Xero Connector
Integrate Xero with spreadsheets, data warehouses, or BI tools to build up a reliable reporting system for efficient decision-making. Get an all-in-one solution to gather, transform, understand and automate your Xero data without any hassle.


How to set up your Xero integration
Analyze your Xero data easier
Collect data on a scheduled basis and blend it with information exported from other applications.

Manage and create new columns, apply filters, and perform other data transformations before loading it into the destination.

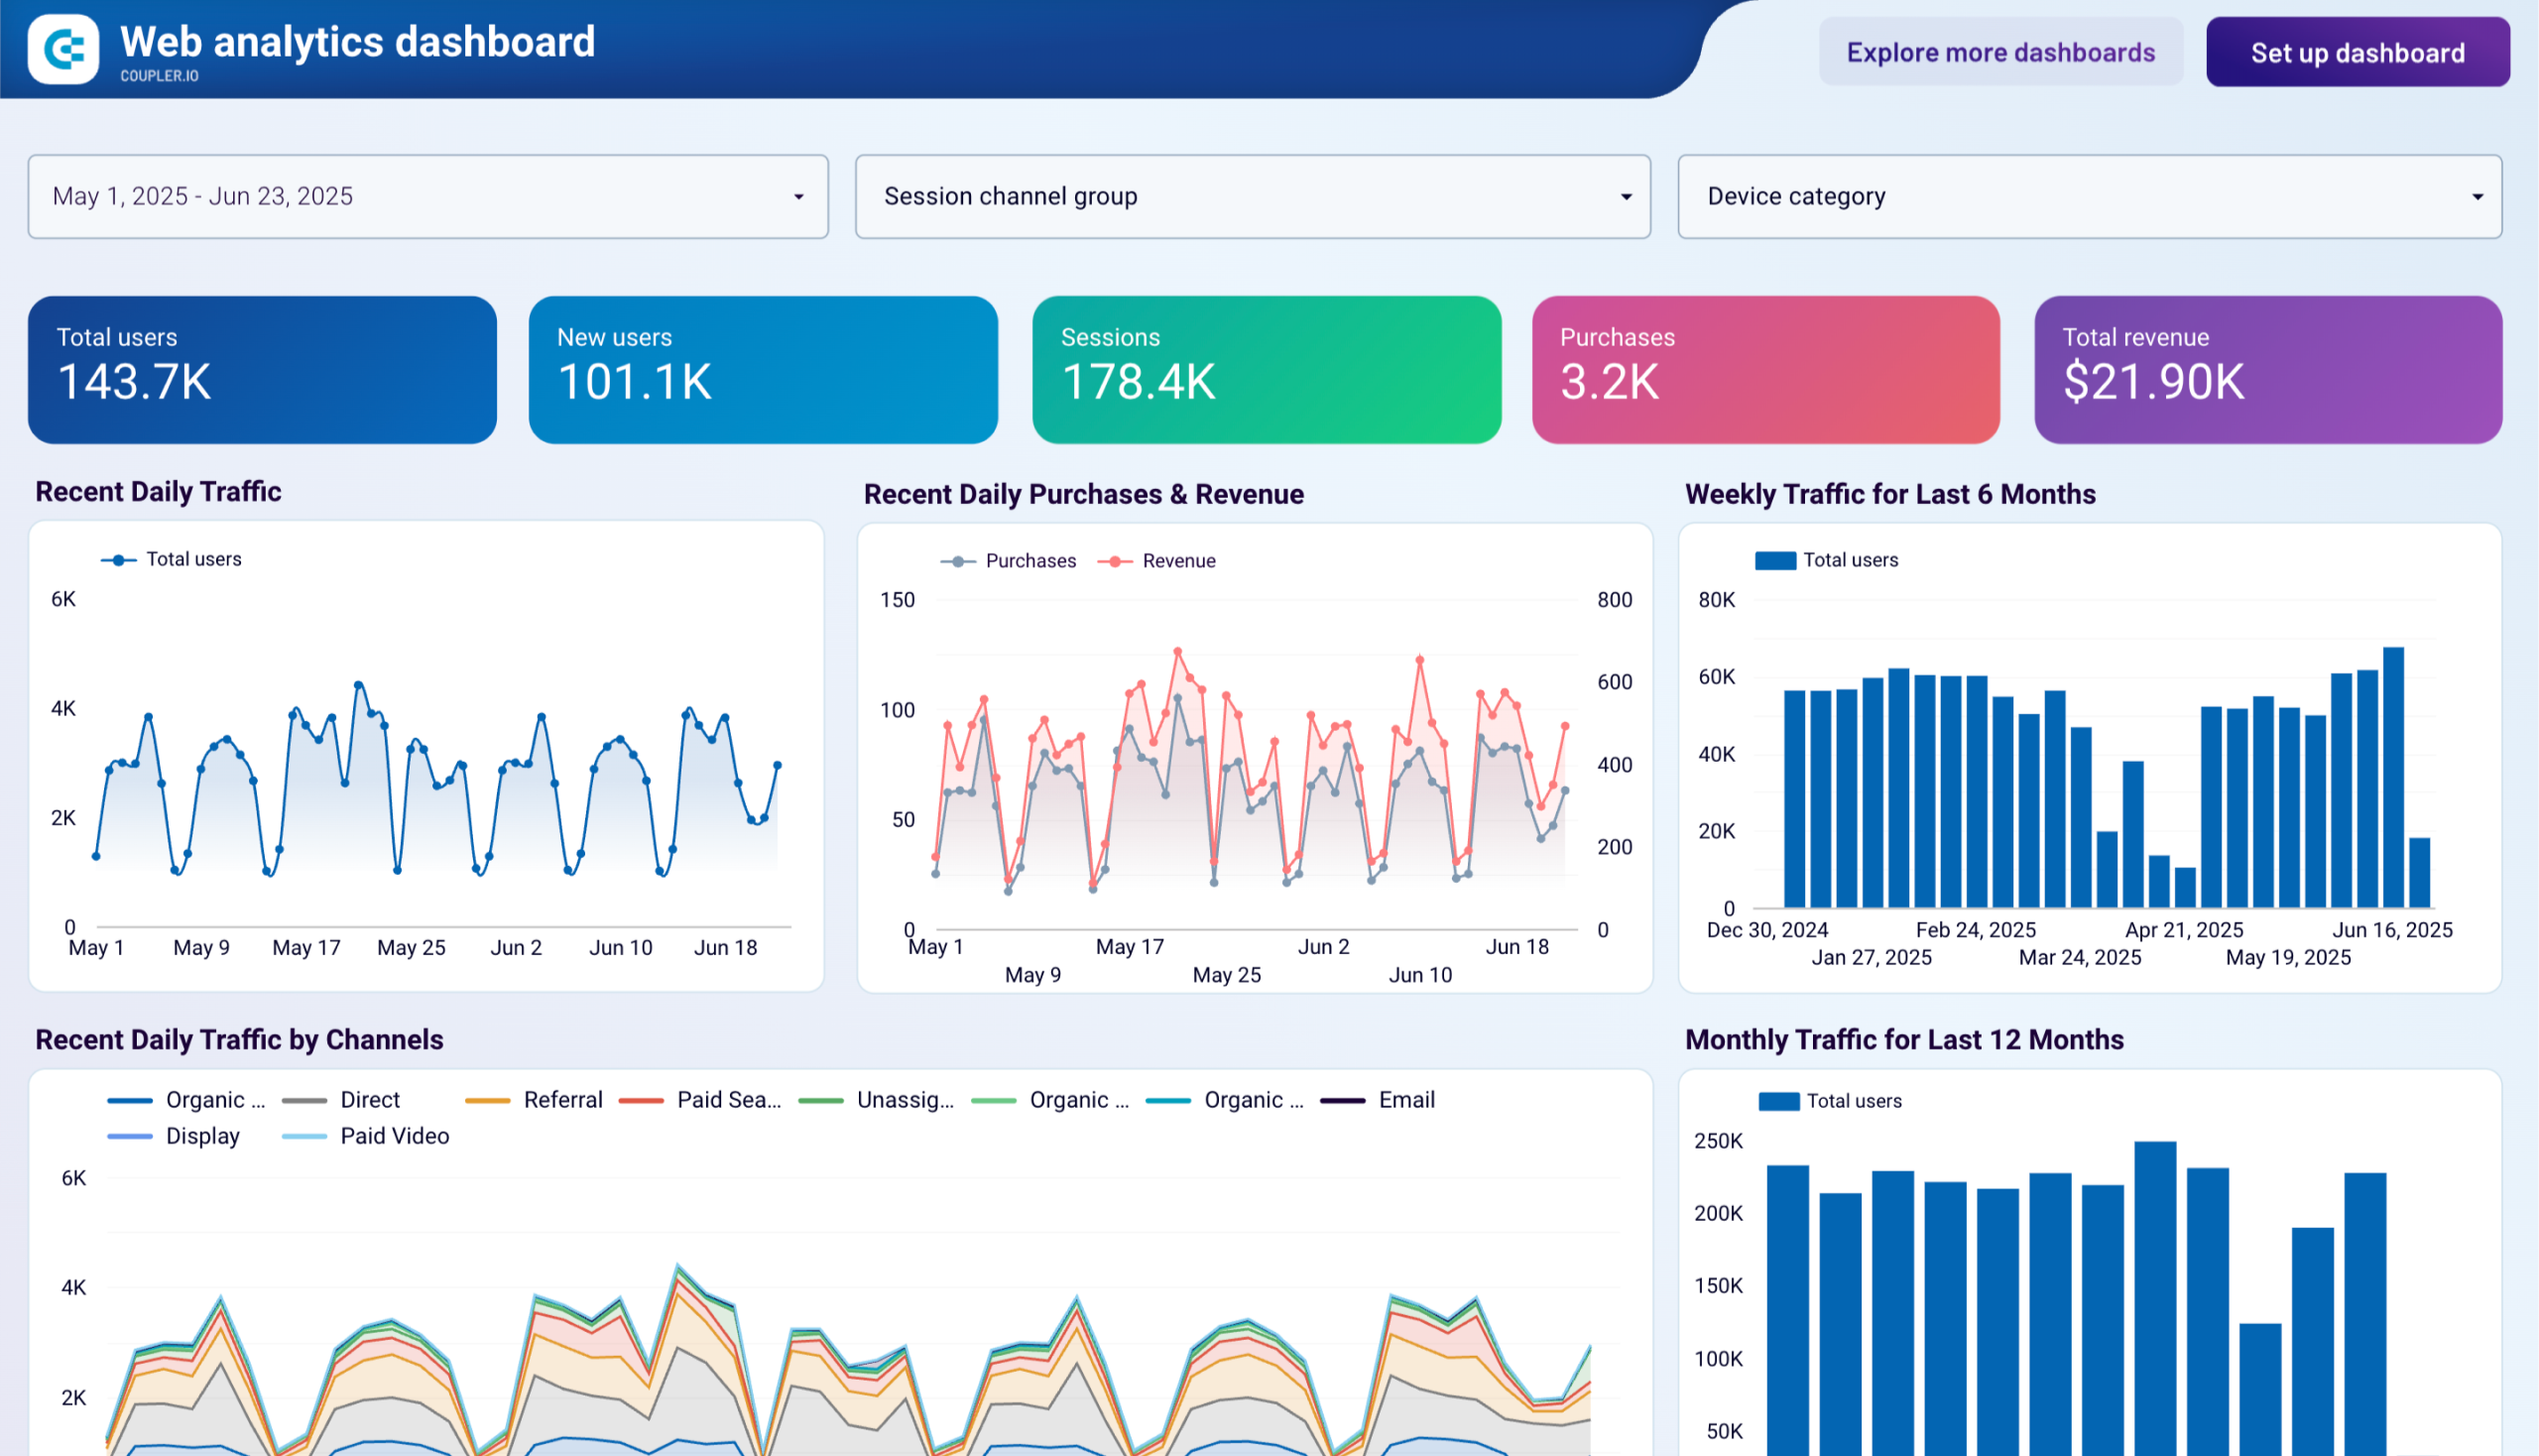
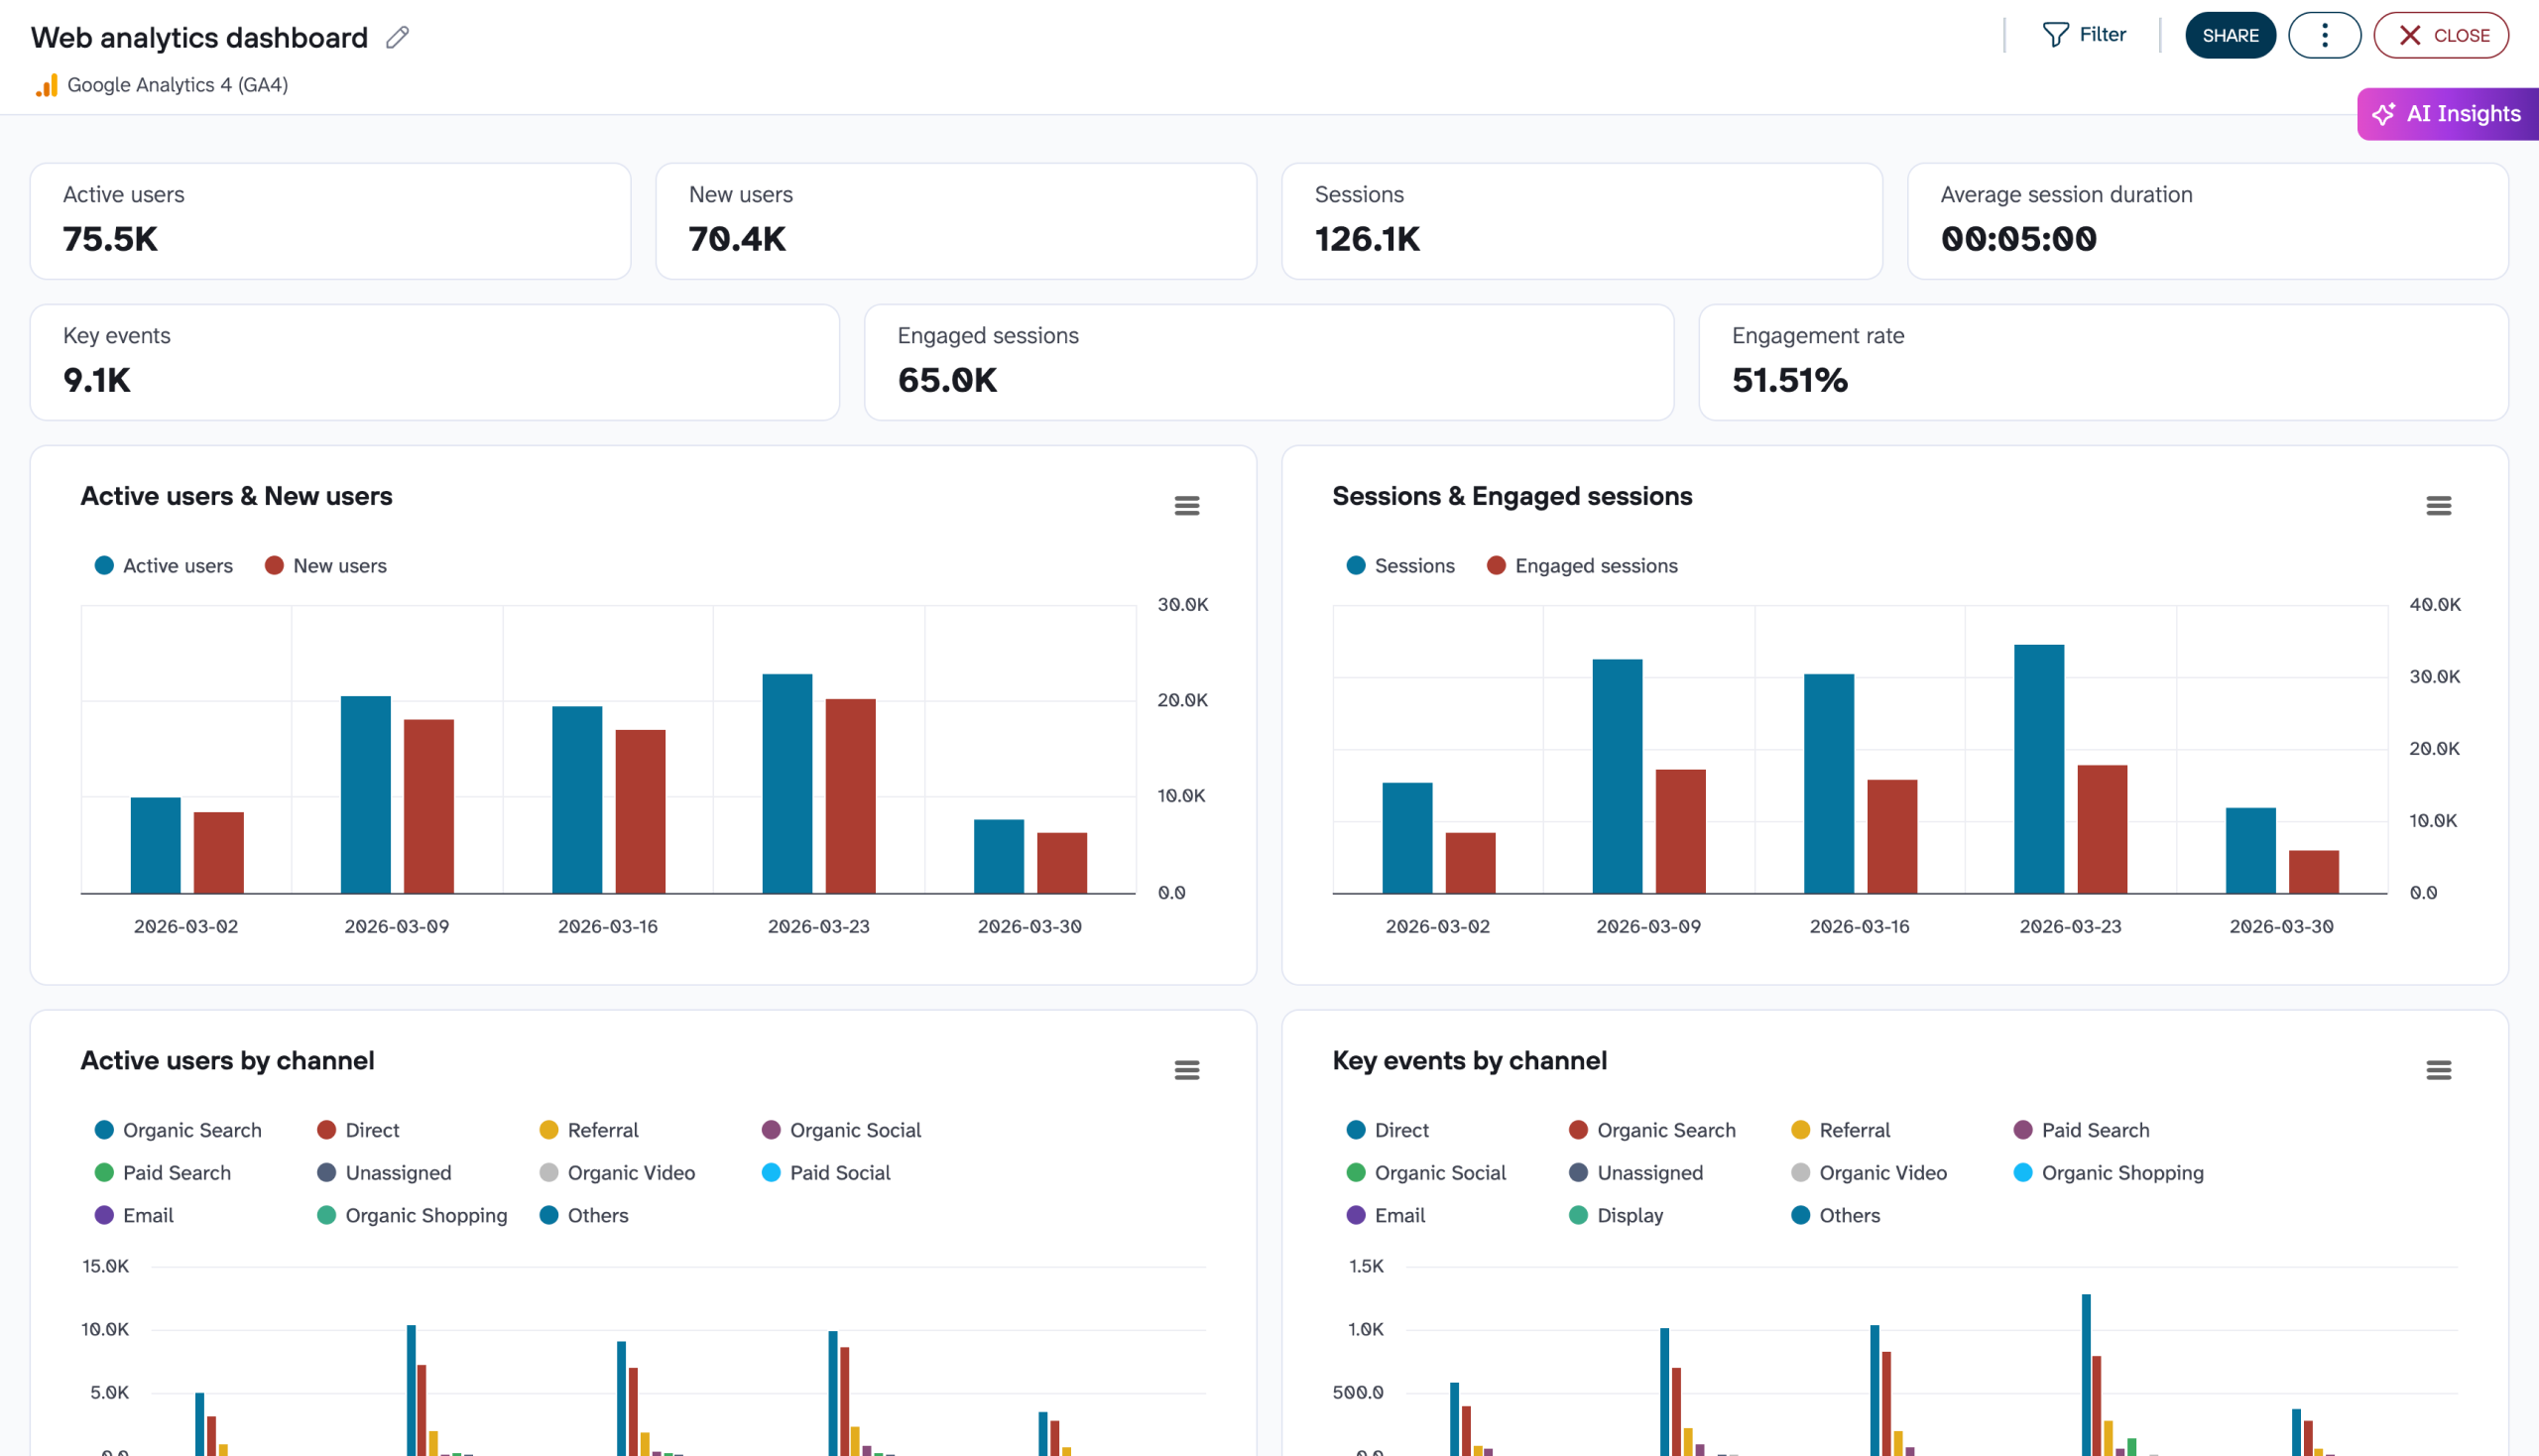
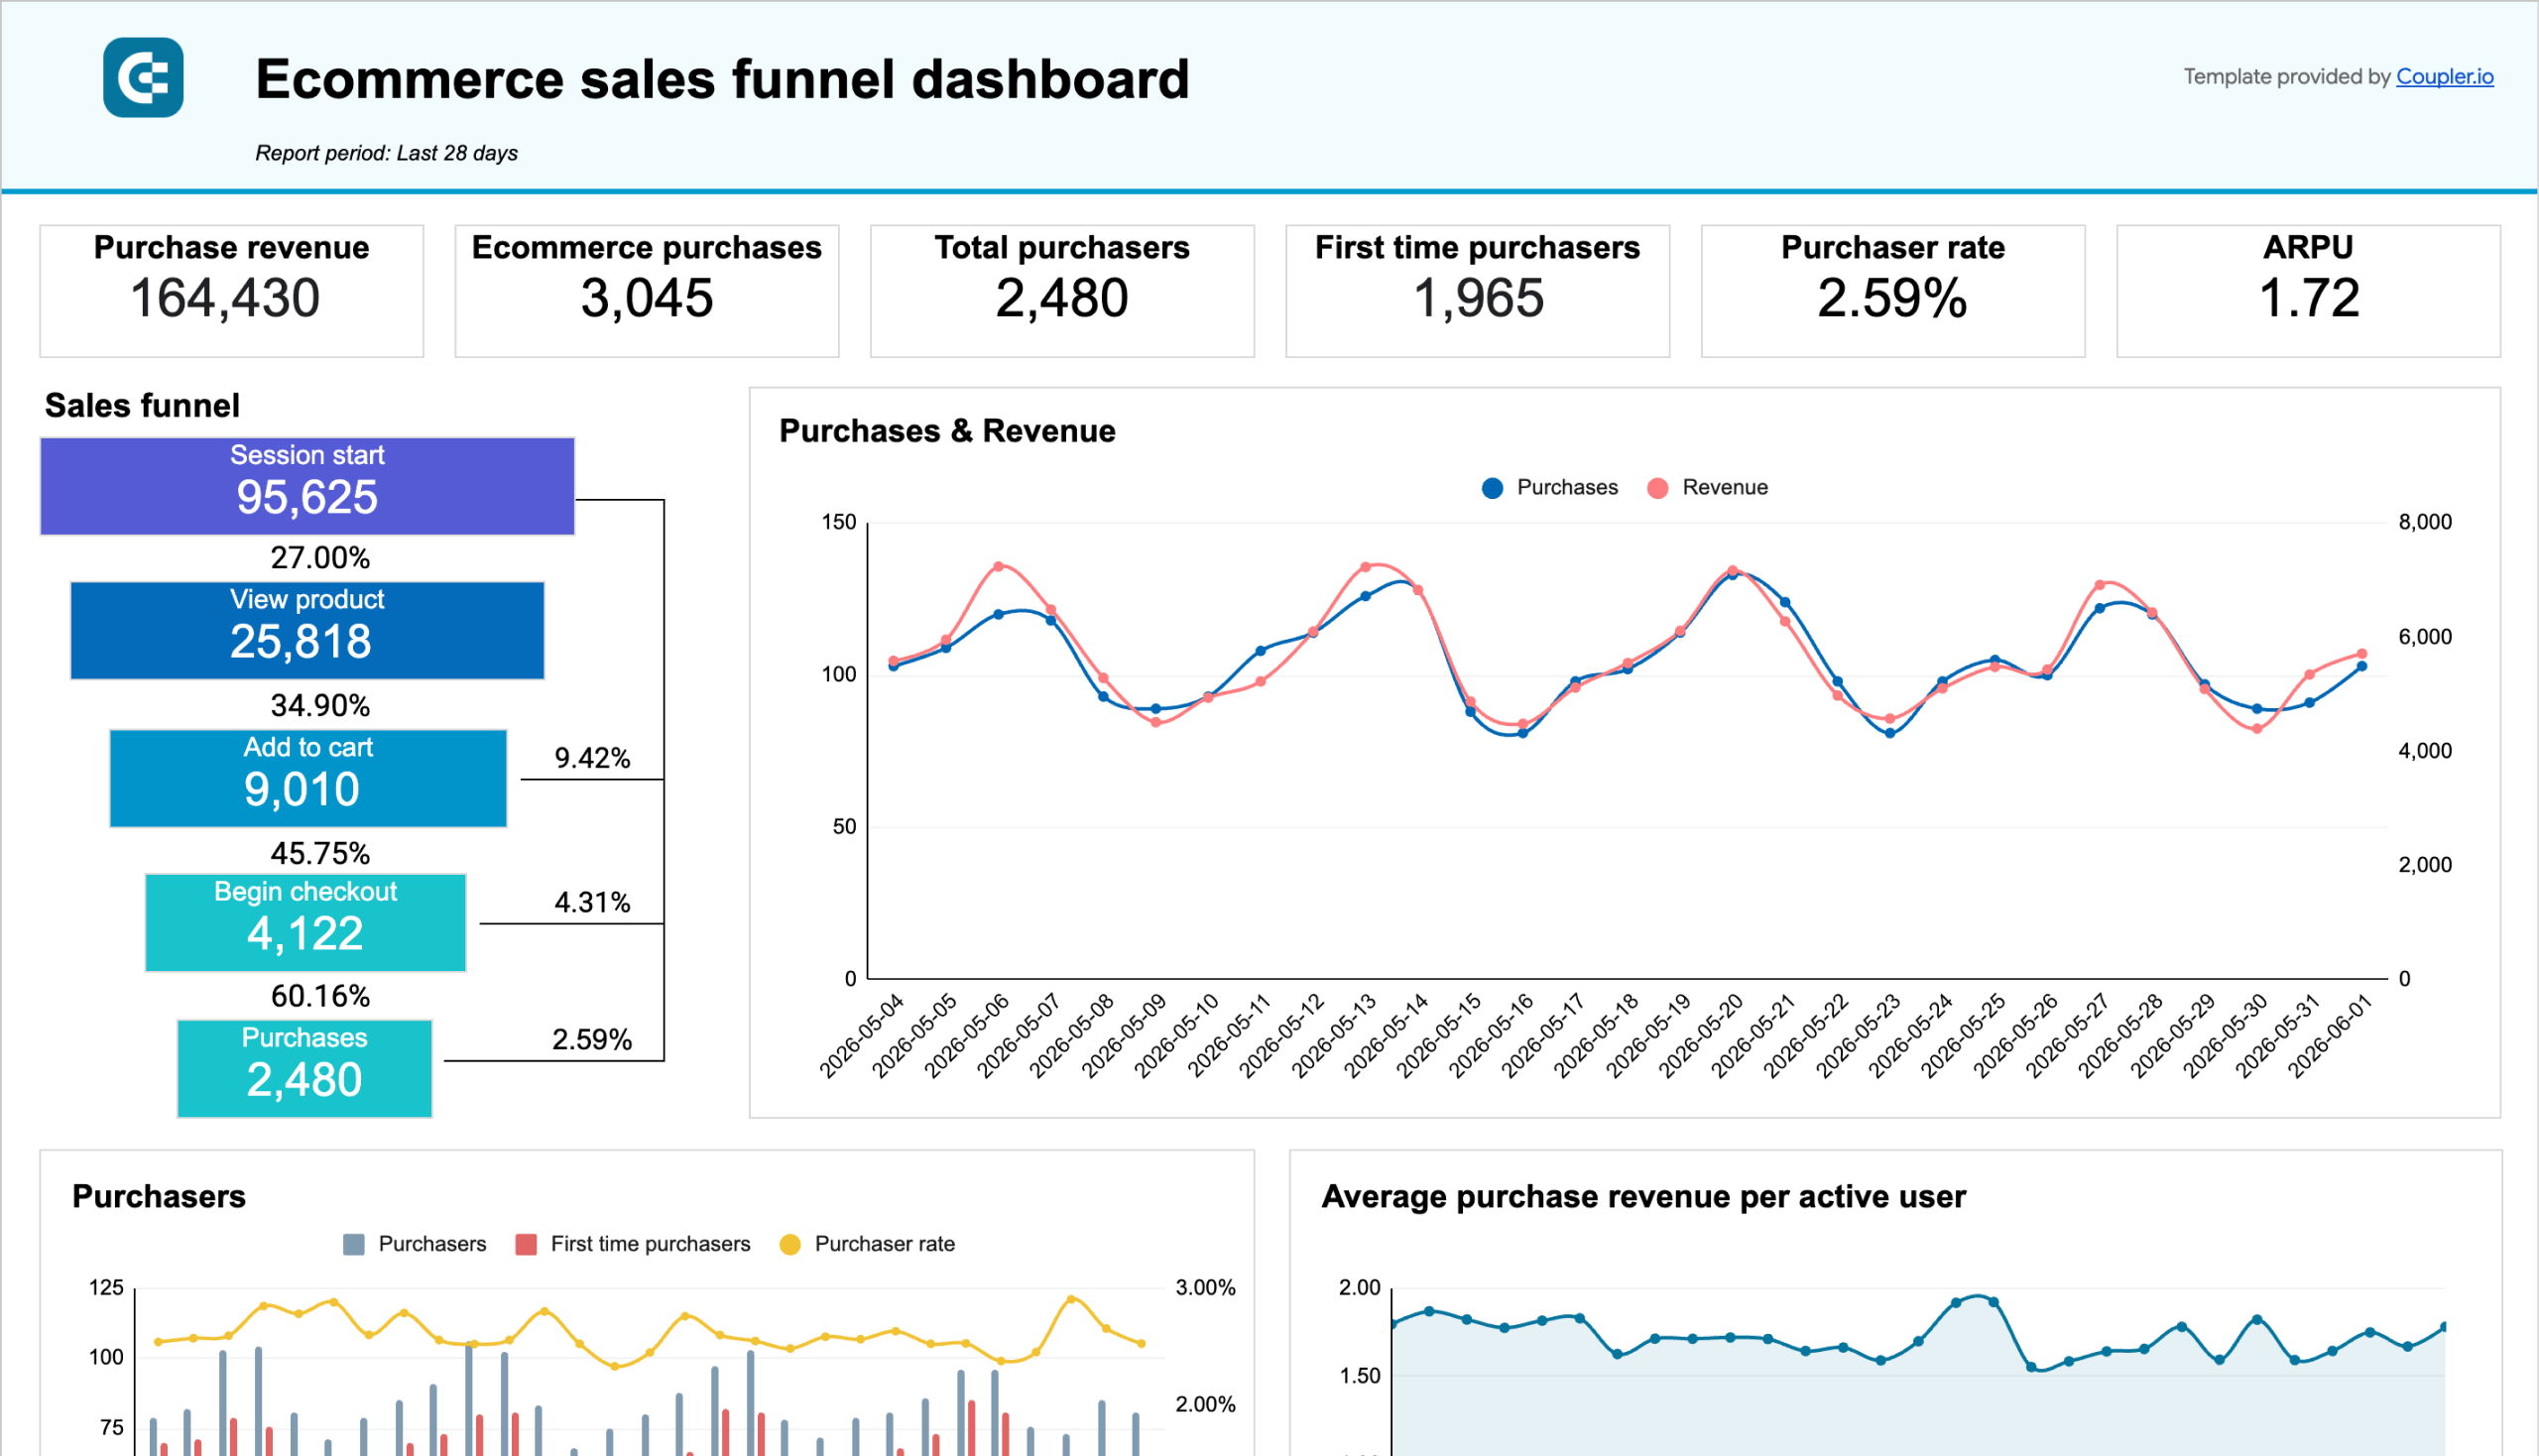
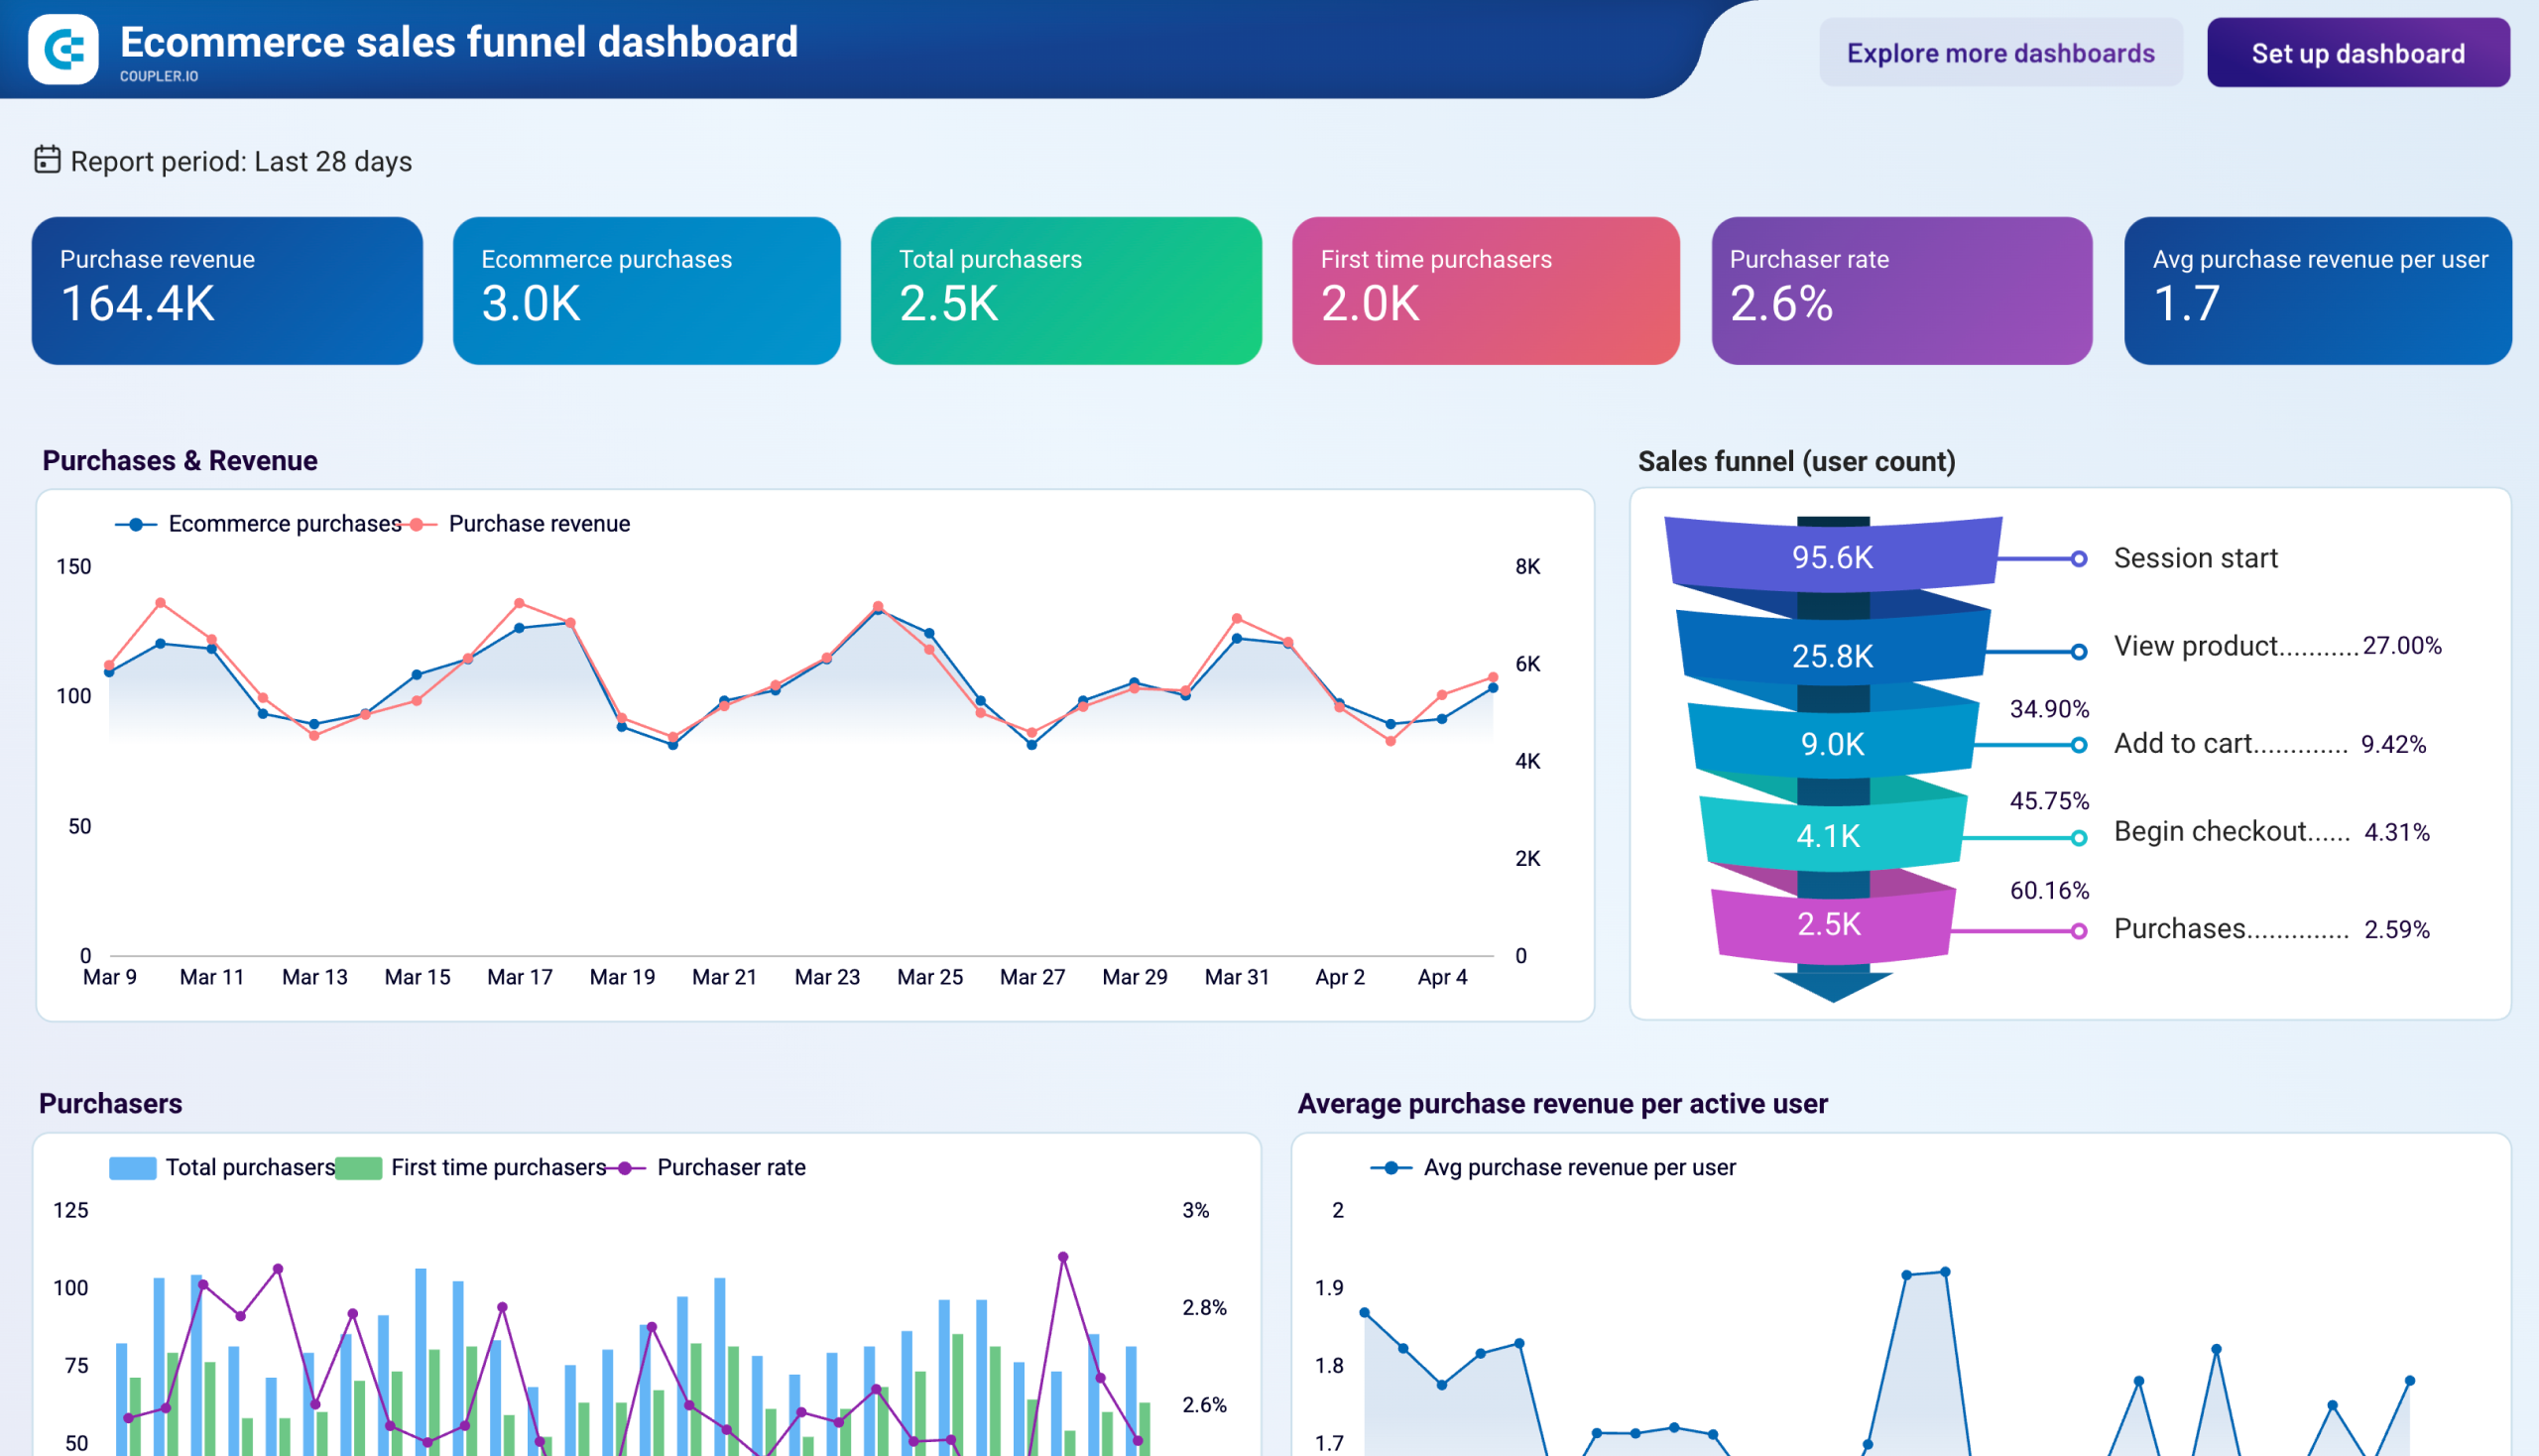
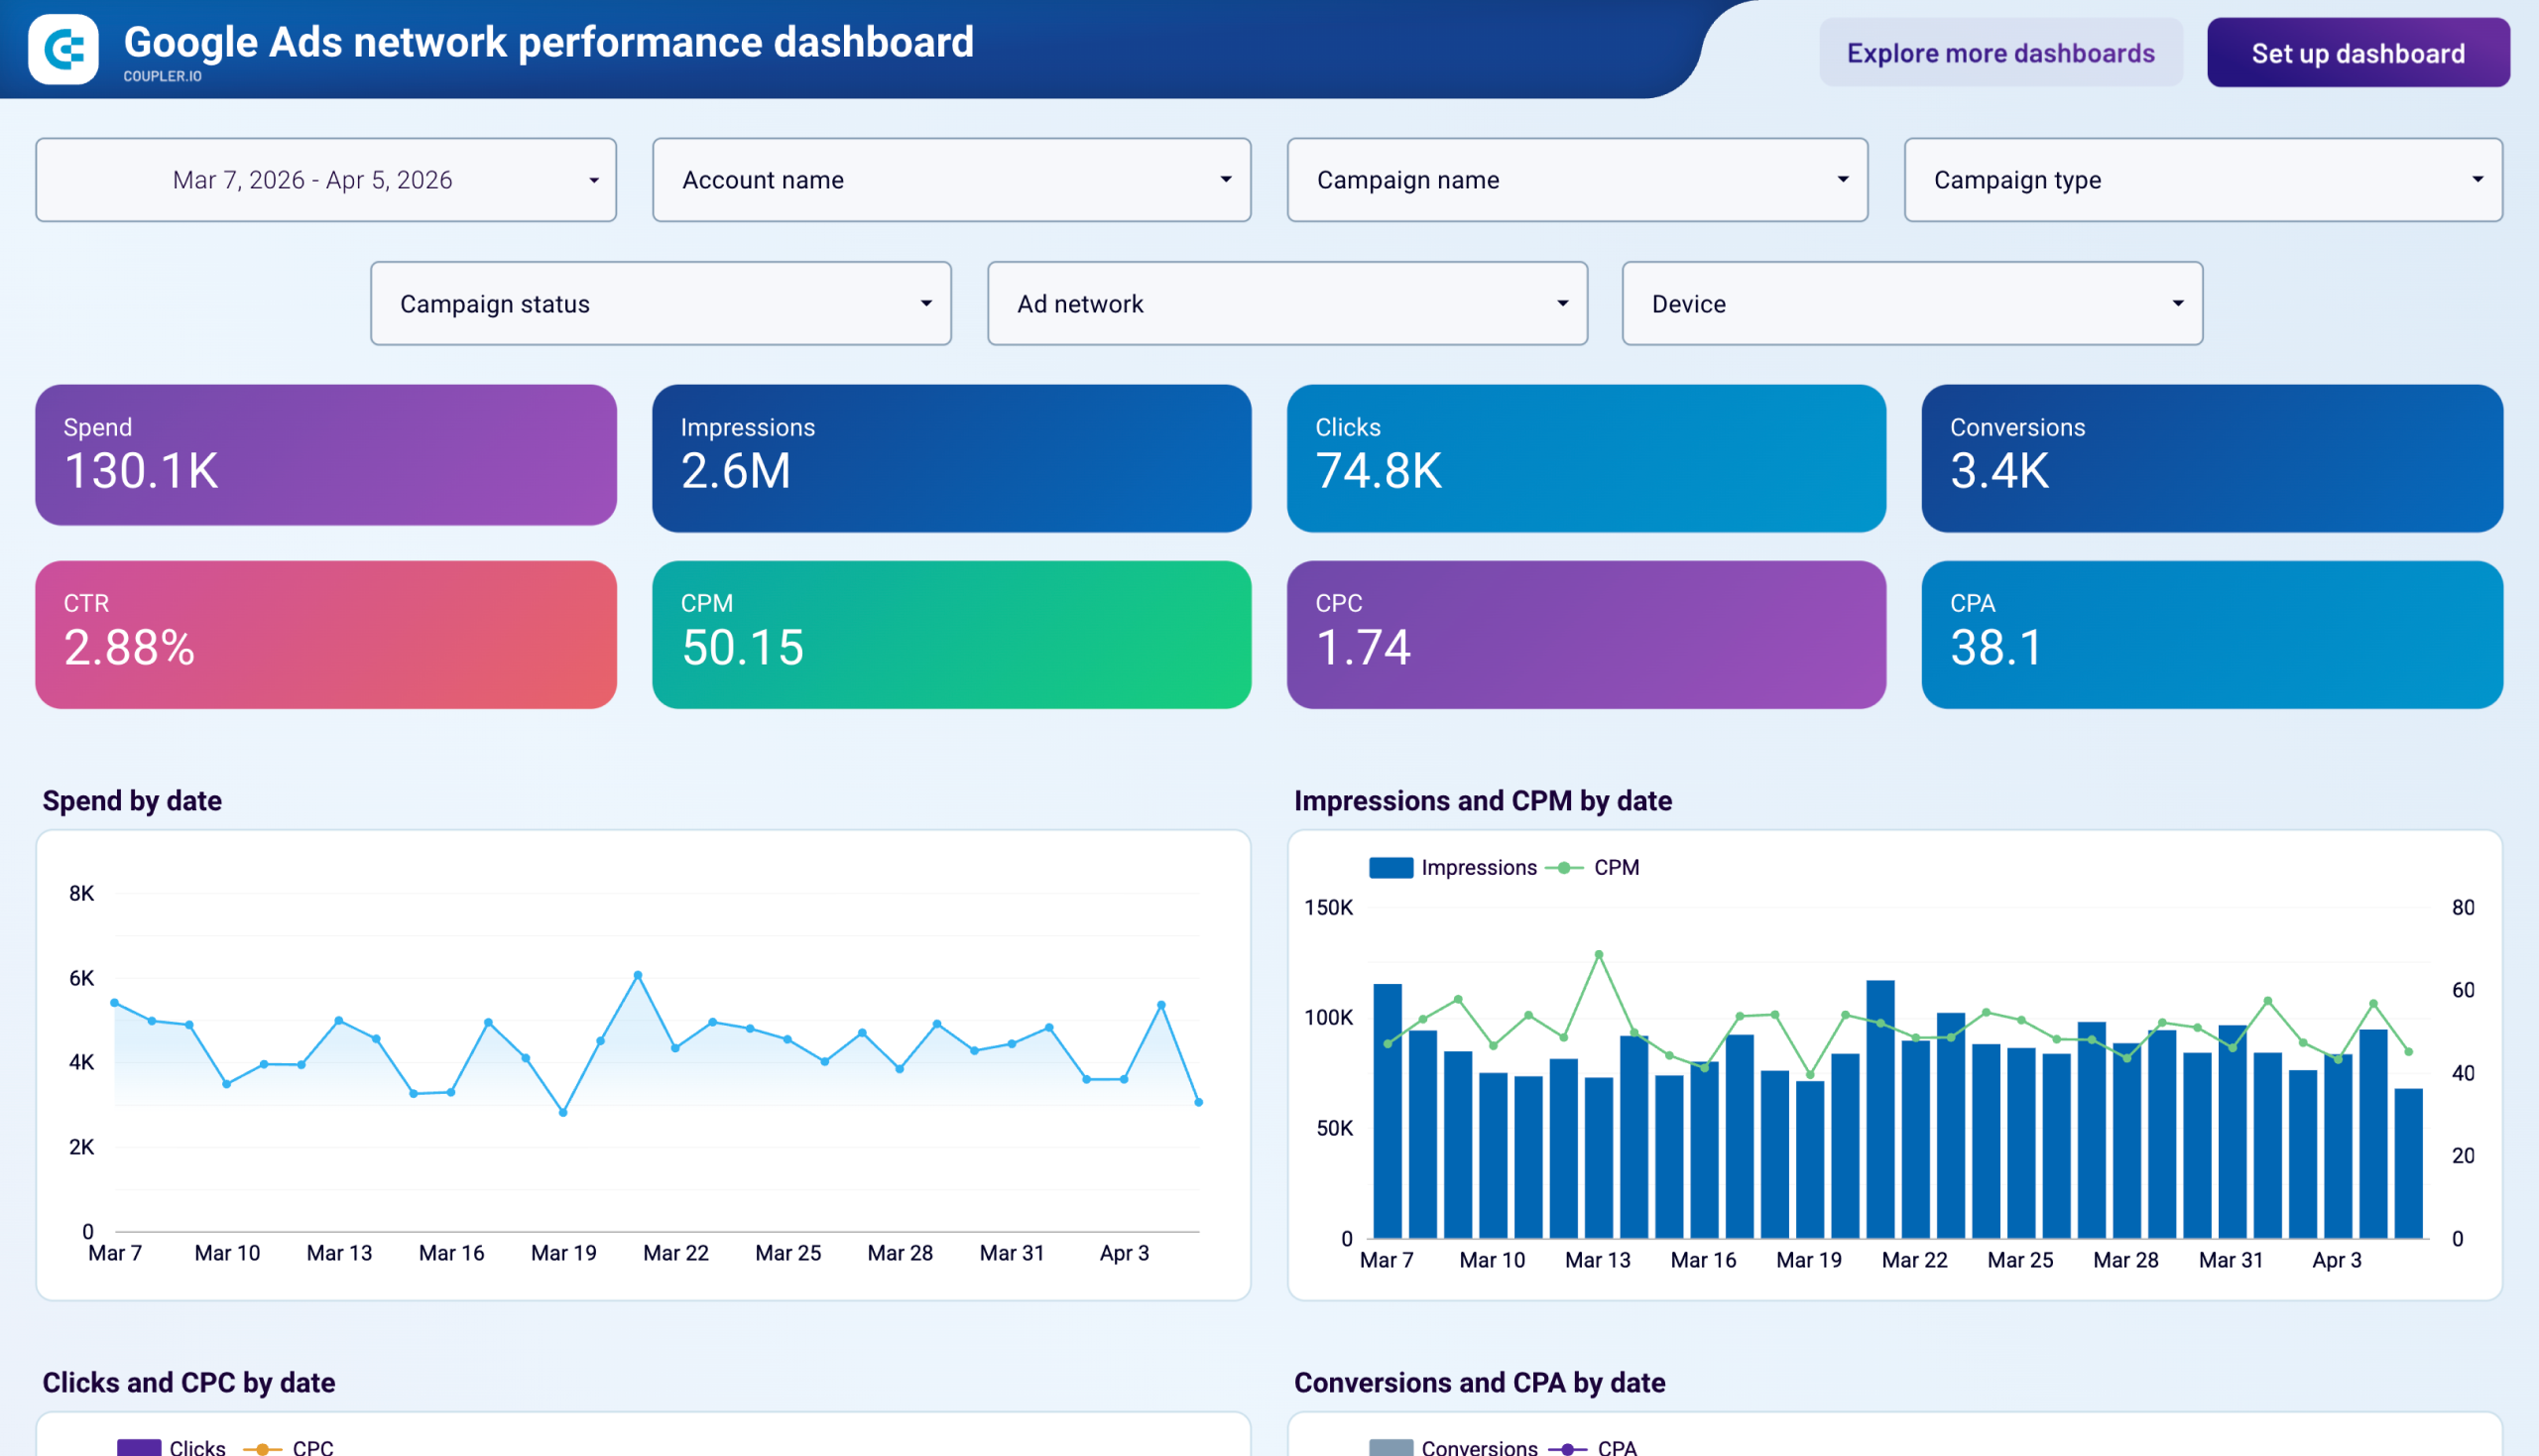
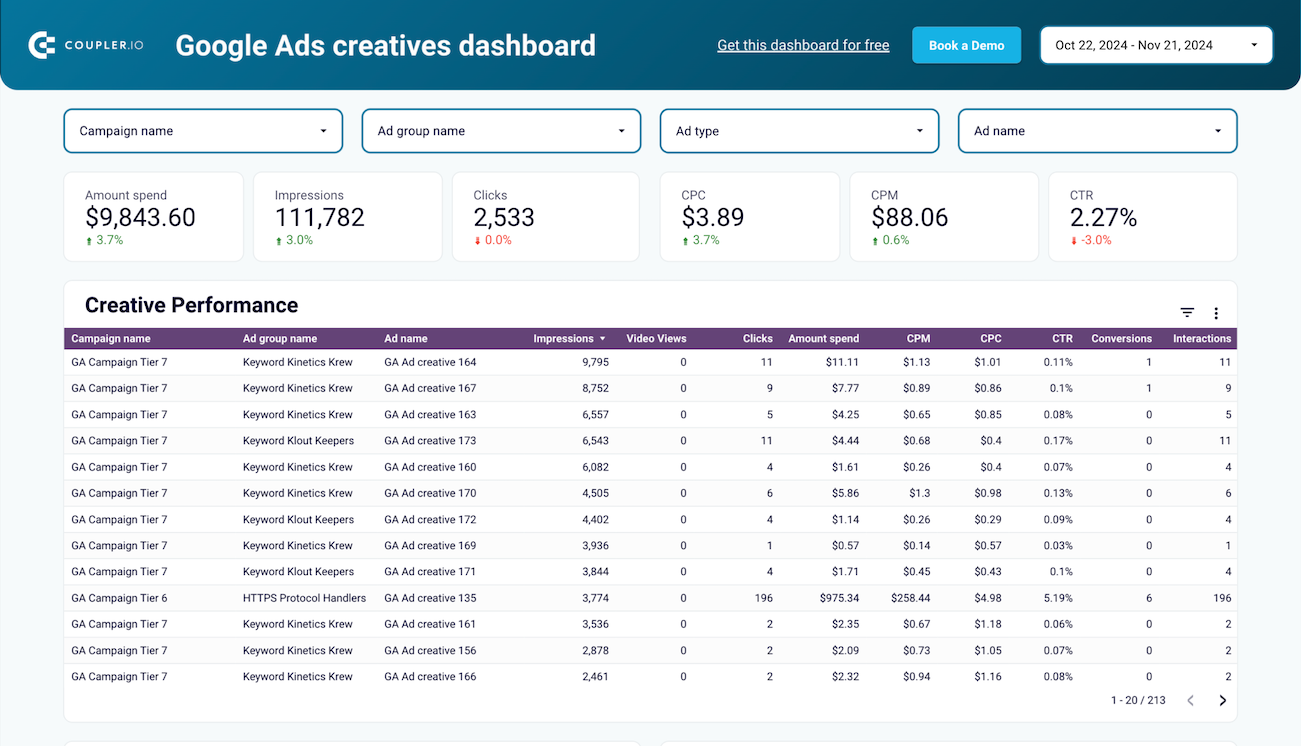
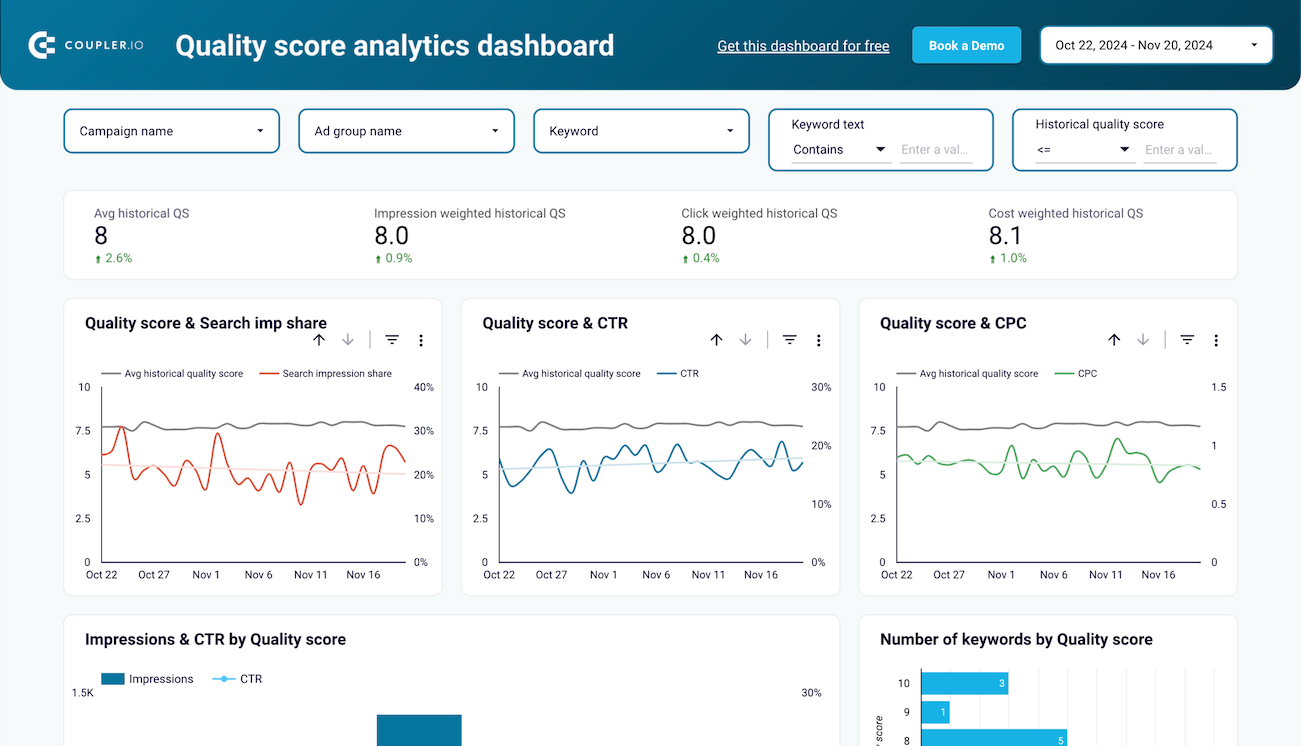
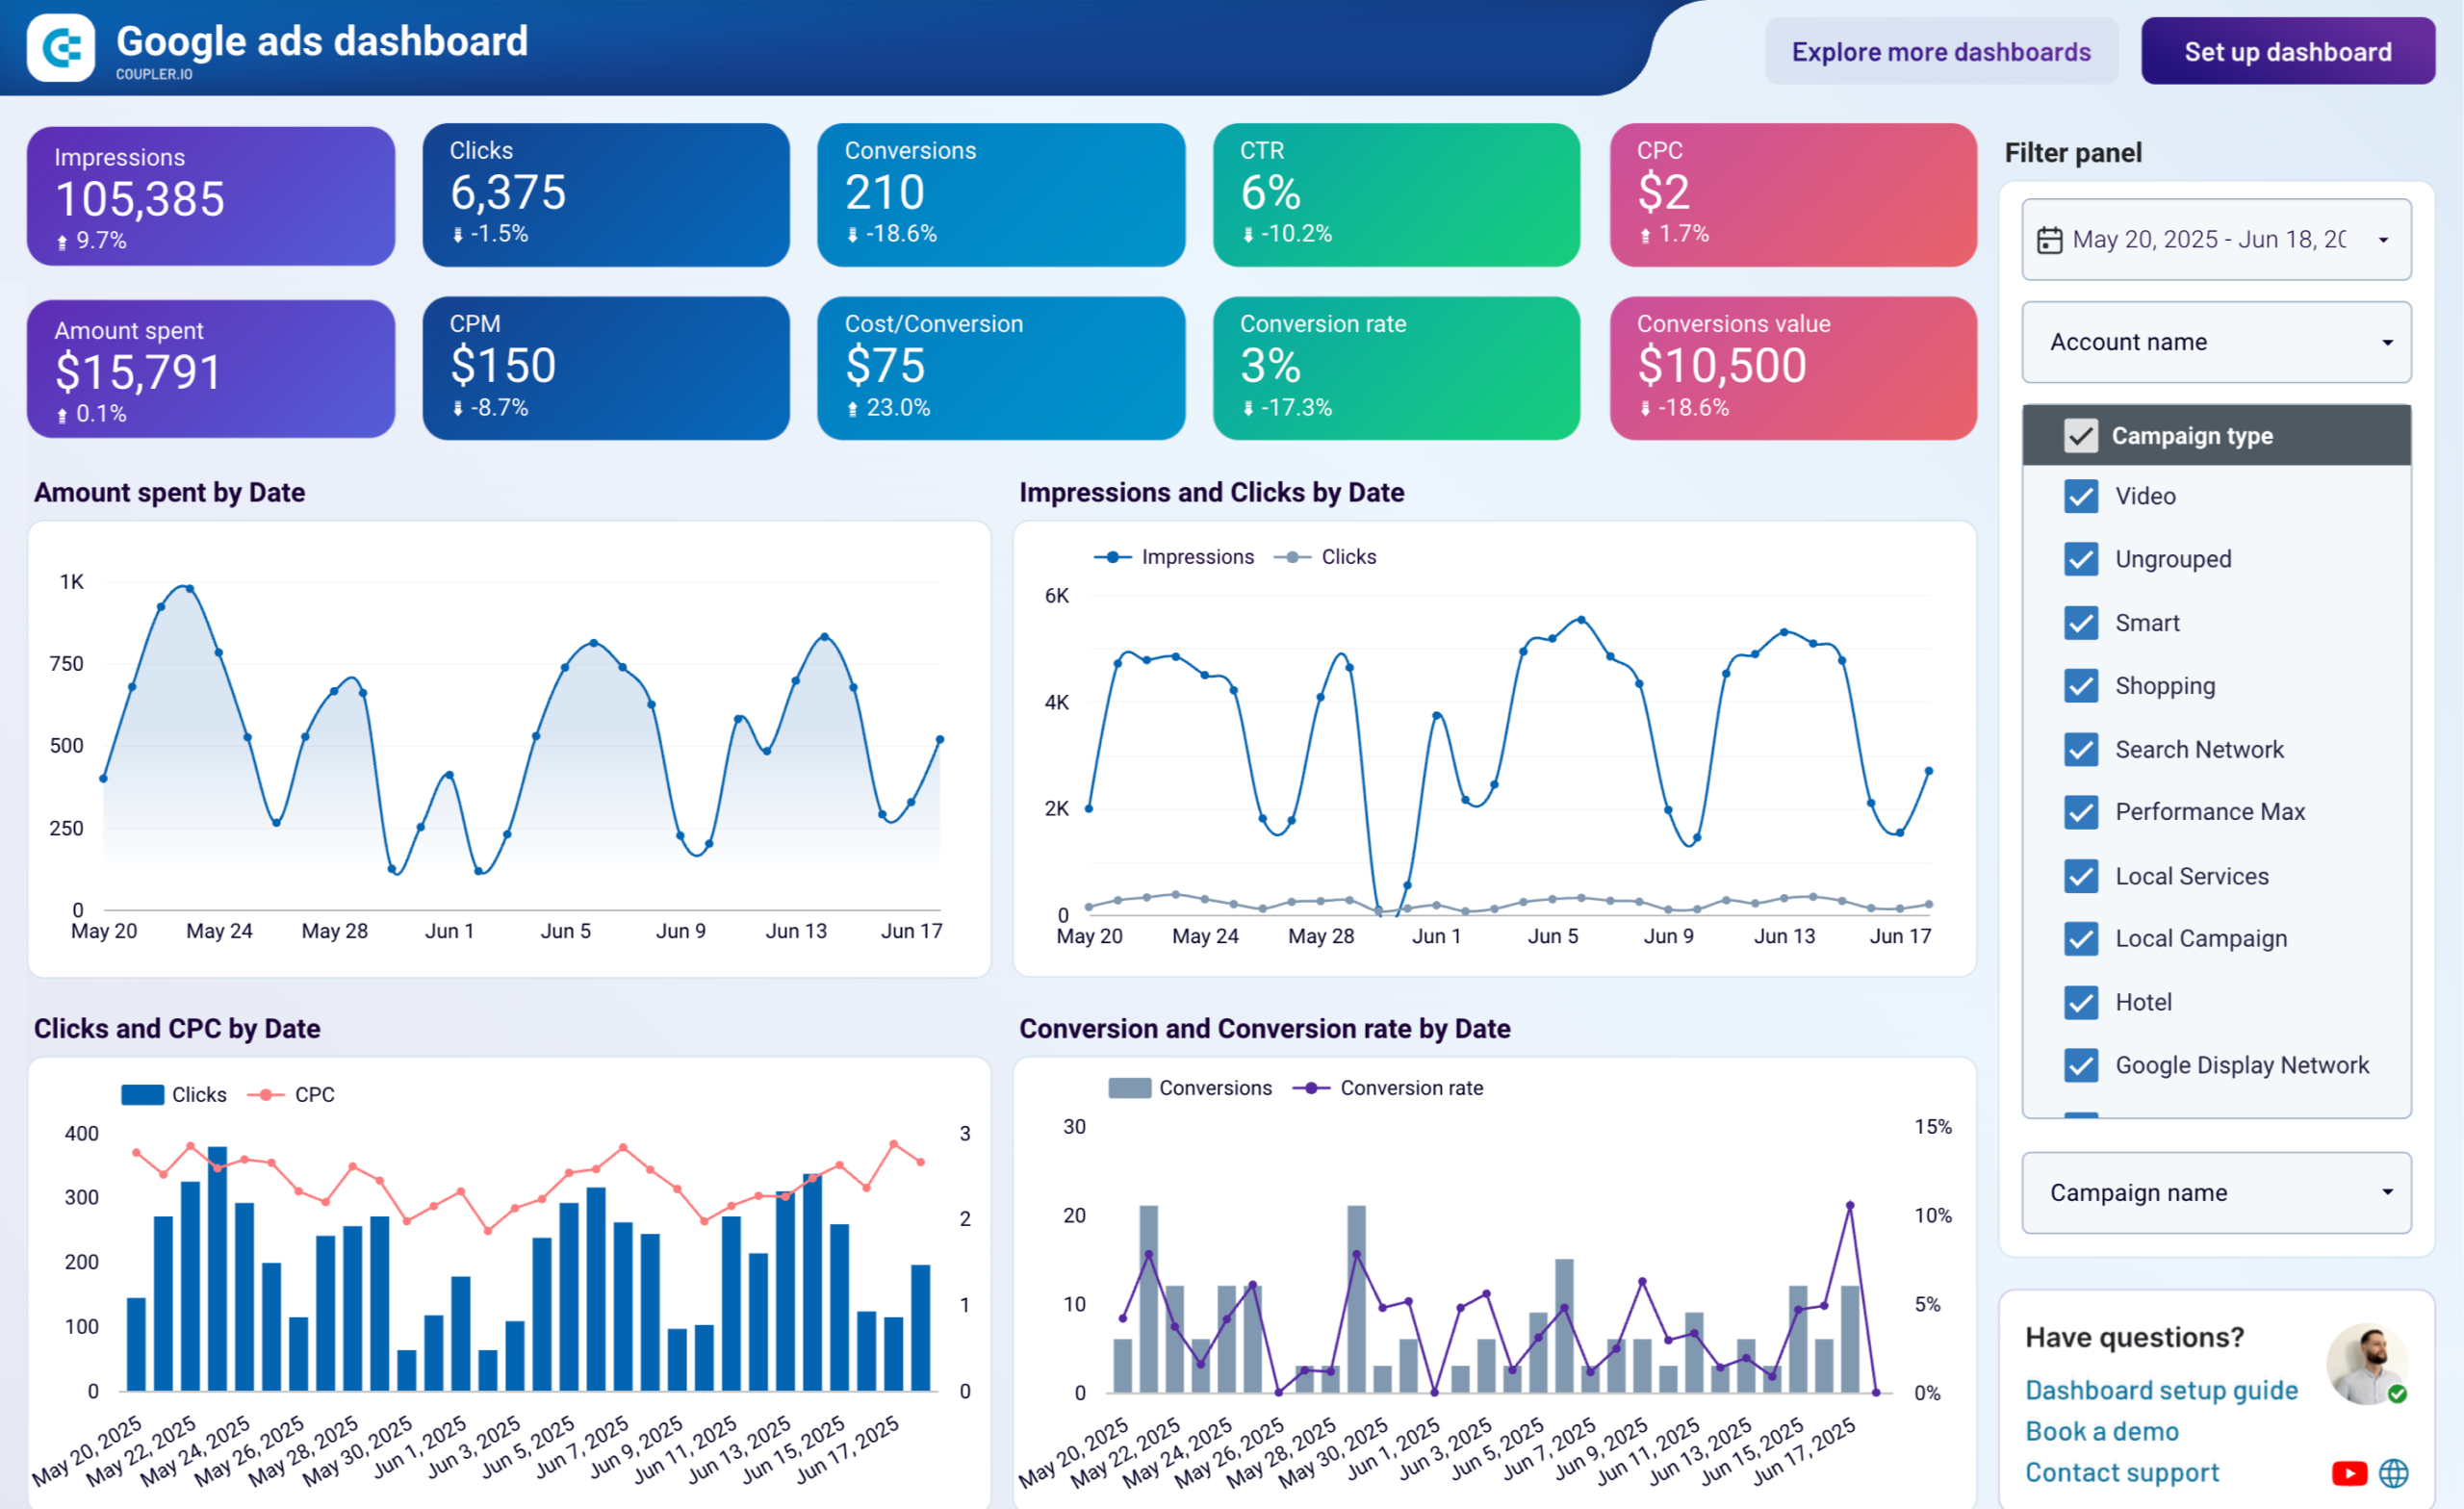
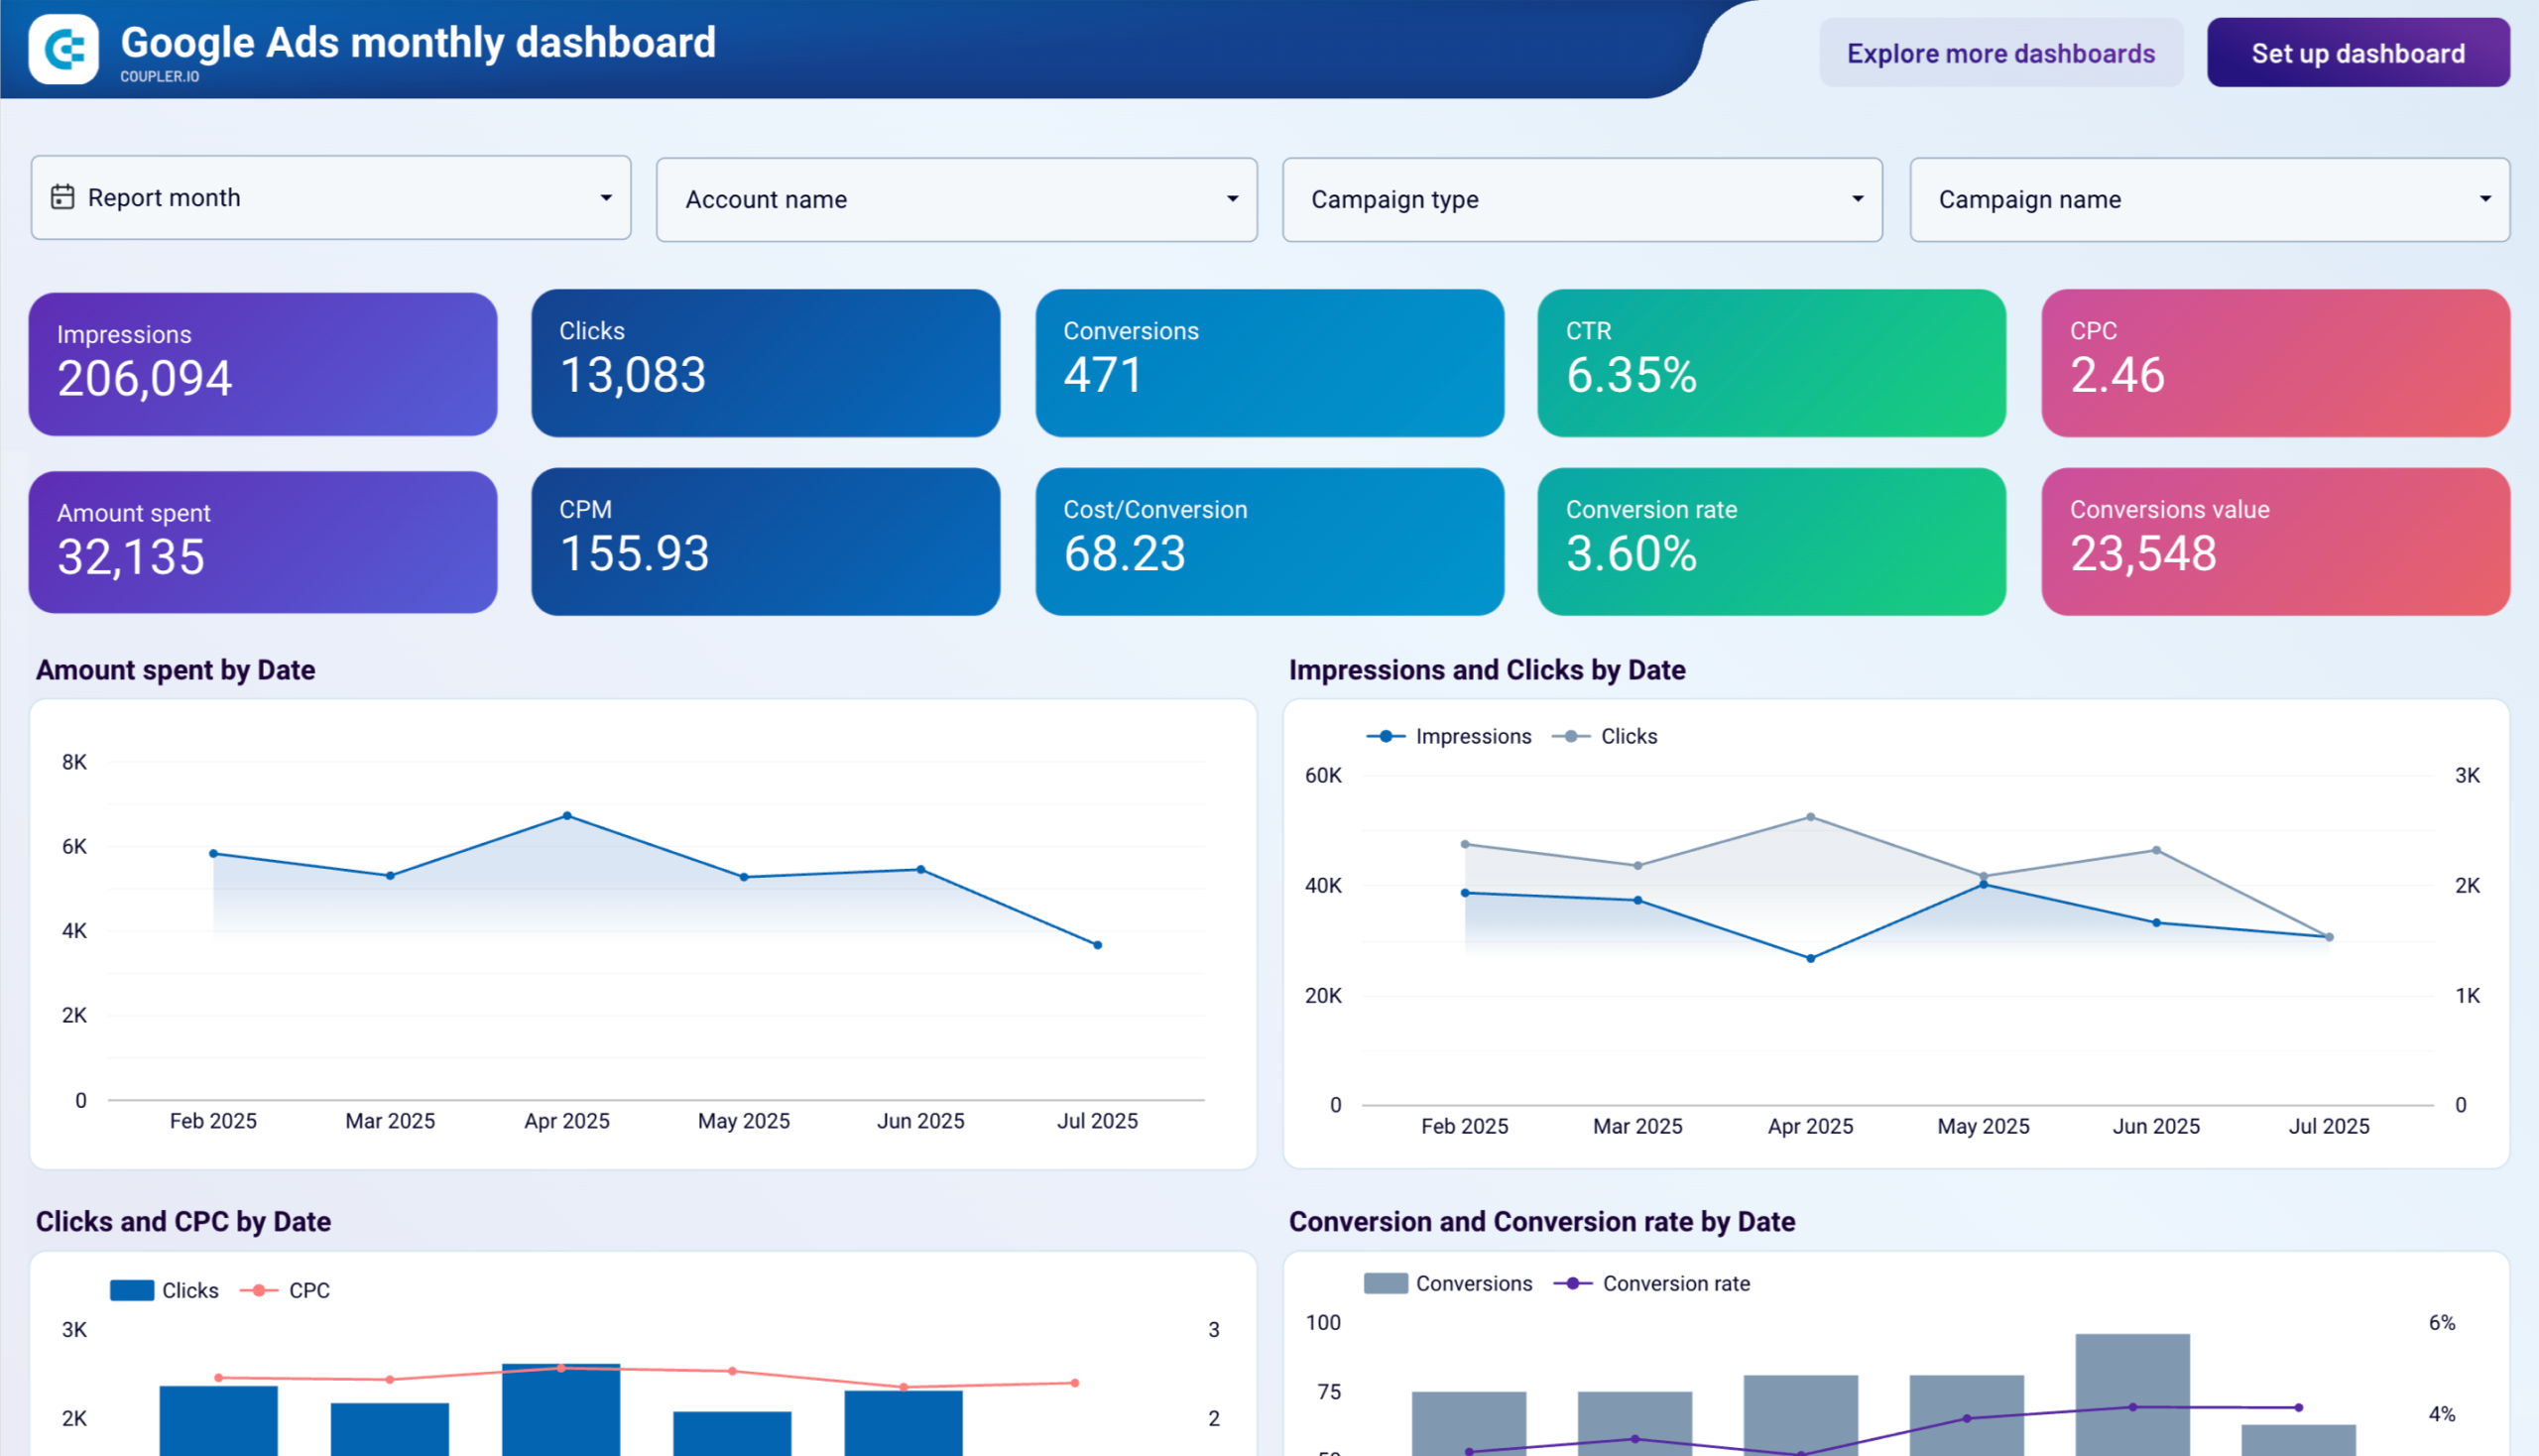
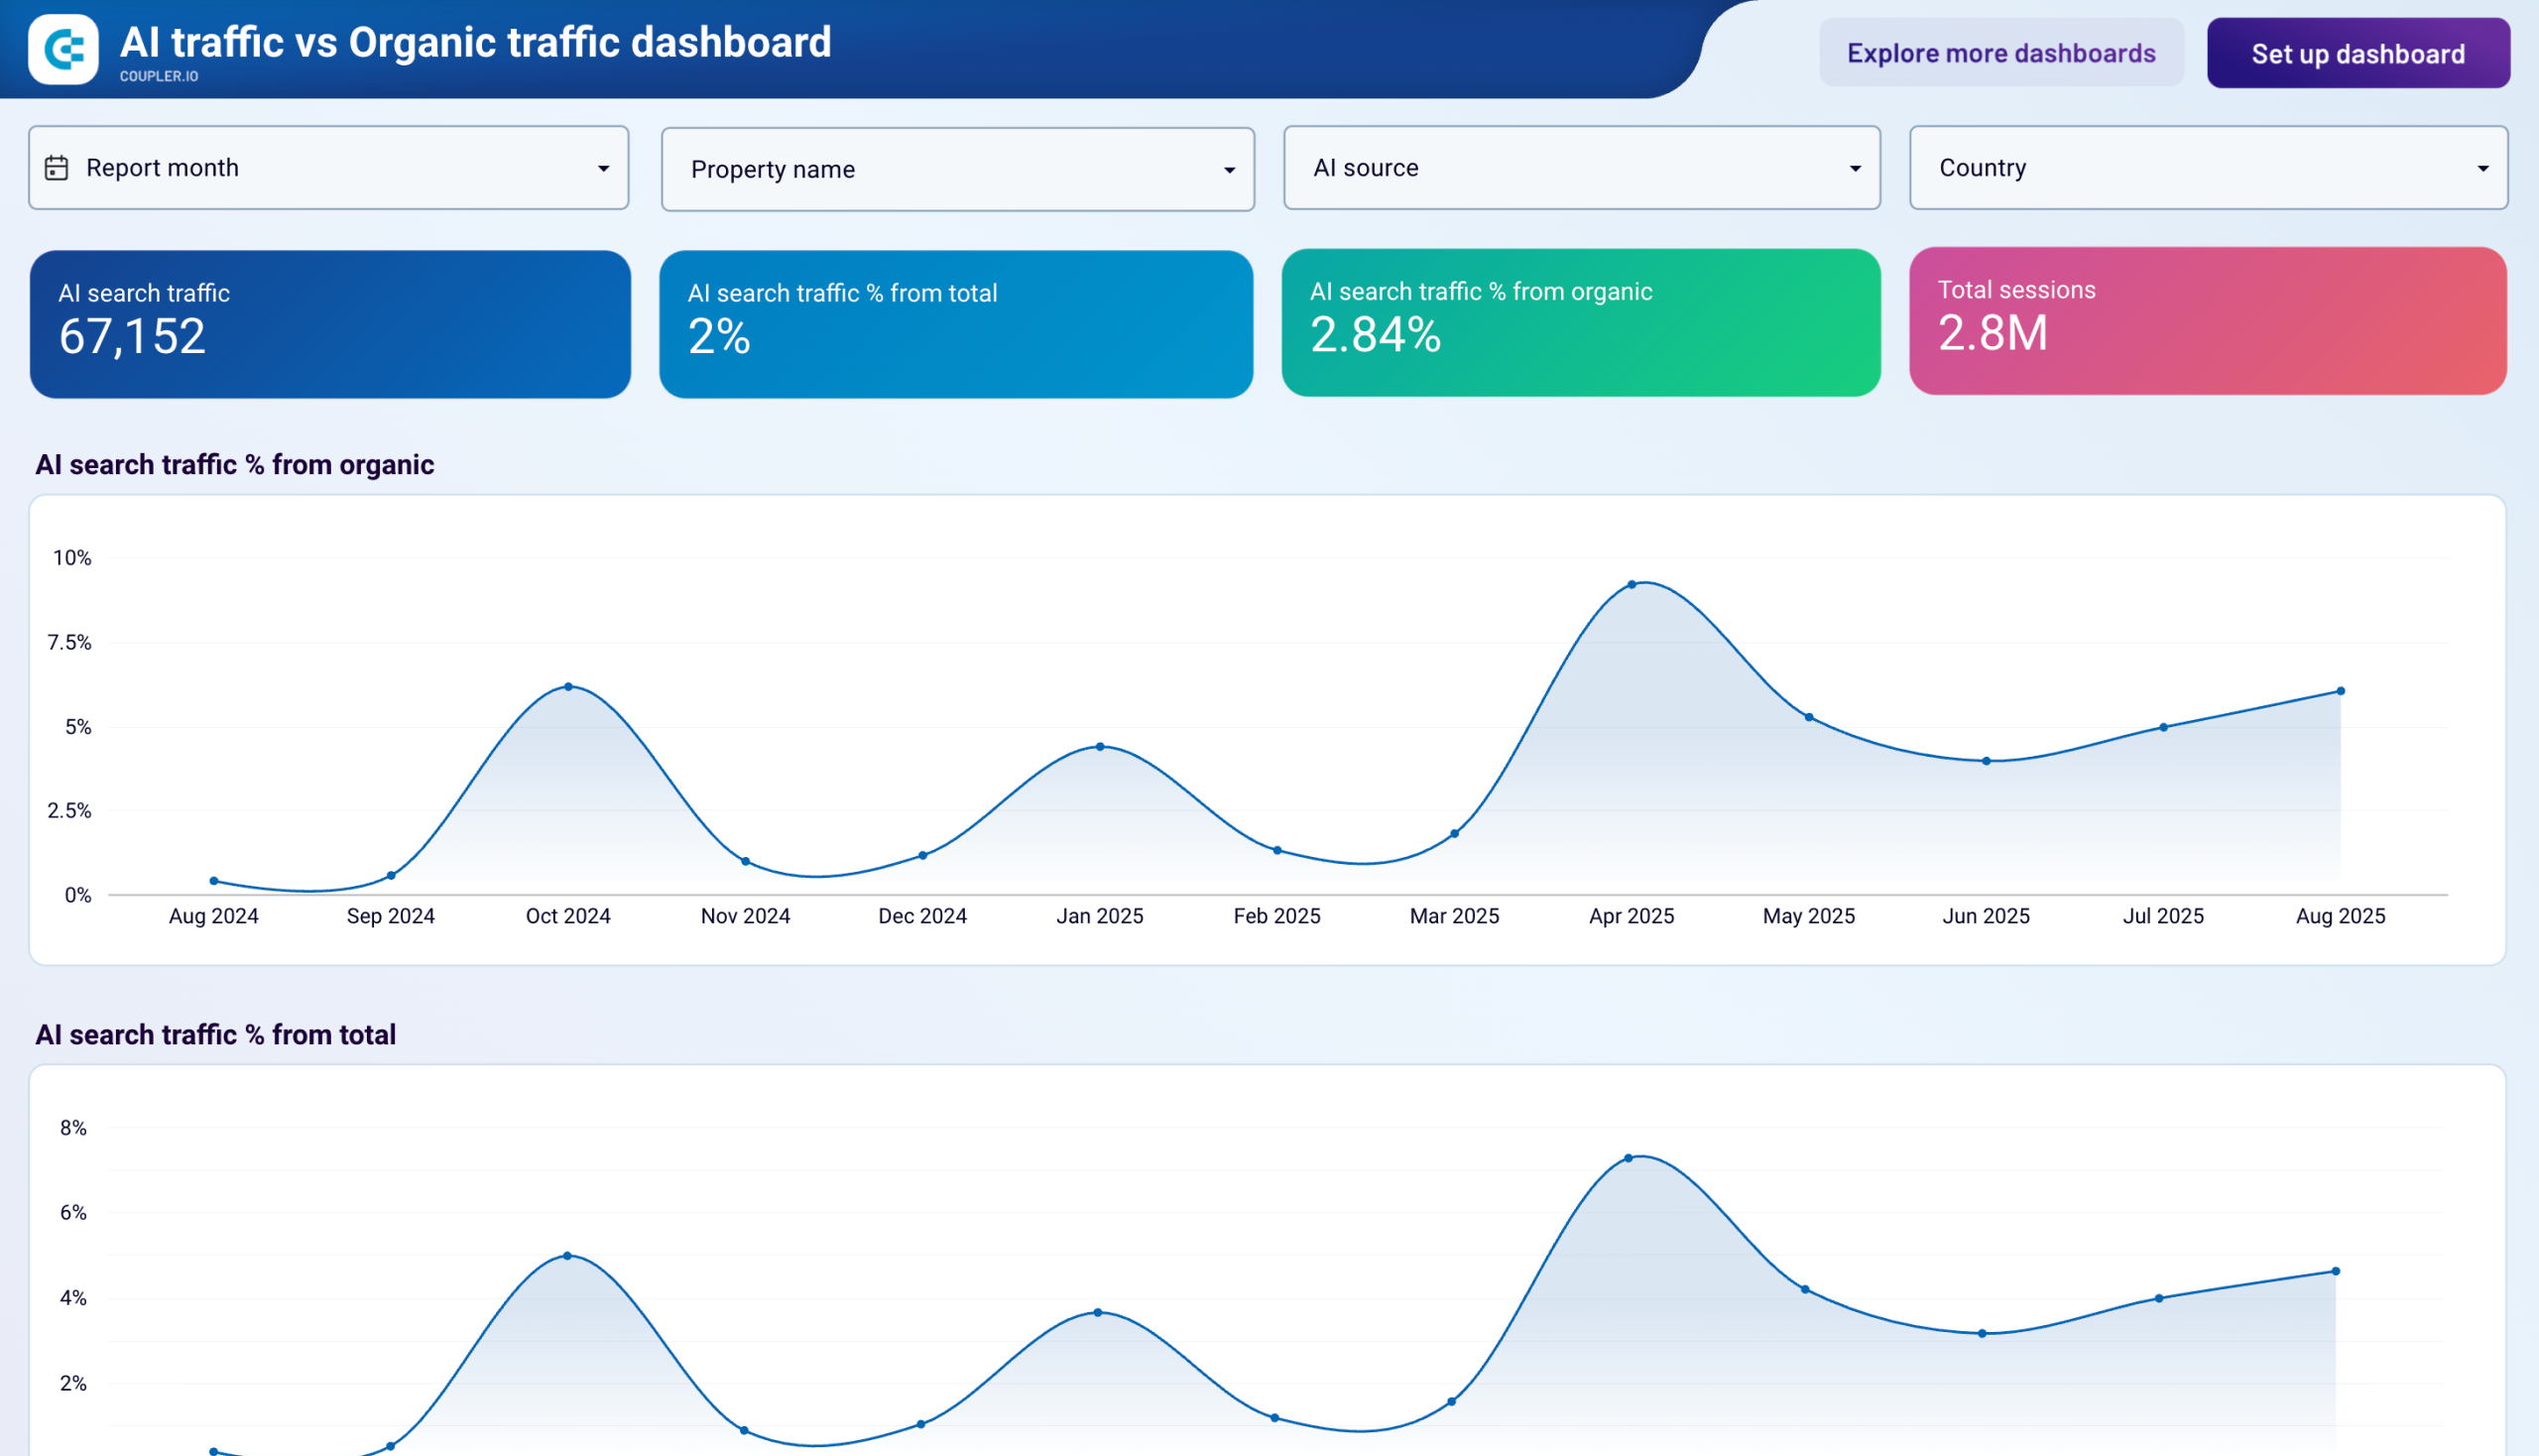
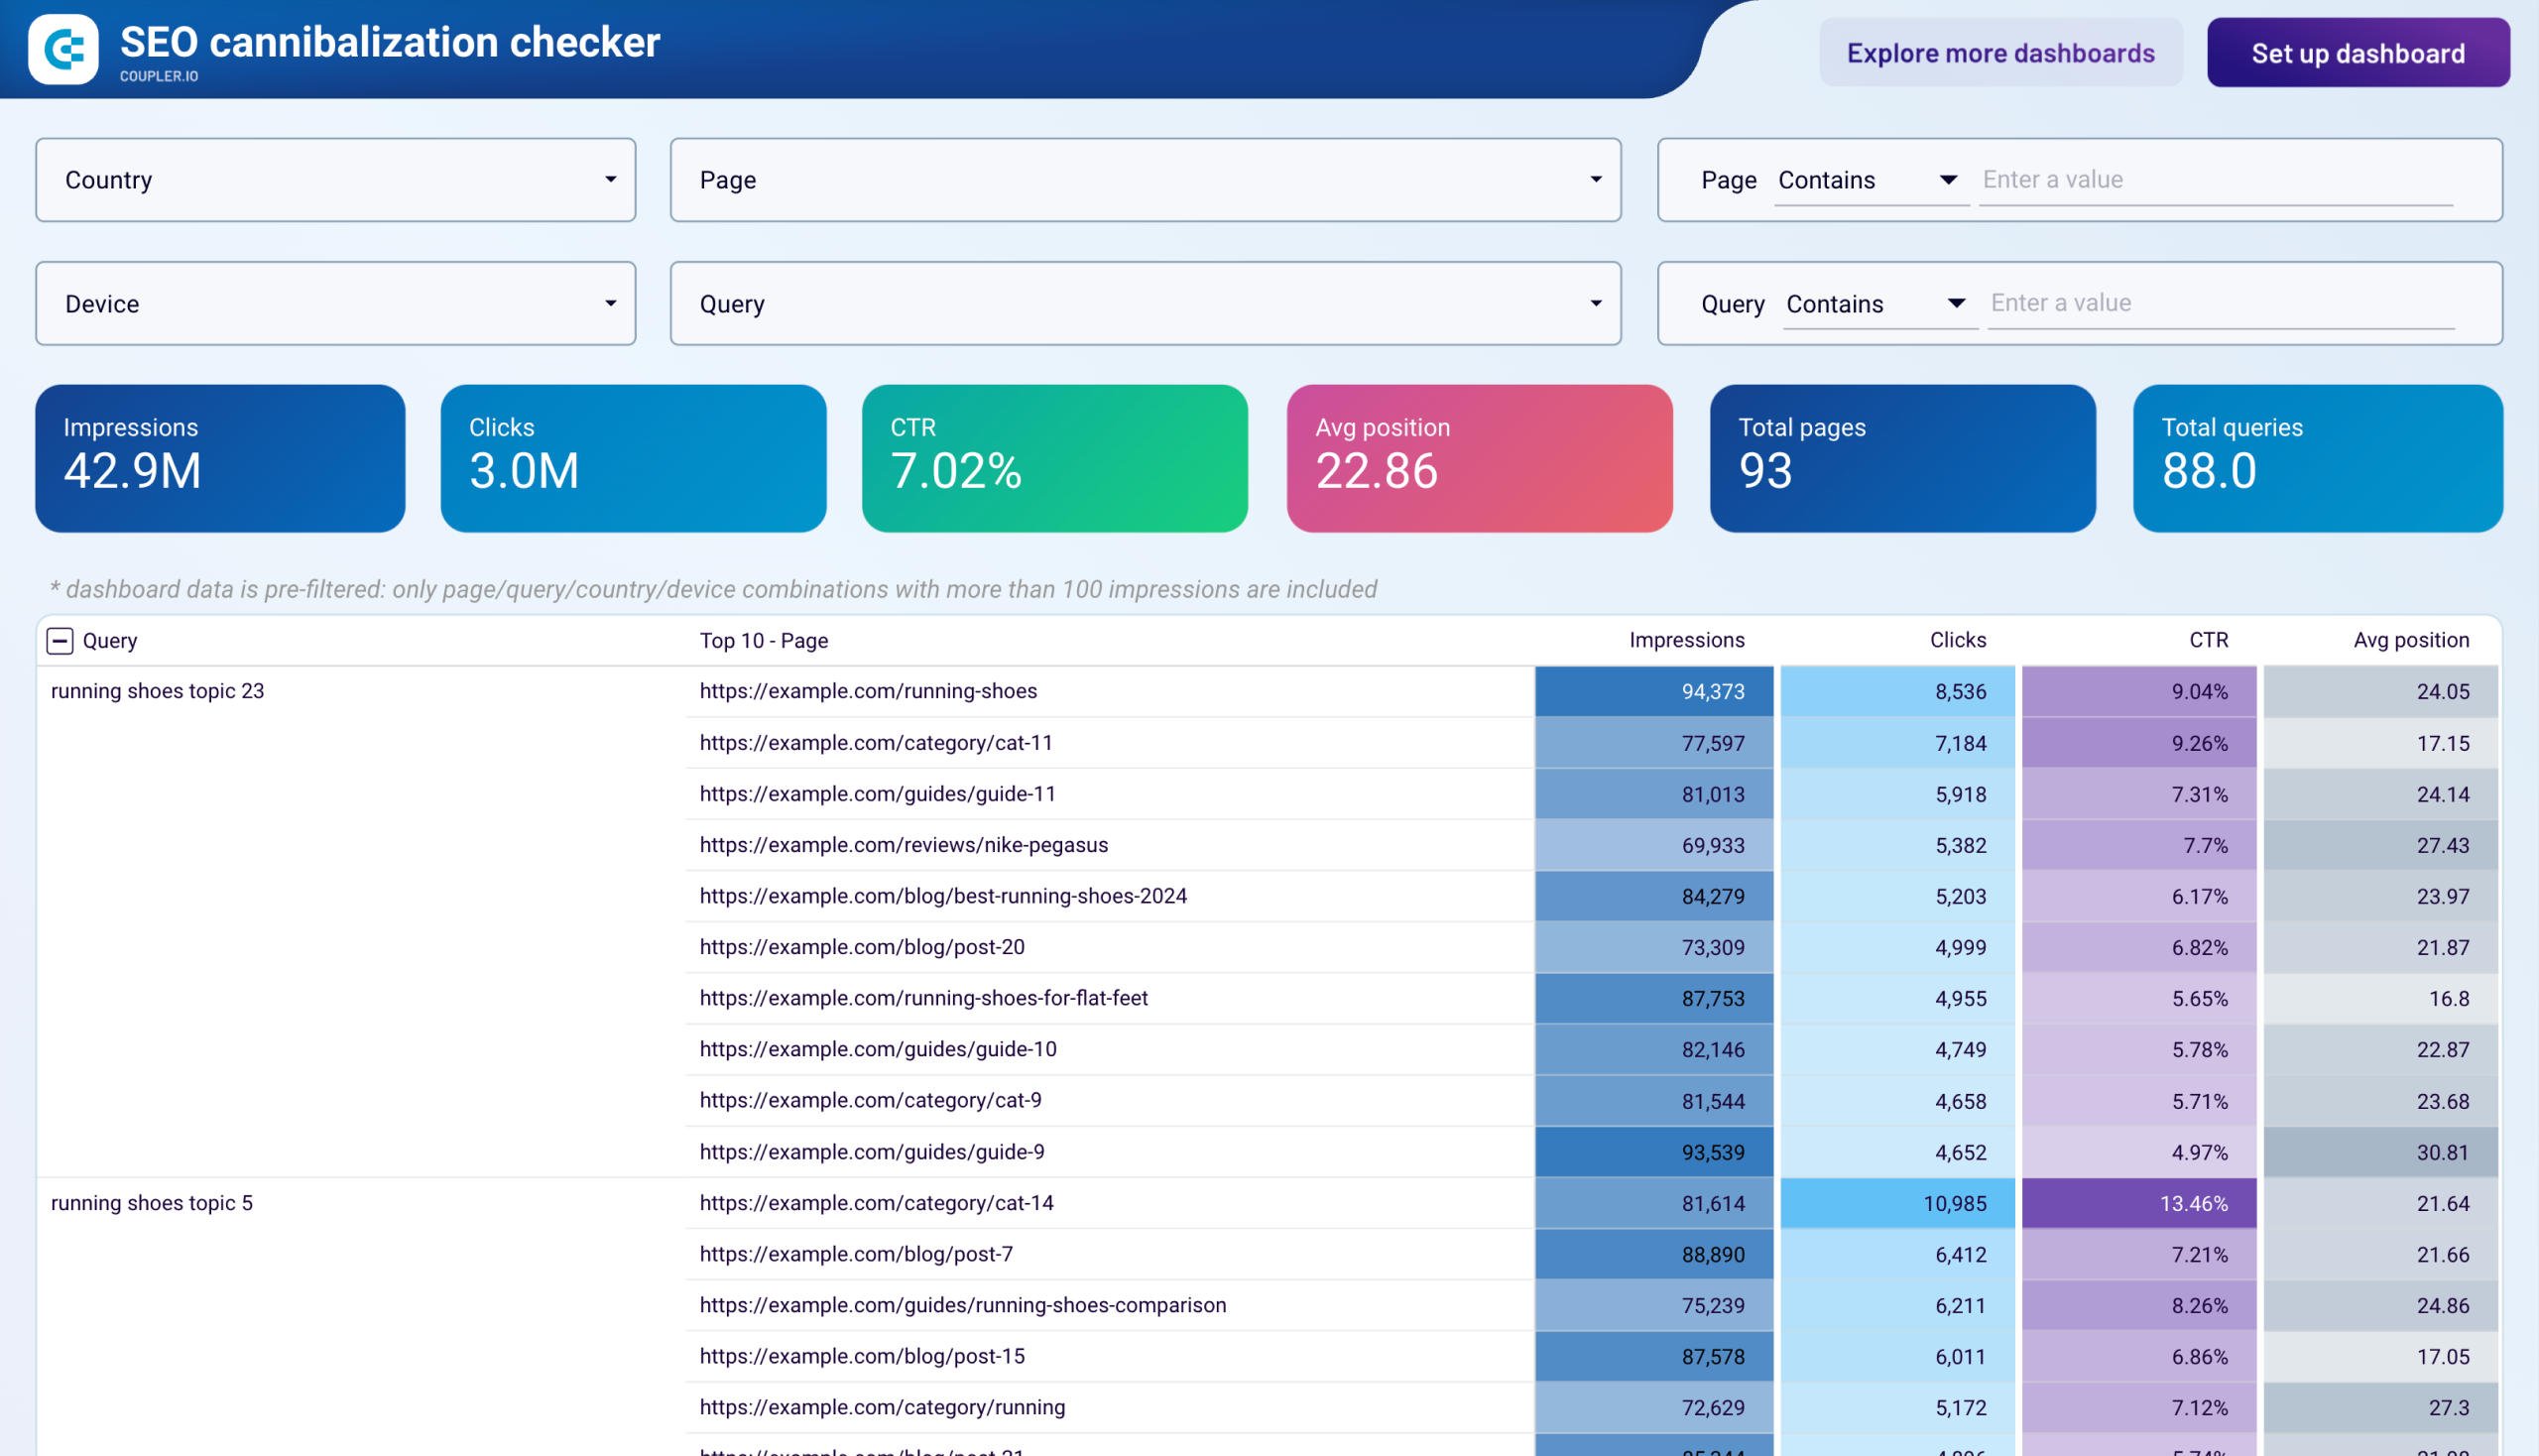
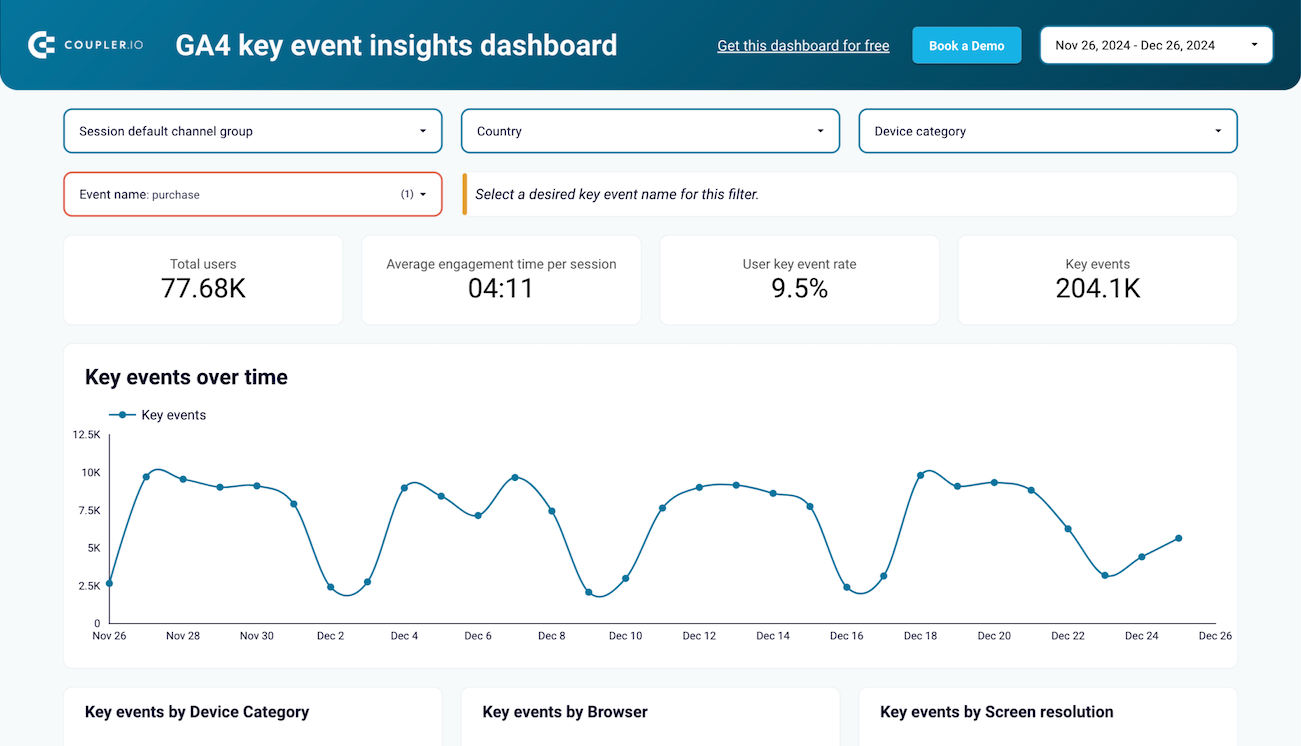
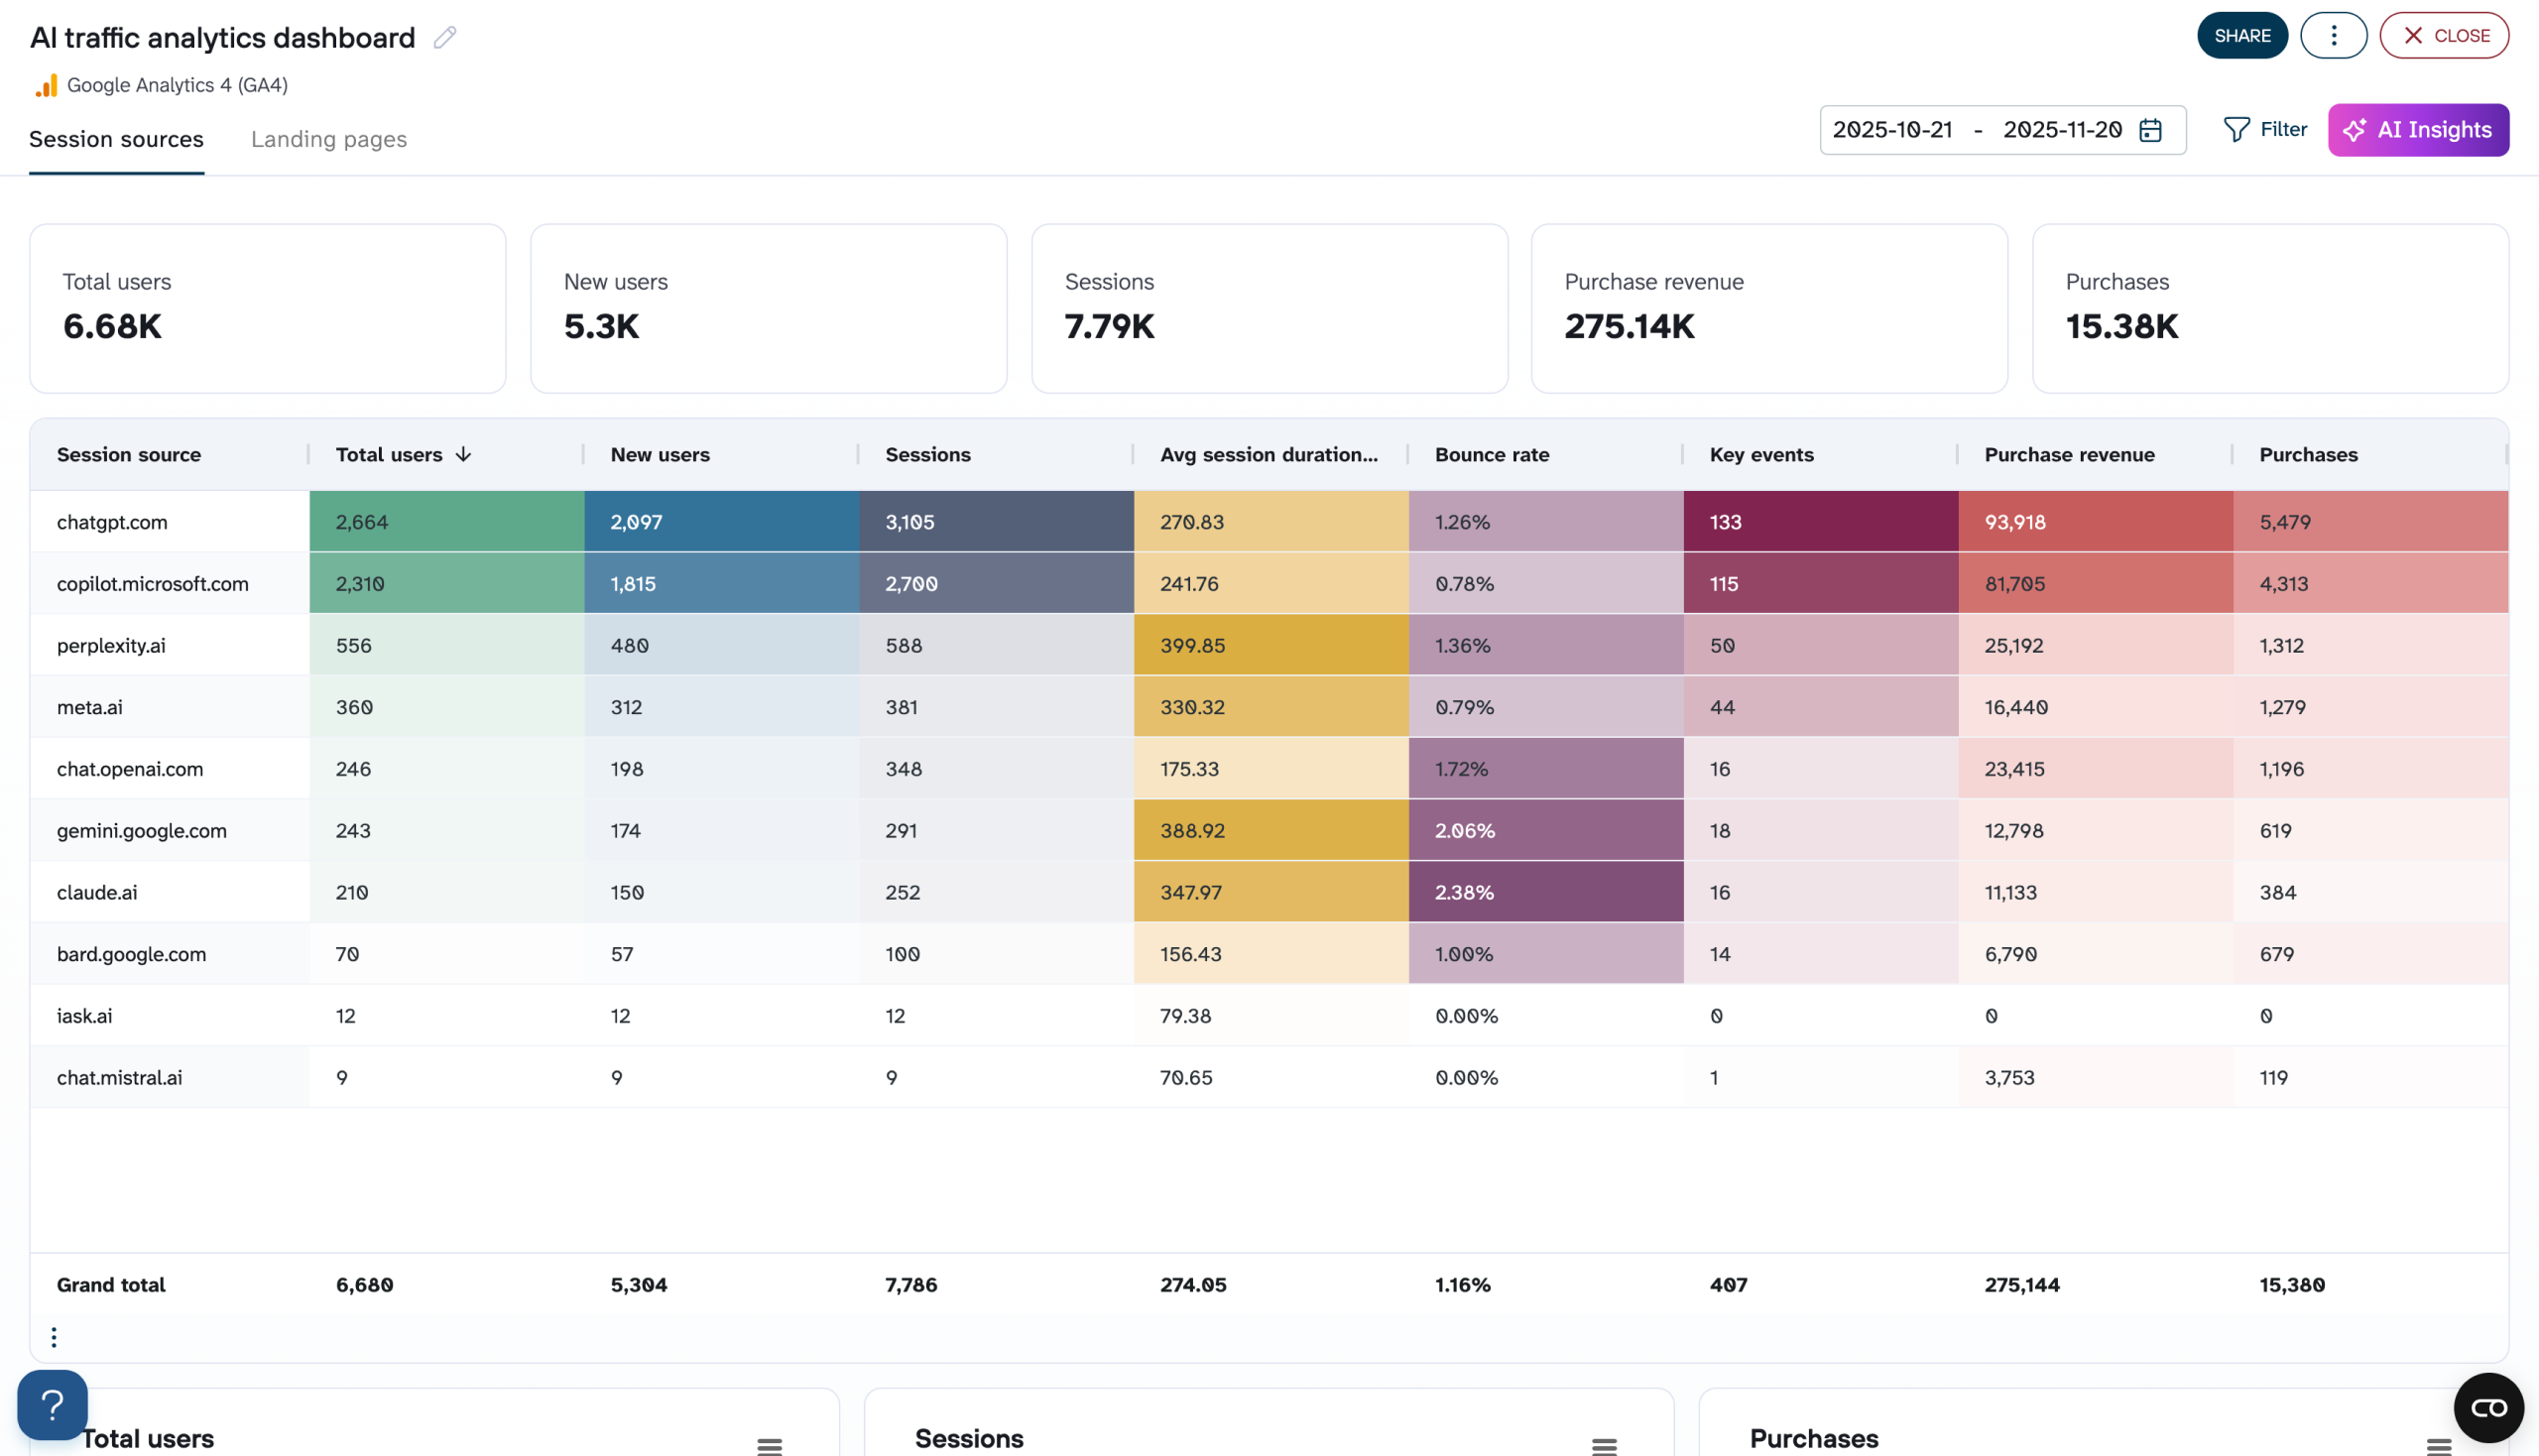
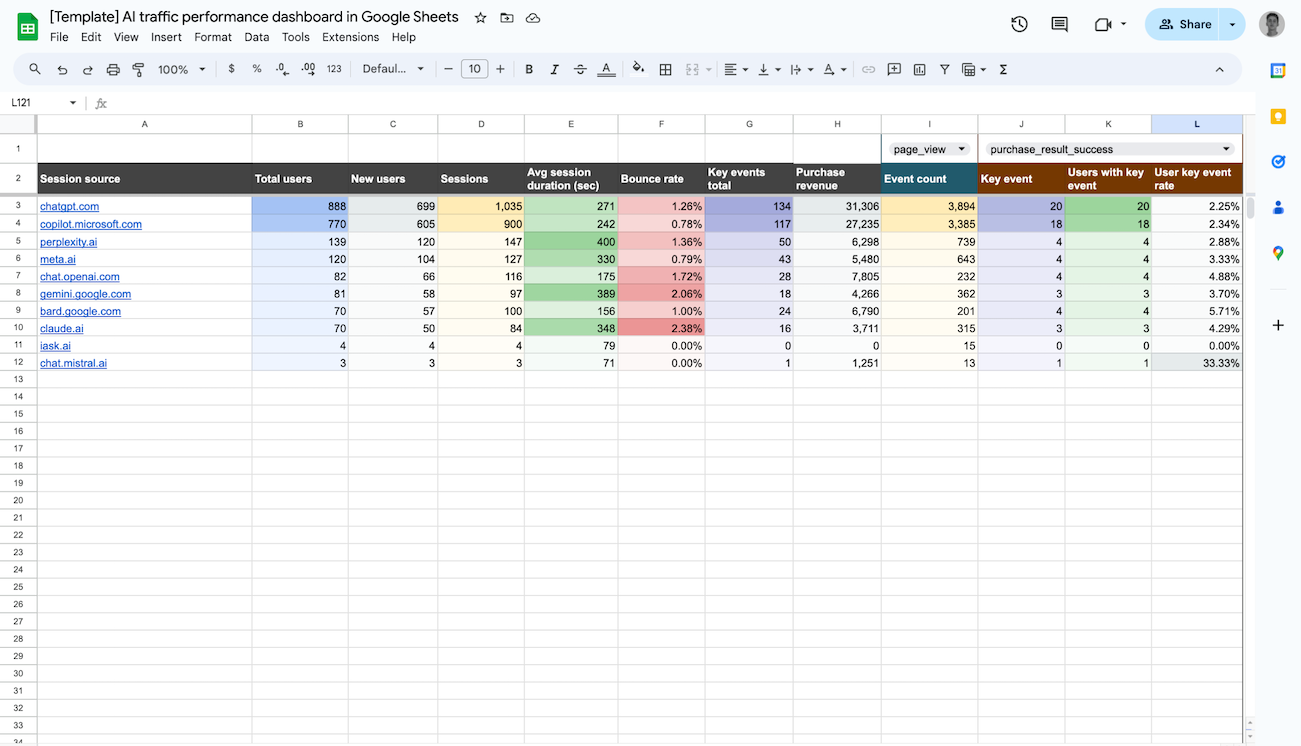
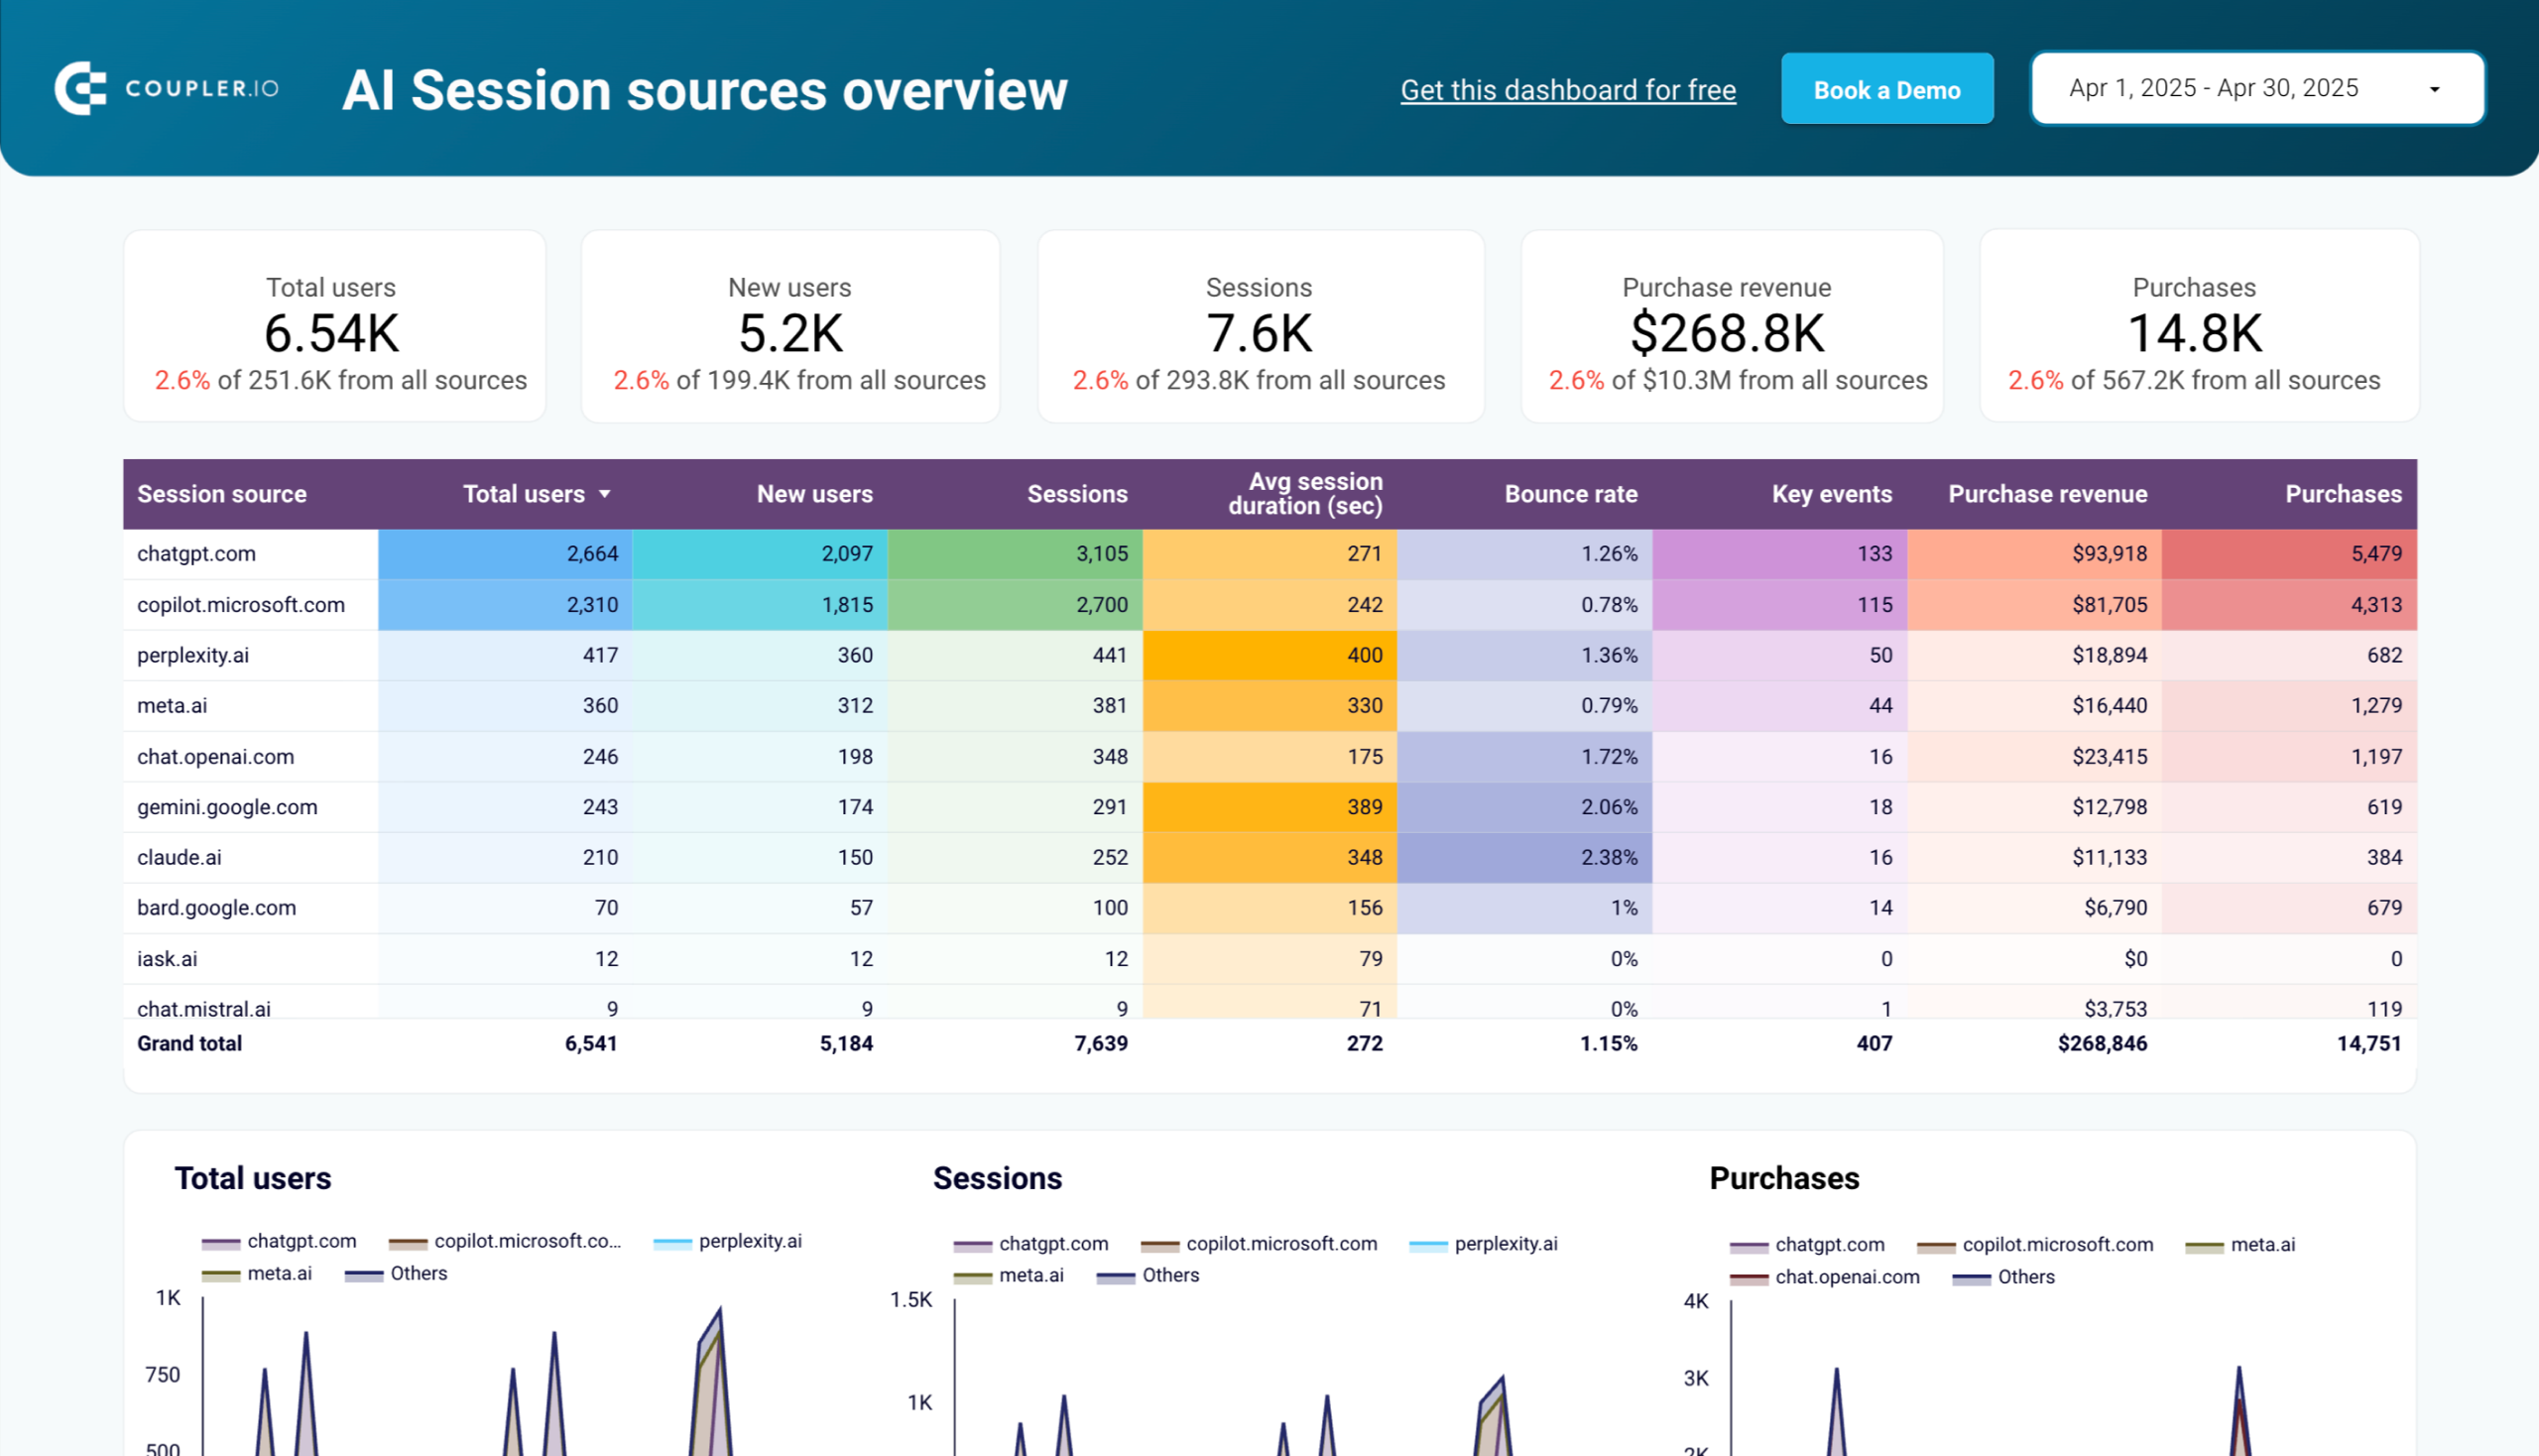
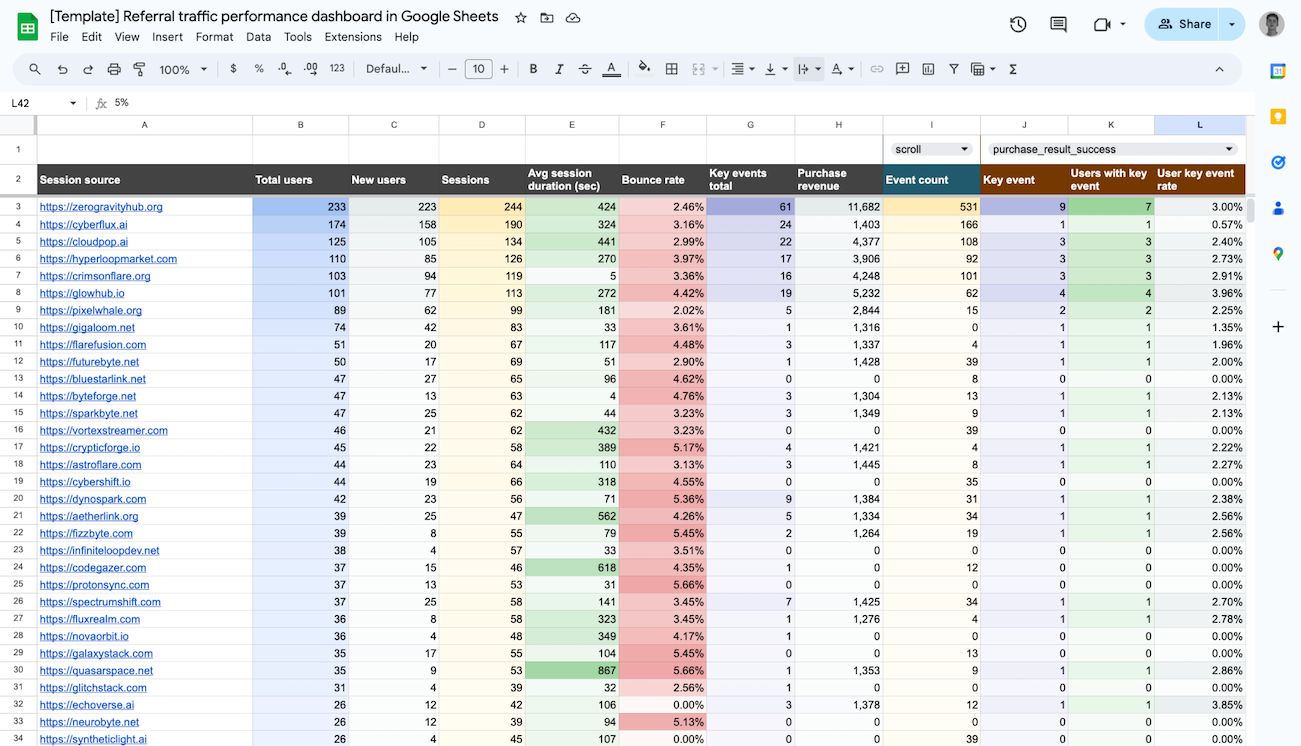
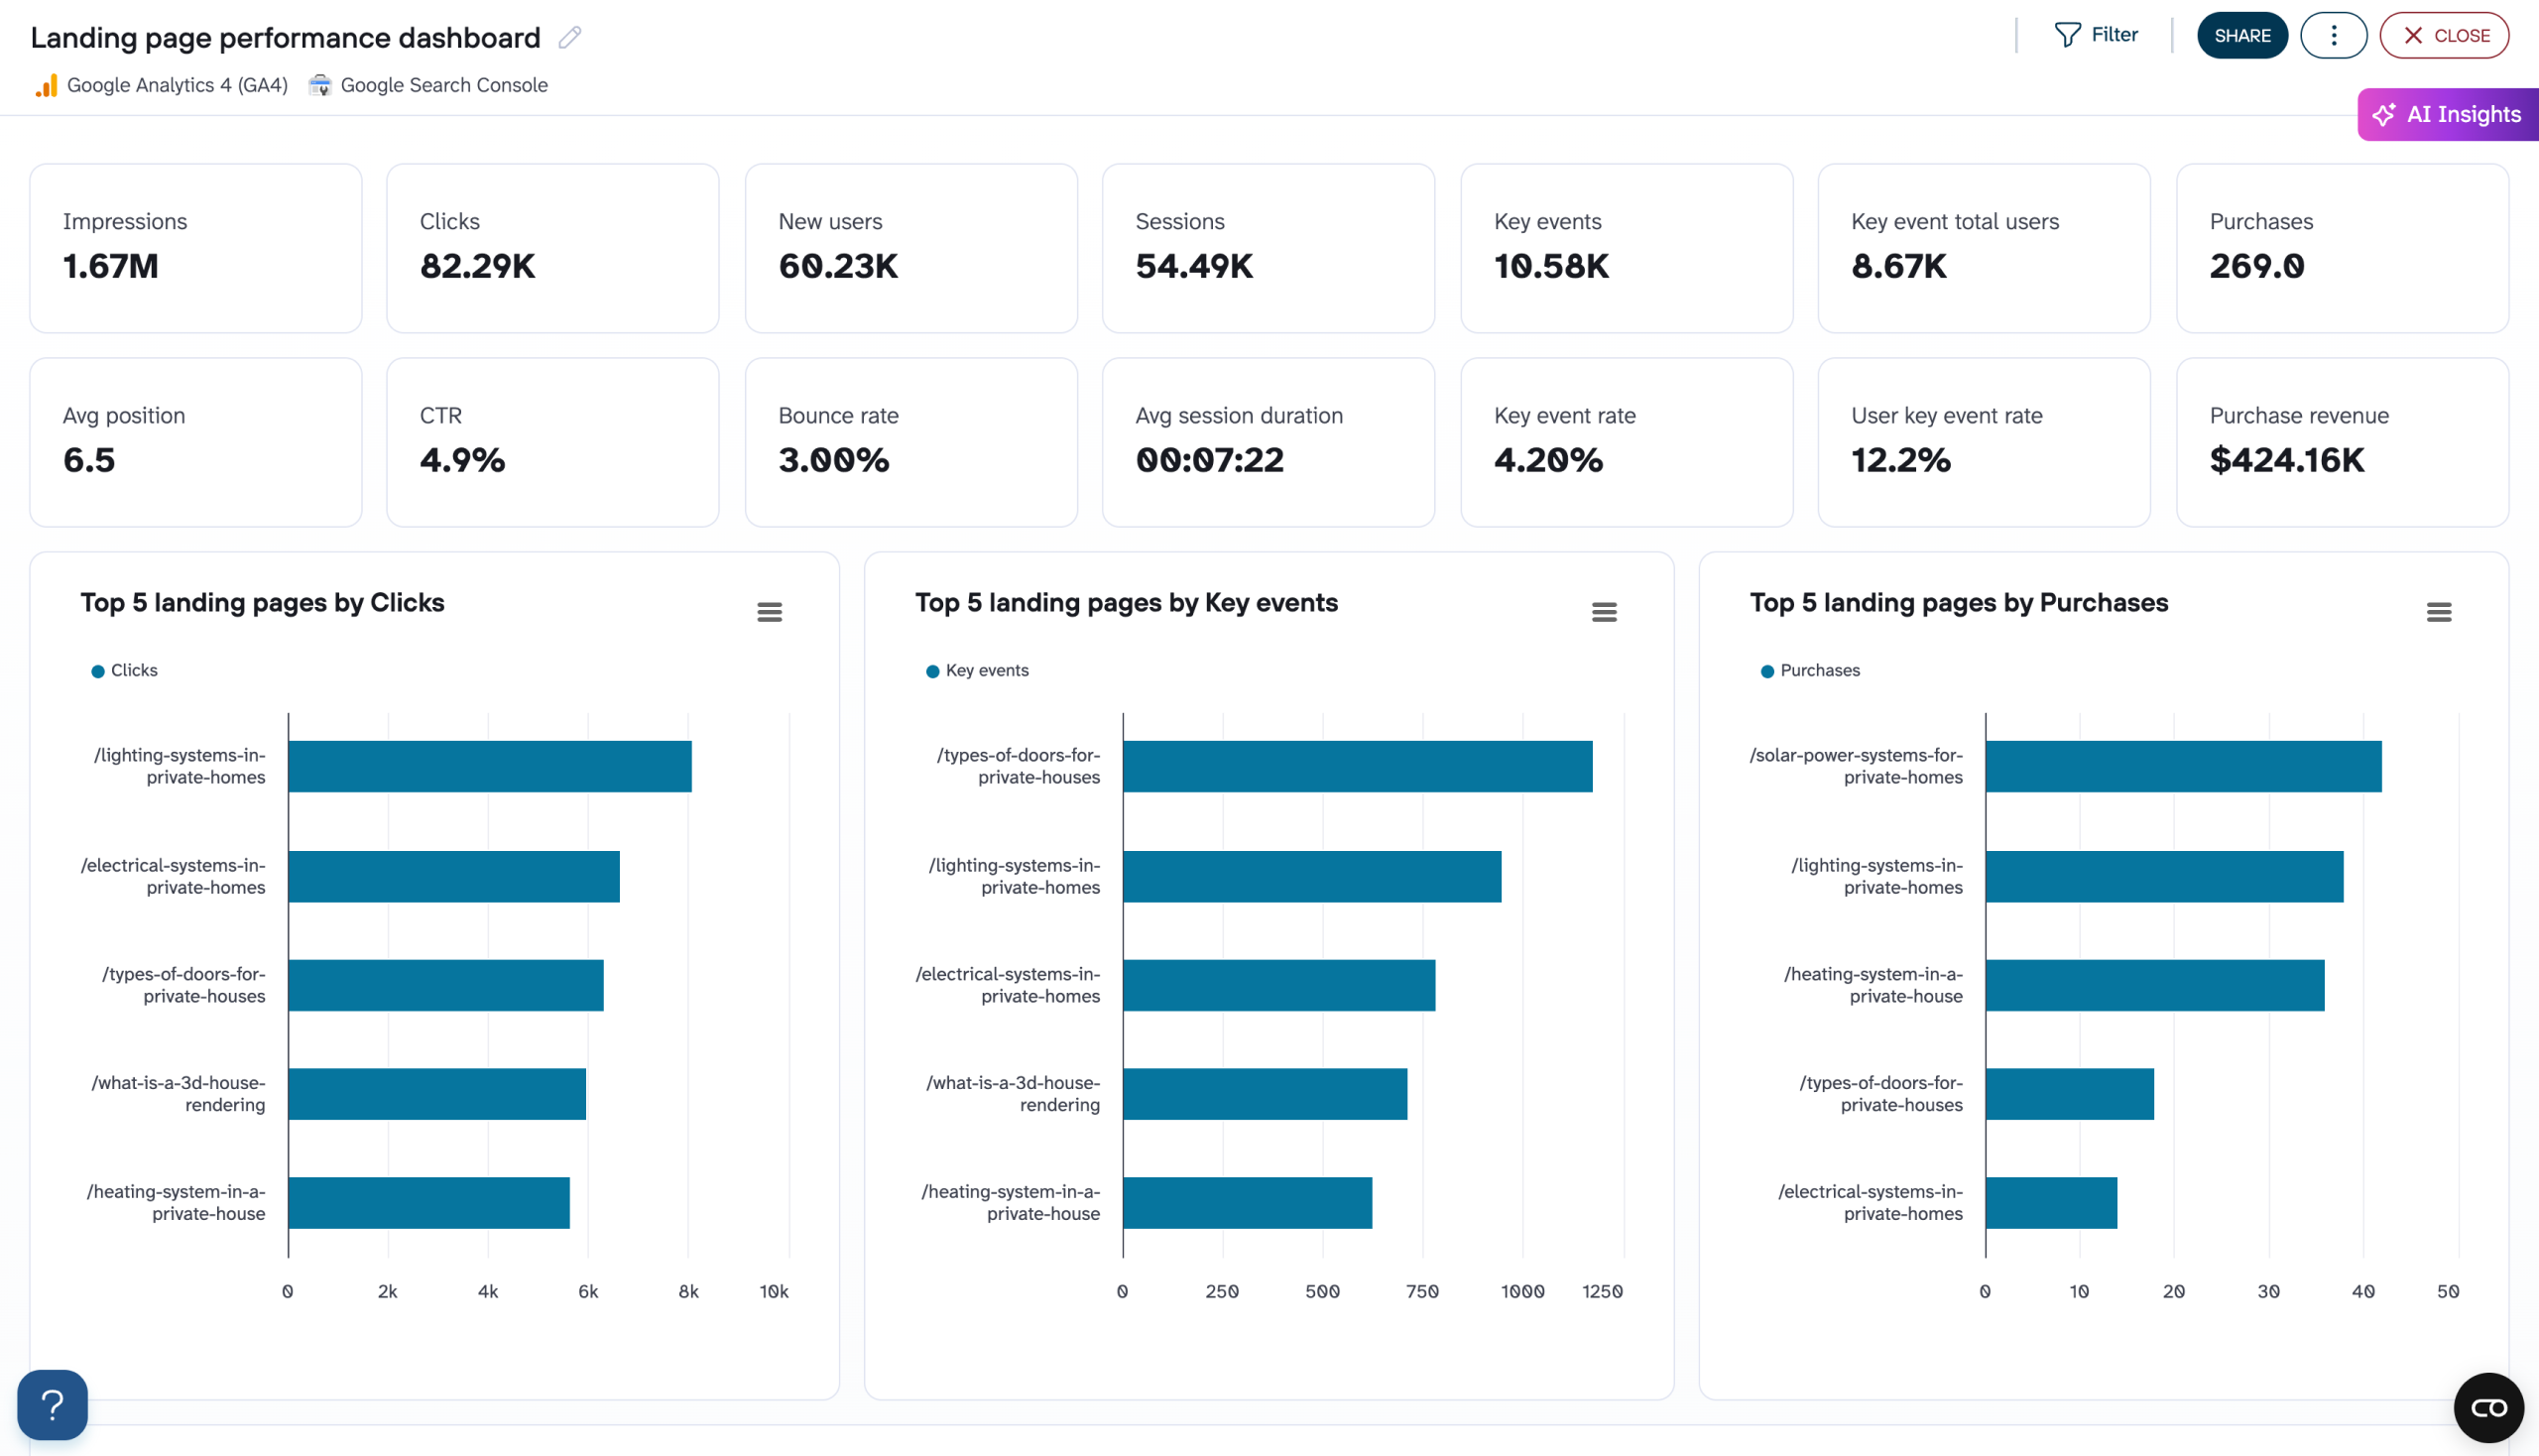
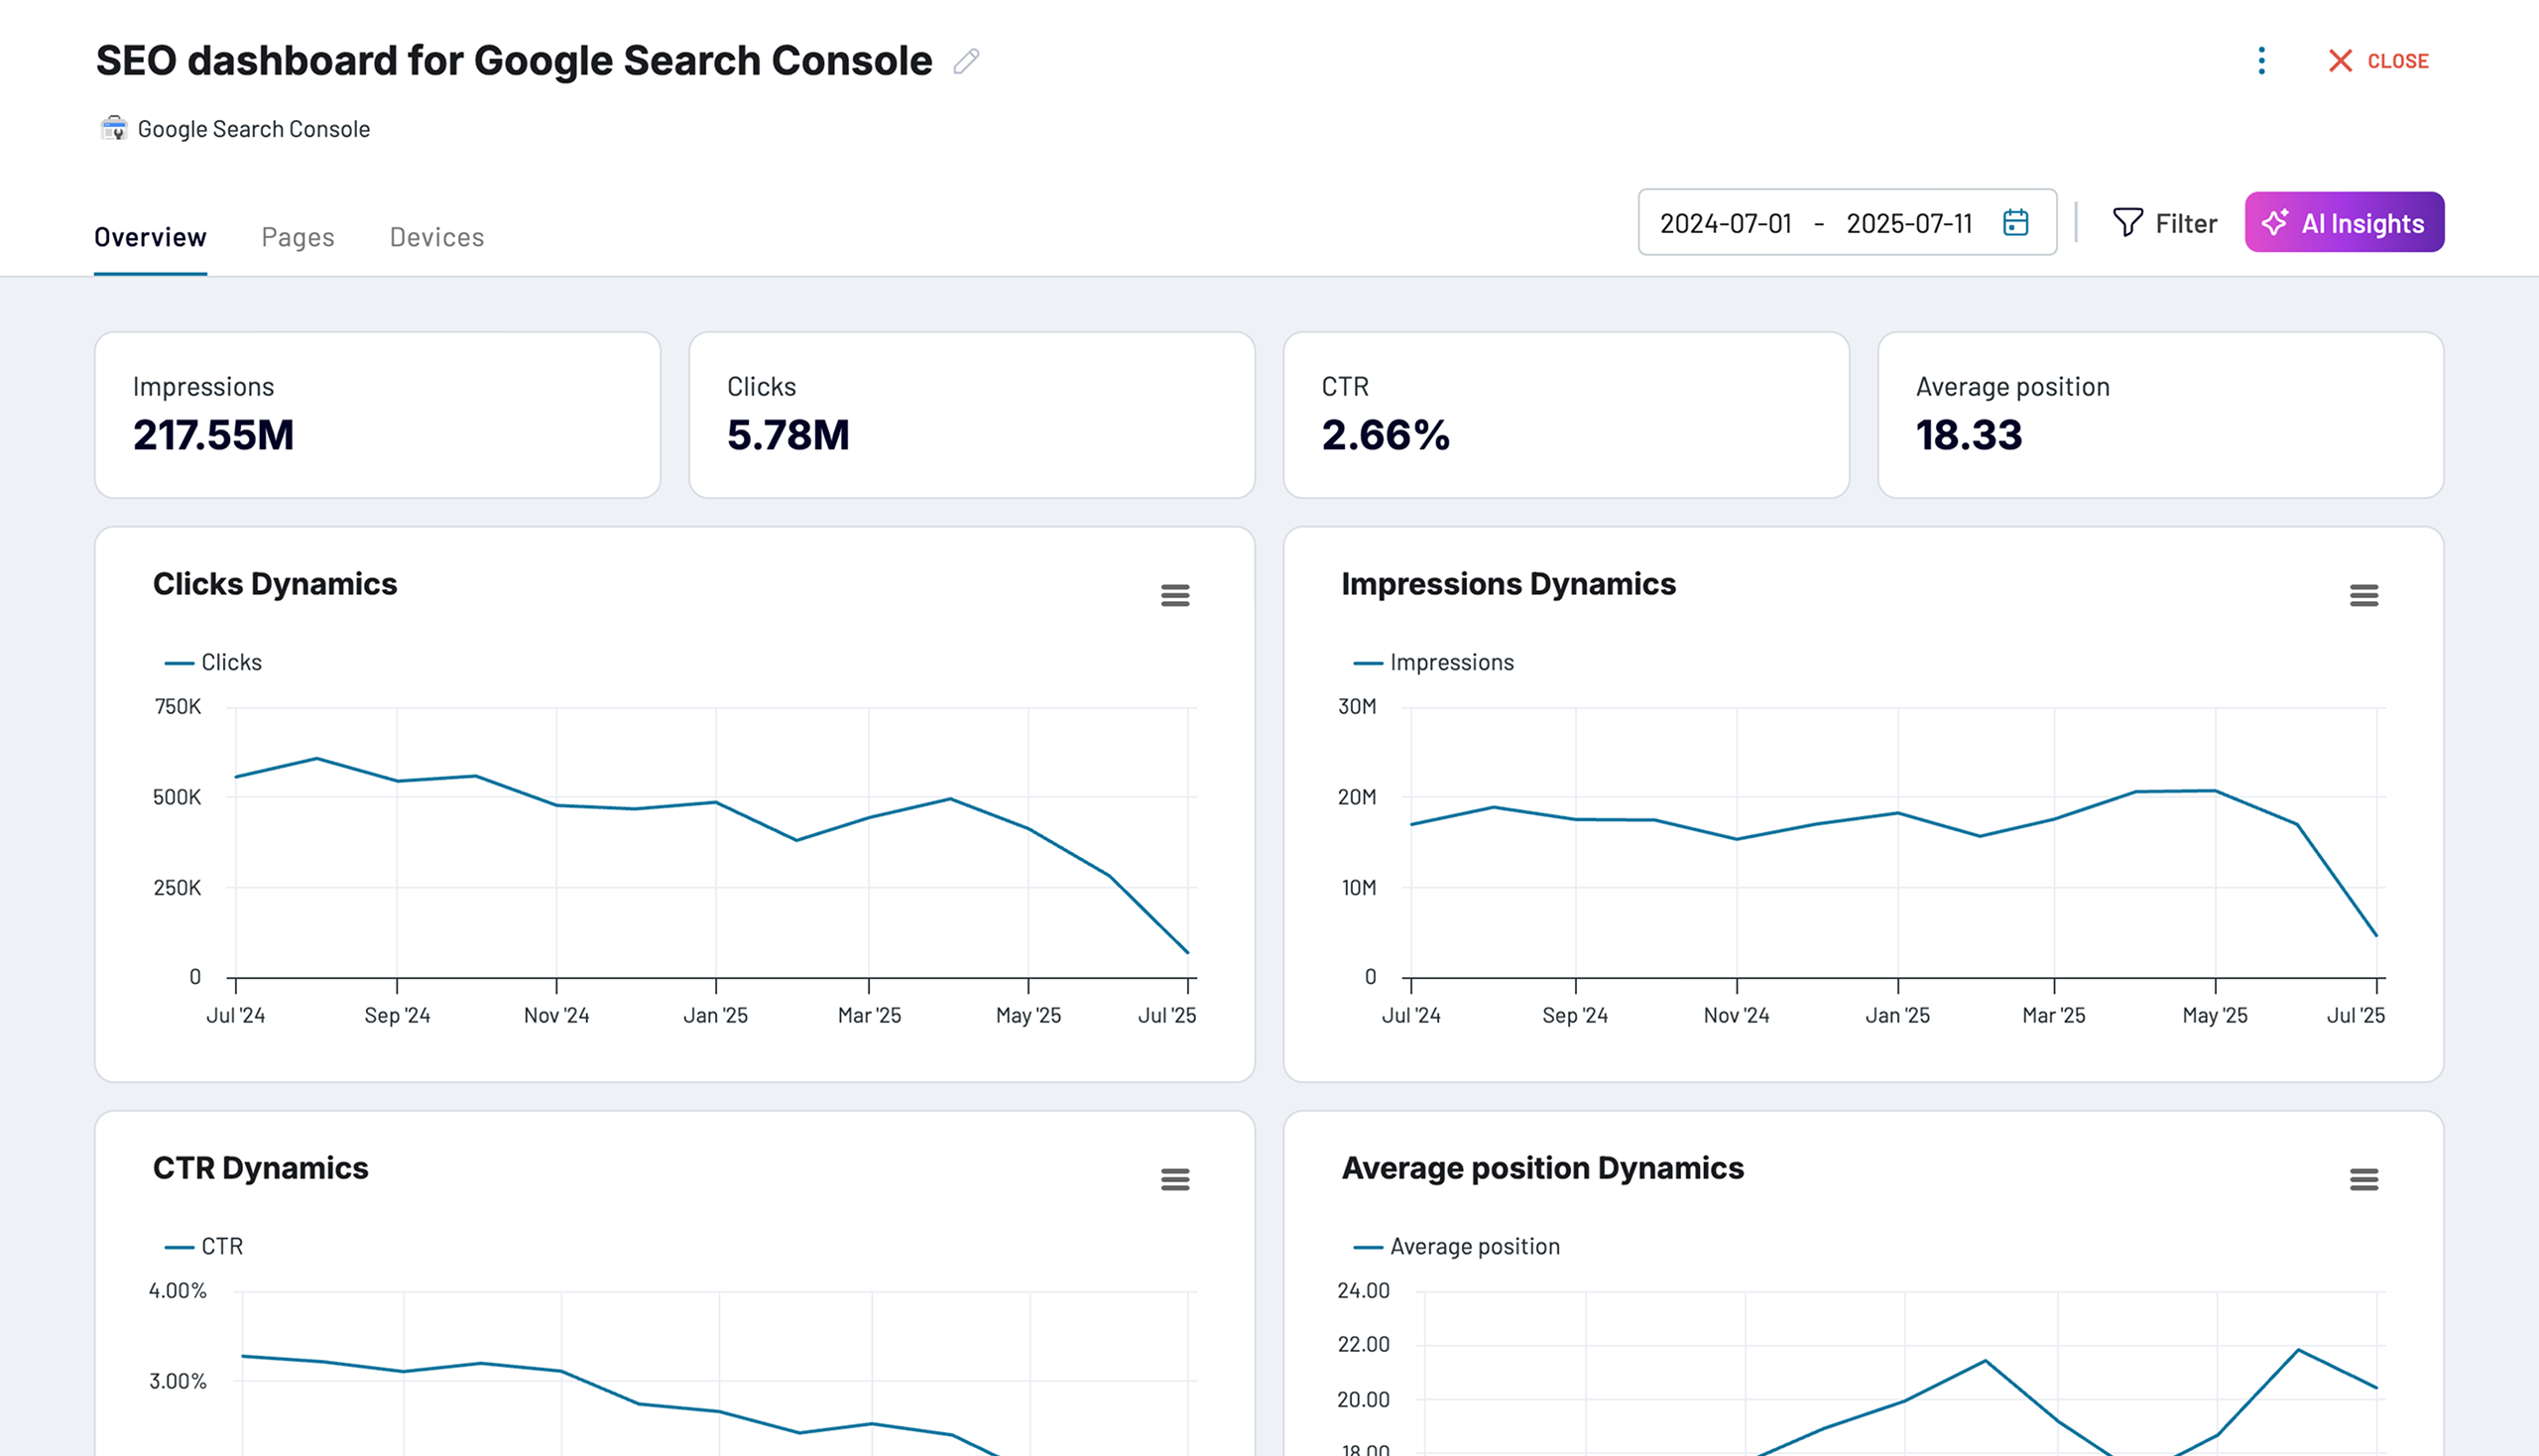
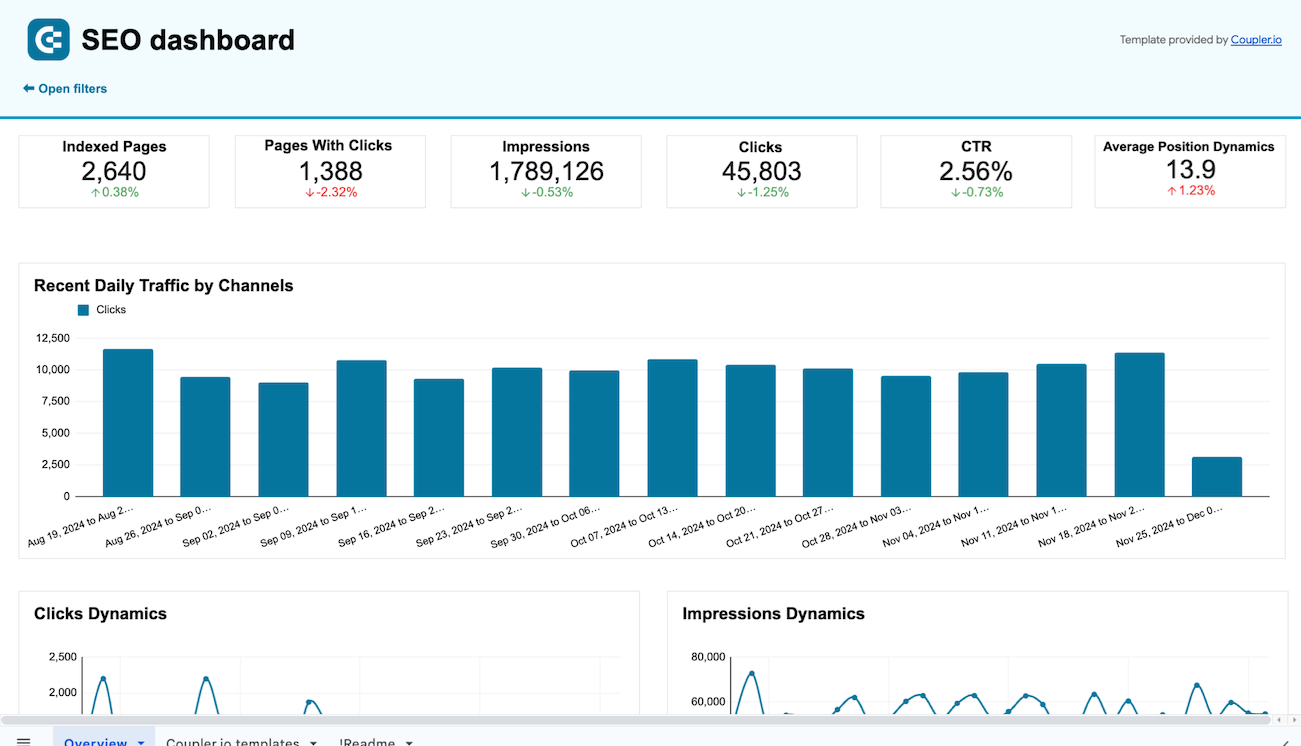
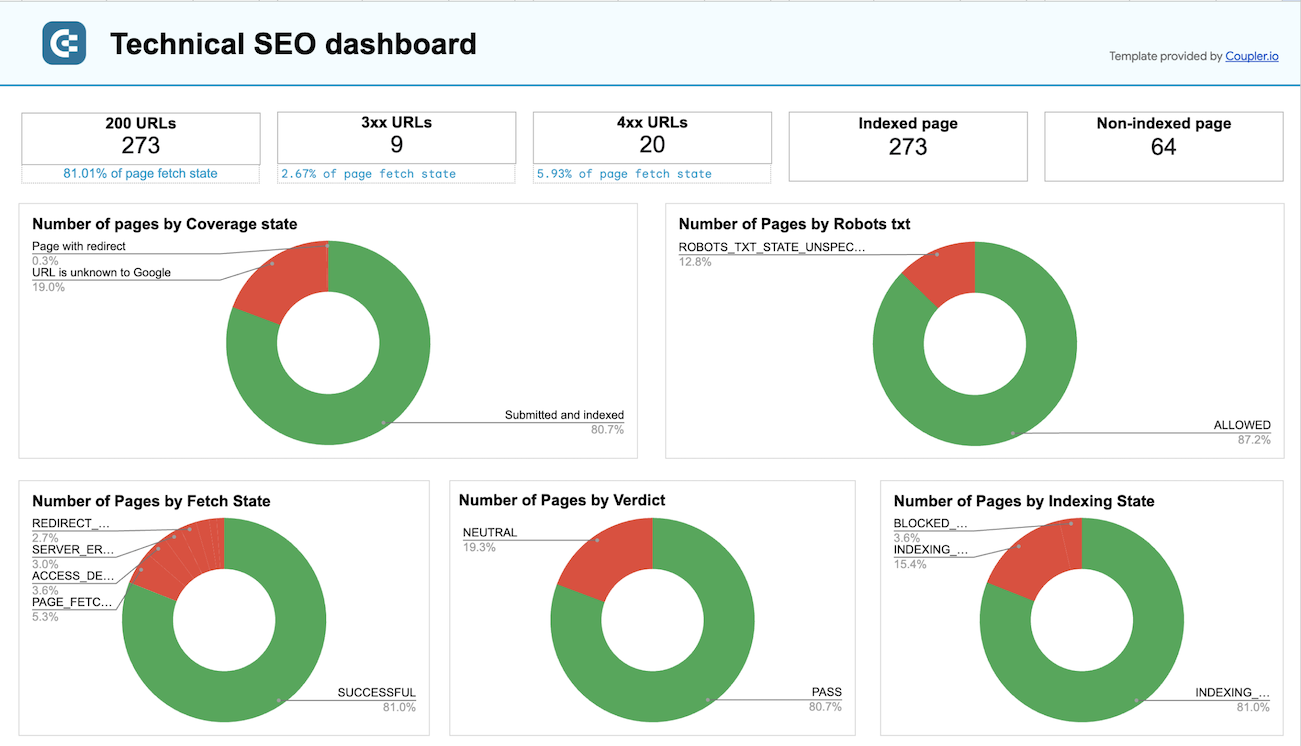
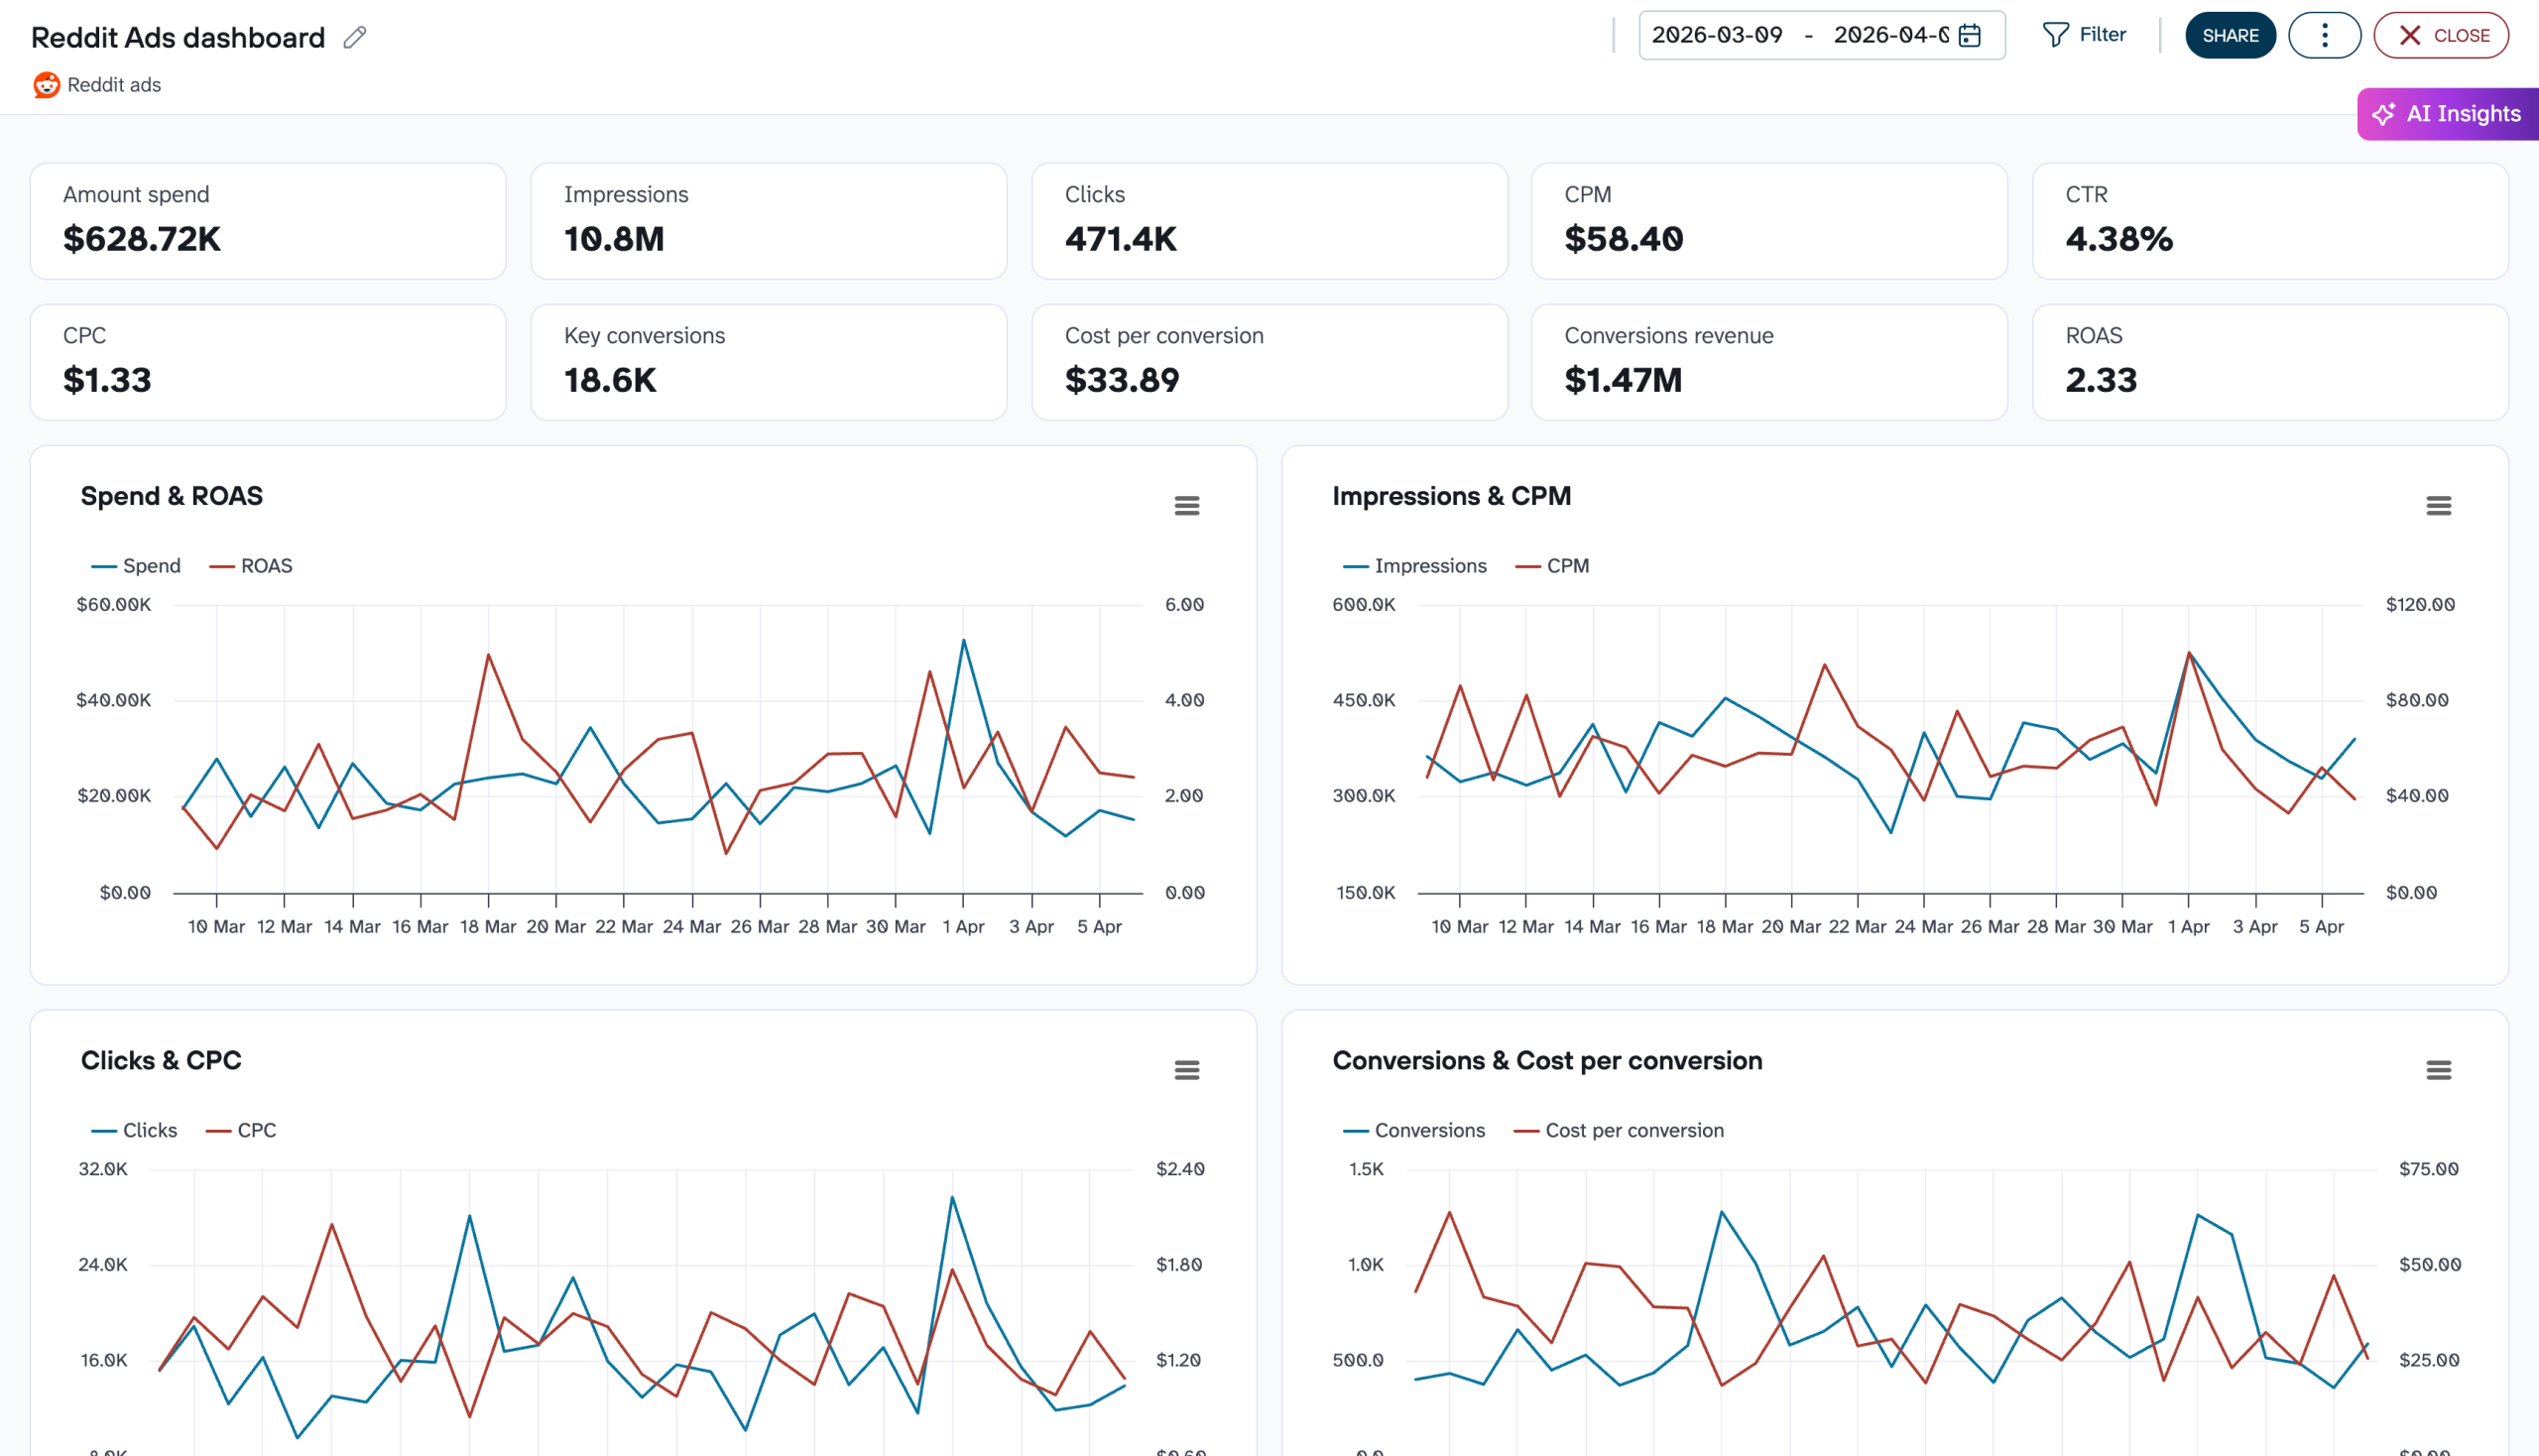
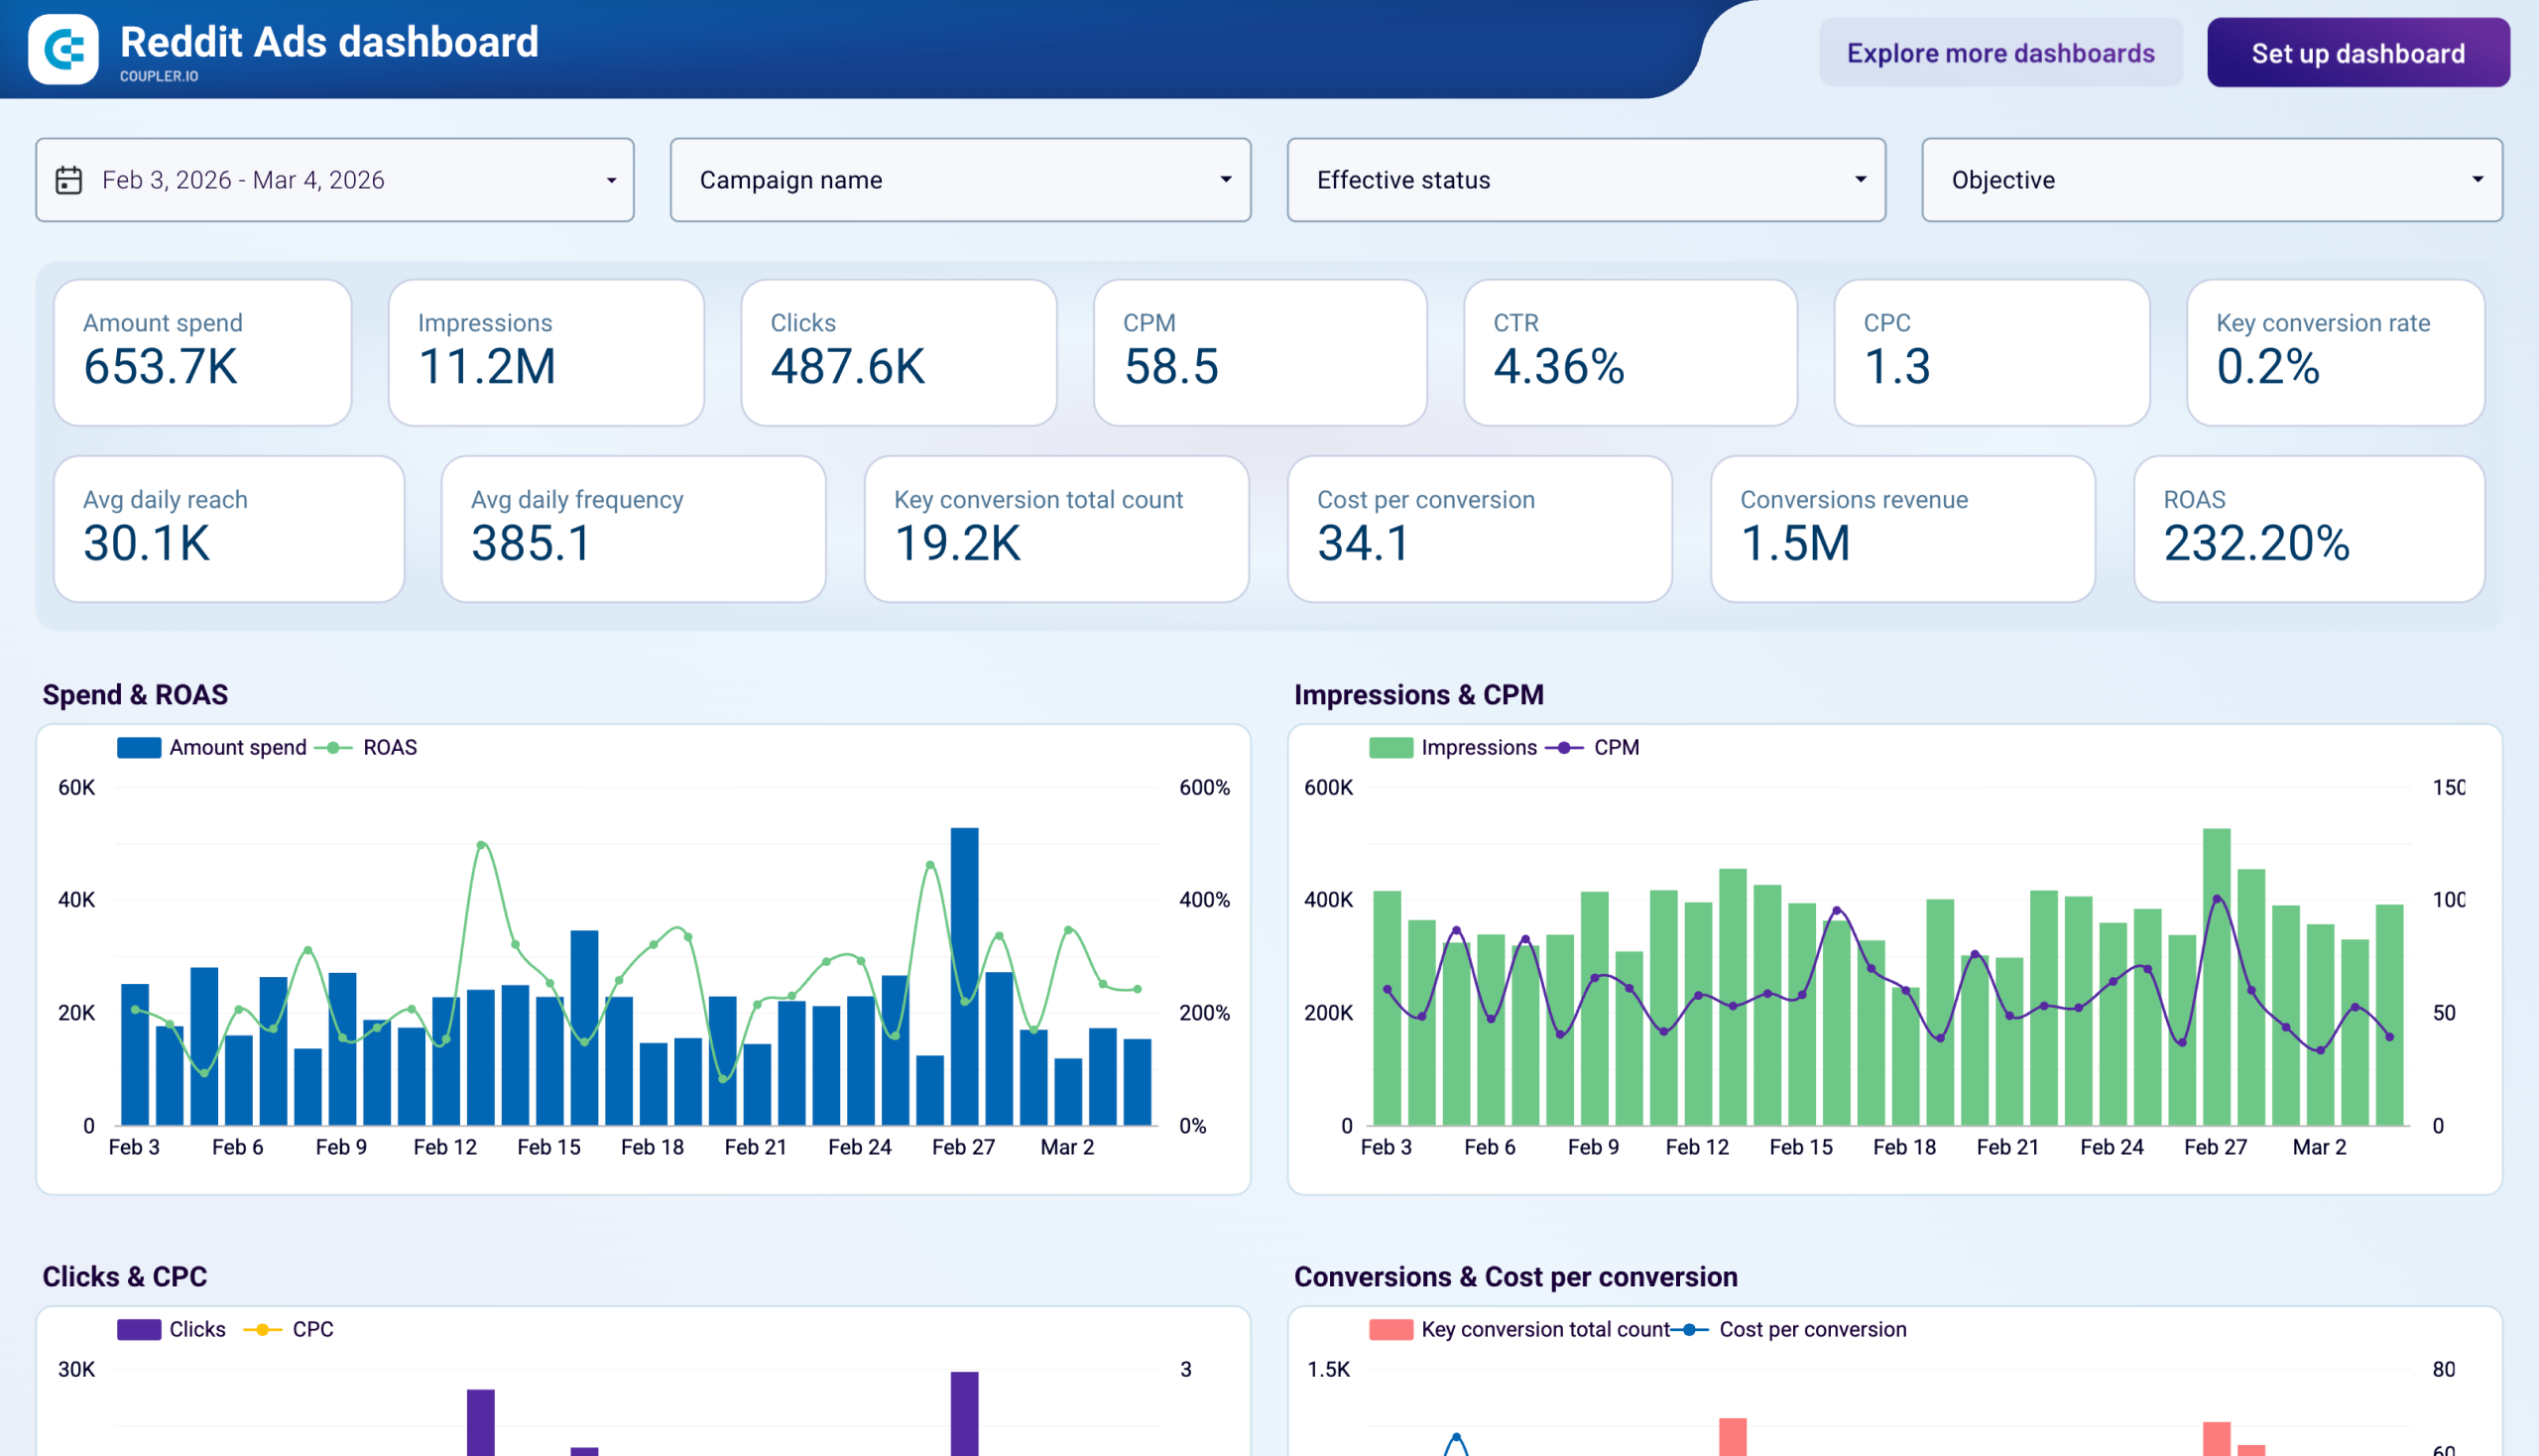
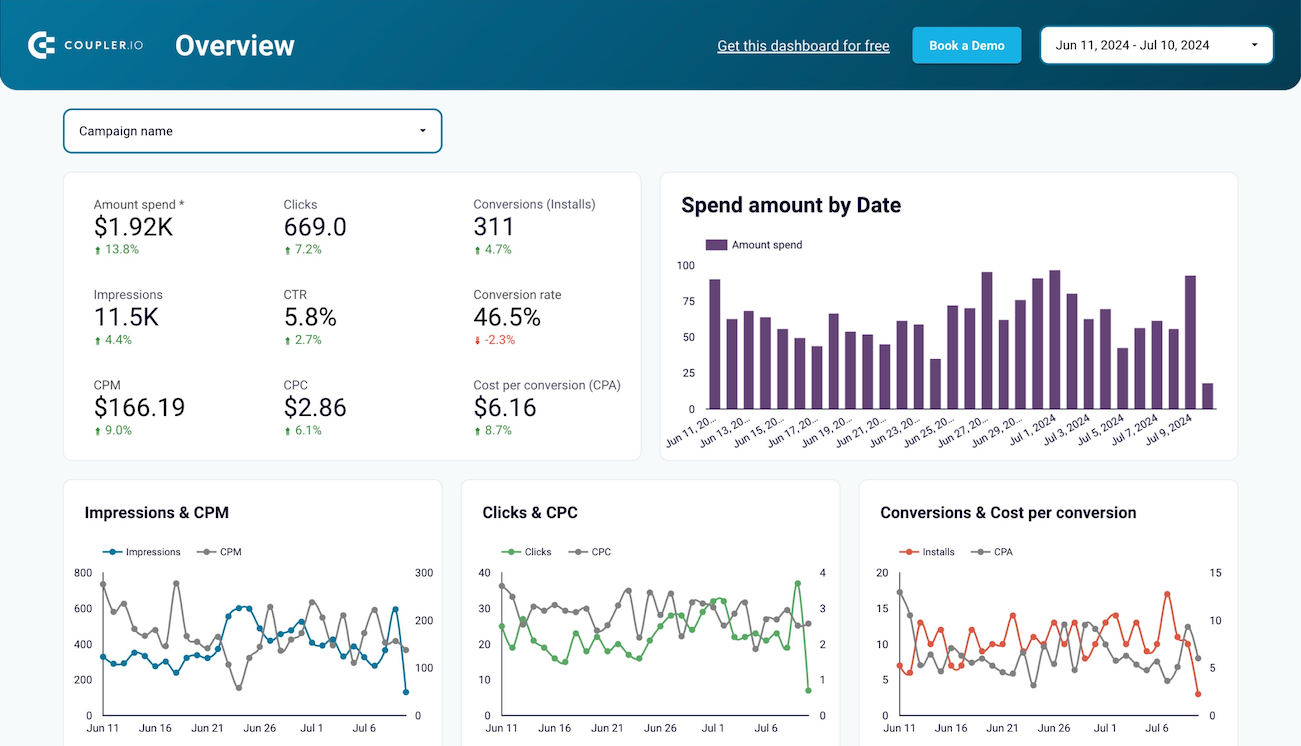
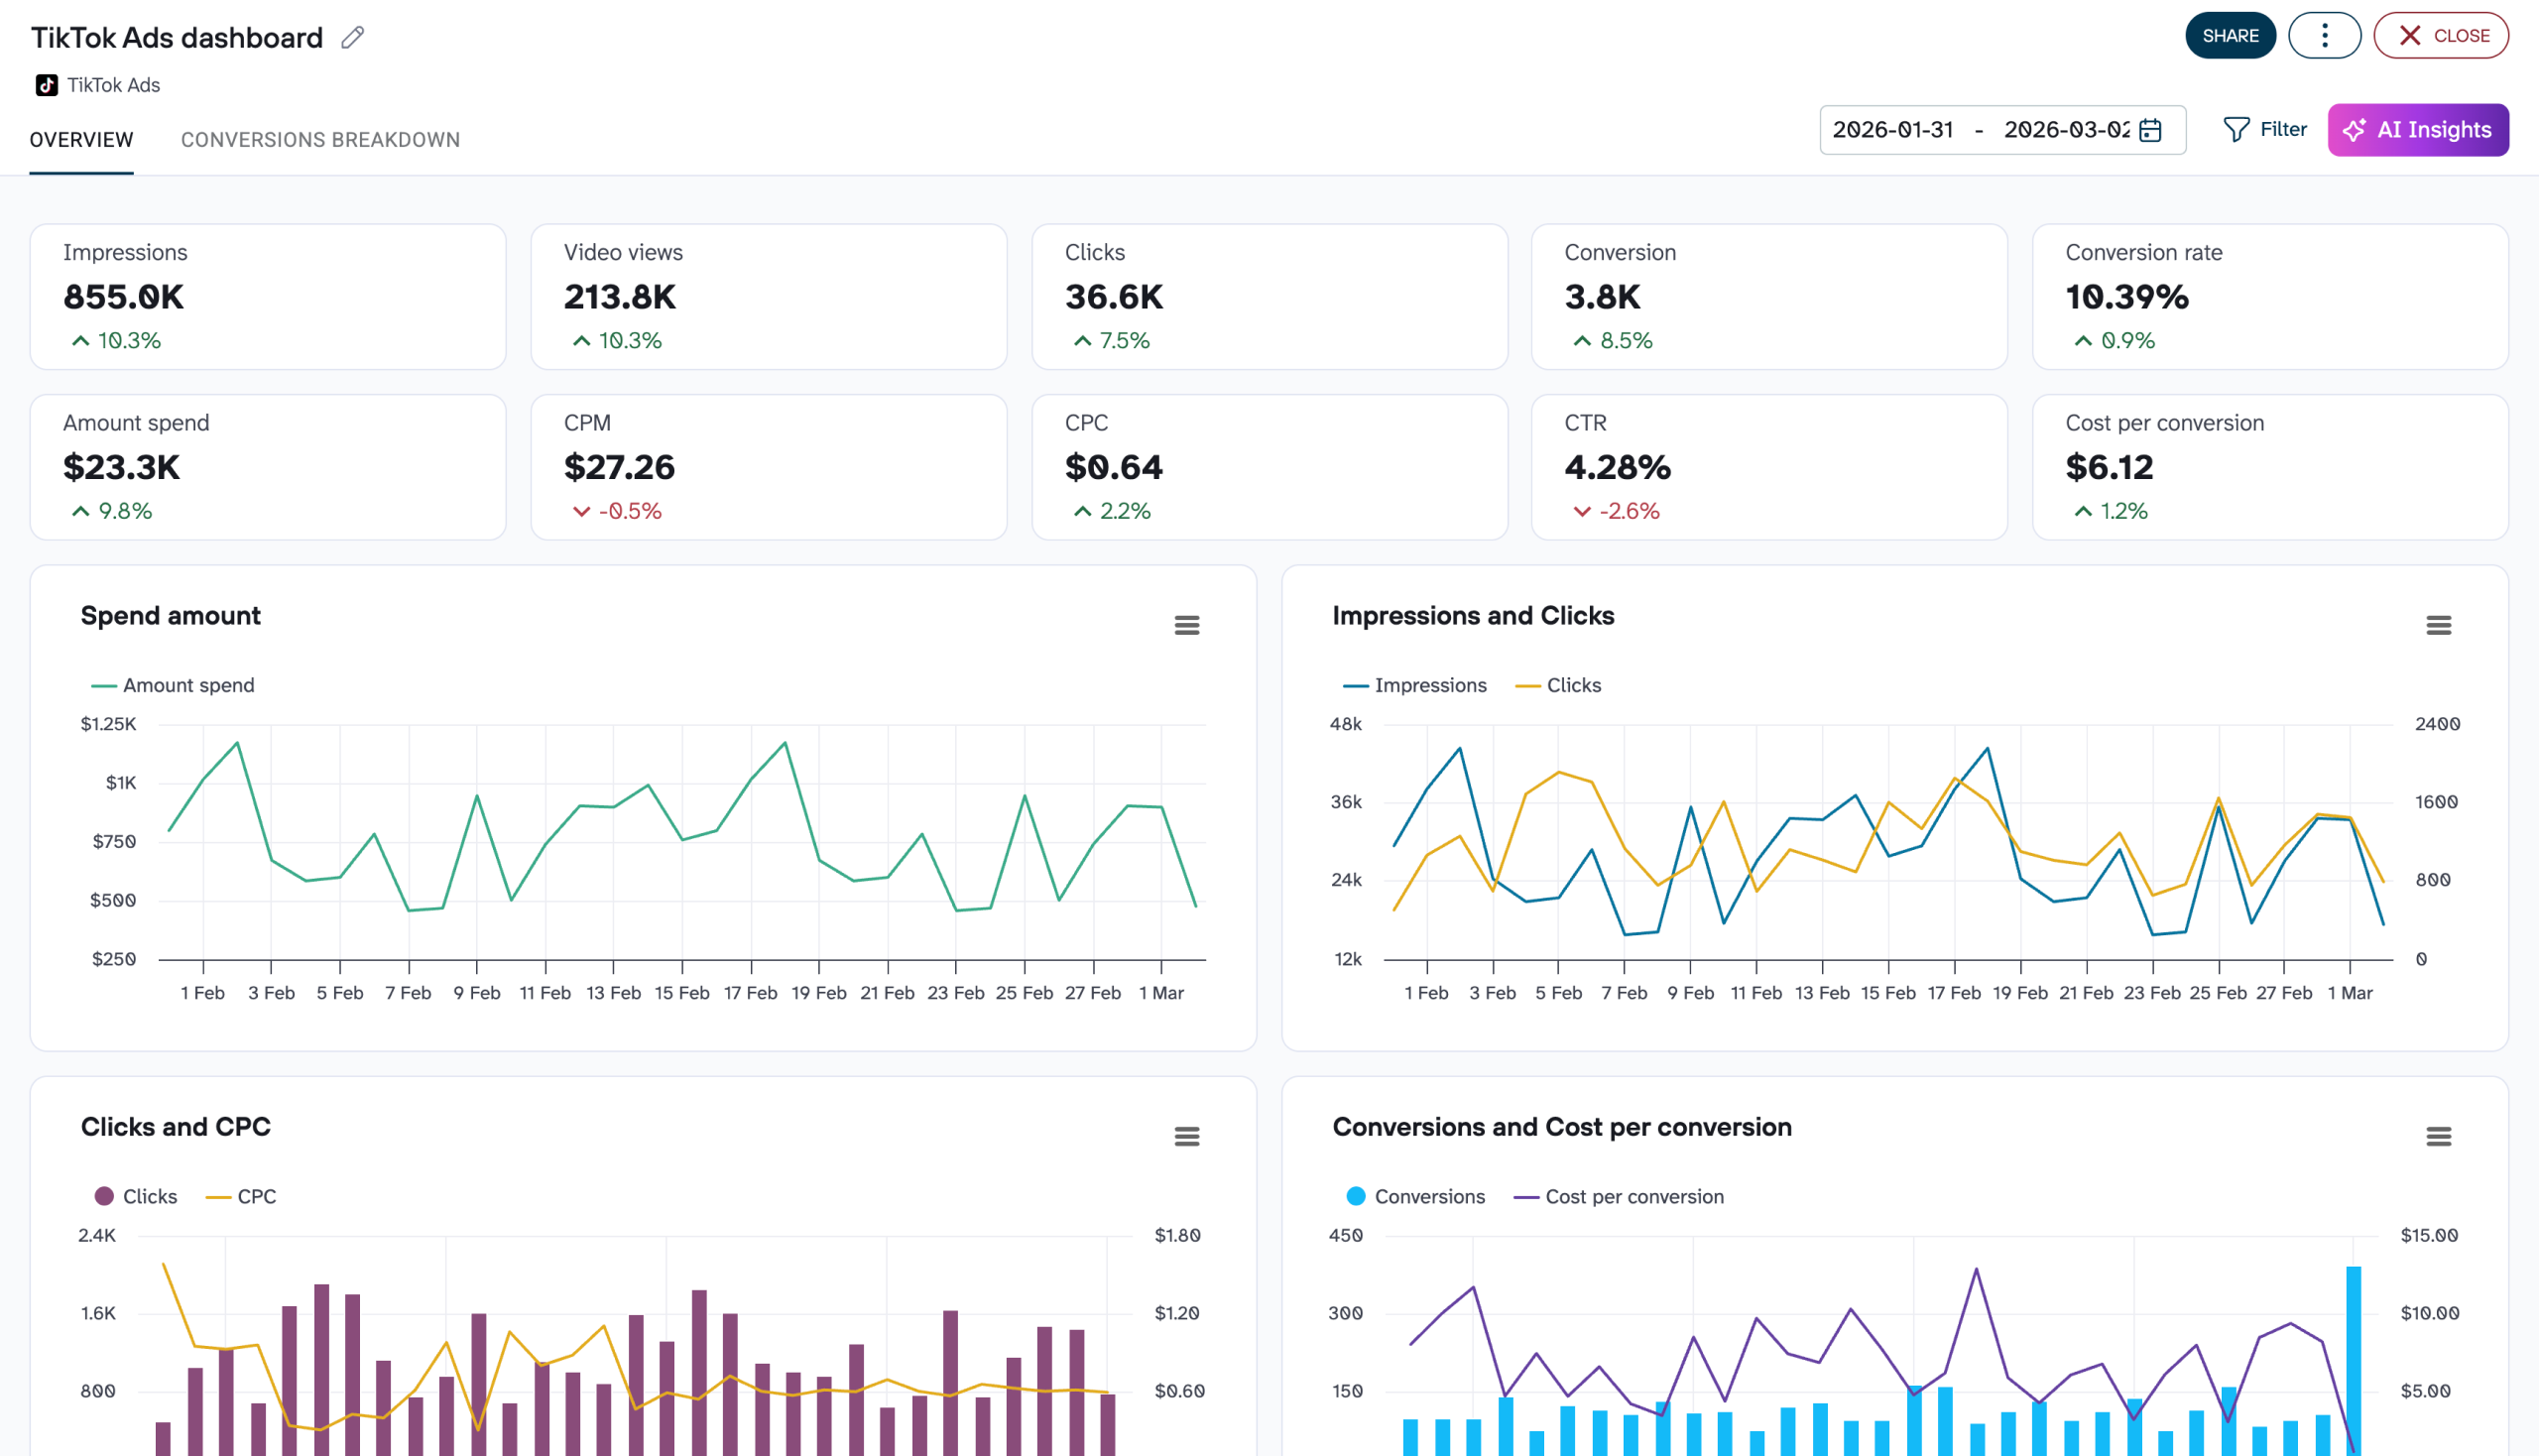
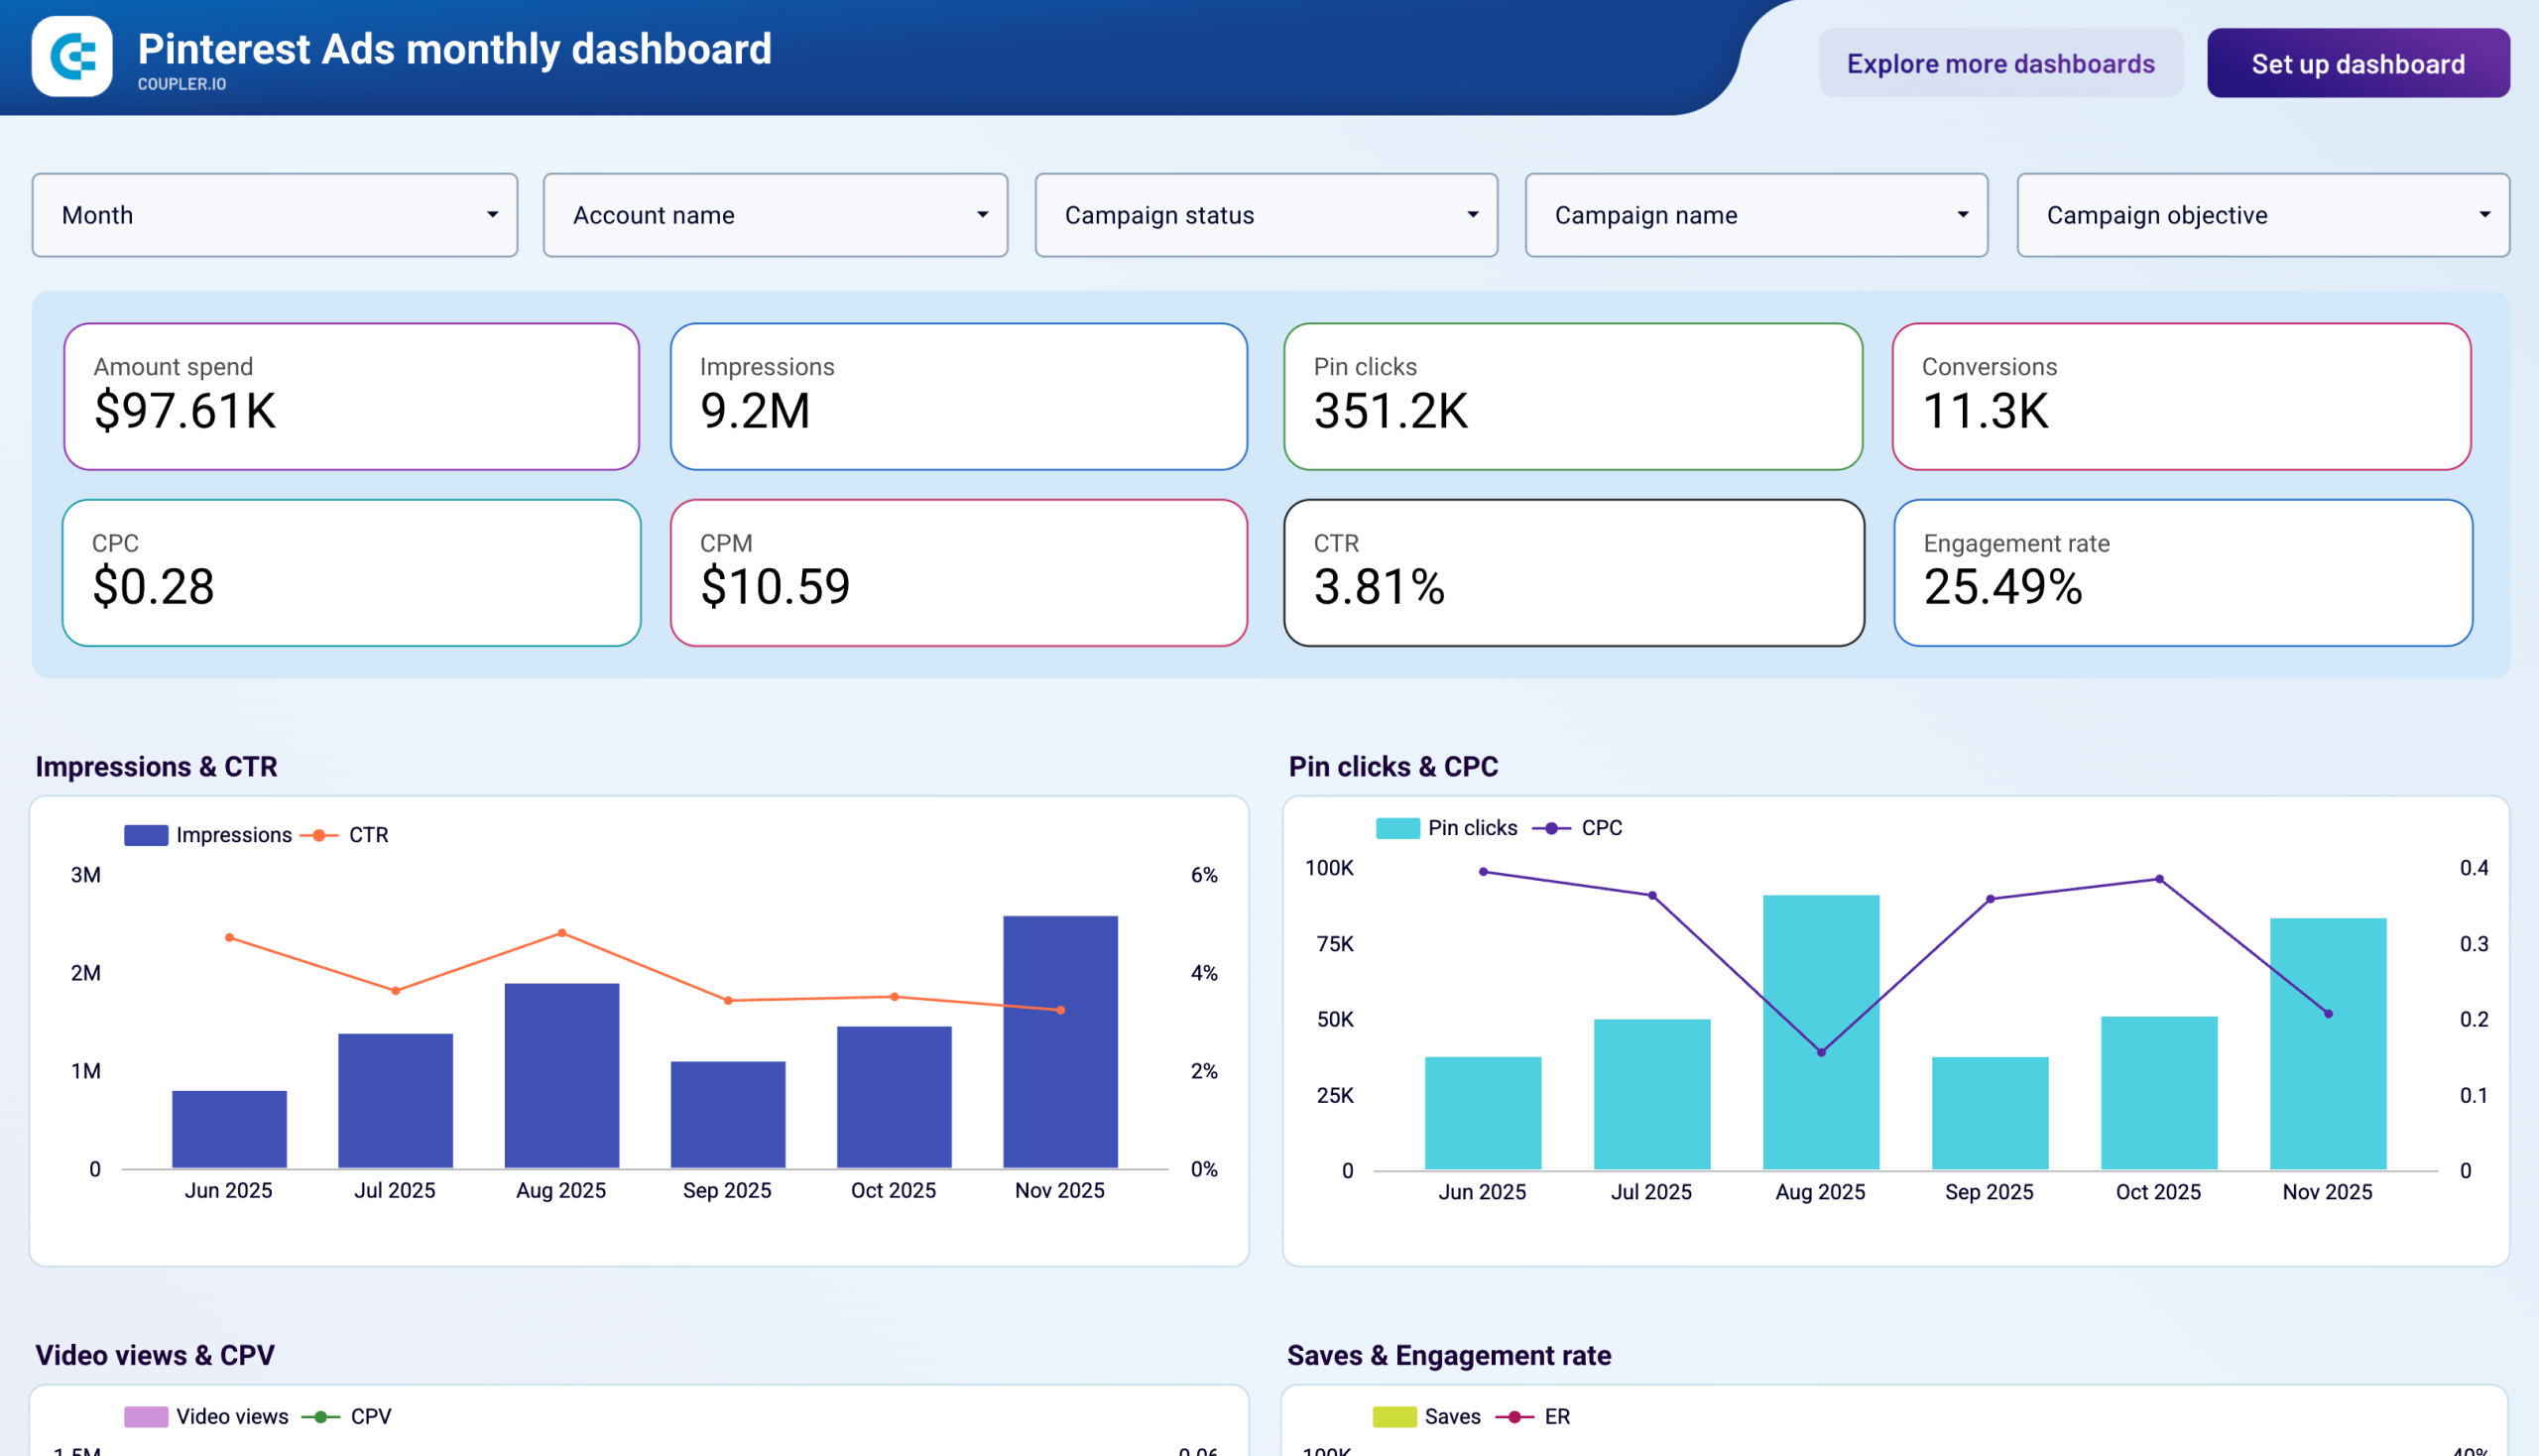
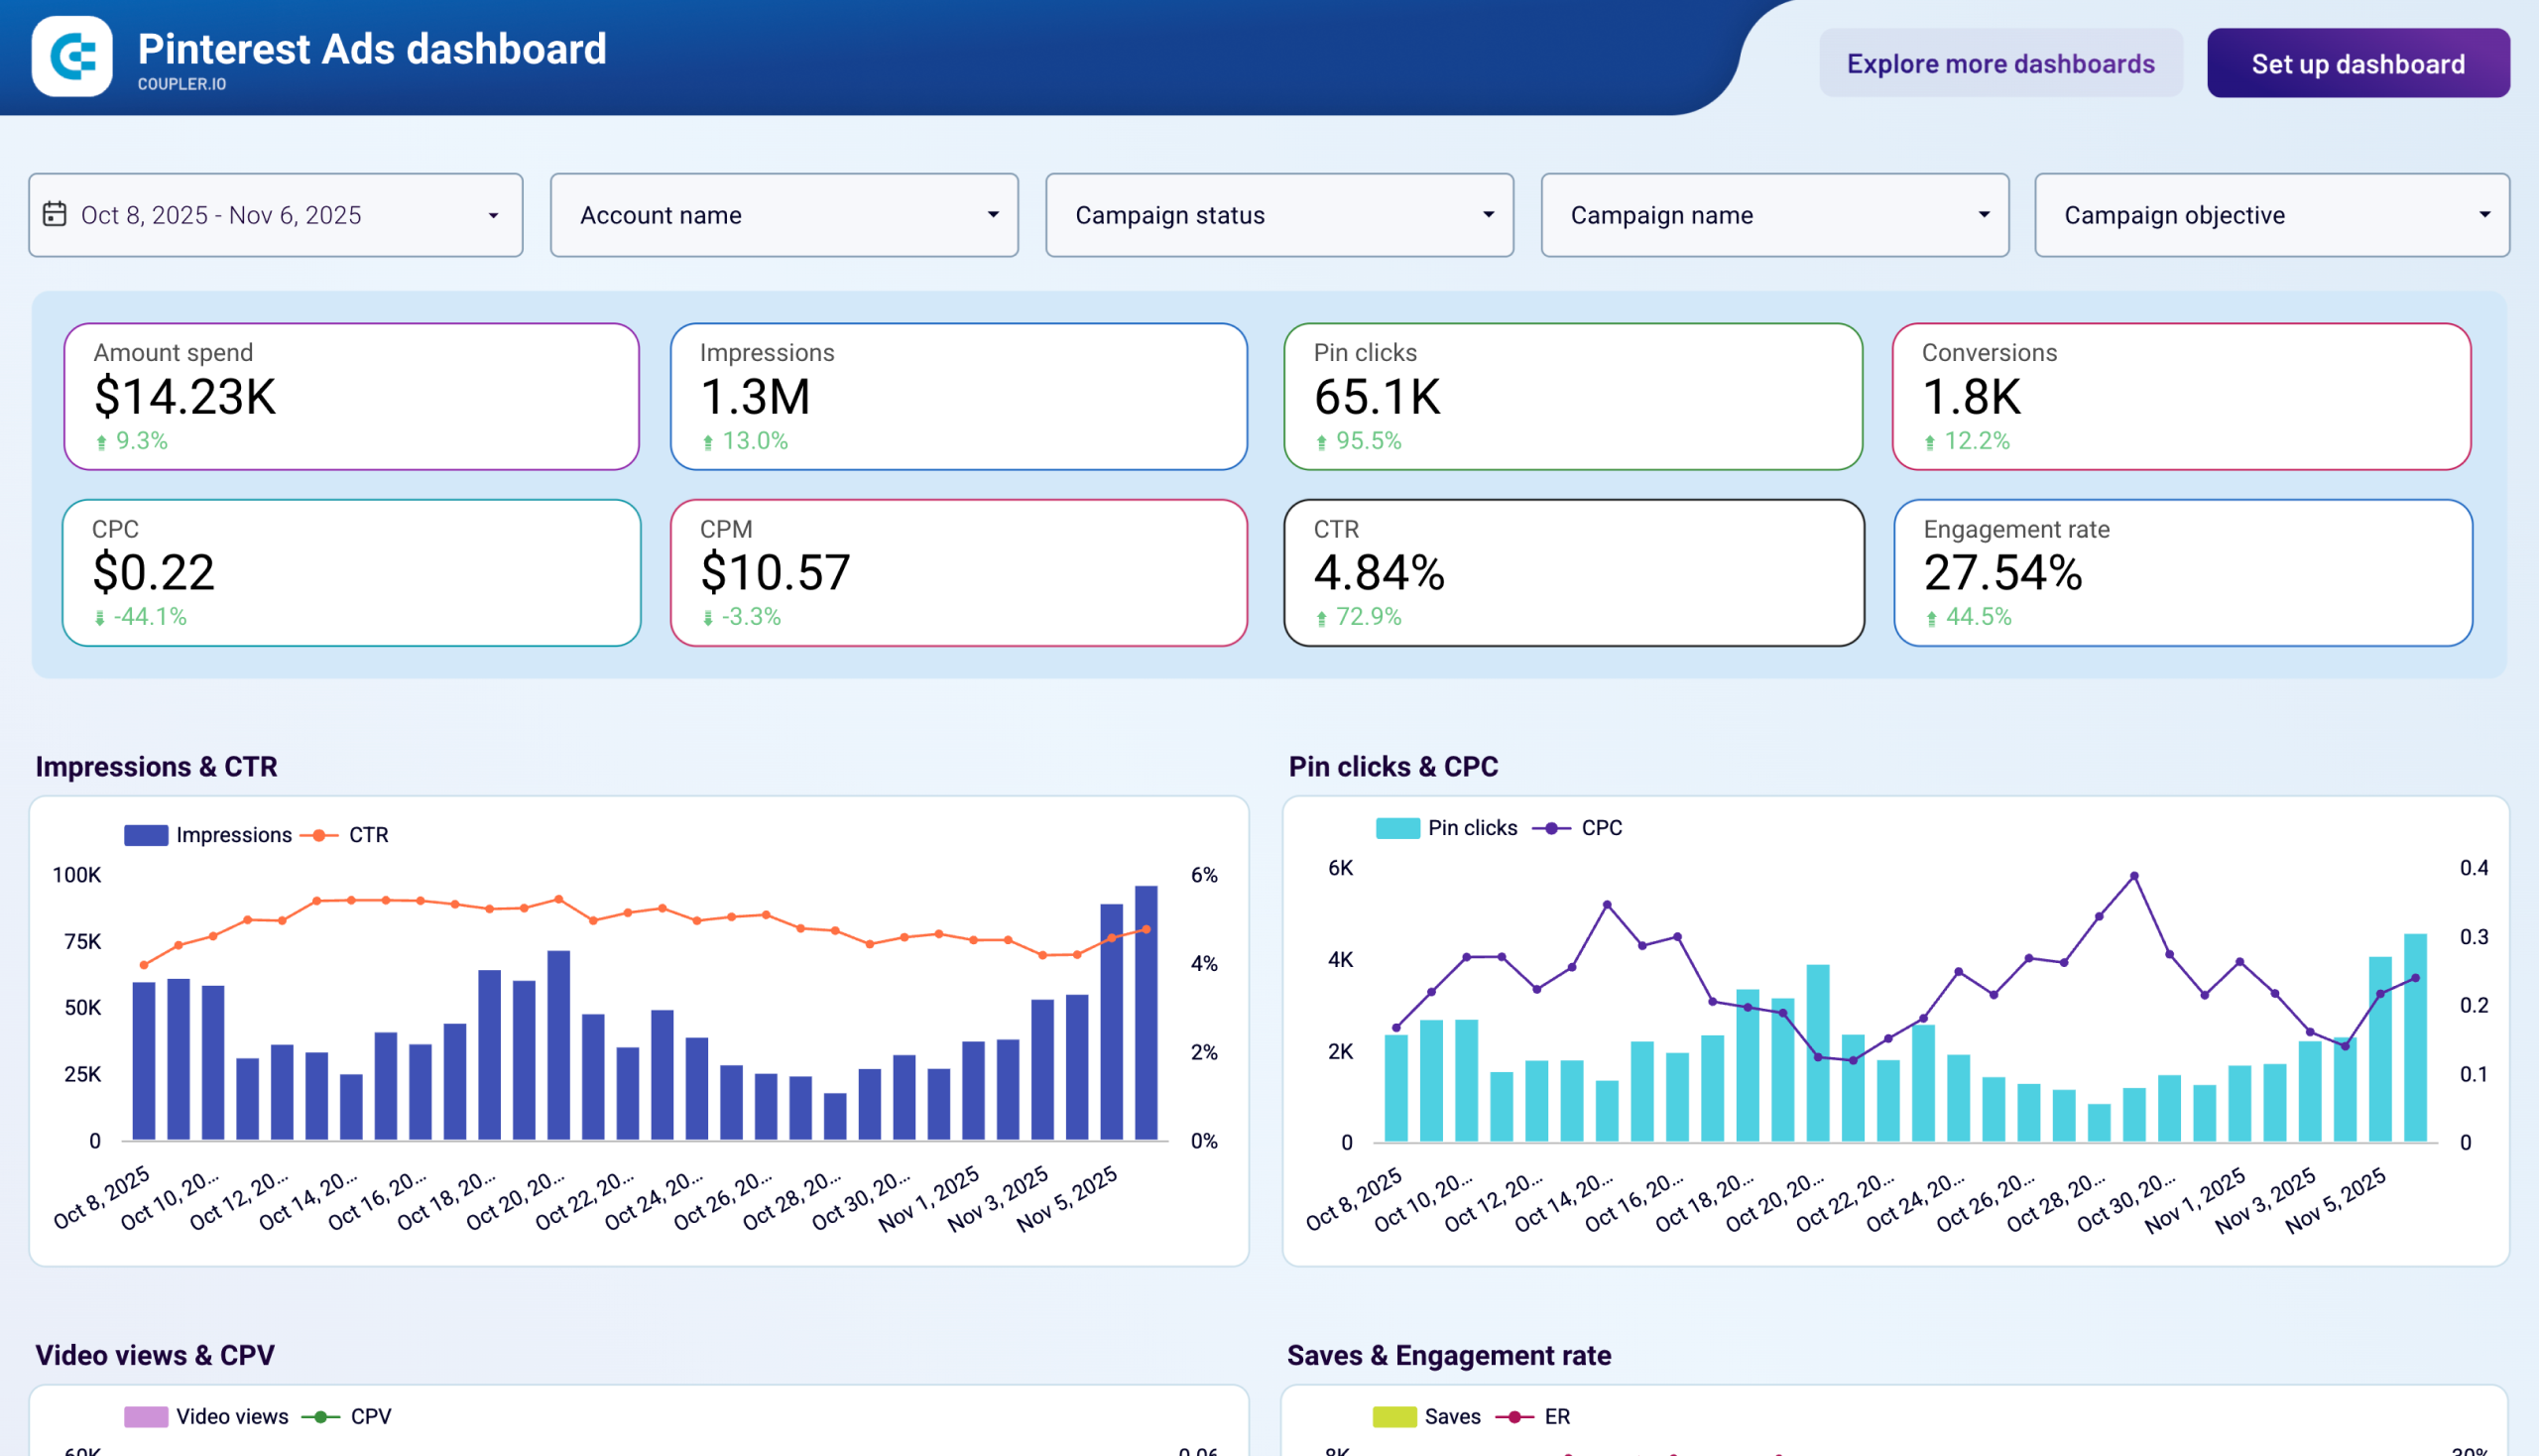
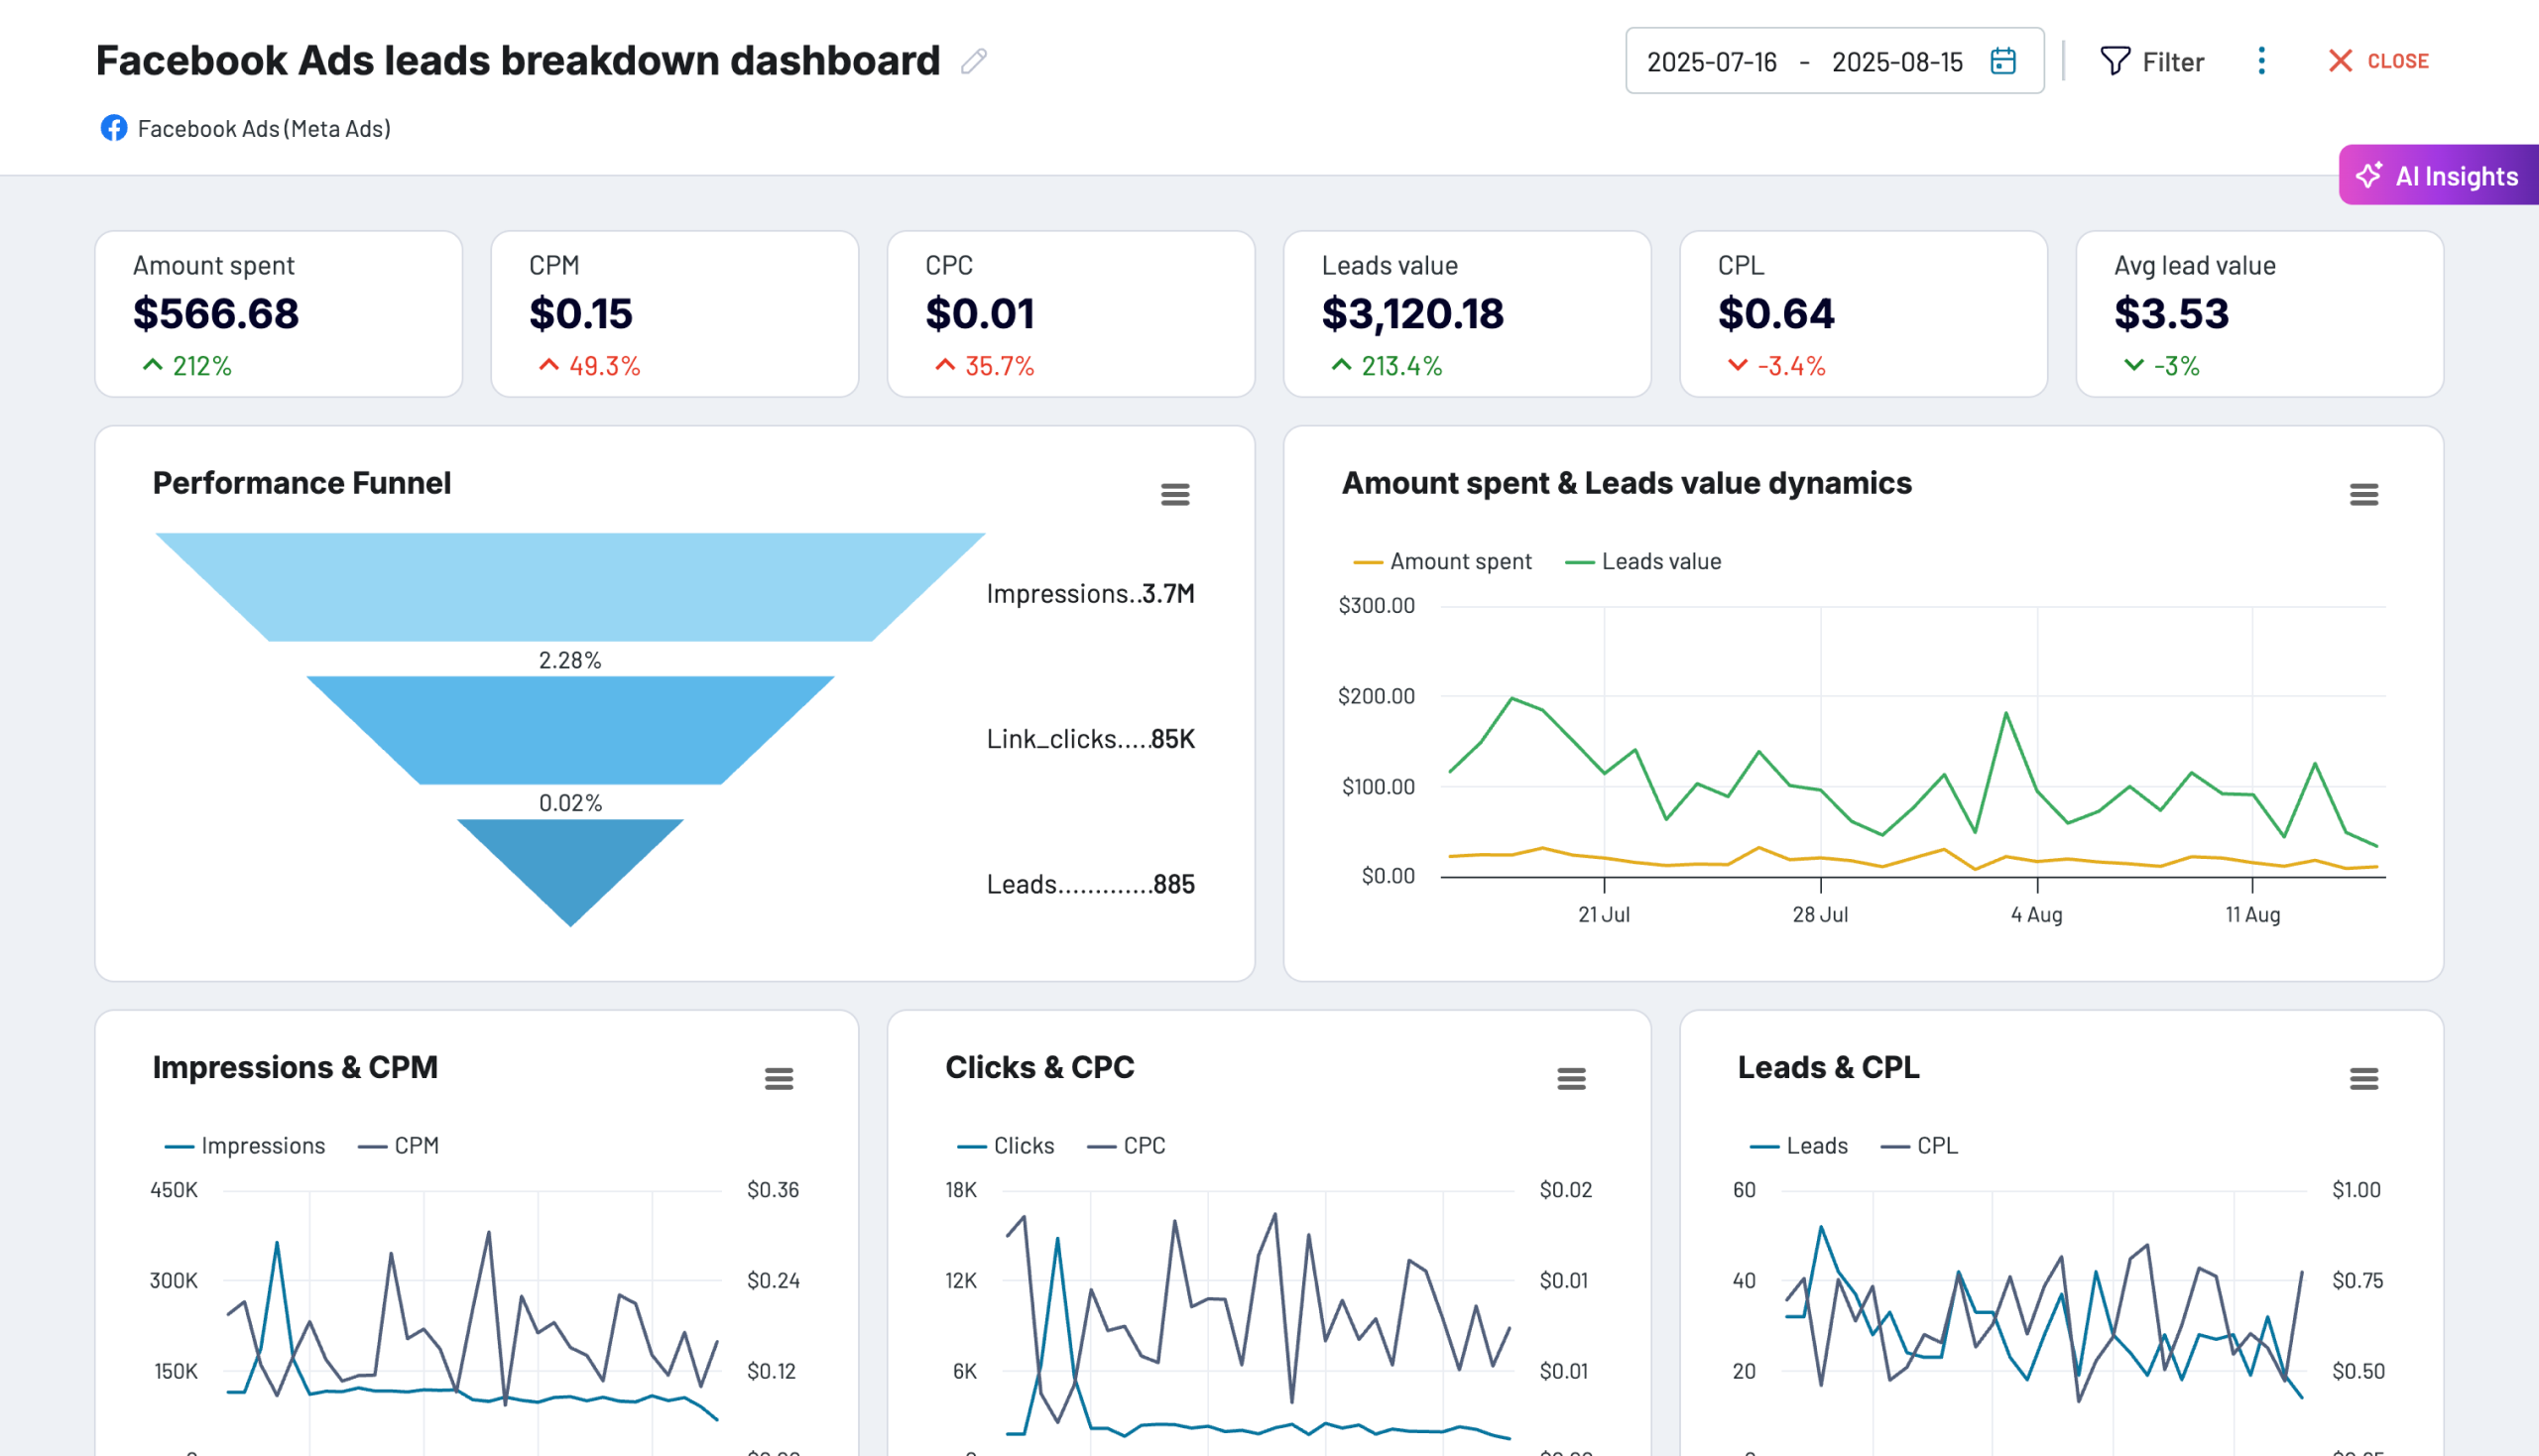
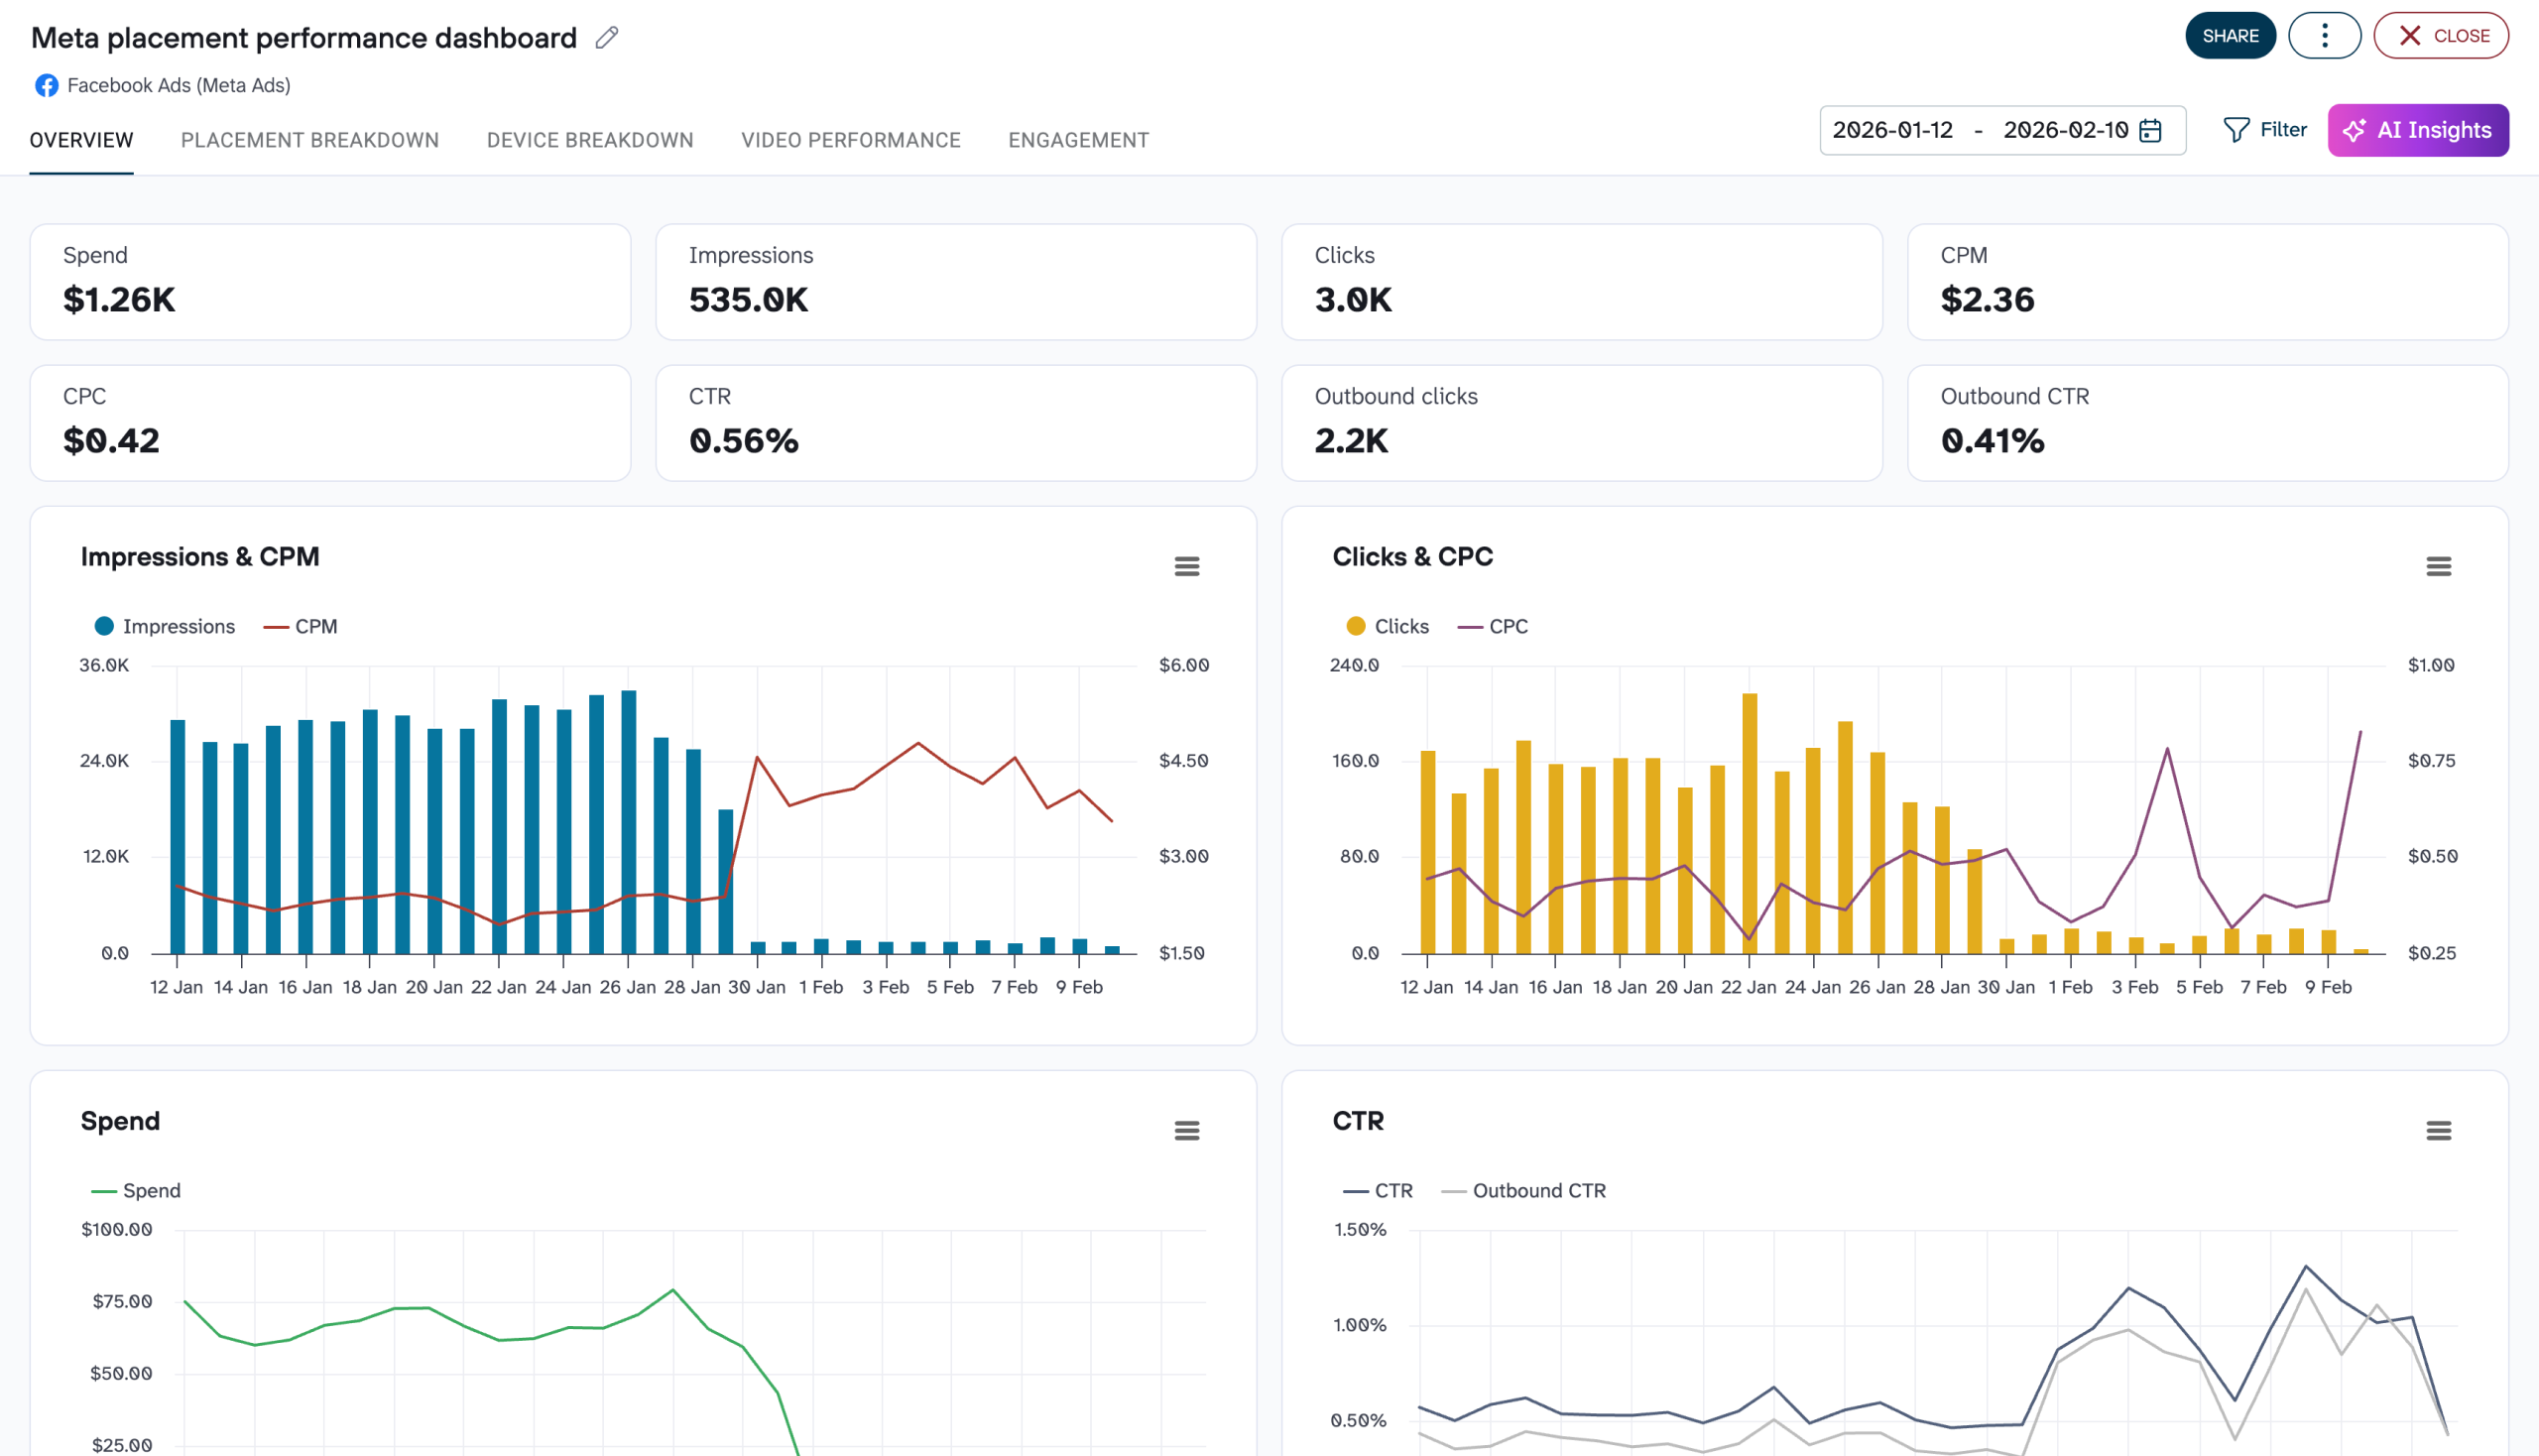
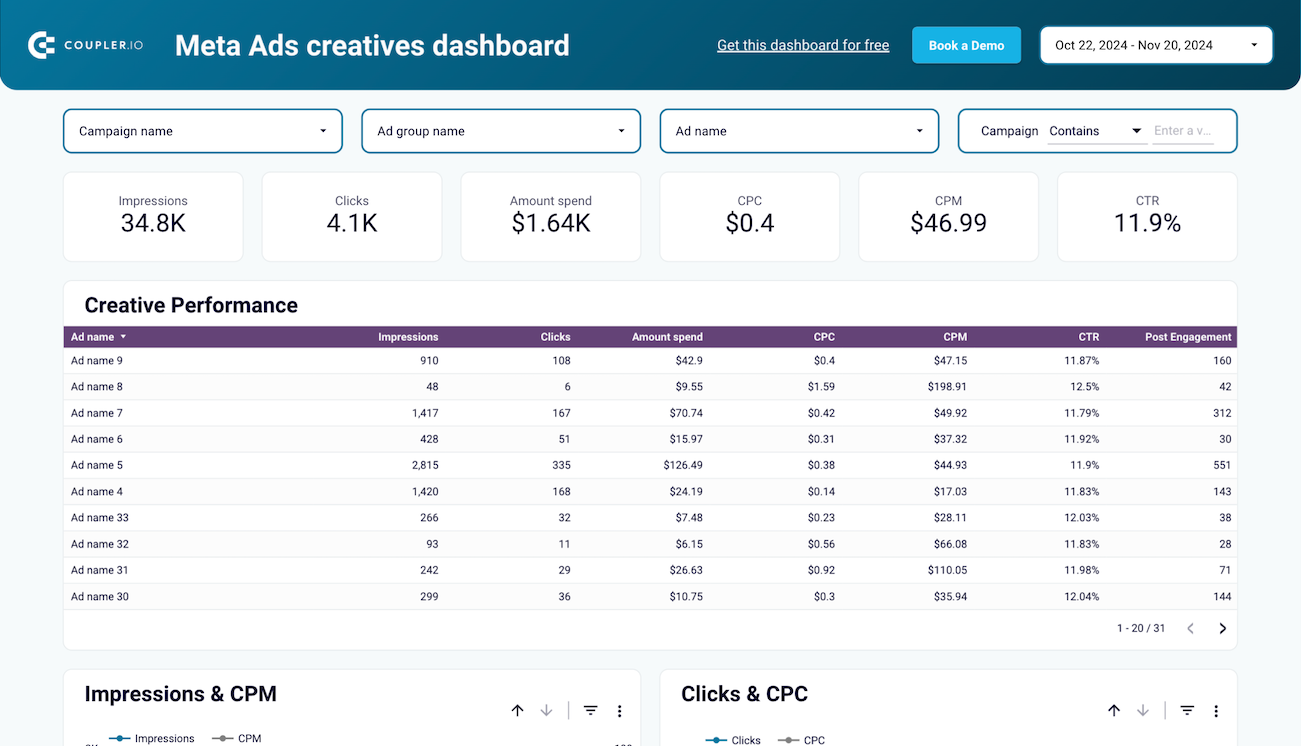
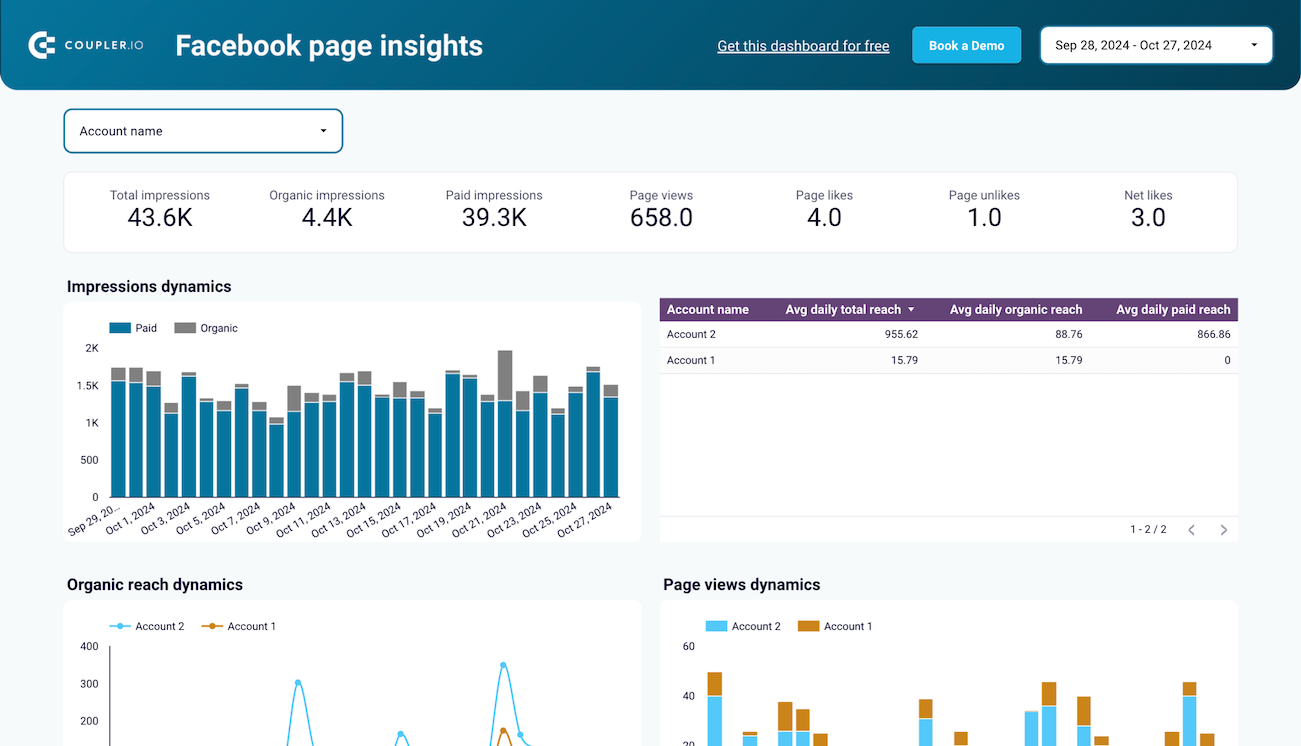
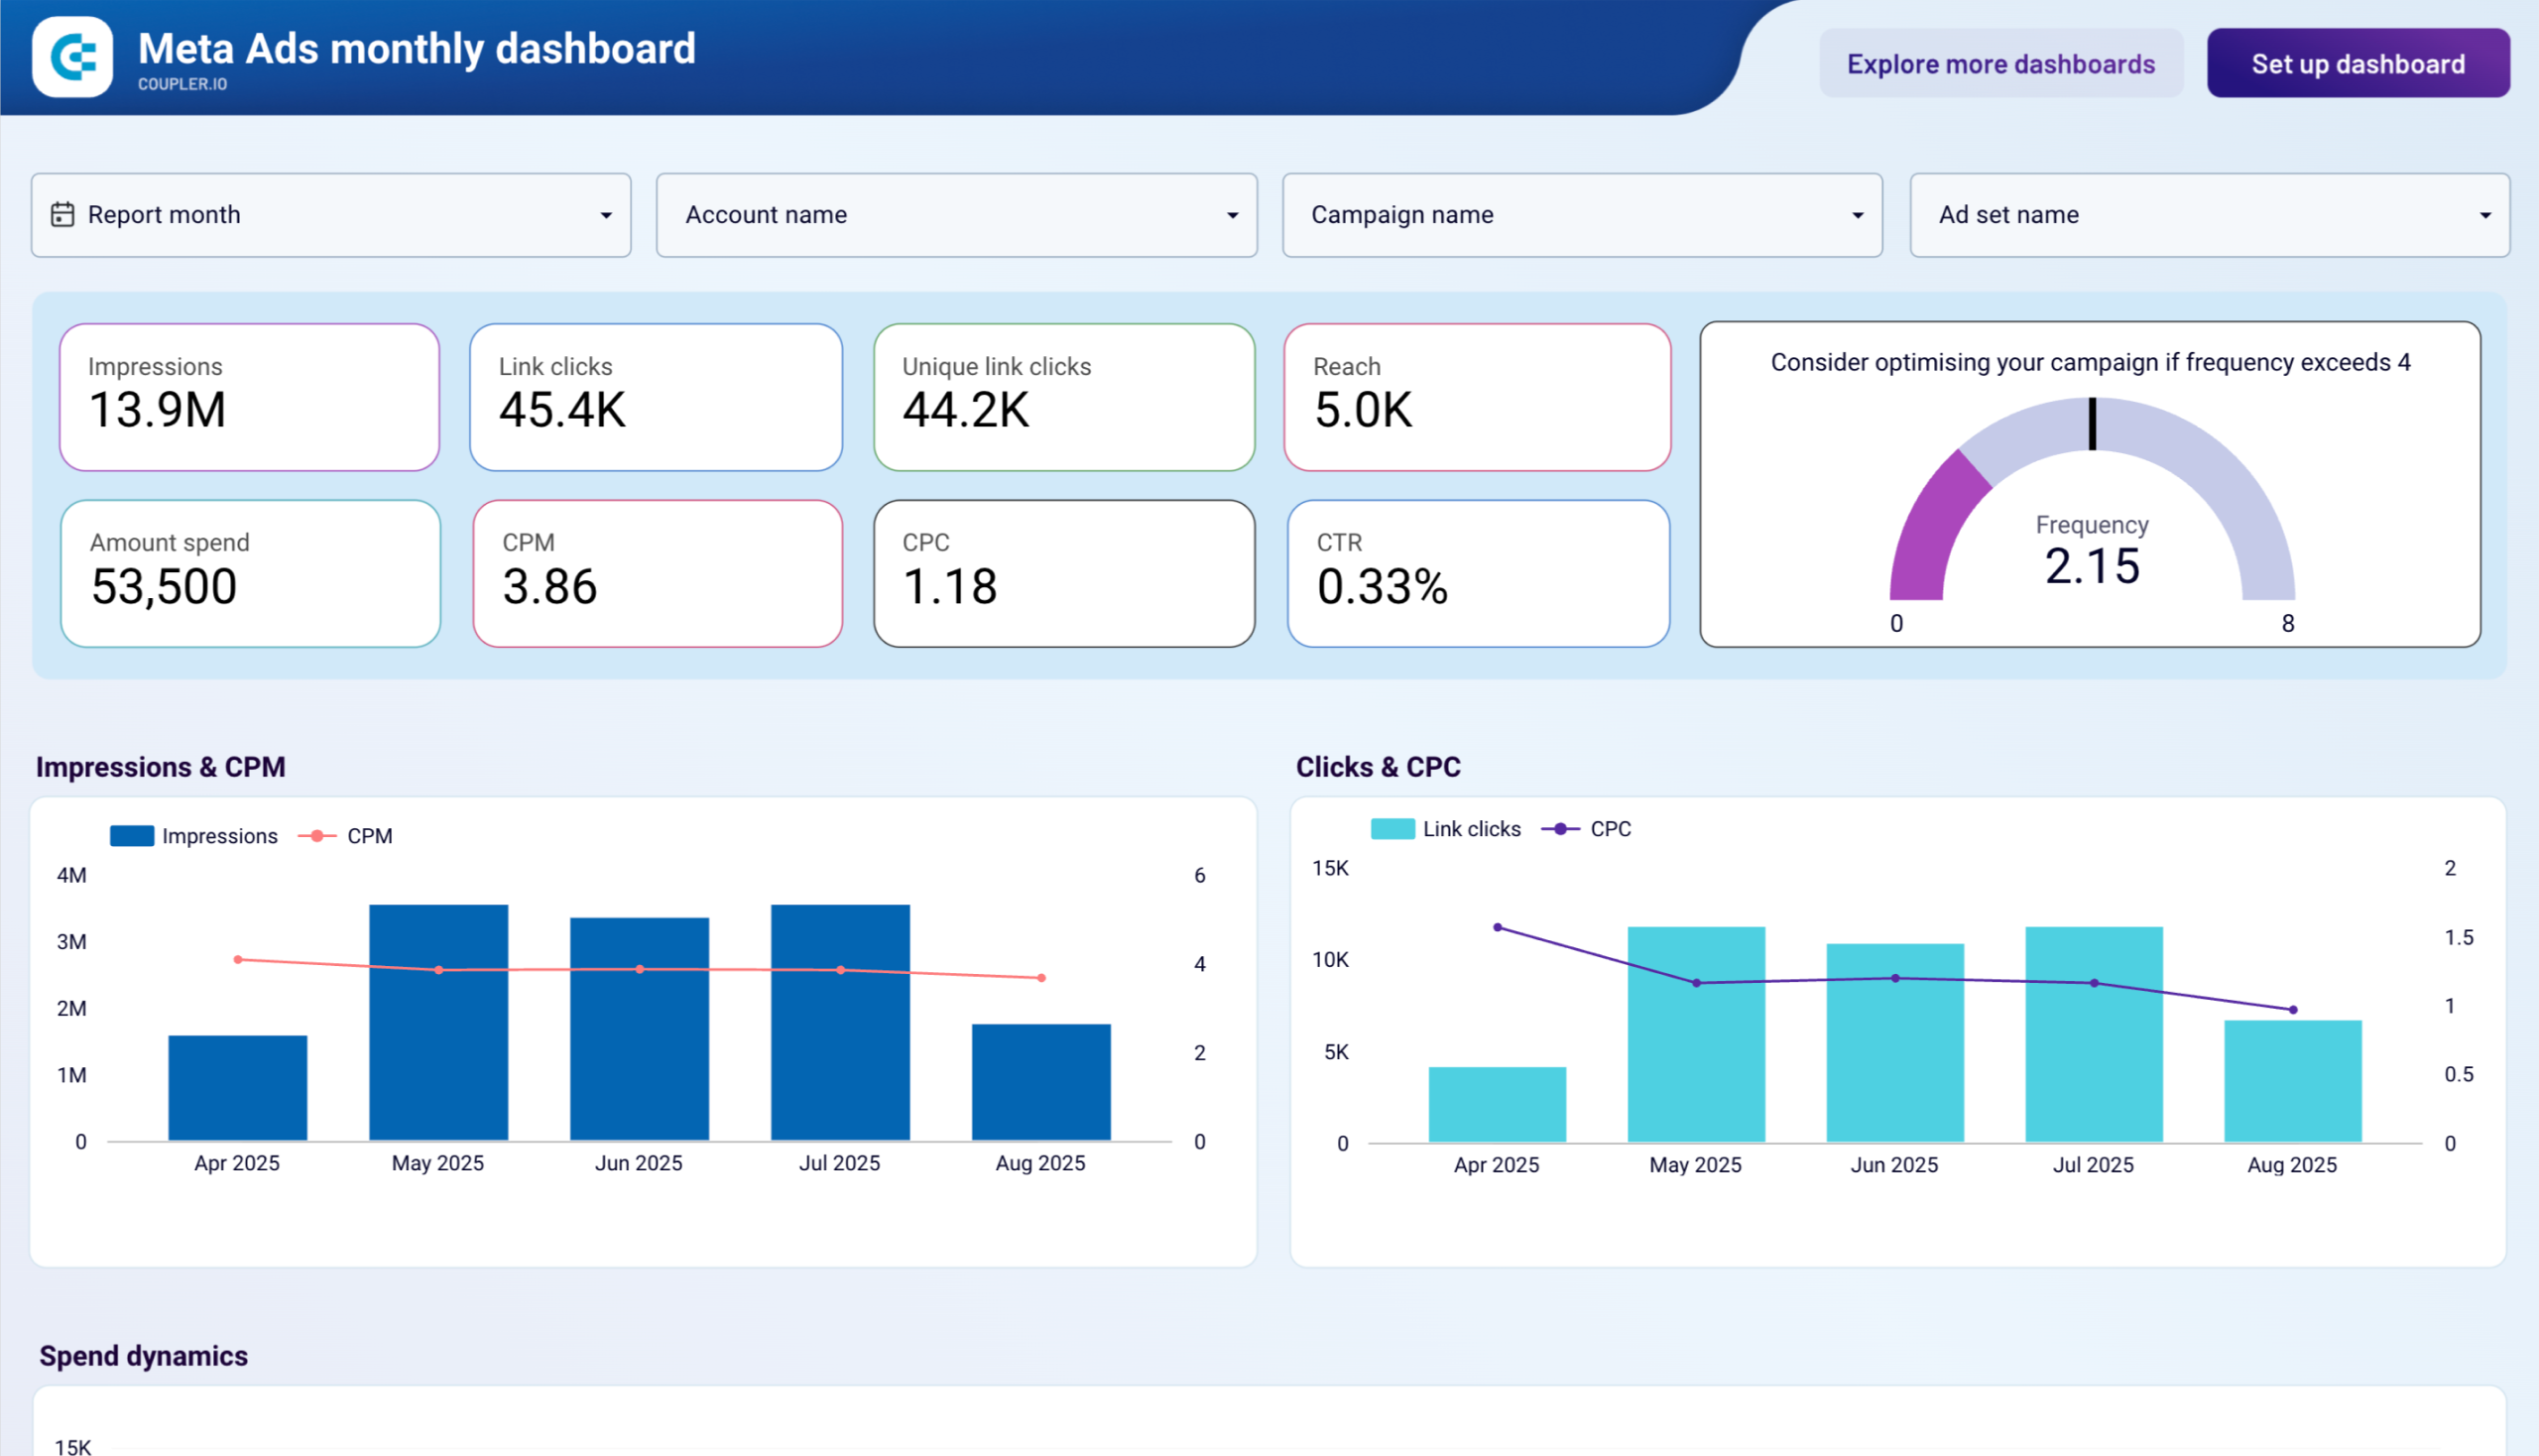
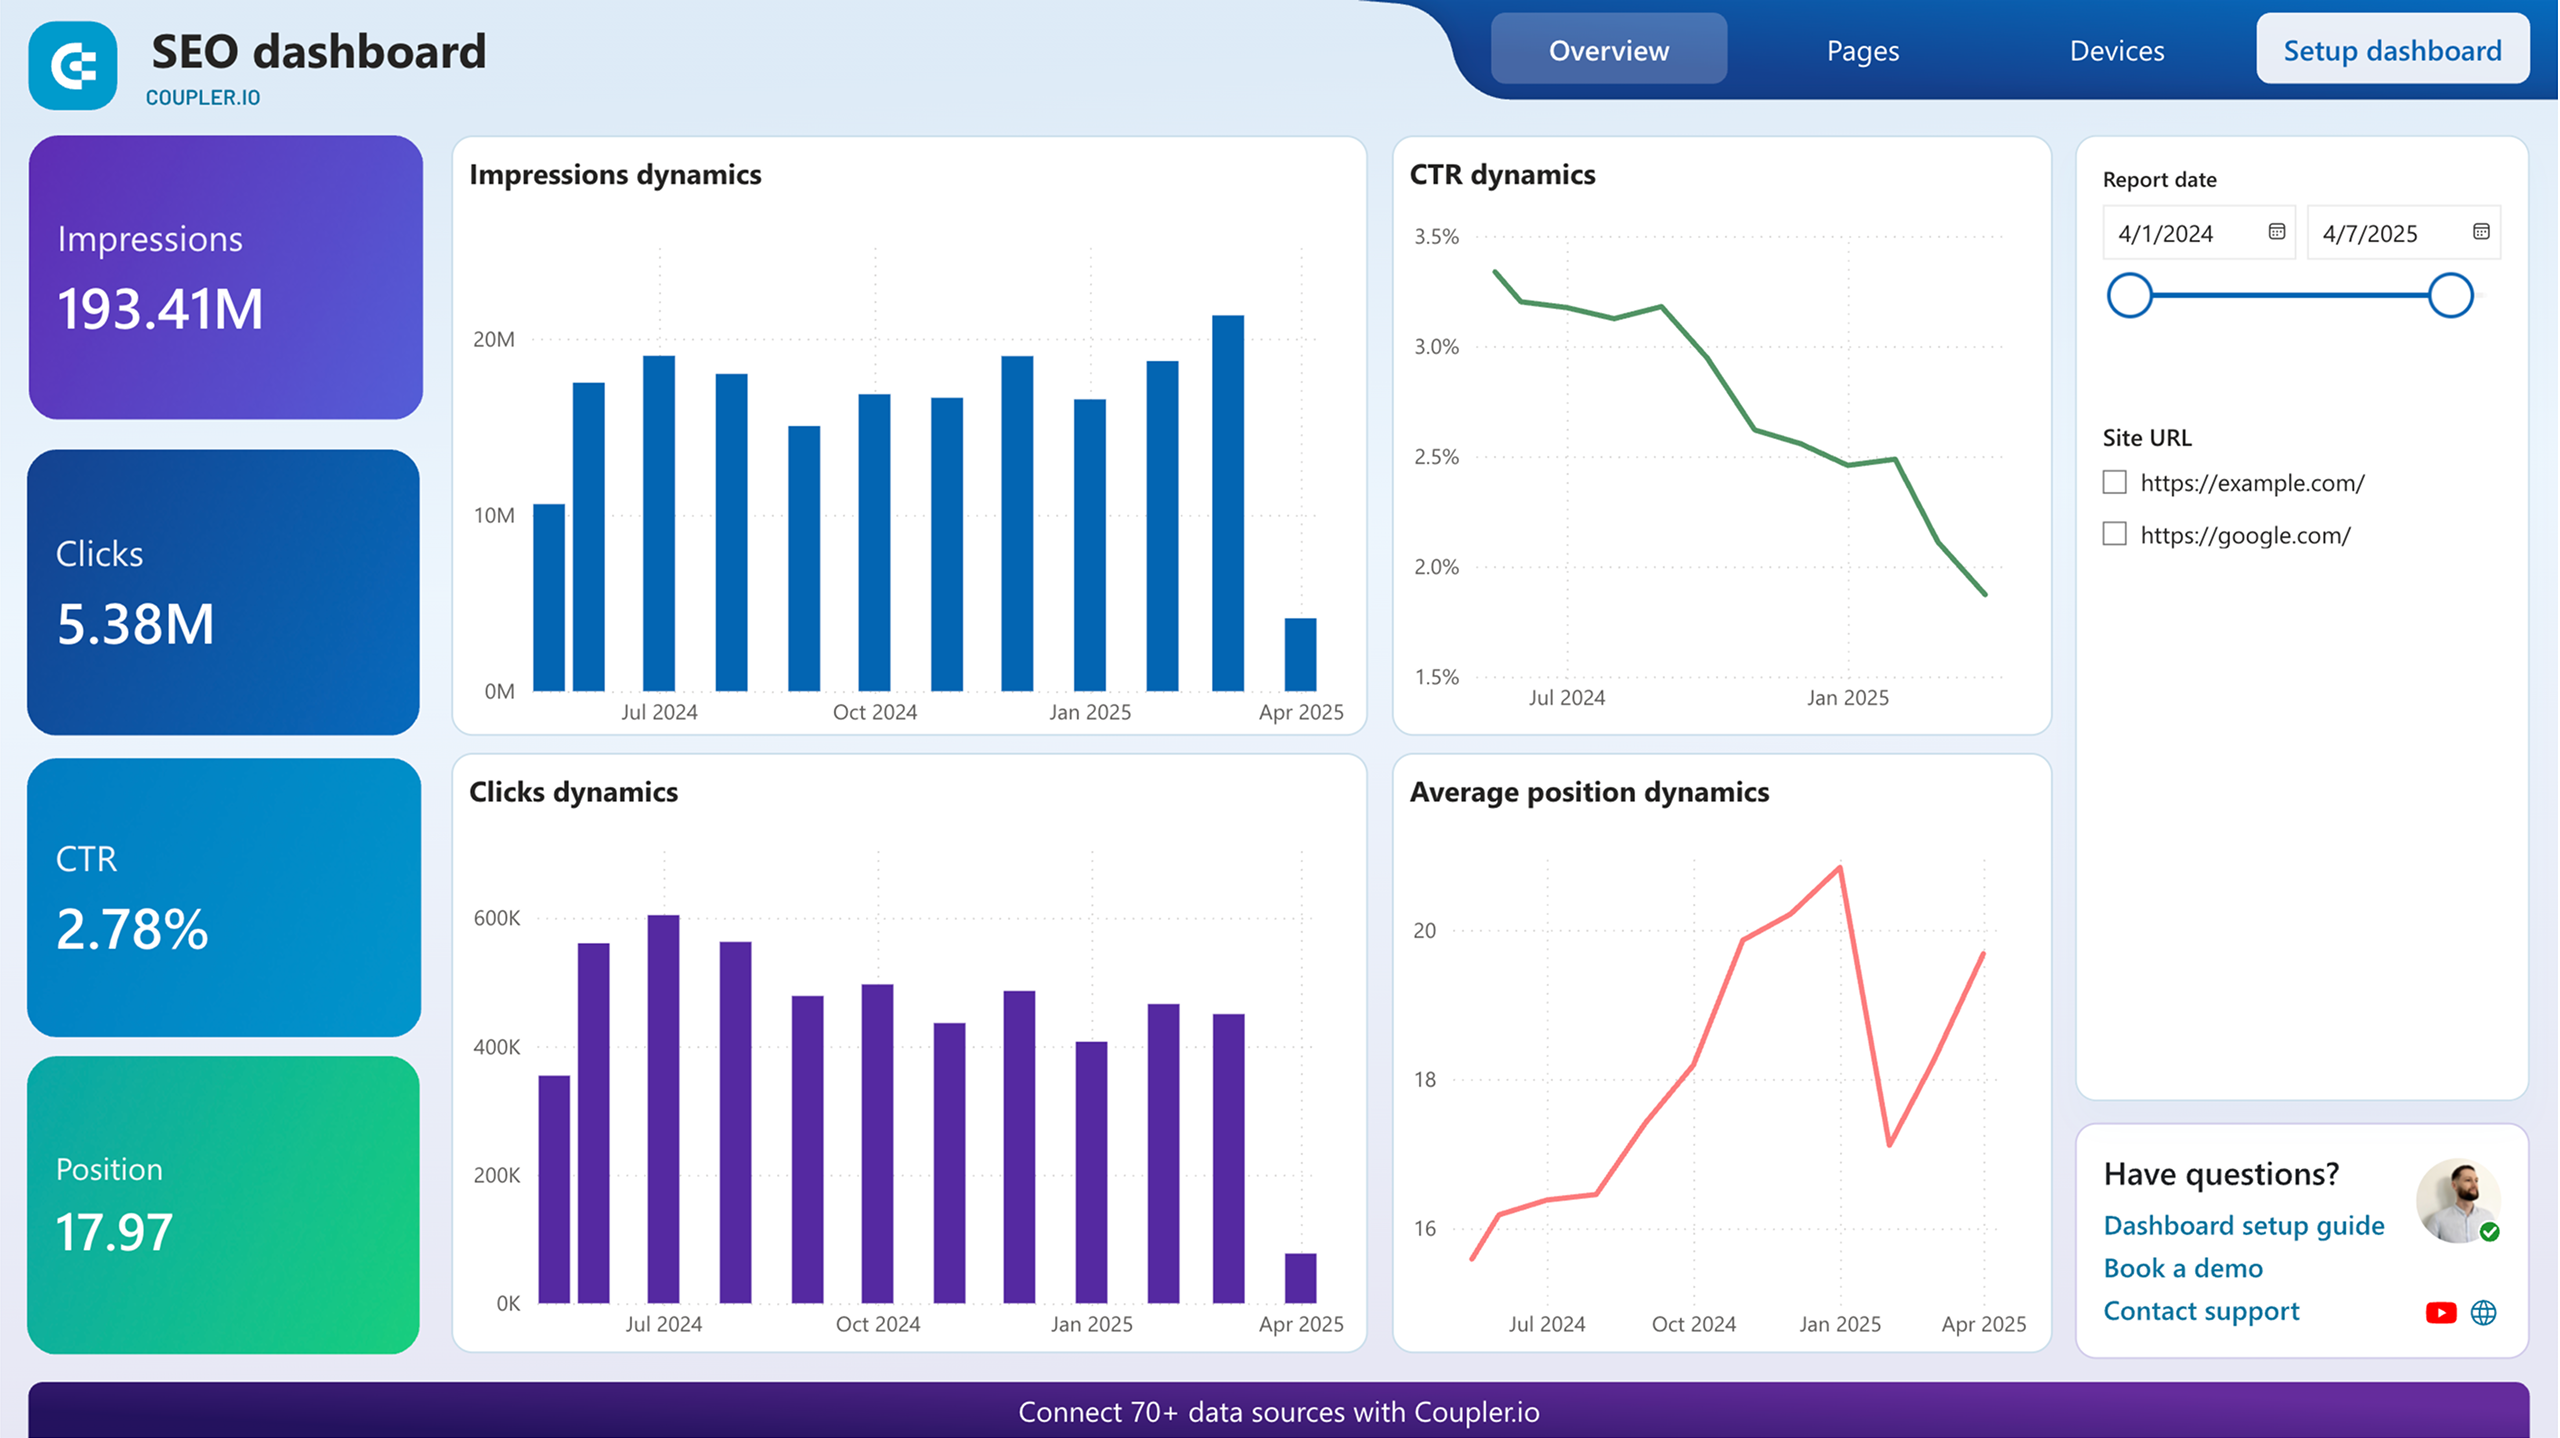
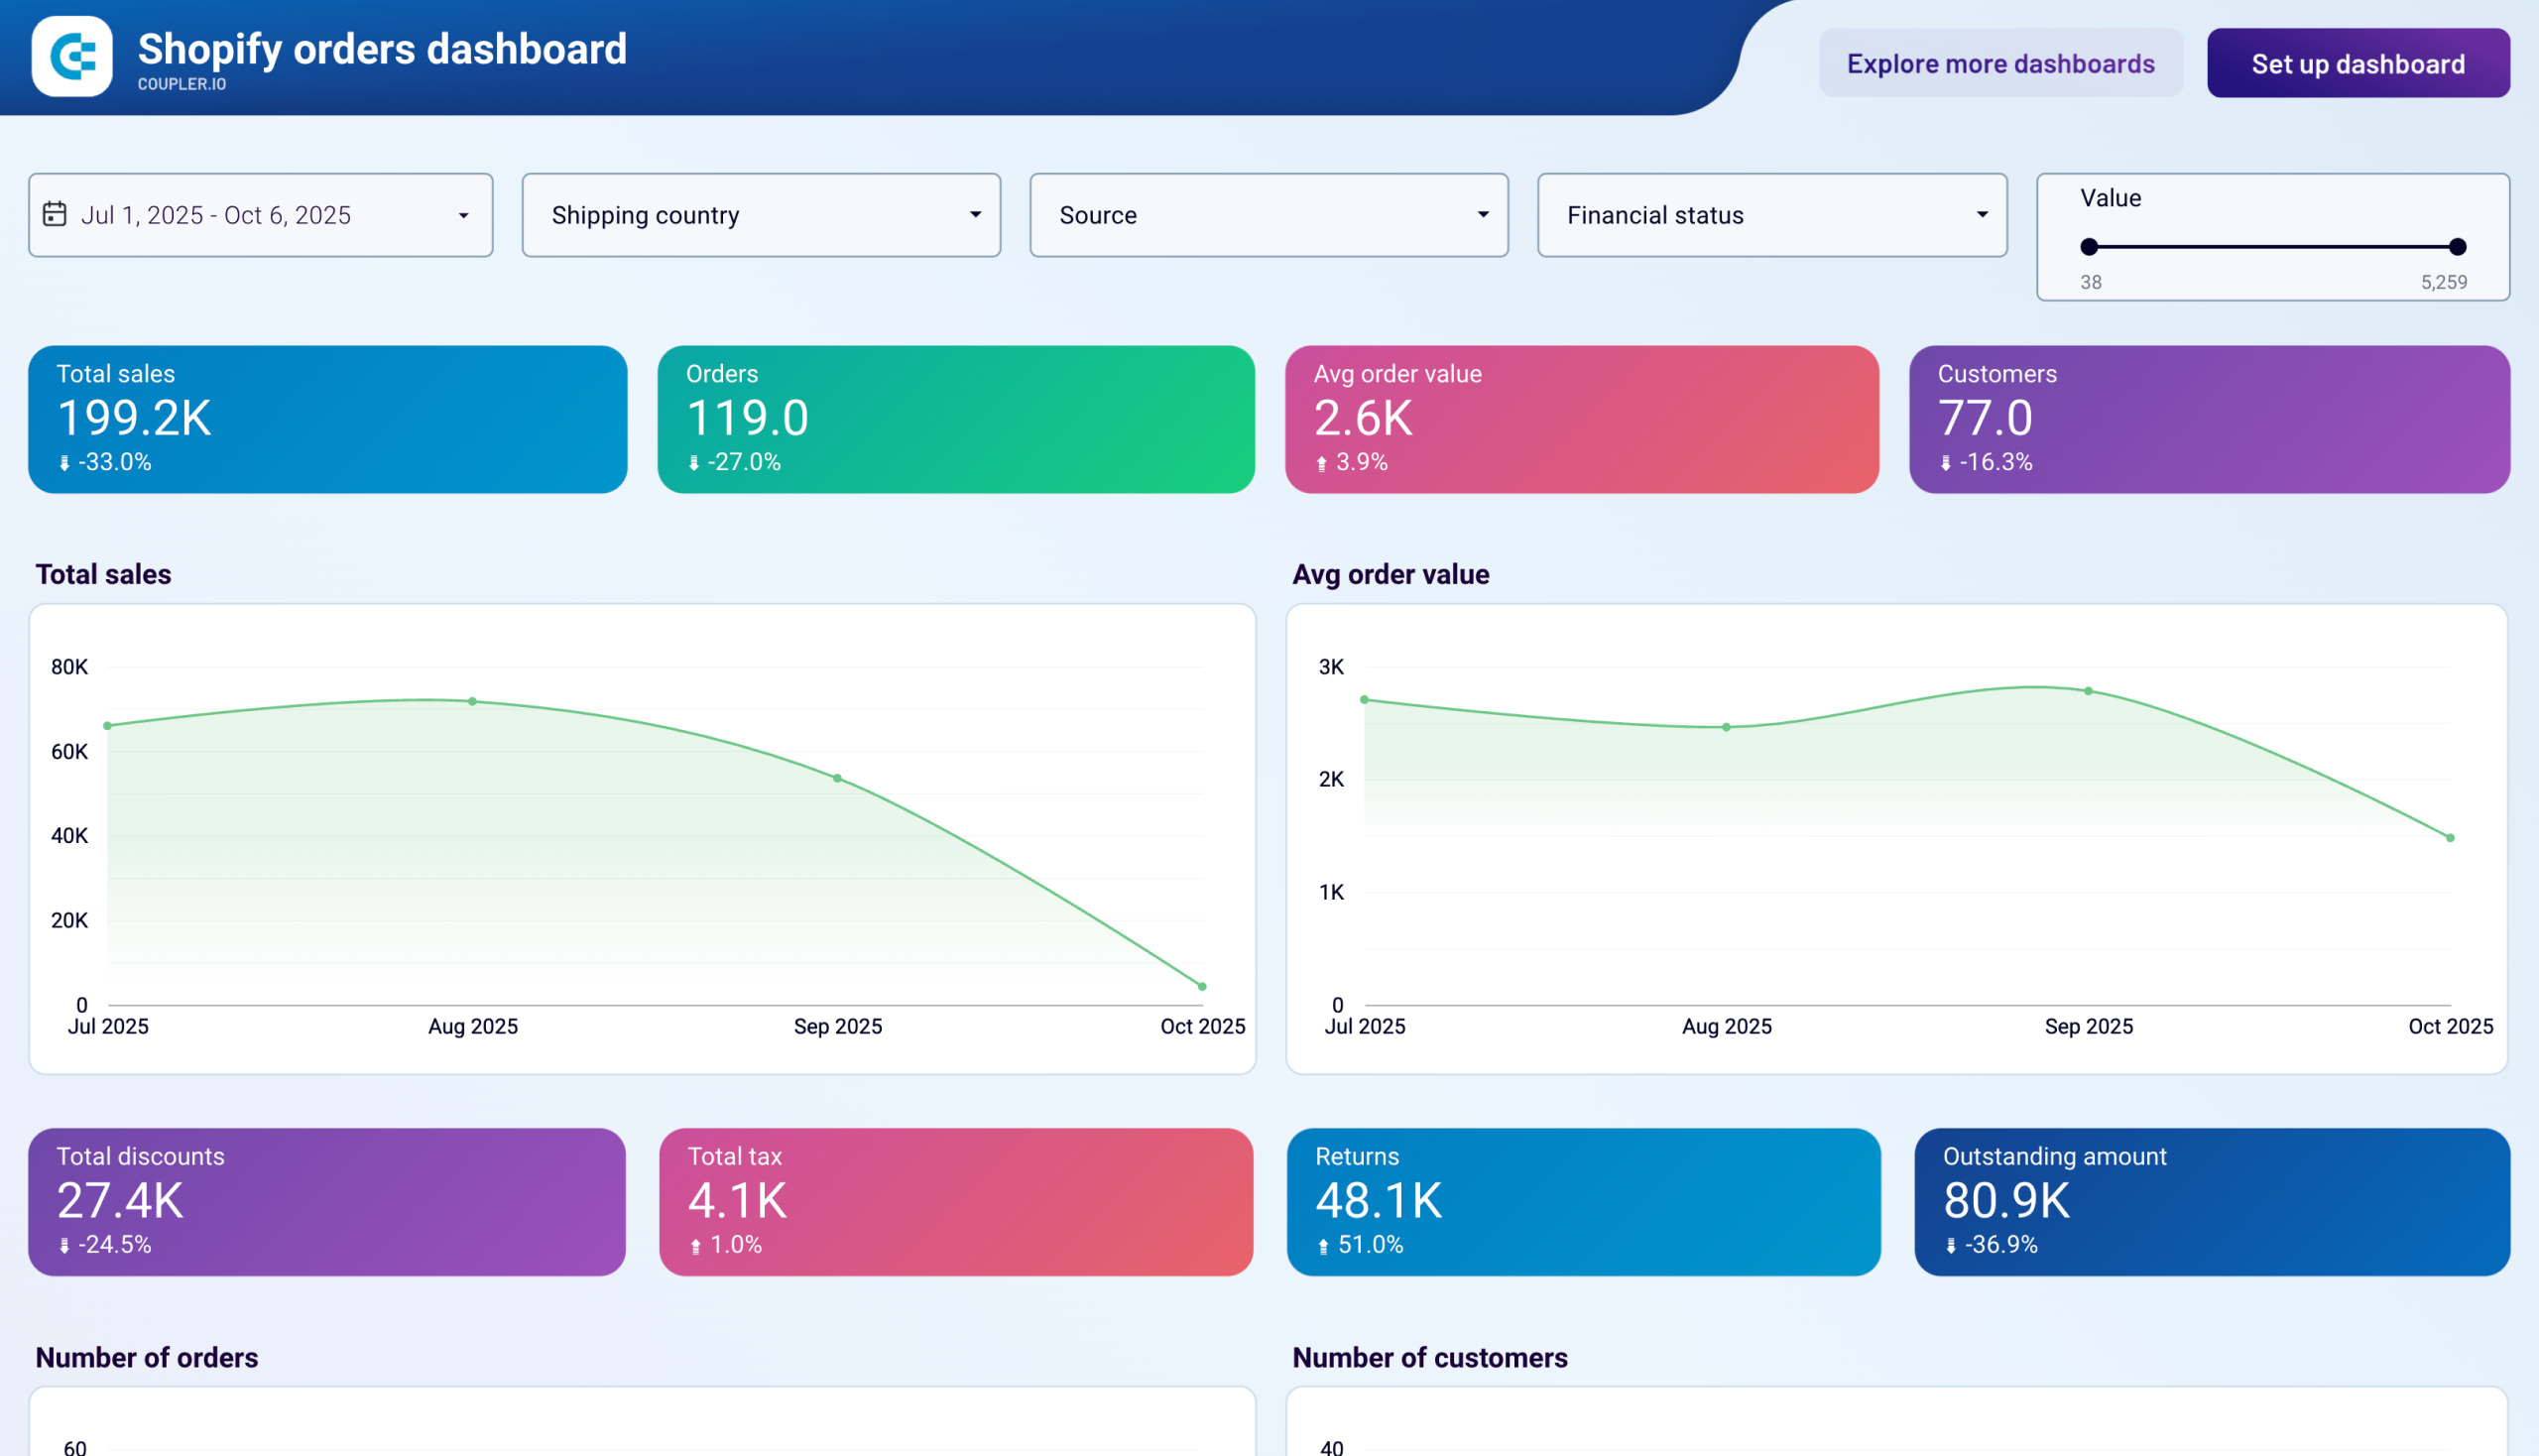
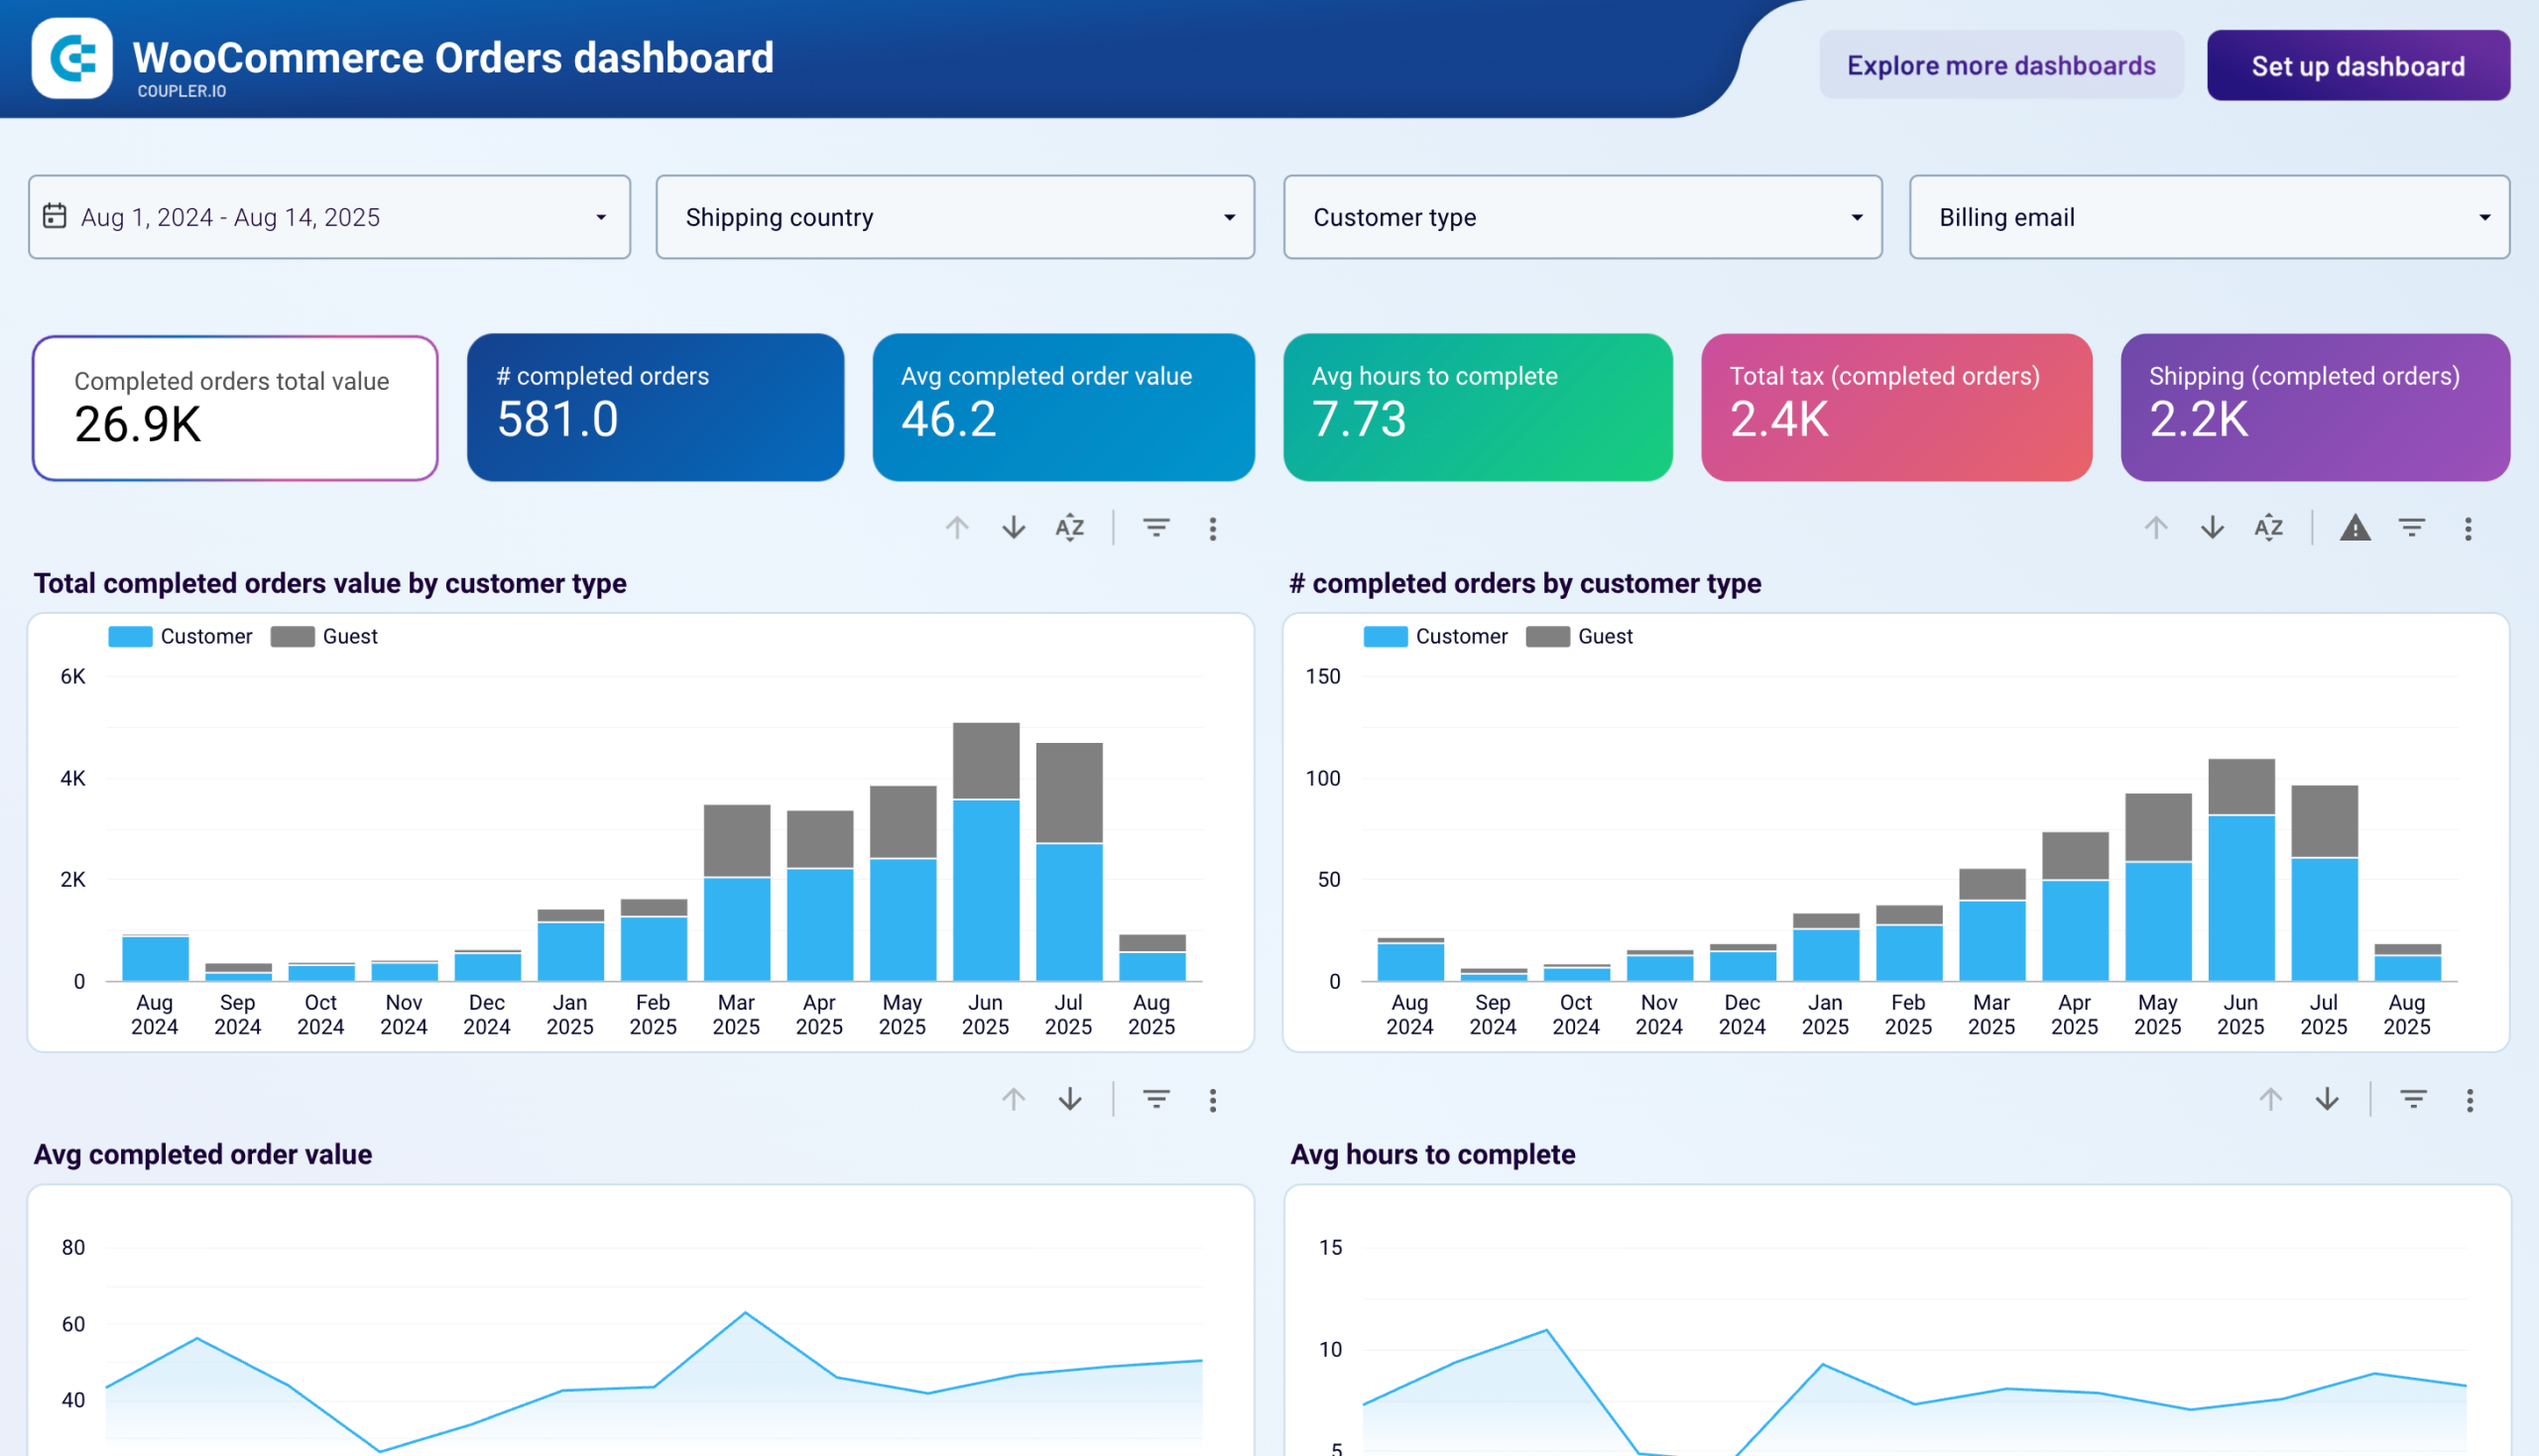
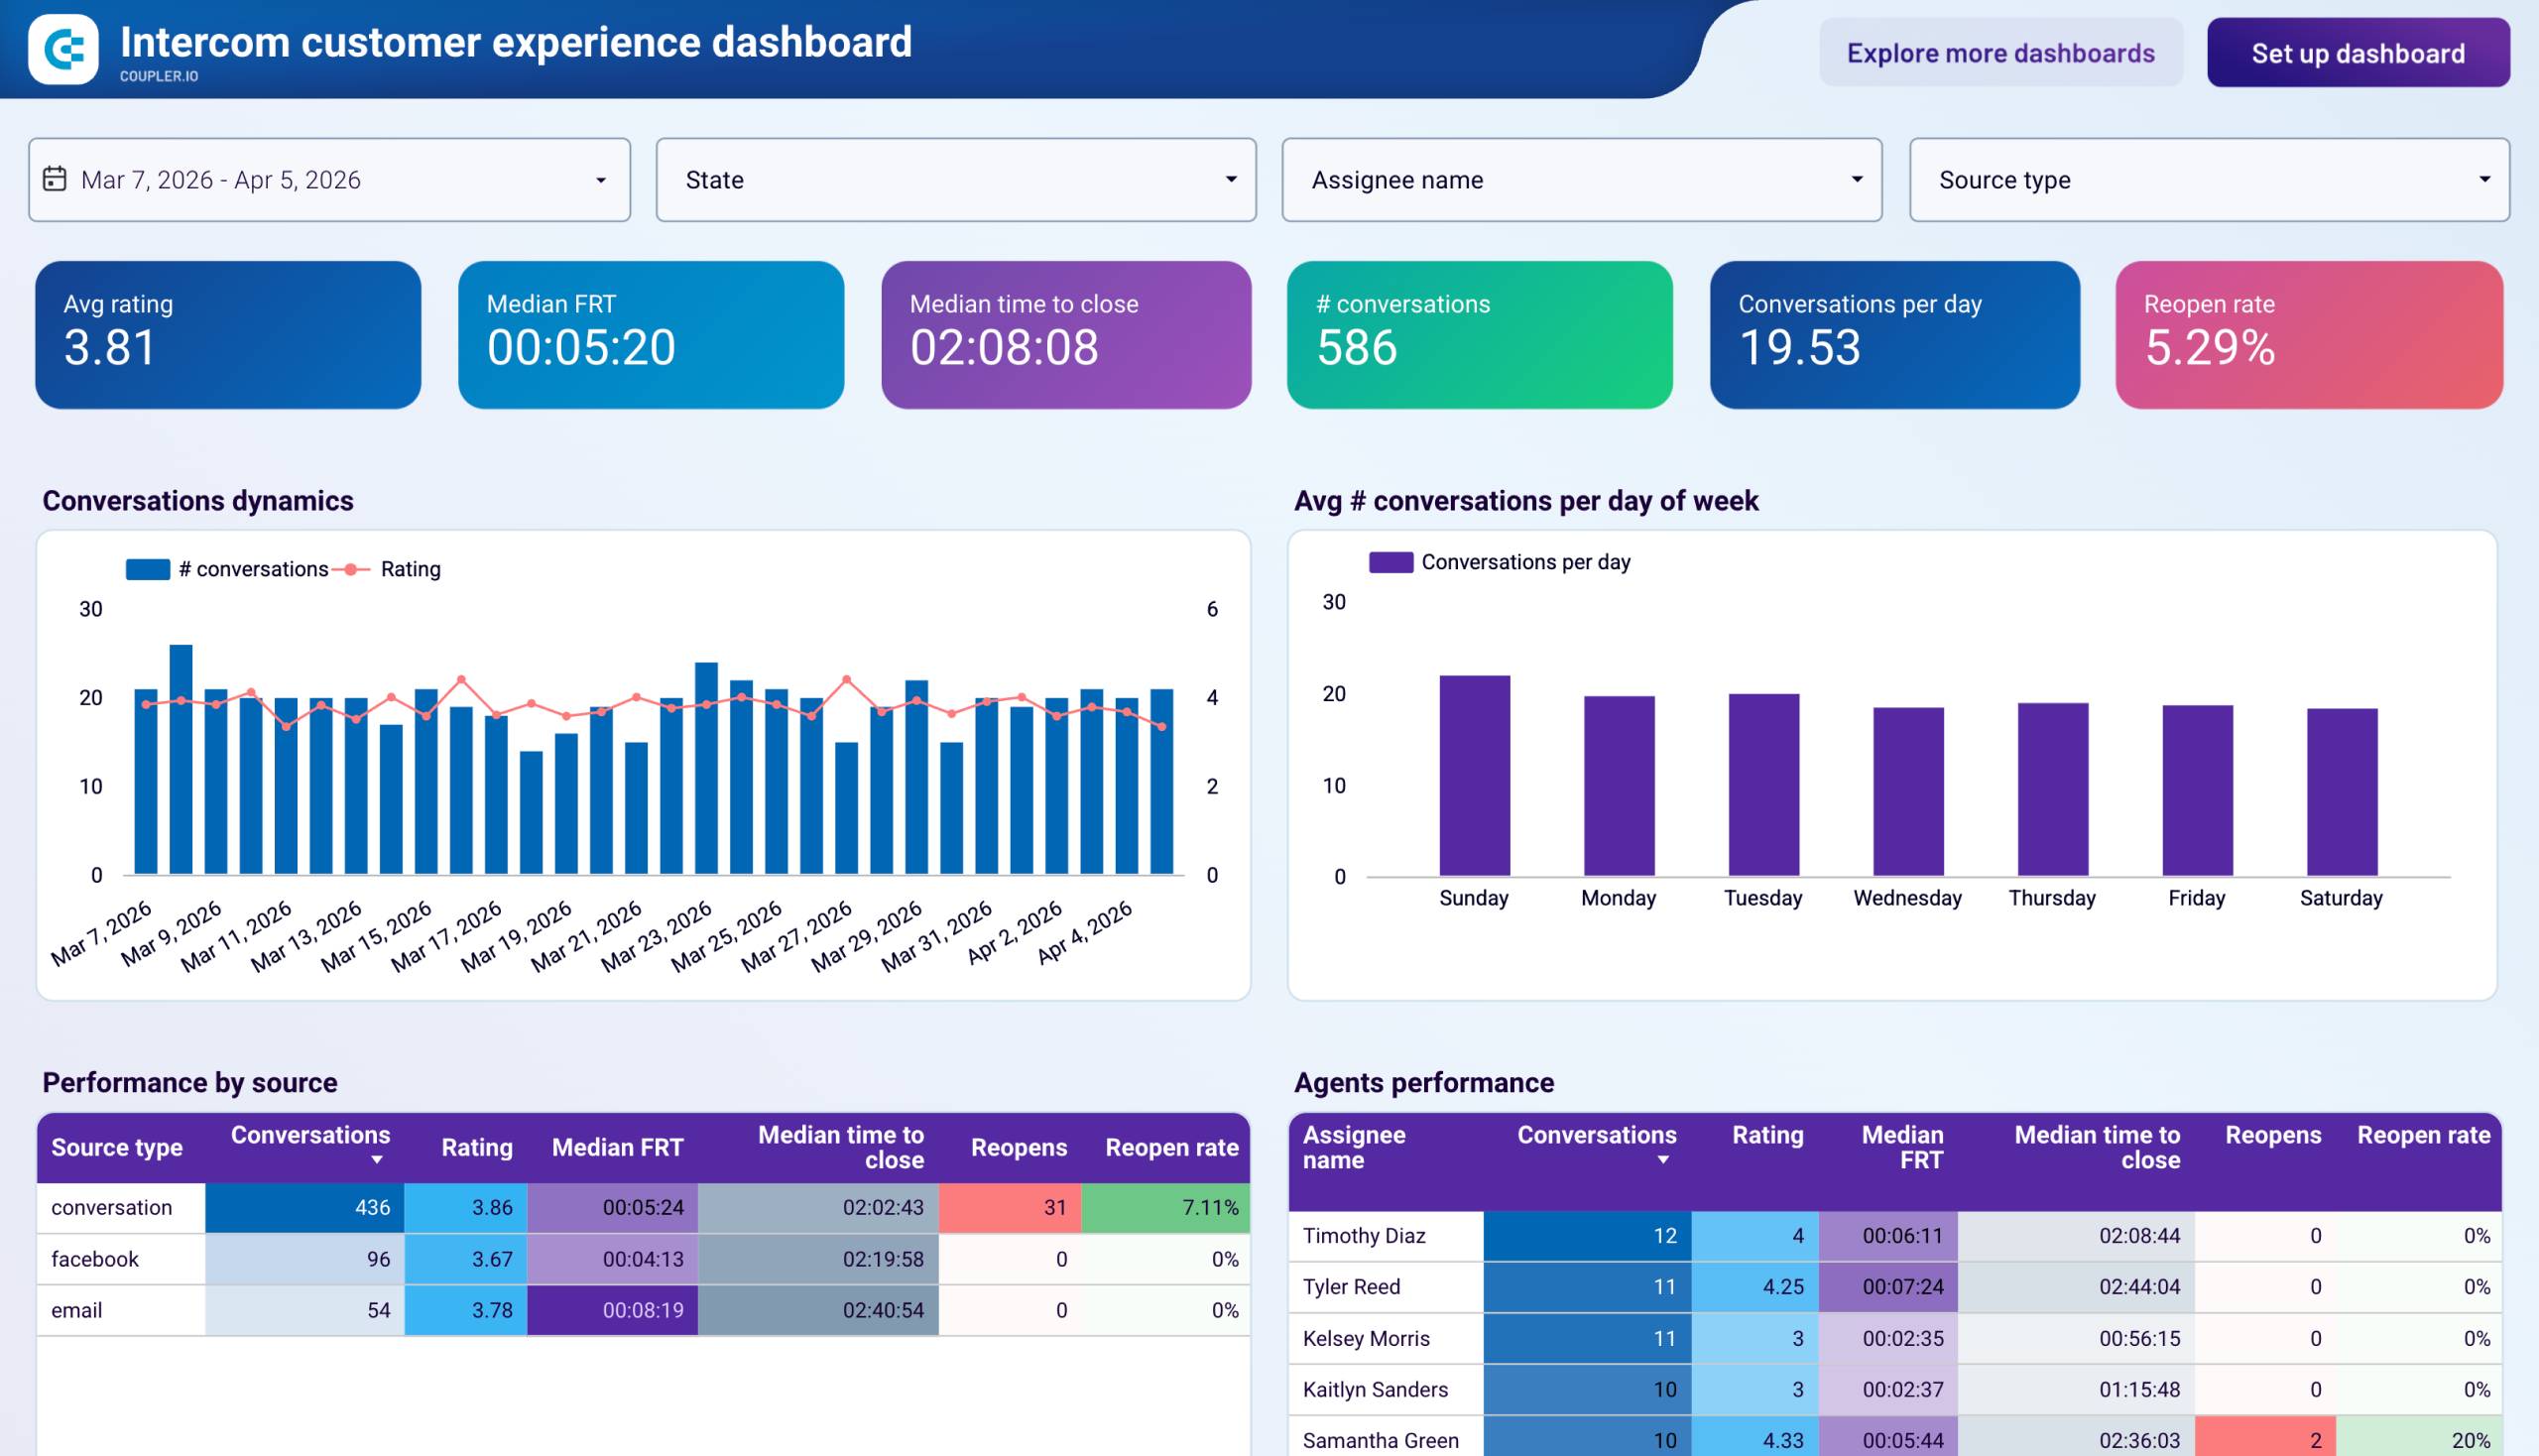
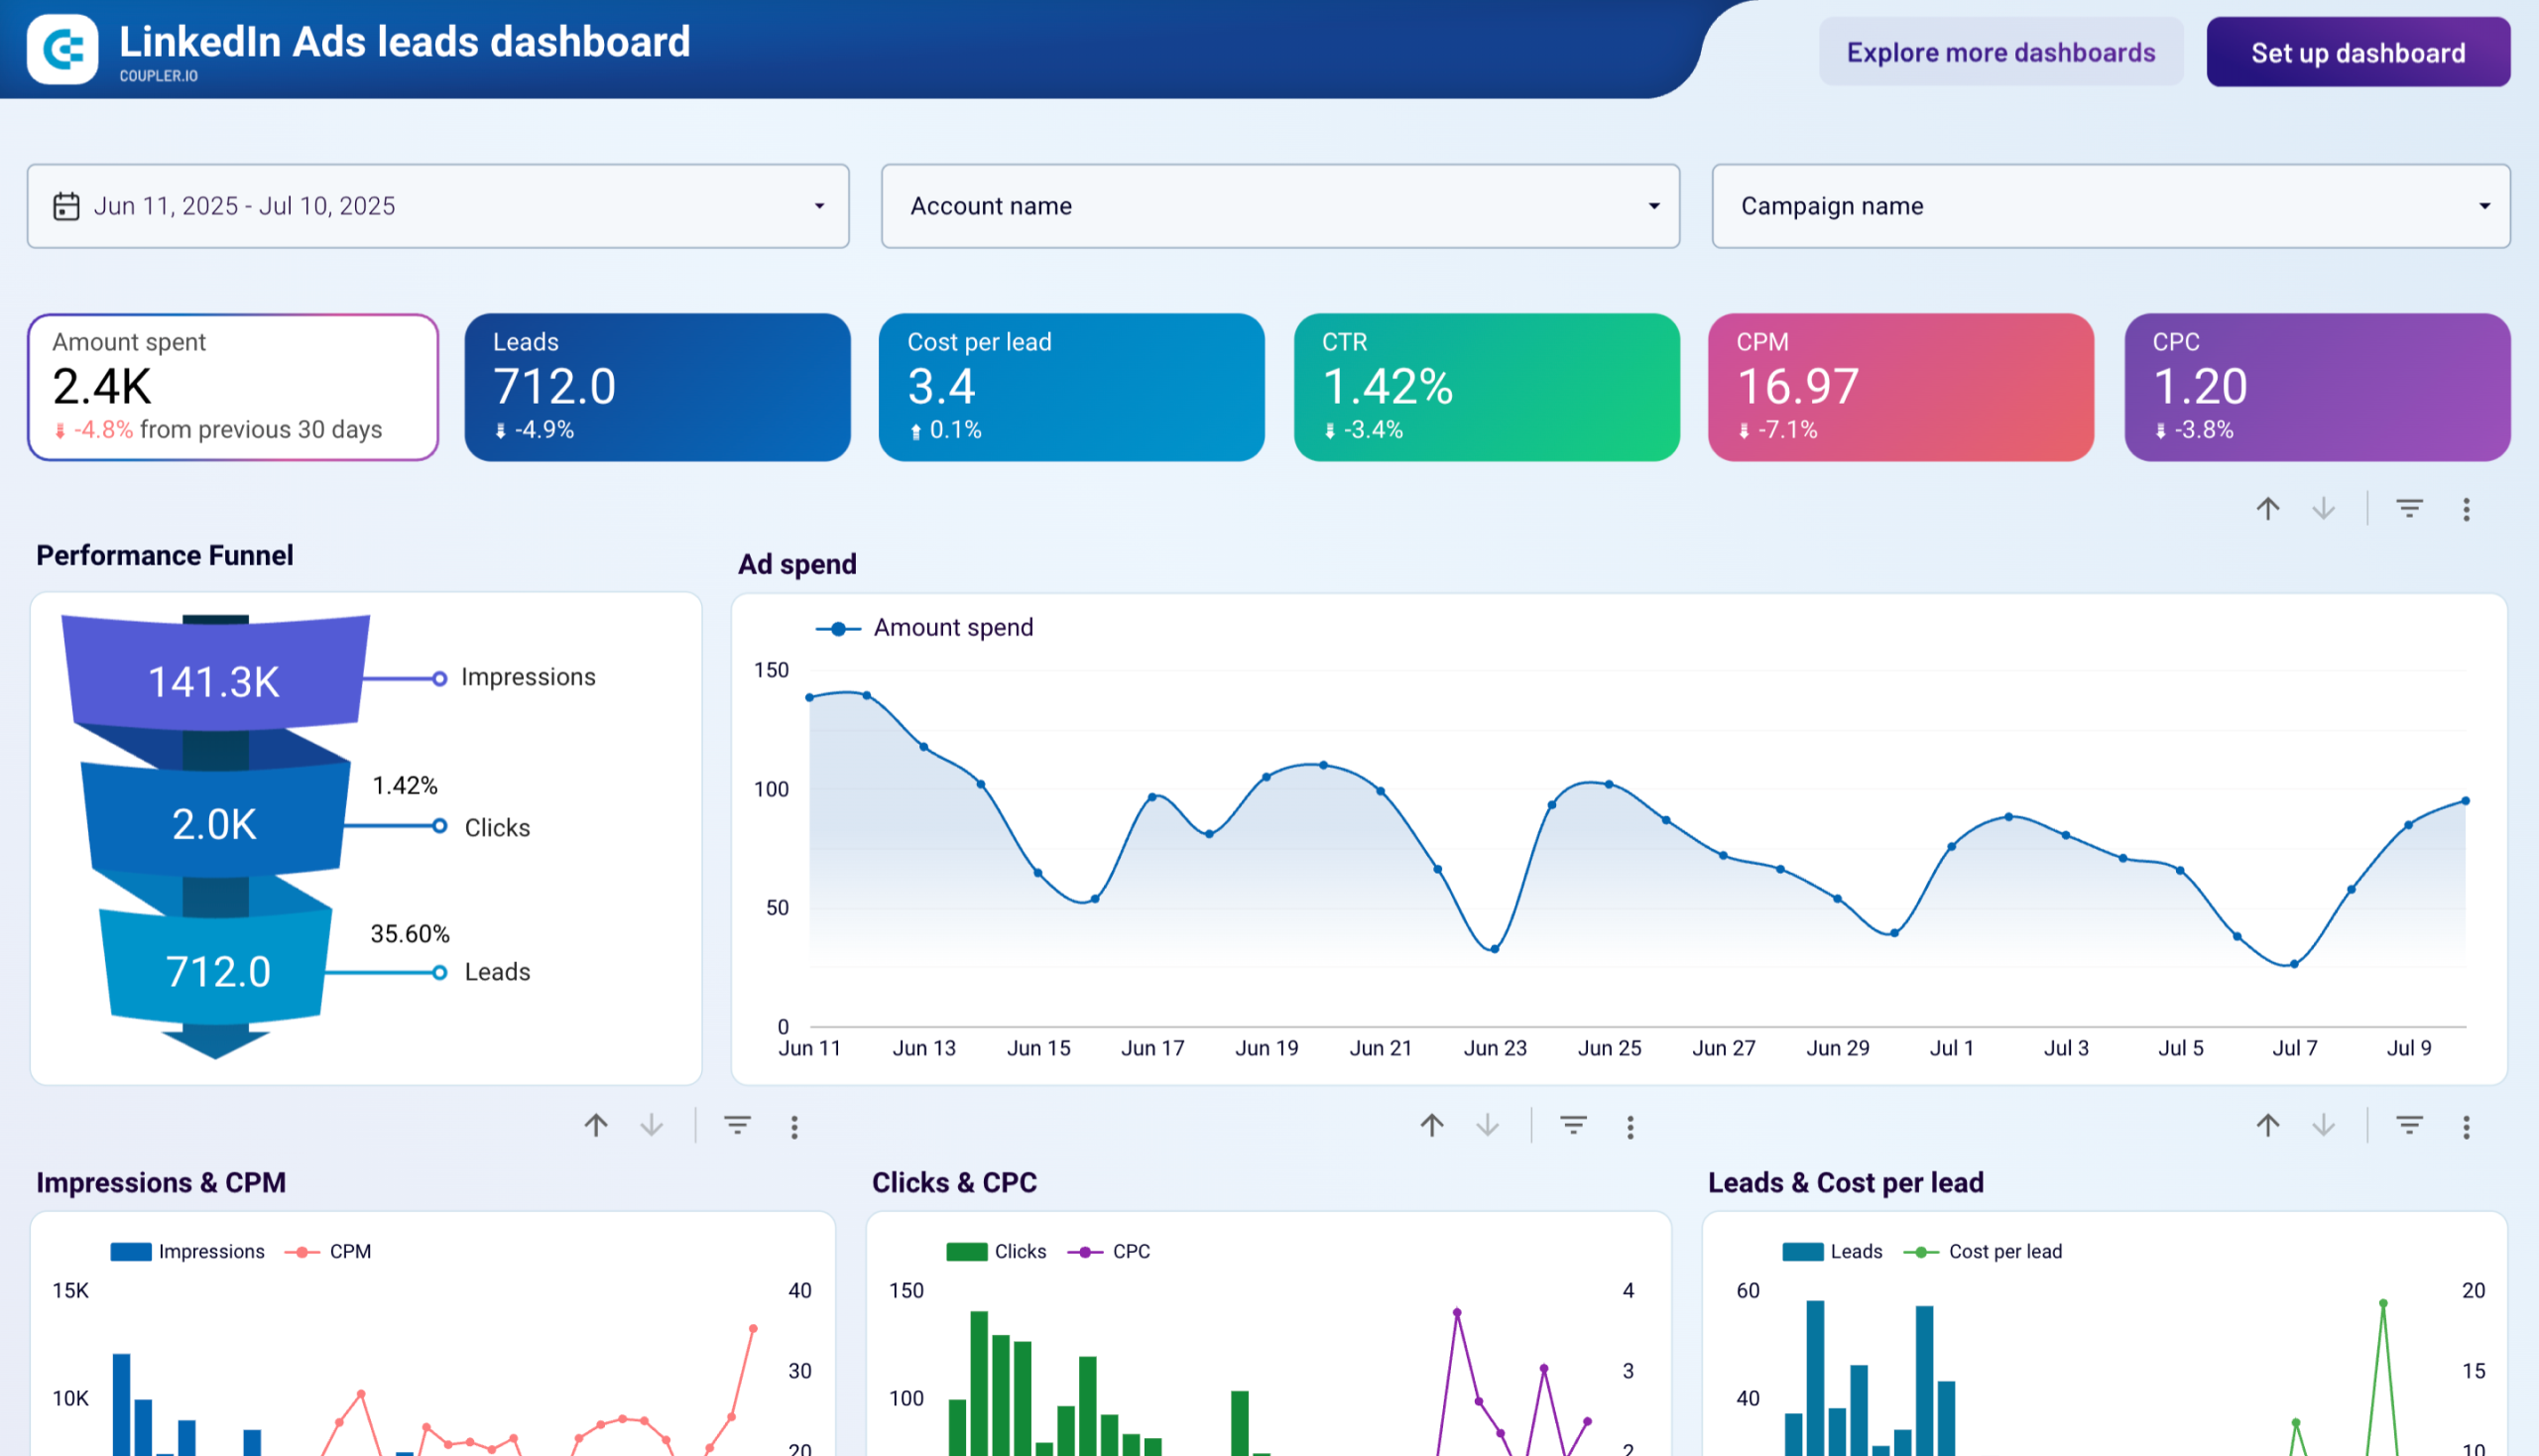
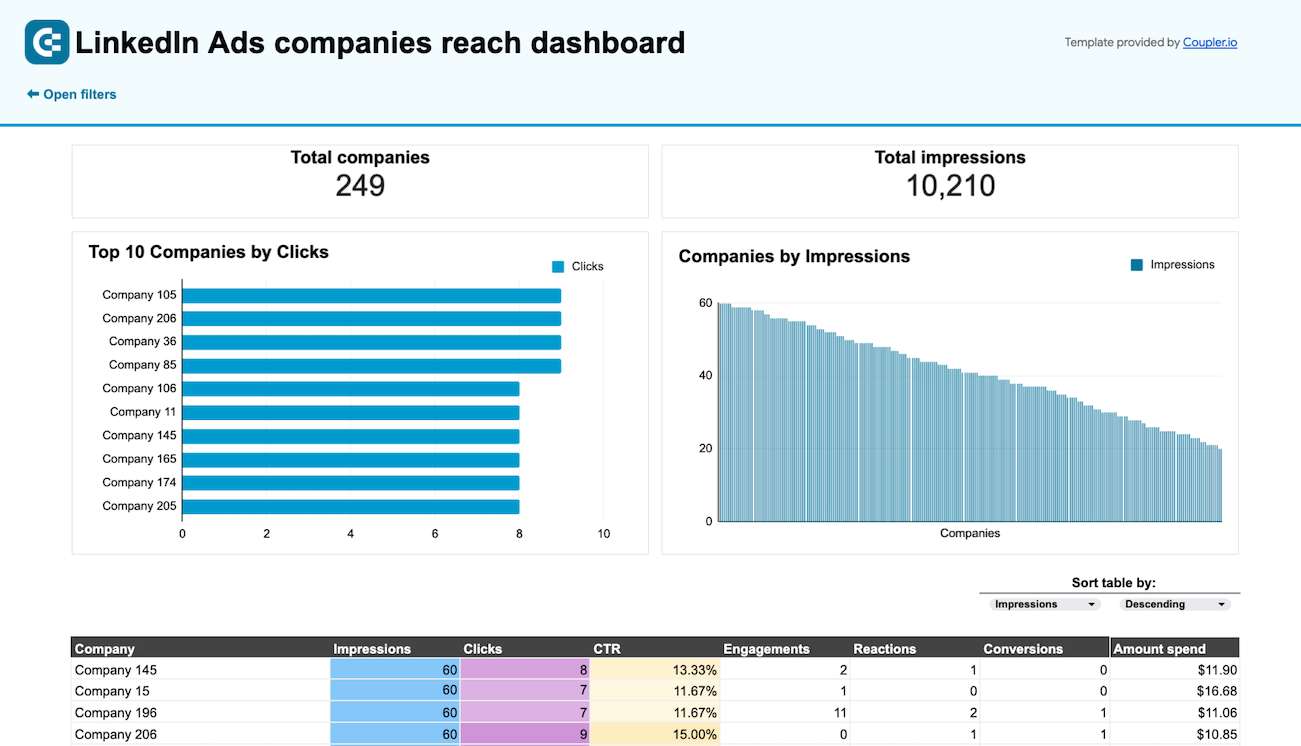
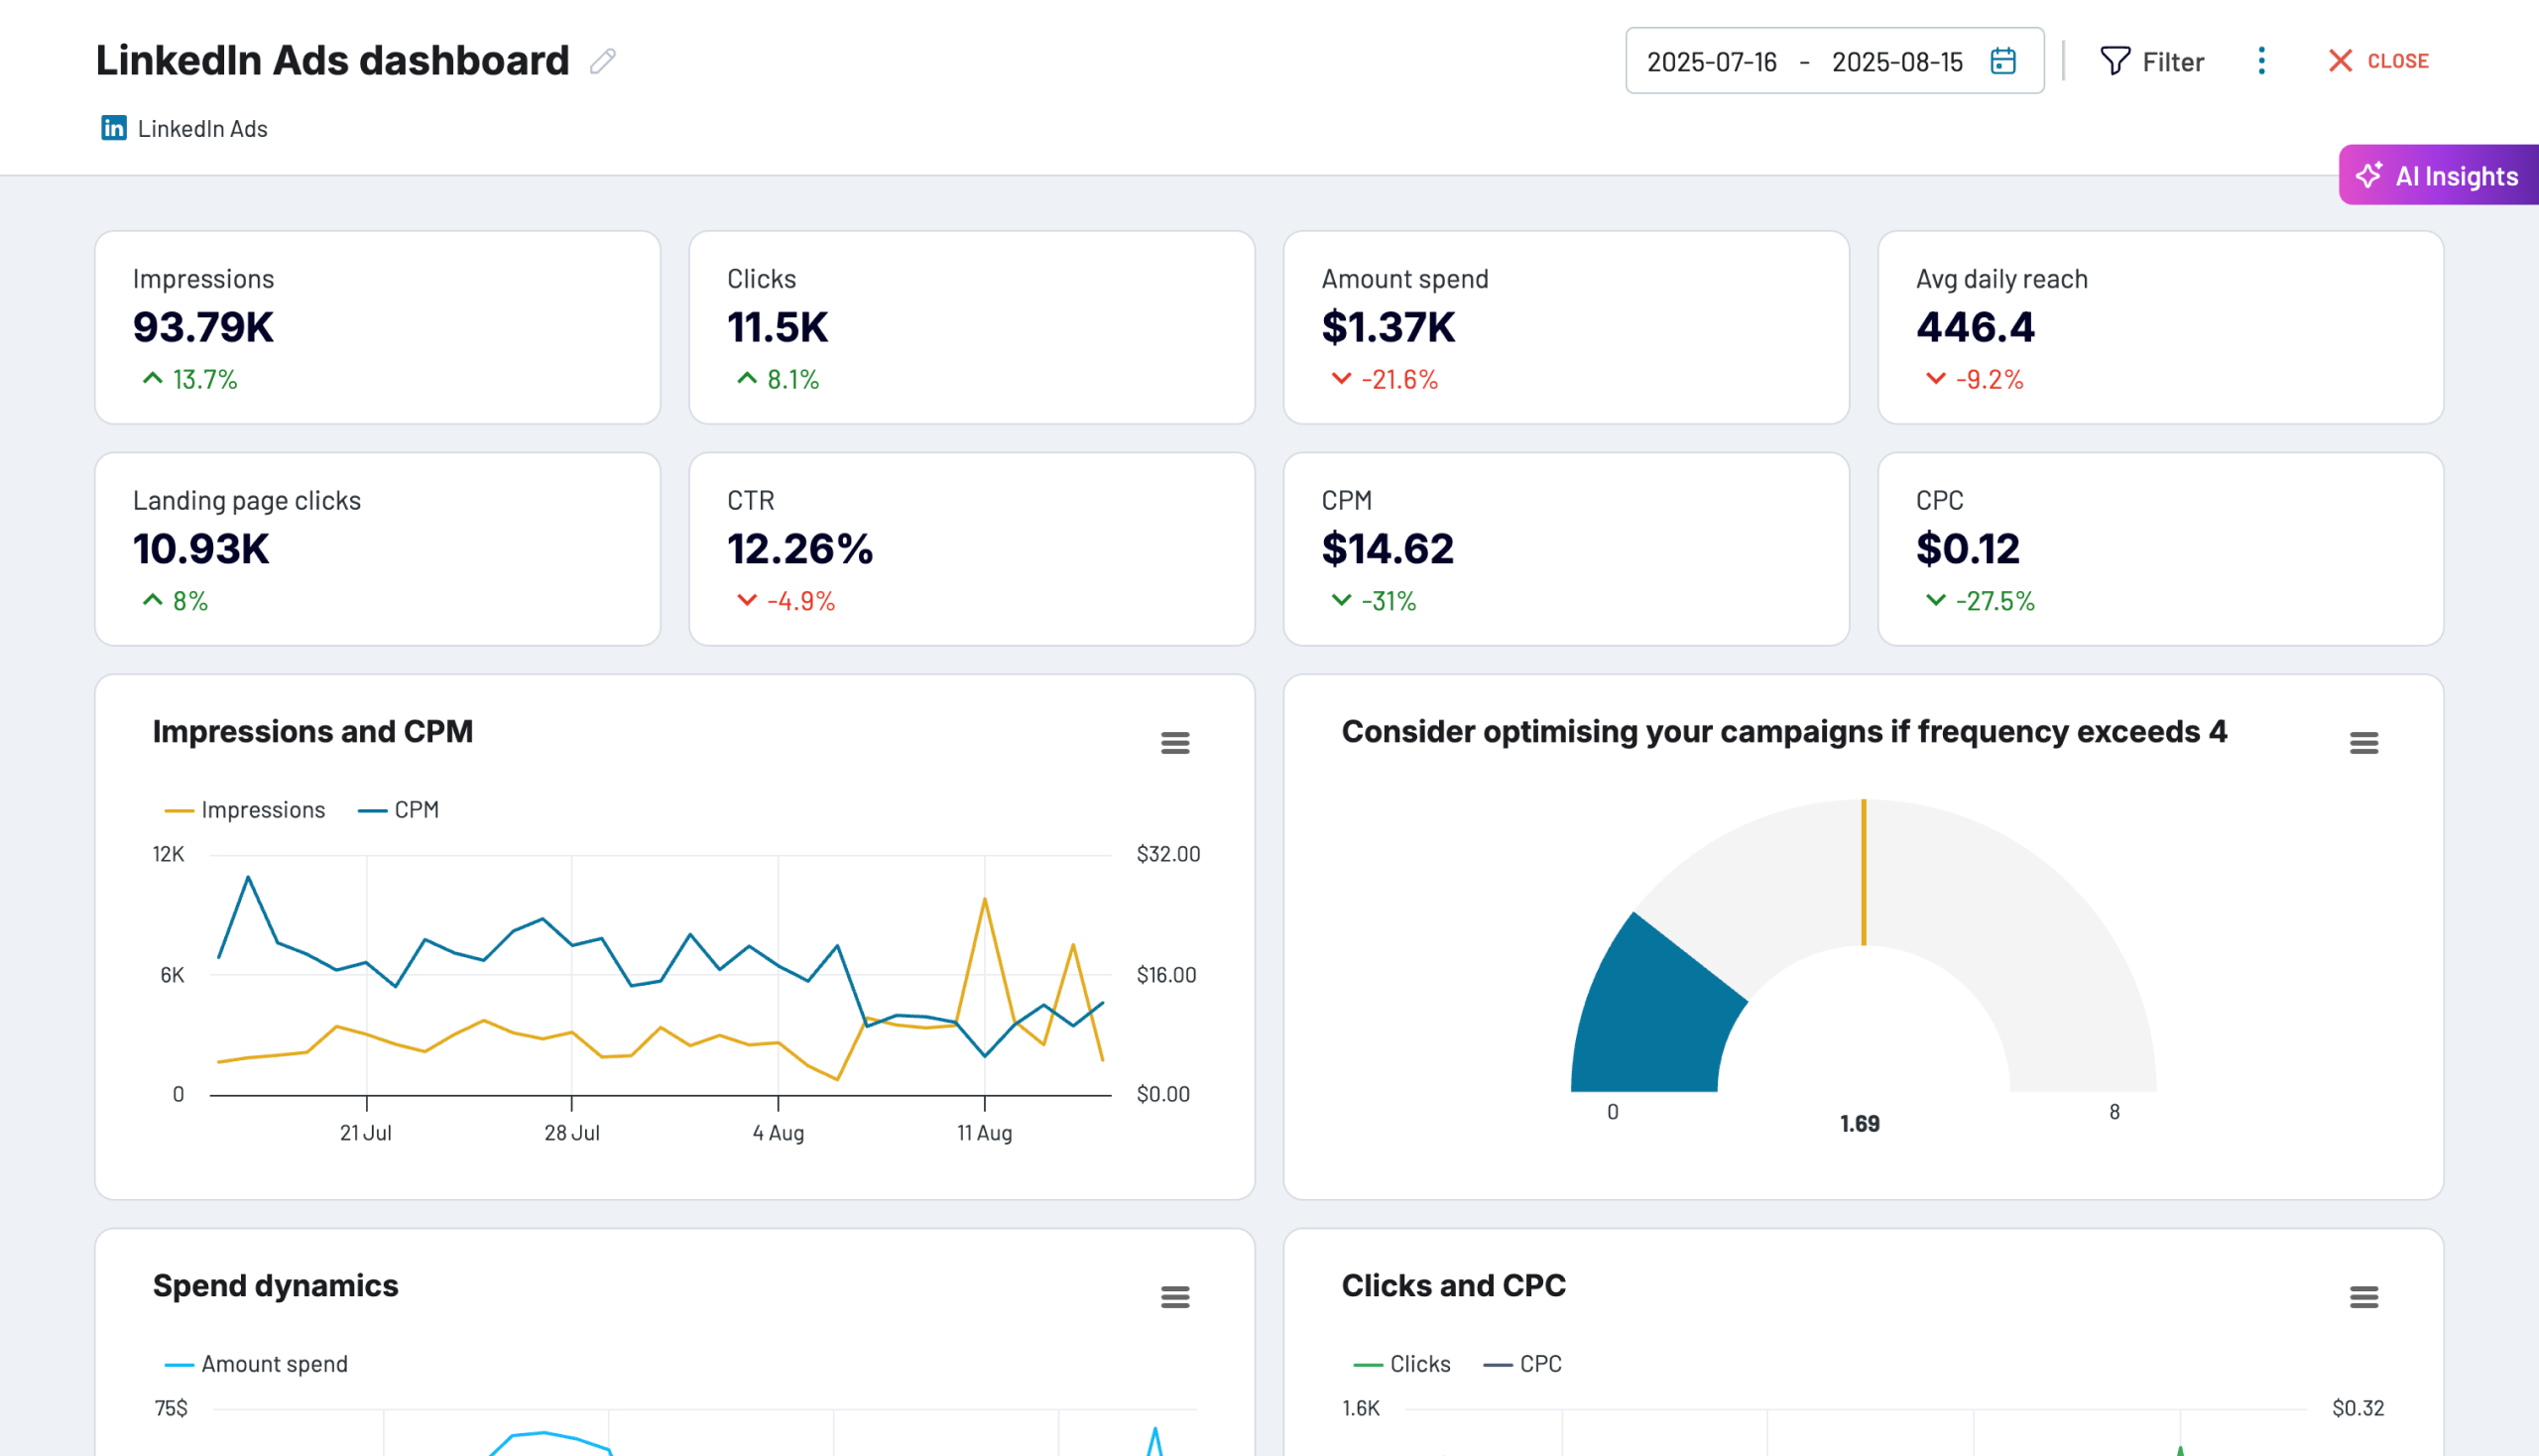
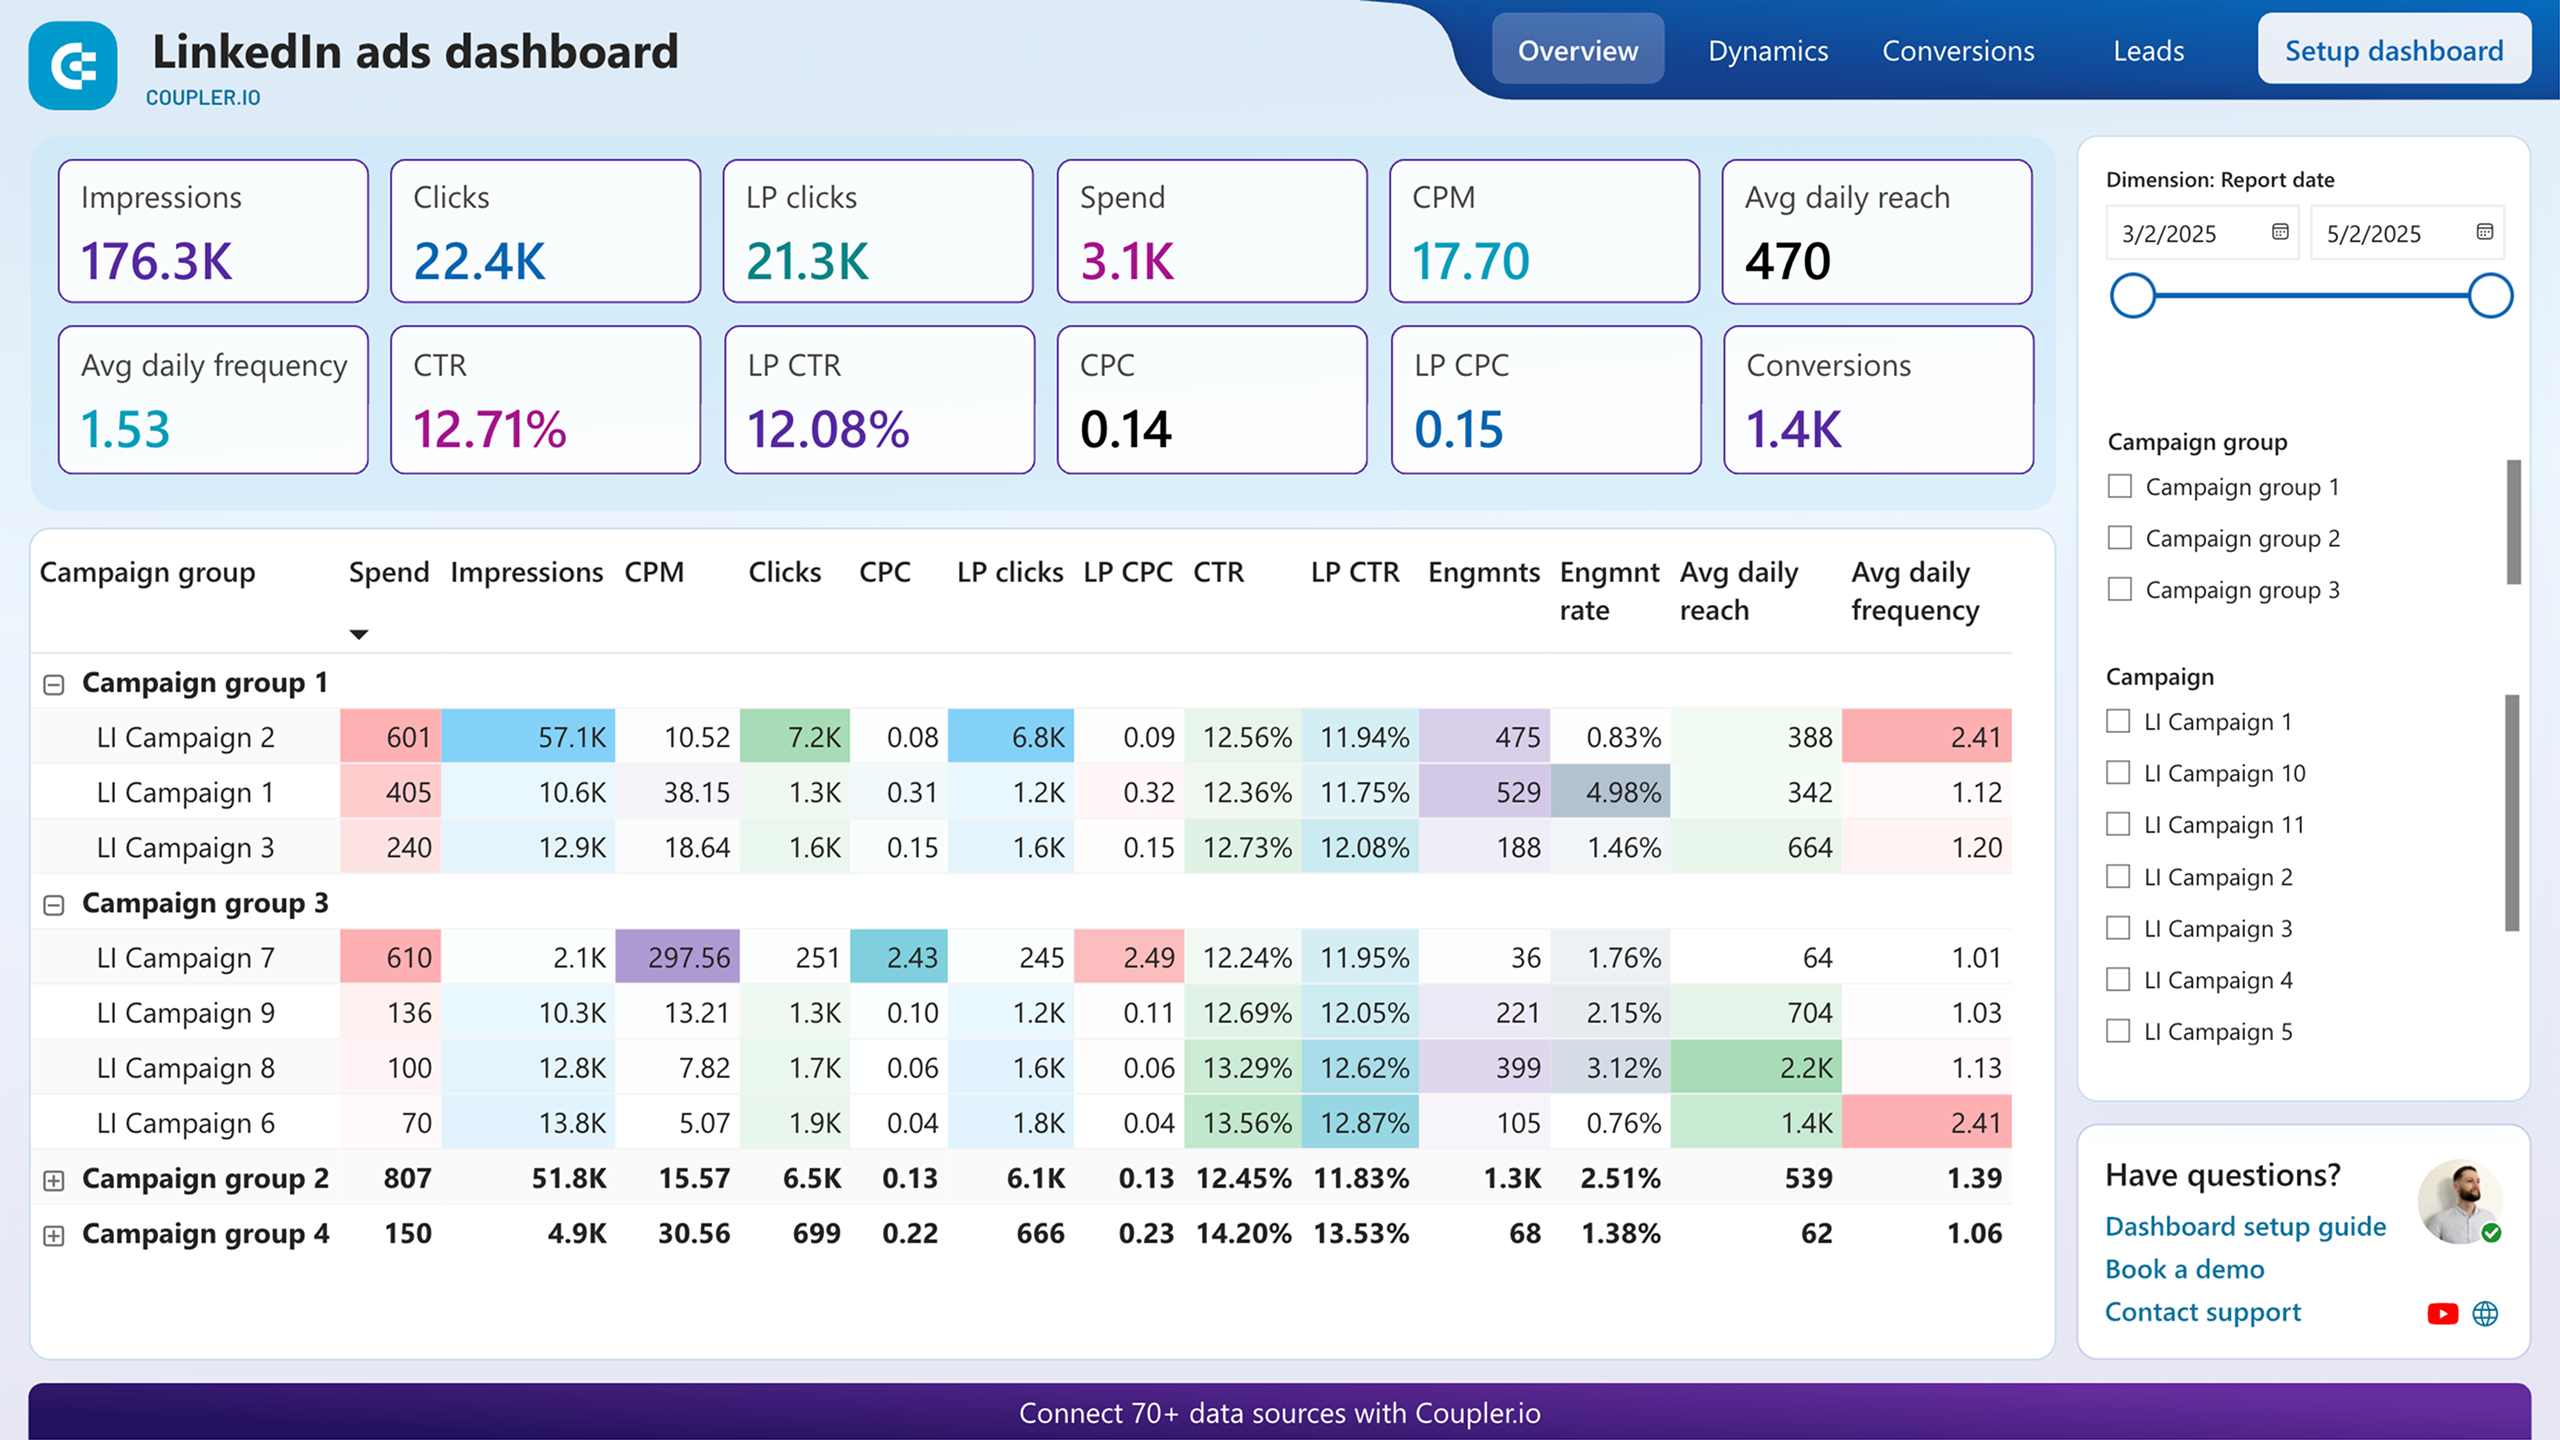
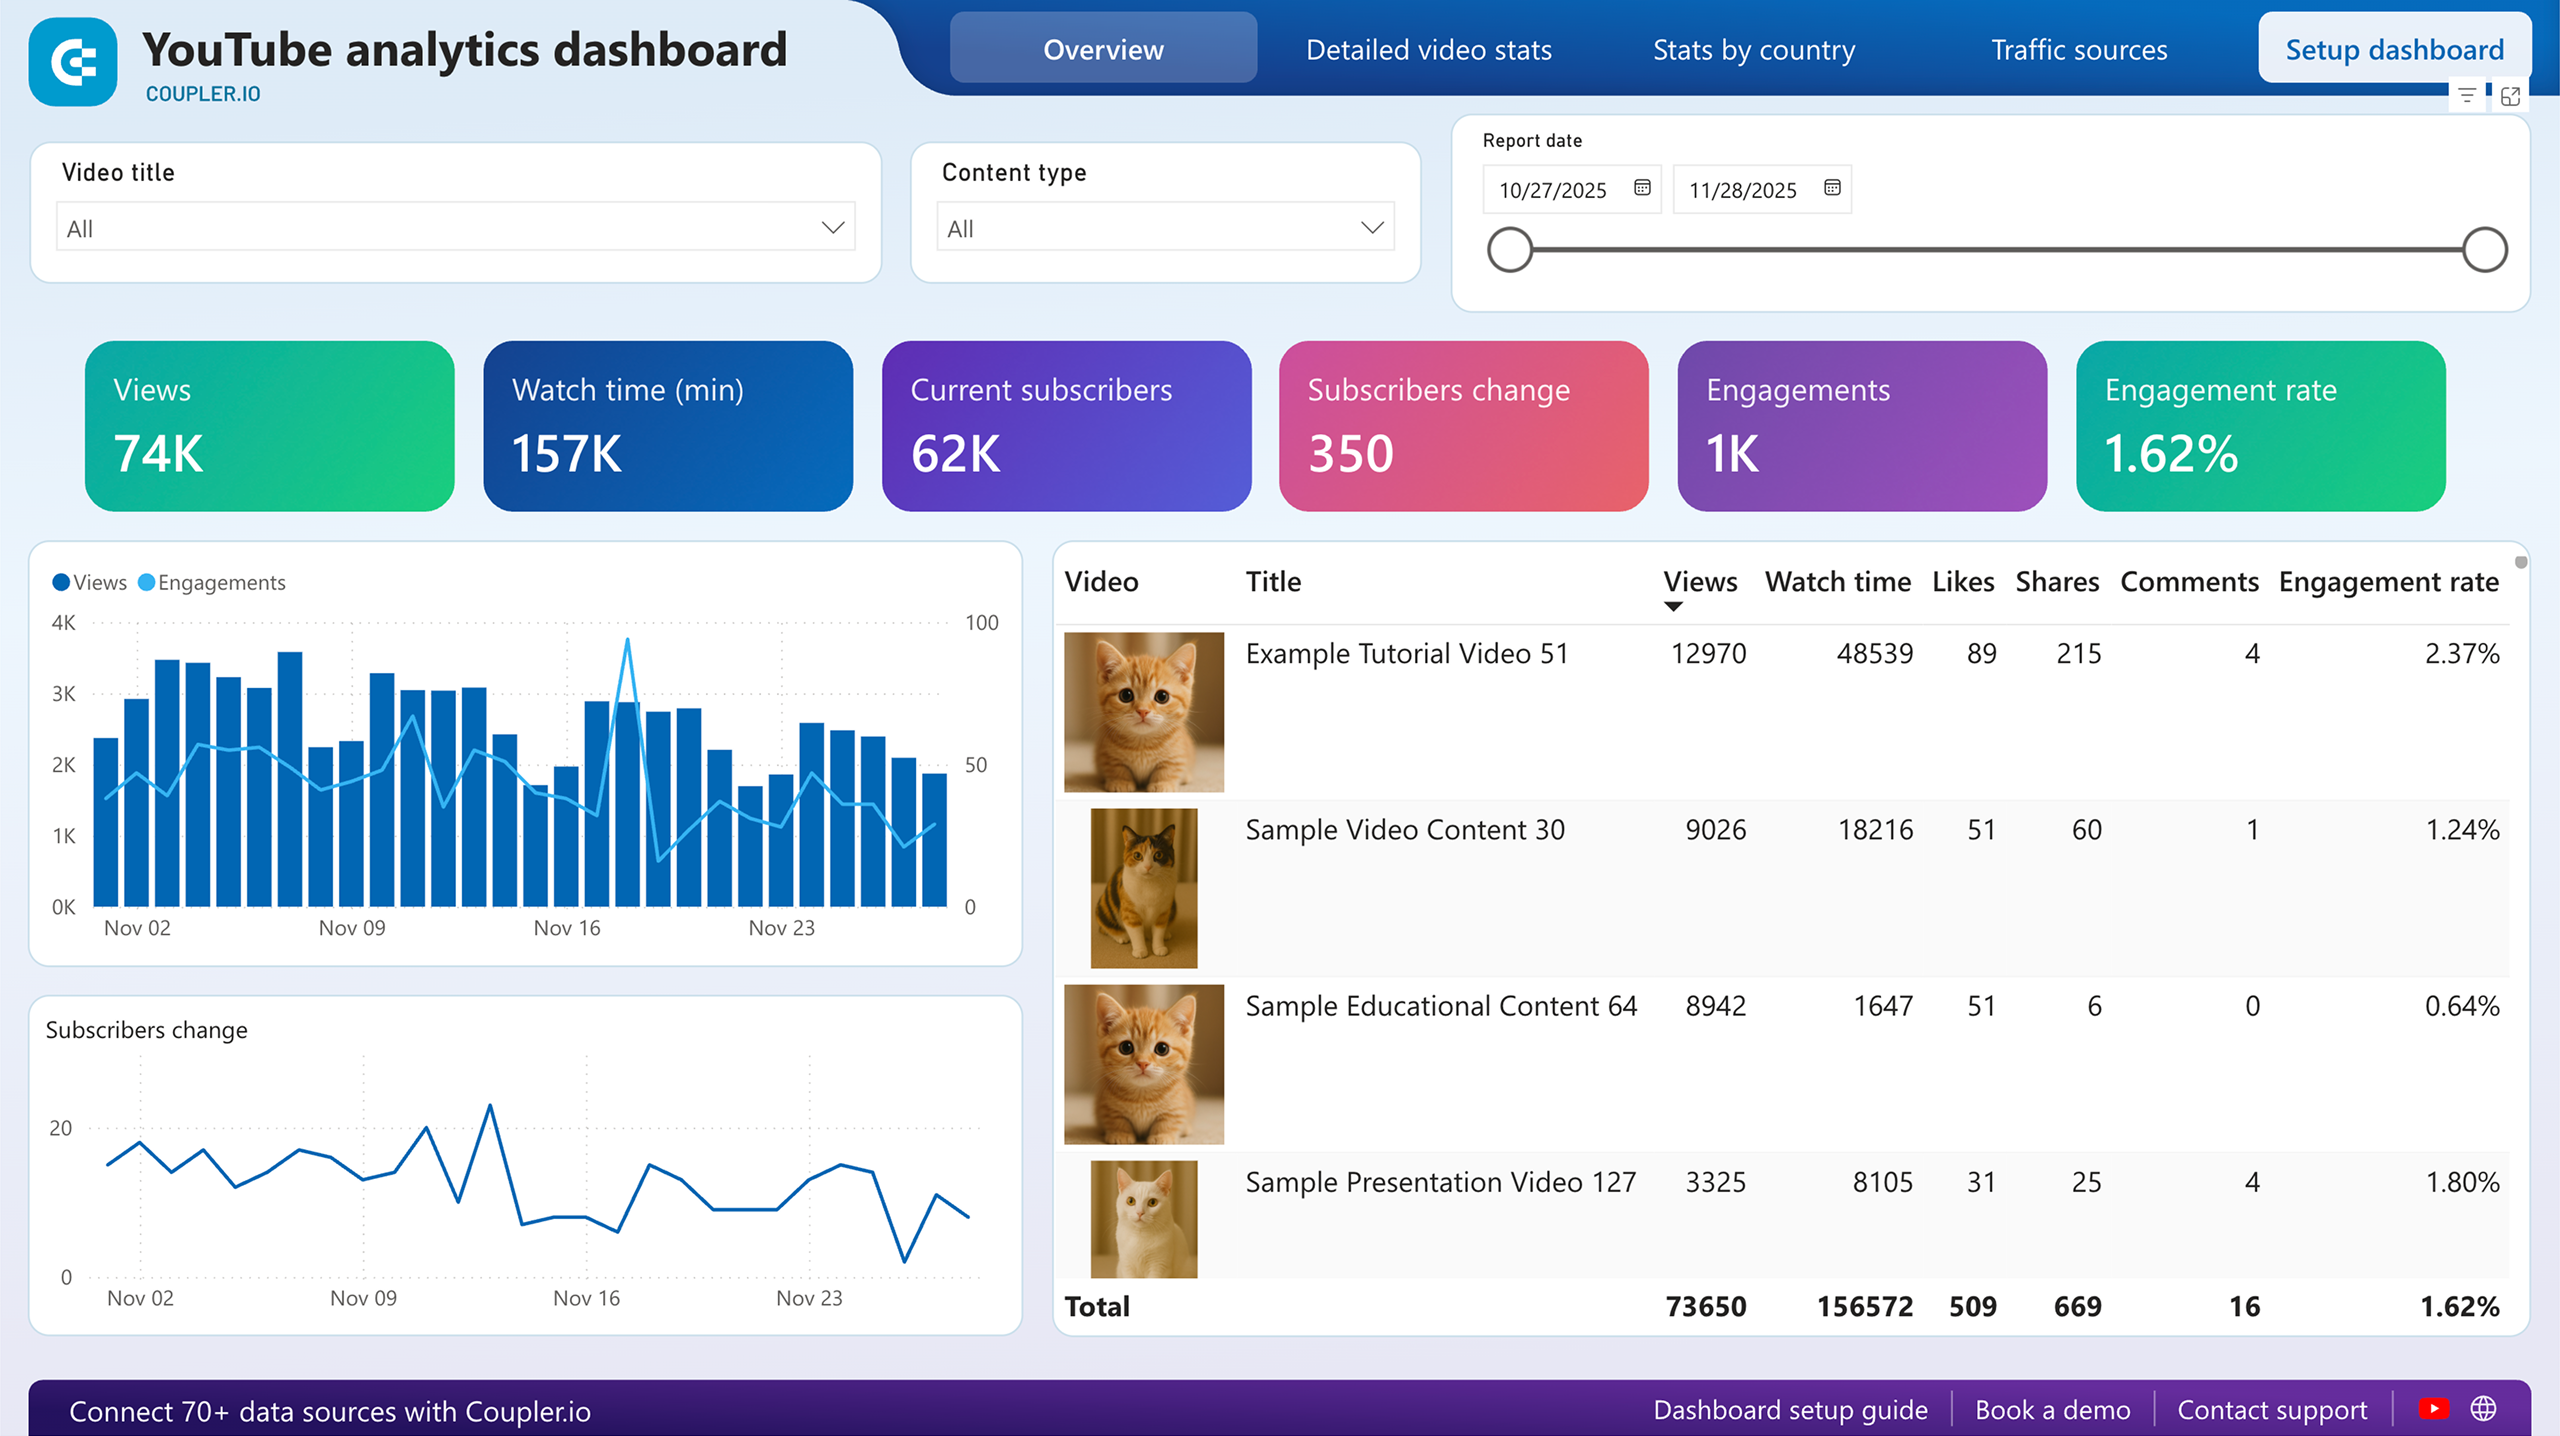
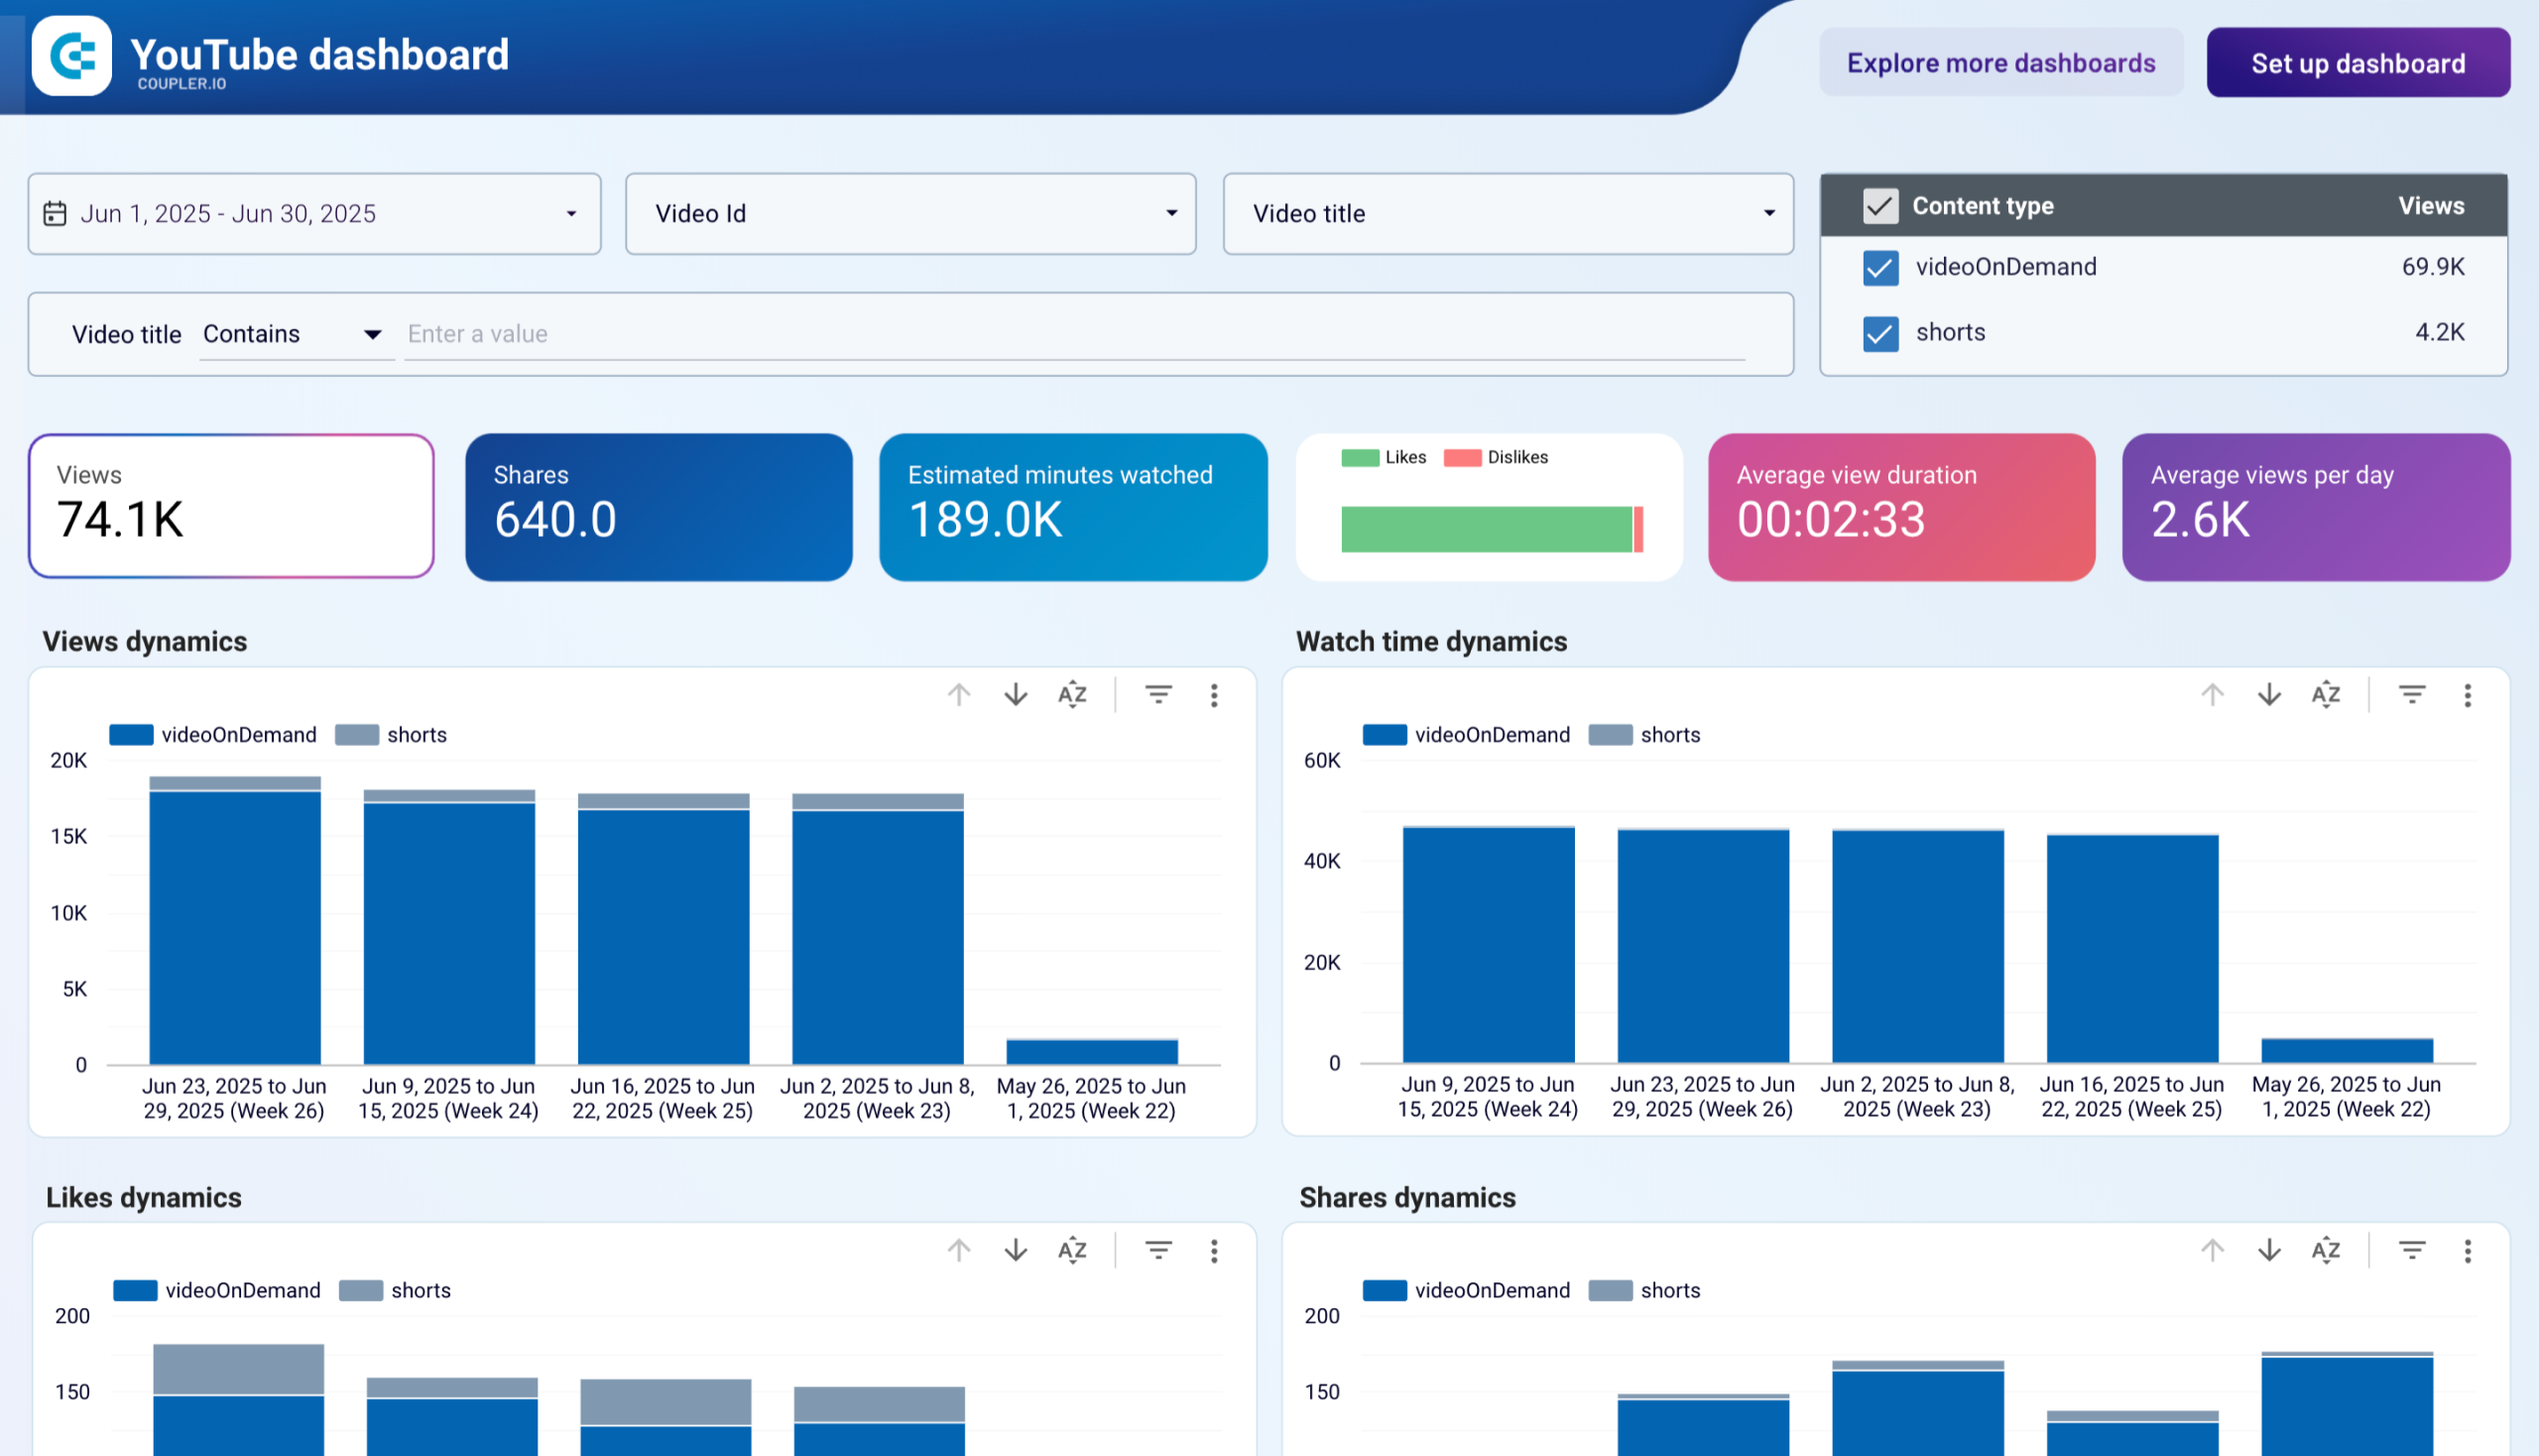
Get analysis-ready data with Coupler.io and build dashboards using Looker Studio or other BI tools in minutes.

Schedule the refresh of your Xero data and build triggered automation sequences using incoming and outgoing webhooks.

Integrate Xero with these destinations


What data you can export from Xero?
-
Accounts
-
Bank transactions
-
Bank transfers
-
Branding themes
-
Contact groups
-
Contacts
-
Credit notes
-
Currencies
-
Employees
-
Expense claims
-
Invoices
-
Items
-
Journals
-
Linked transactions
-
Manual journals
-
Organisation
-
Overpayments
-
Payments
-
Prepayments
-
Purchase orders
-
Receipts
-
Repeating invoices
-
Tax rates
-
Tracking categories
-
Users
-
Quotes
-
Benefits
-
Deductions
-
Earning rates
-
Earnings orders (Statutory deductions)
-
Employees (UK or NZ)
-
Leave types
-
Pay run calendars
-
Pay runs
-
Reimbursements
-
Accounts (UK or NZ)
-
Timesheets
-
Tracking categories (UK or NZ)
-
Employees (AU)
-
Leave applications
-
Leave applications with leave periods
-
Earnings rates
-
Deduction types
-
Leave types
-
Reimbursement types
-
Pay runs
-
Payroll calendars
-
Settings
-
Accounts (AU)
-
Tracking categories (AU)
-
Super funds
-
Timesheets
-
Timesheets with timesheet lines
-
Projects
-
Tasks by projects
-
Time by projects
-
Users
-
Aged Payables By Contact
-
Aged Receivables By Contact
-
Balance Sheet
-
Bank Statement
-
Bank Summary
-
Budget Summary
-
Executive Summary
-
Profit And Loss
-
Trial Balance
Coupler.io made it easy to create dashboards and reports from different data sources. The sync is reliable and the user experience is amazing.

Take your reporting to the next level
 Sign Up with Google
 Sign Up with MICROSOFT
 SIGN UP WITH EMAIL
By signing up to Coupler.io, you agree to our Privacy Policy and Terms of Use.
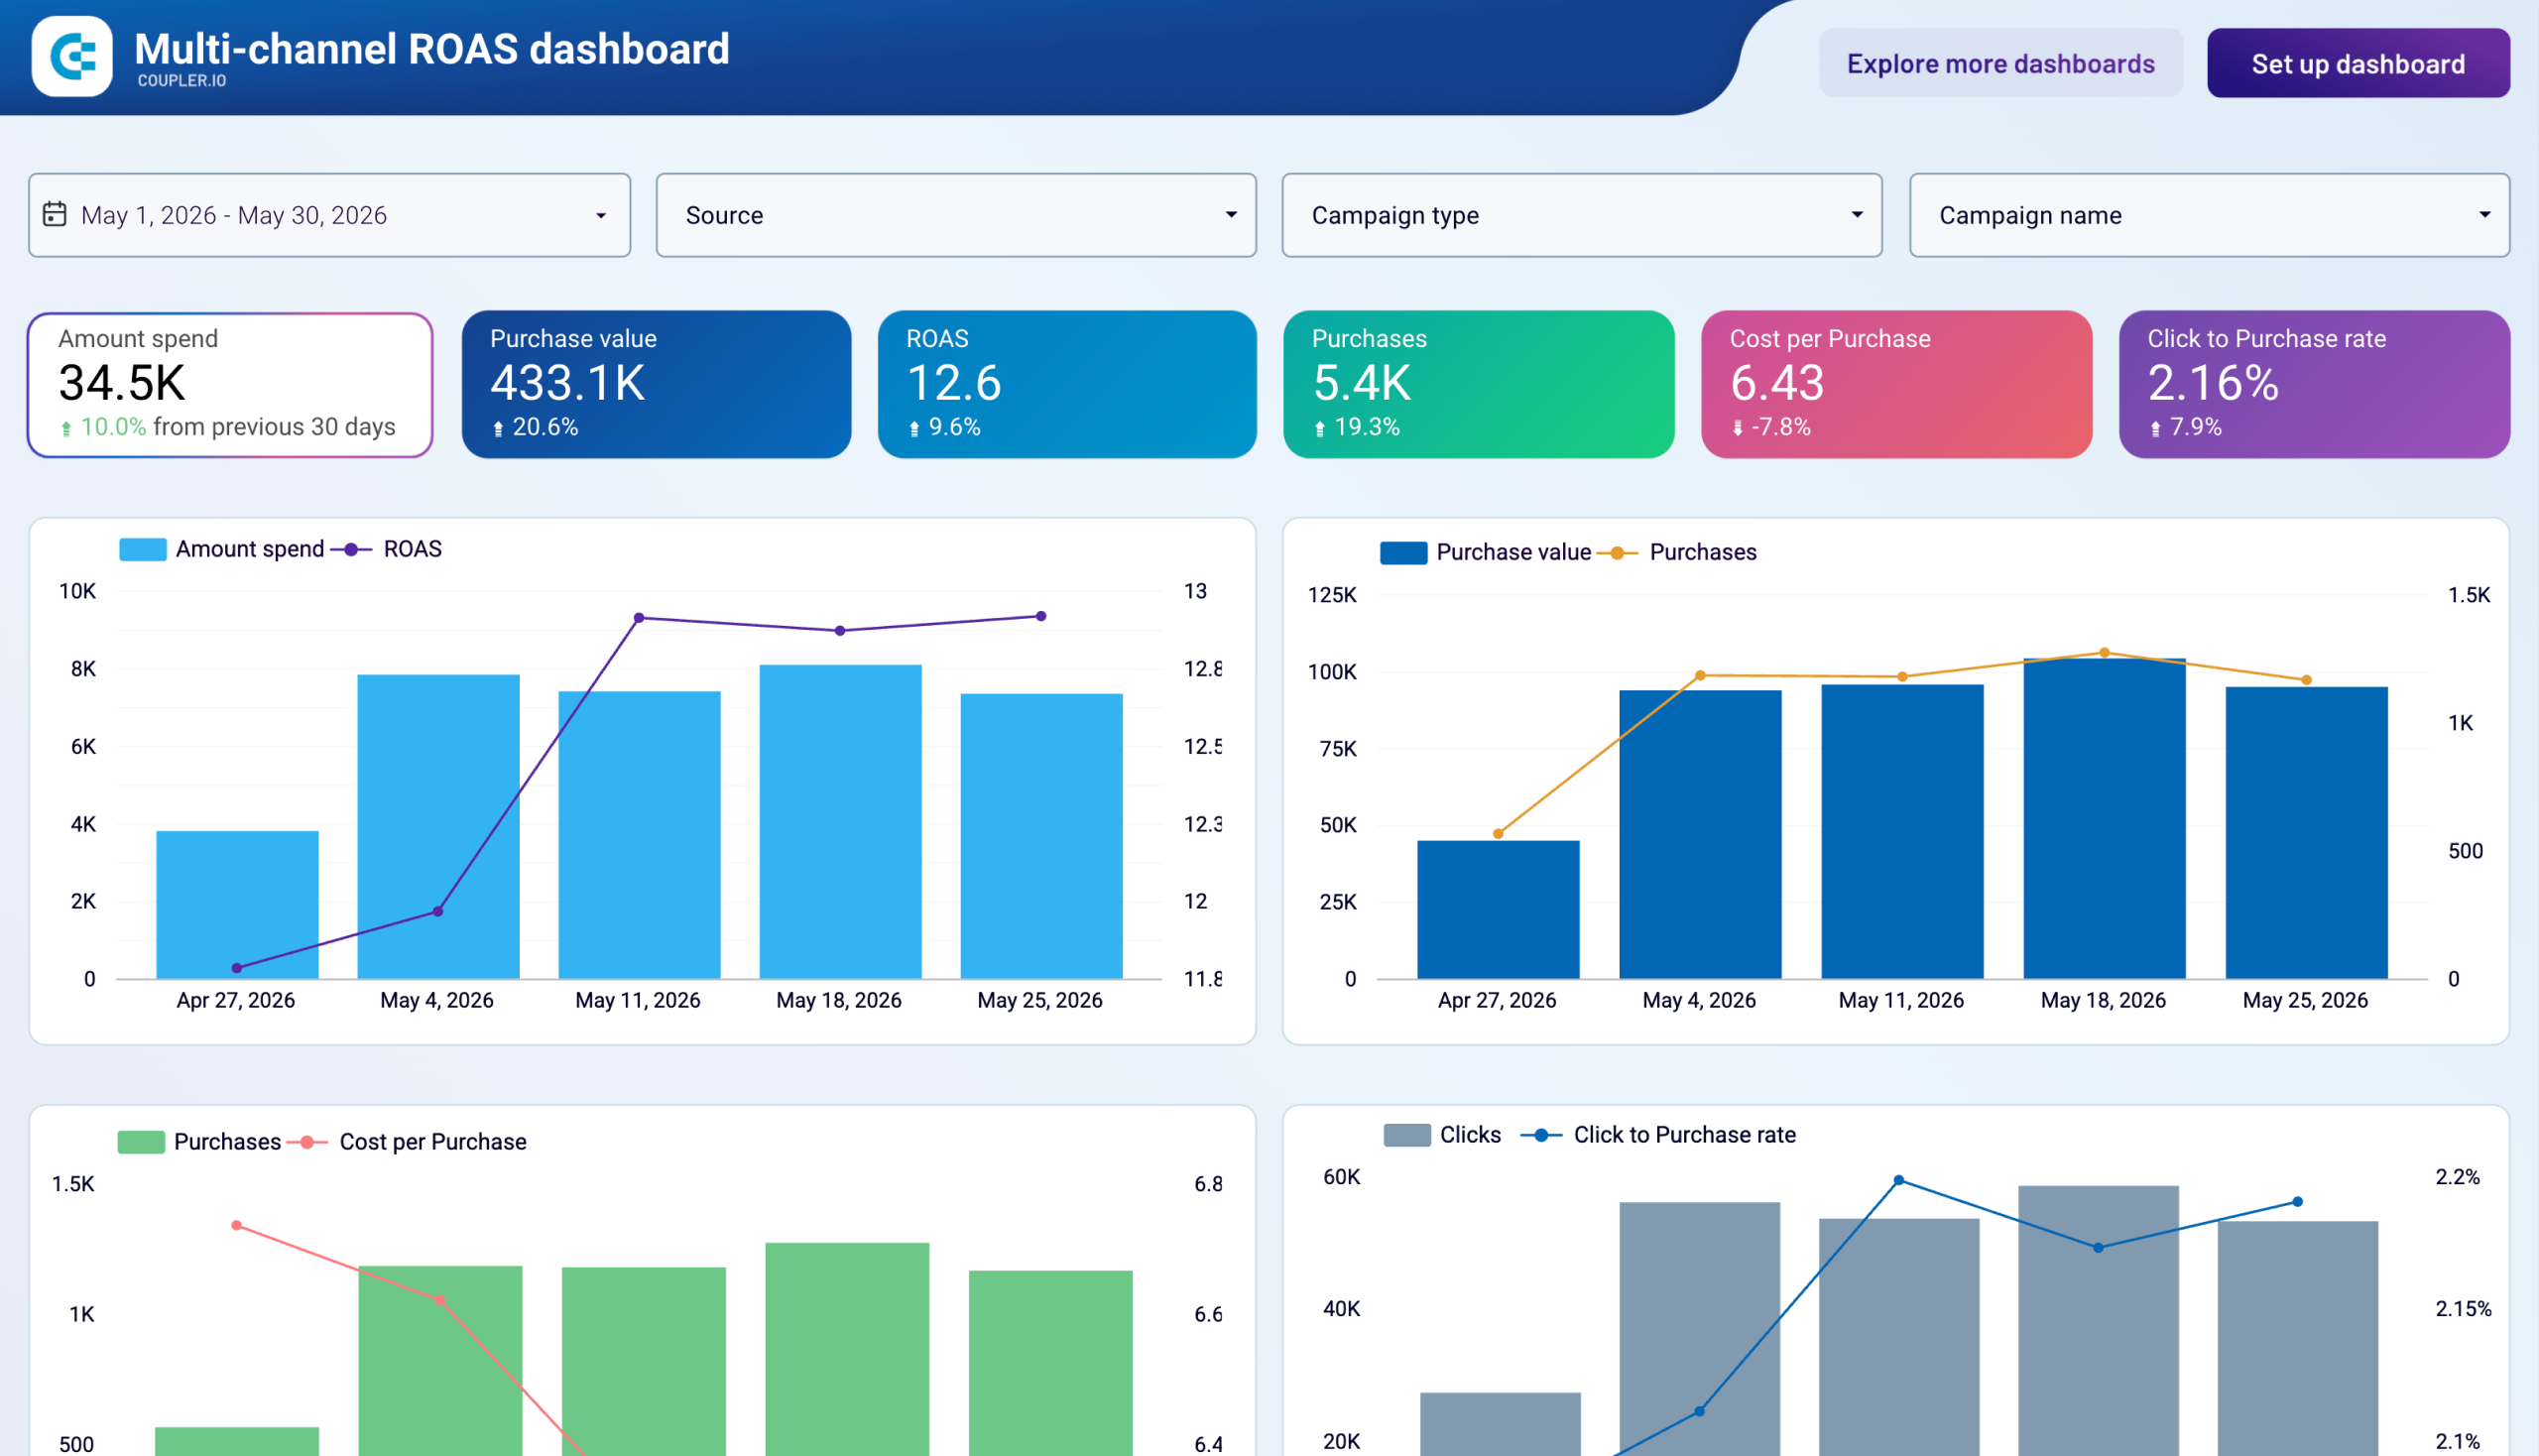
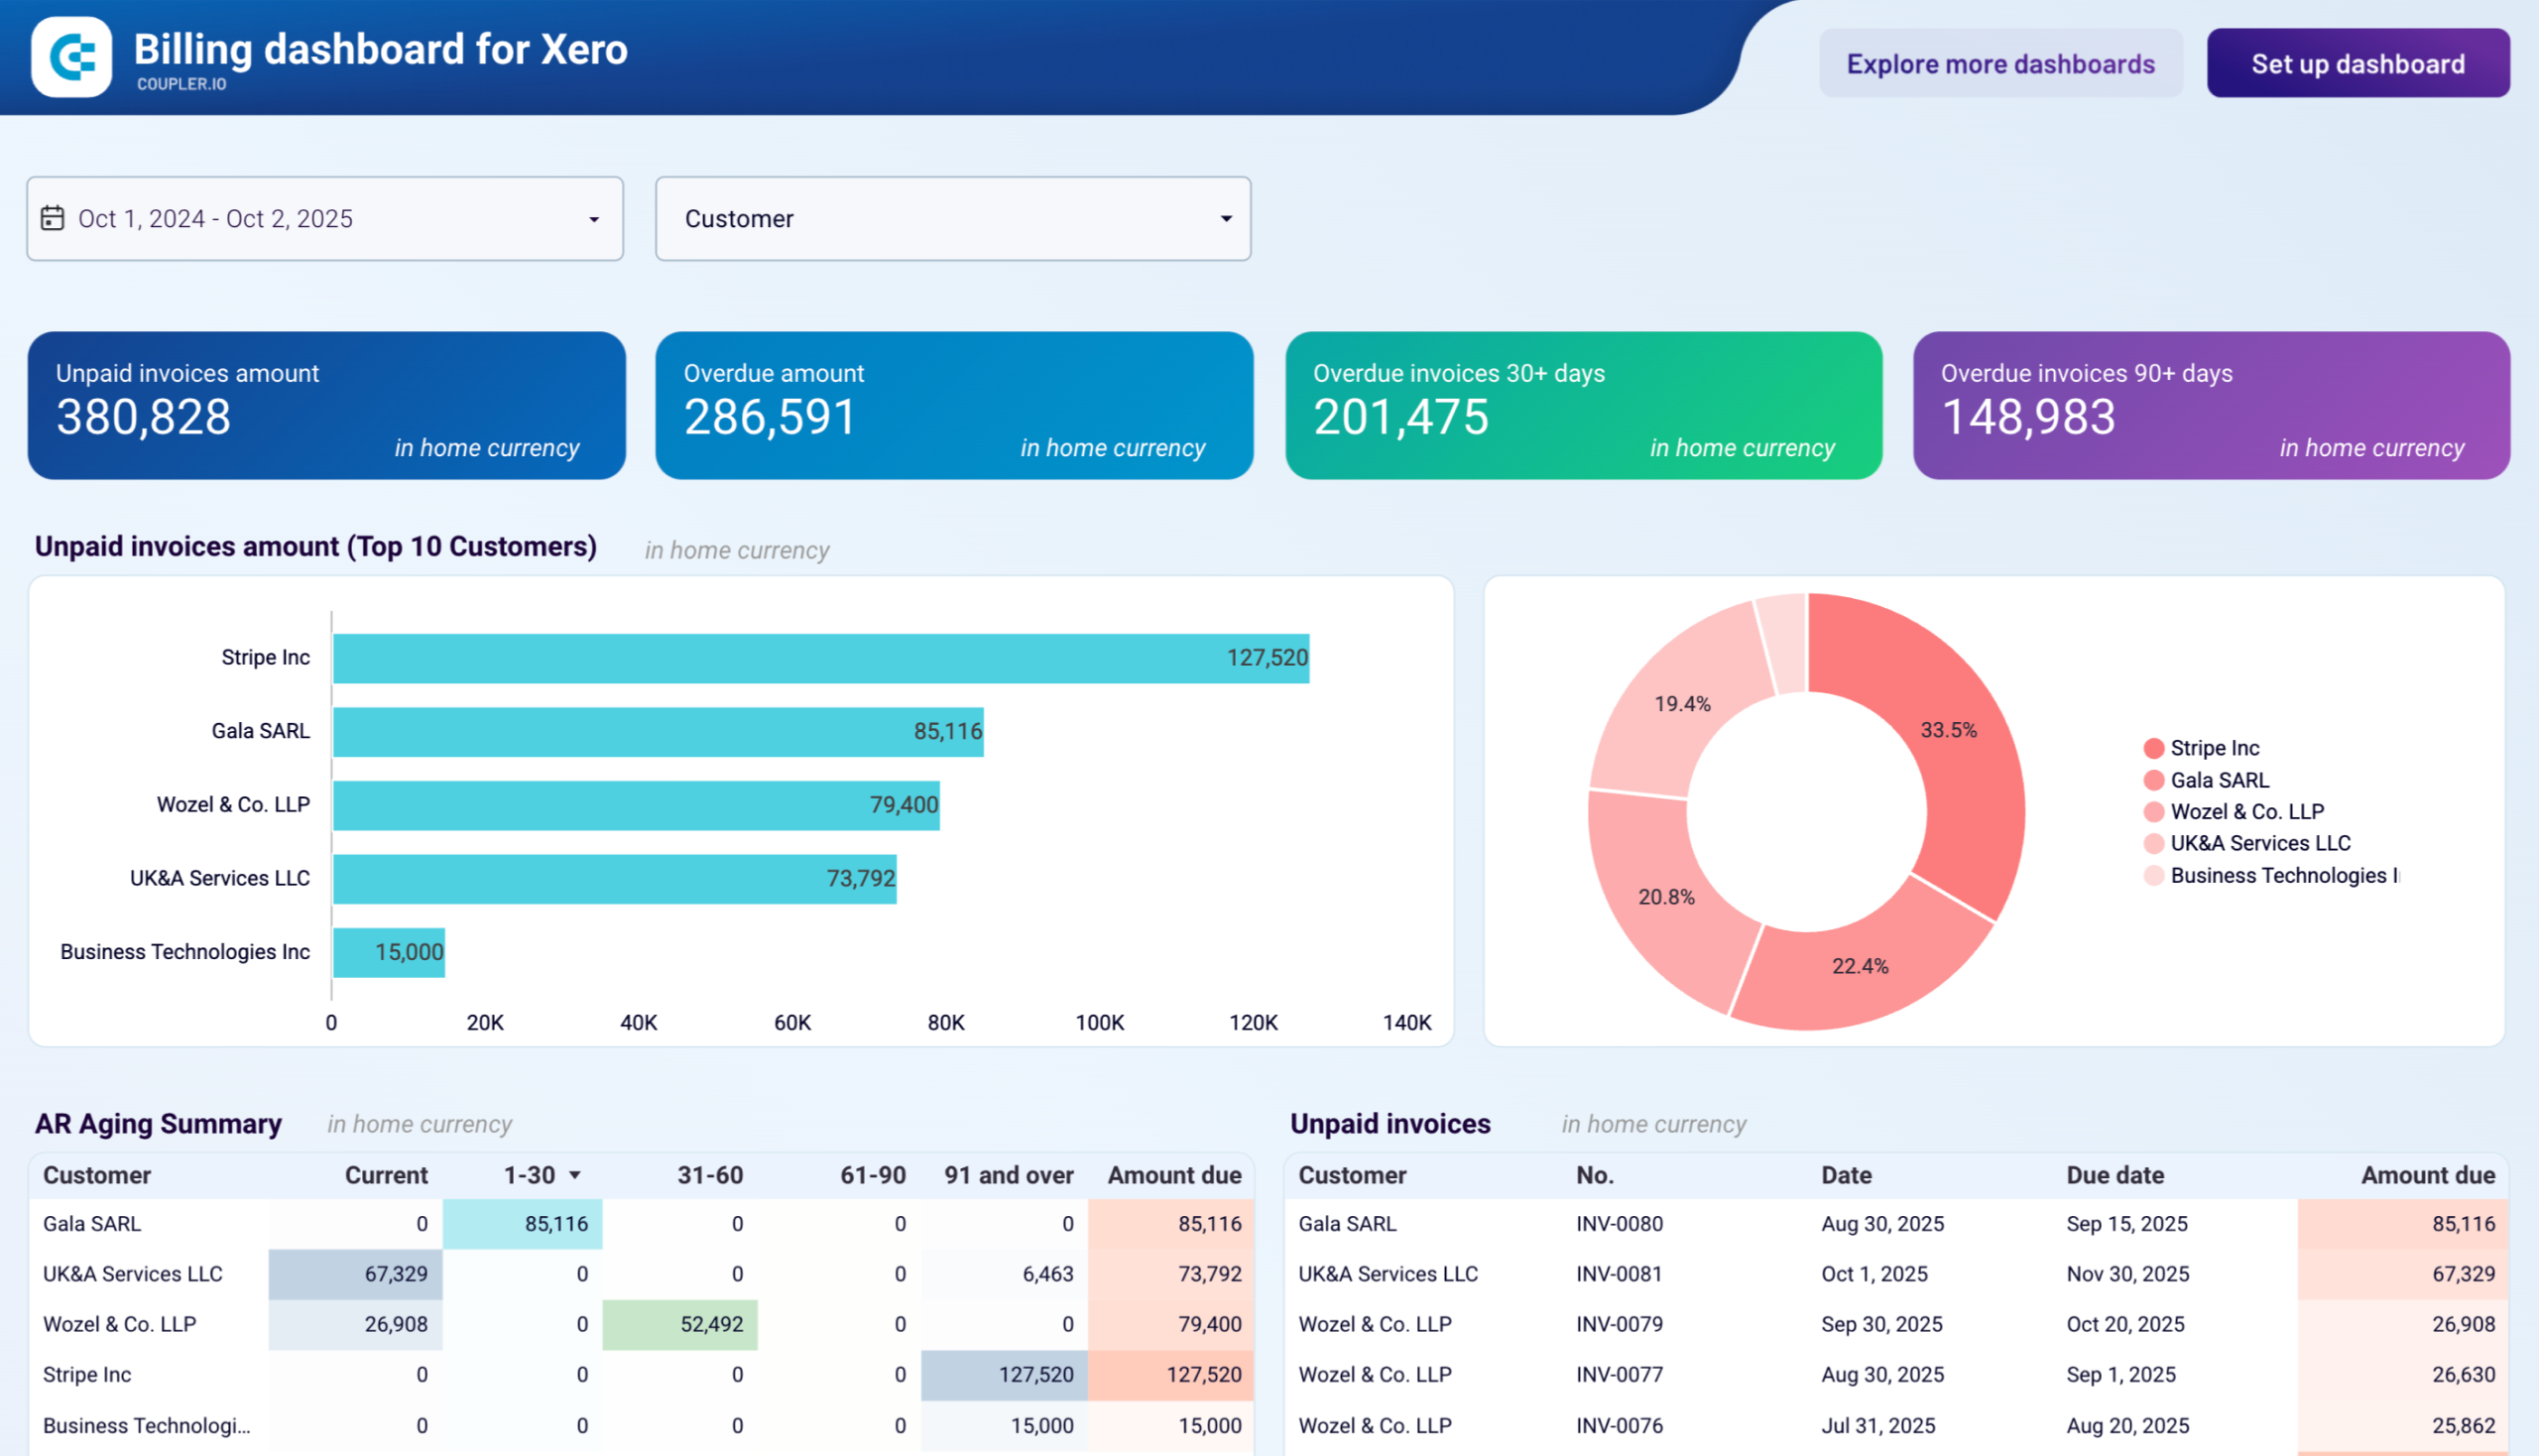
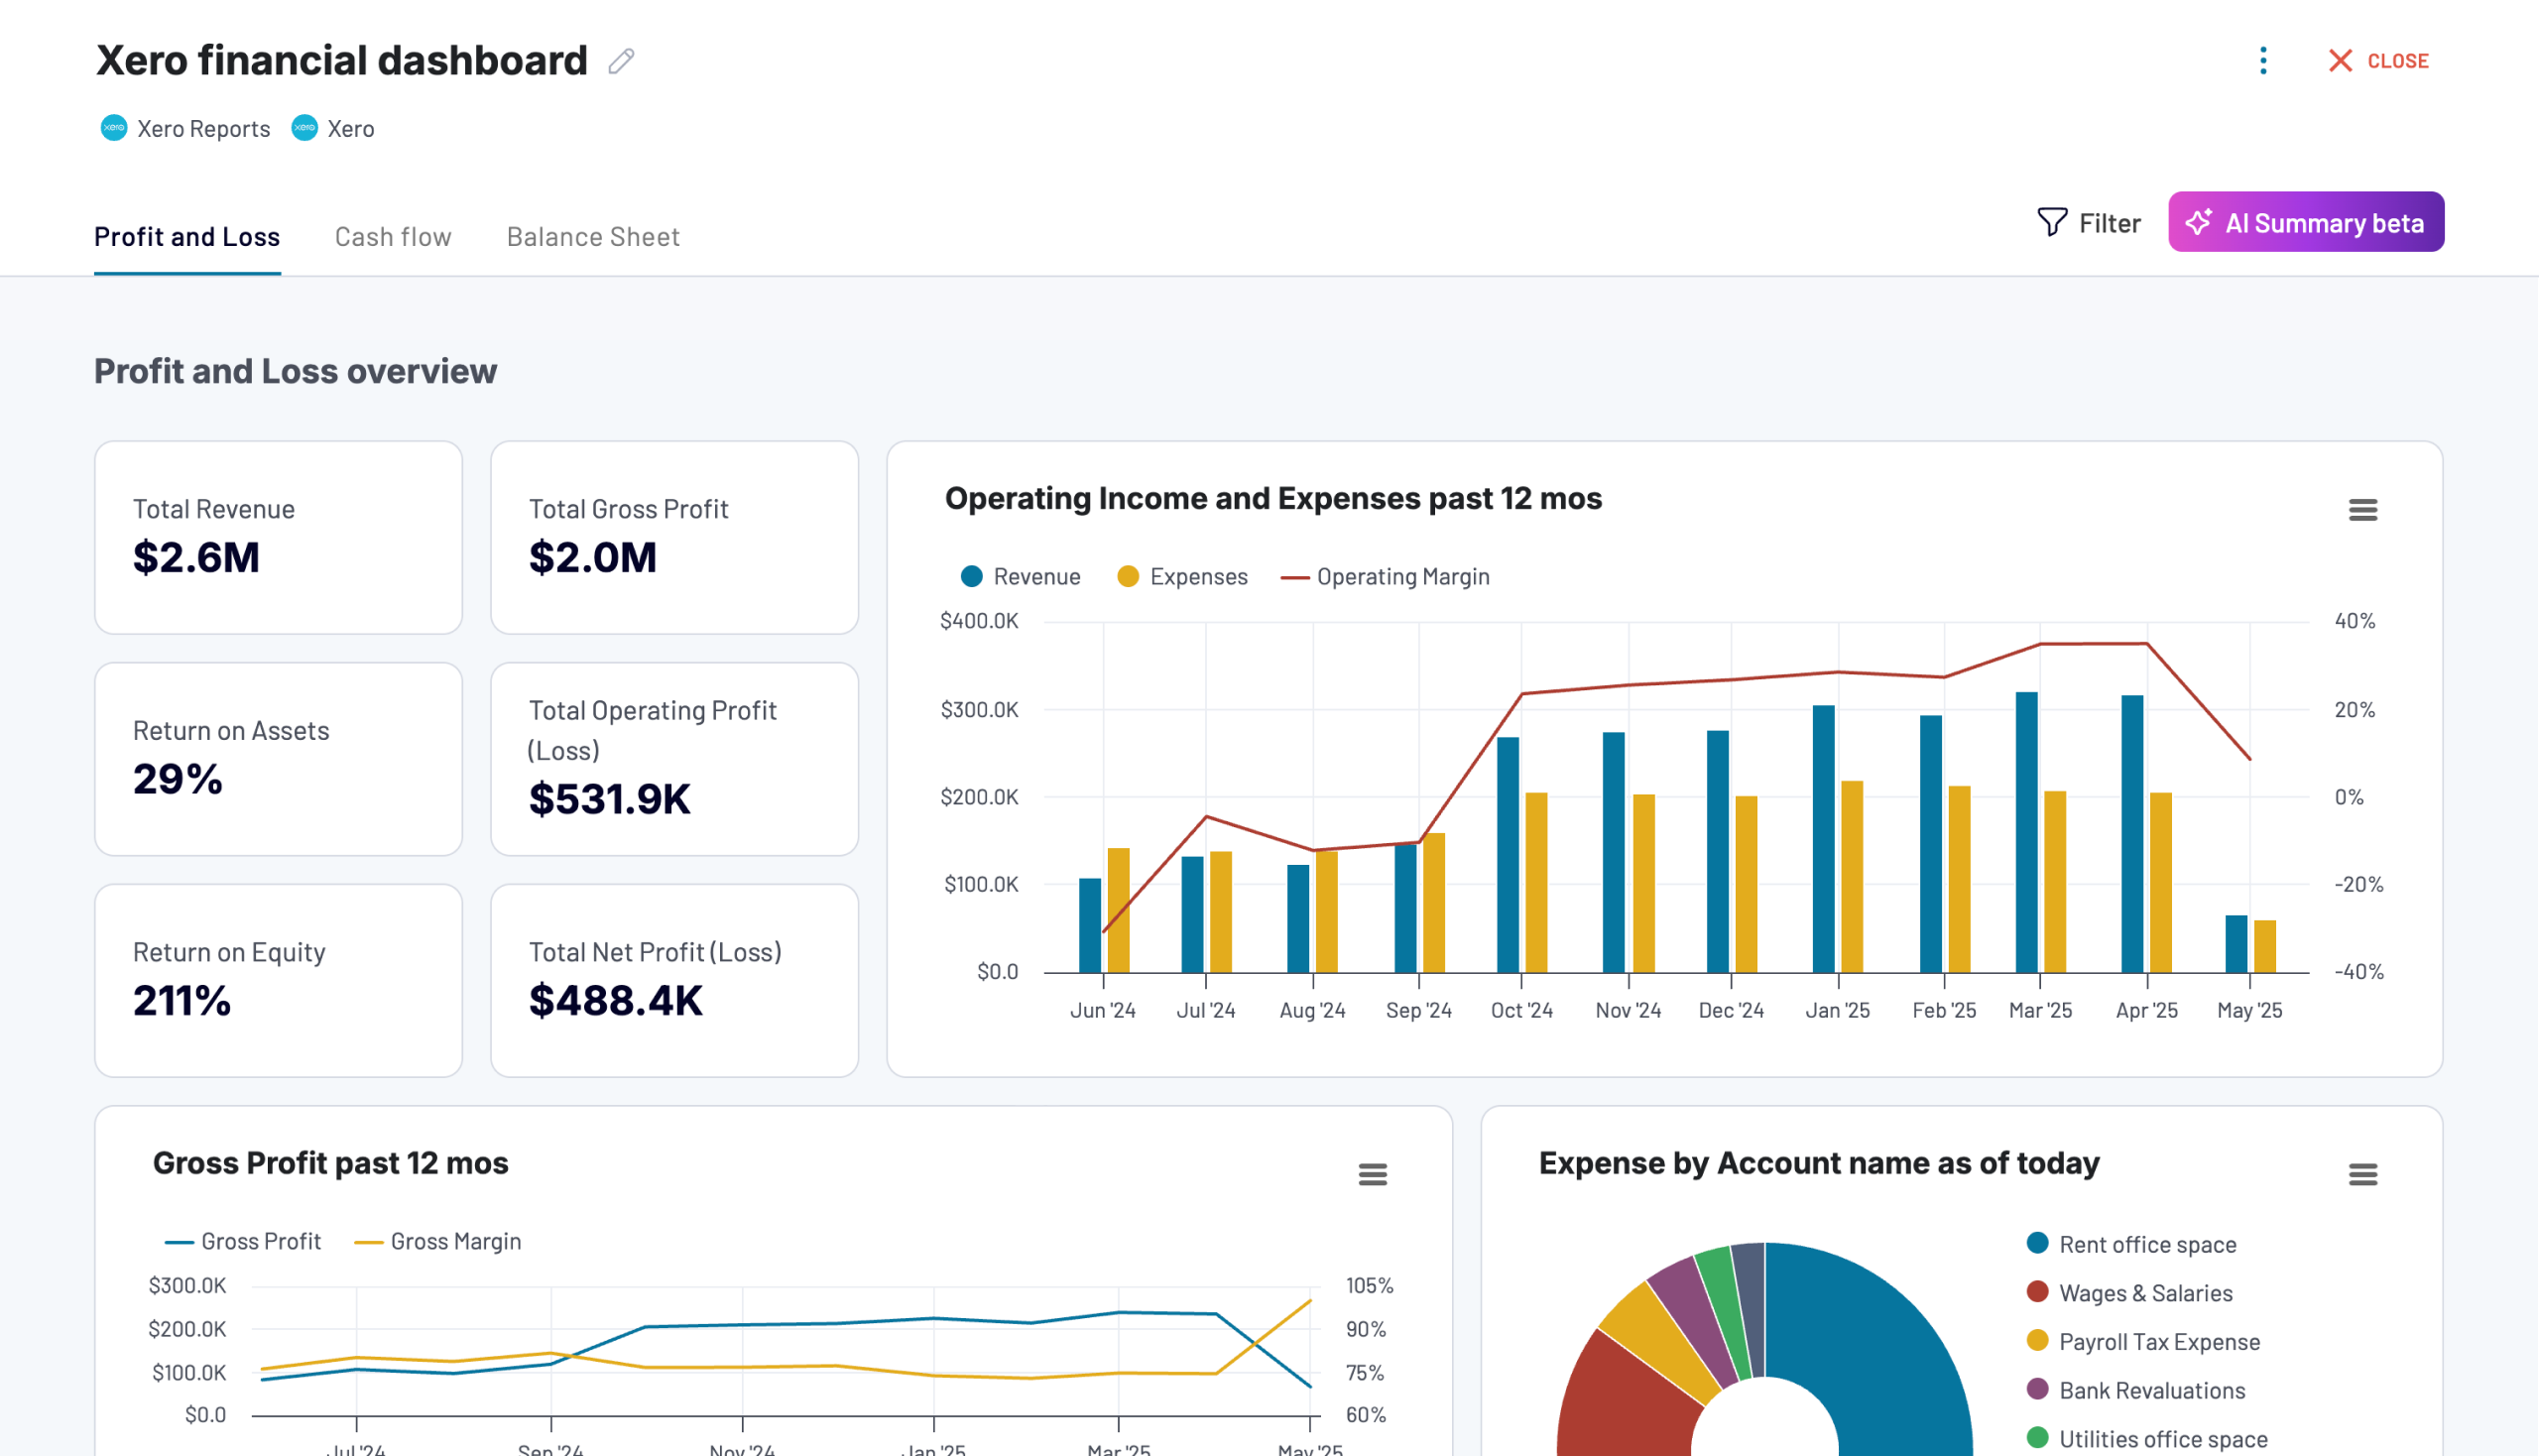
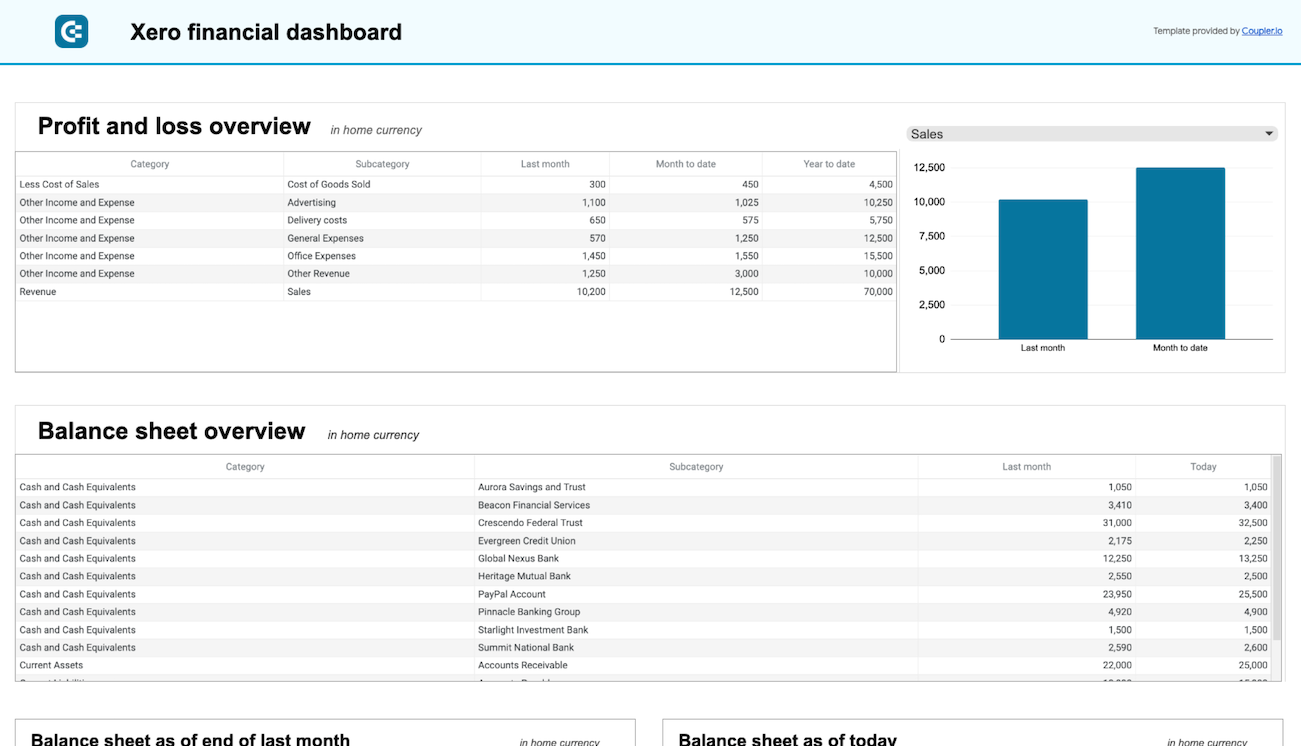
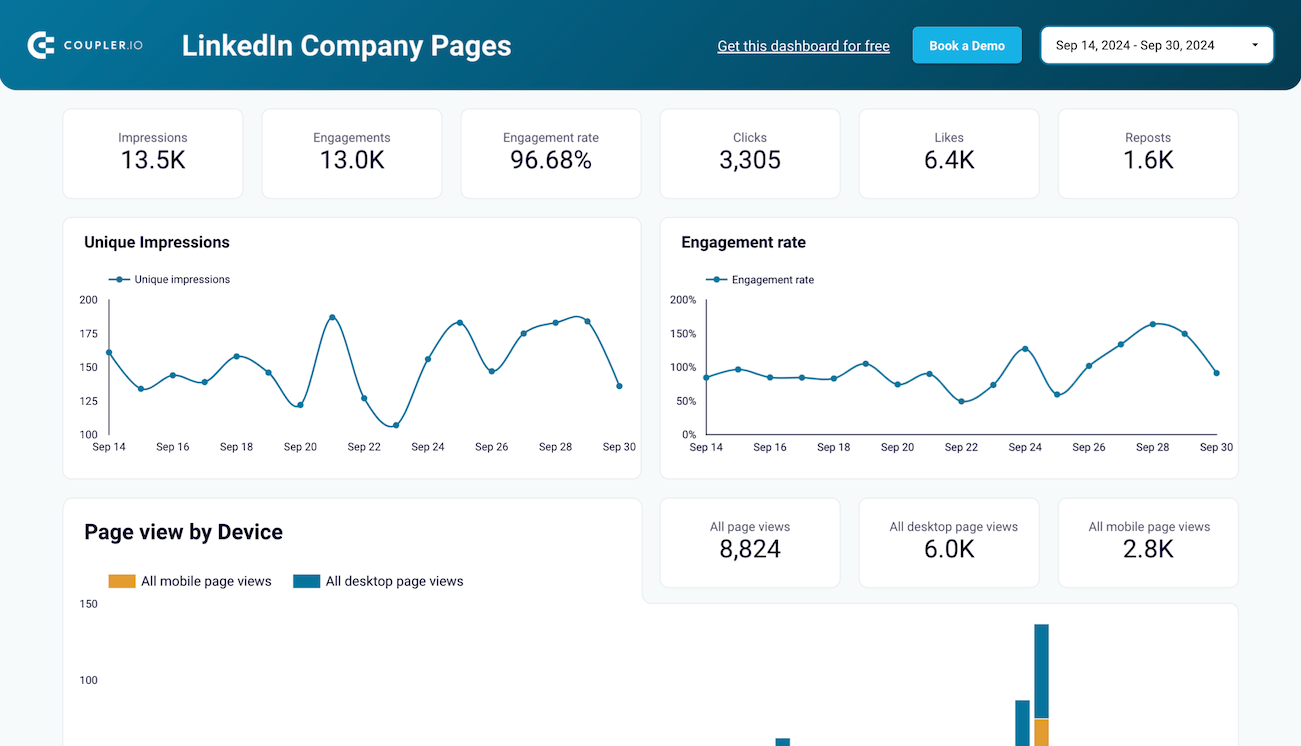
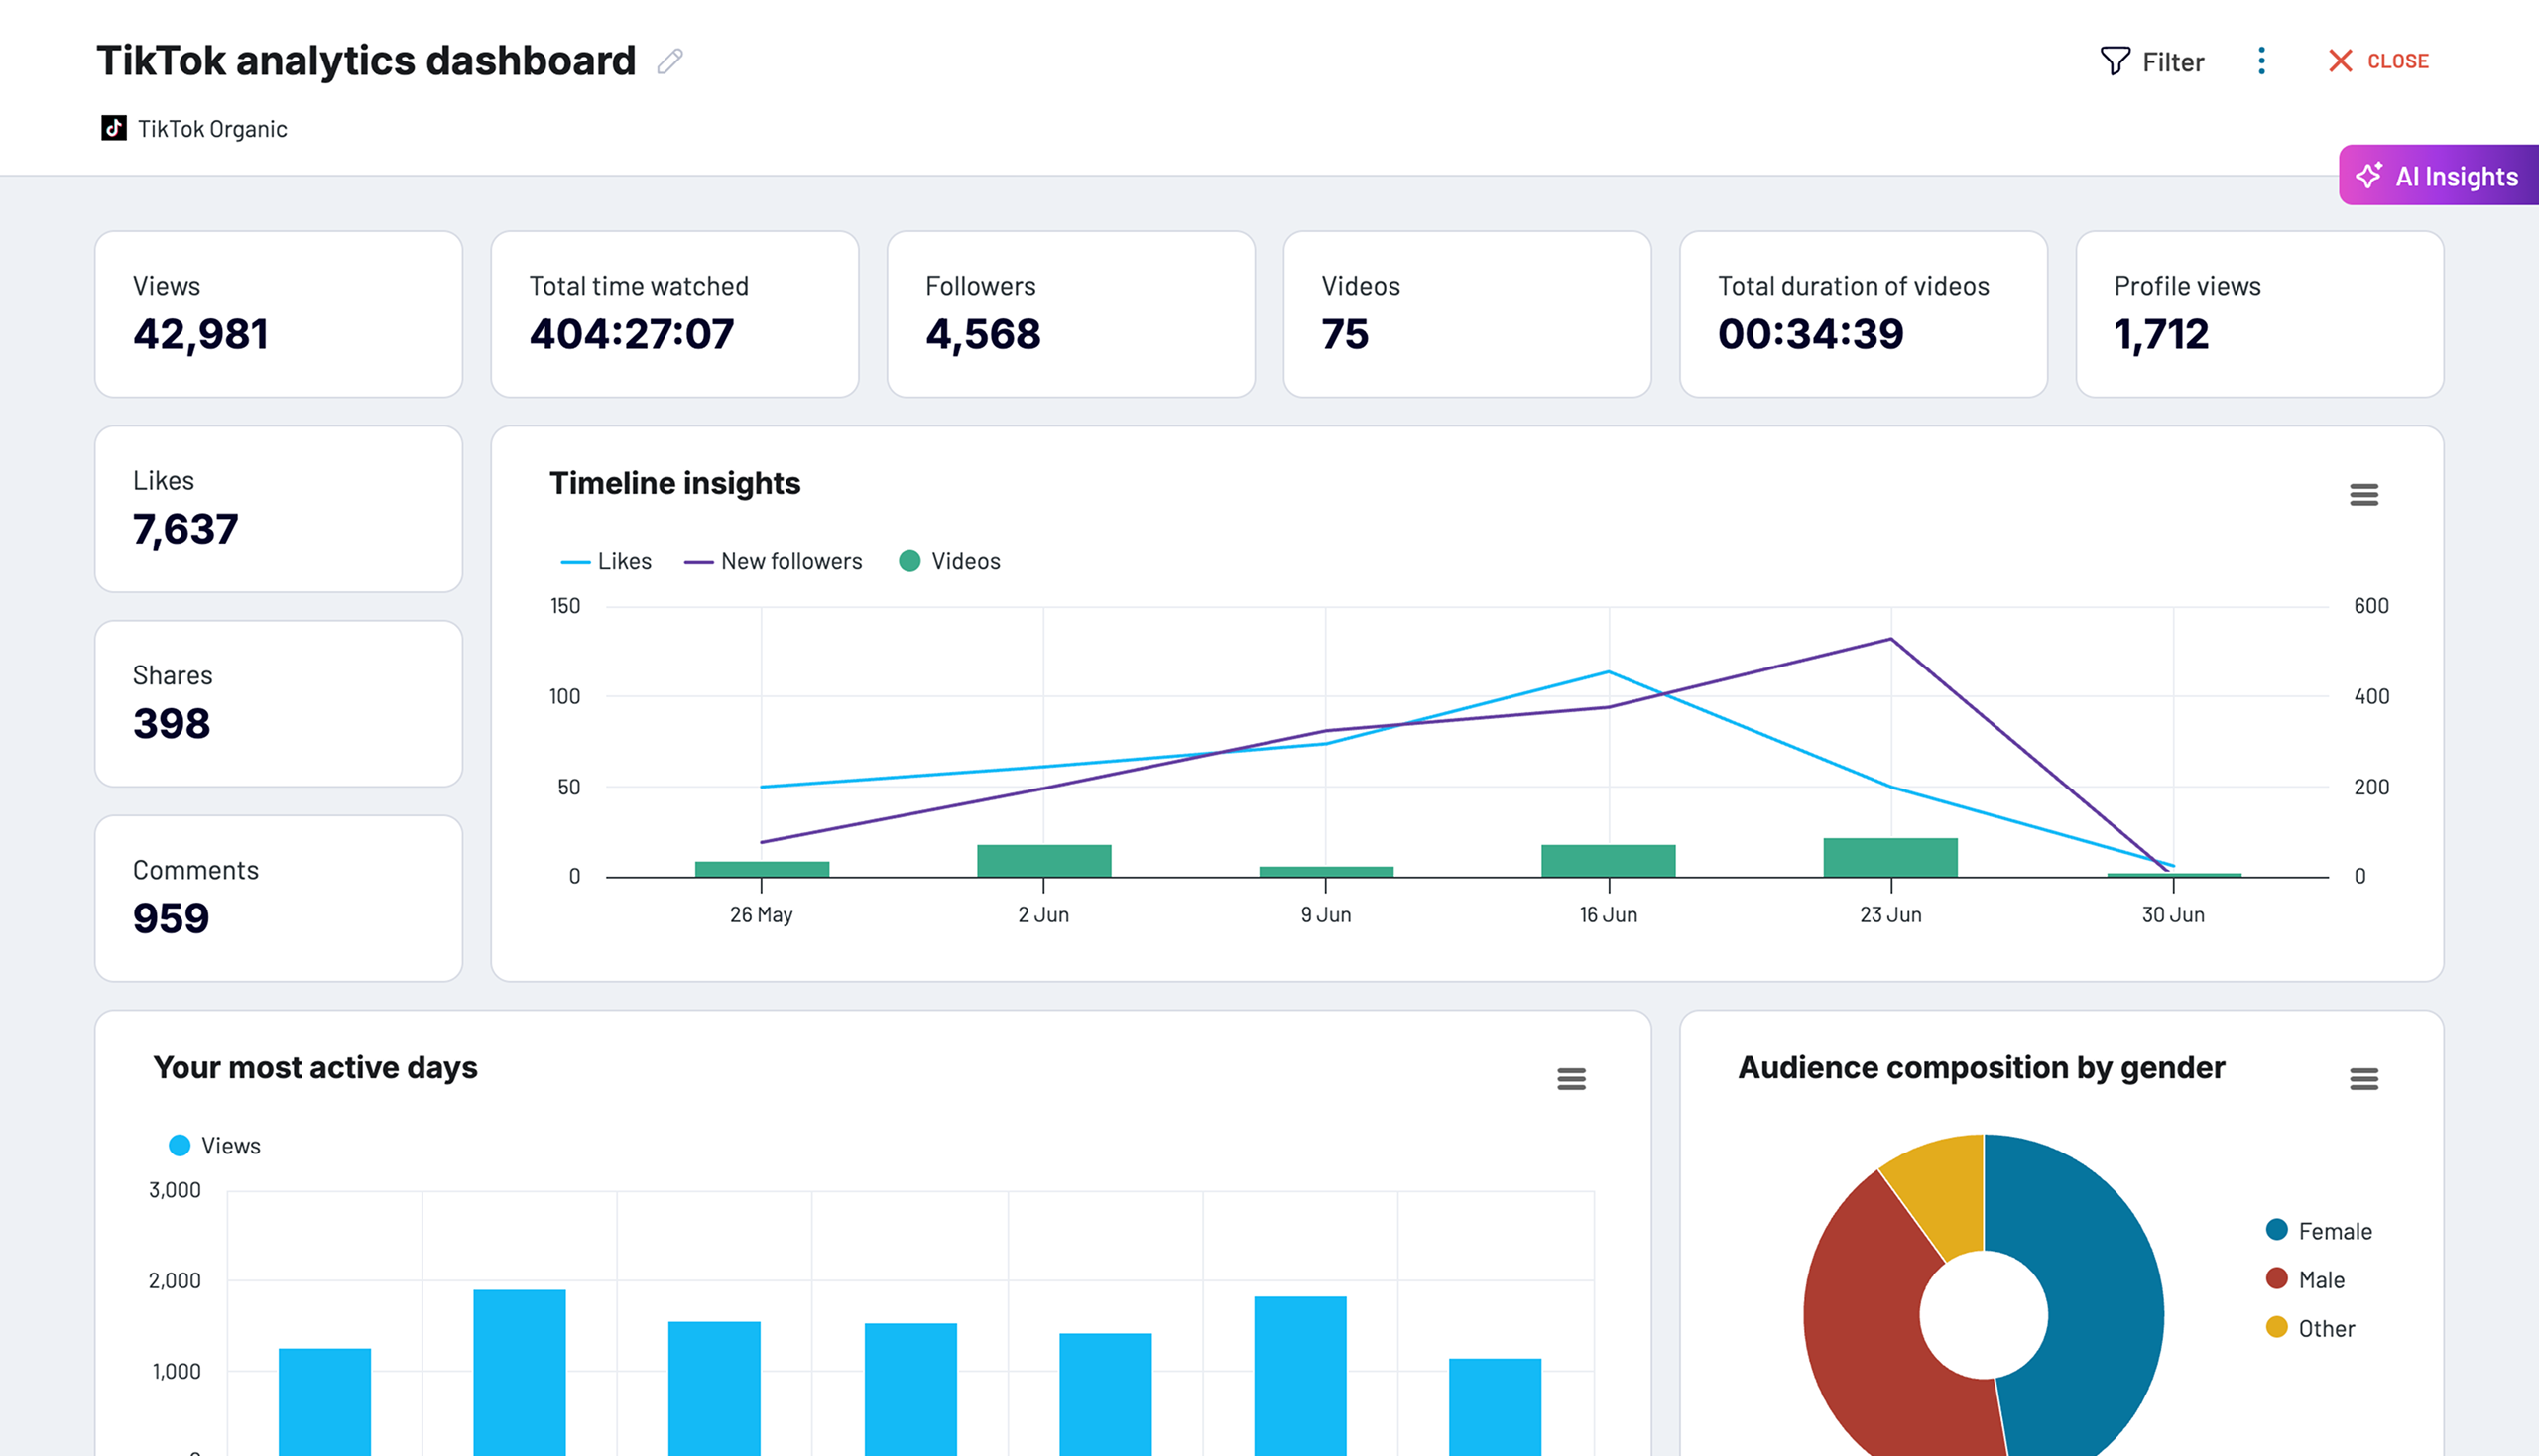
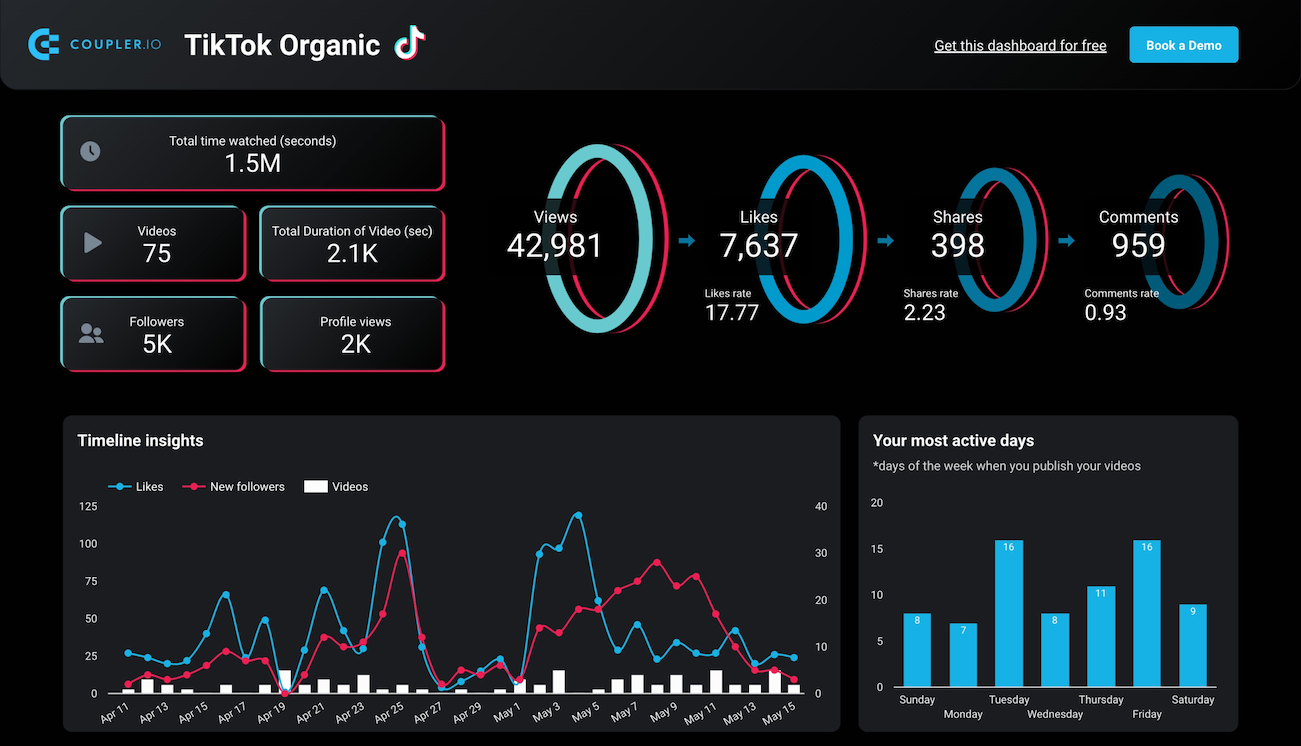
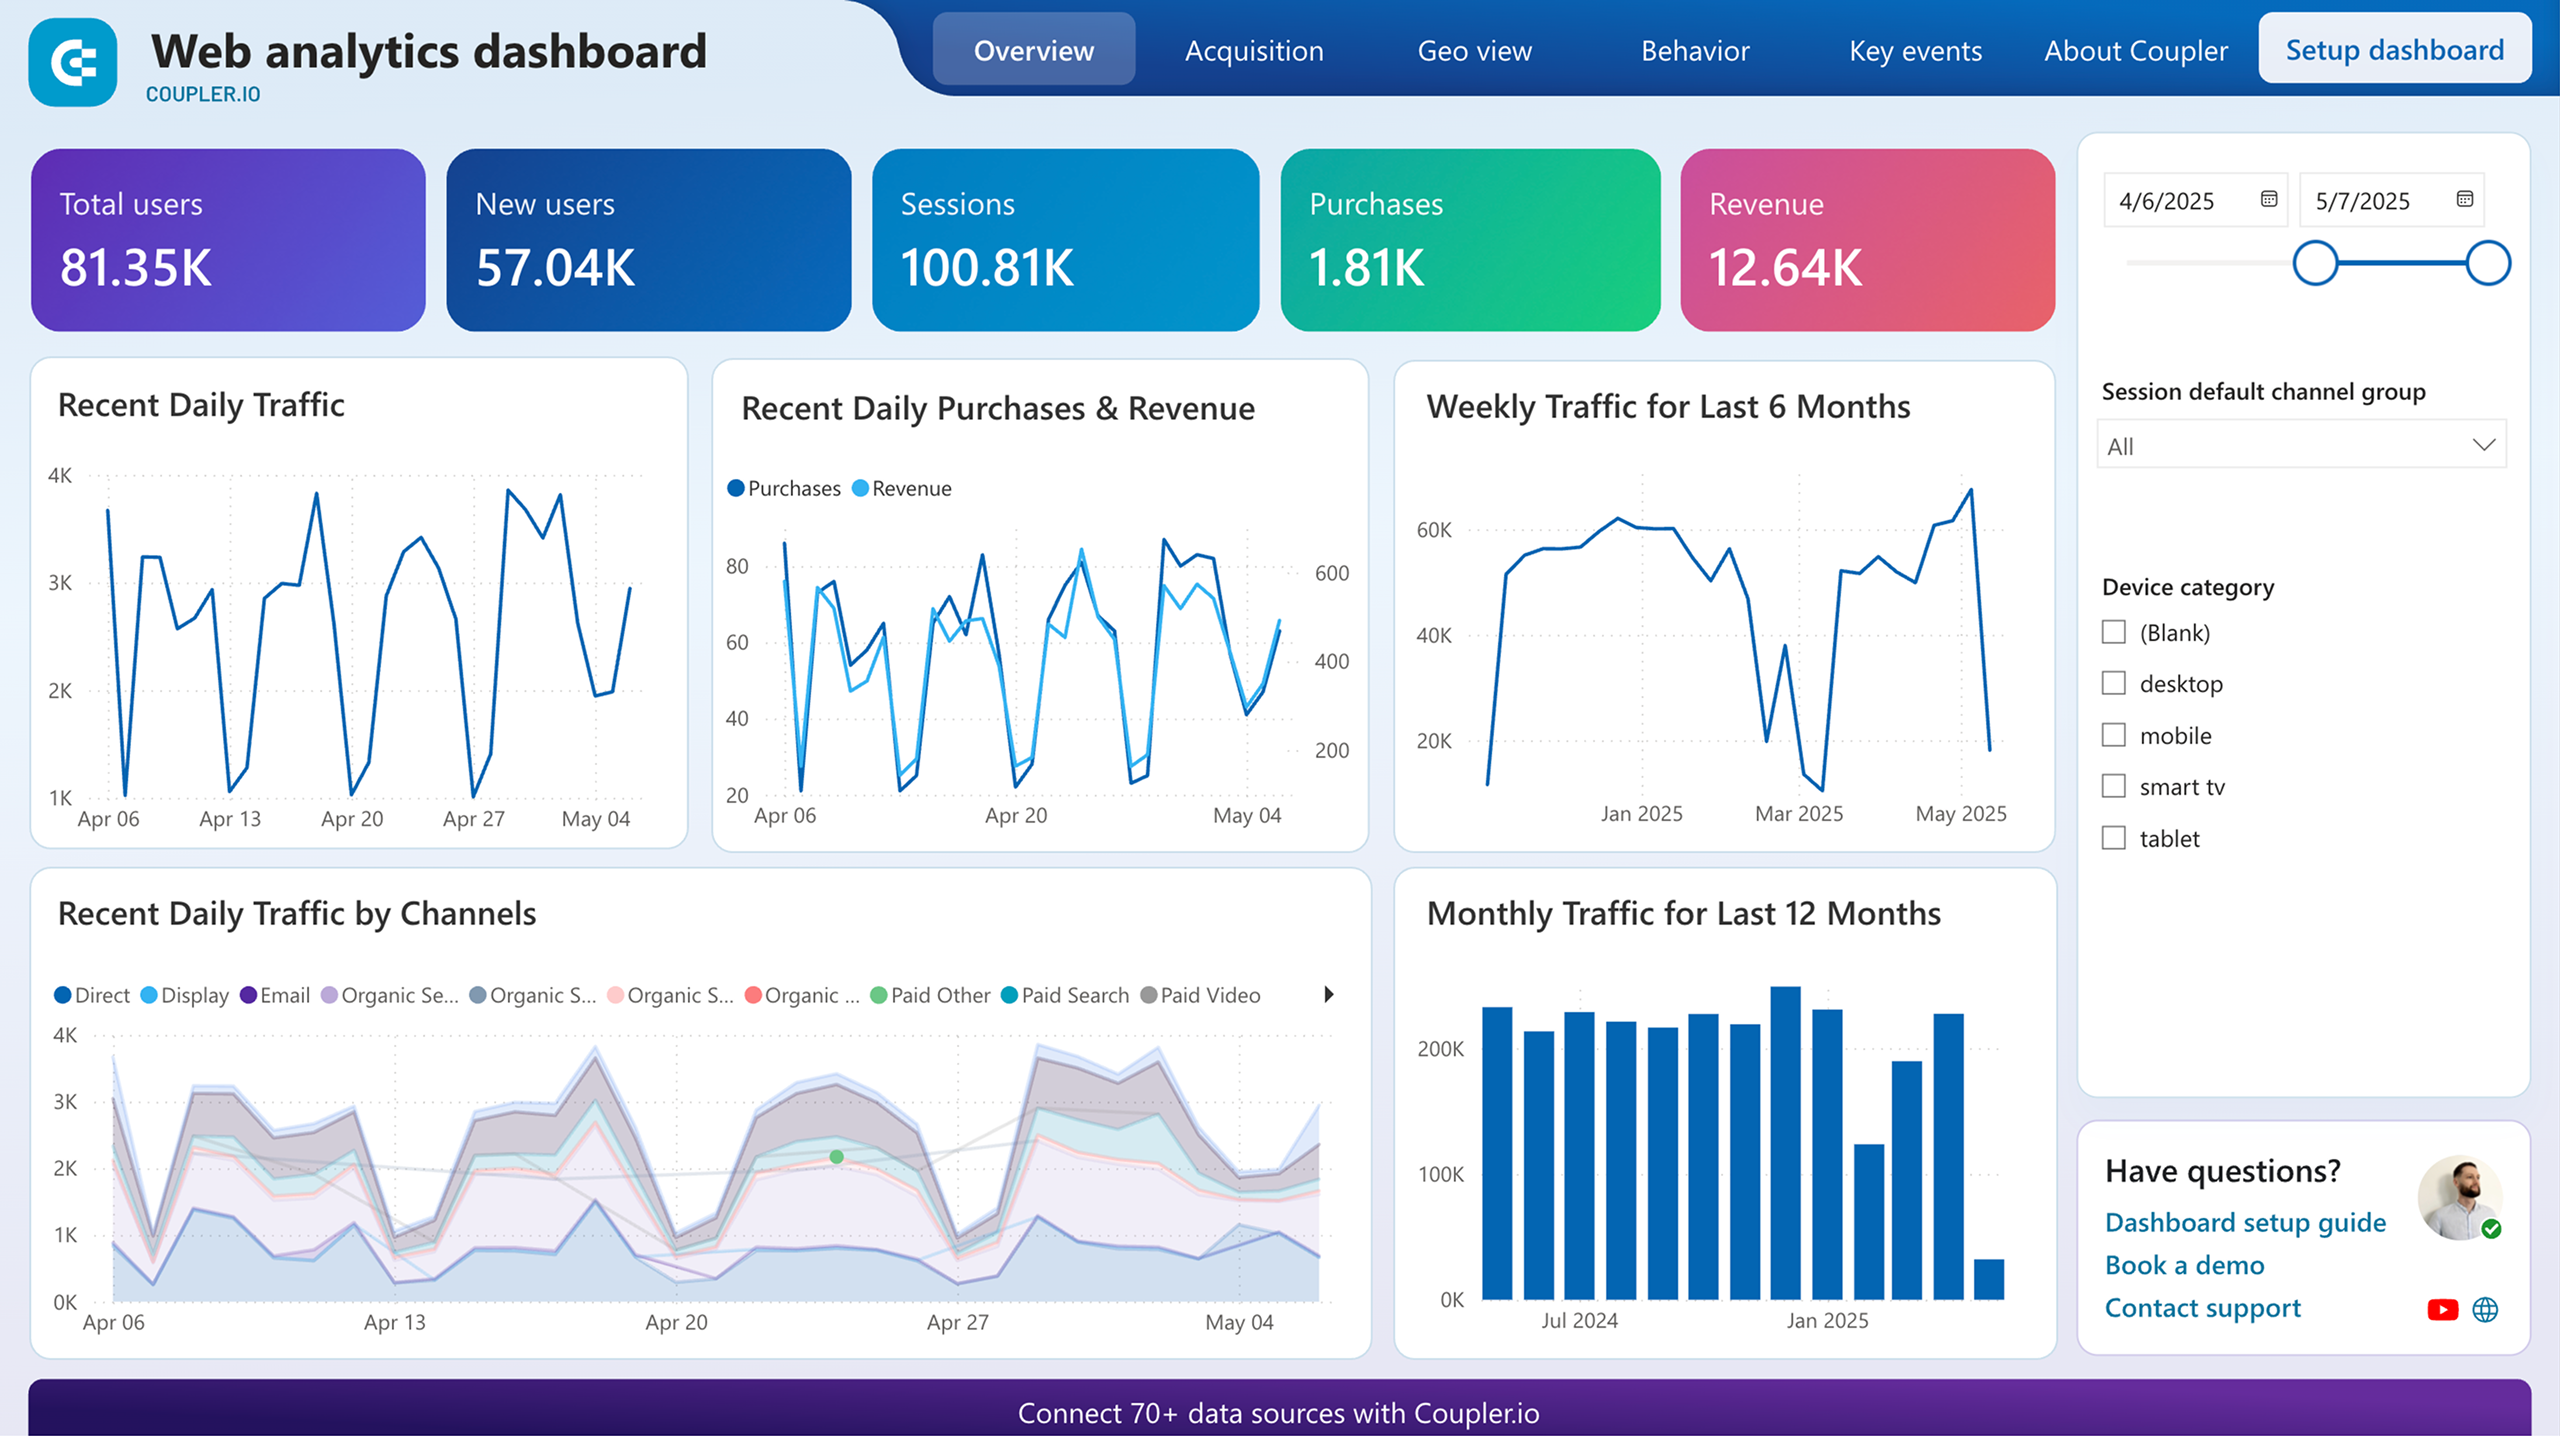
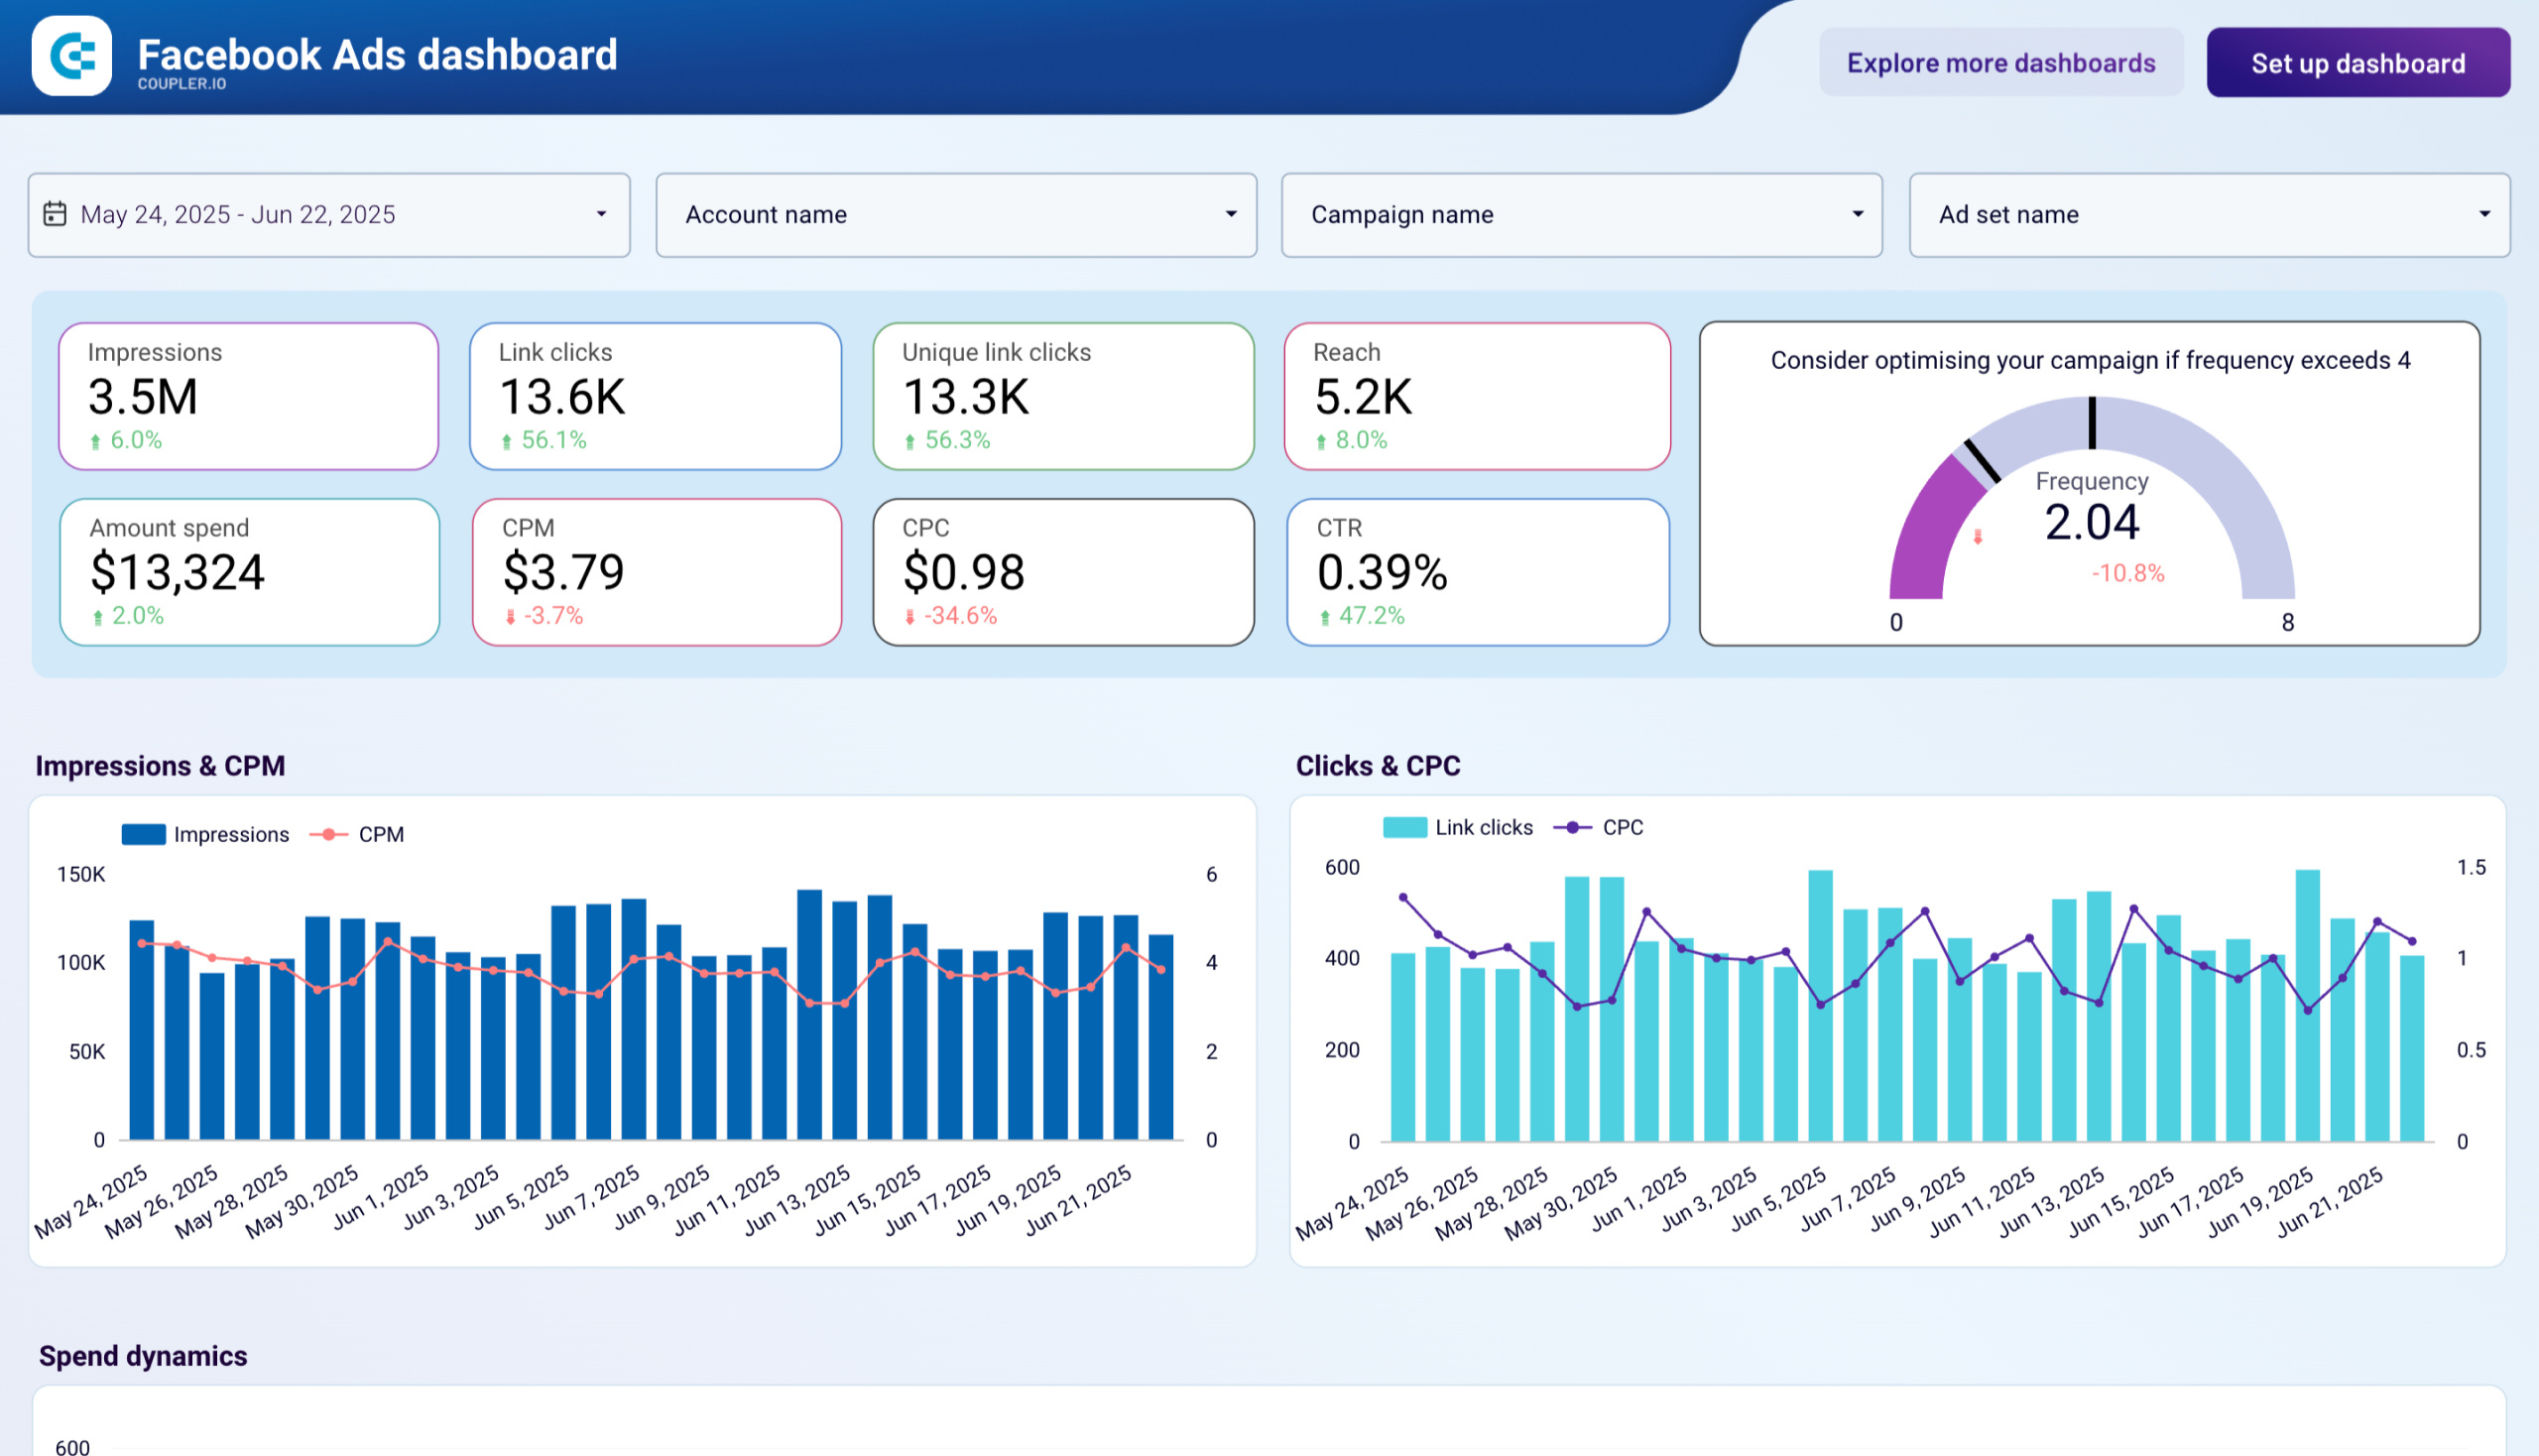
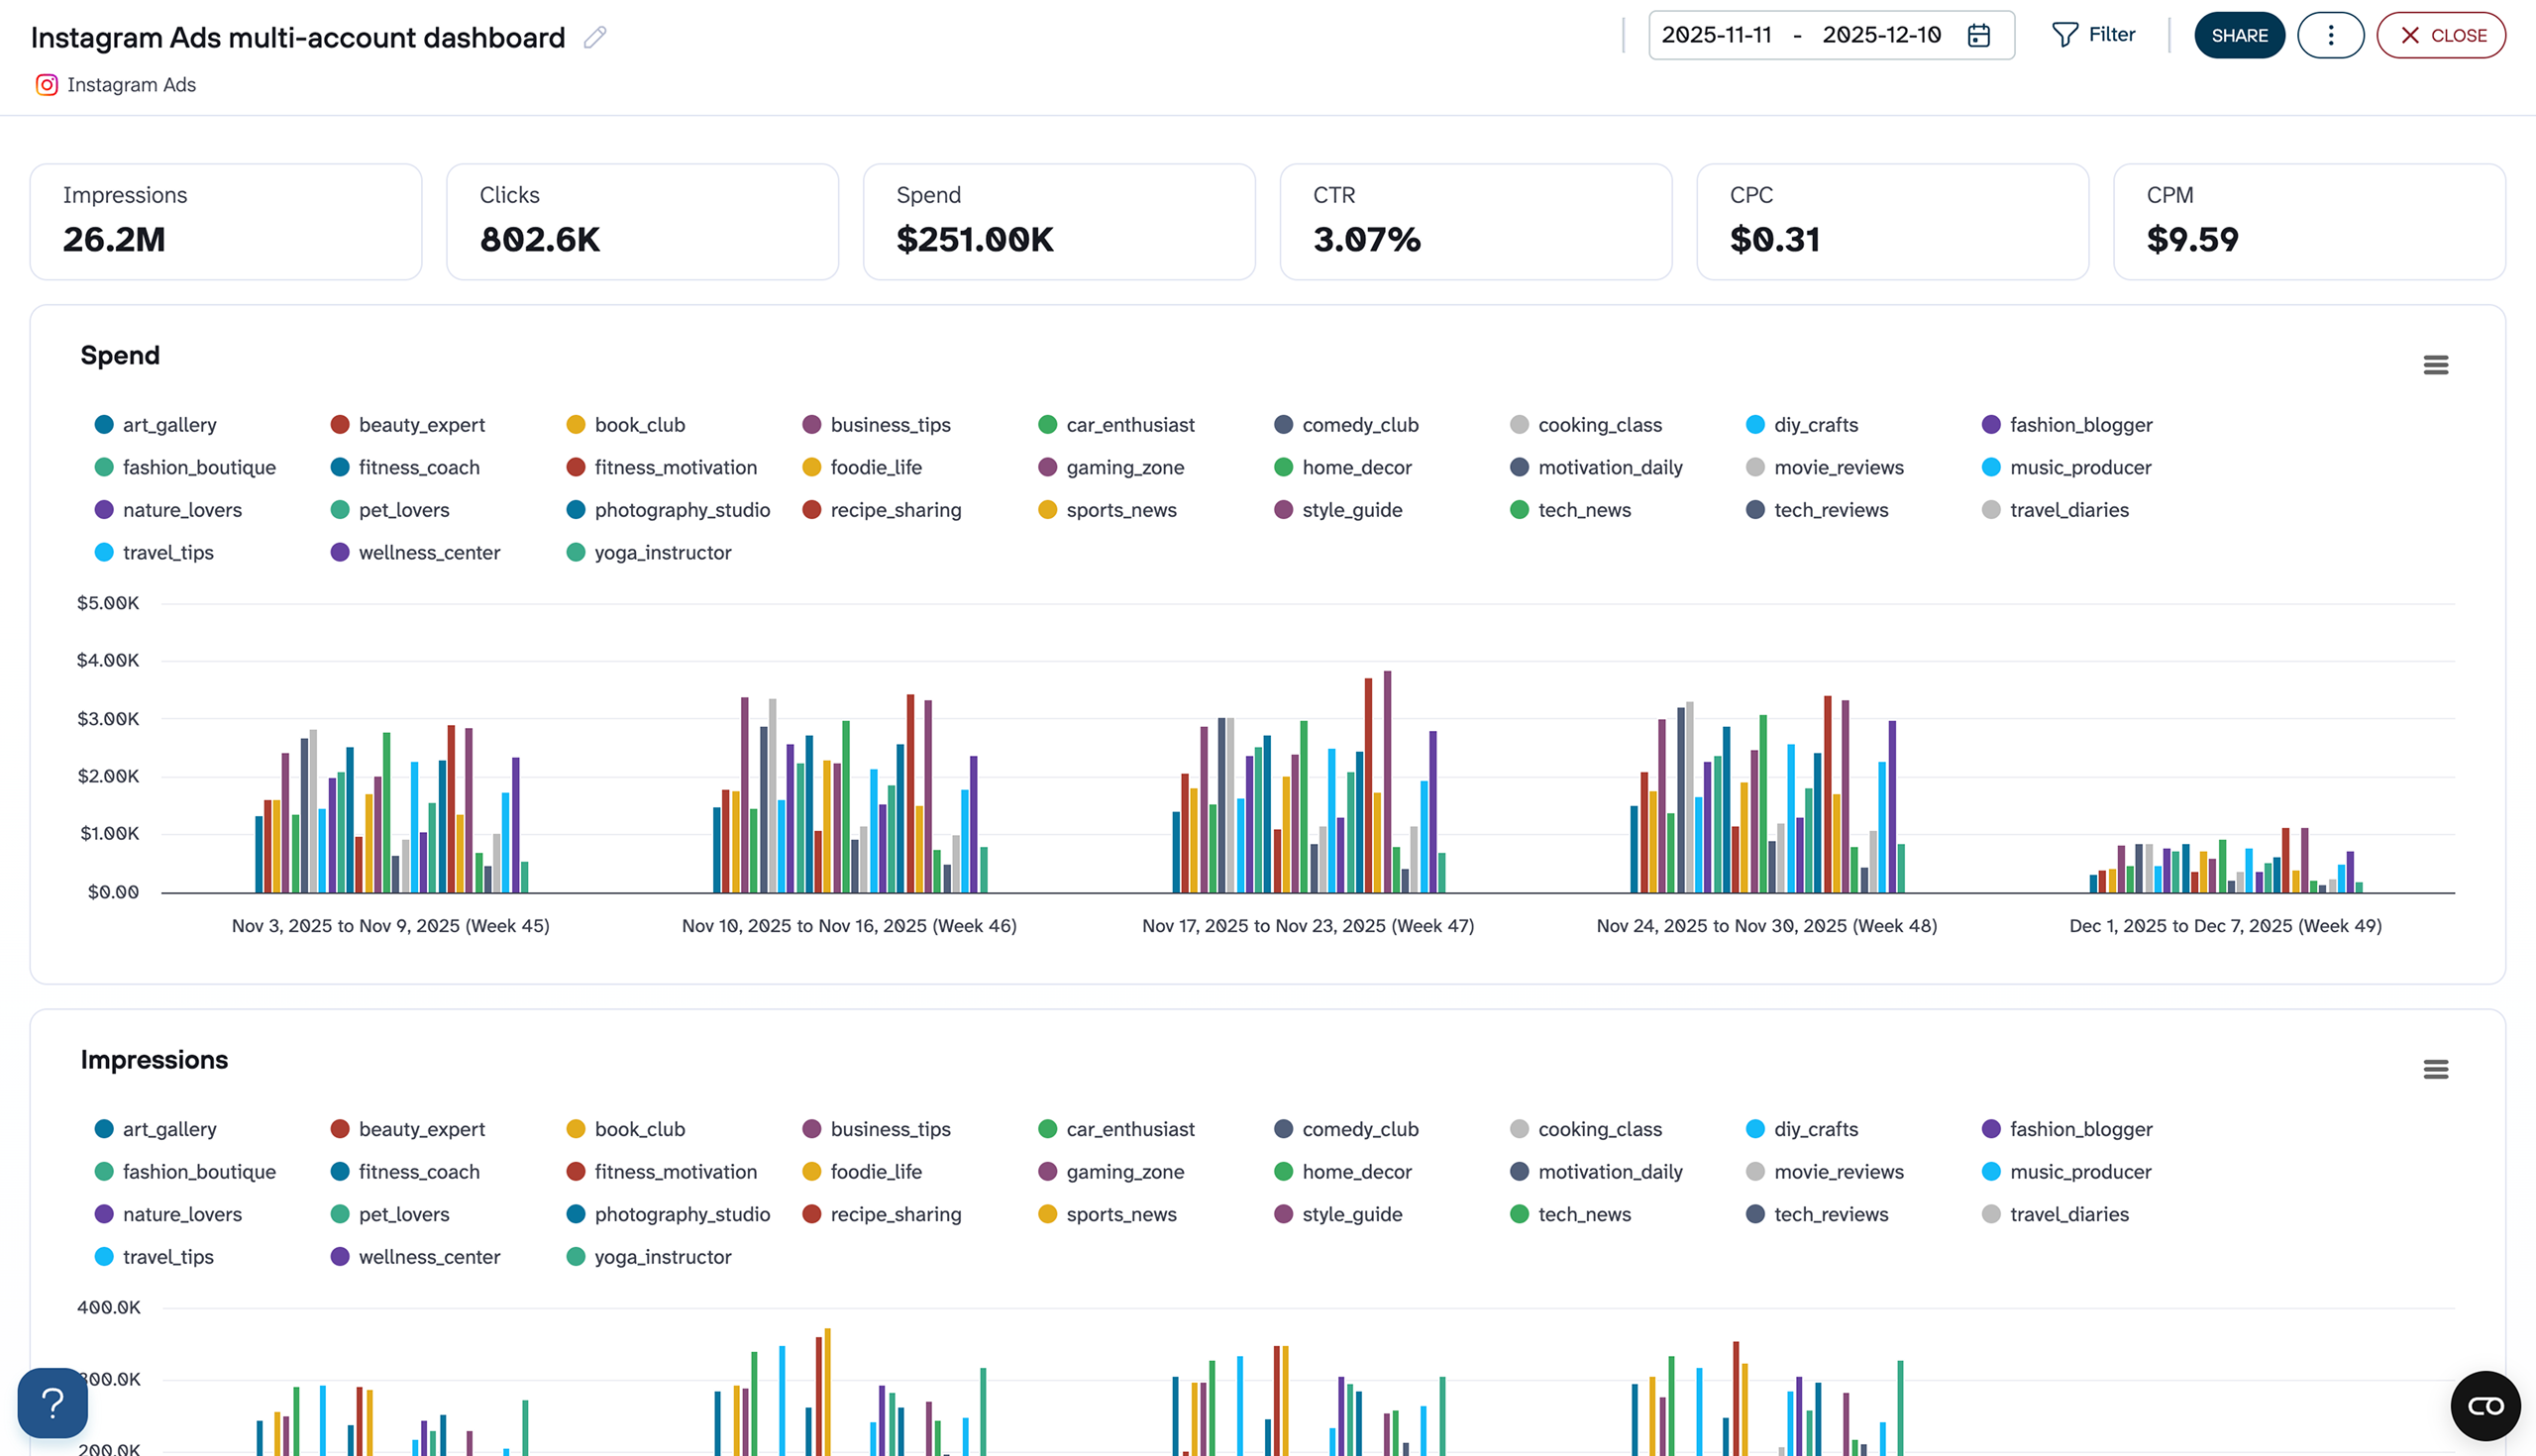
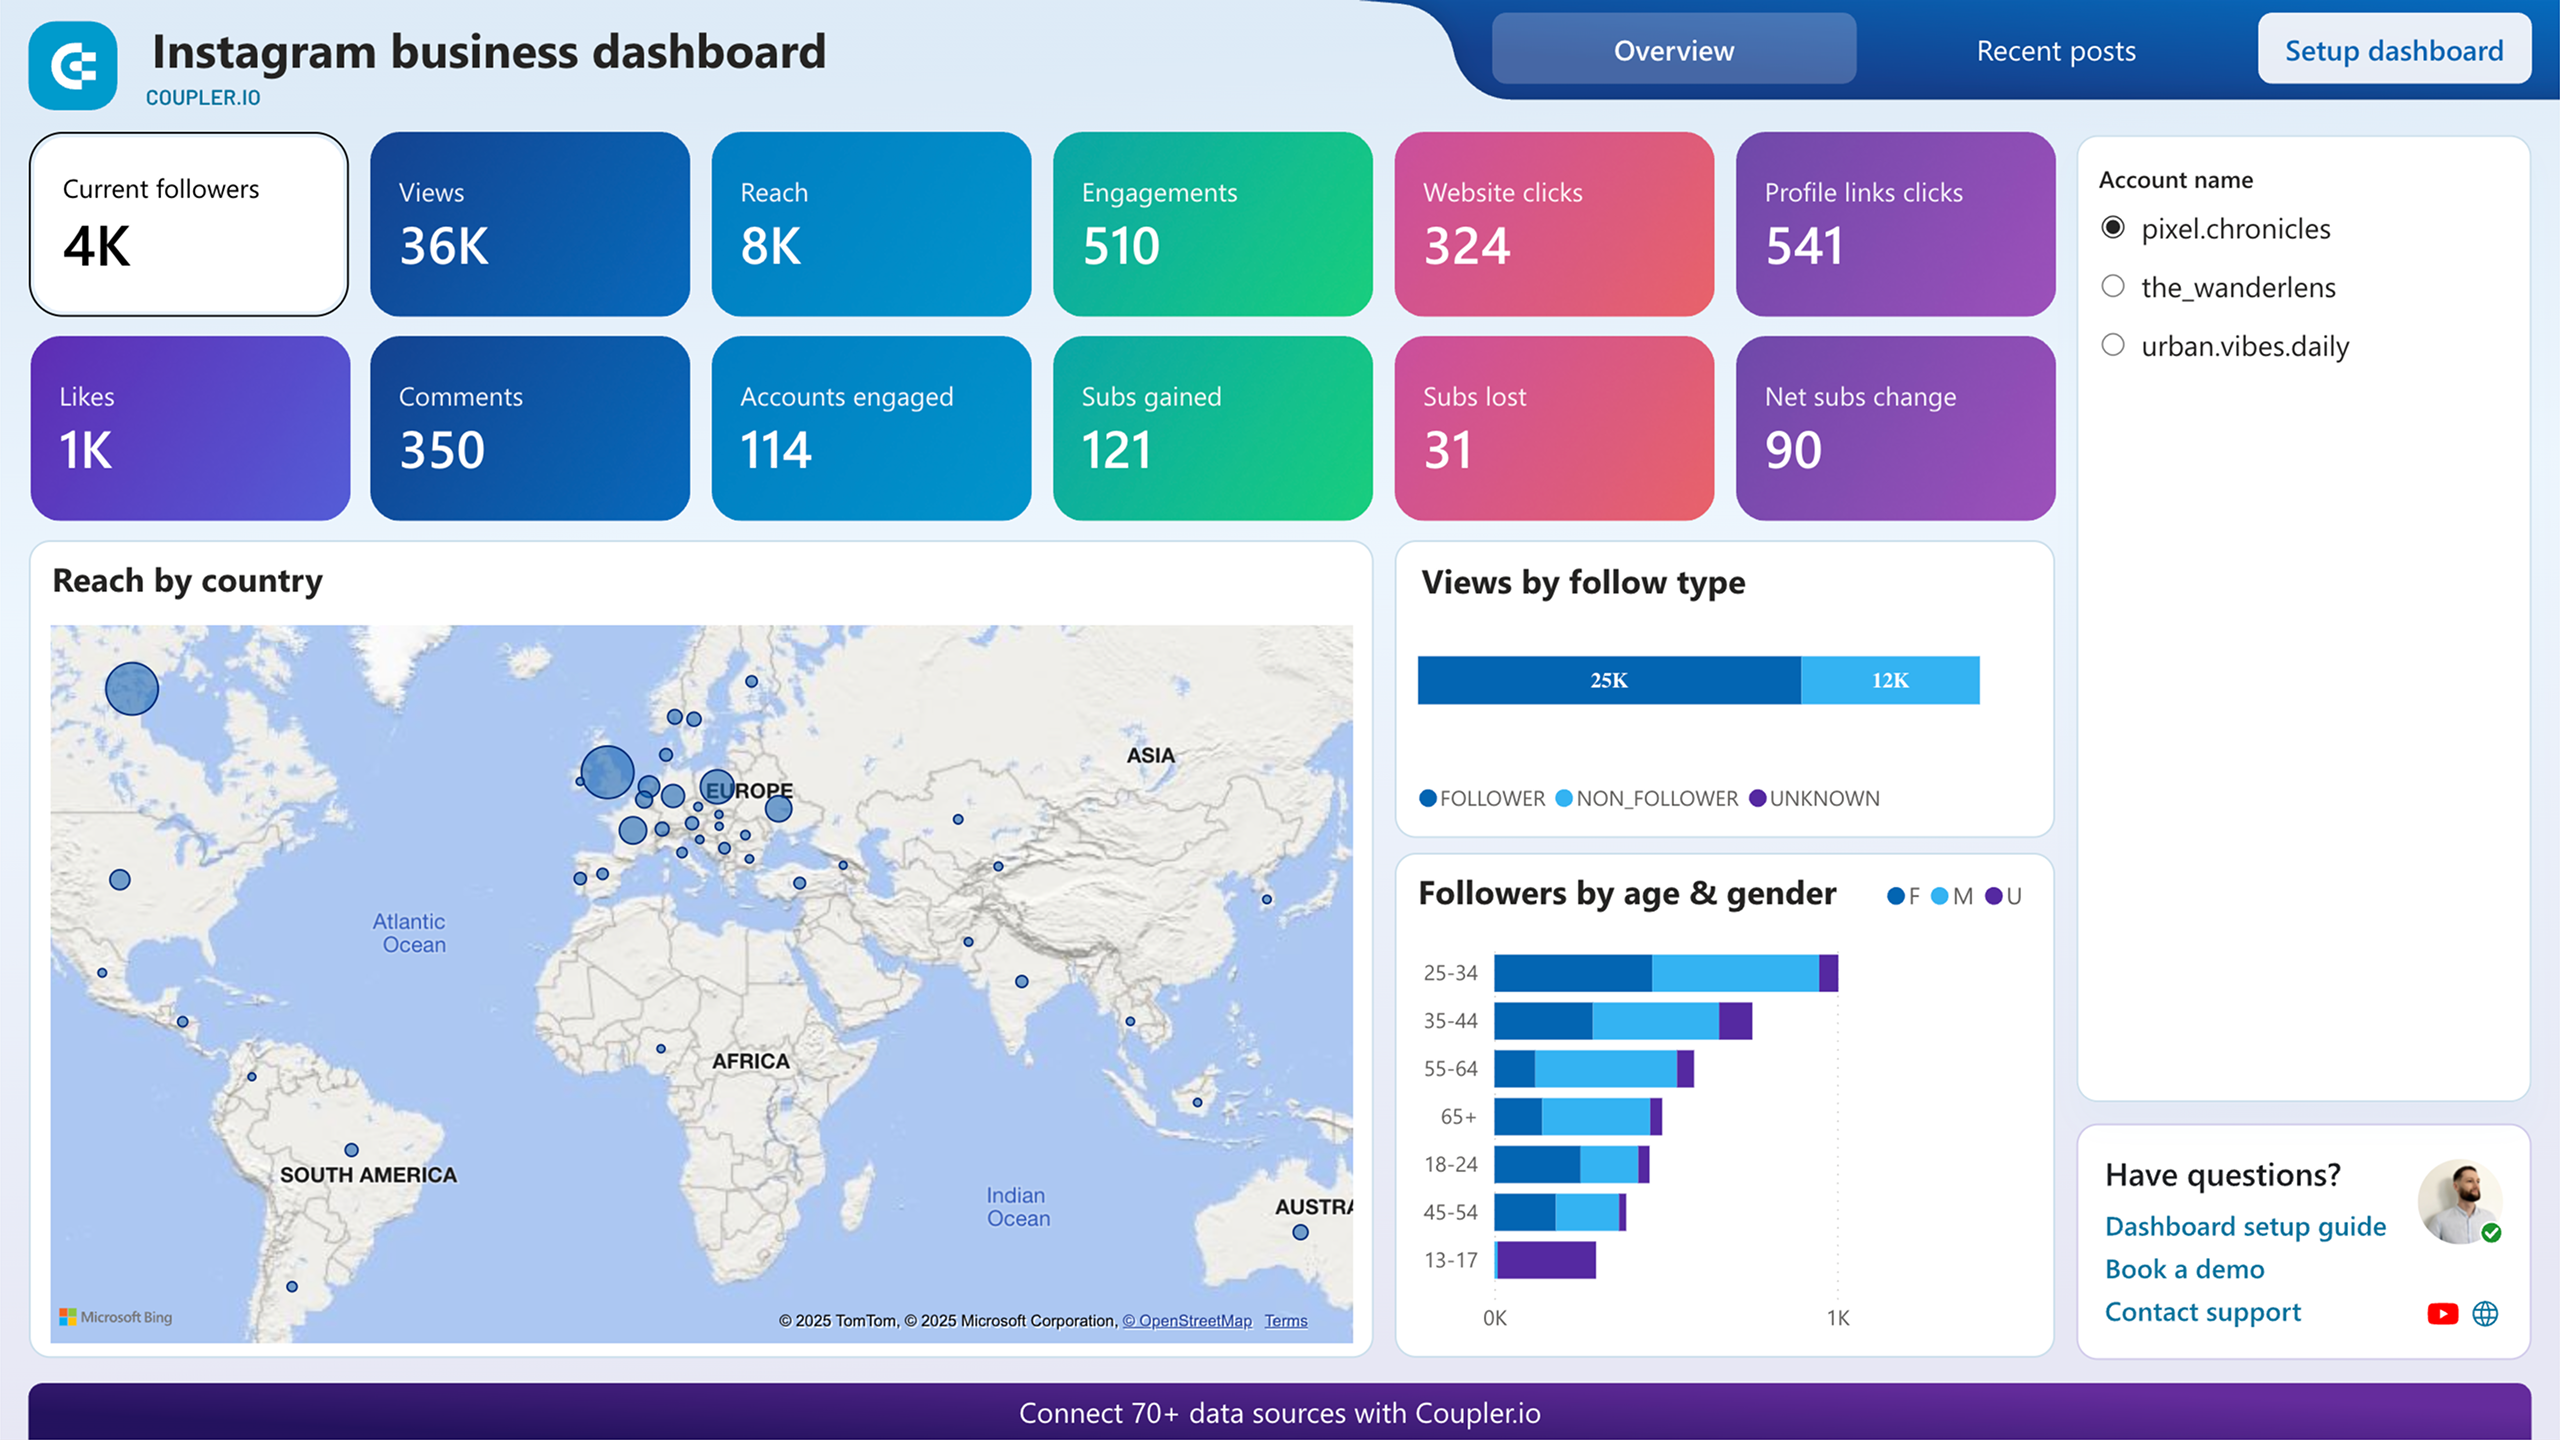
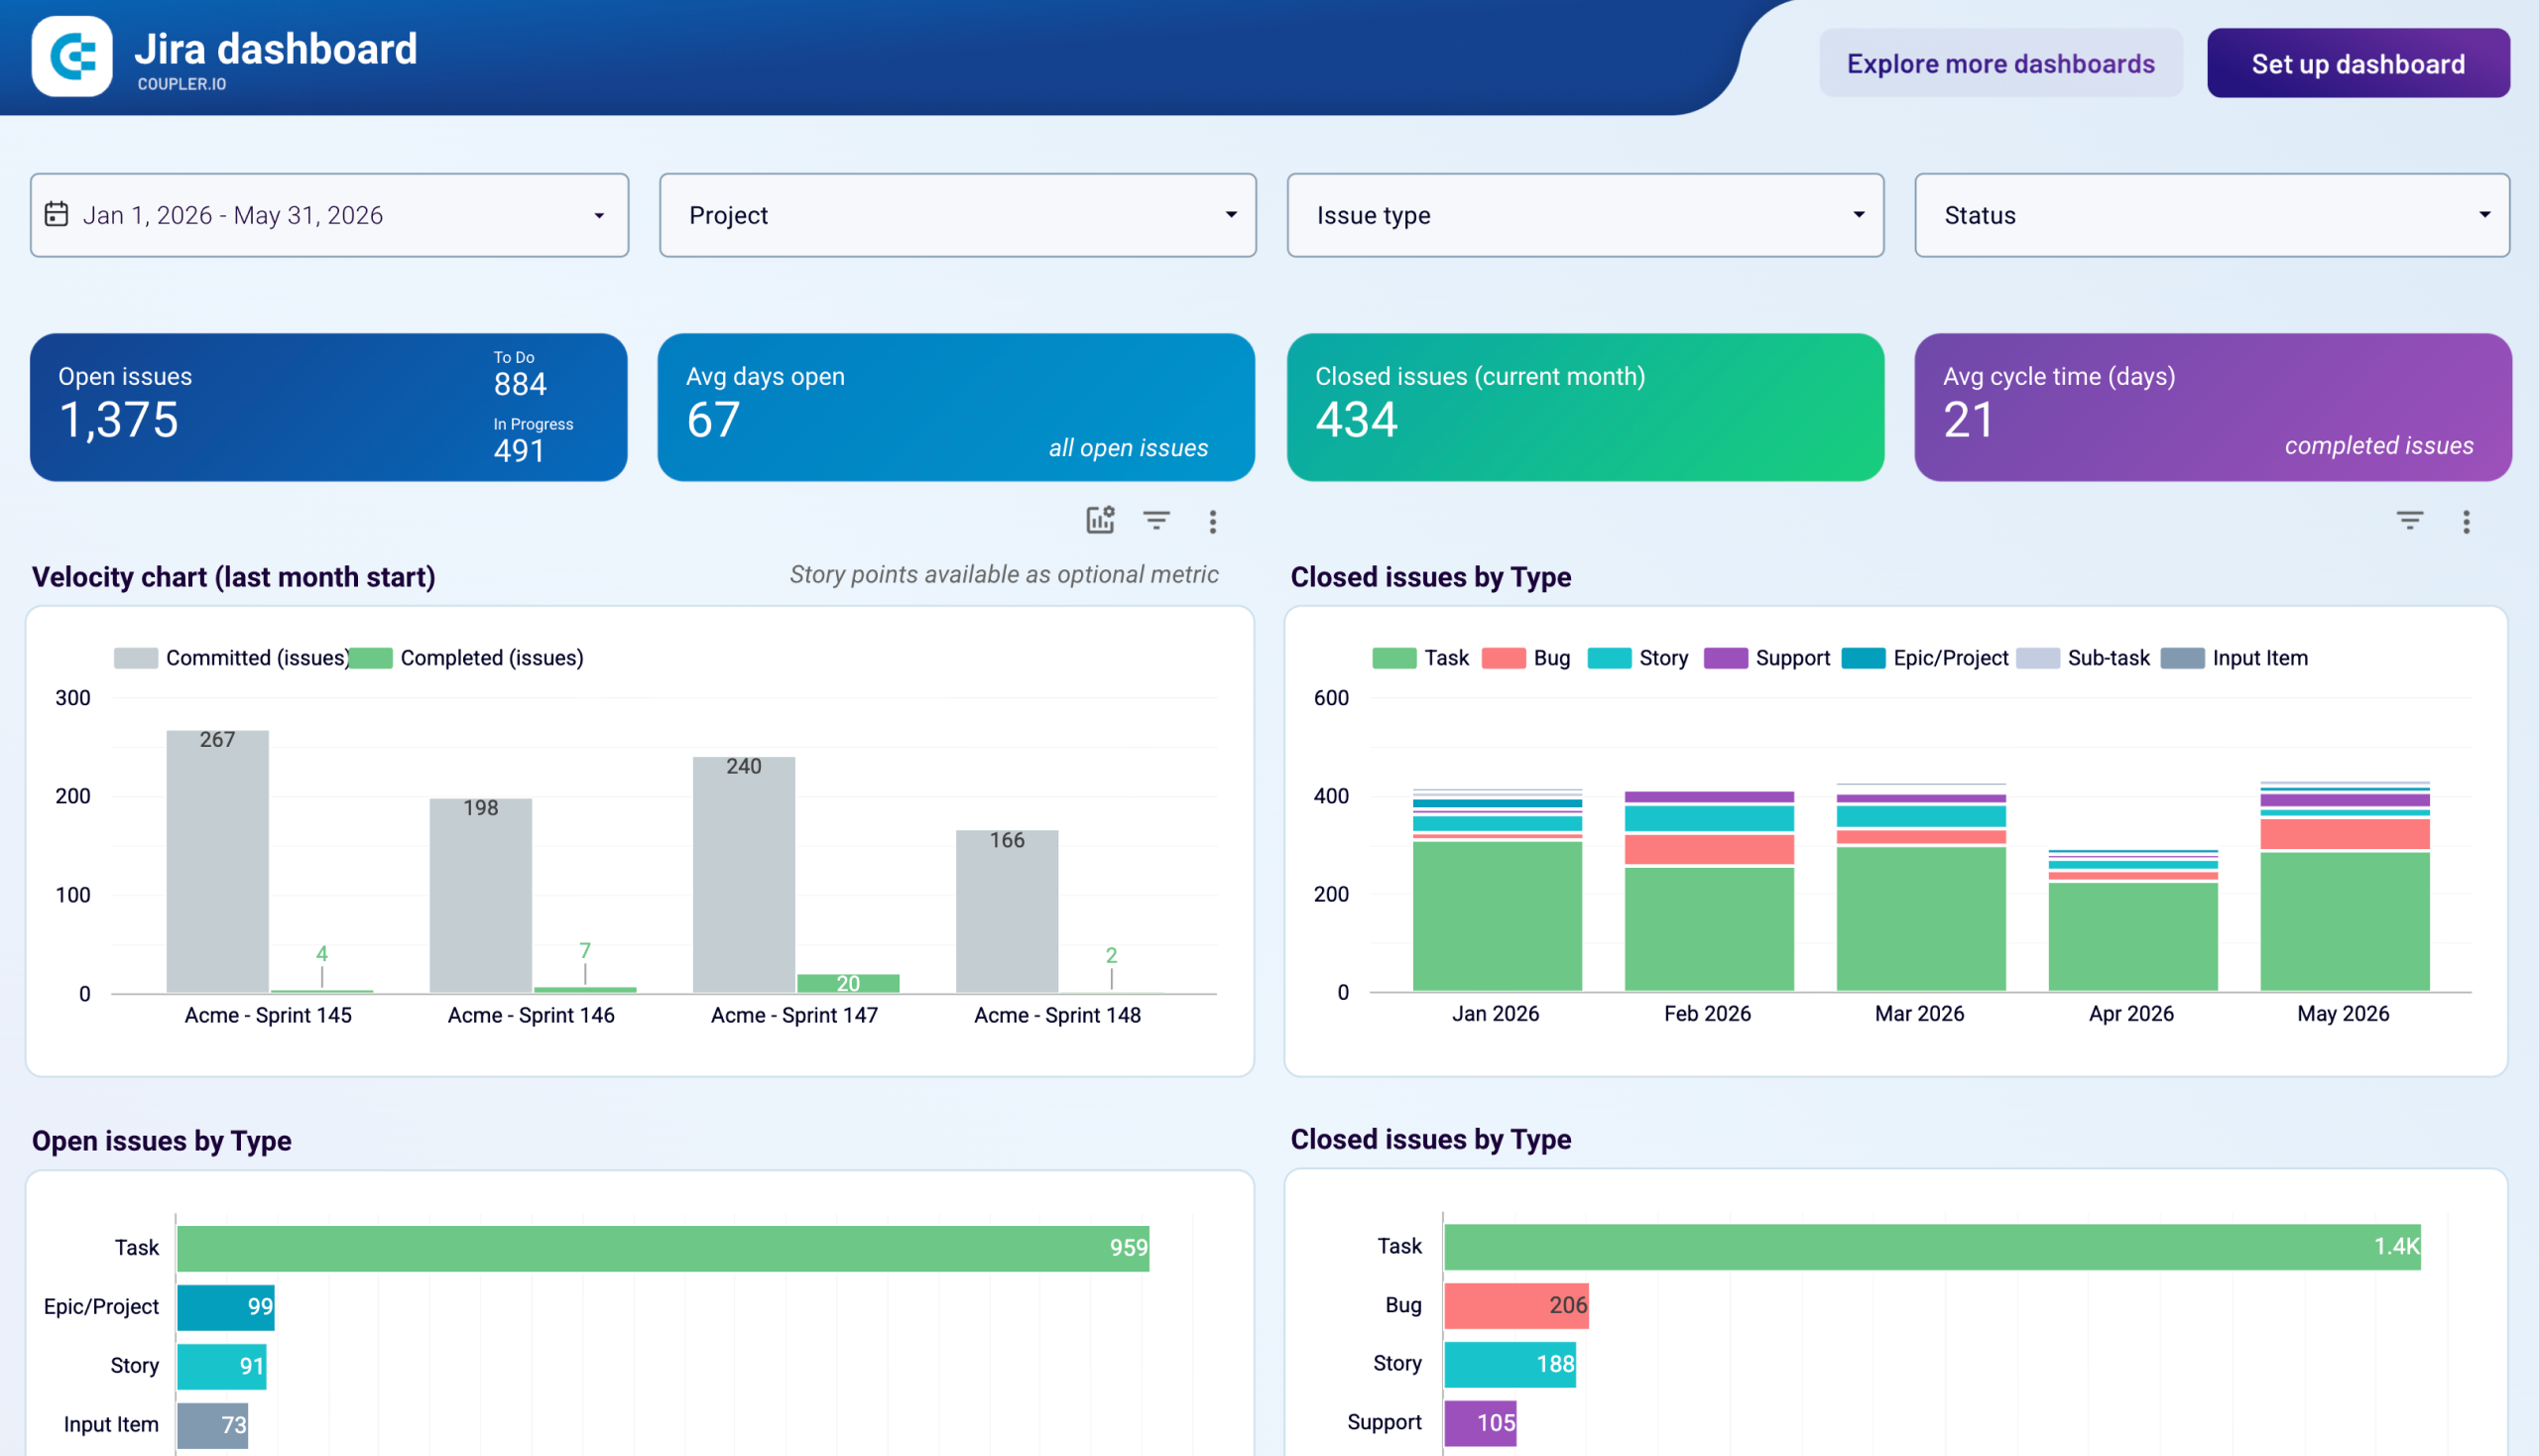
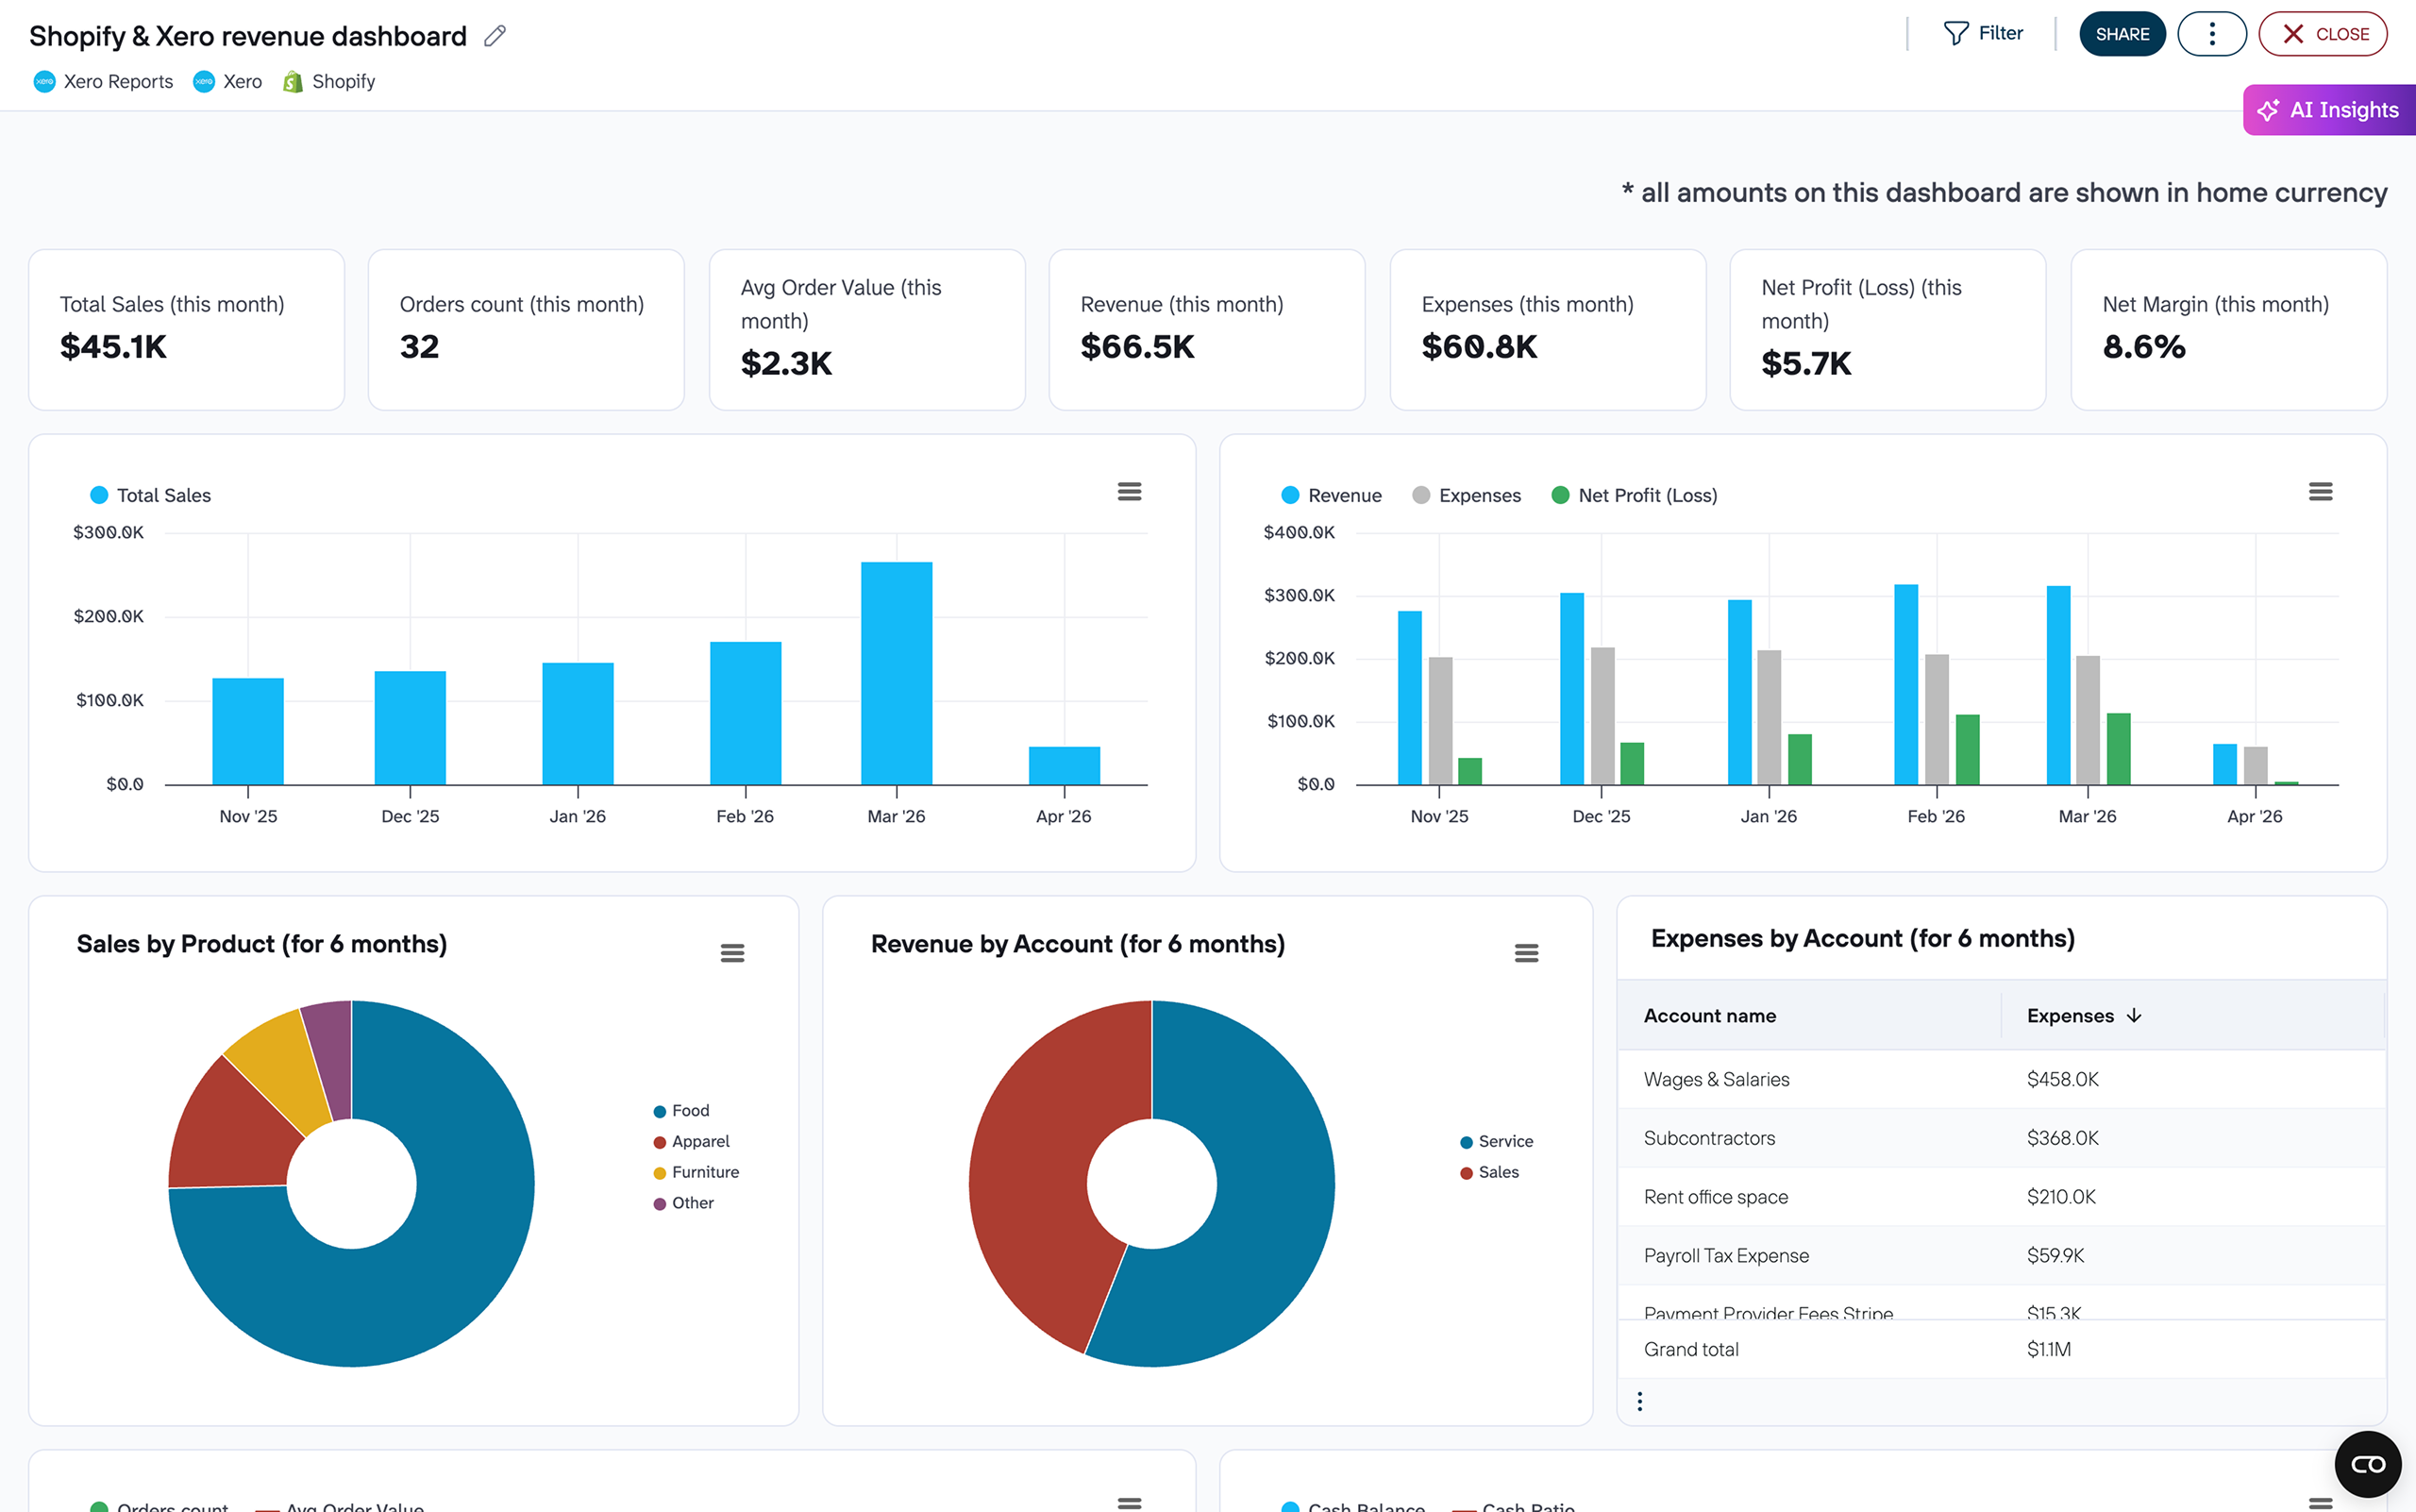
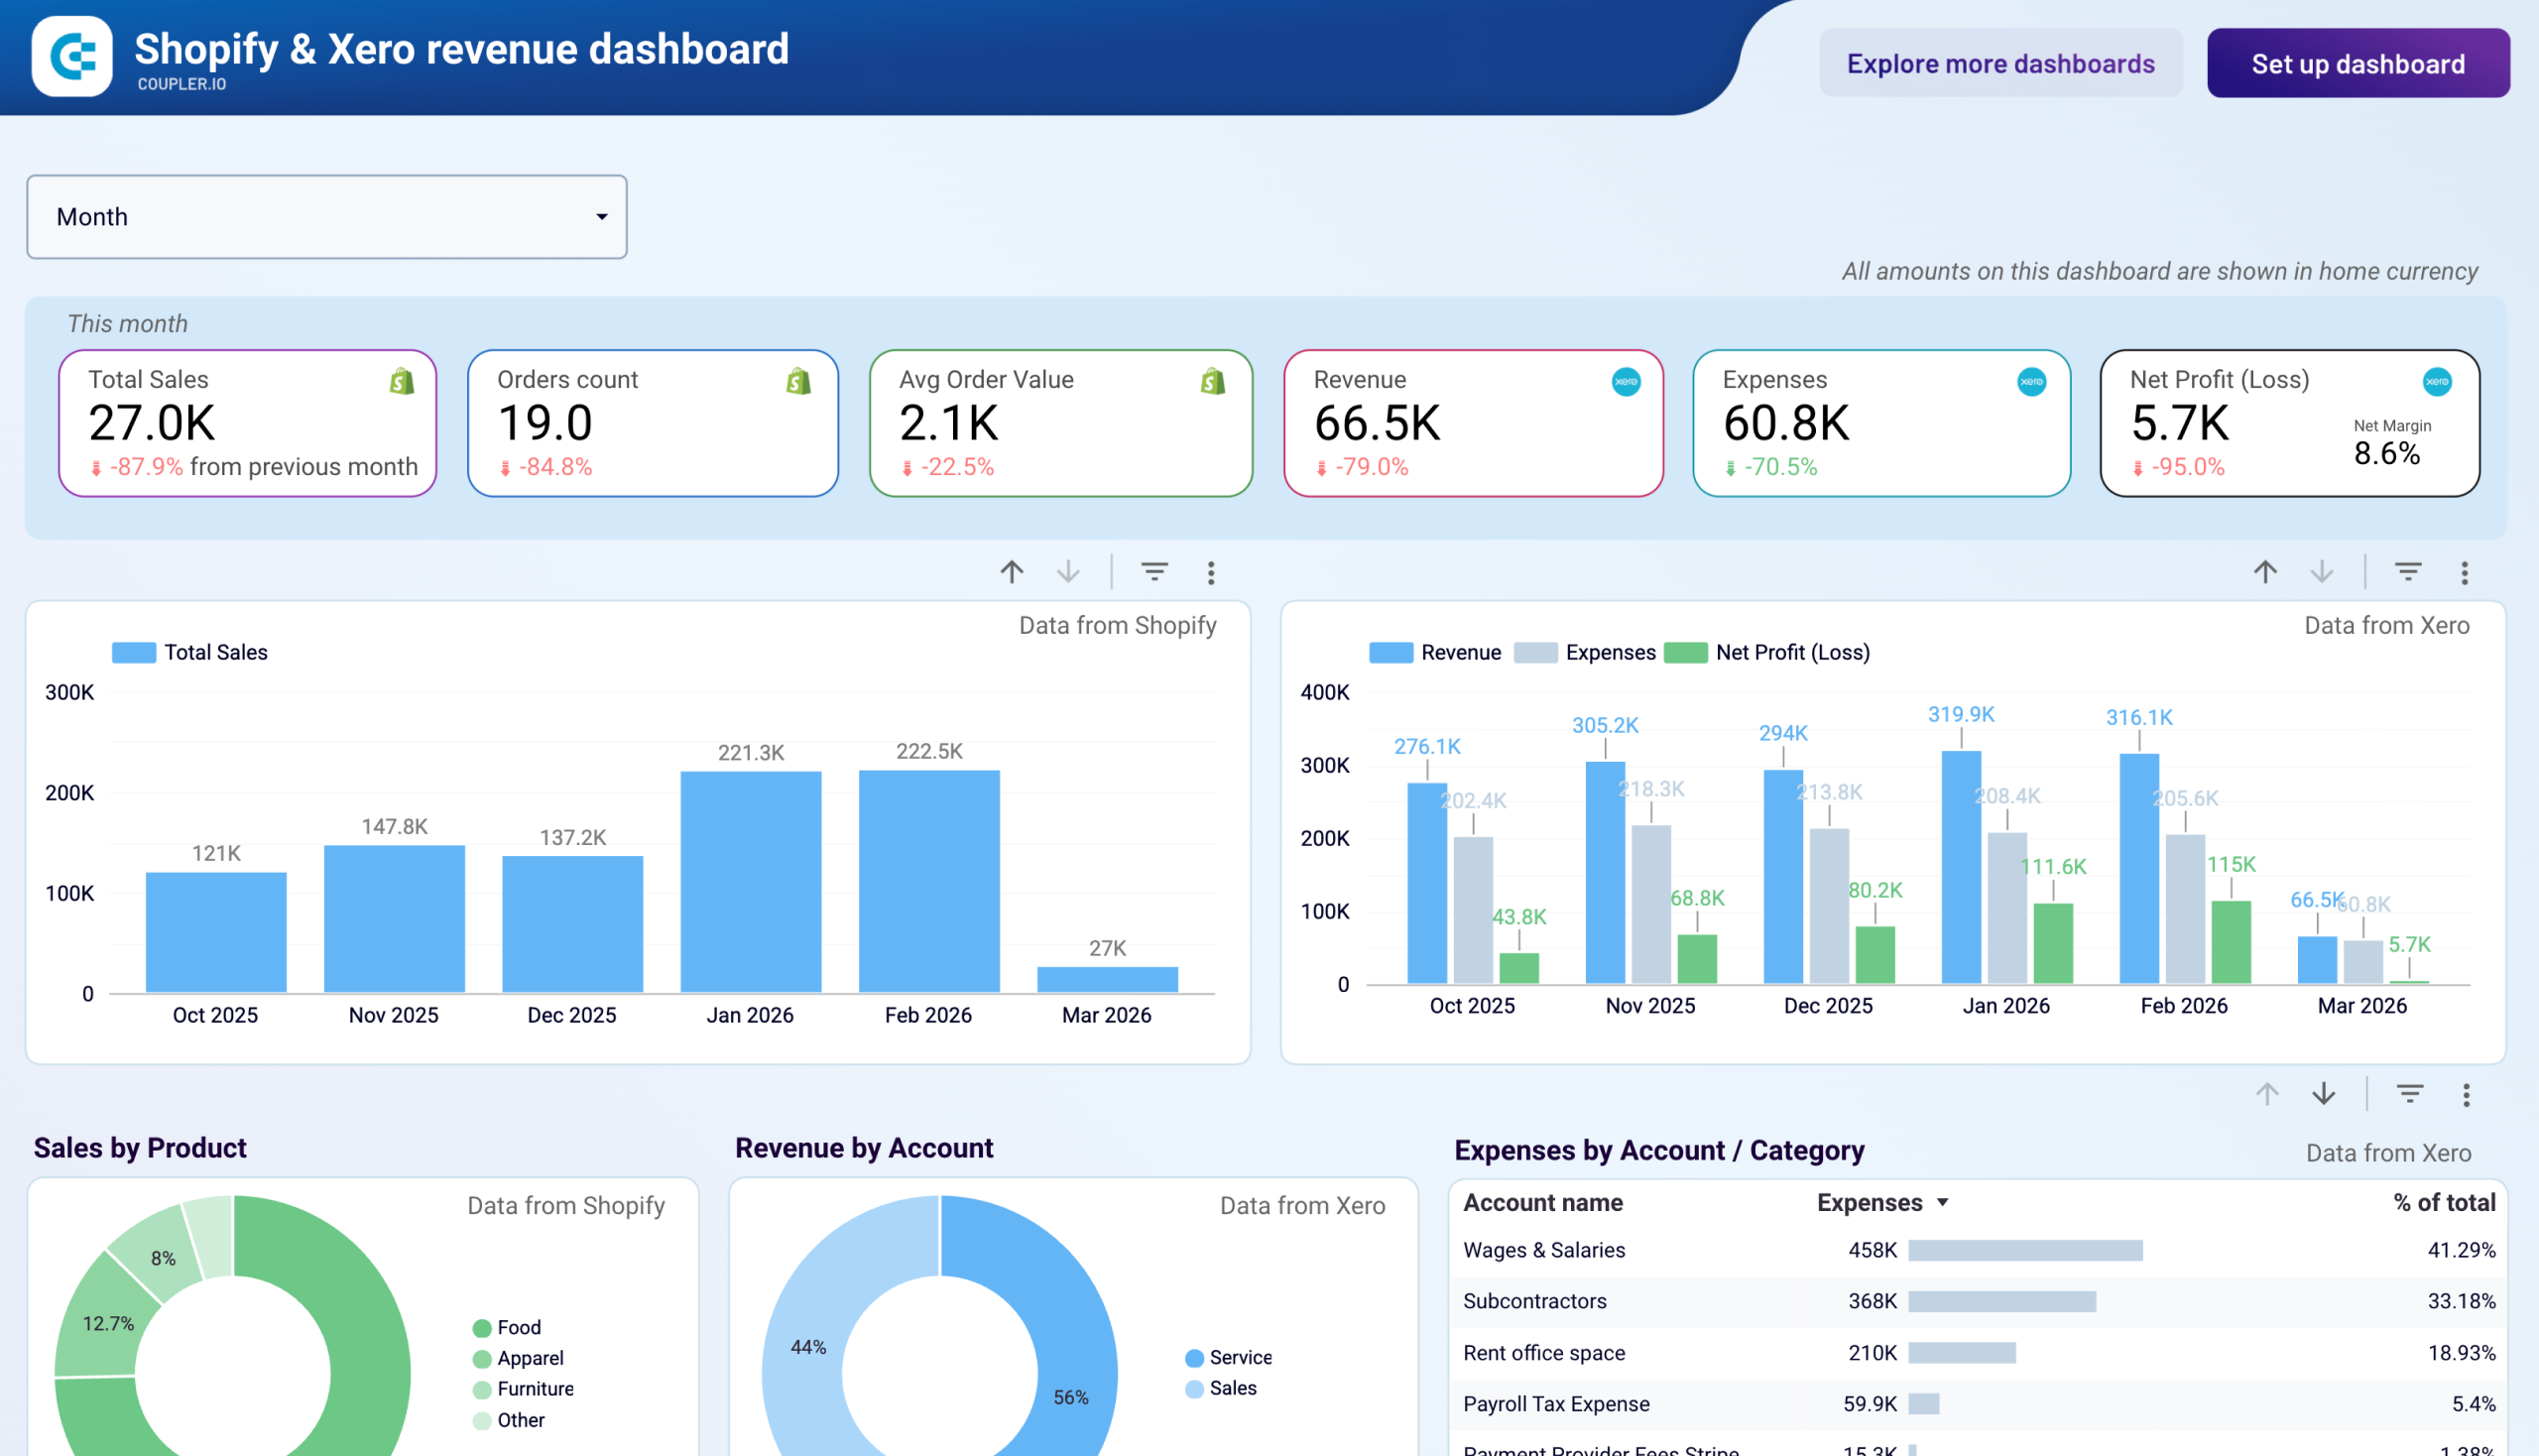
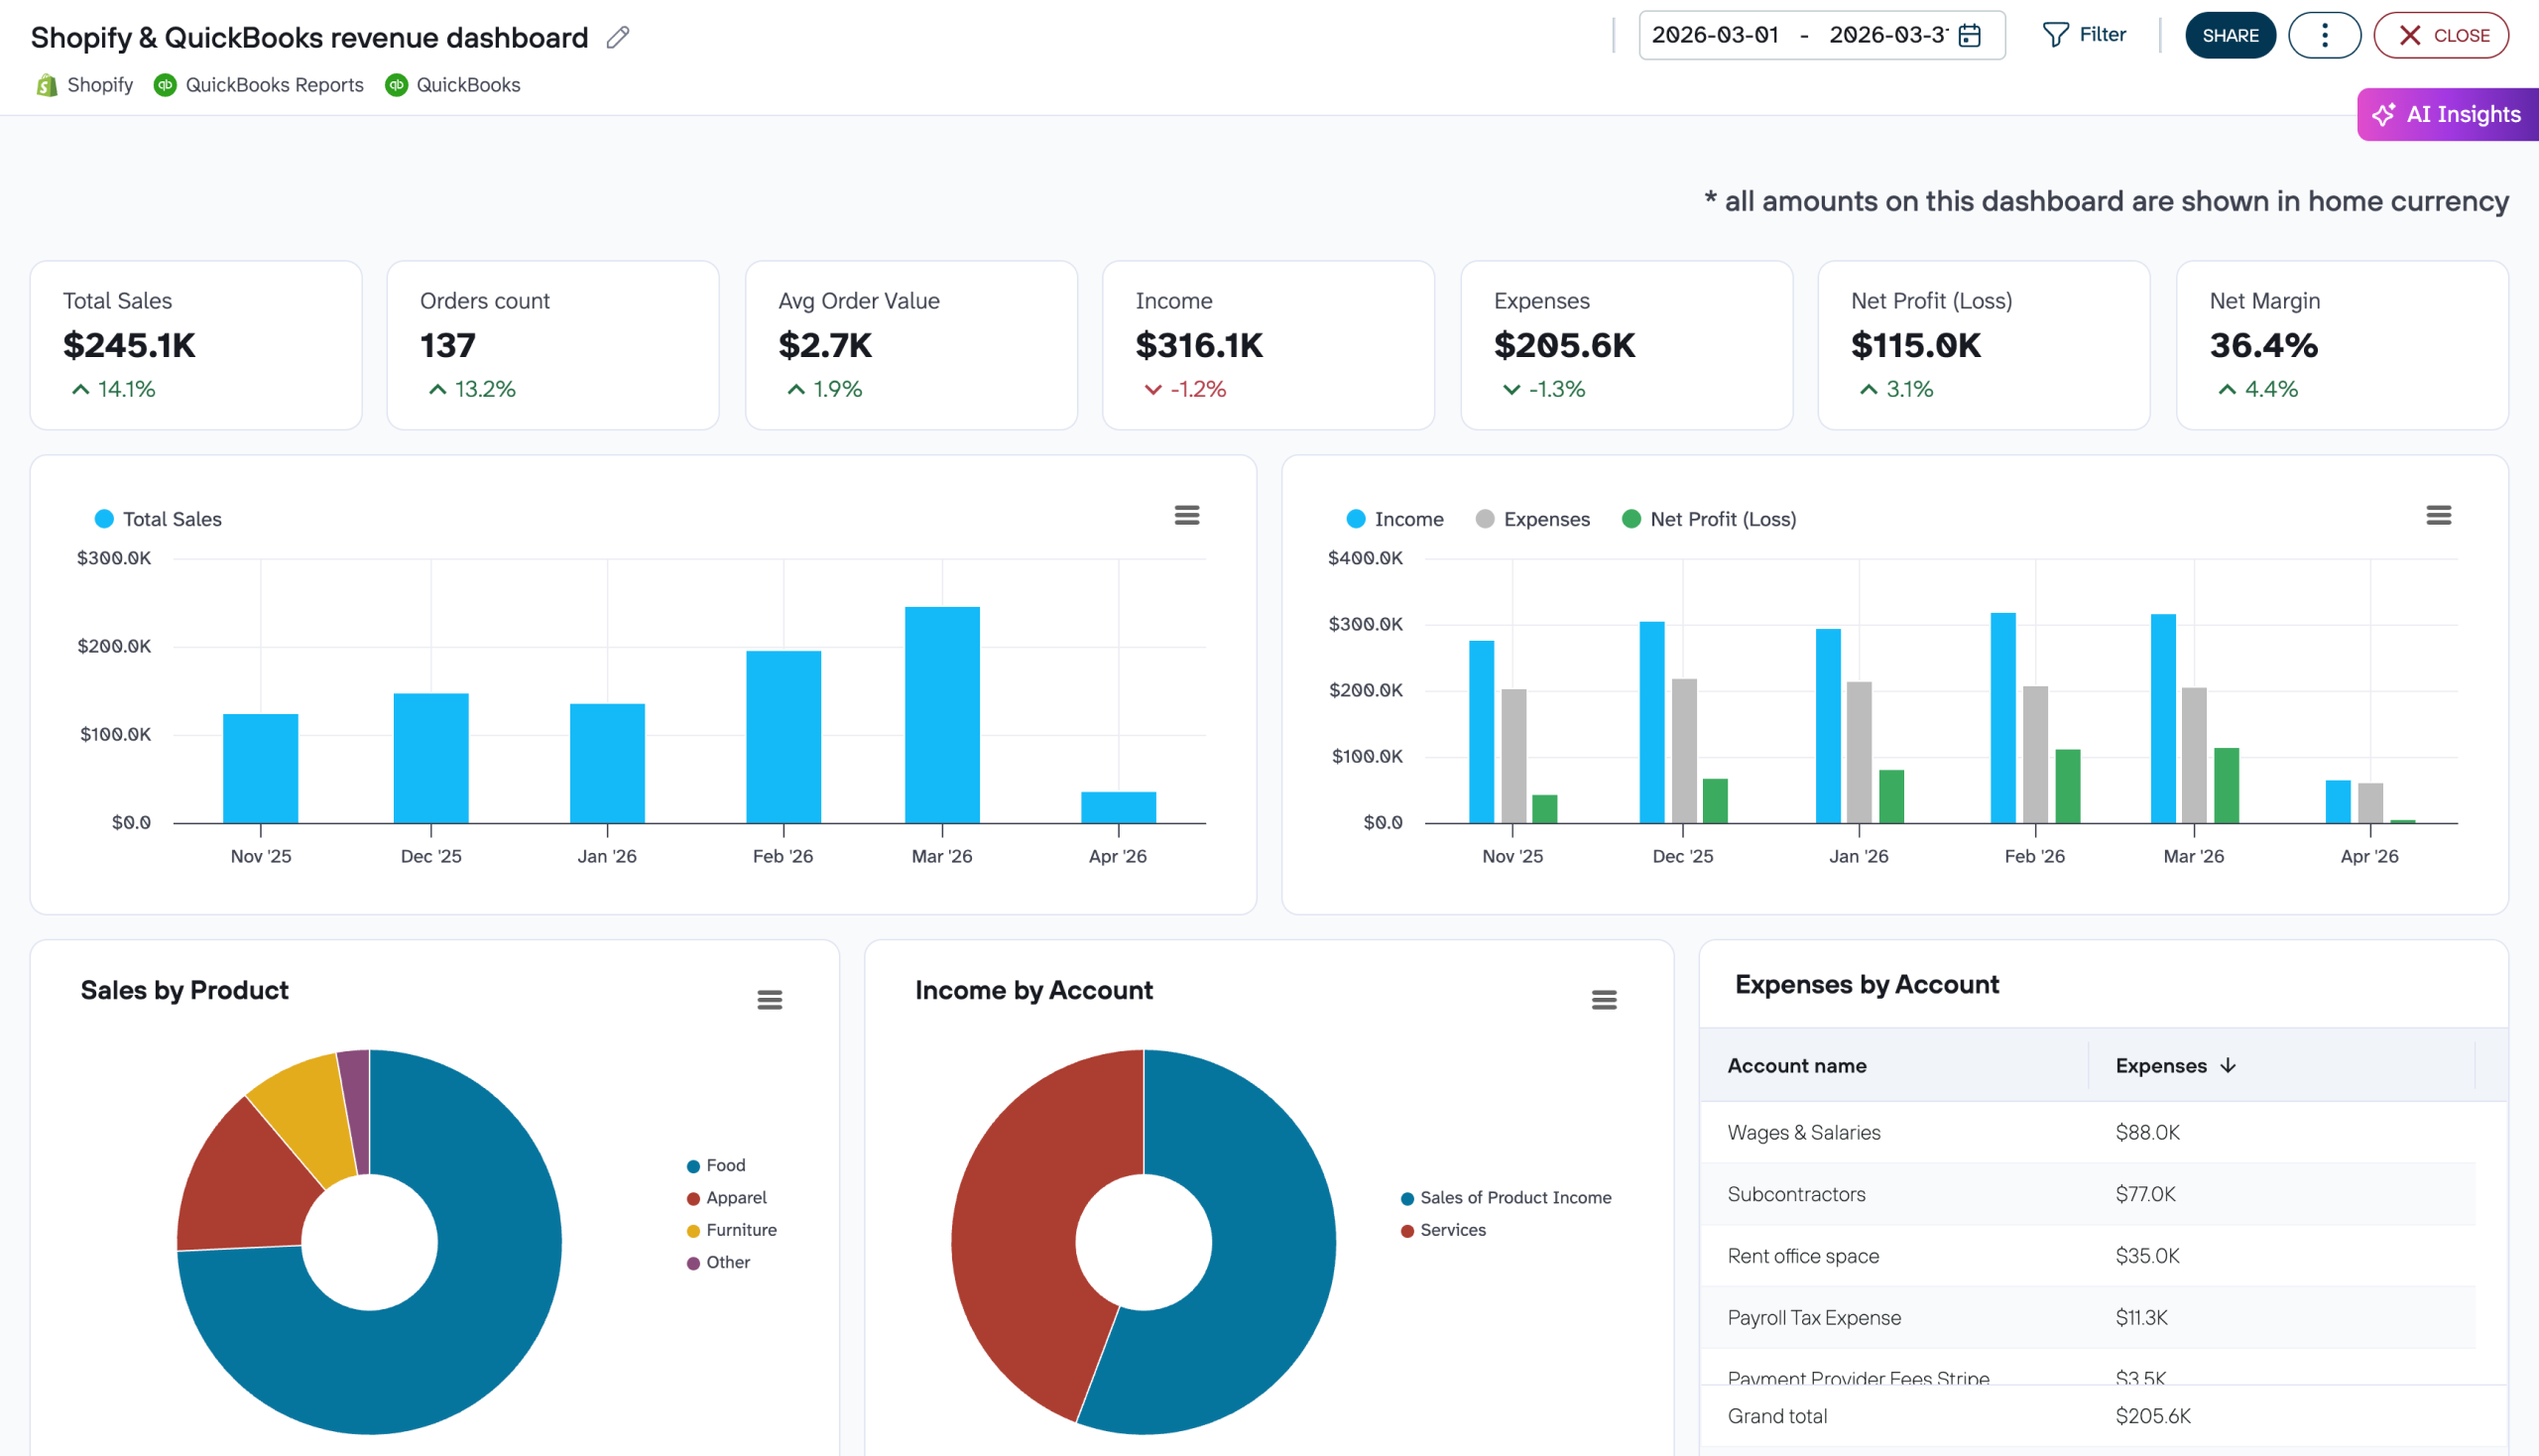
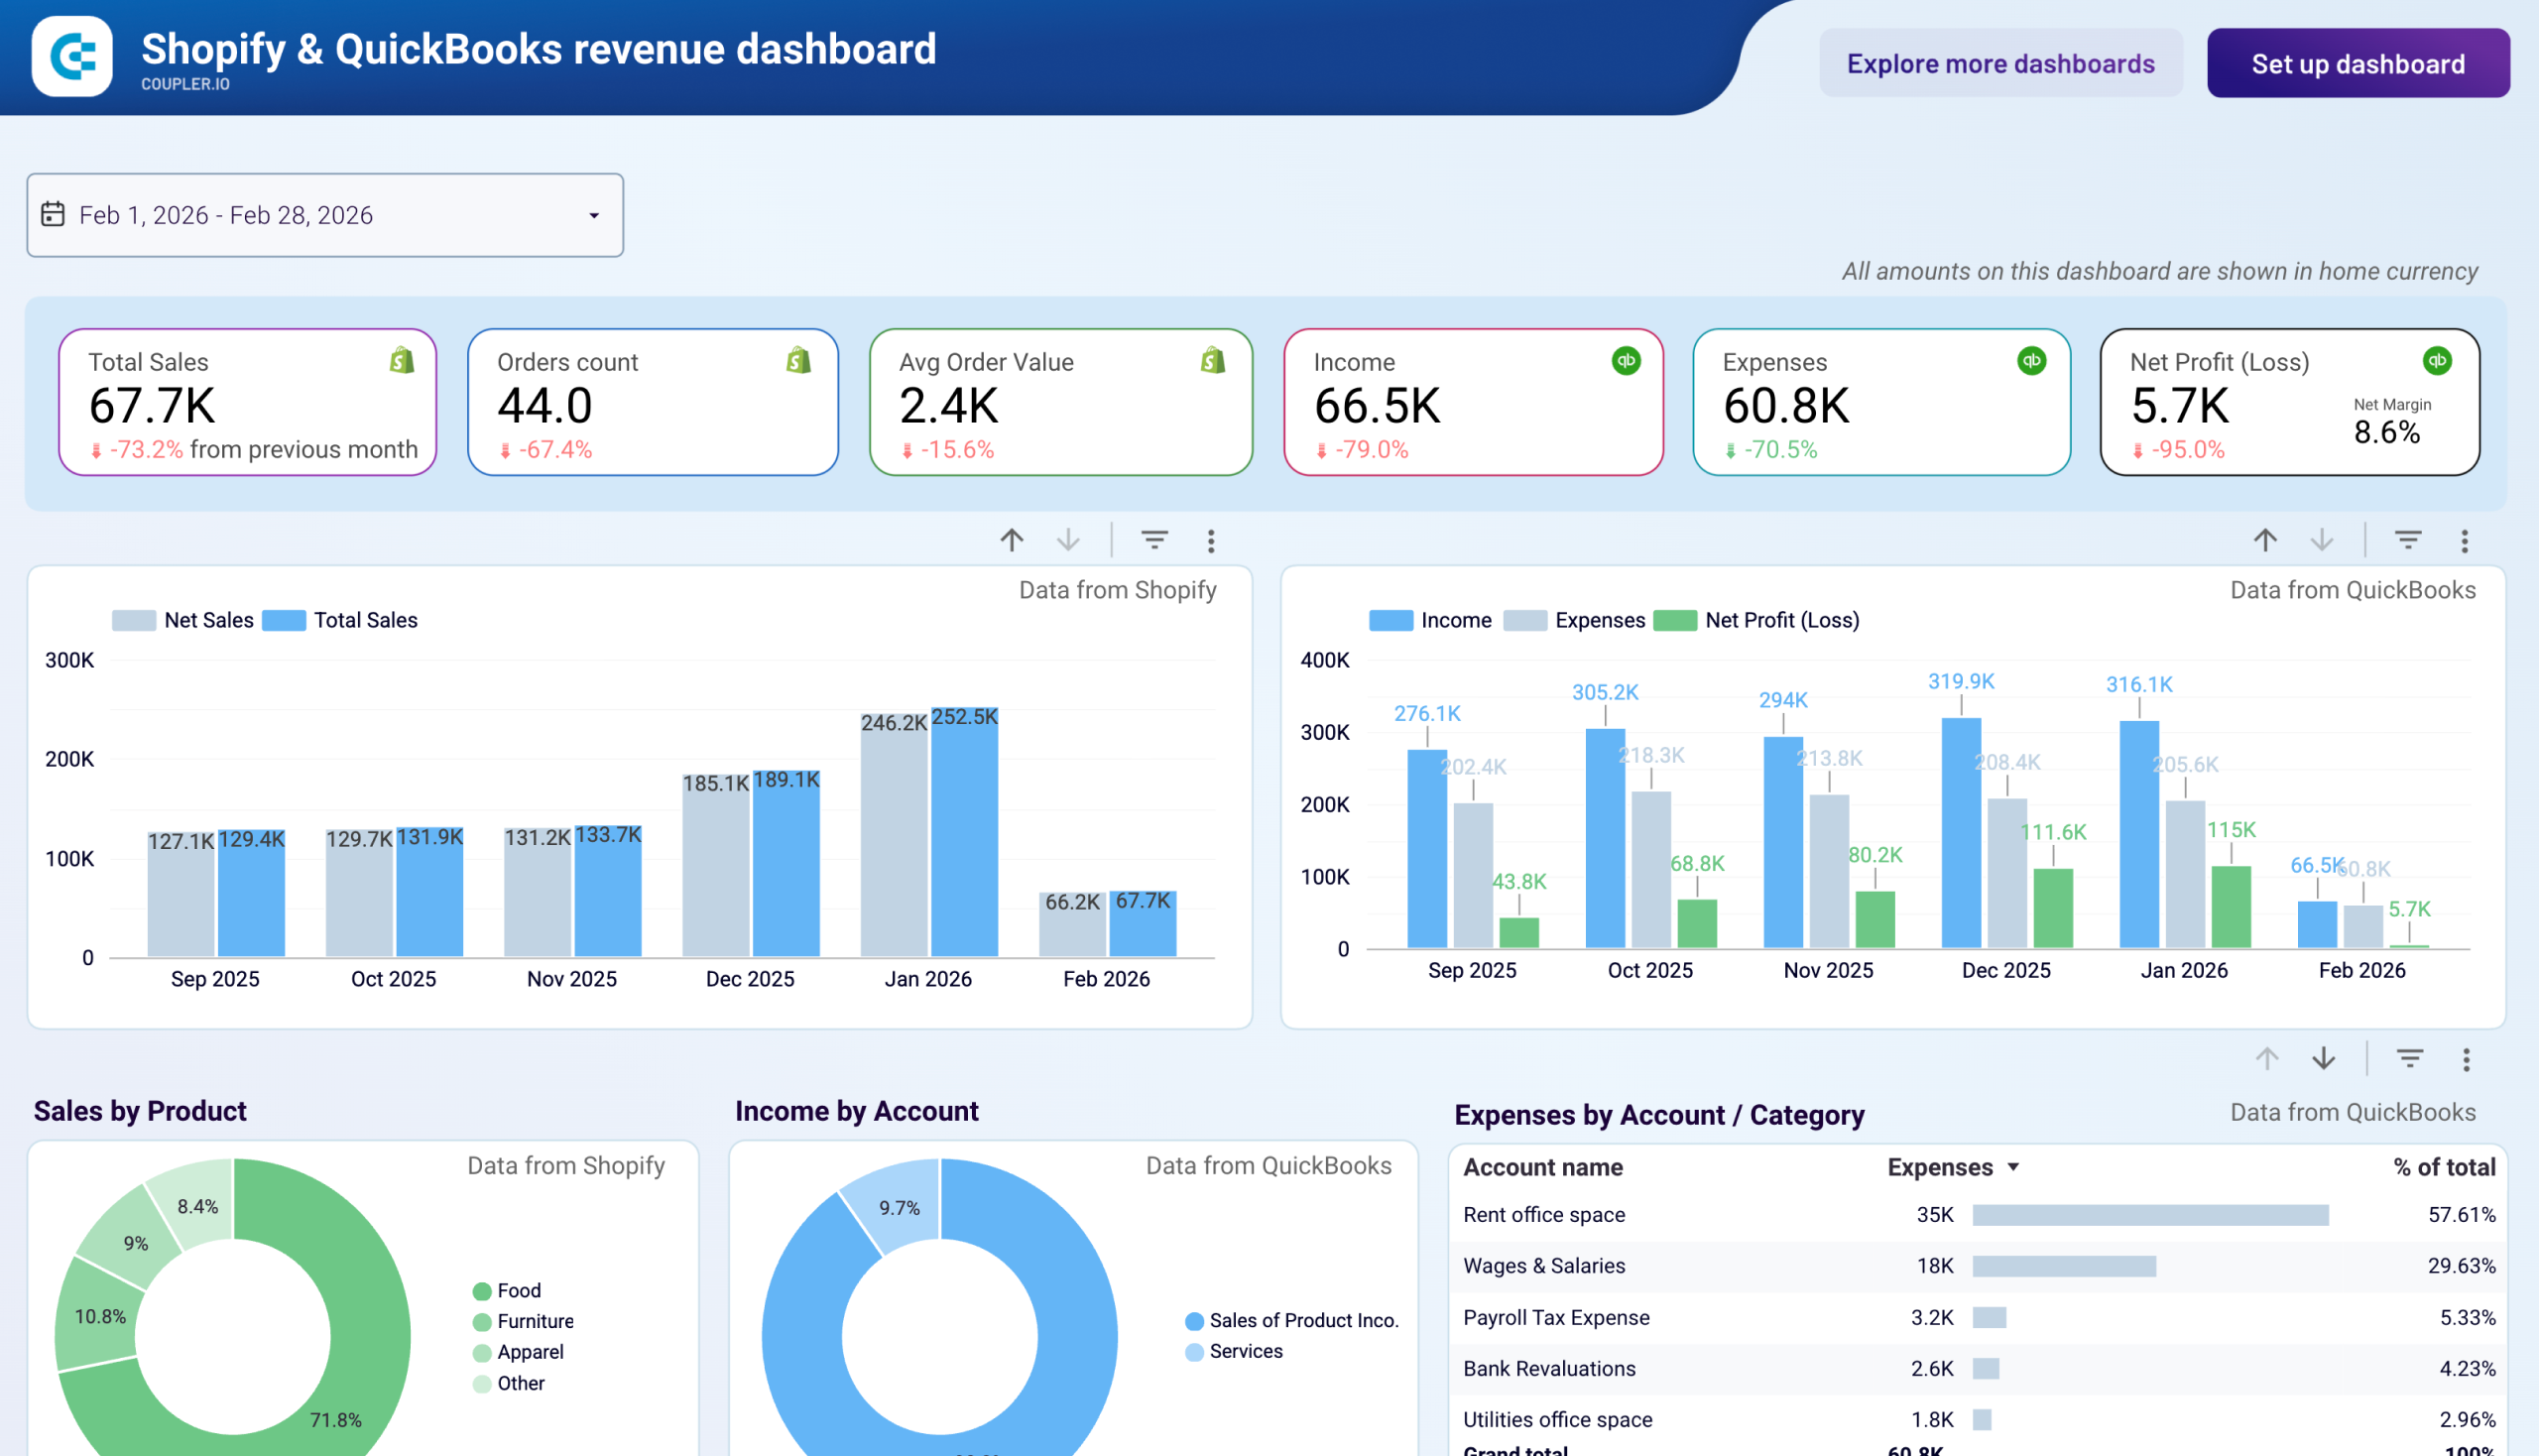
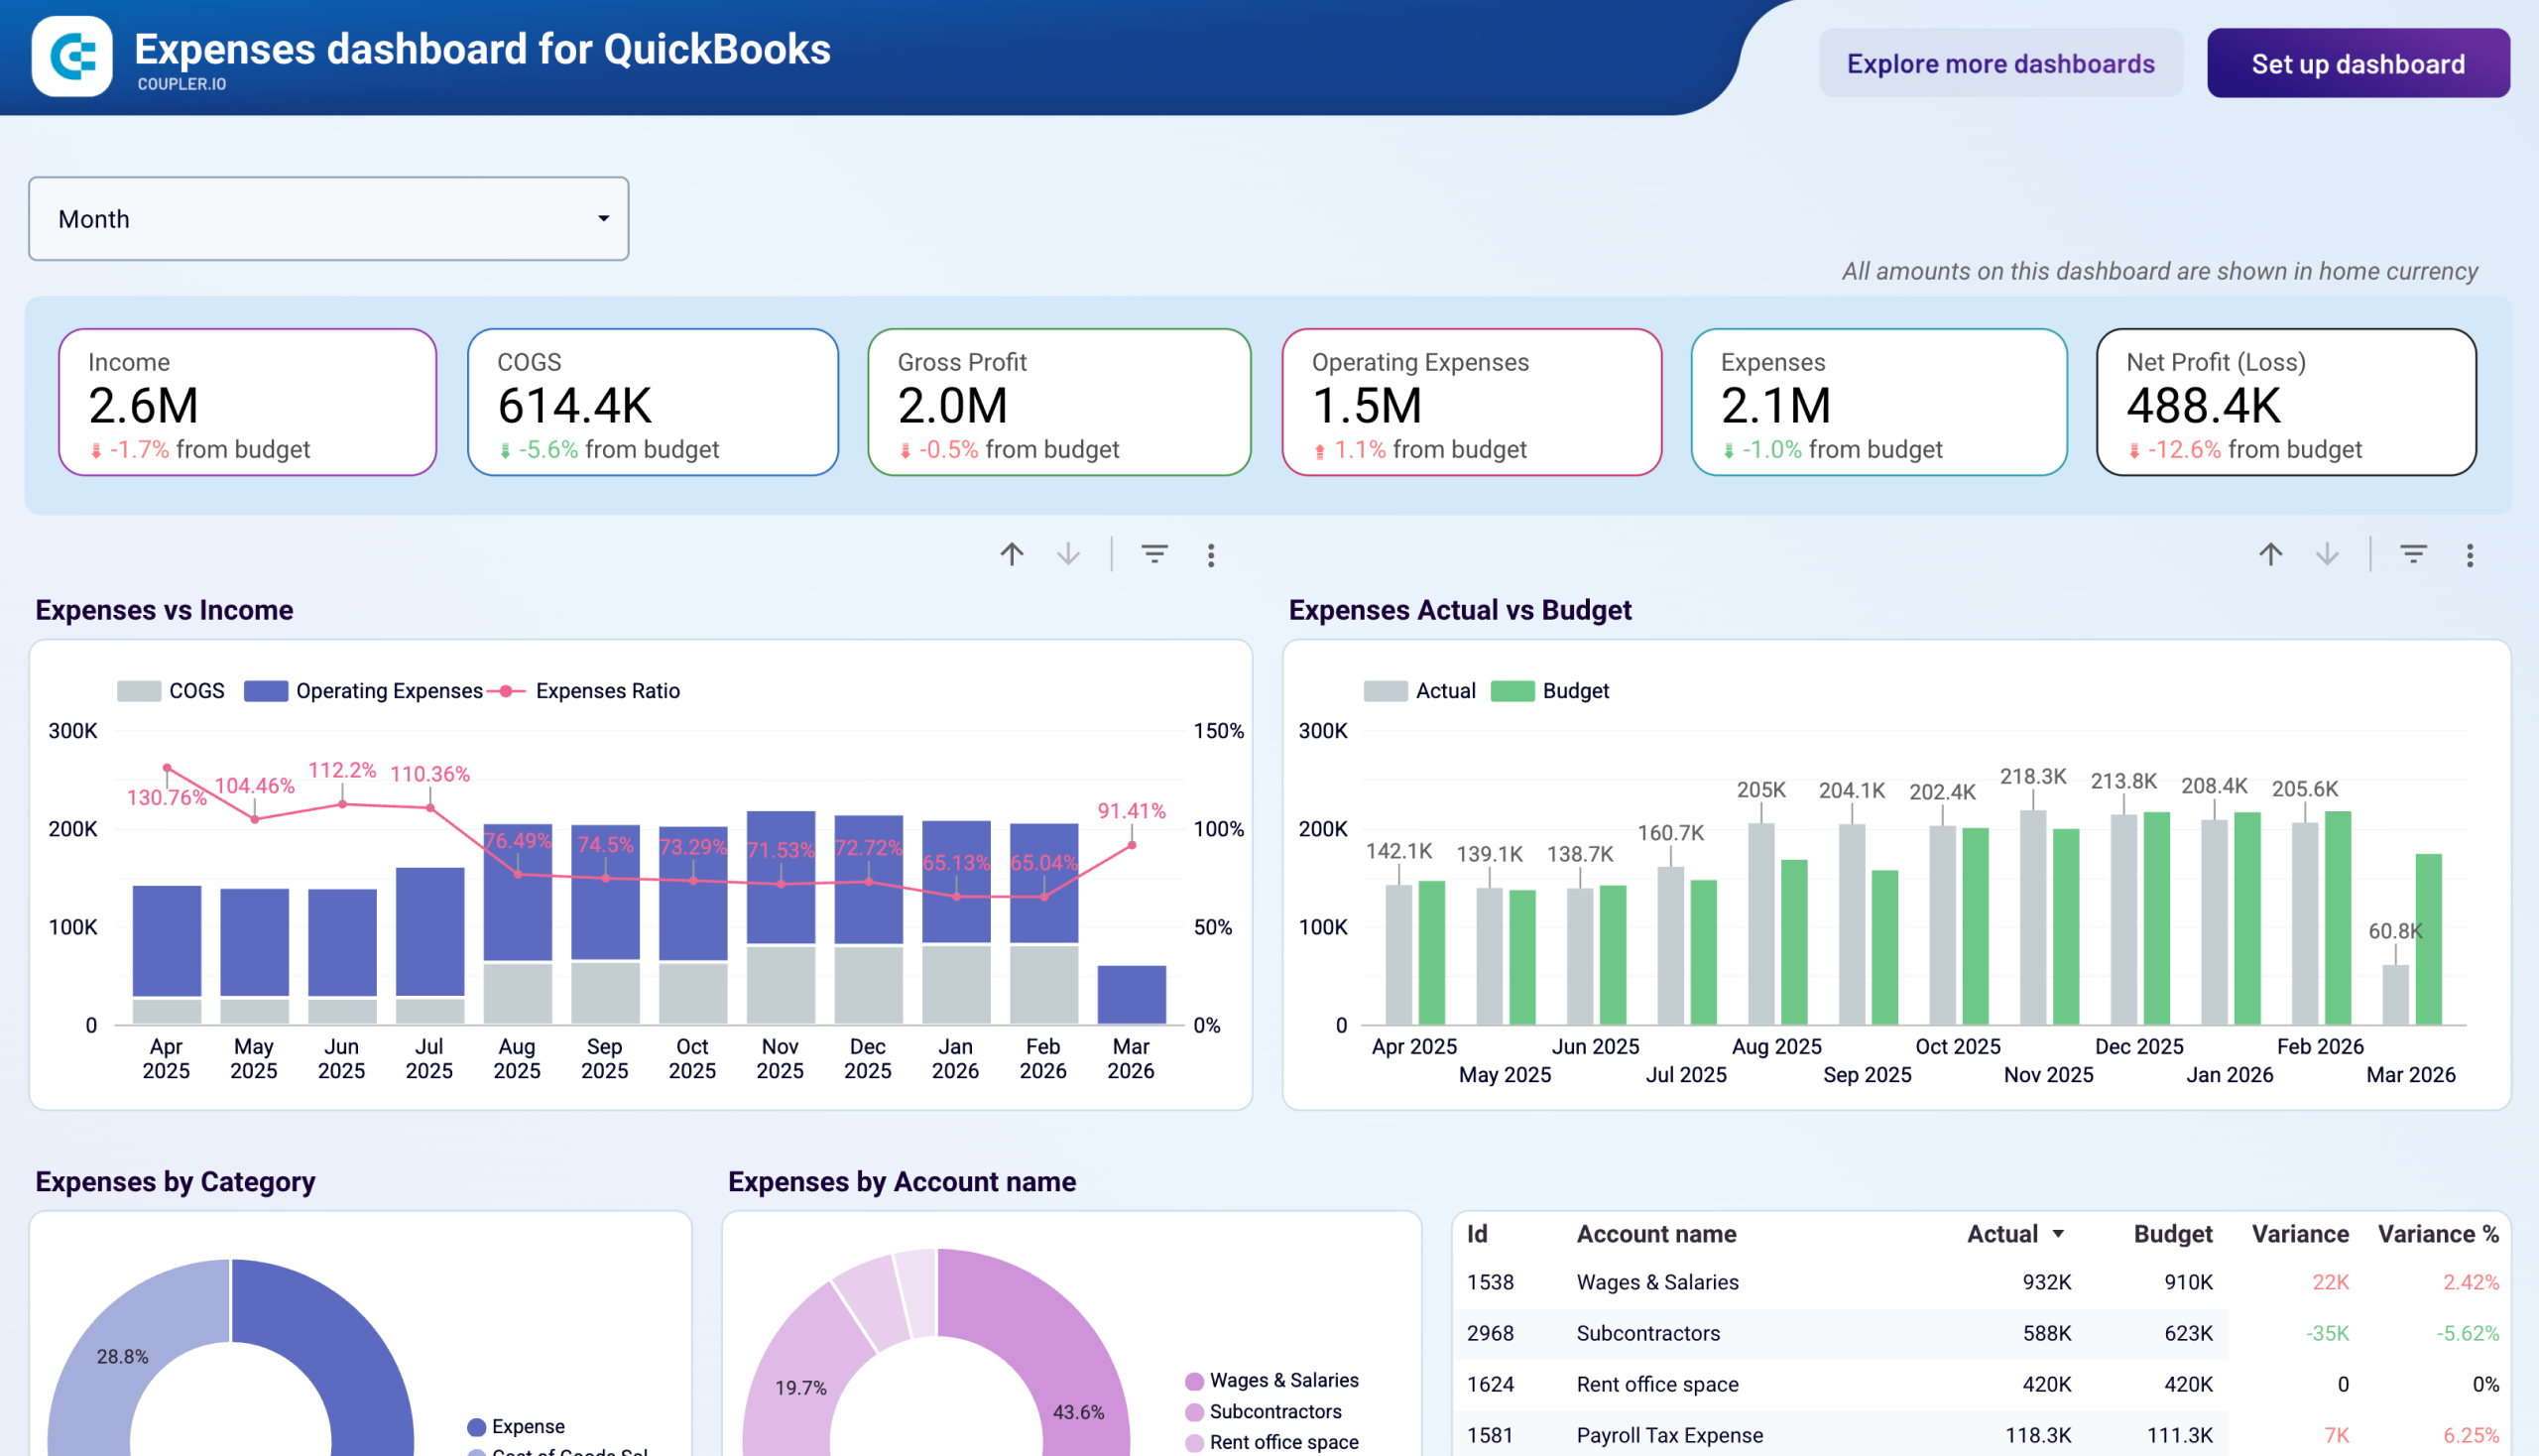
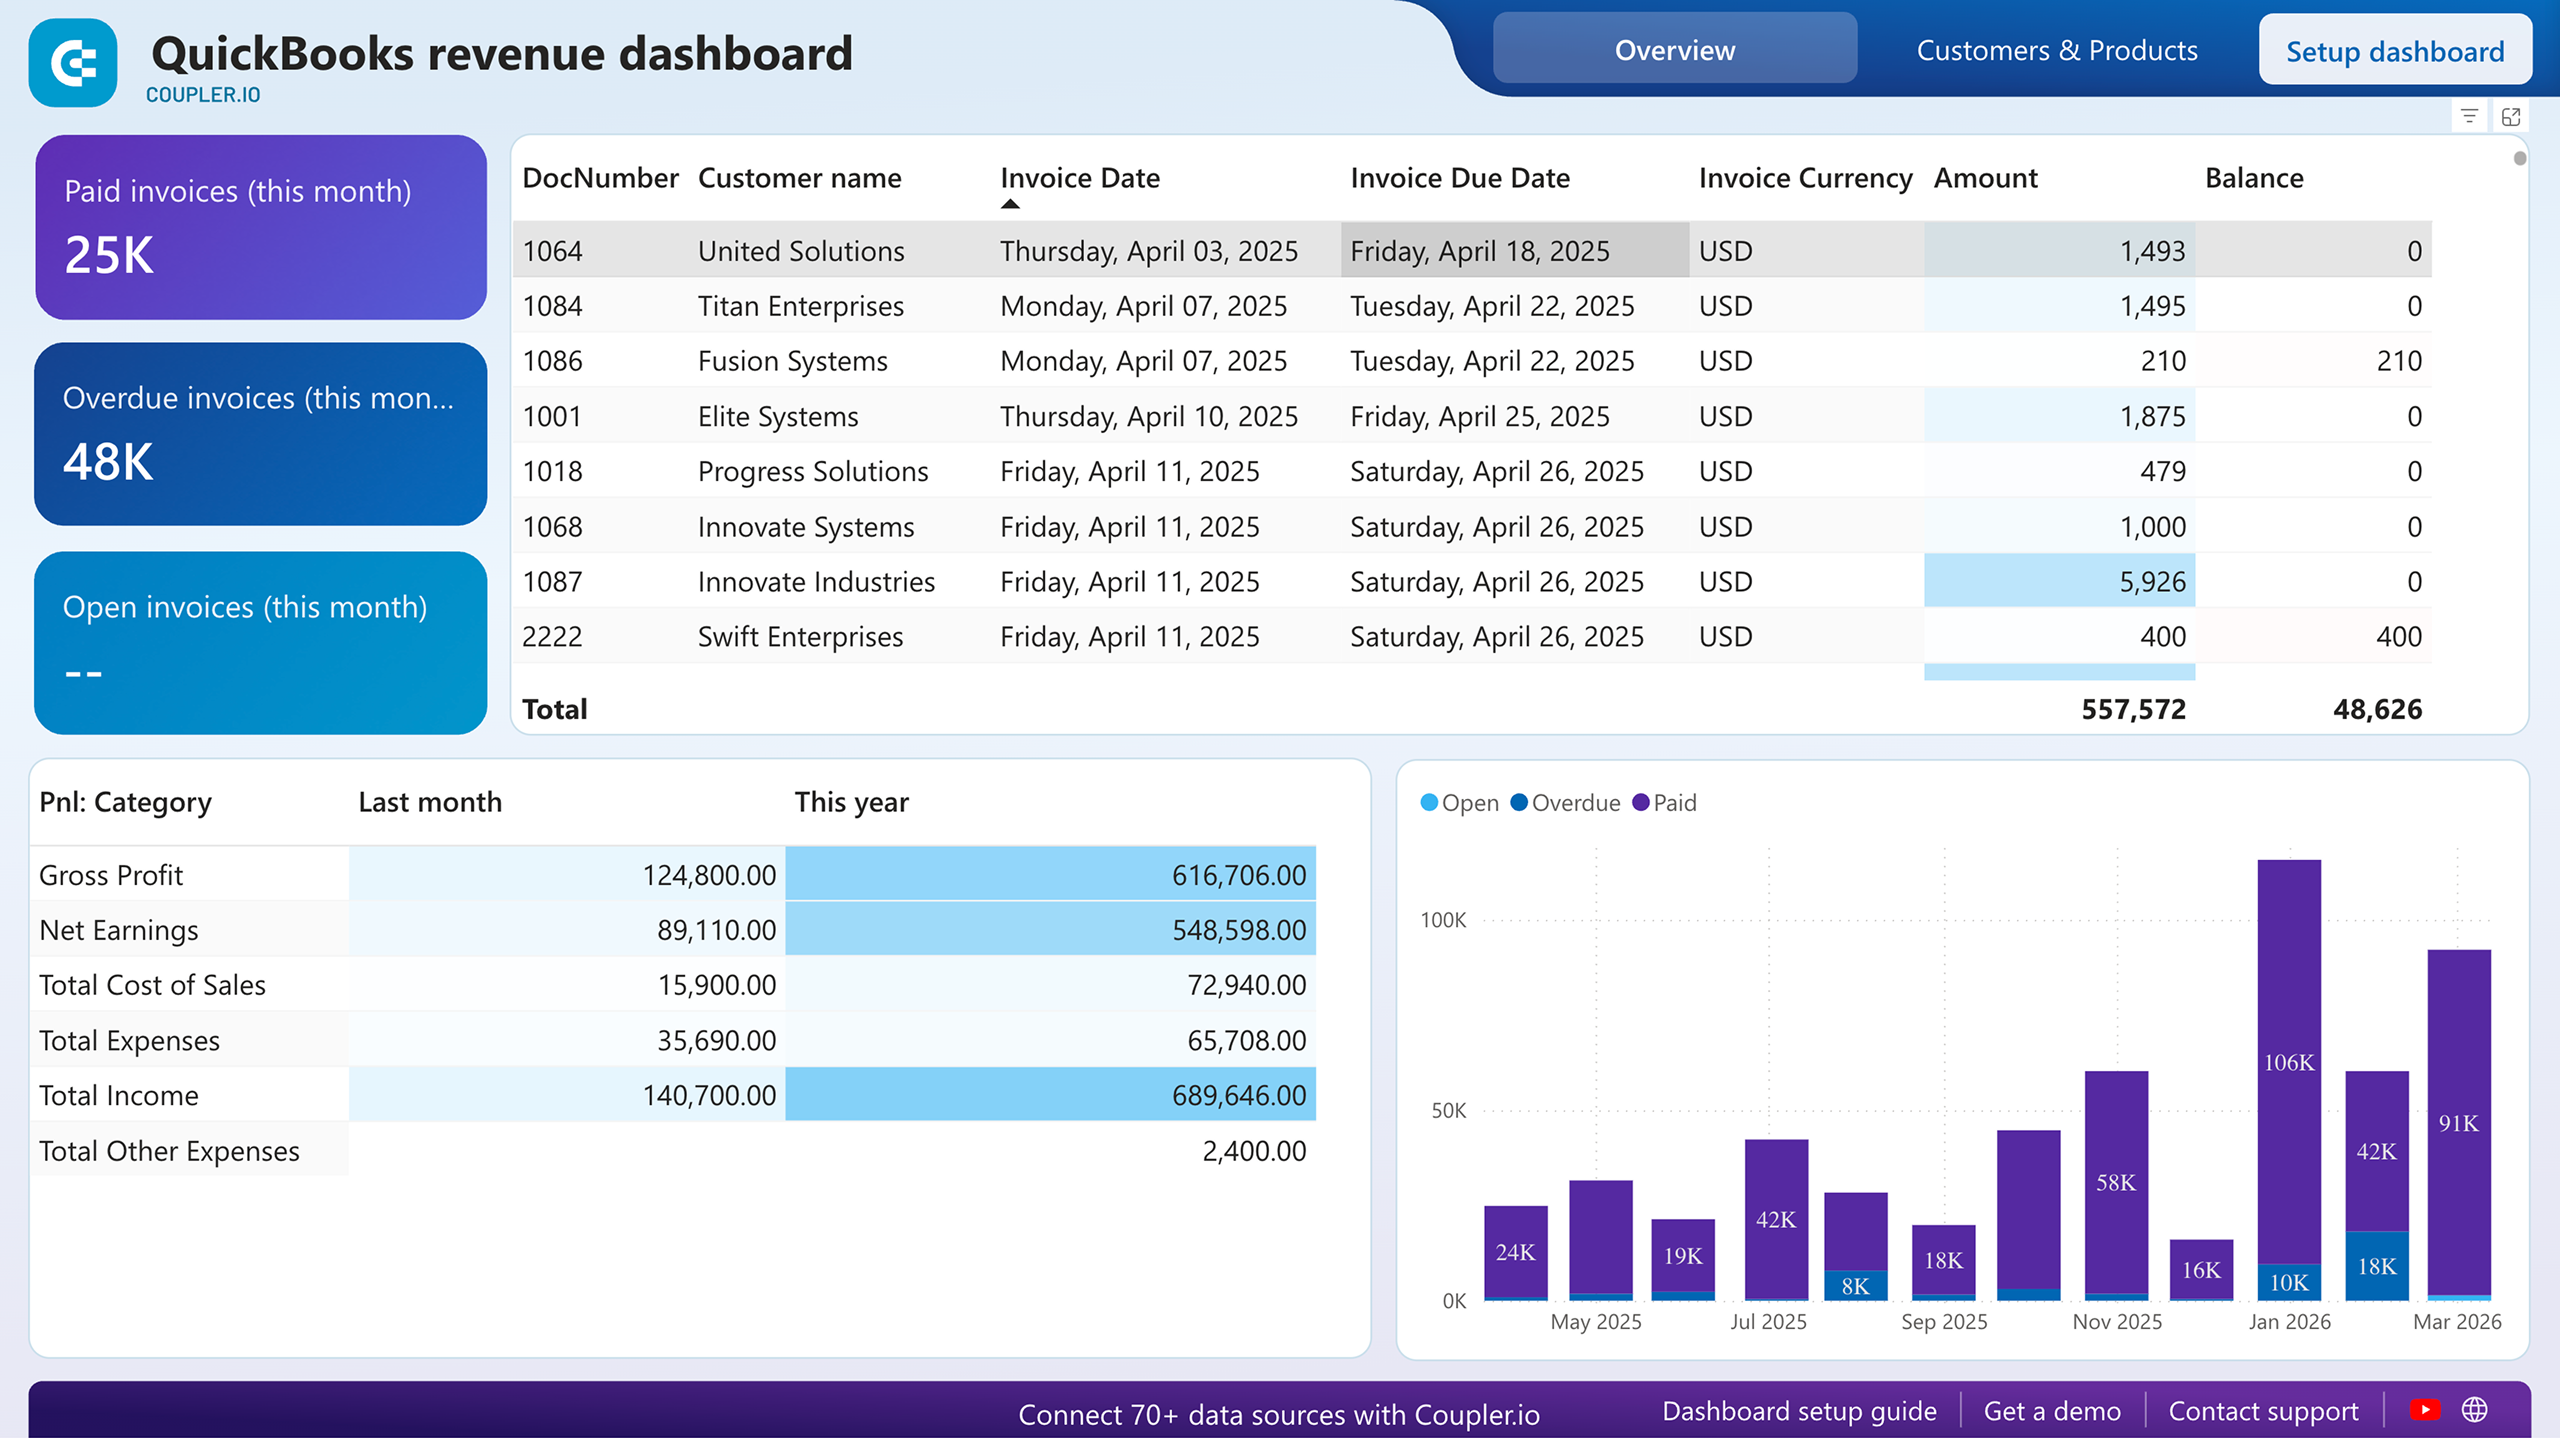
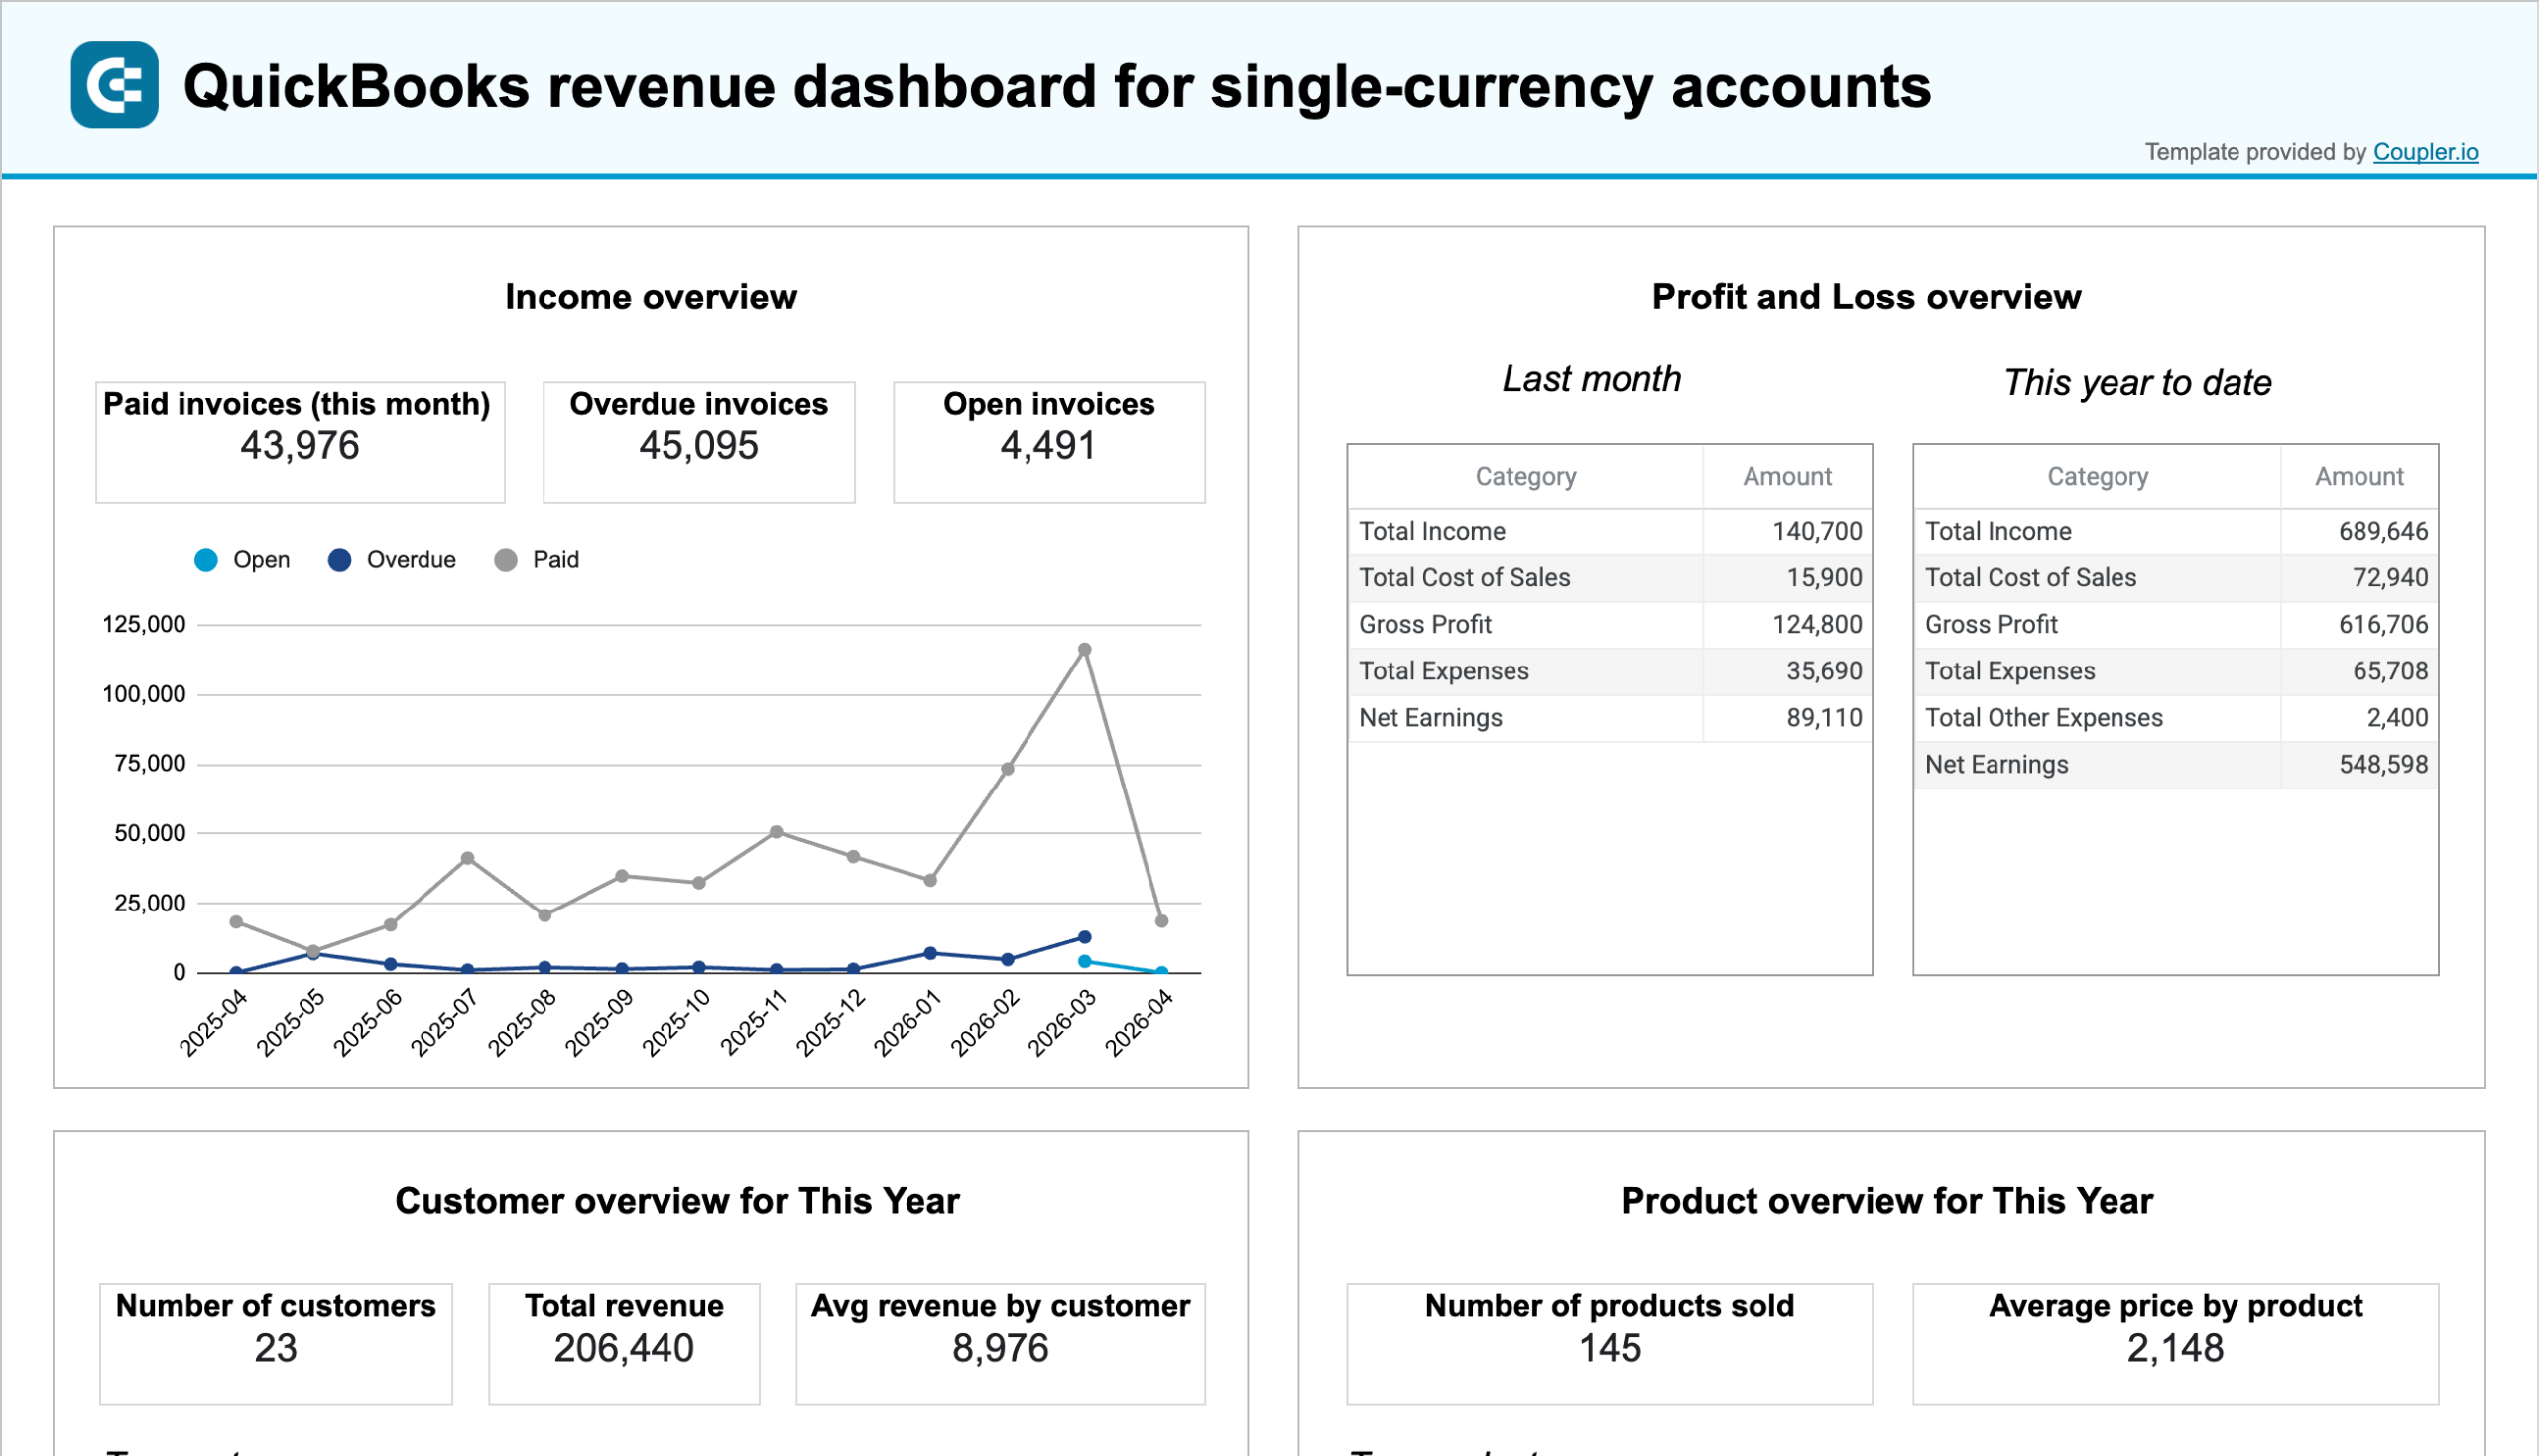
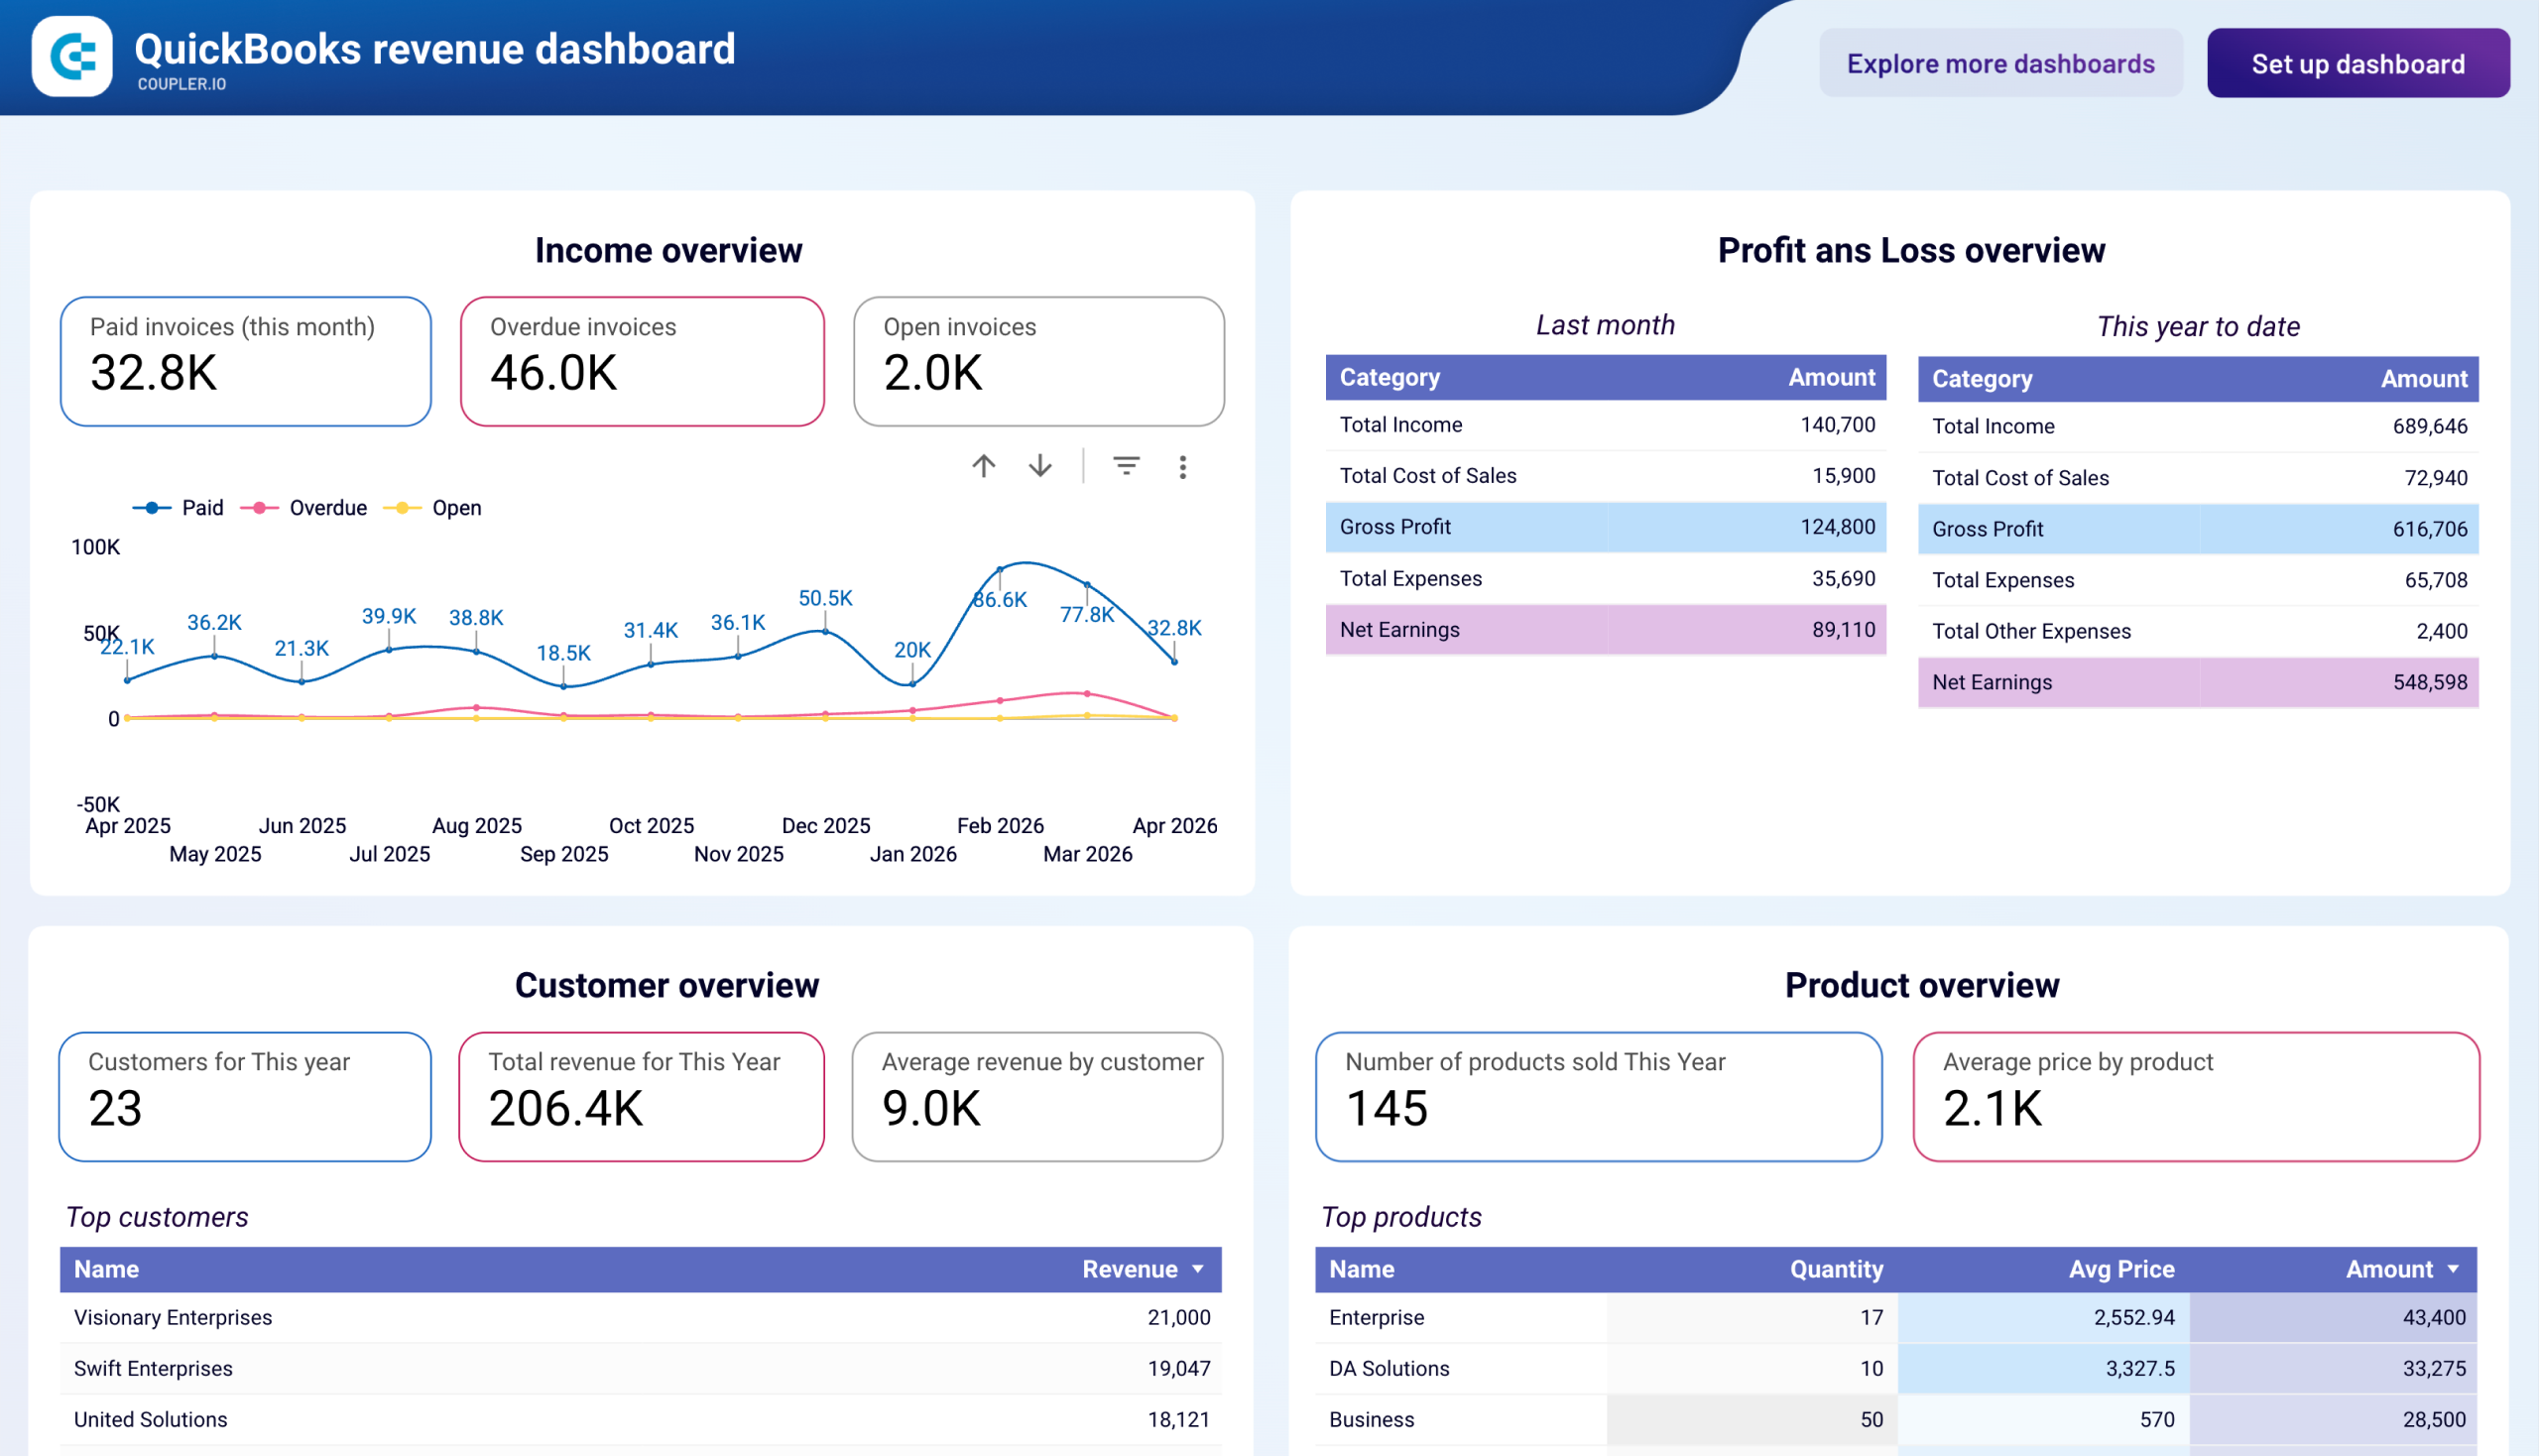
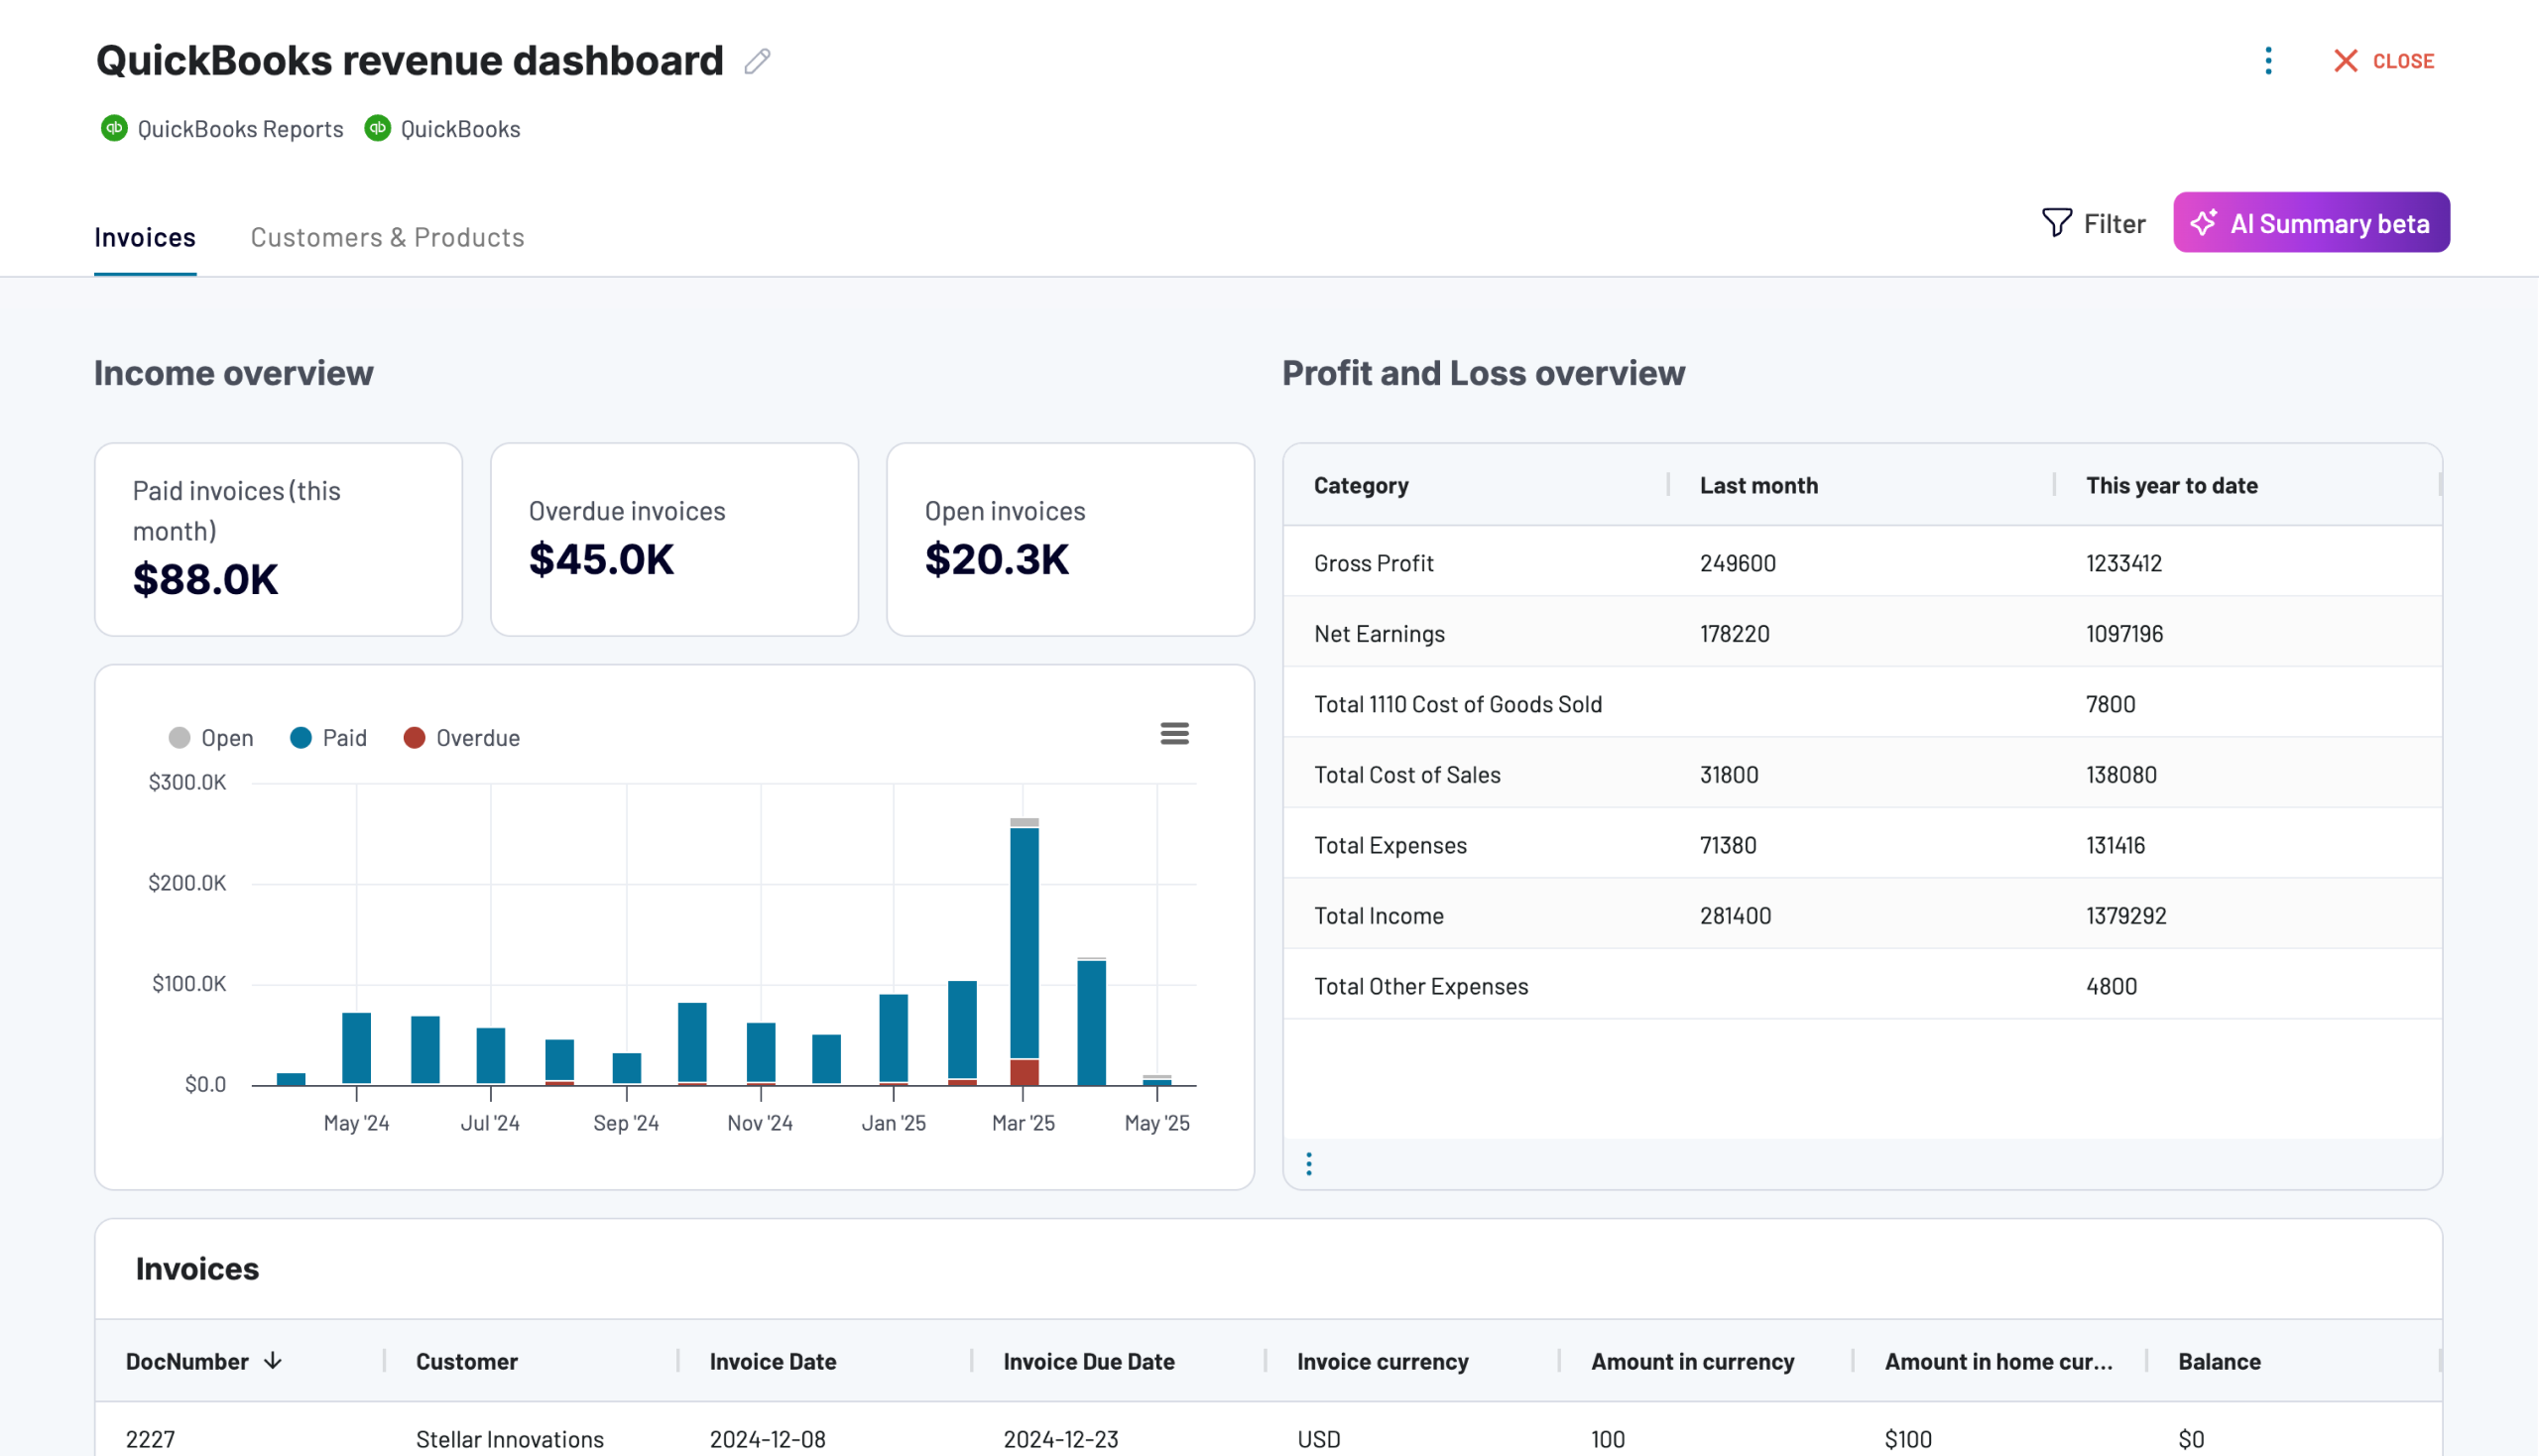
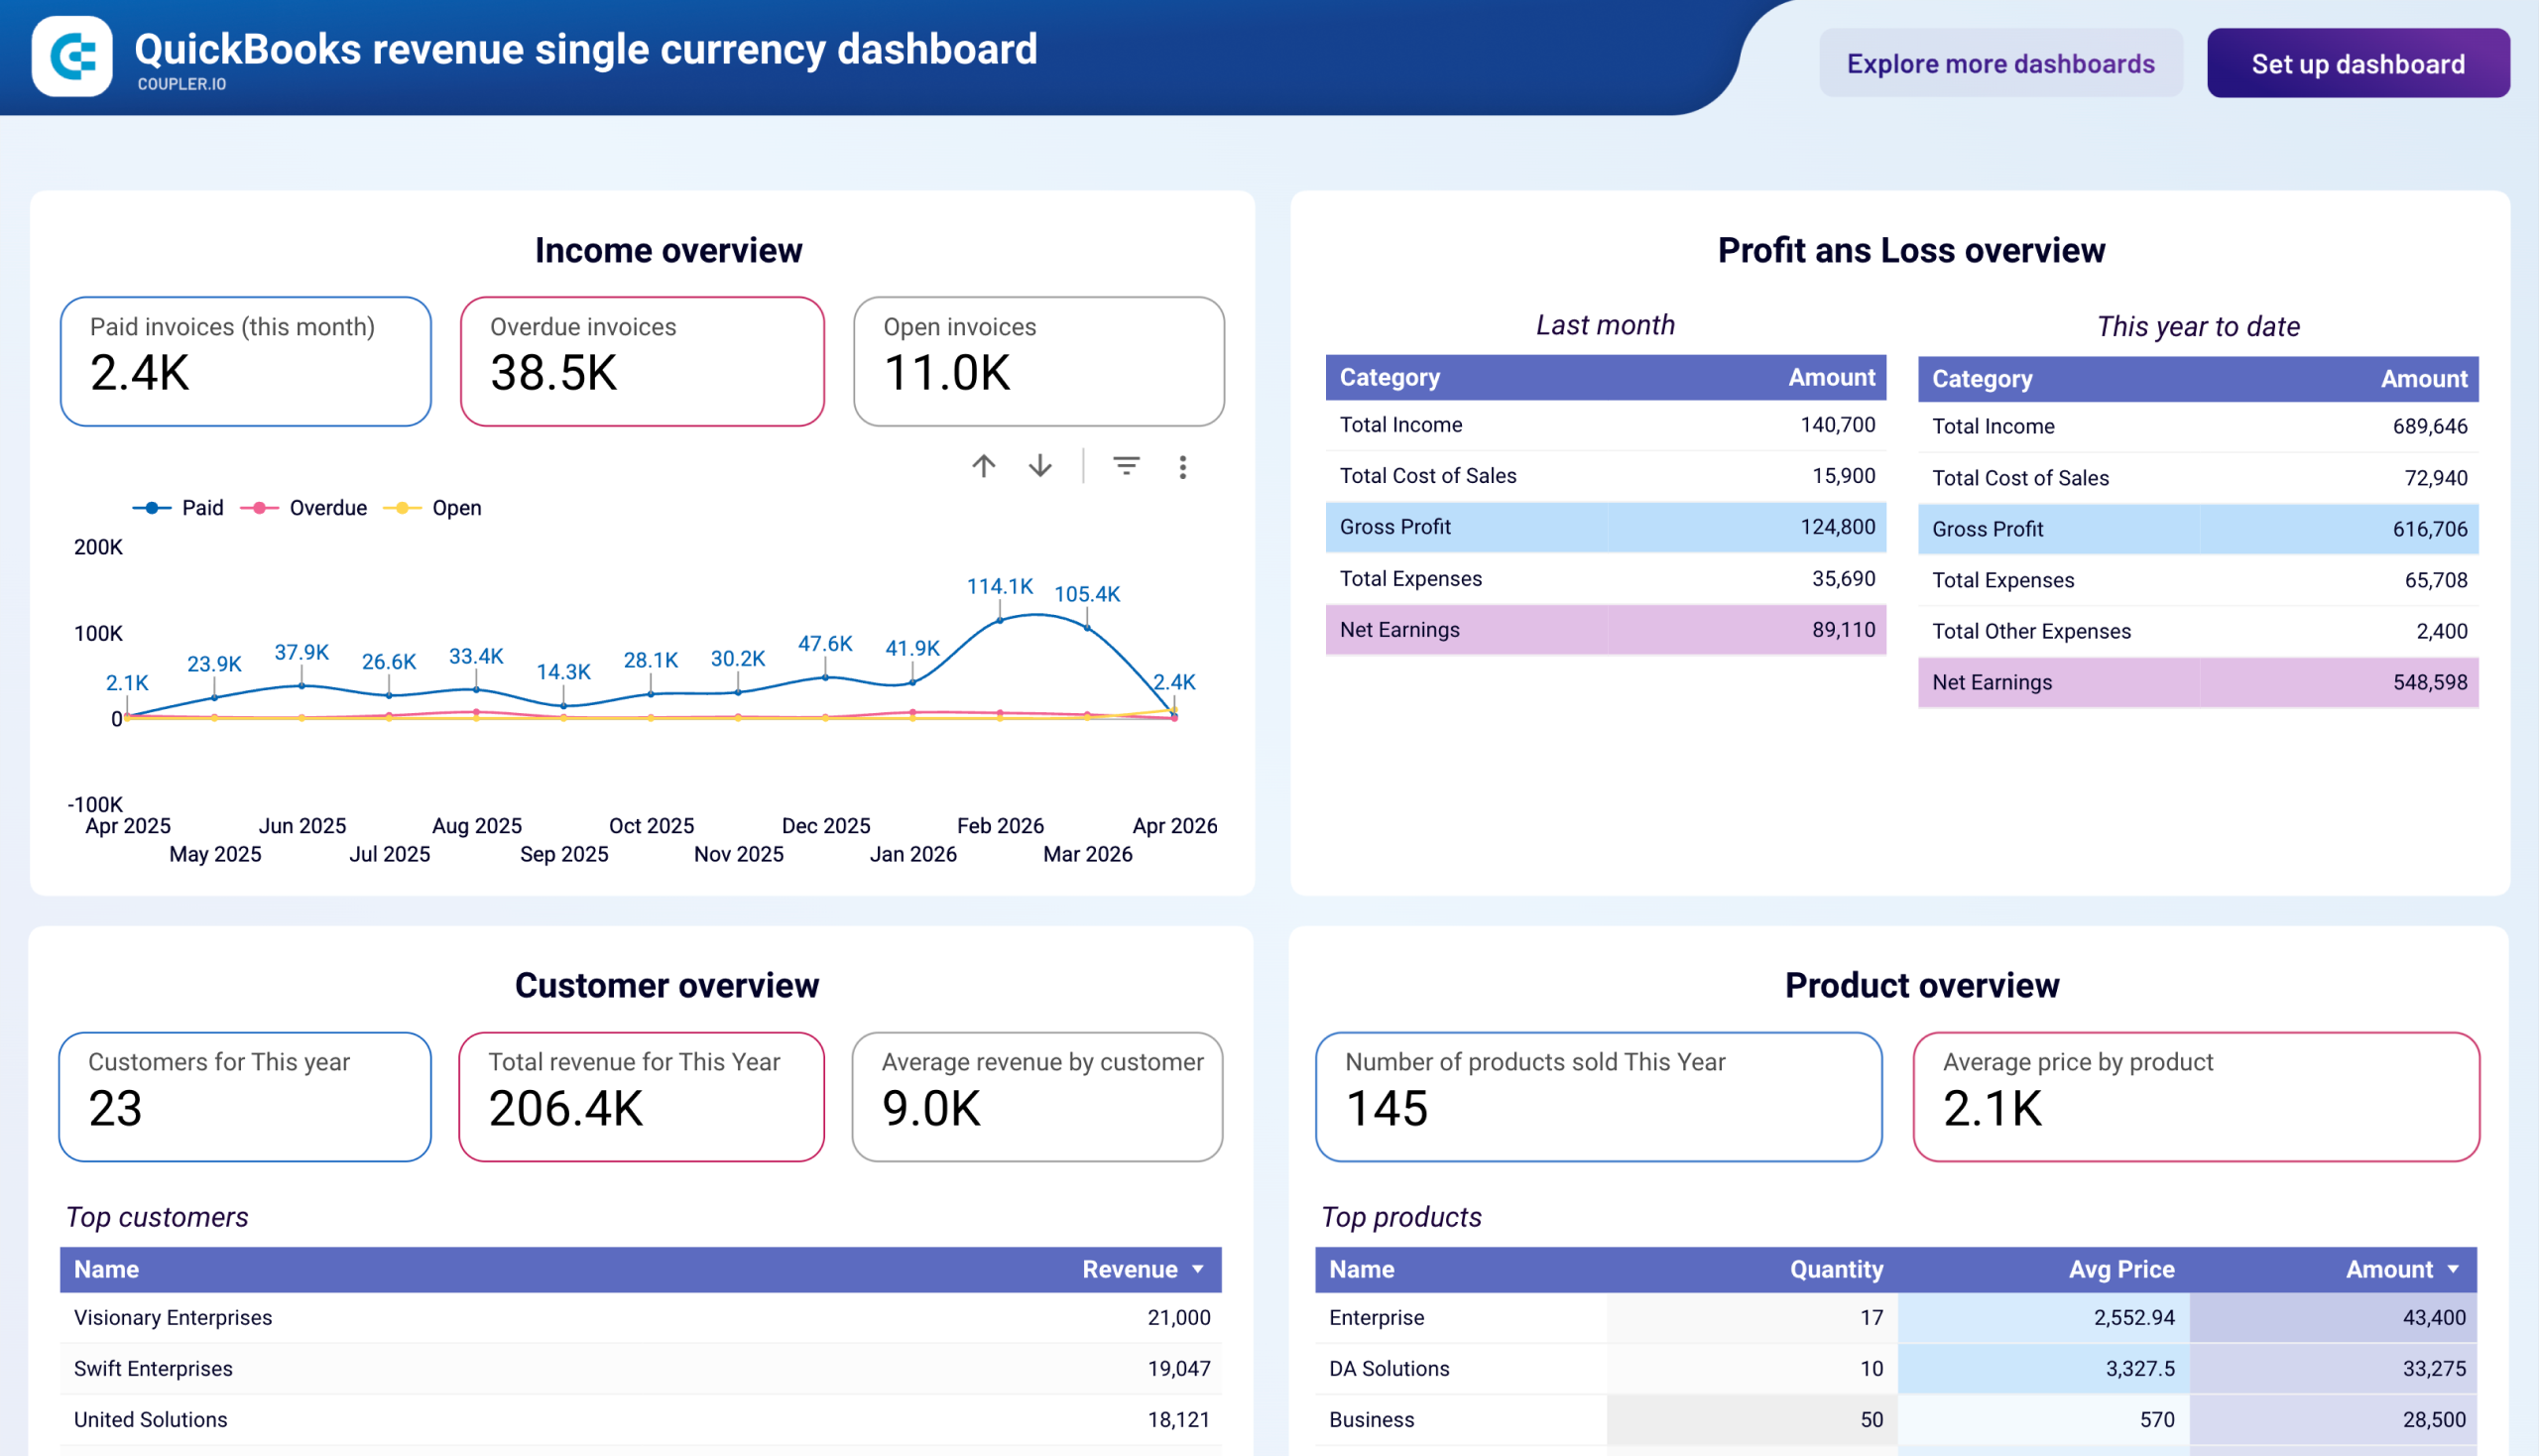
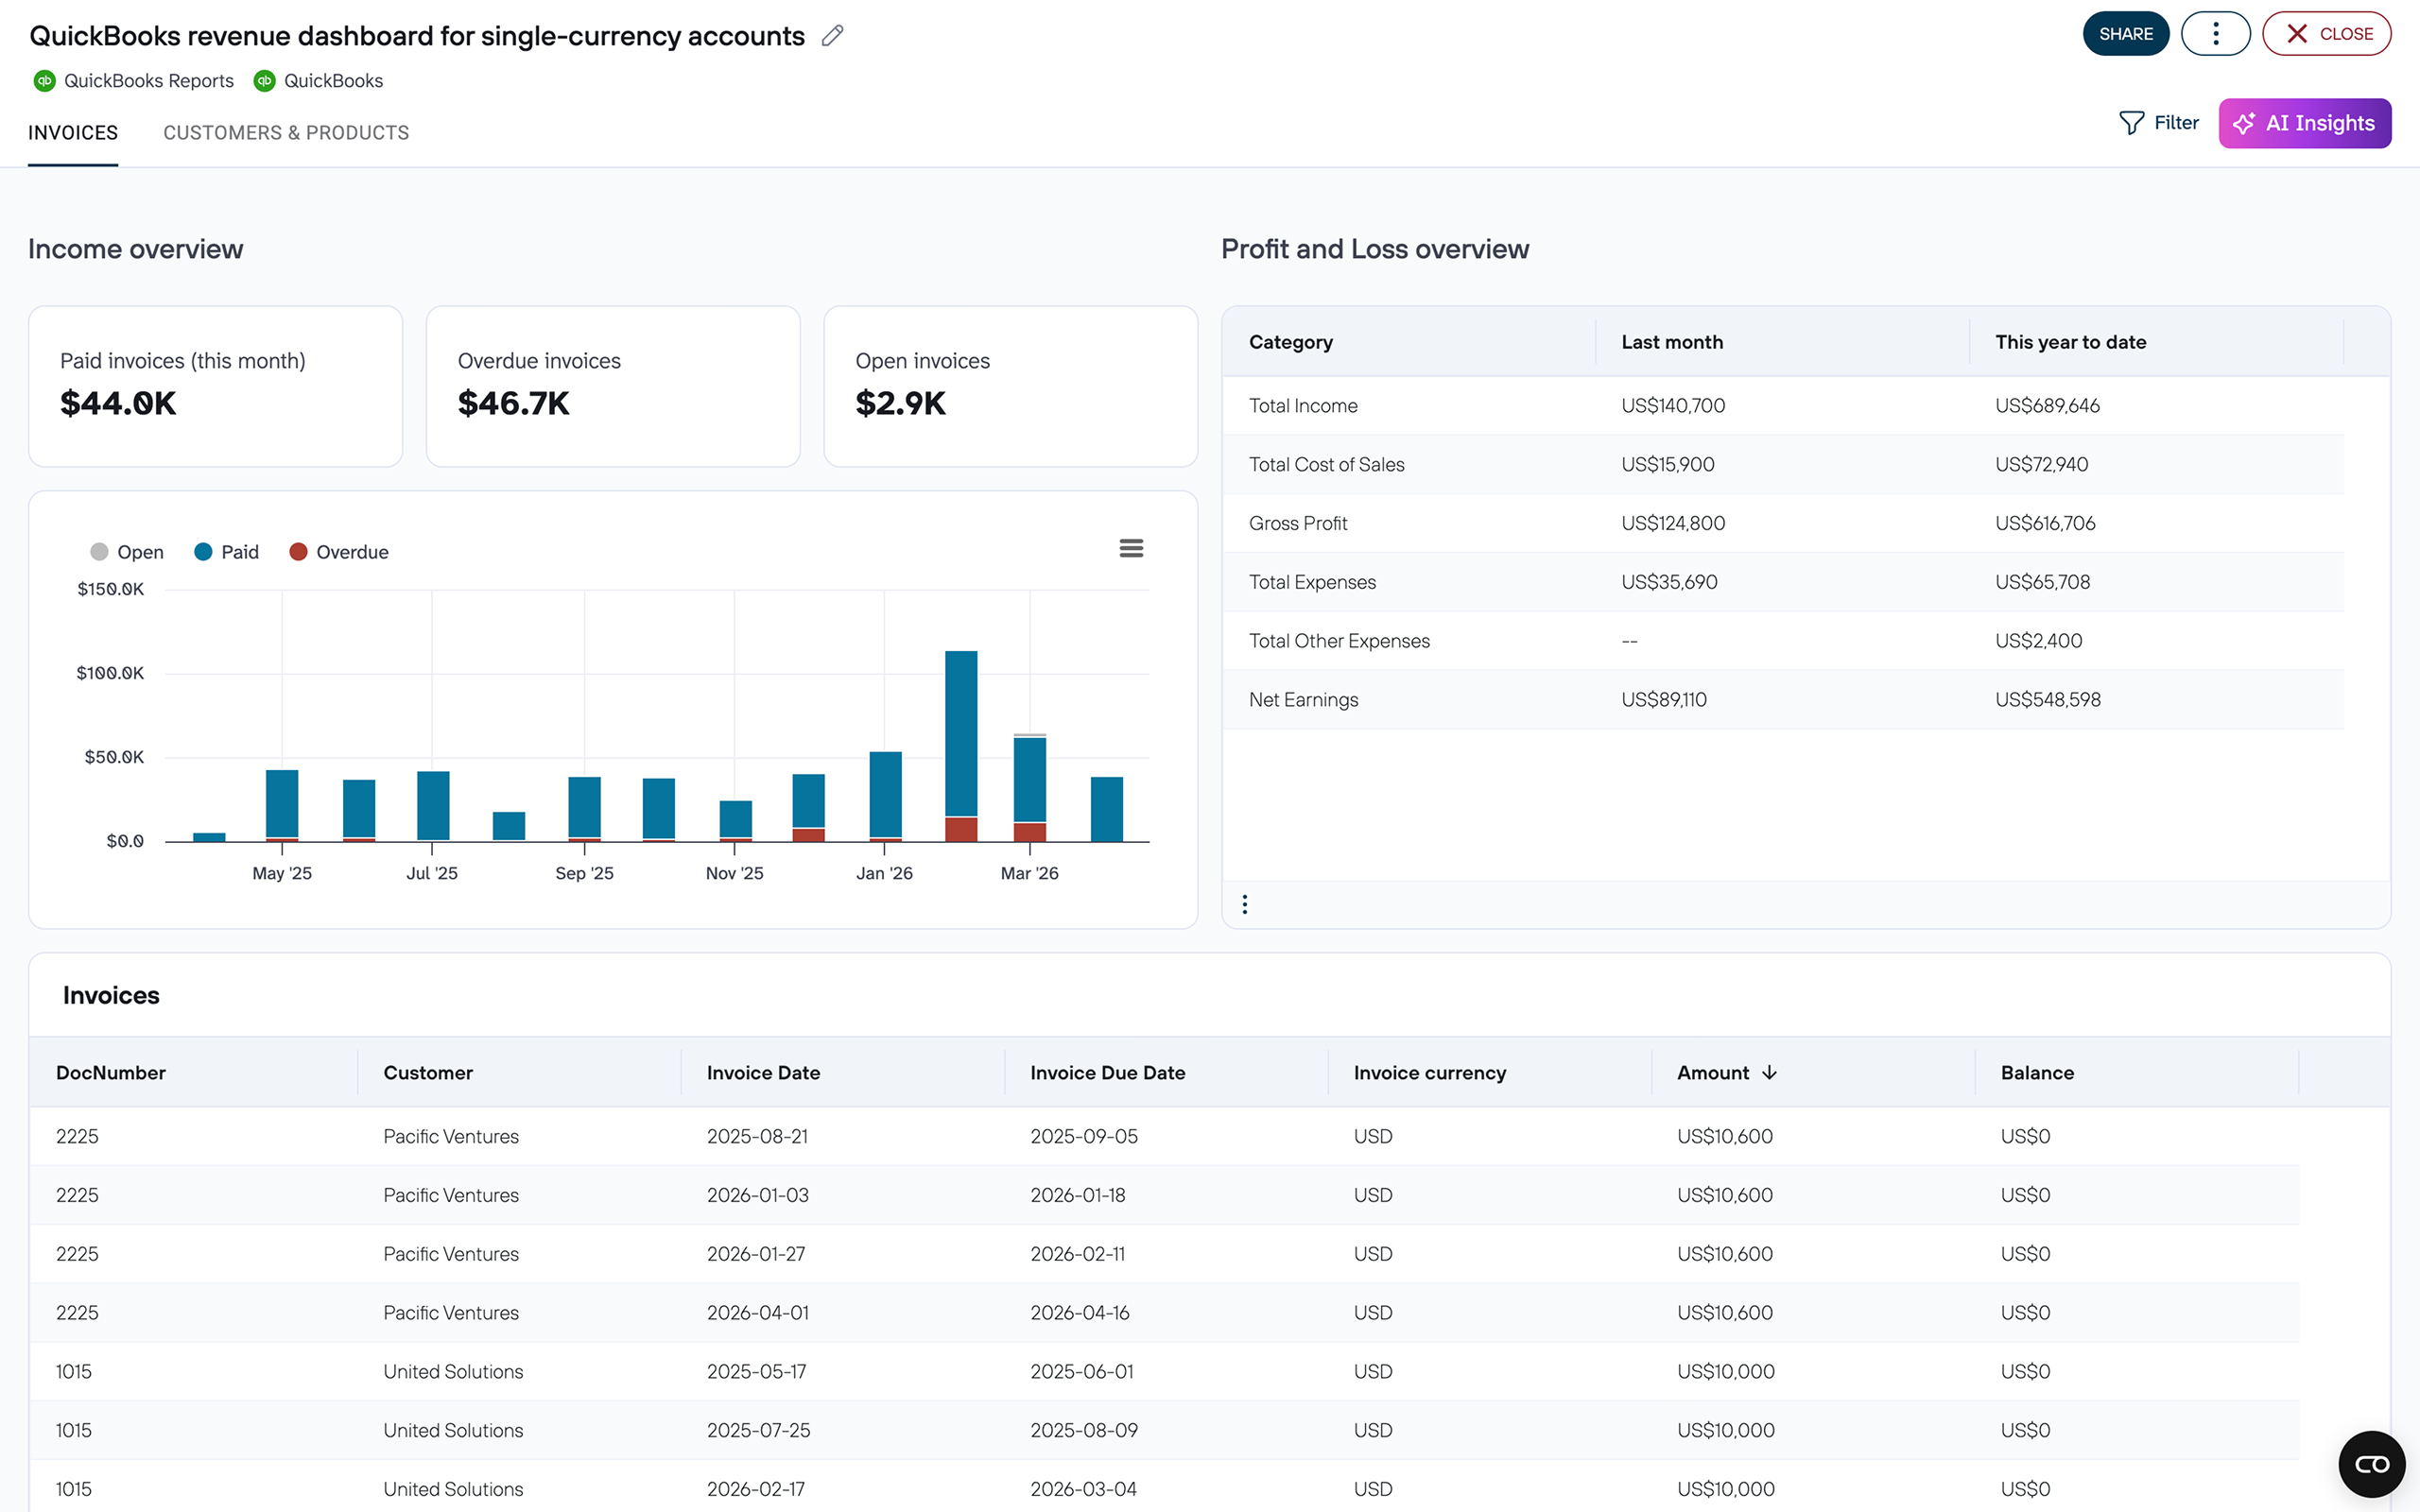
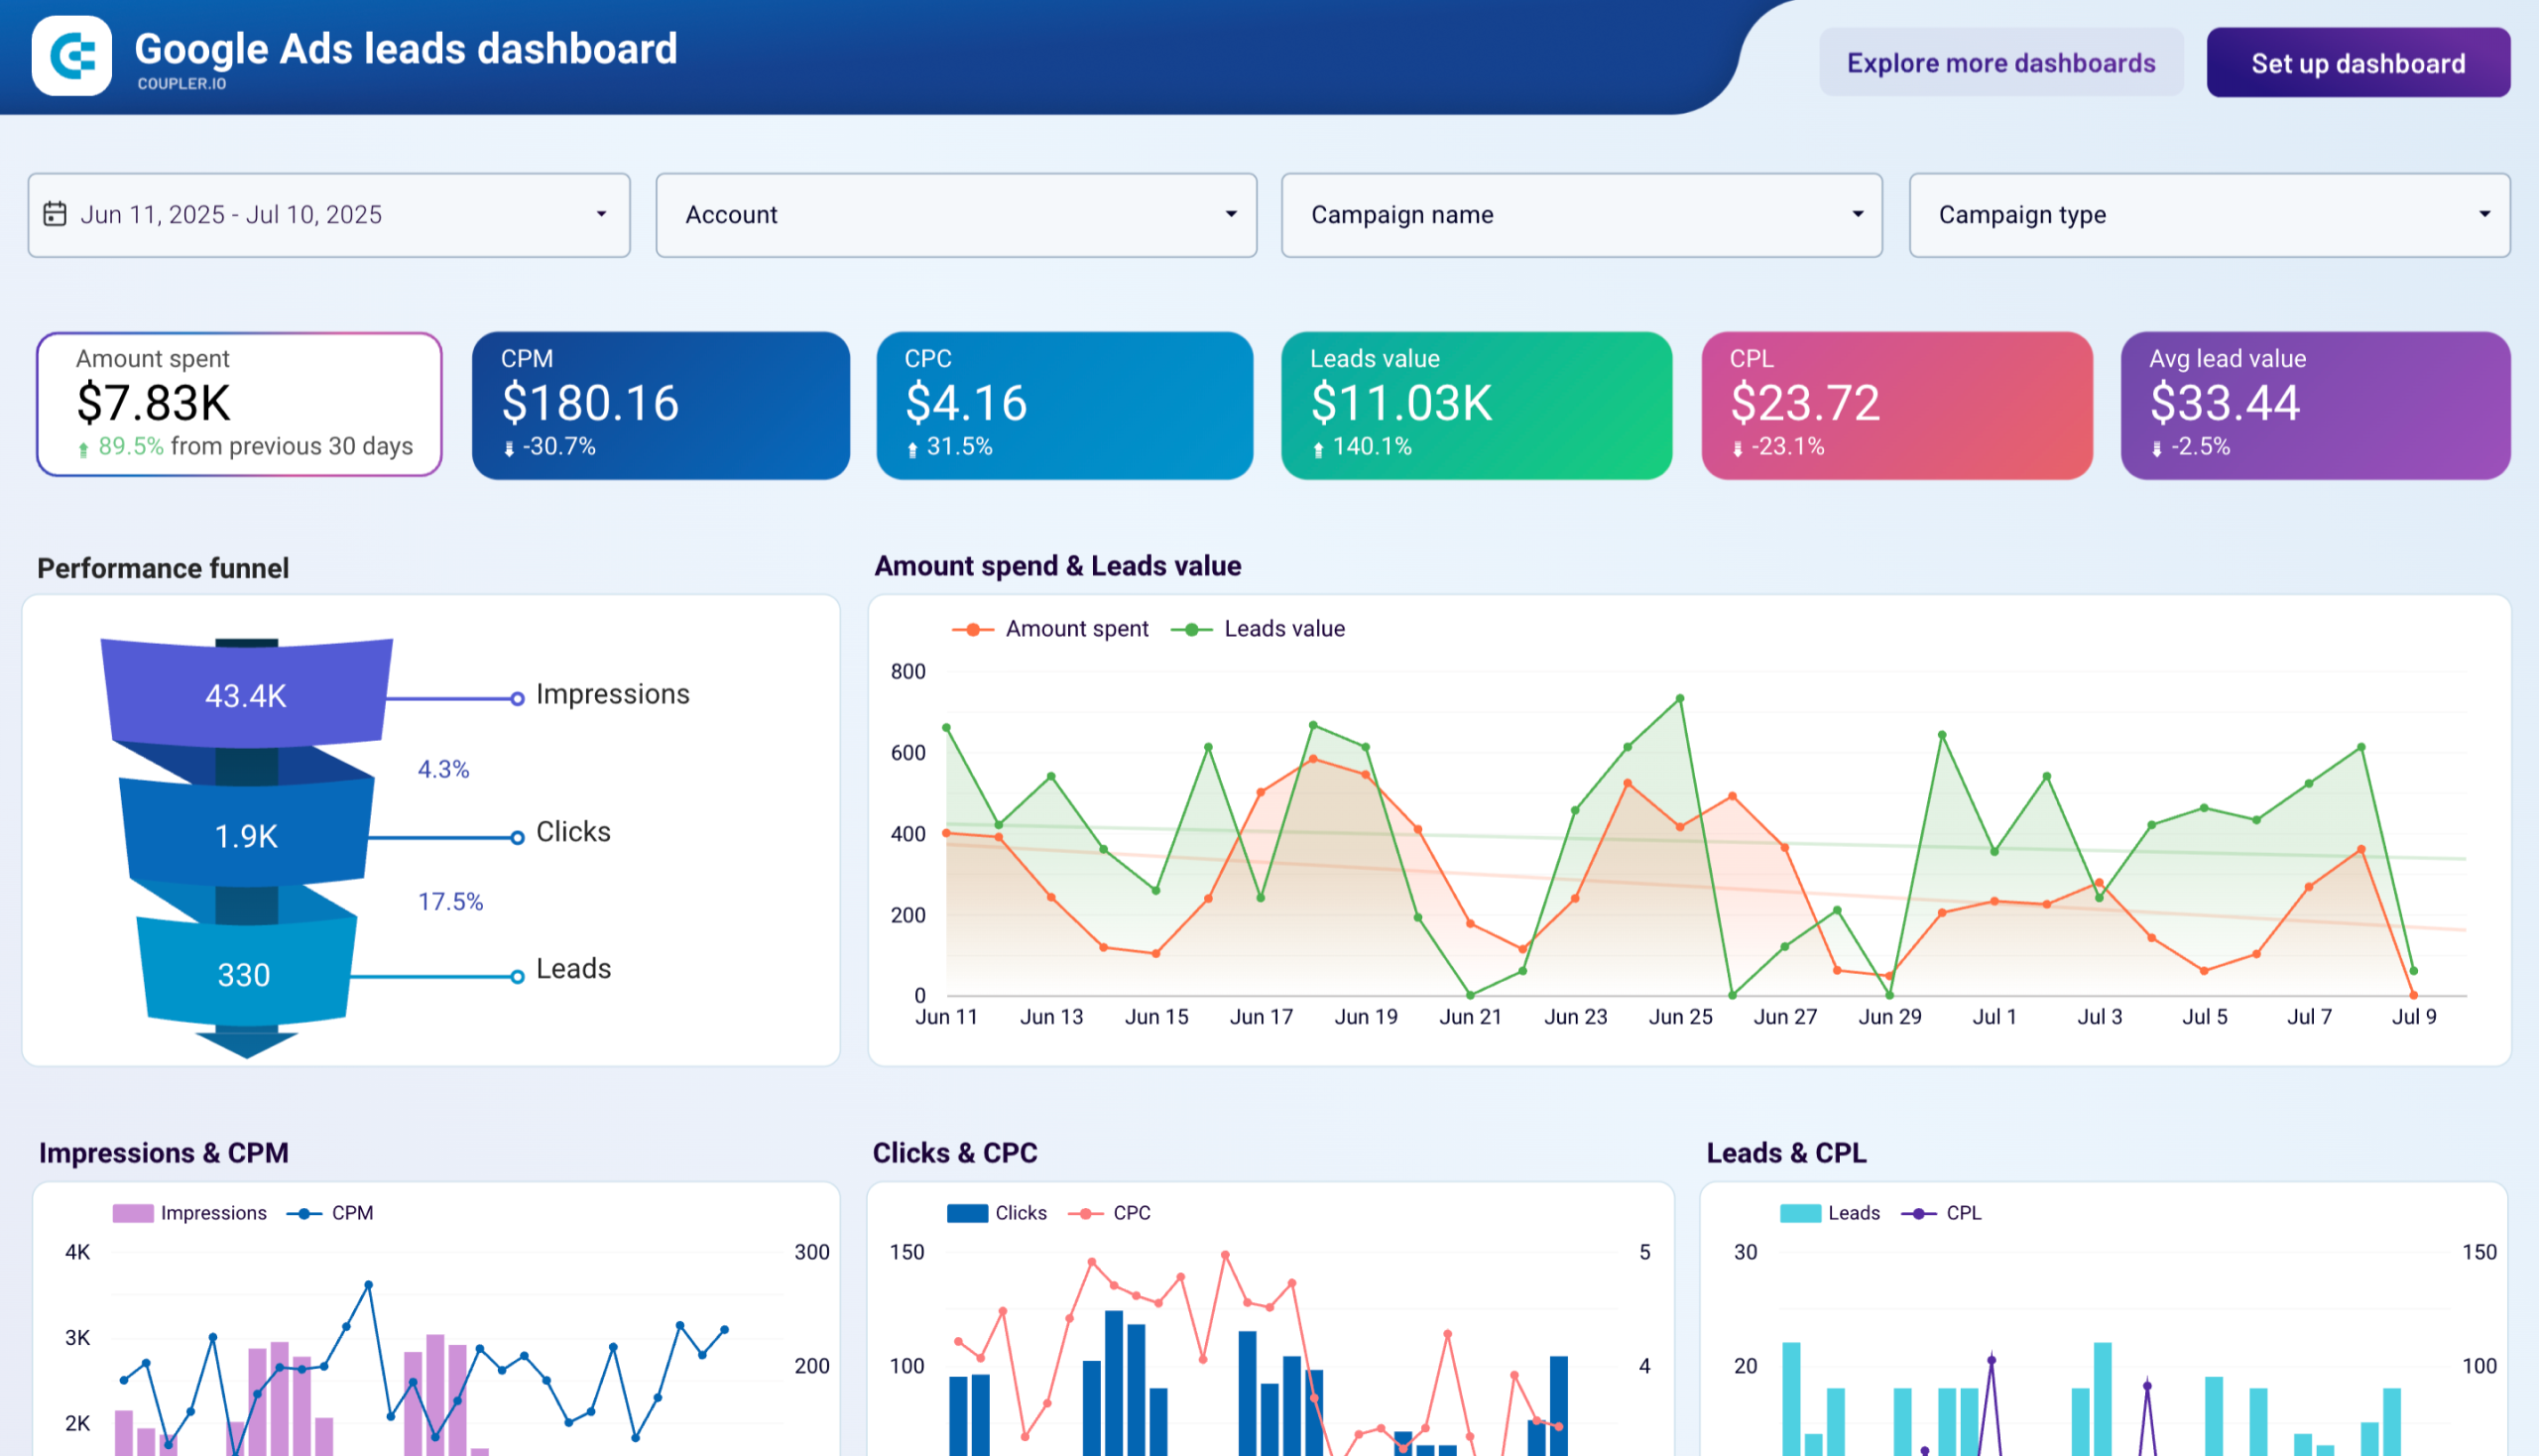
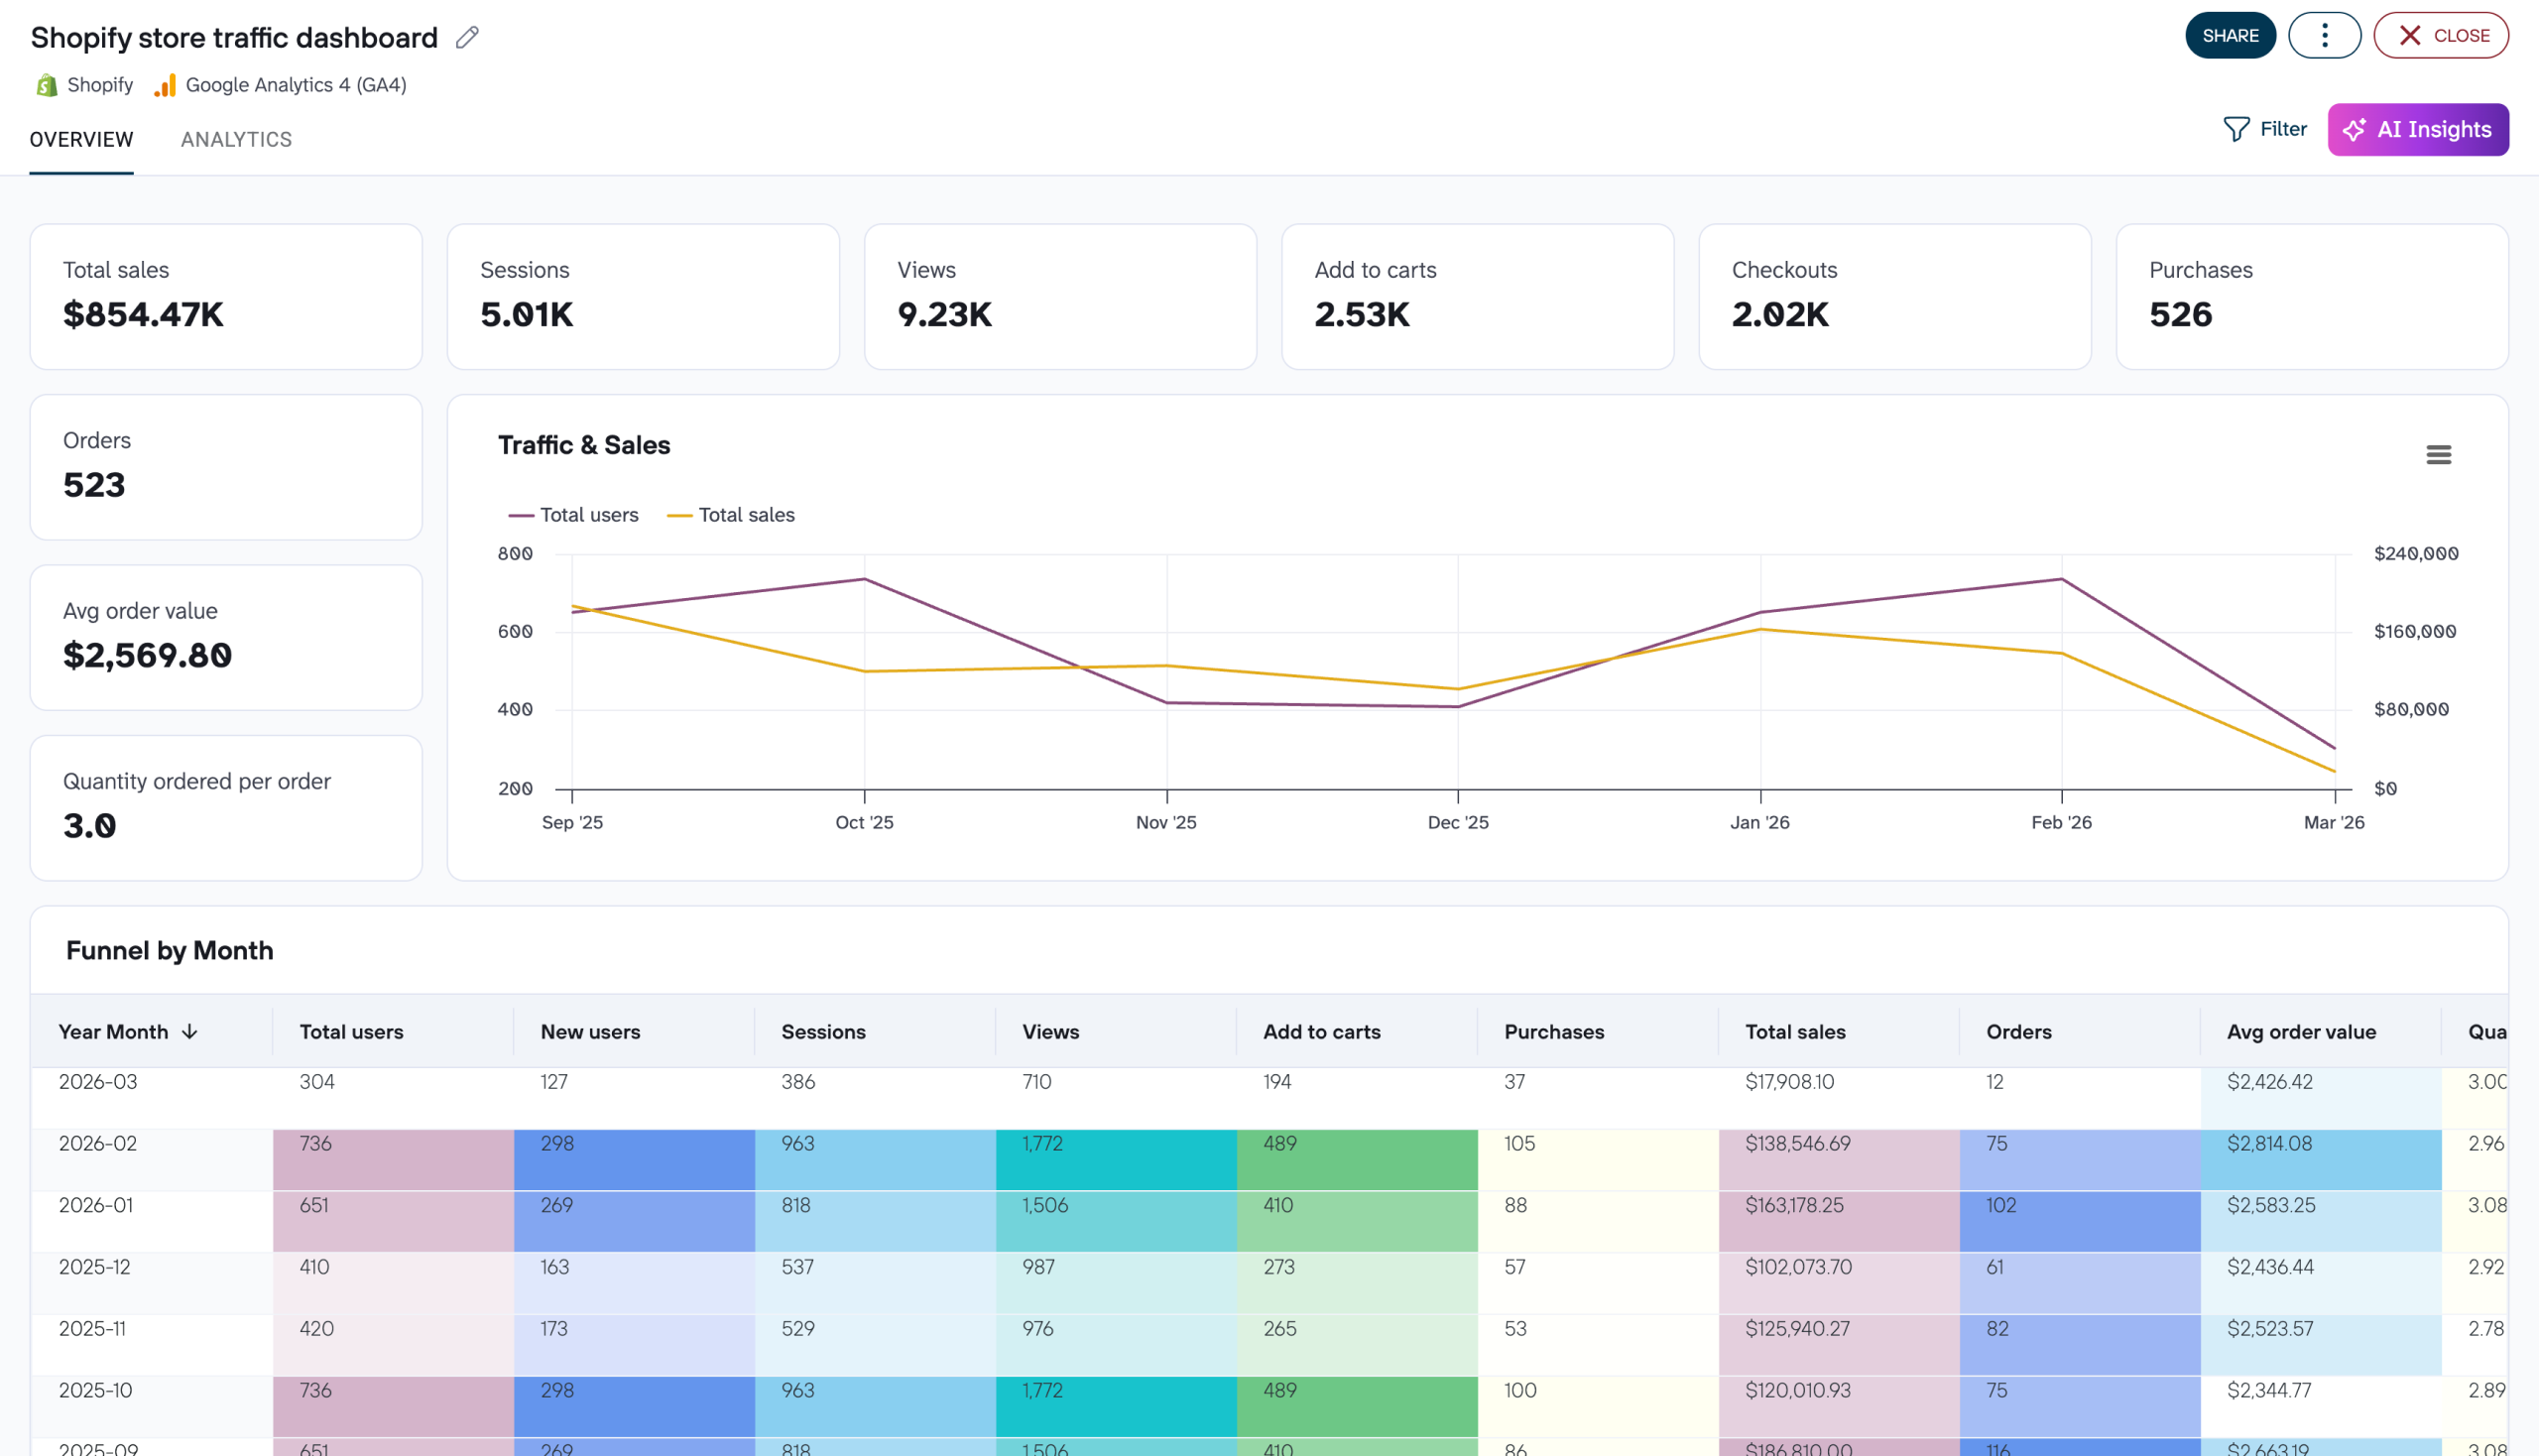
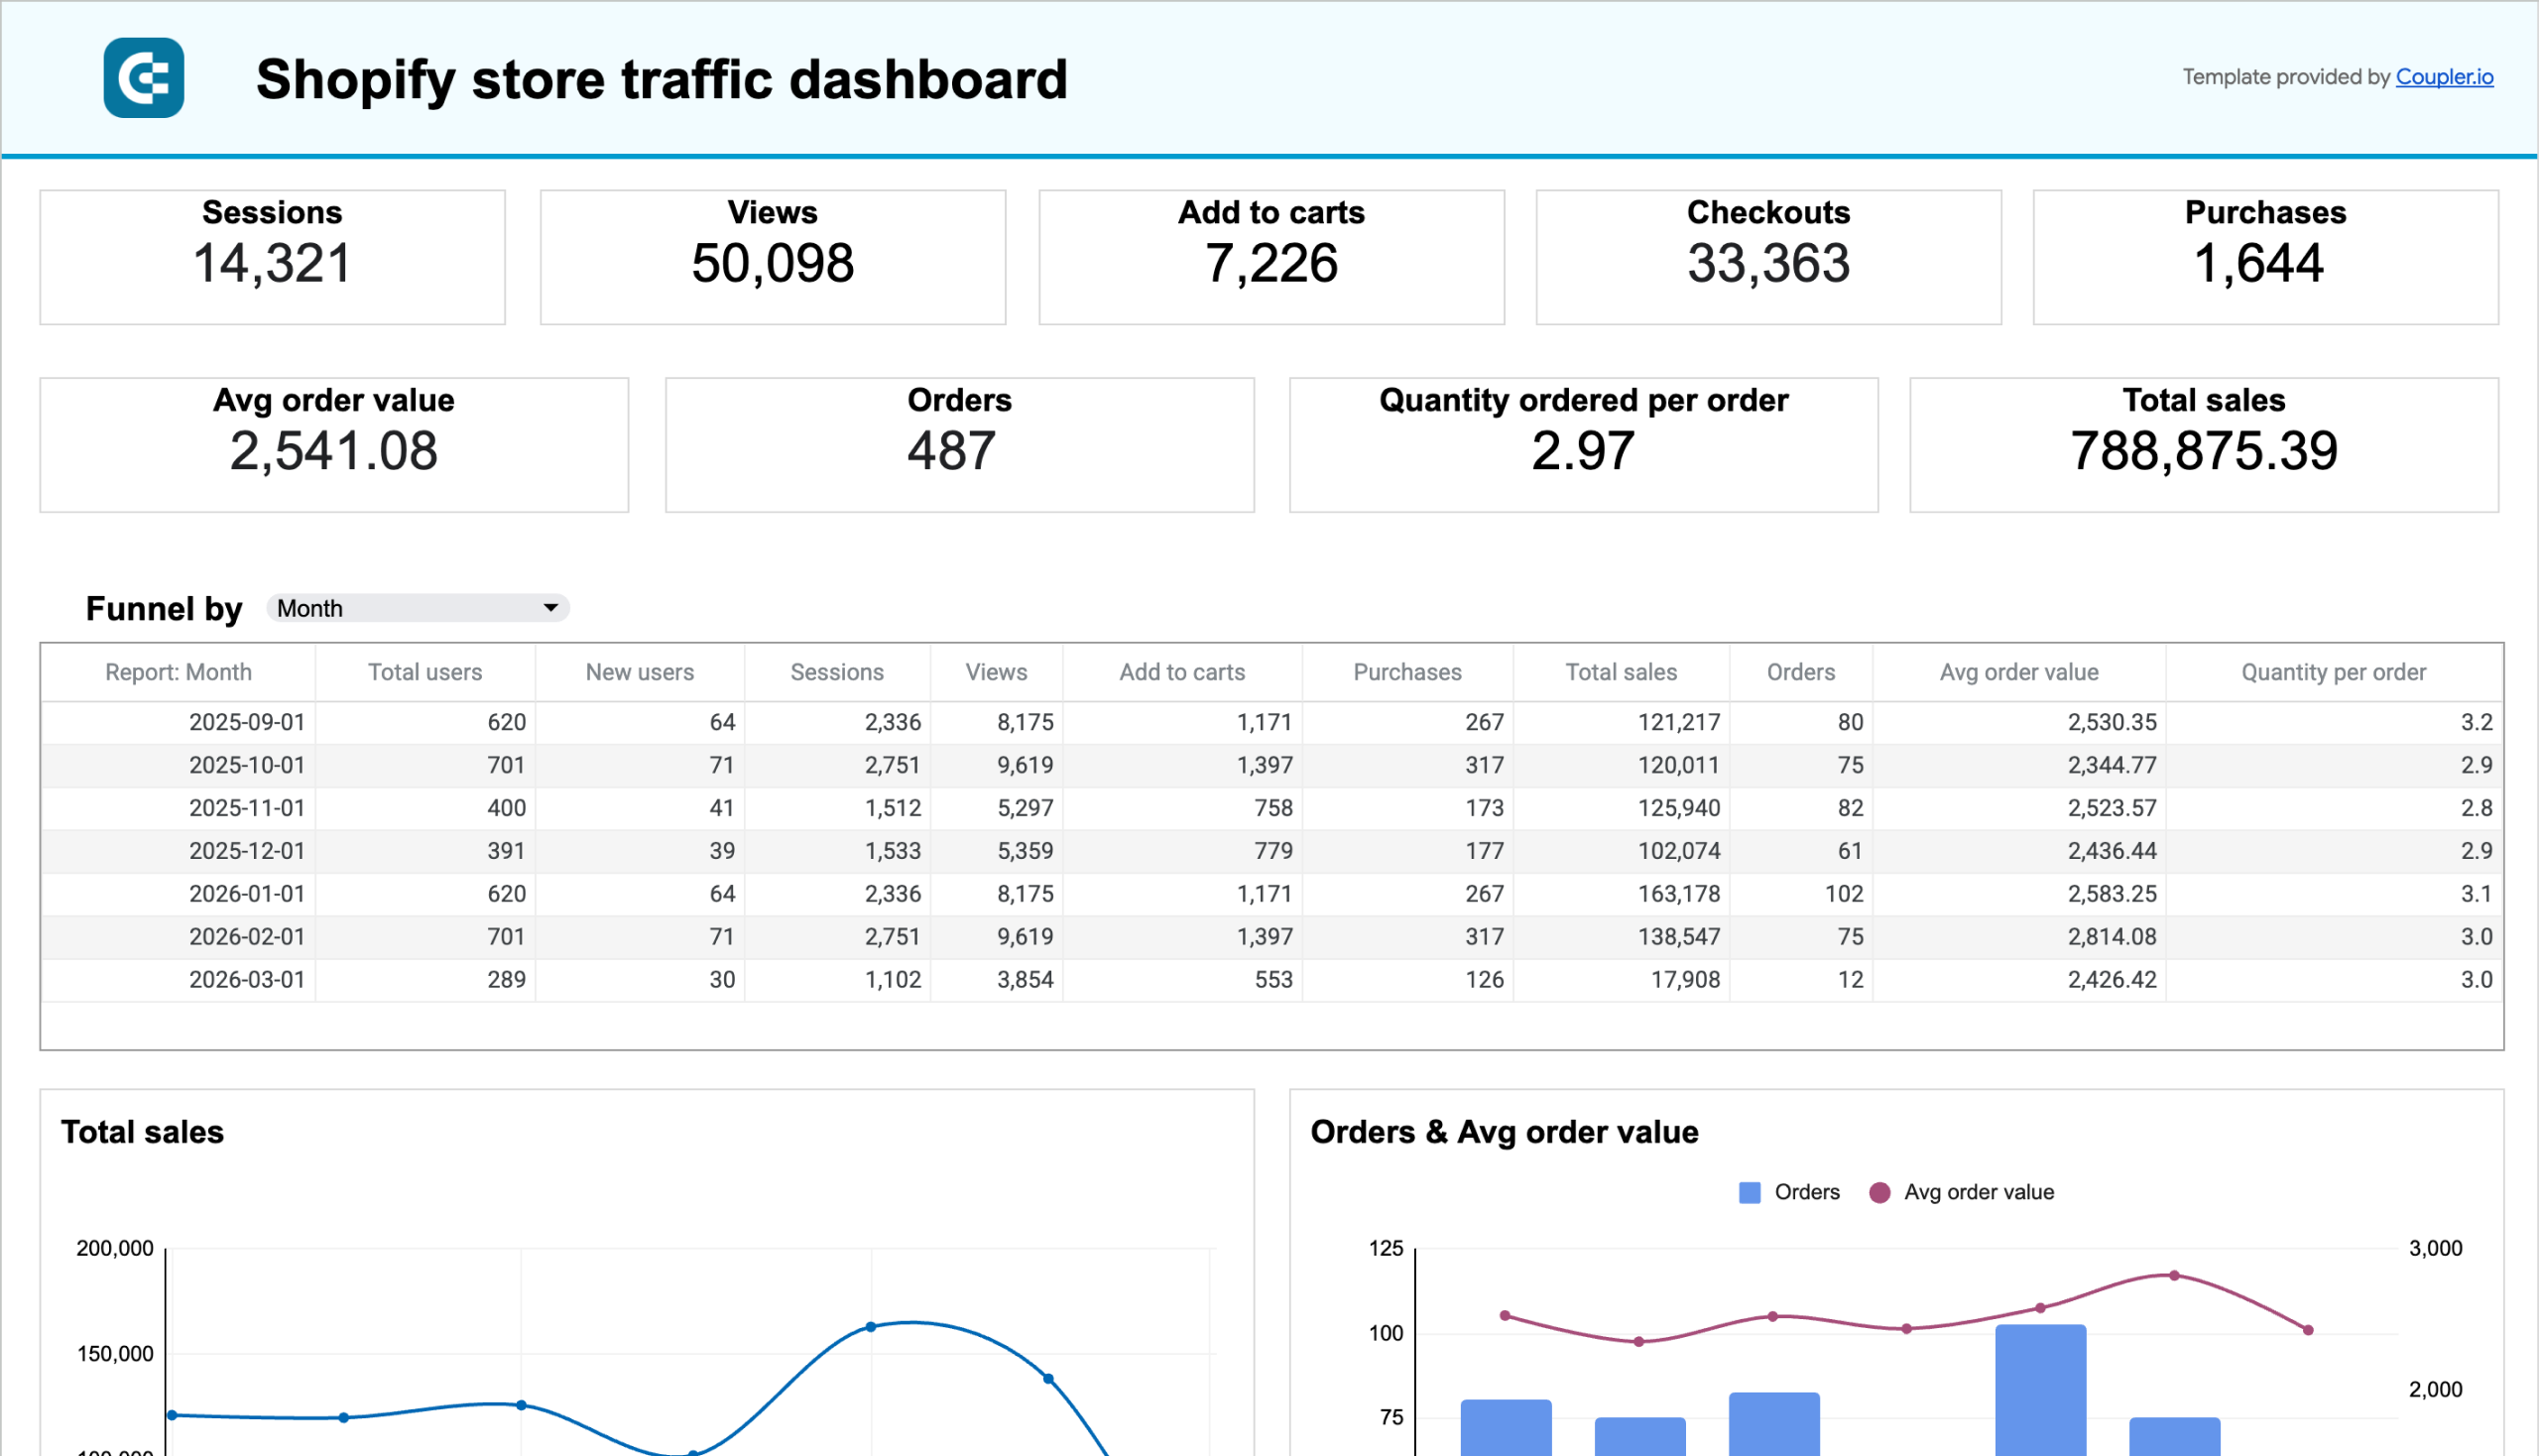
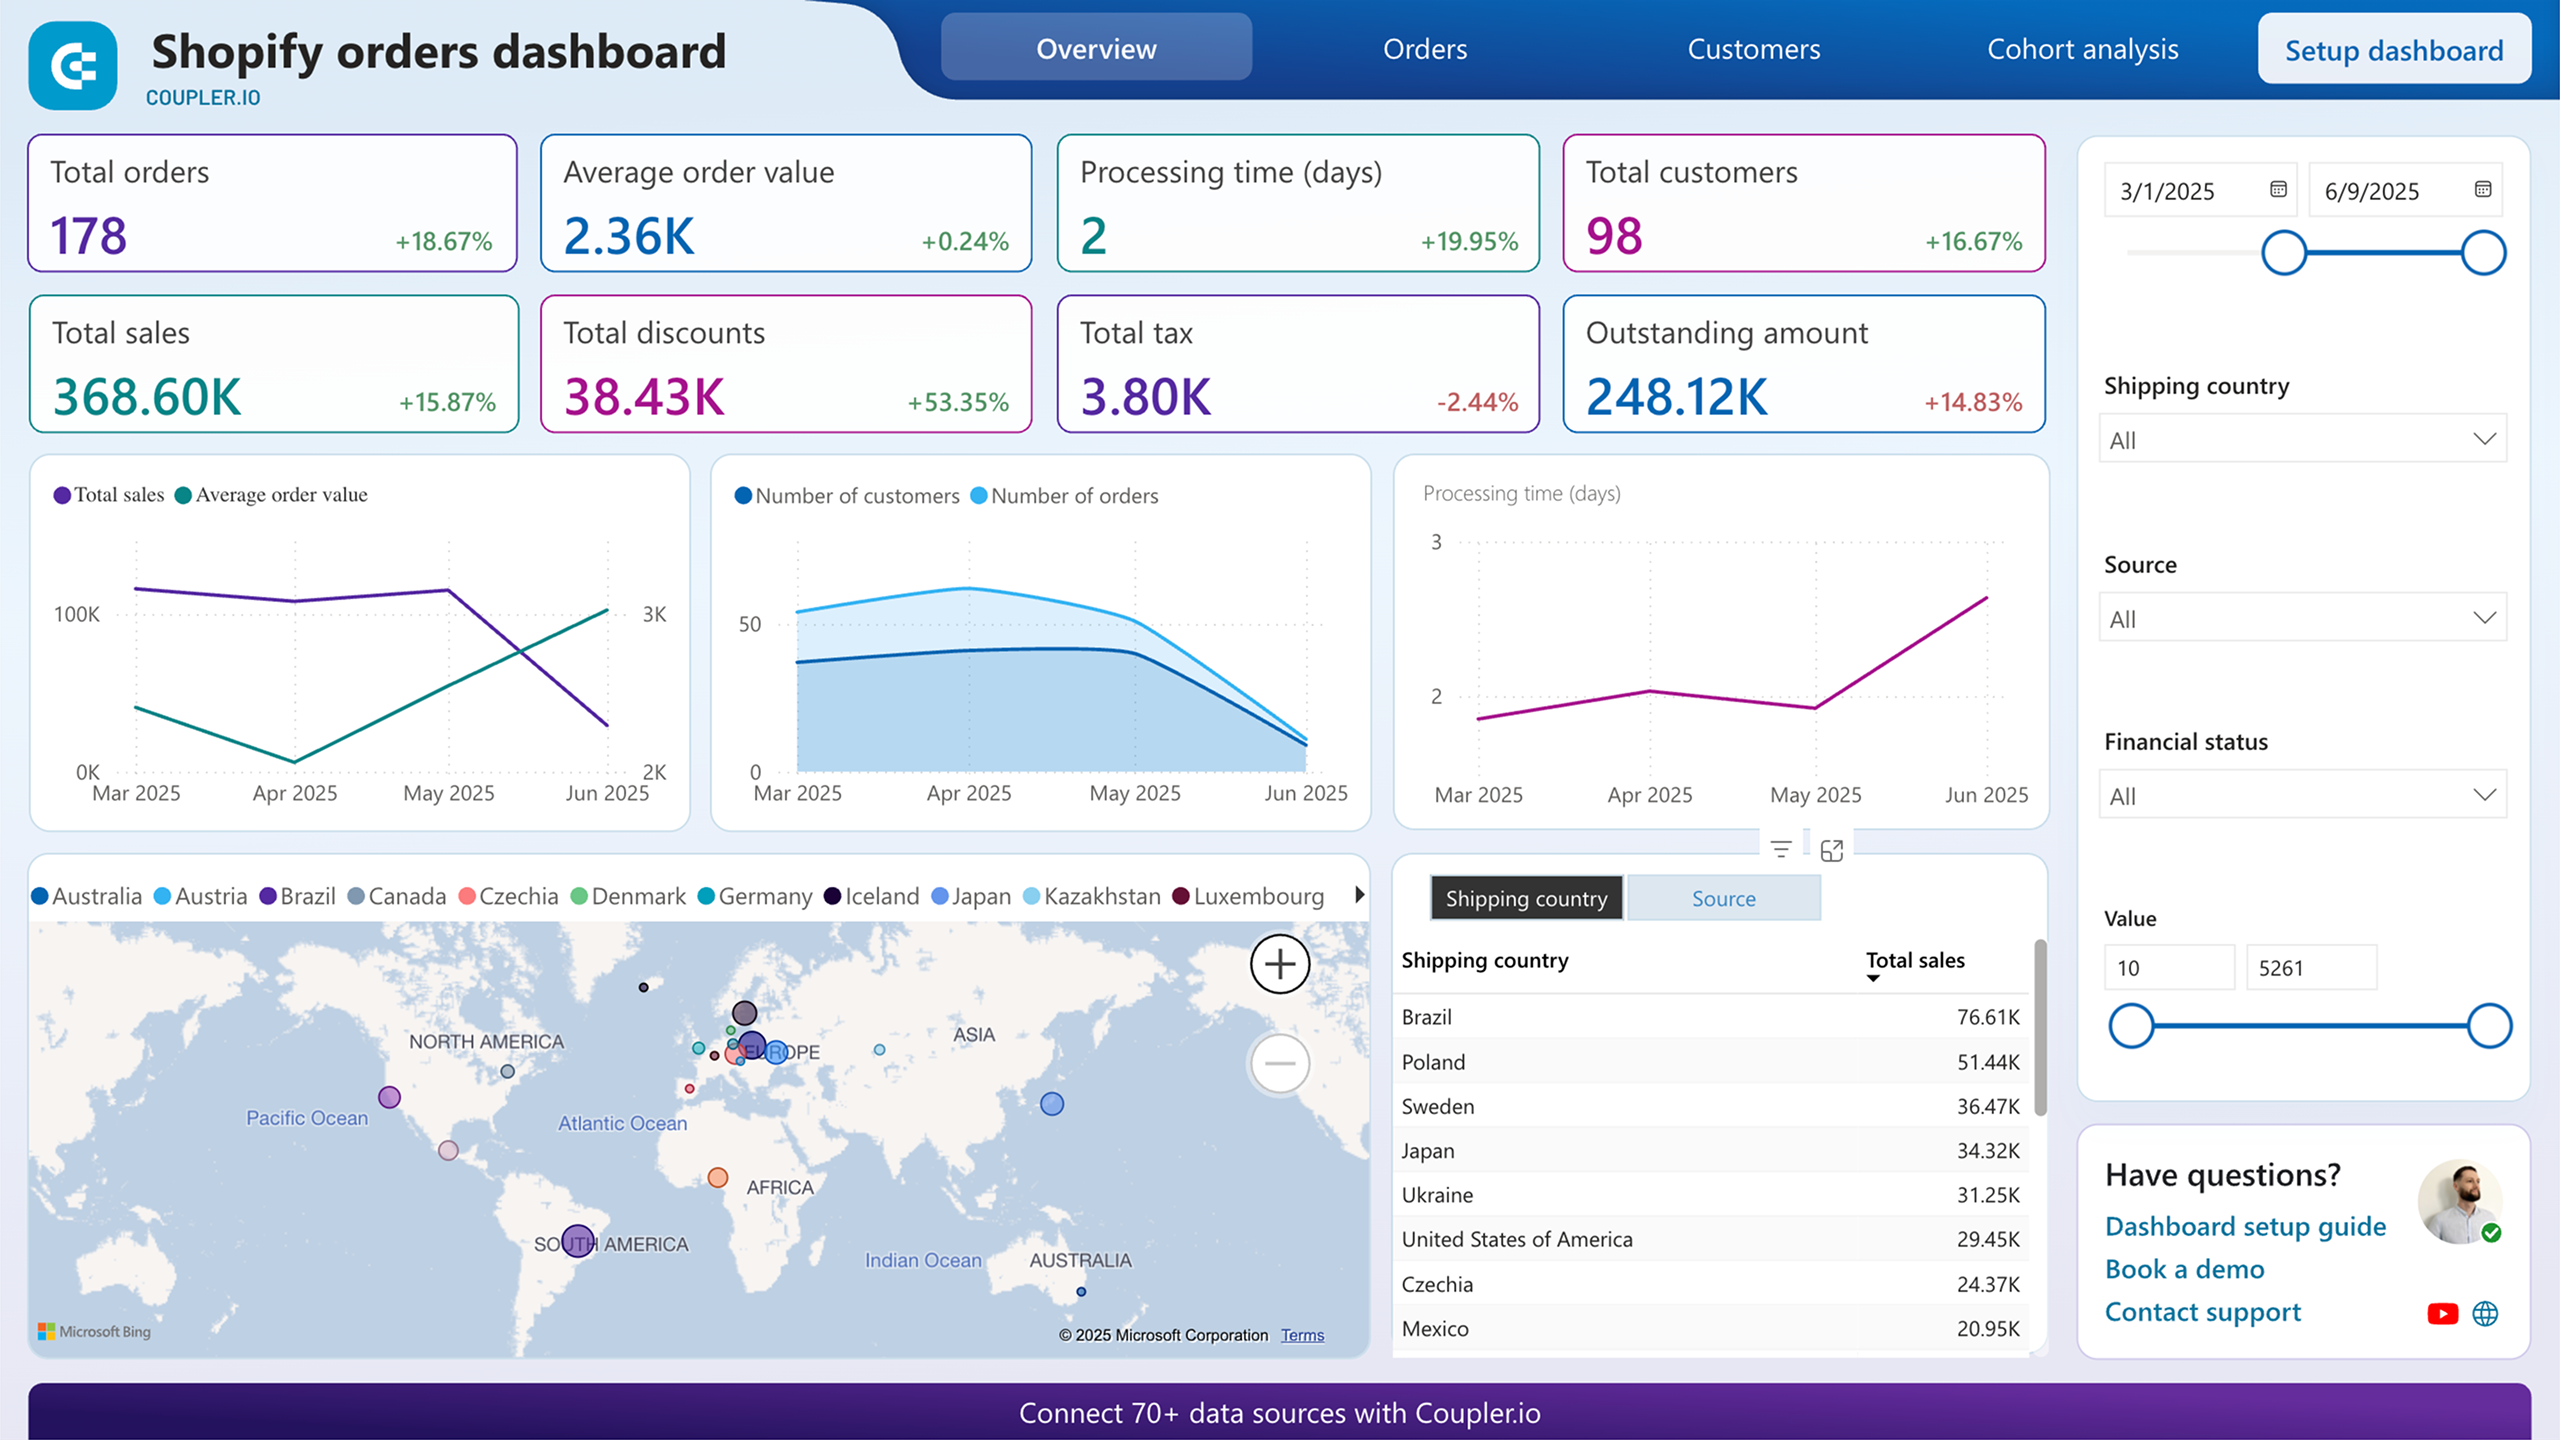
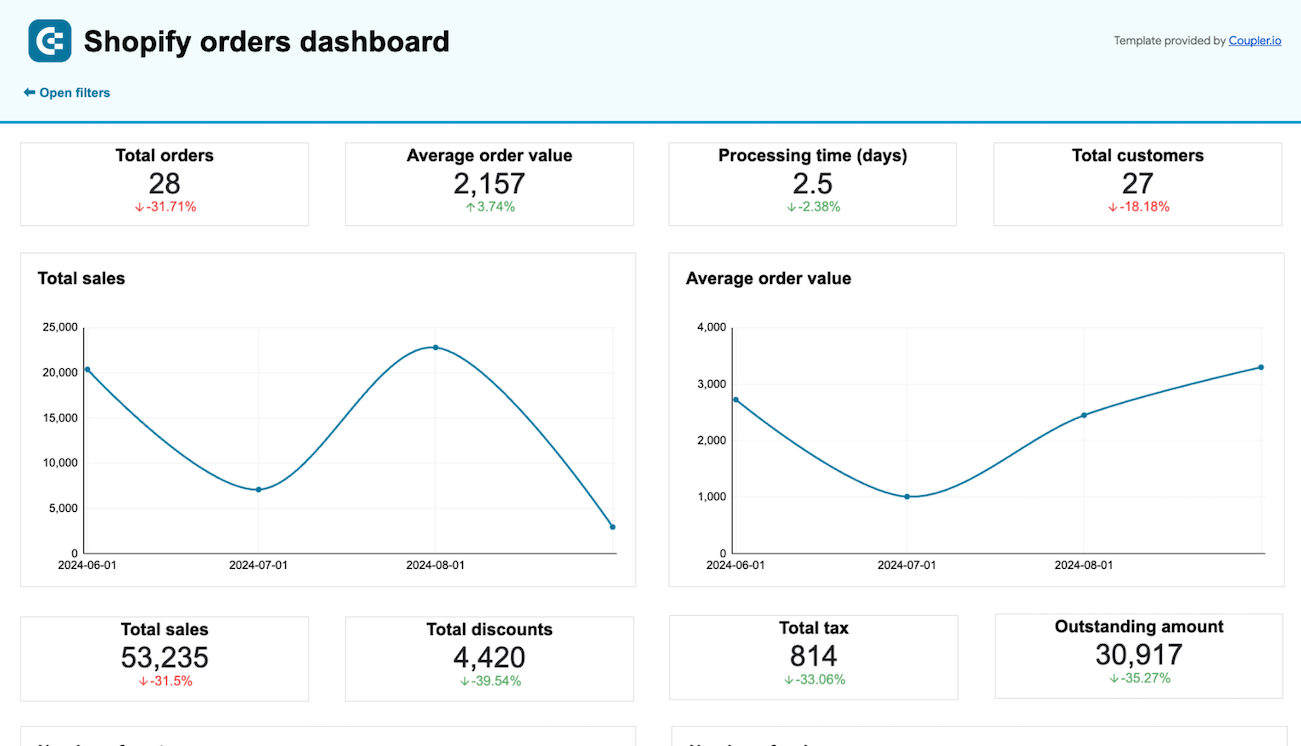
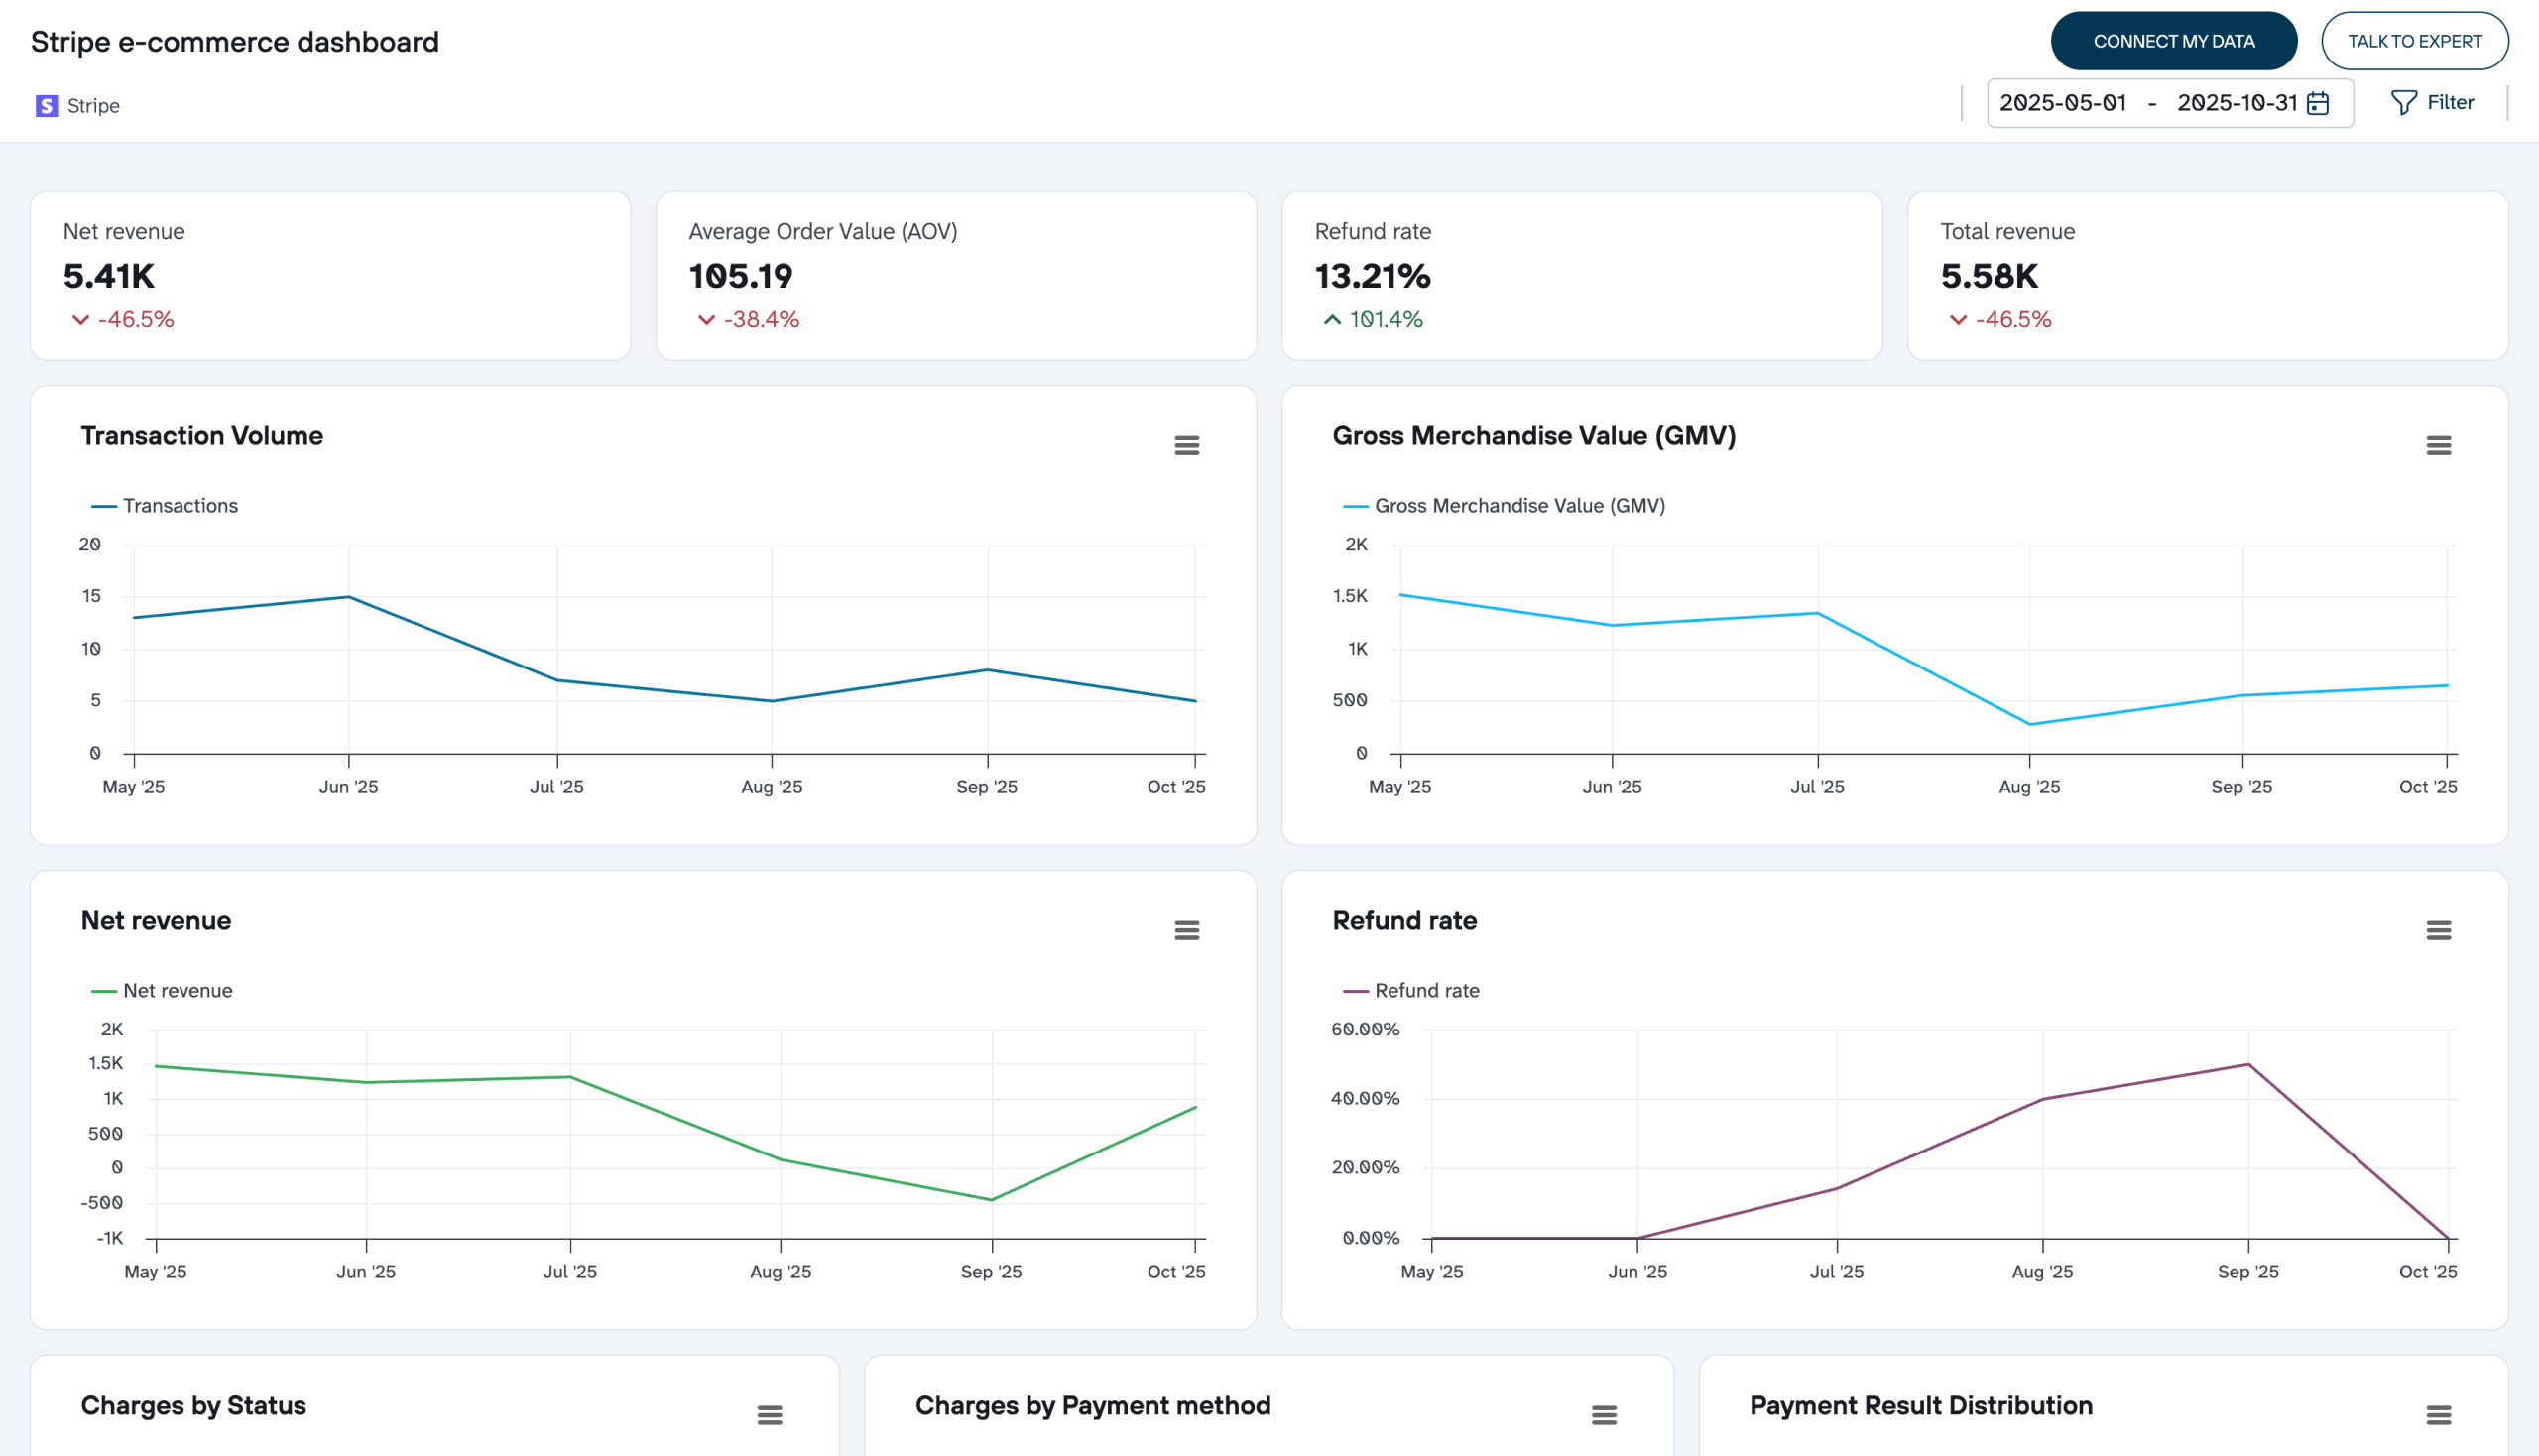
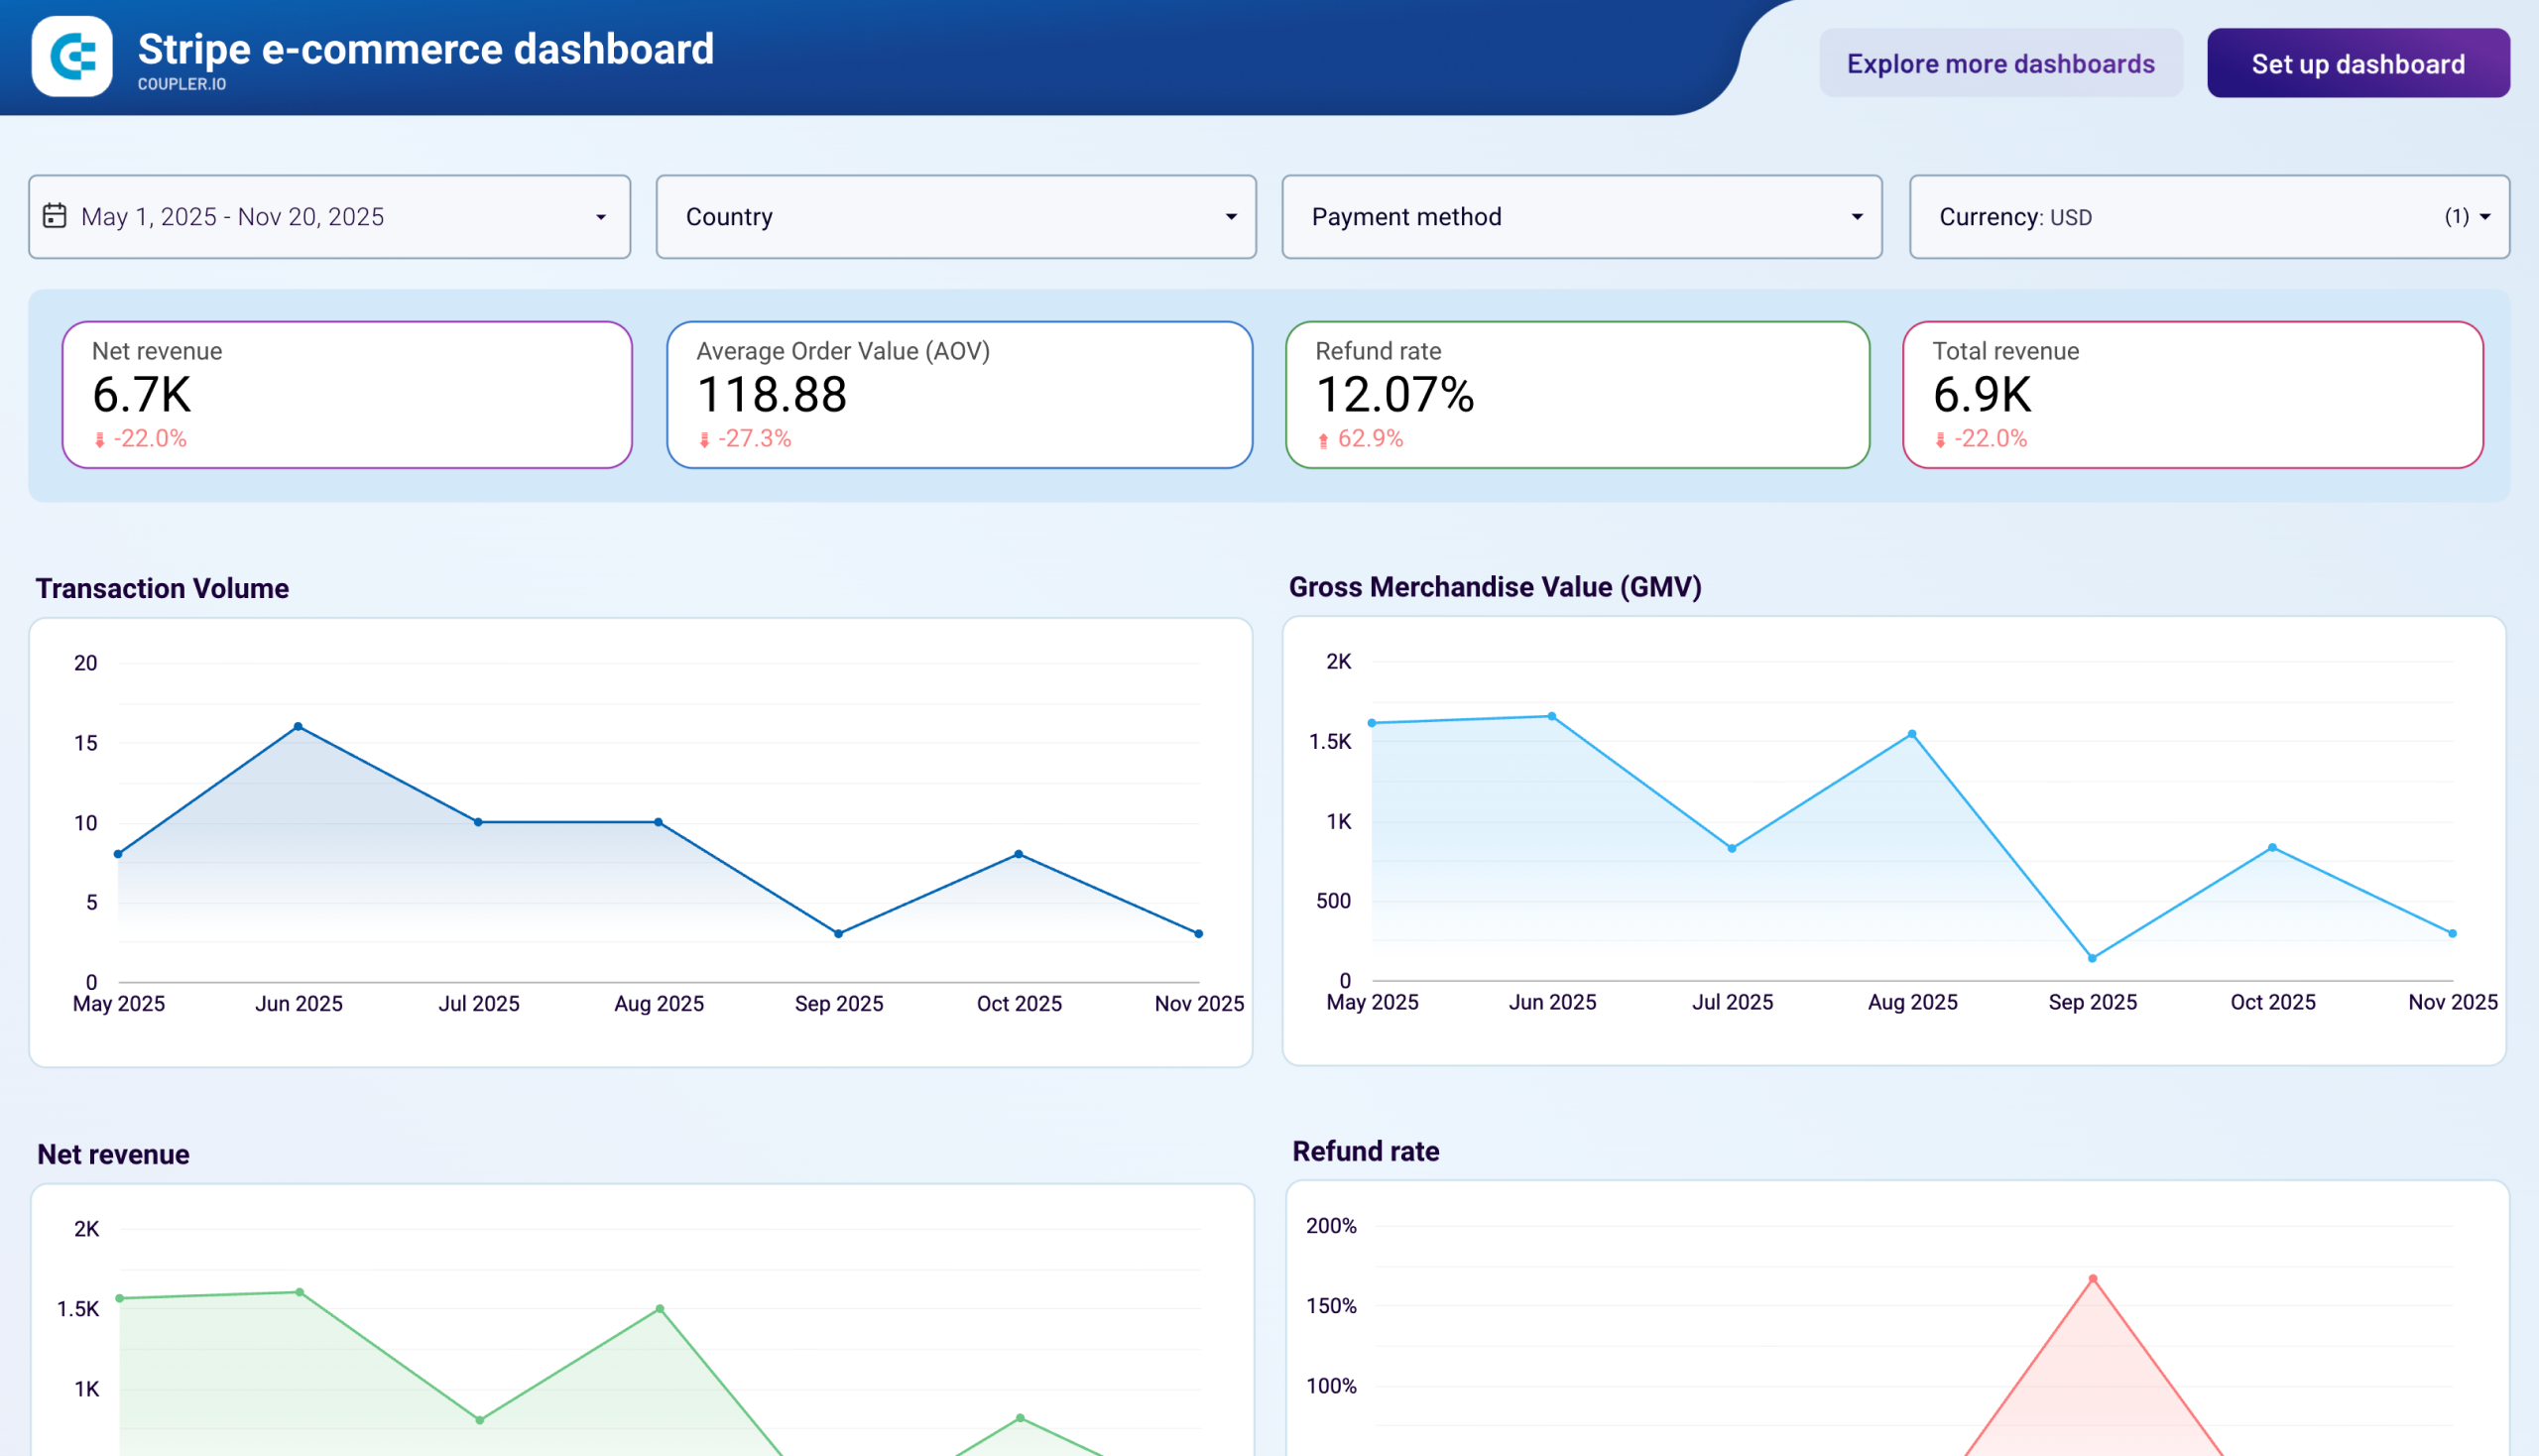
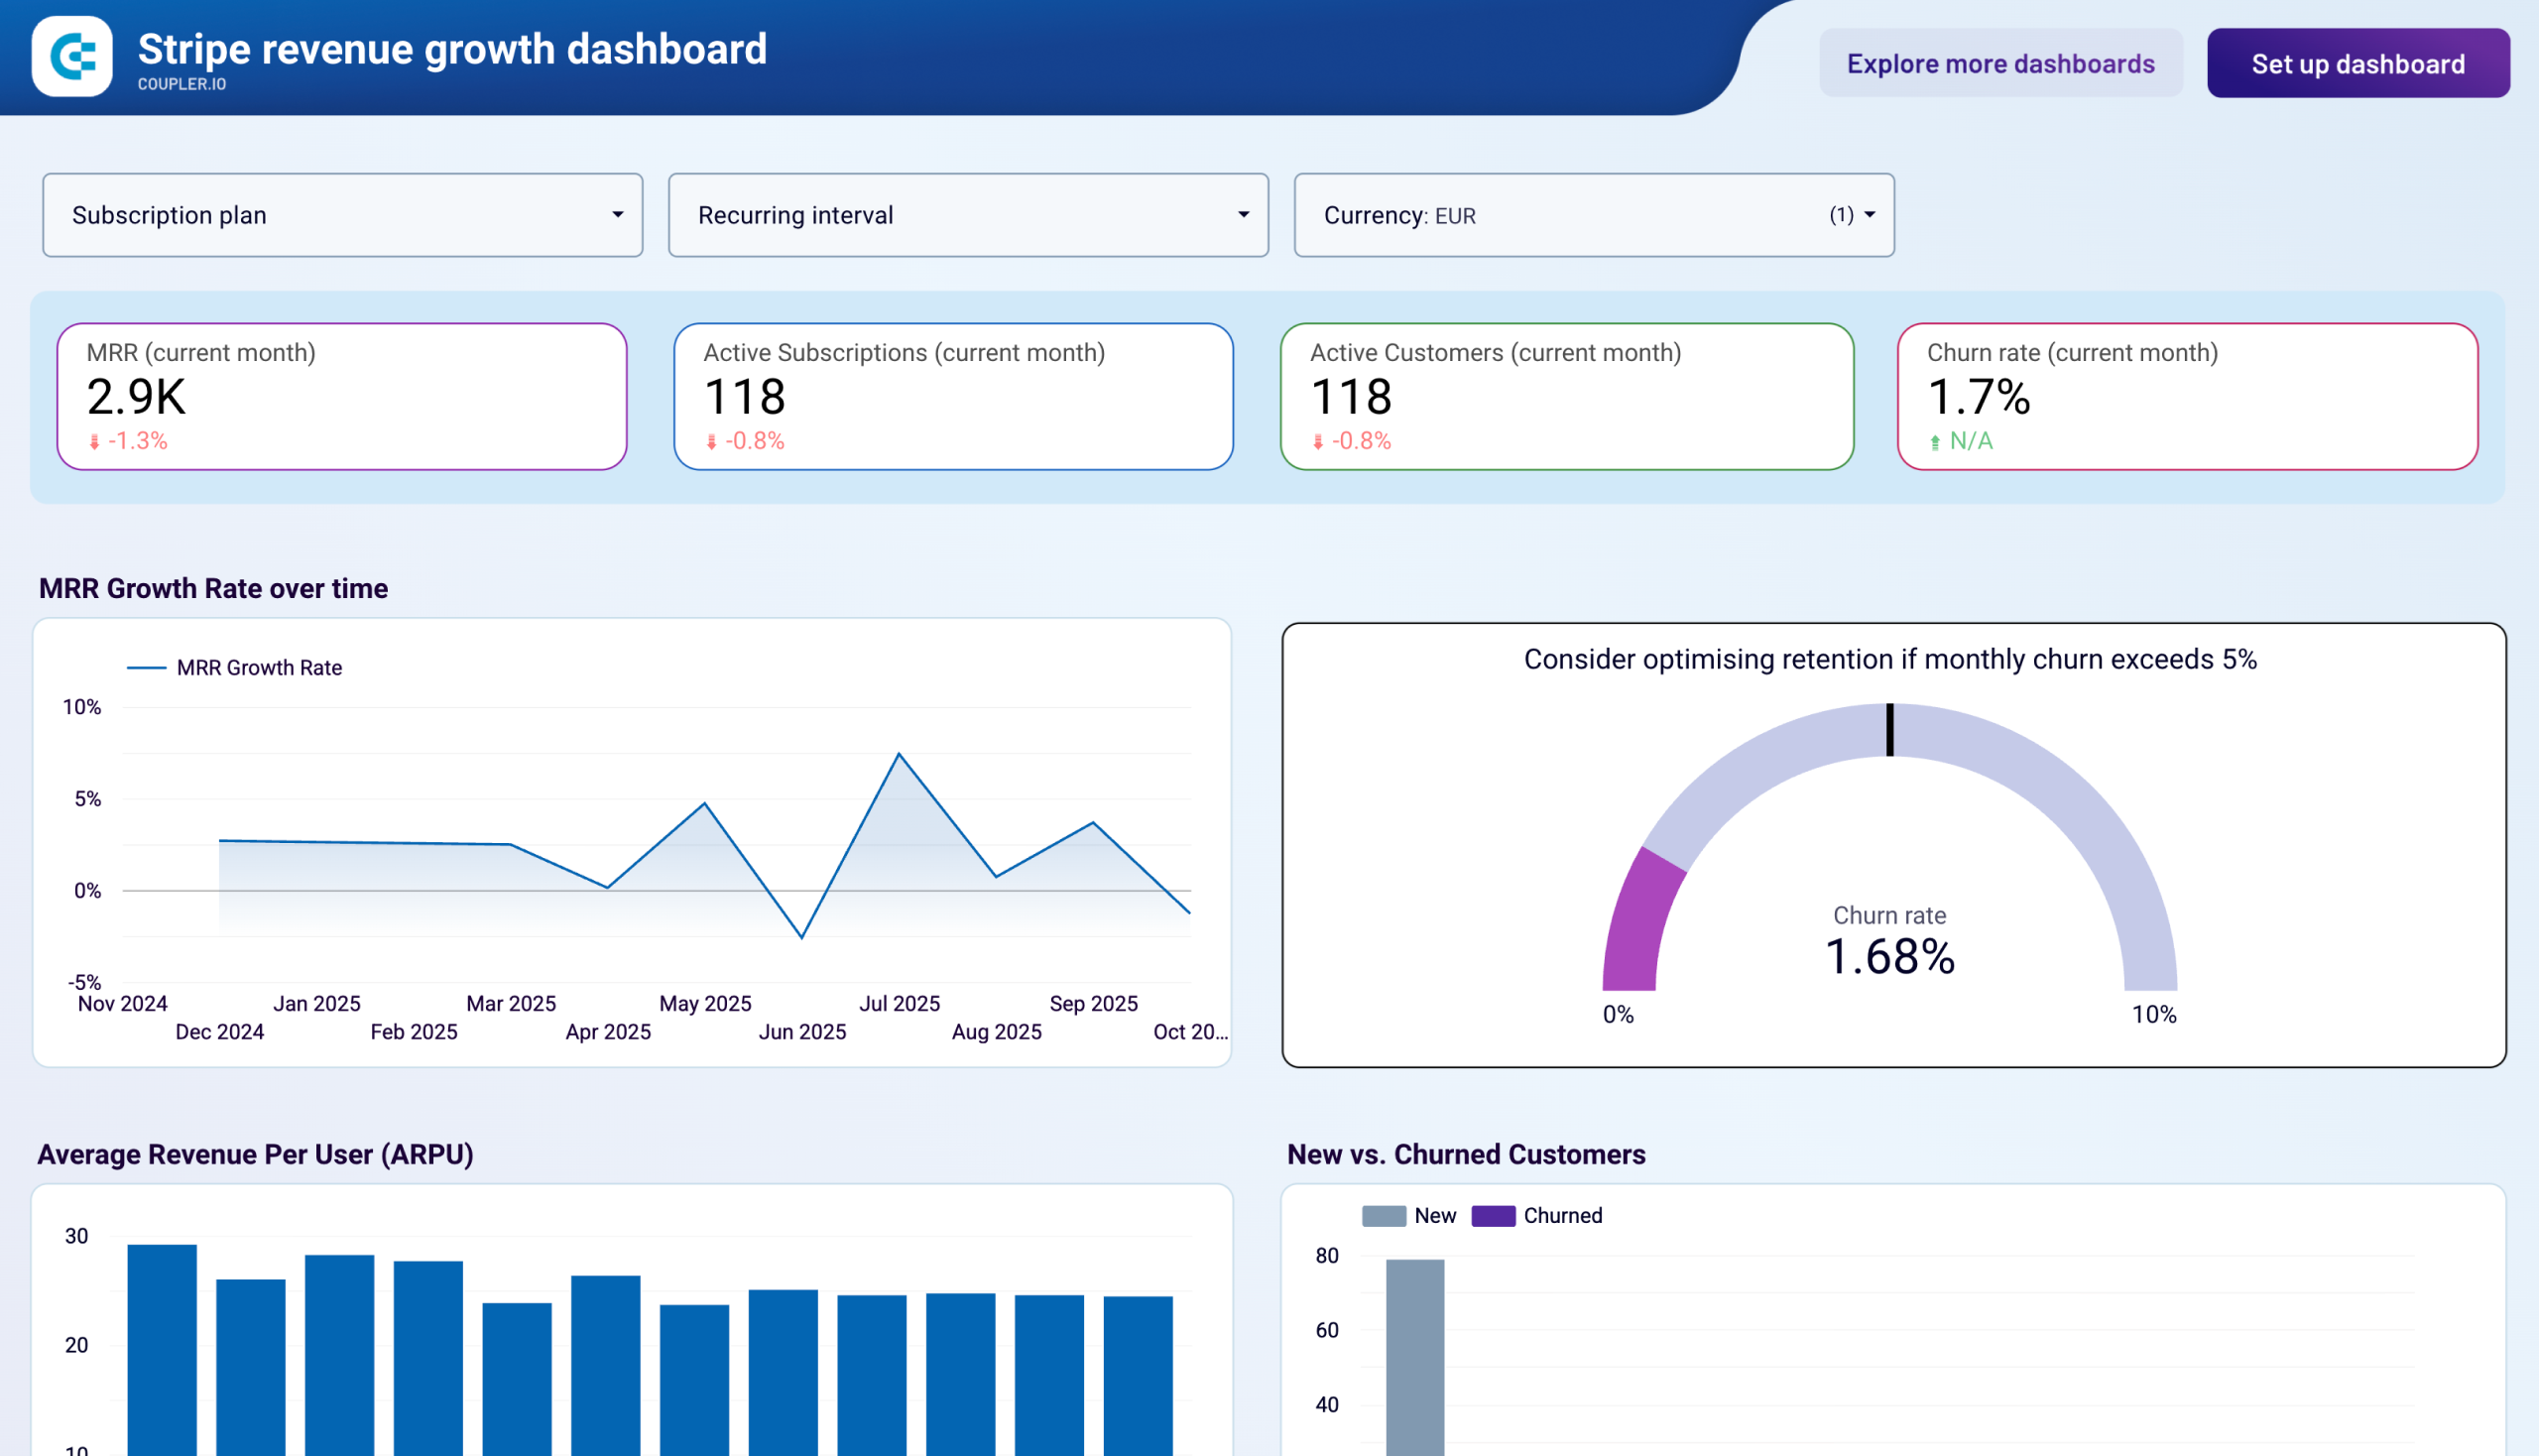
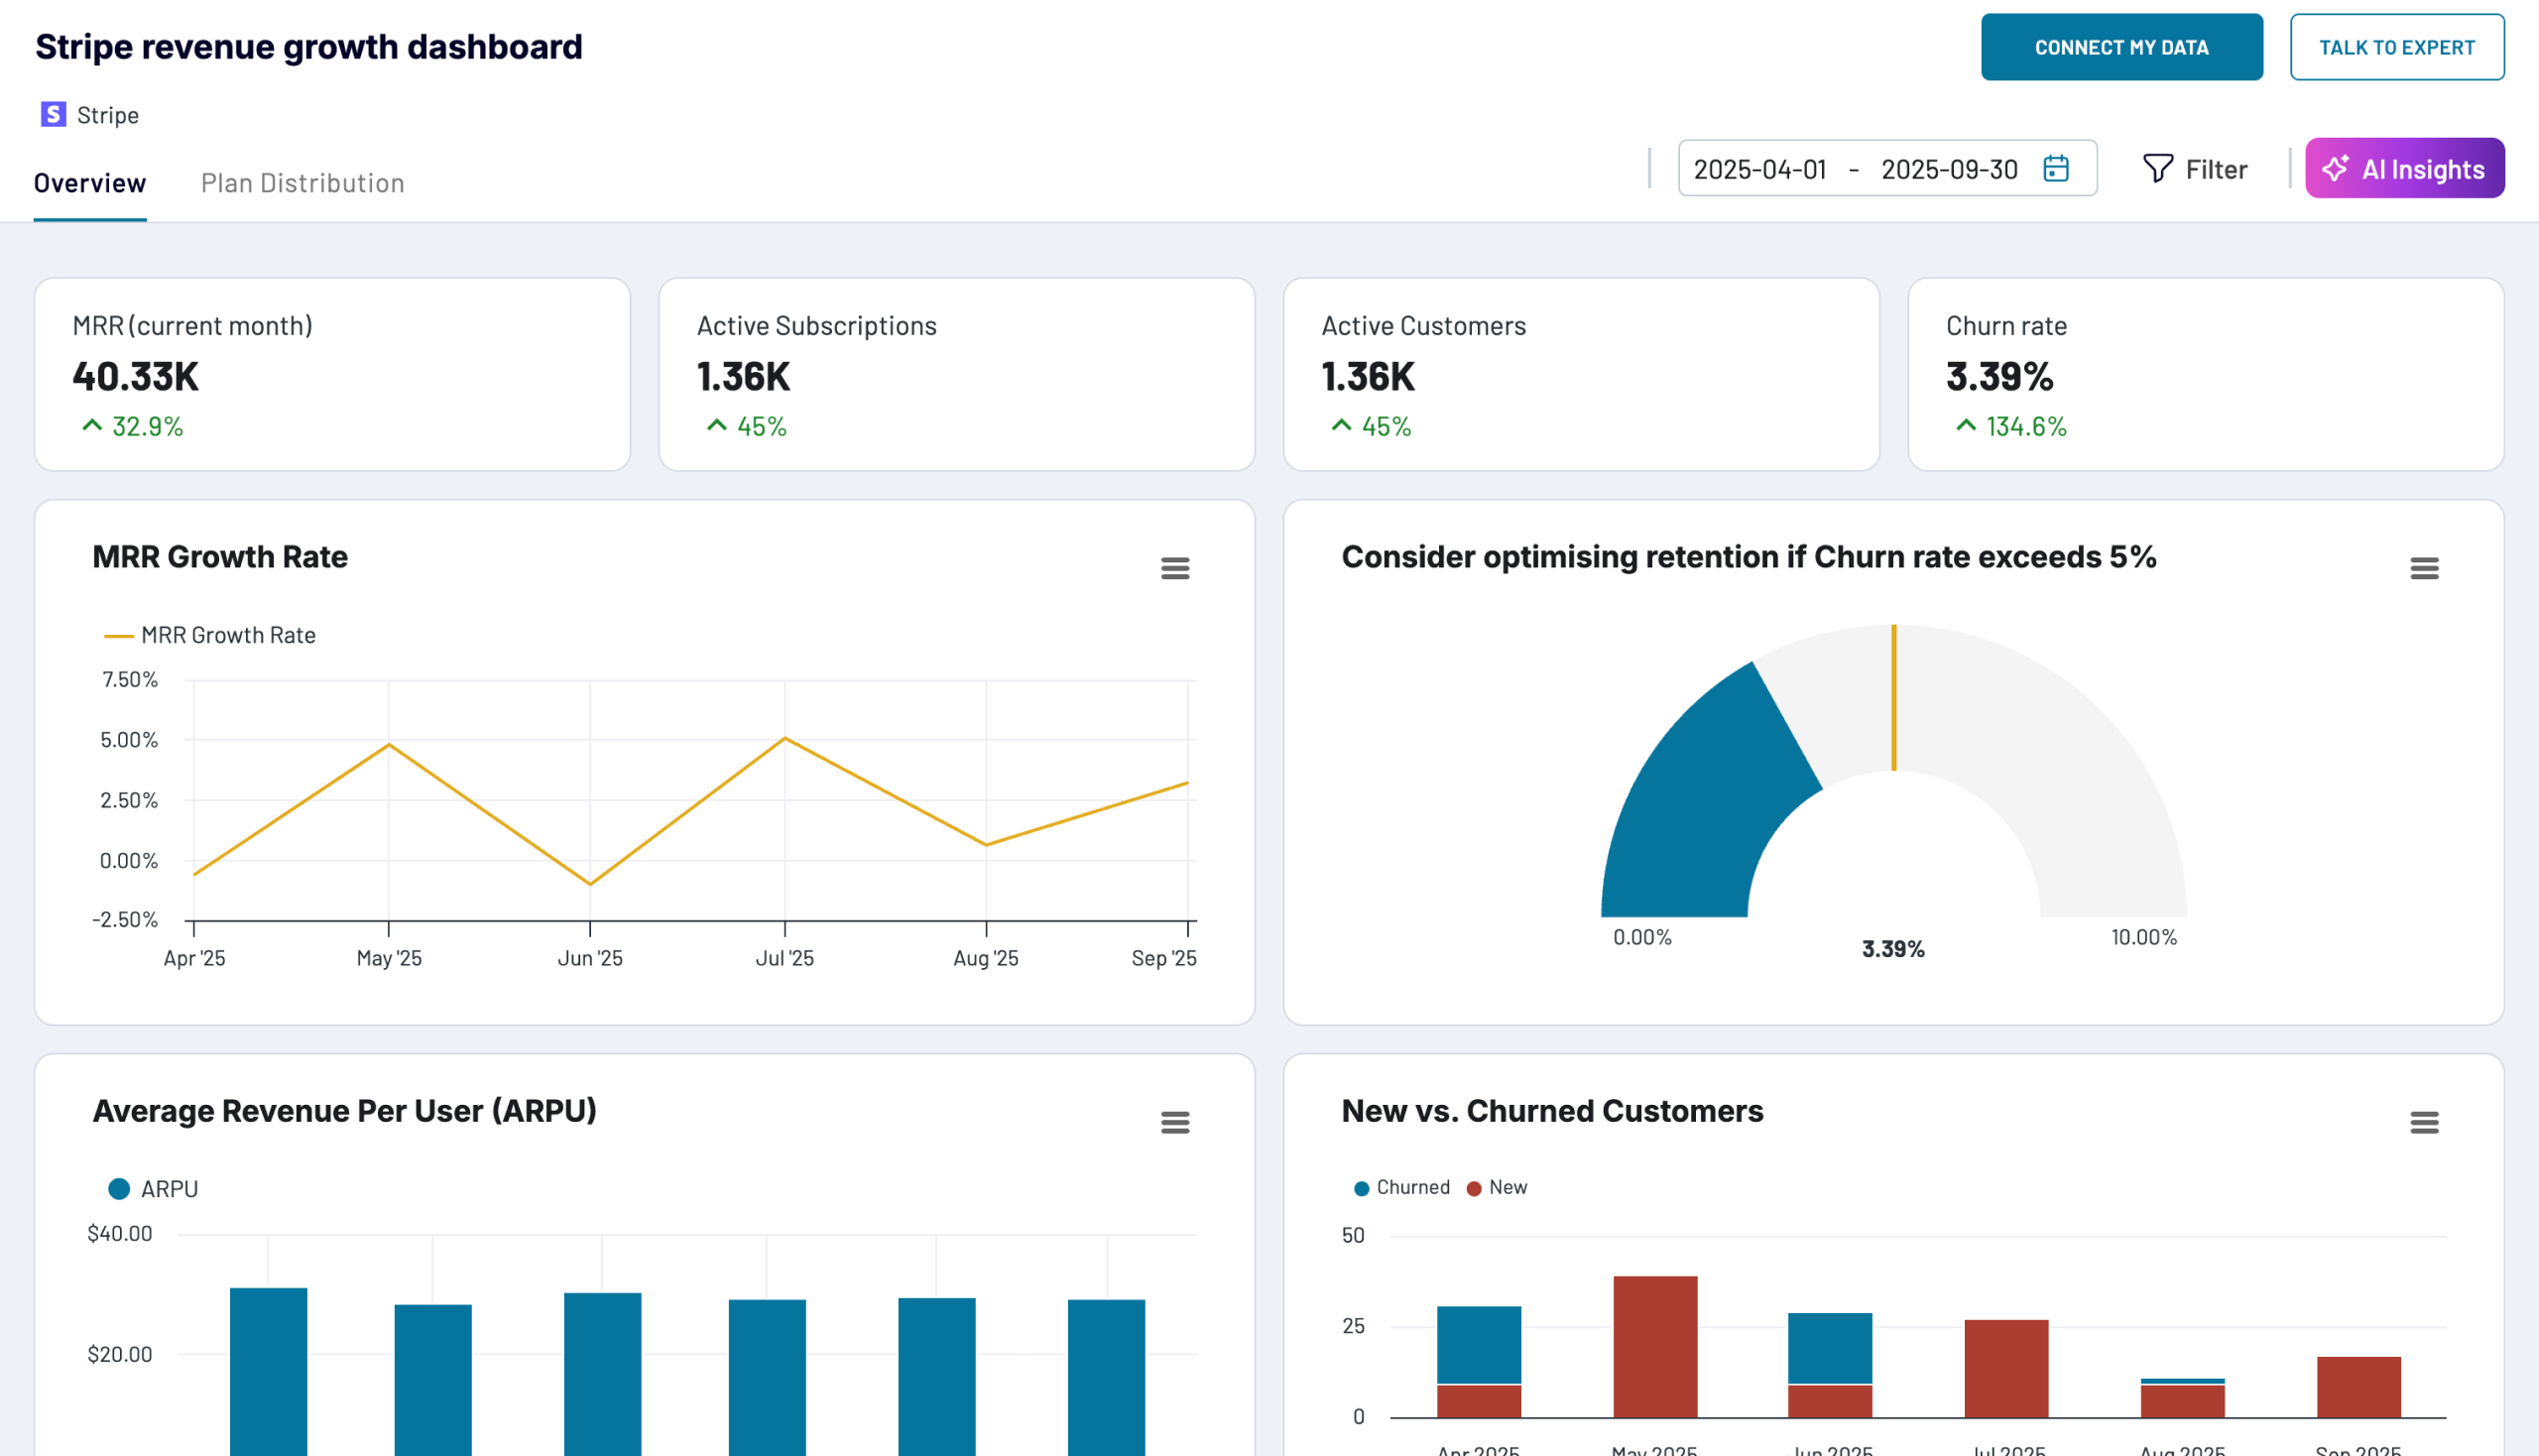
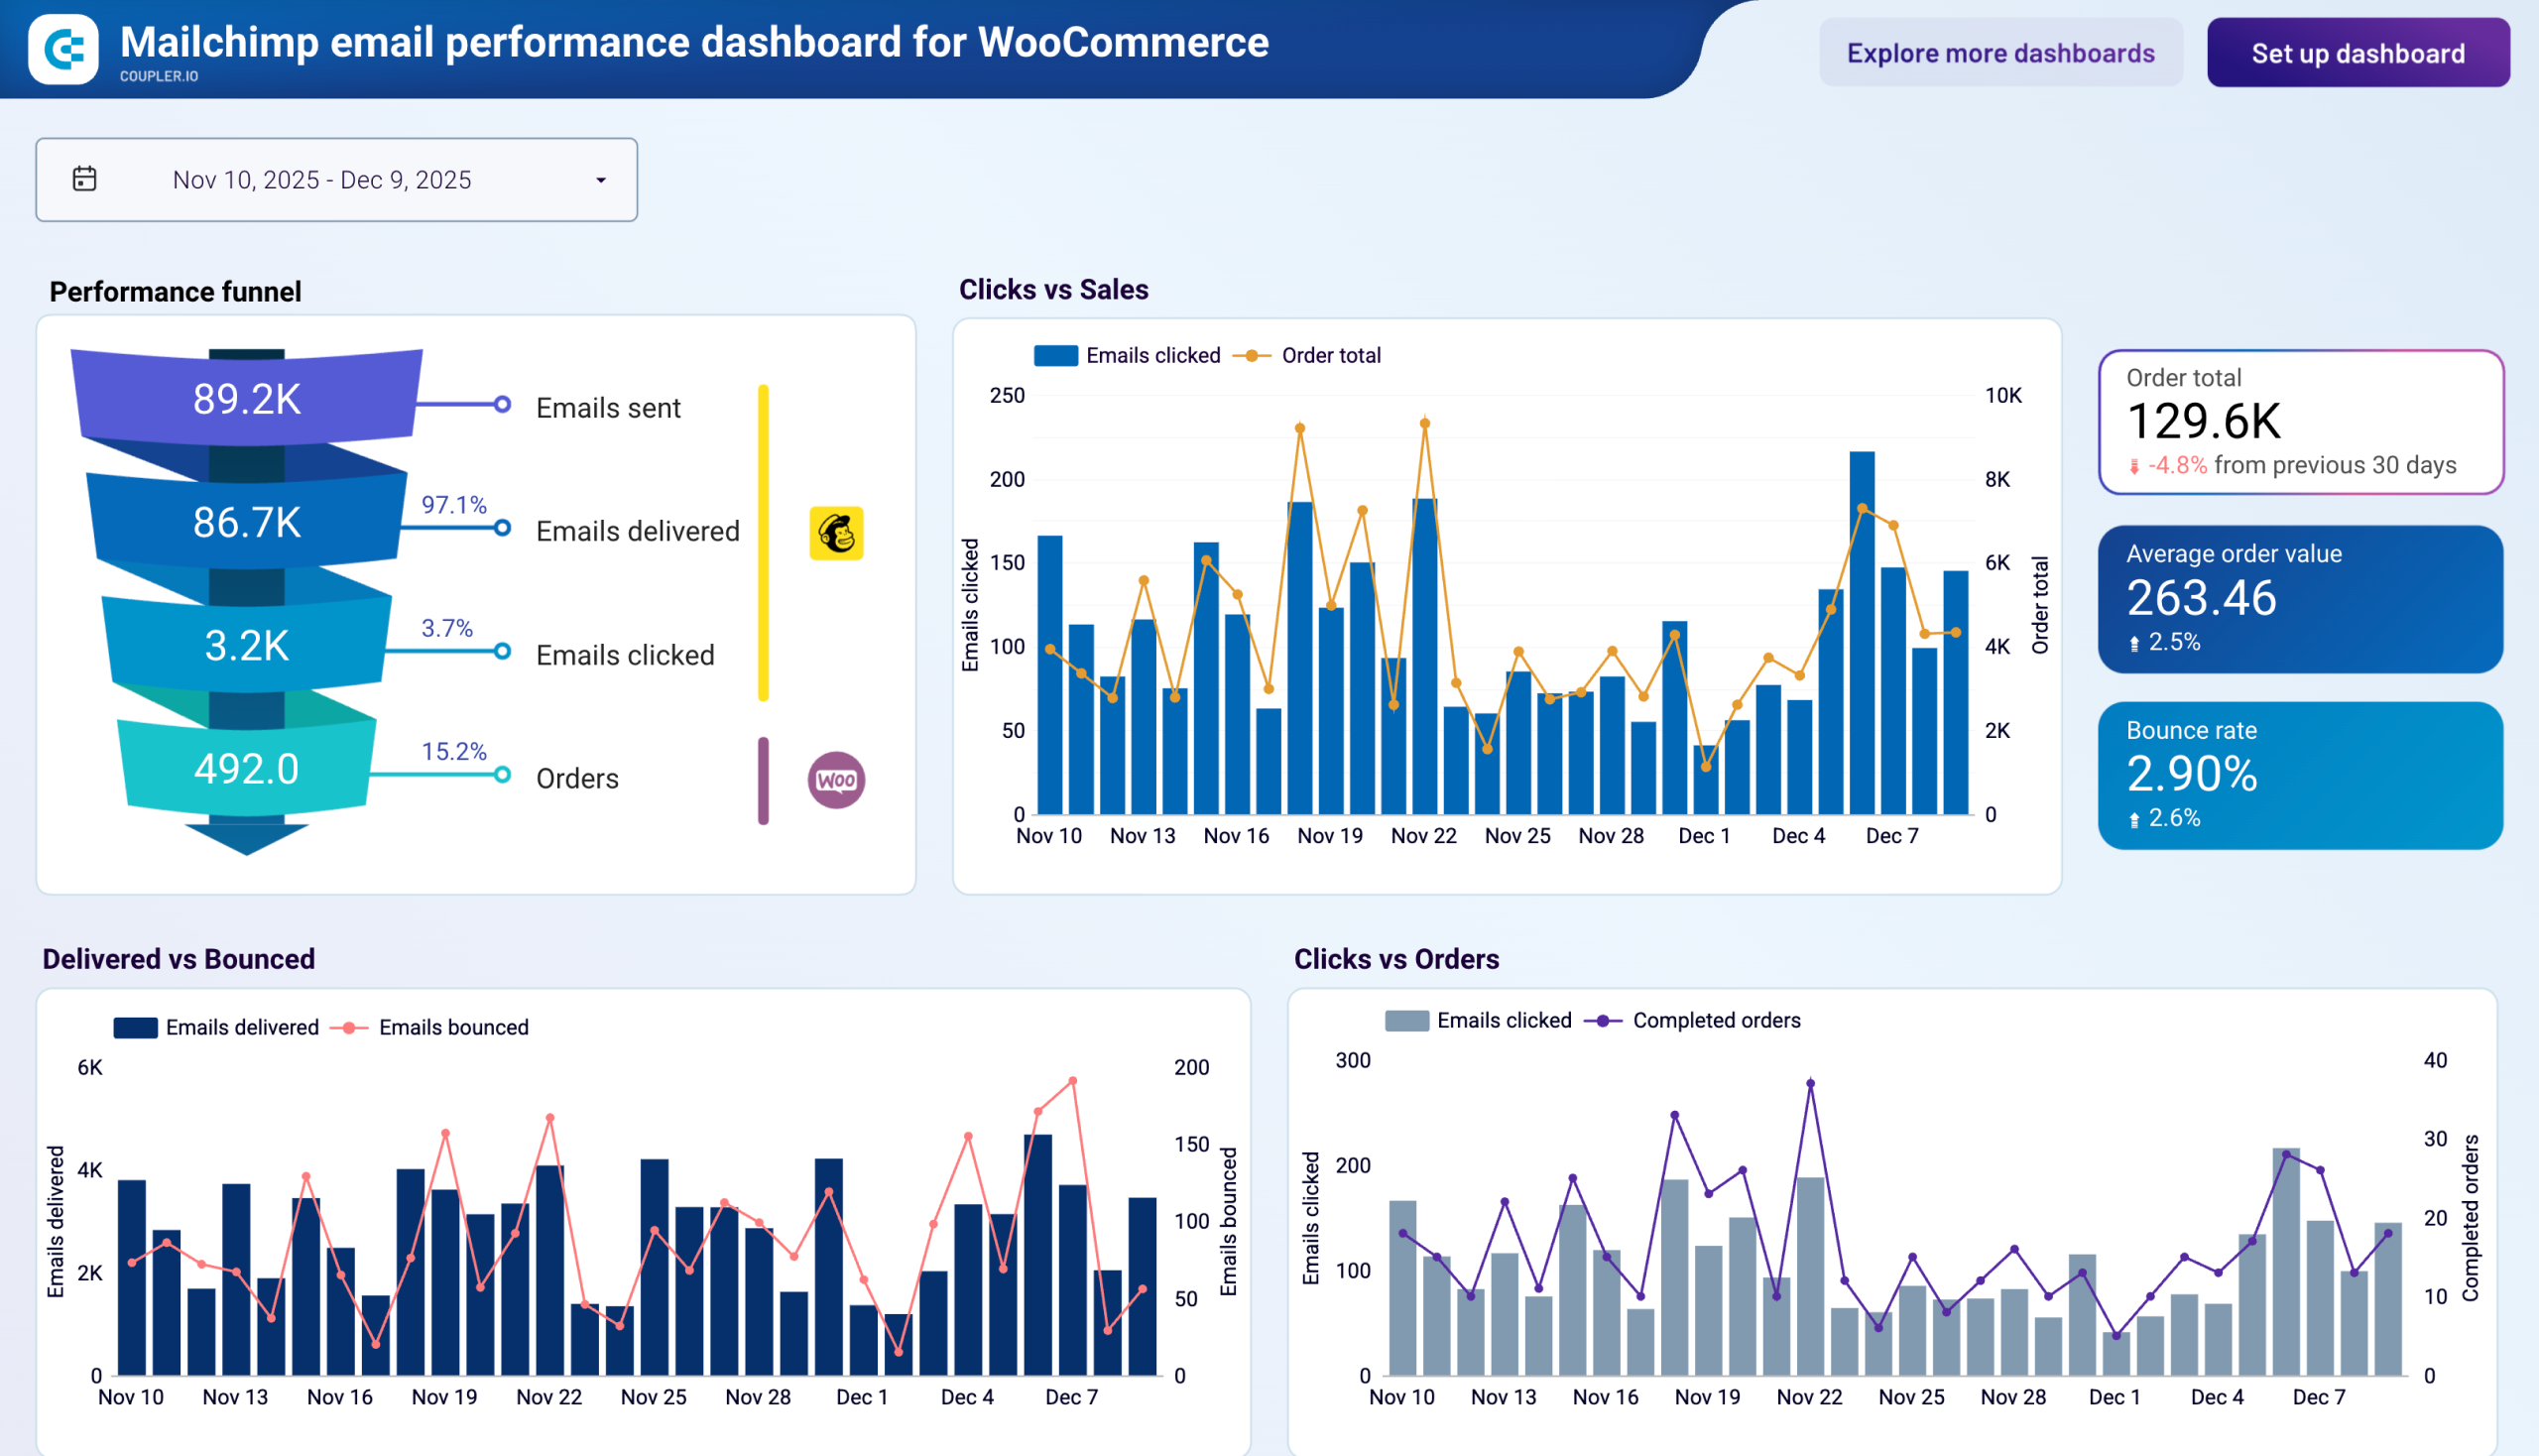
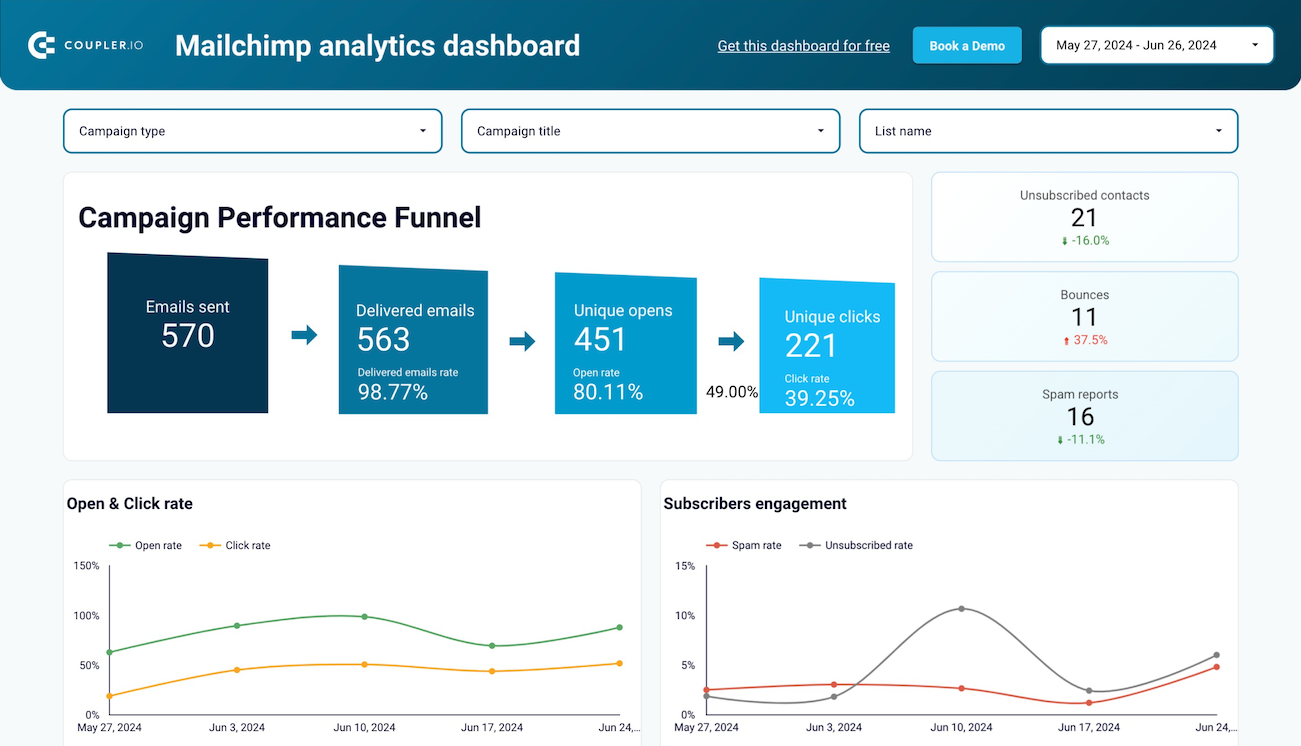
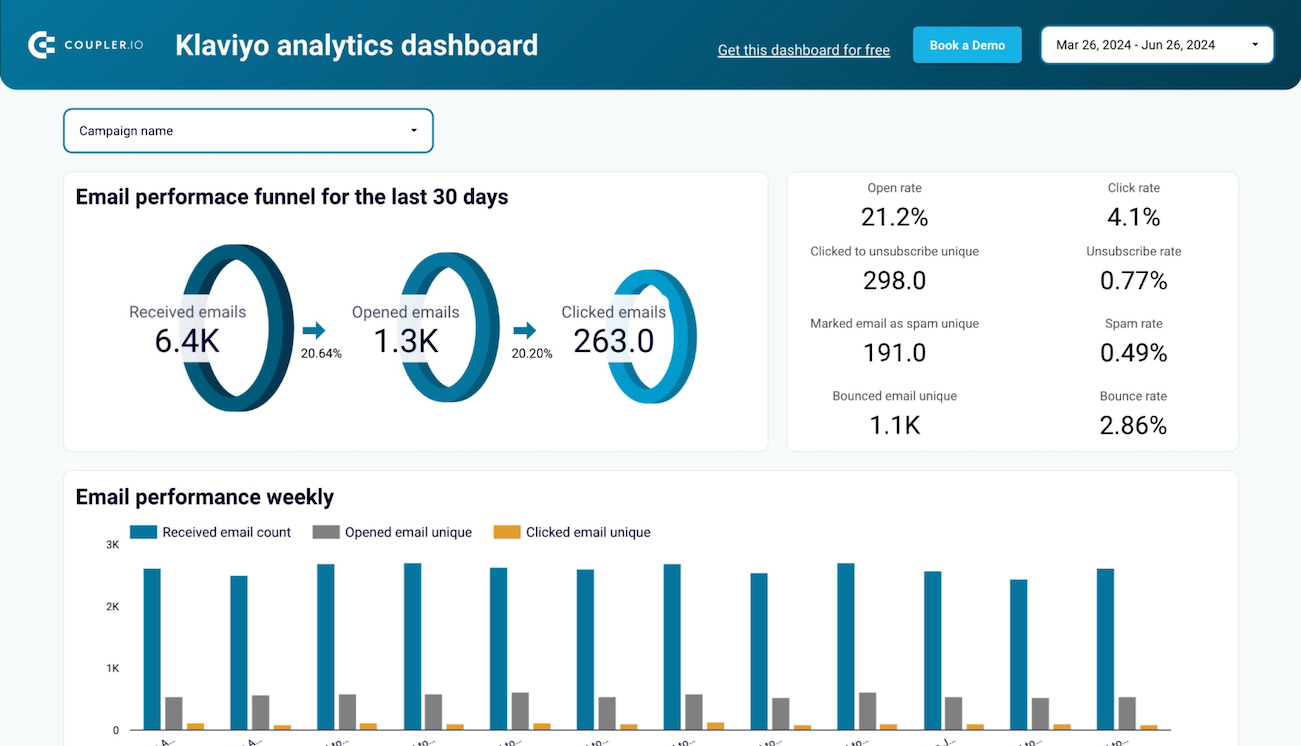
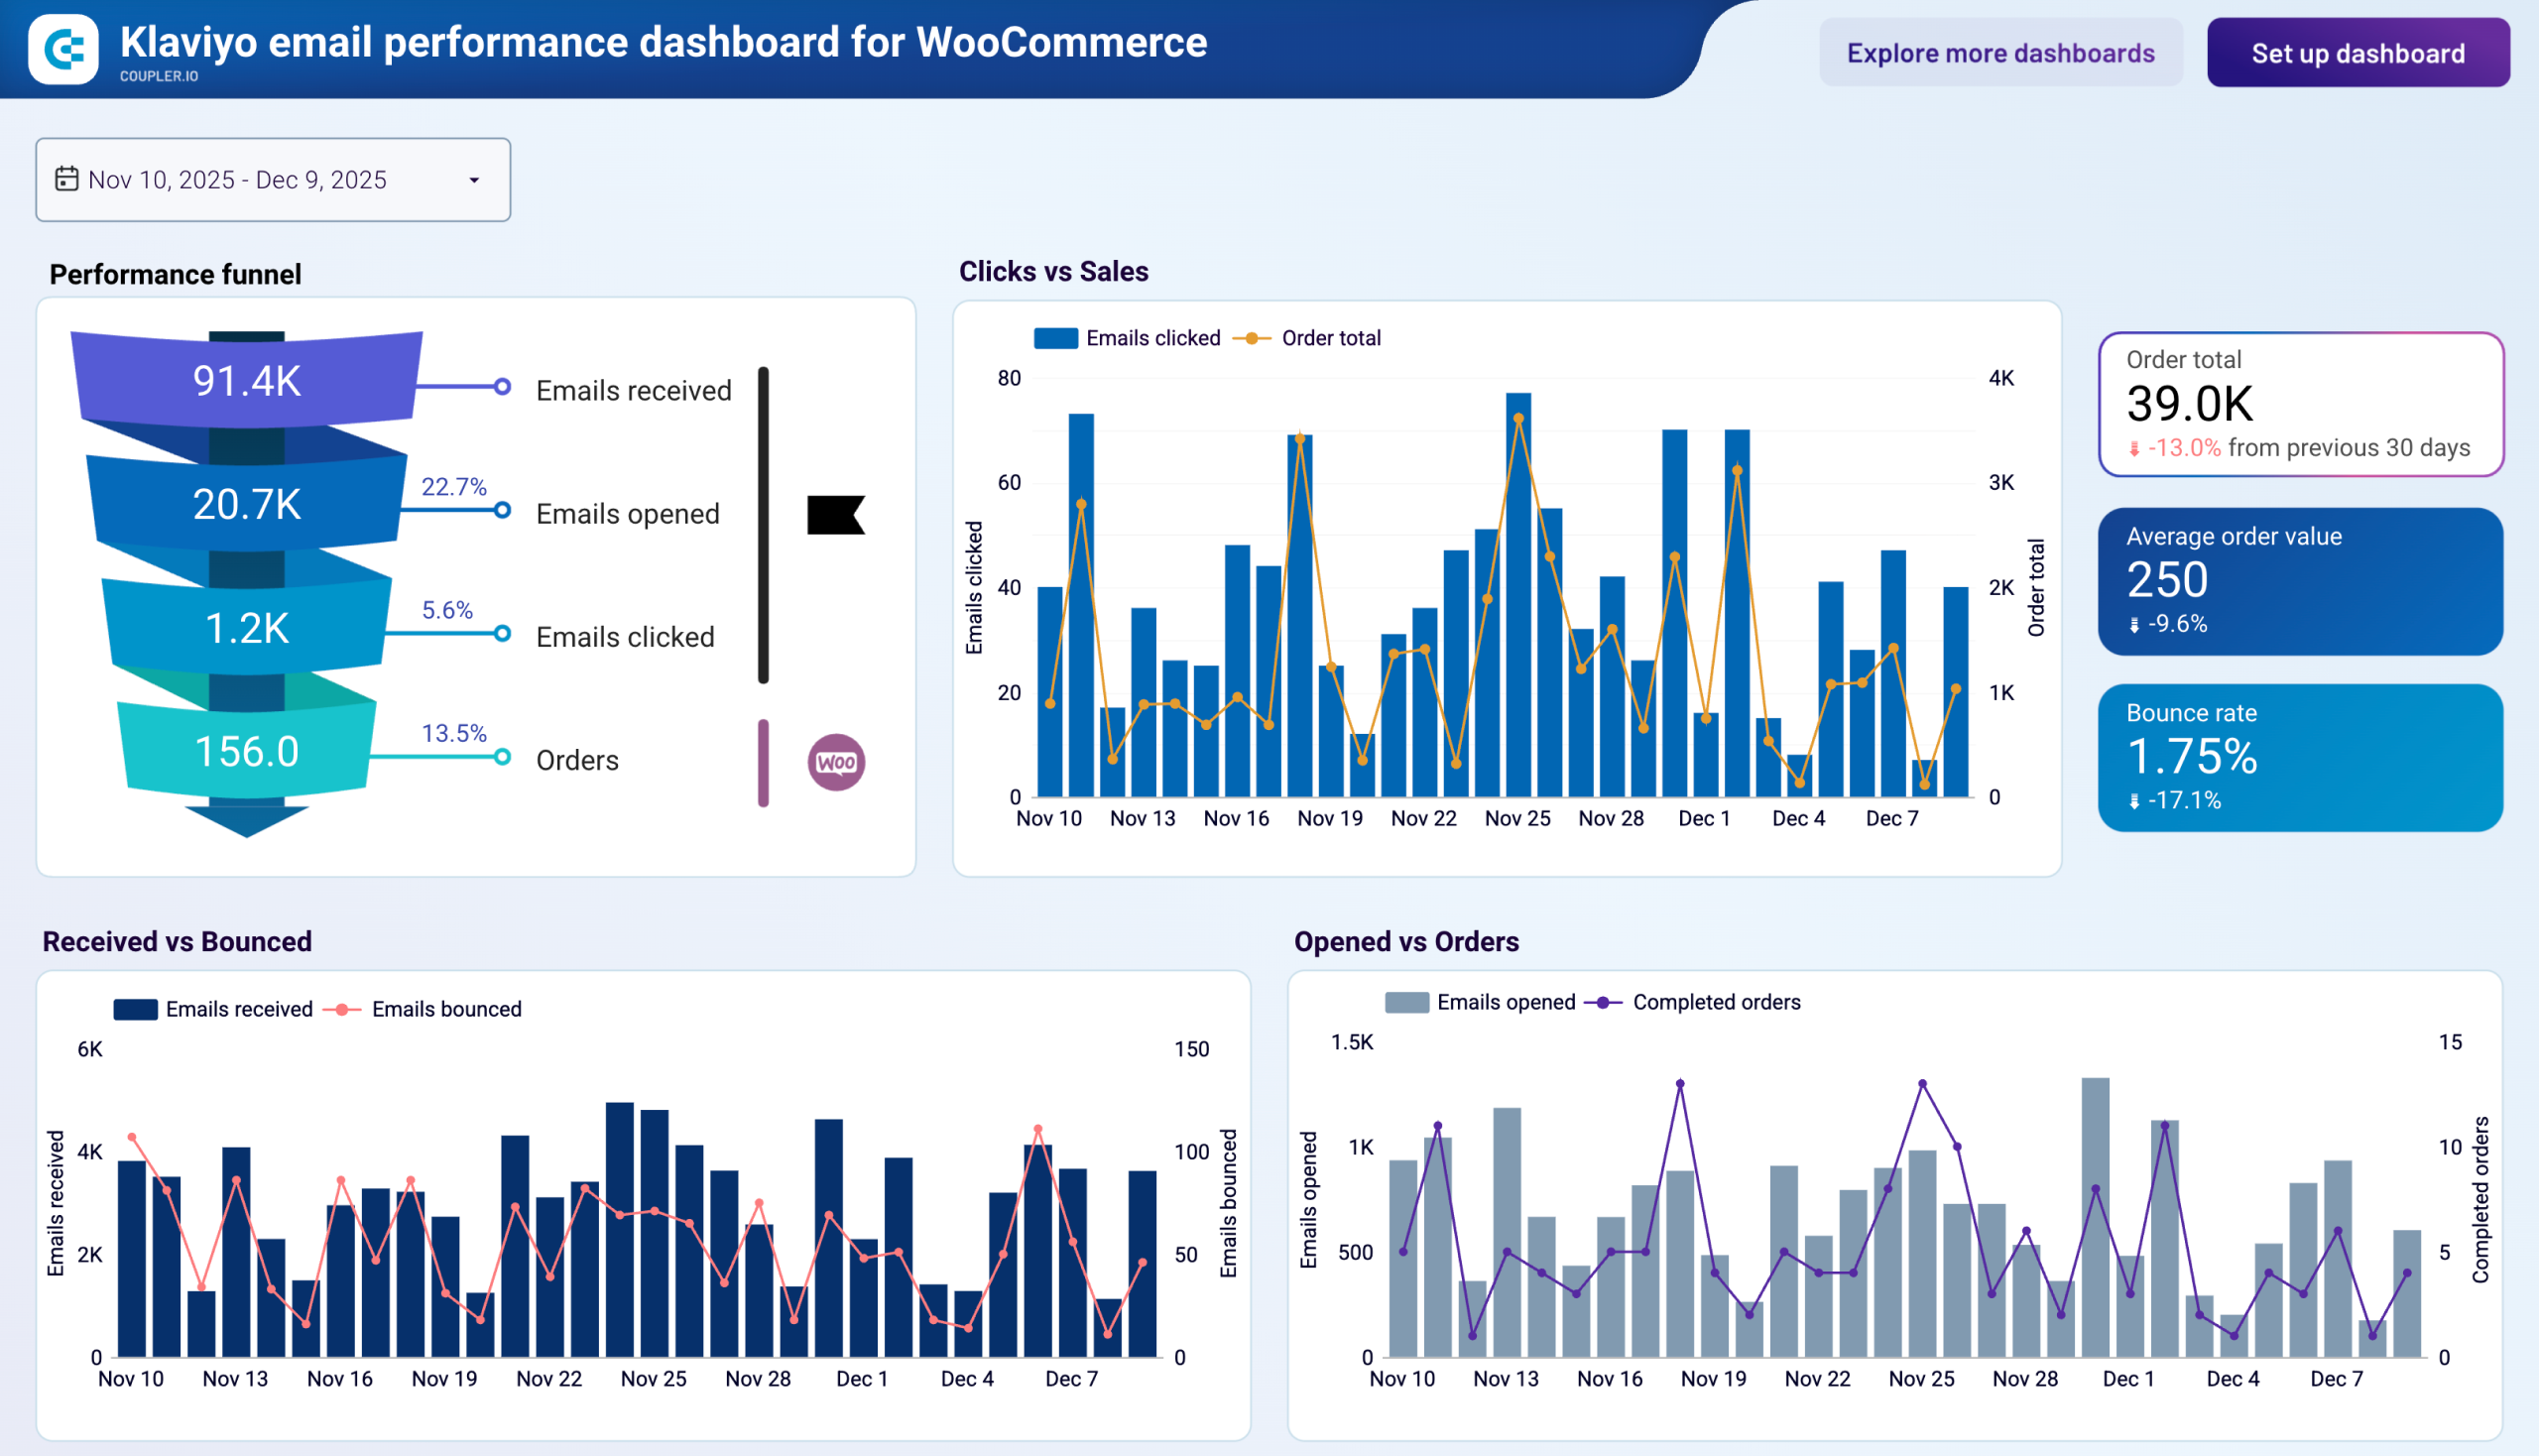
Use Coupler.io dashboards templates
Coupler.io offers a range of ready-to-use interactive dashboard templates designed to streamline your reporting and analytics. Explore our template gallery and connect your Xero to start using the plug-and-play dashboard right away.


 +3
+3


 +6
+6


 +5
+5
 +6
+6

 +3
+3


 +1
+1


 +4
+4
 +4
+4
 +2
+2
 +2
+2


 +5
+5
 +4
+4
 +5
+5
 +5
+5


 +3
+3

 +1
+1
 +3
+3


 +1
+1
 +3
+3
 +3
+3


 +2
+2


 +1
+1


 +1
+1


 +2
+2
 +3
+3
 +4
+4


about your case. It doesn't cost you a penny 😉
Data set templates gallery
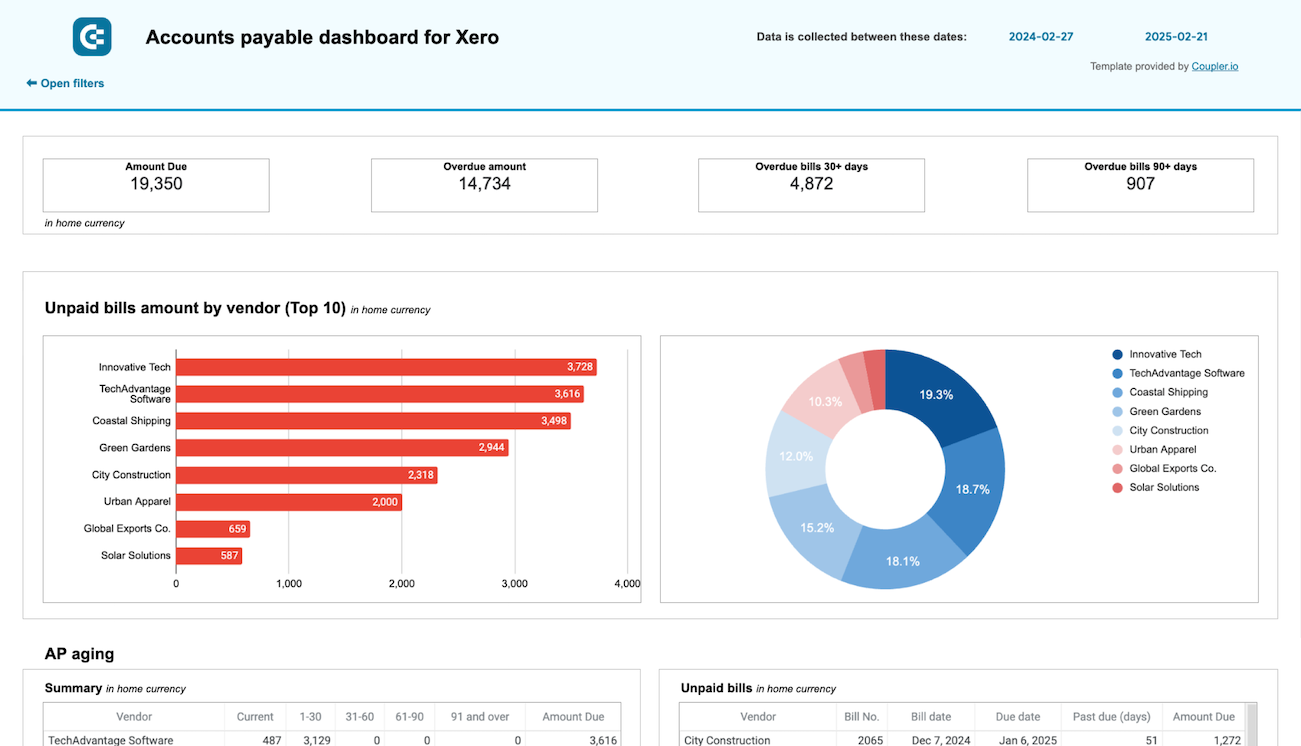
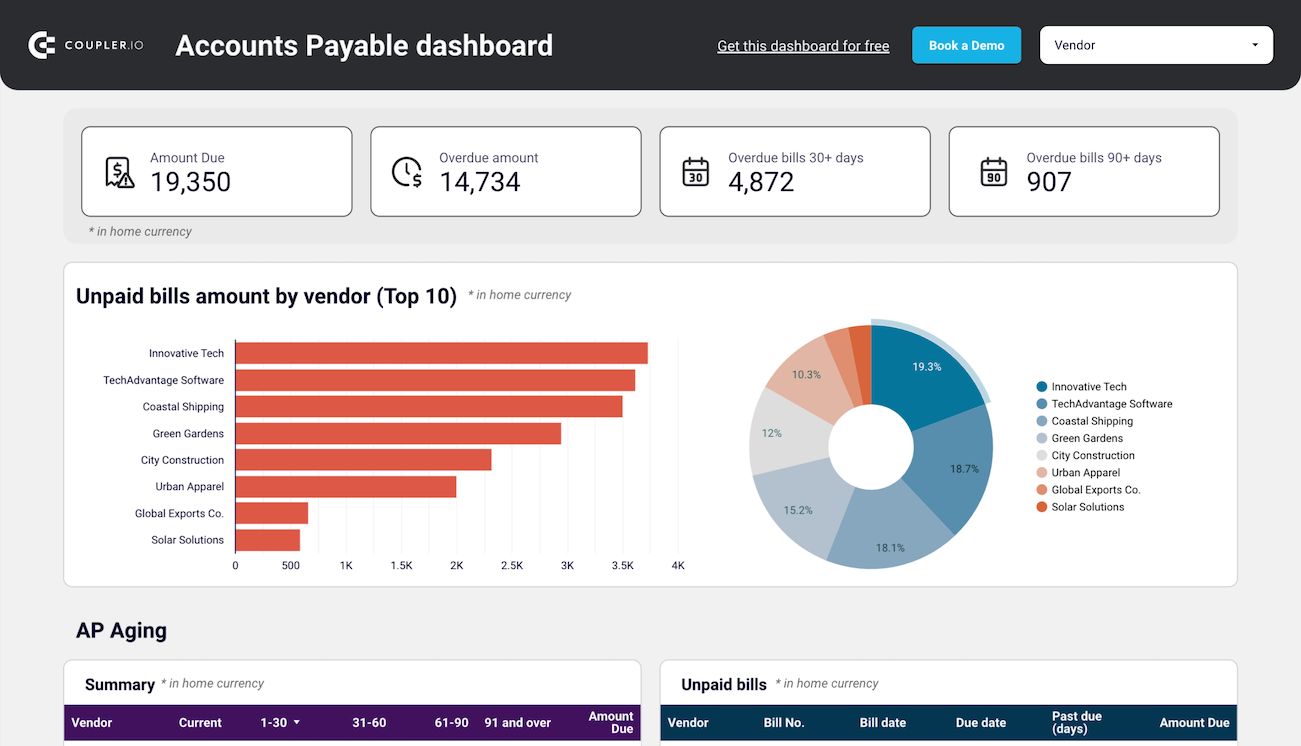
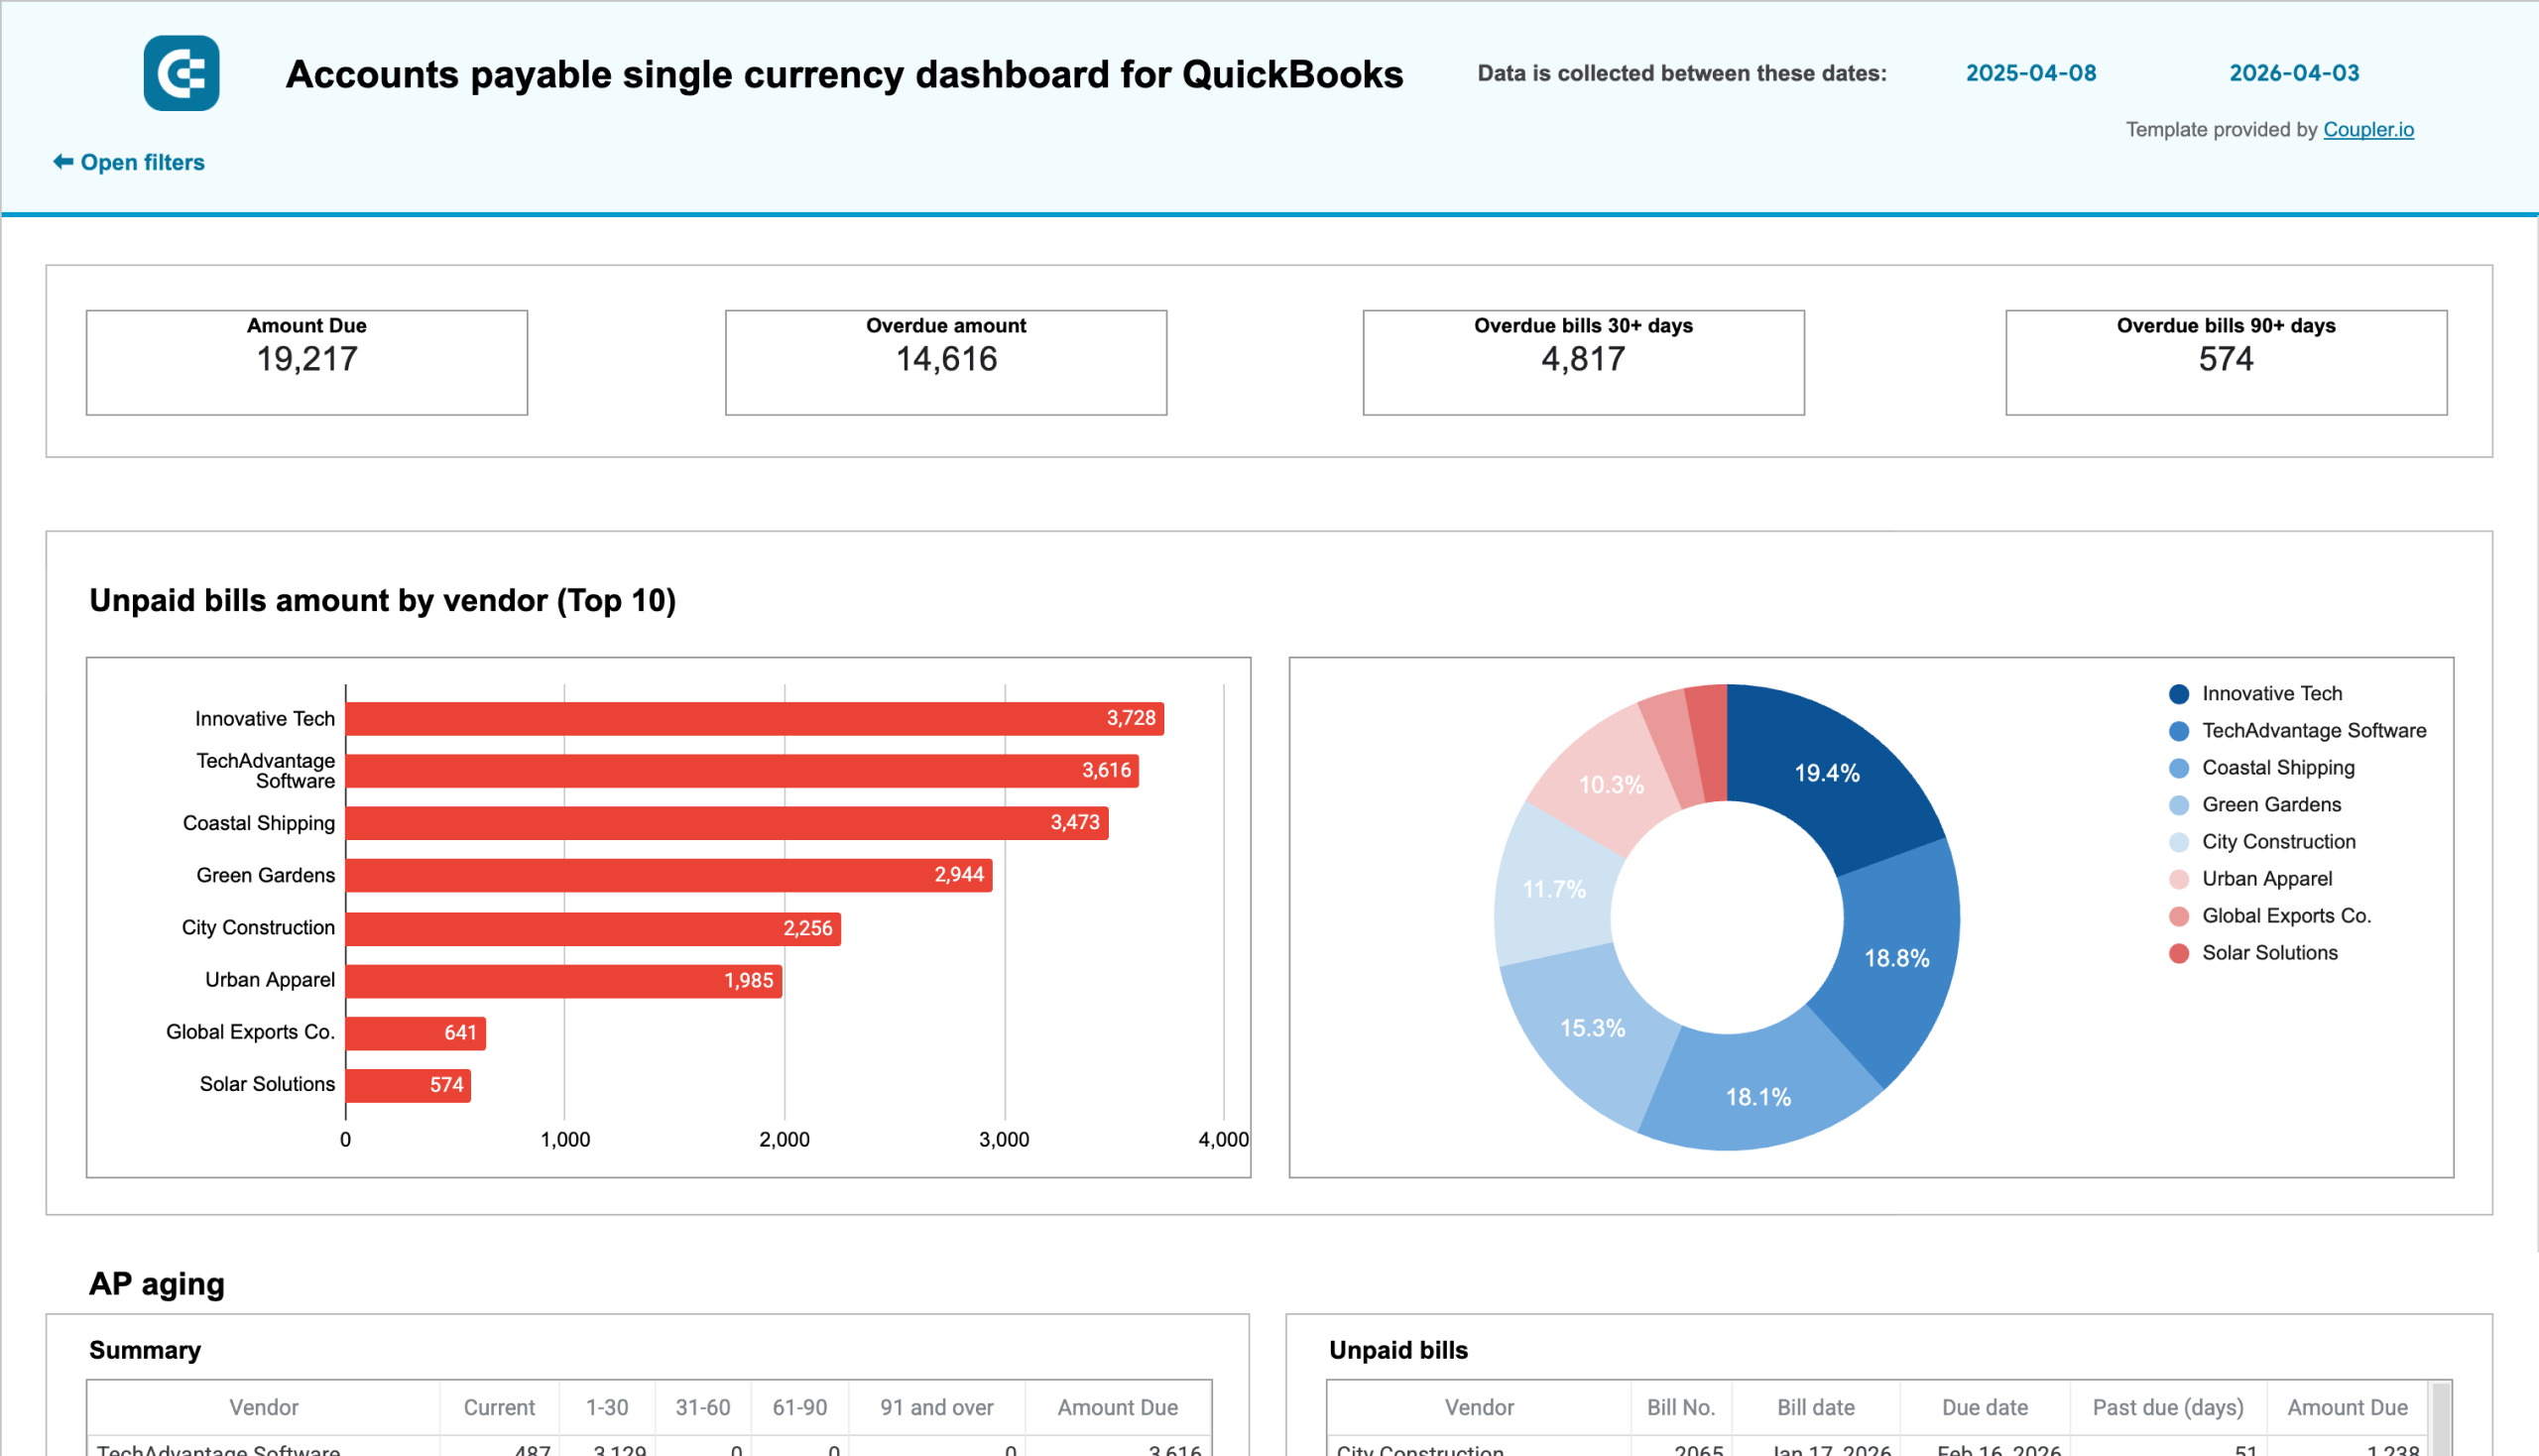
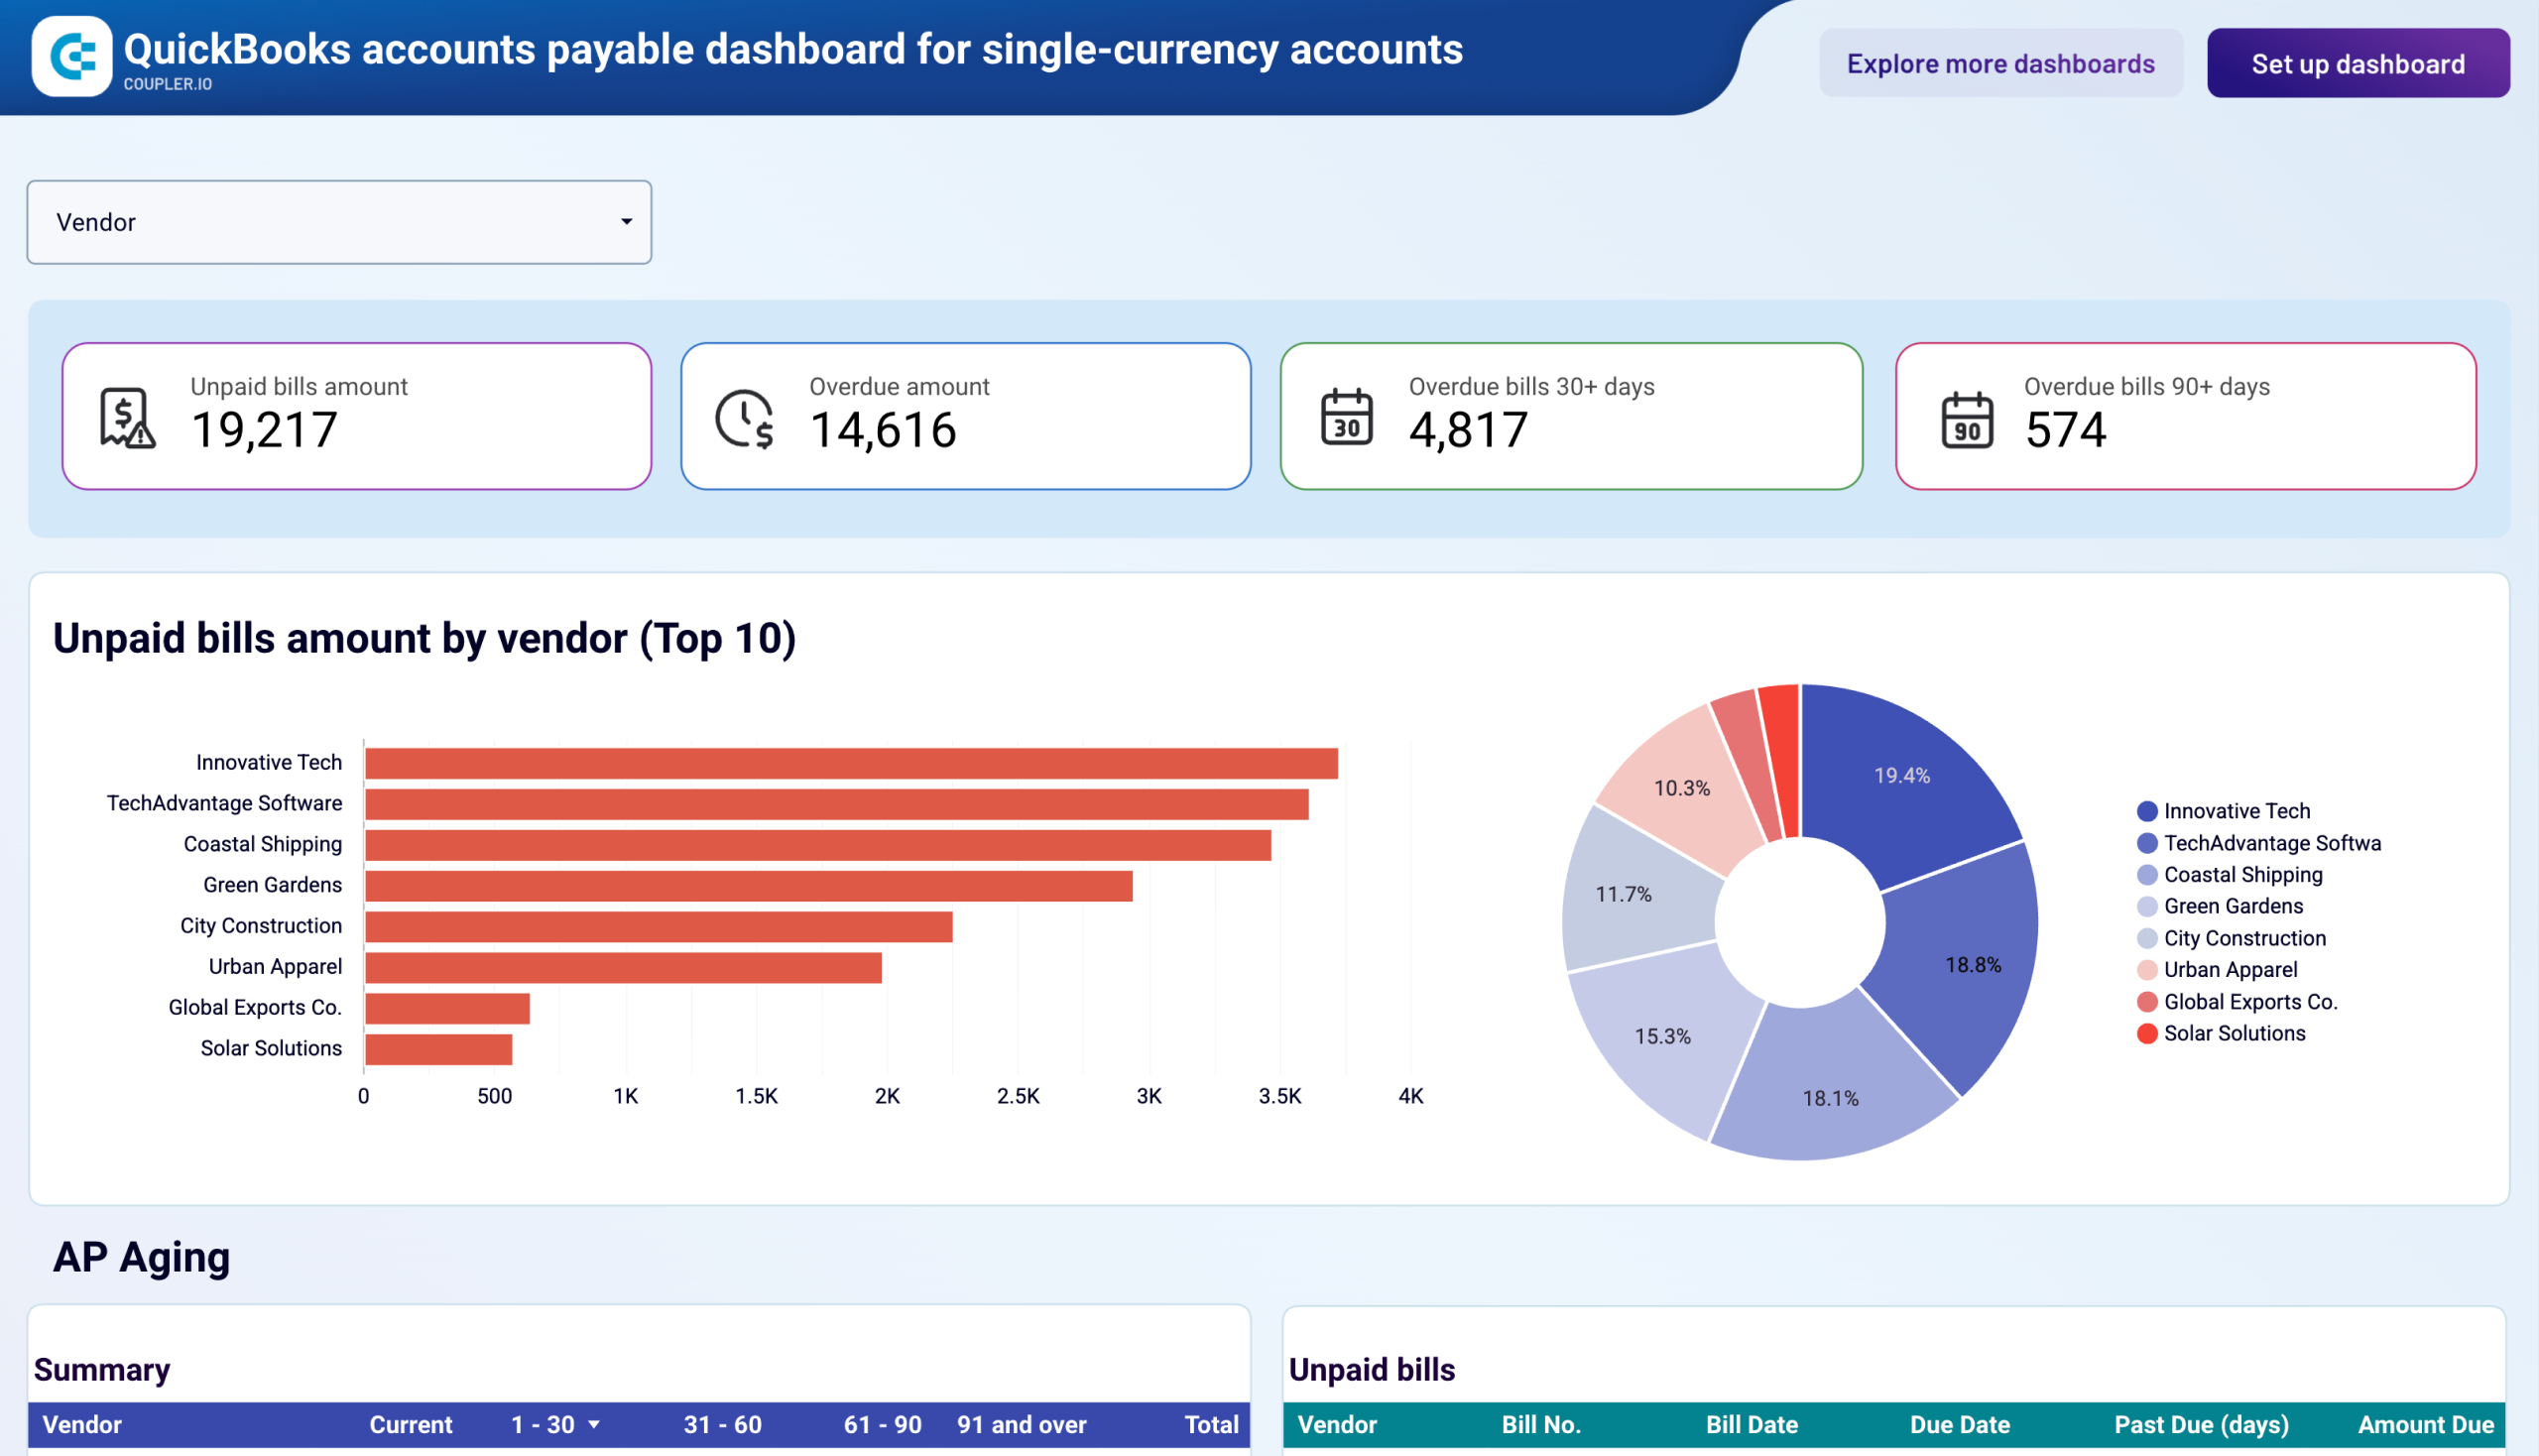
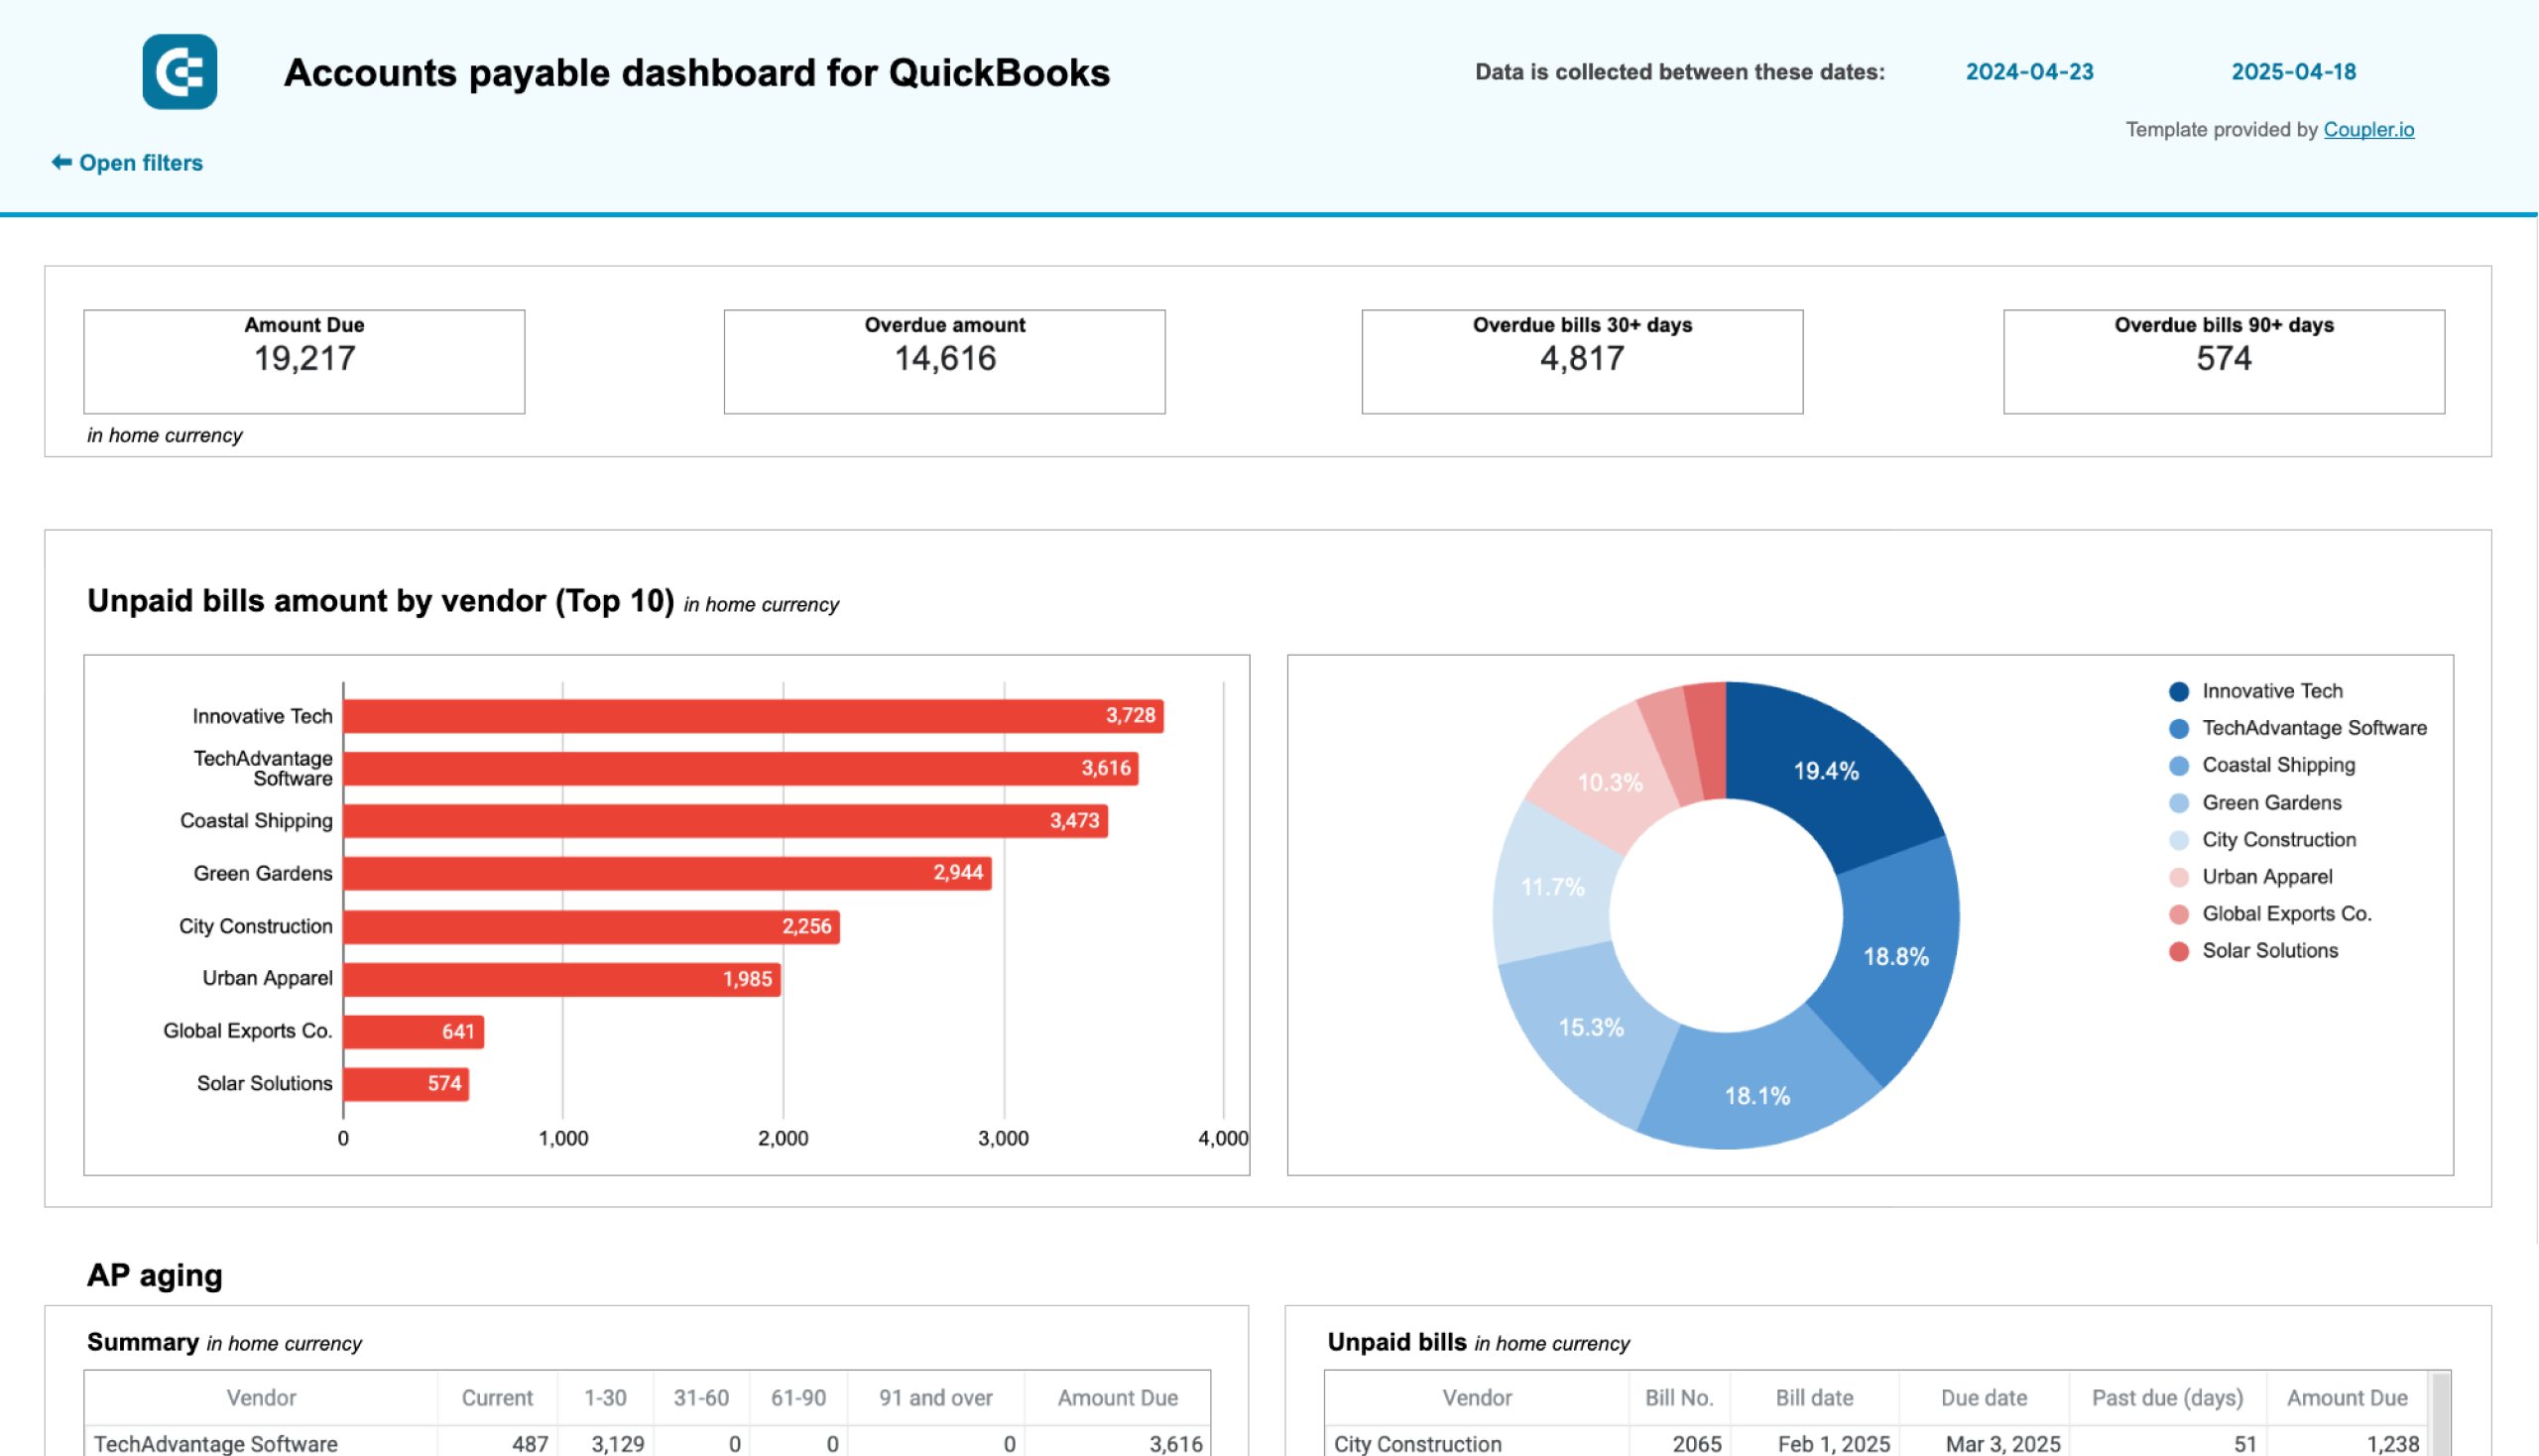
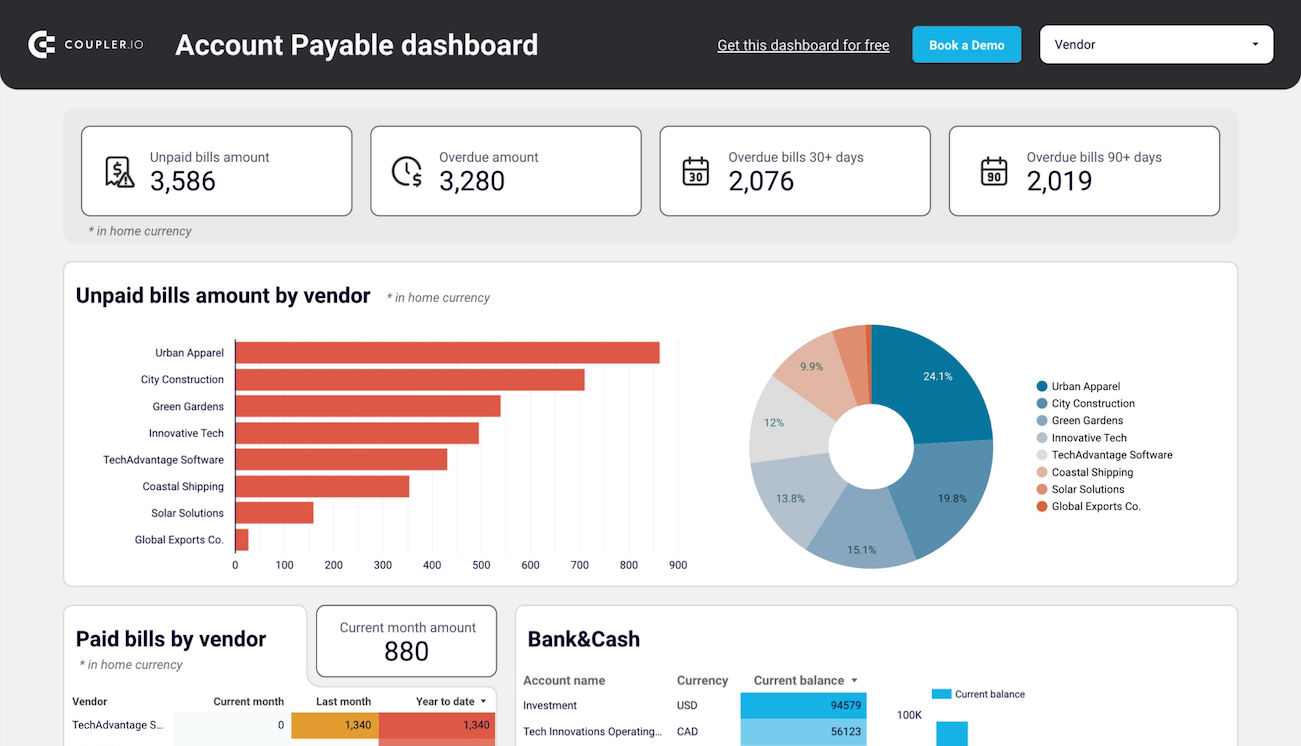
Track outstanding vendor bills by aging periods to manage payment schedules, prioritize payables, and optimize cash flow management. Unpaid bill amounts may differ from Xero UI because exchange rates are applied differently. Xero UI uses current exchange rate at viewing time, while dataset uses rate from bill creation date.
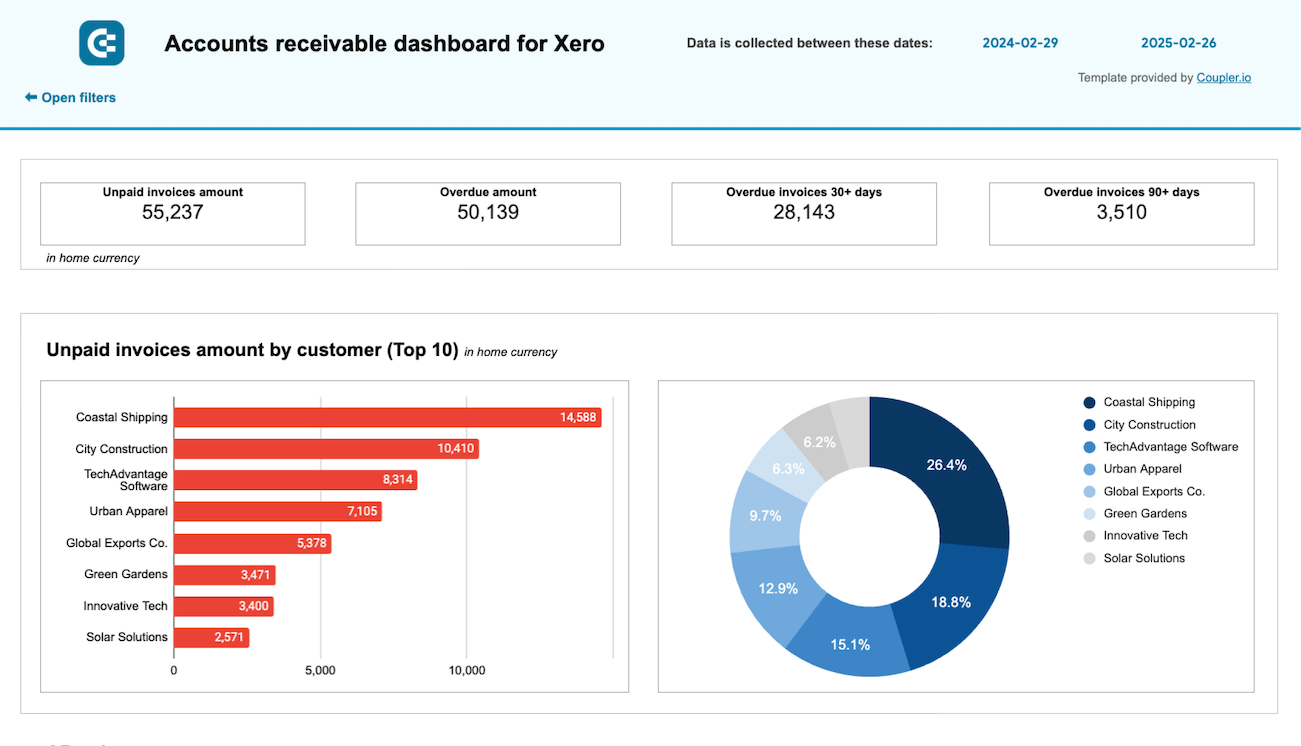
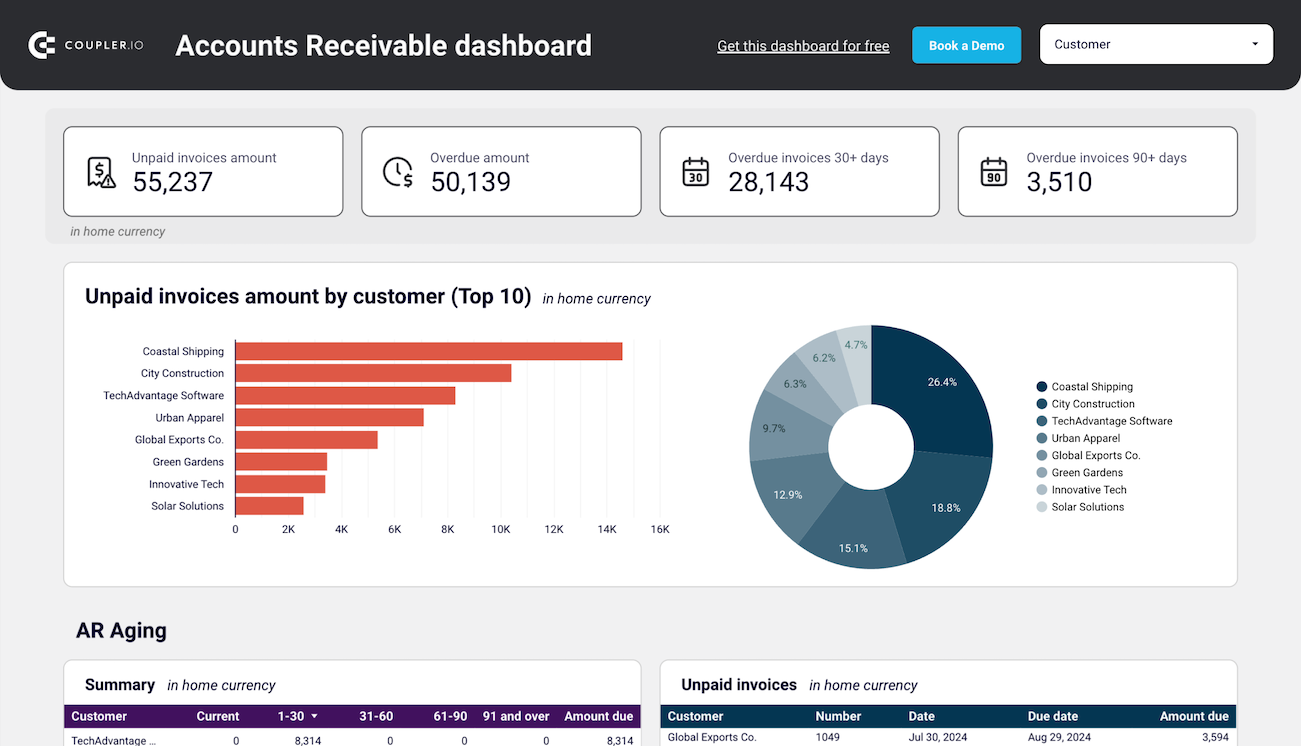
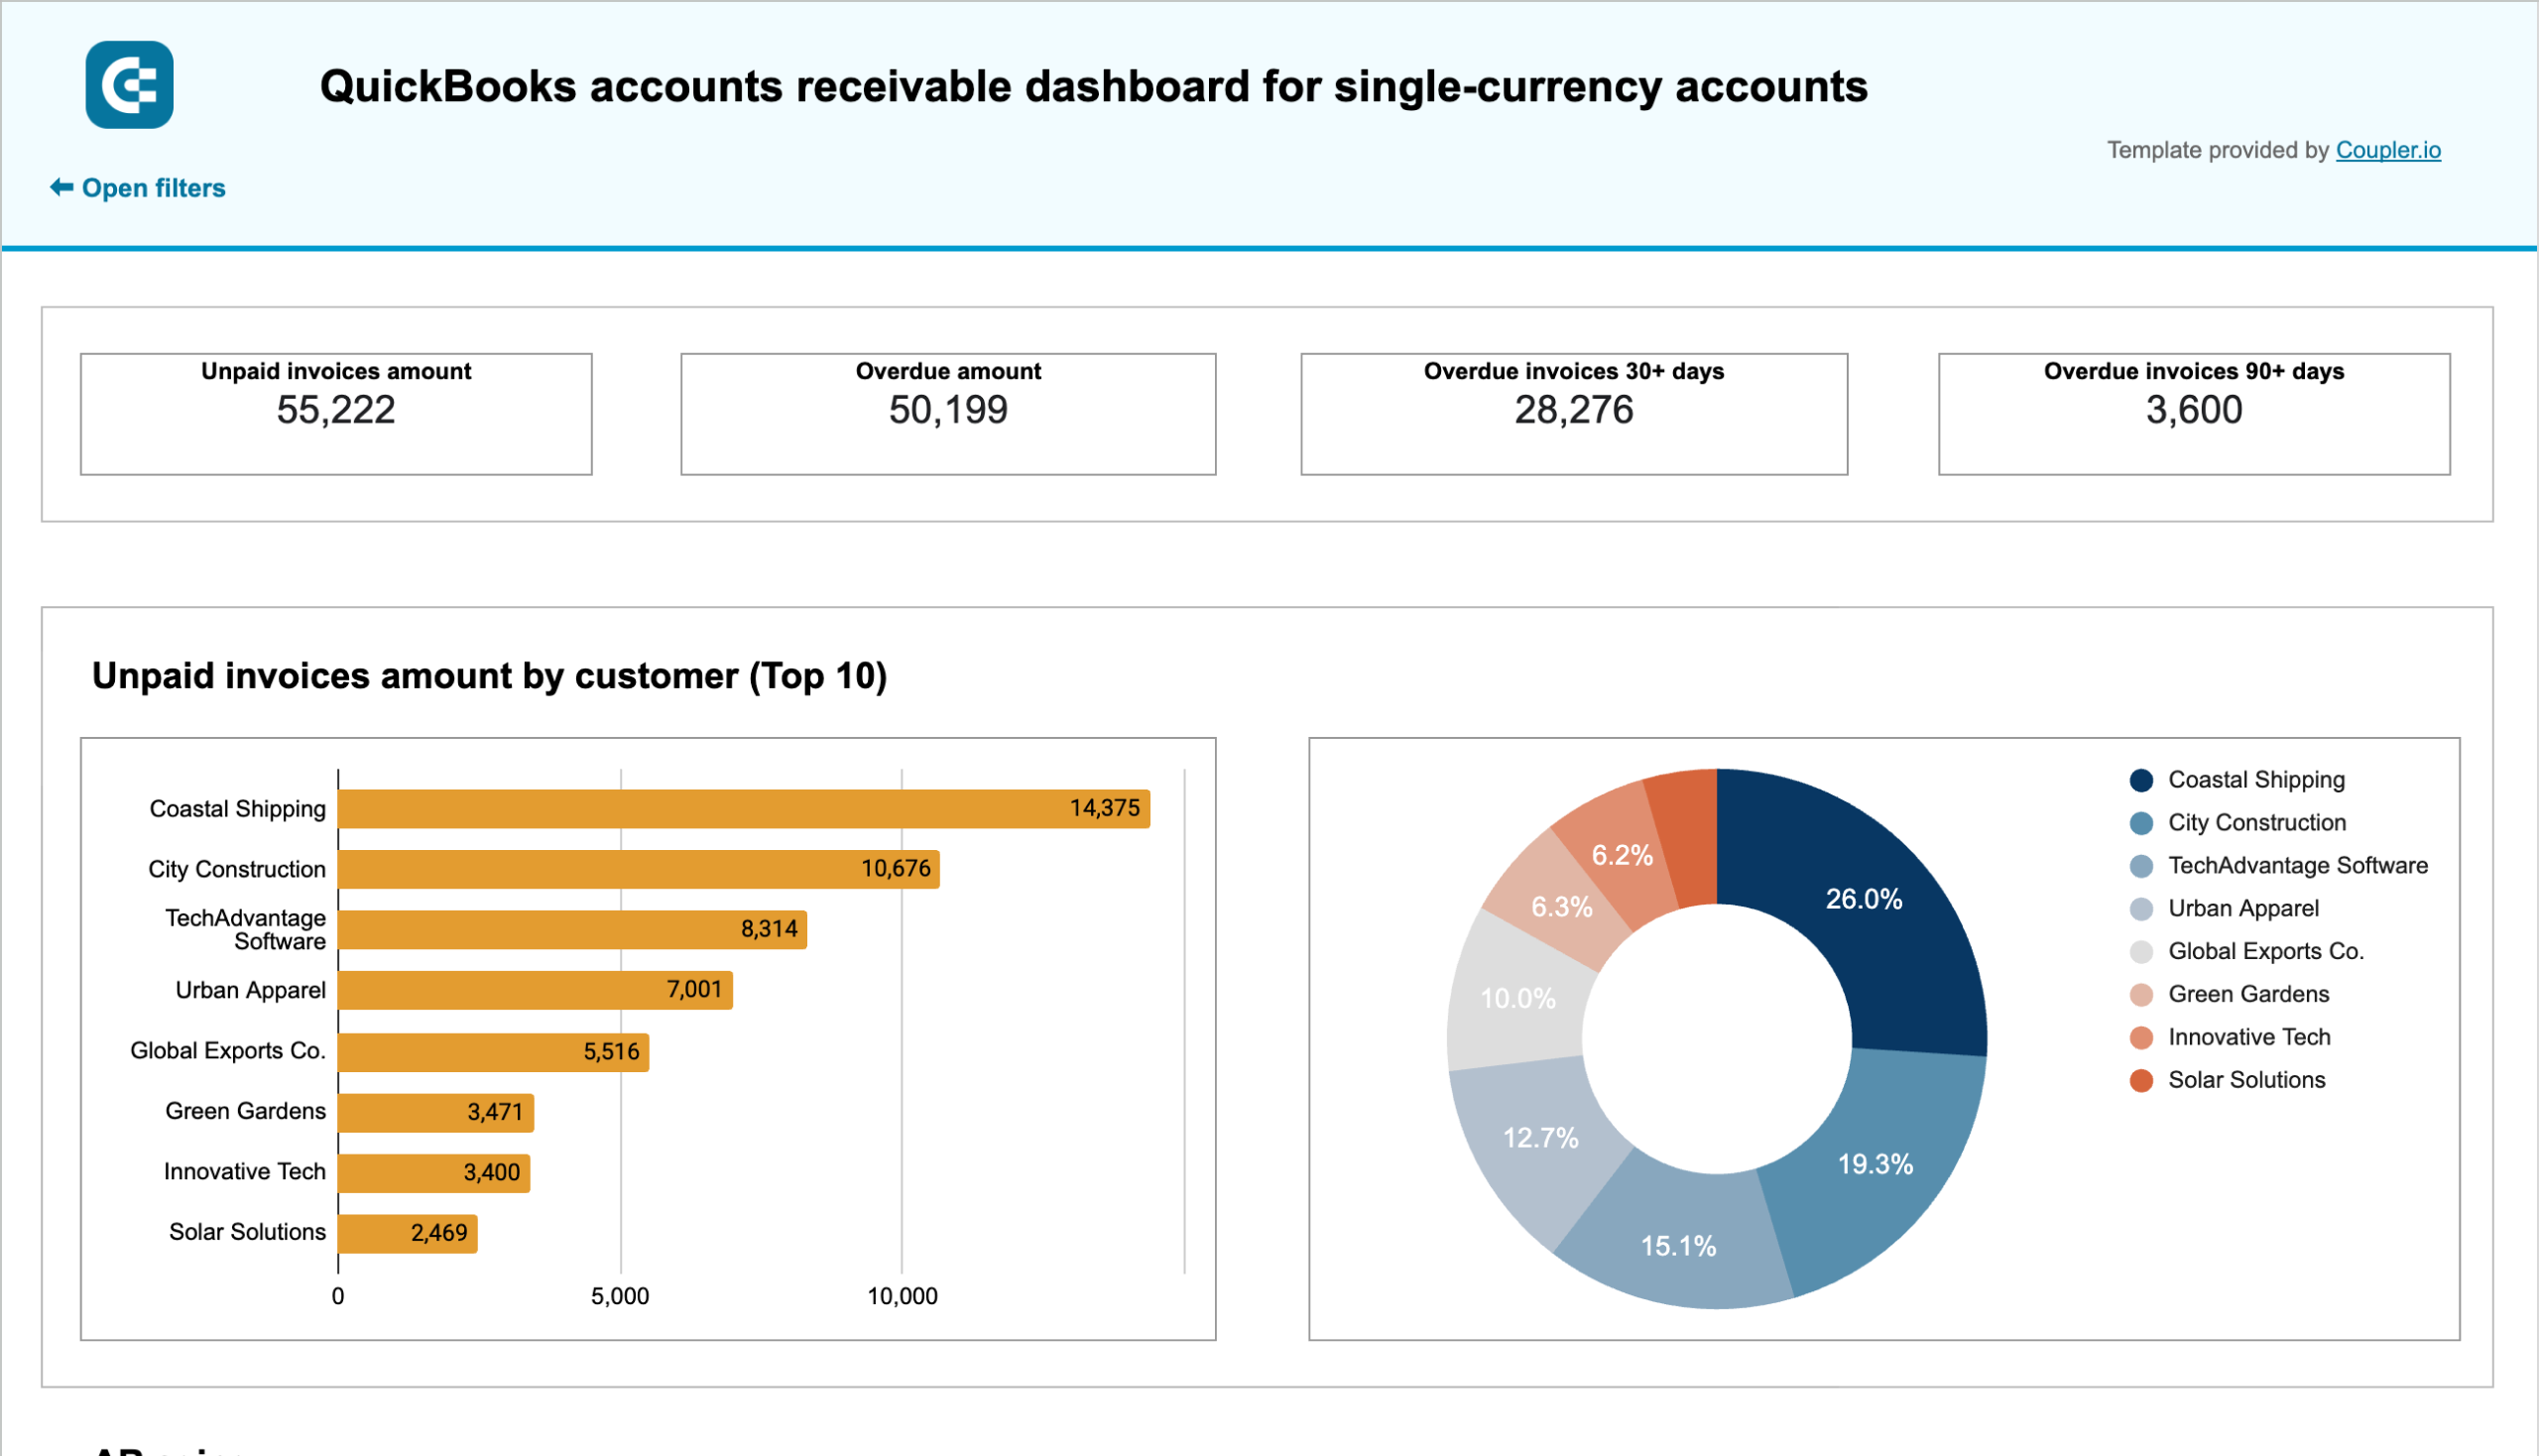
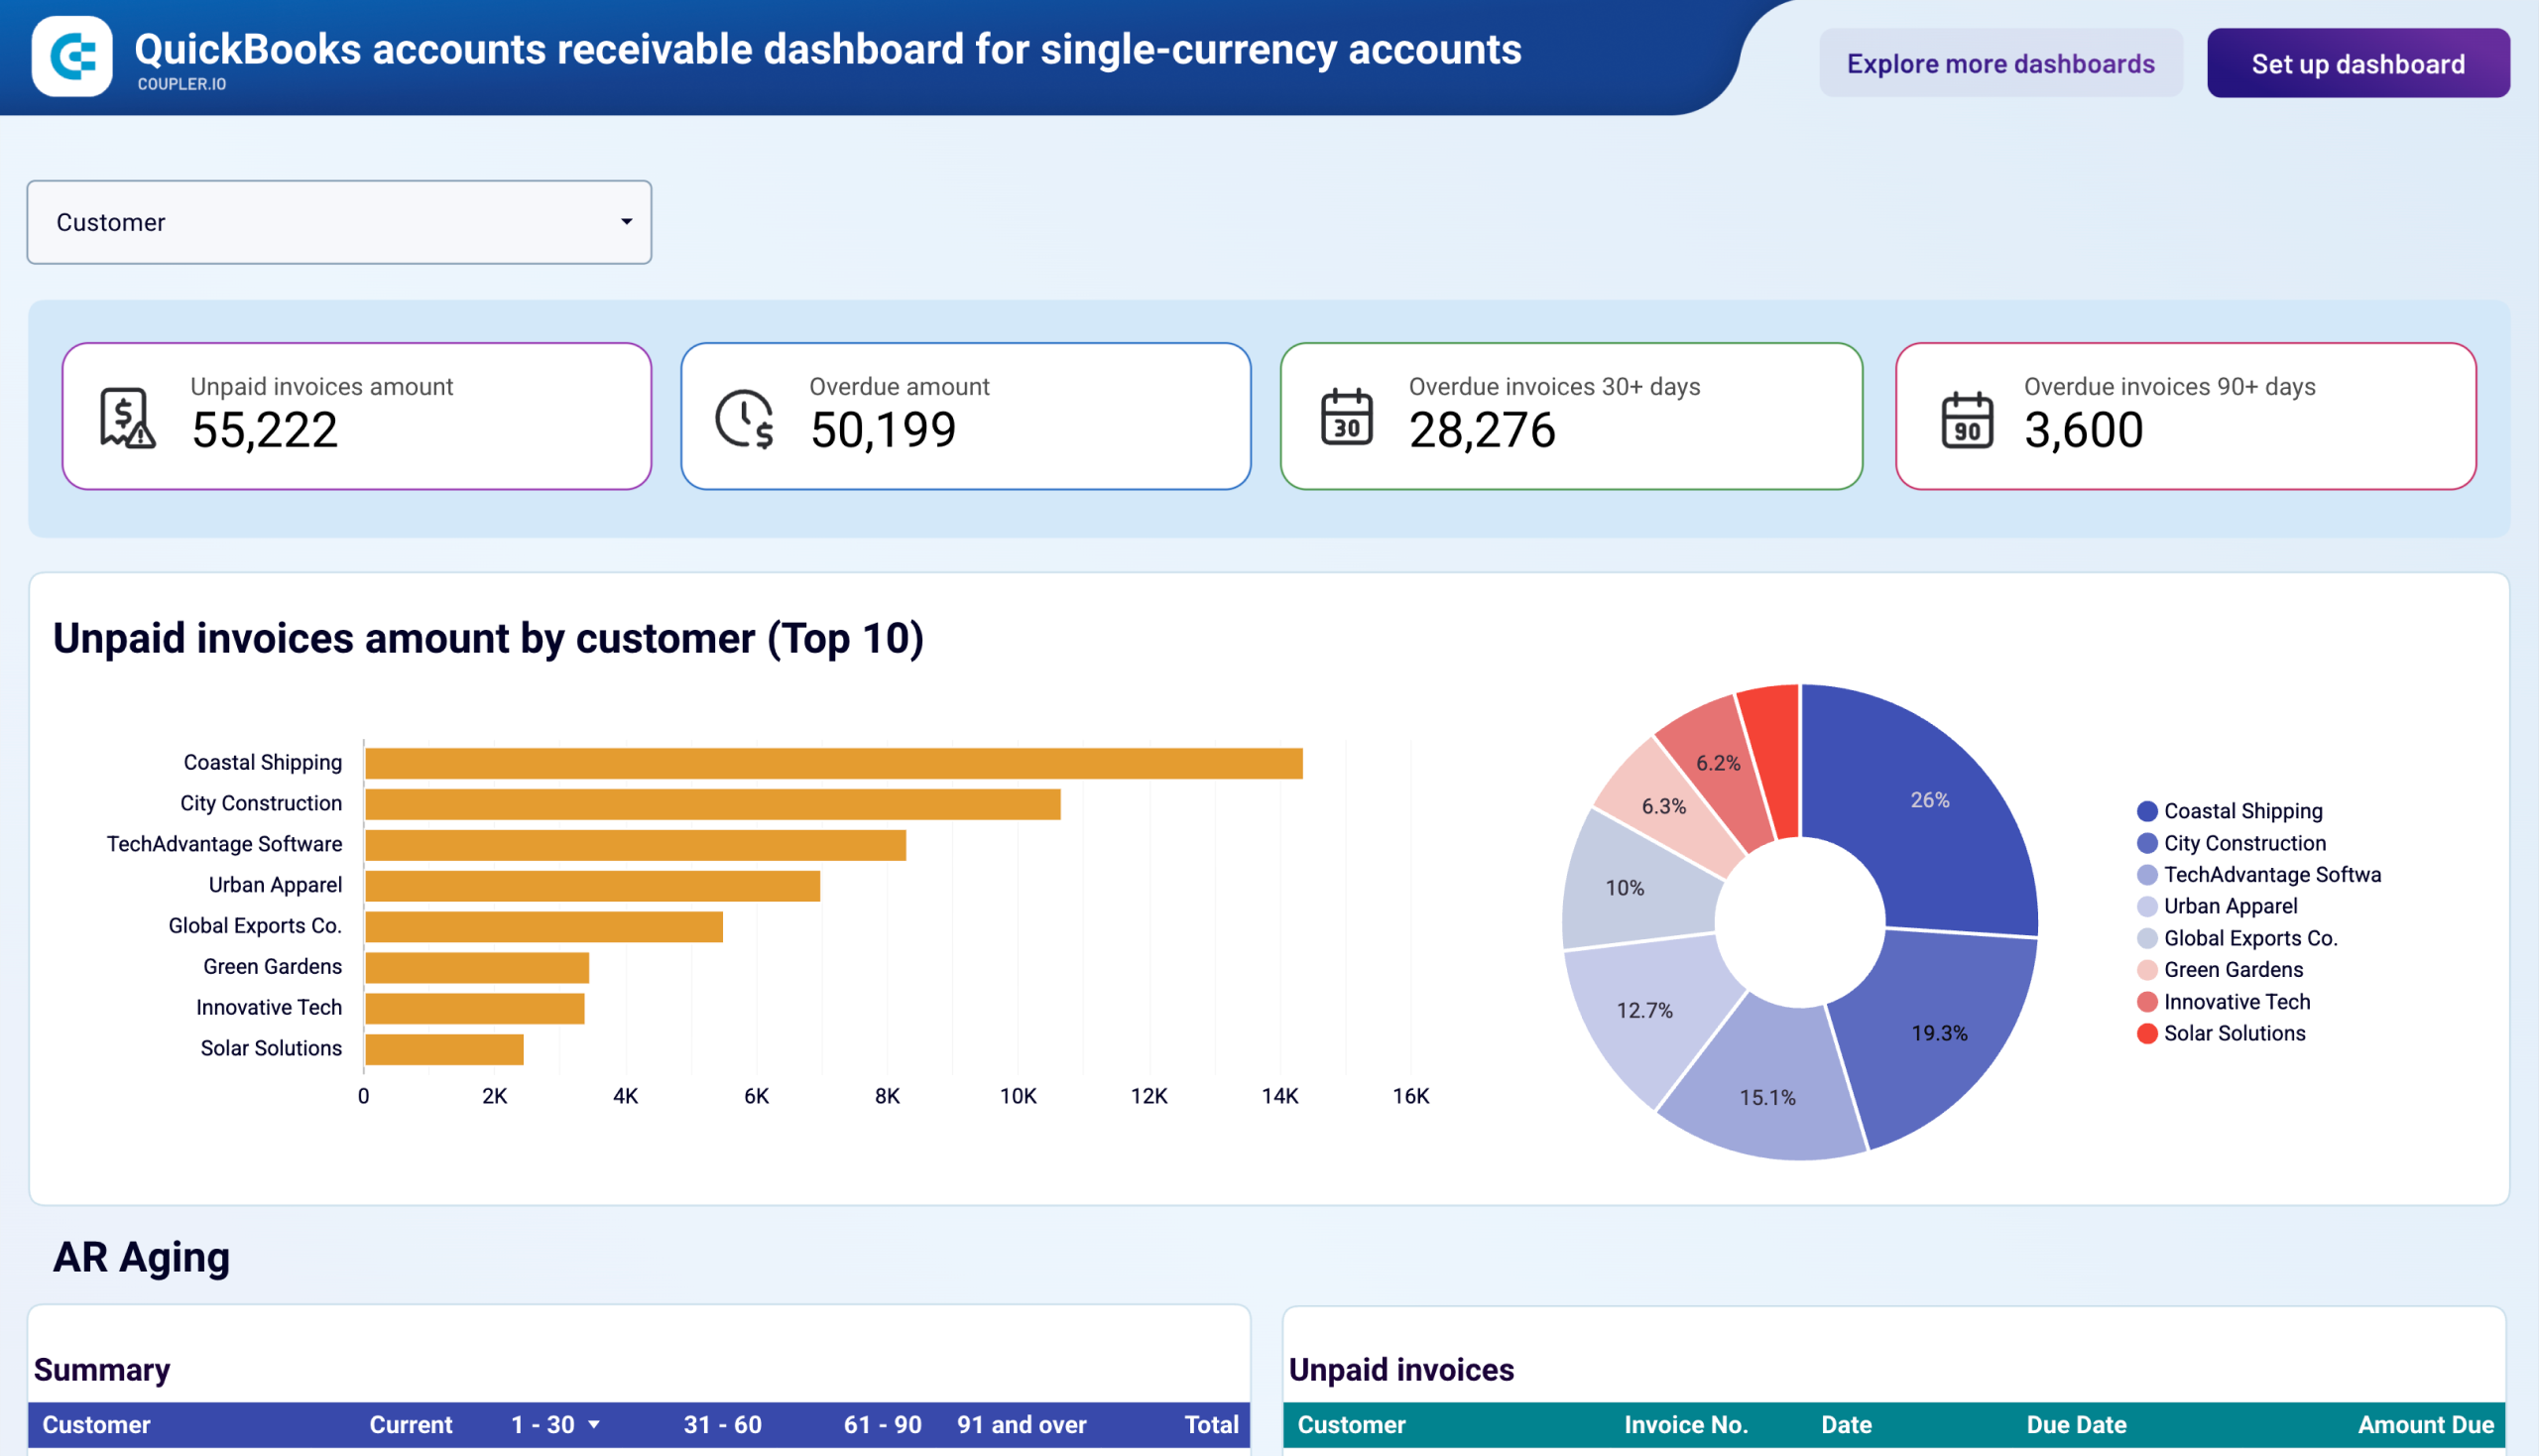
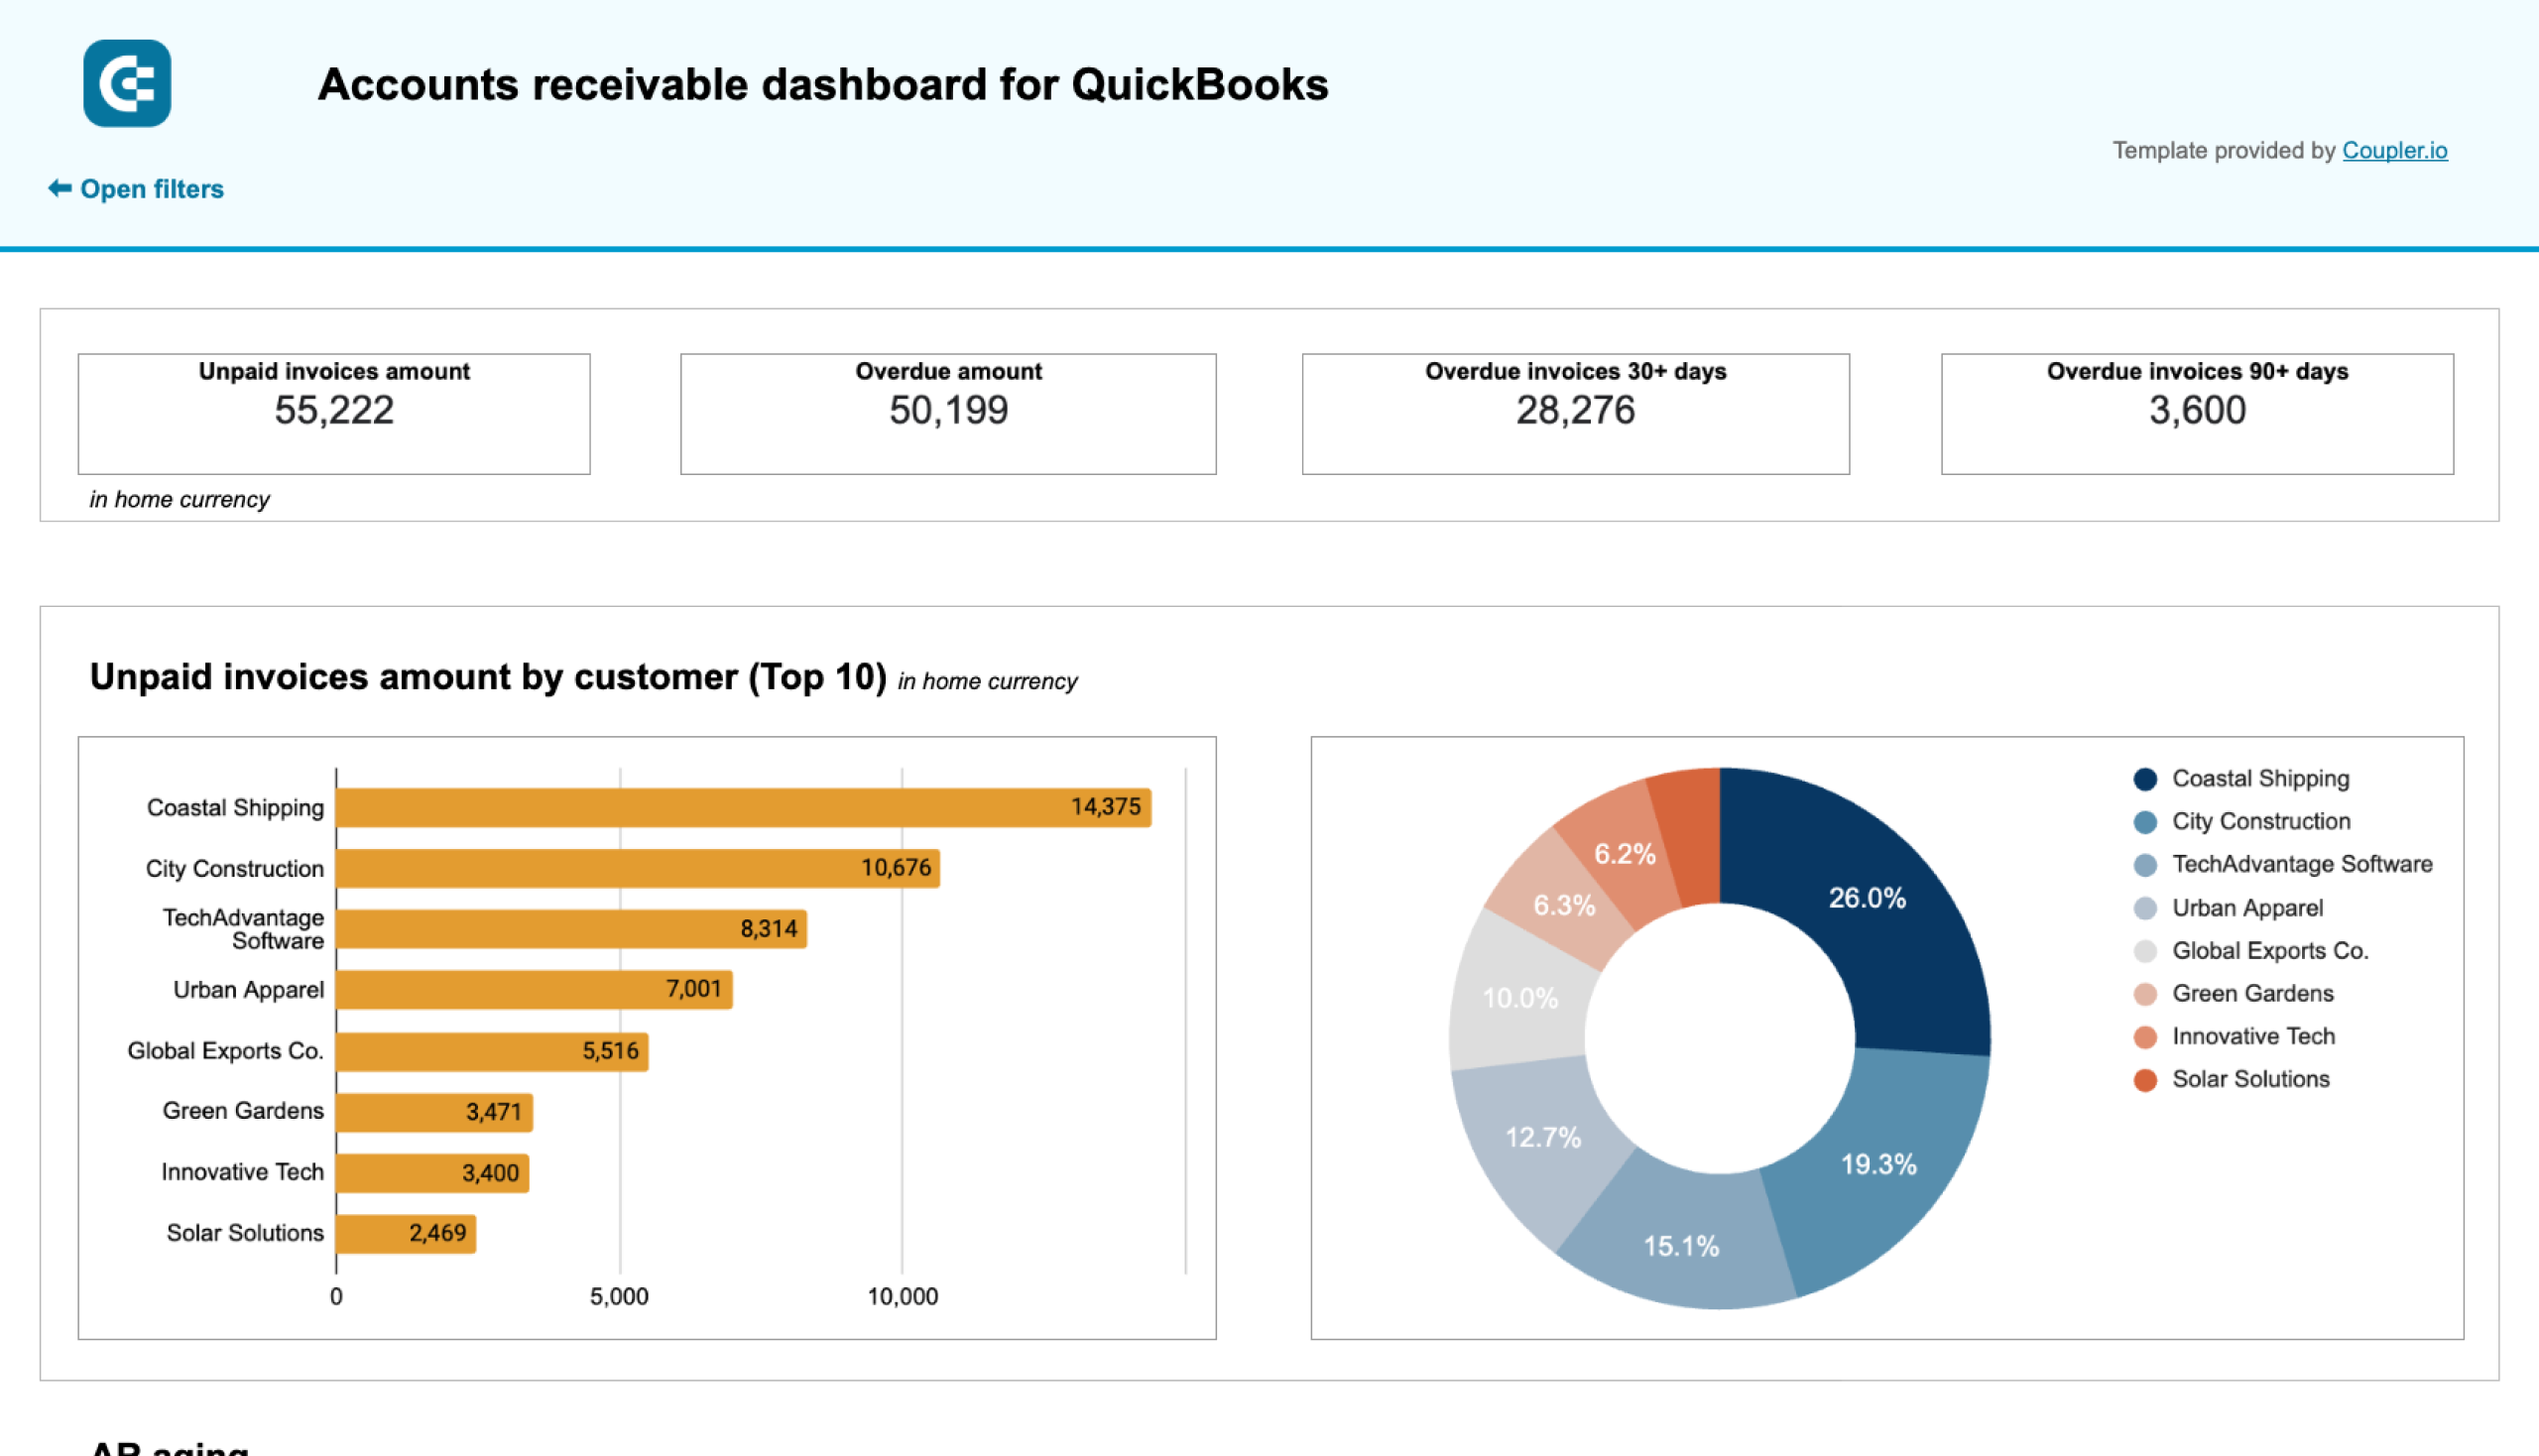
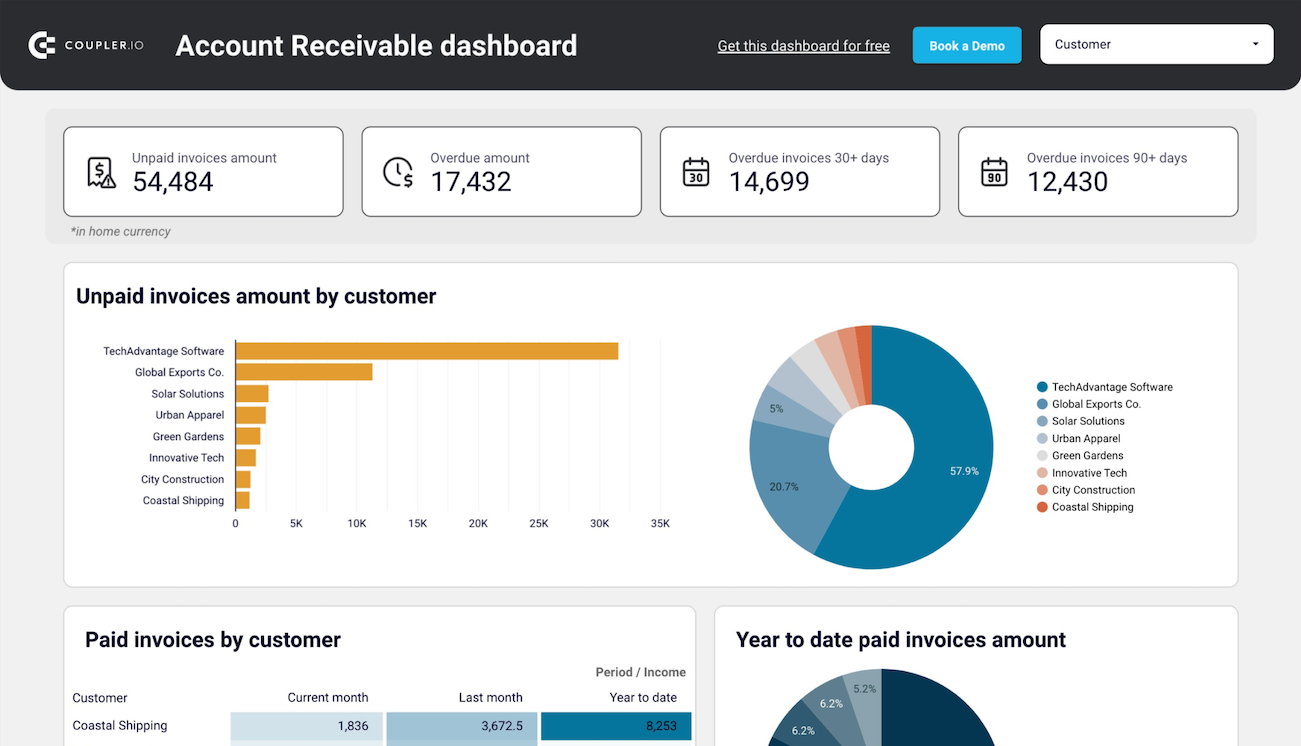
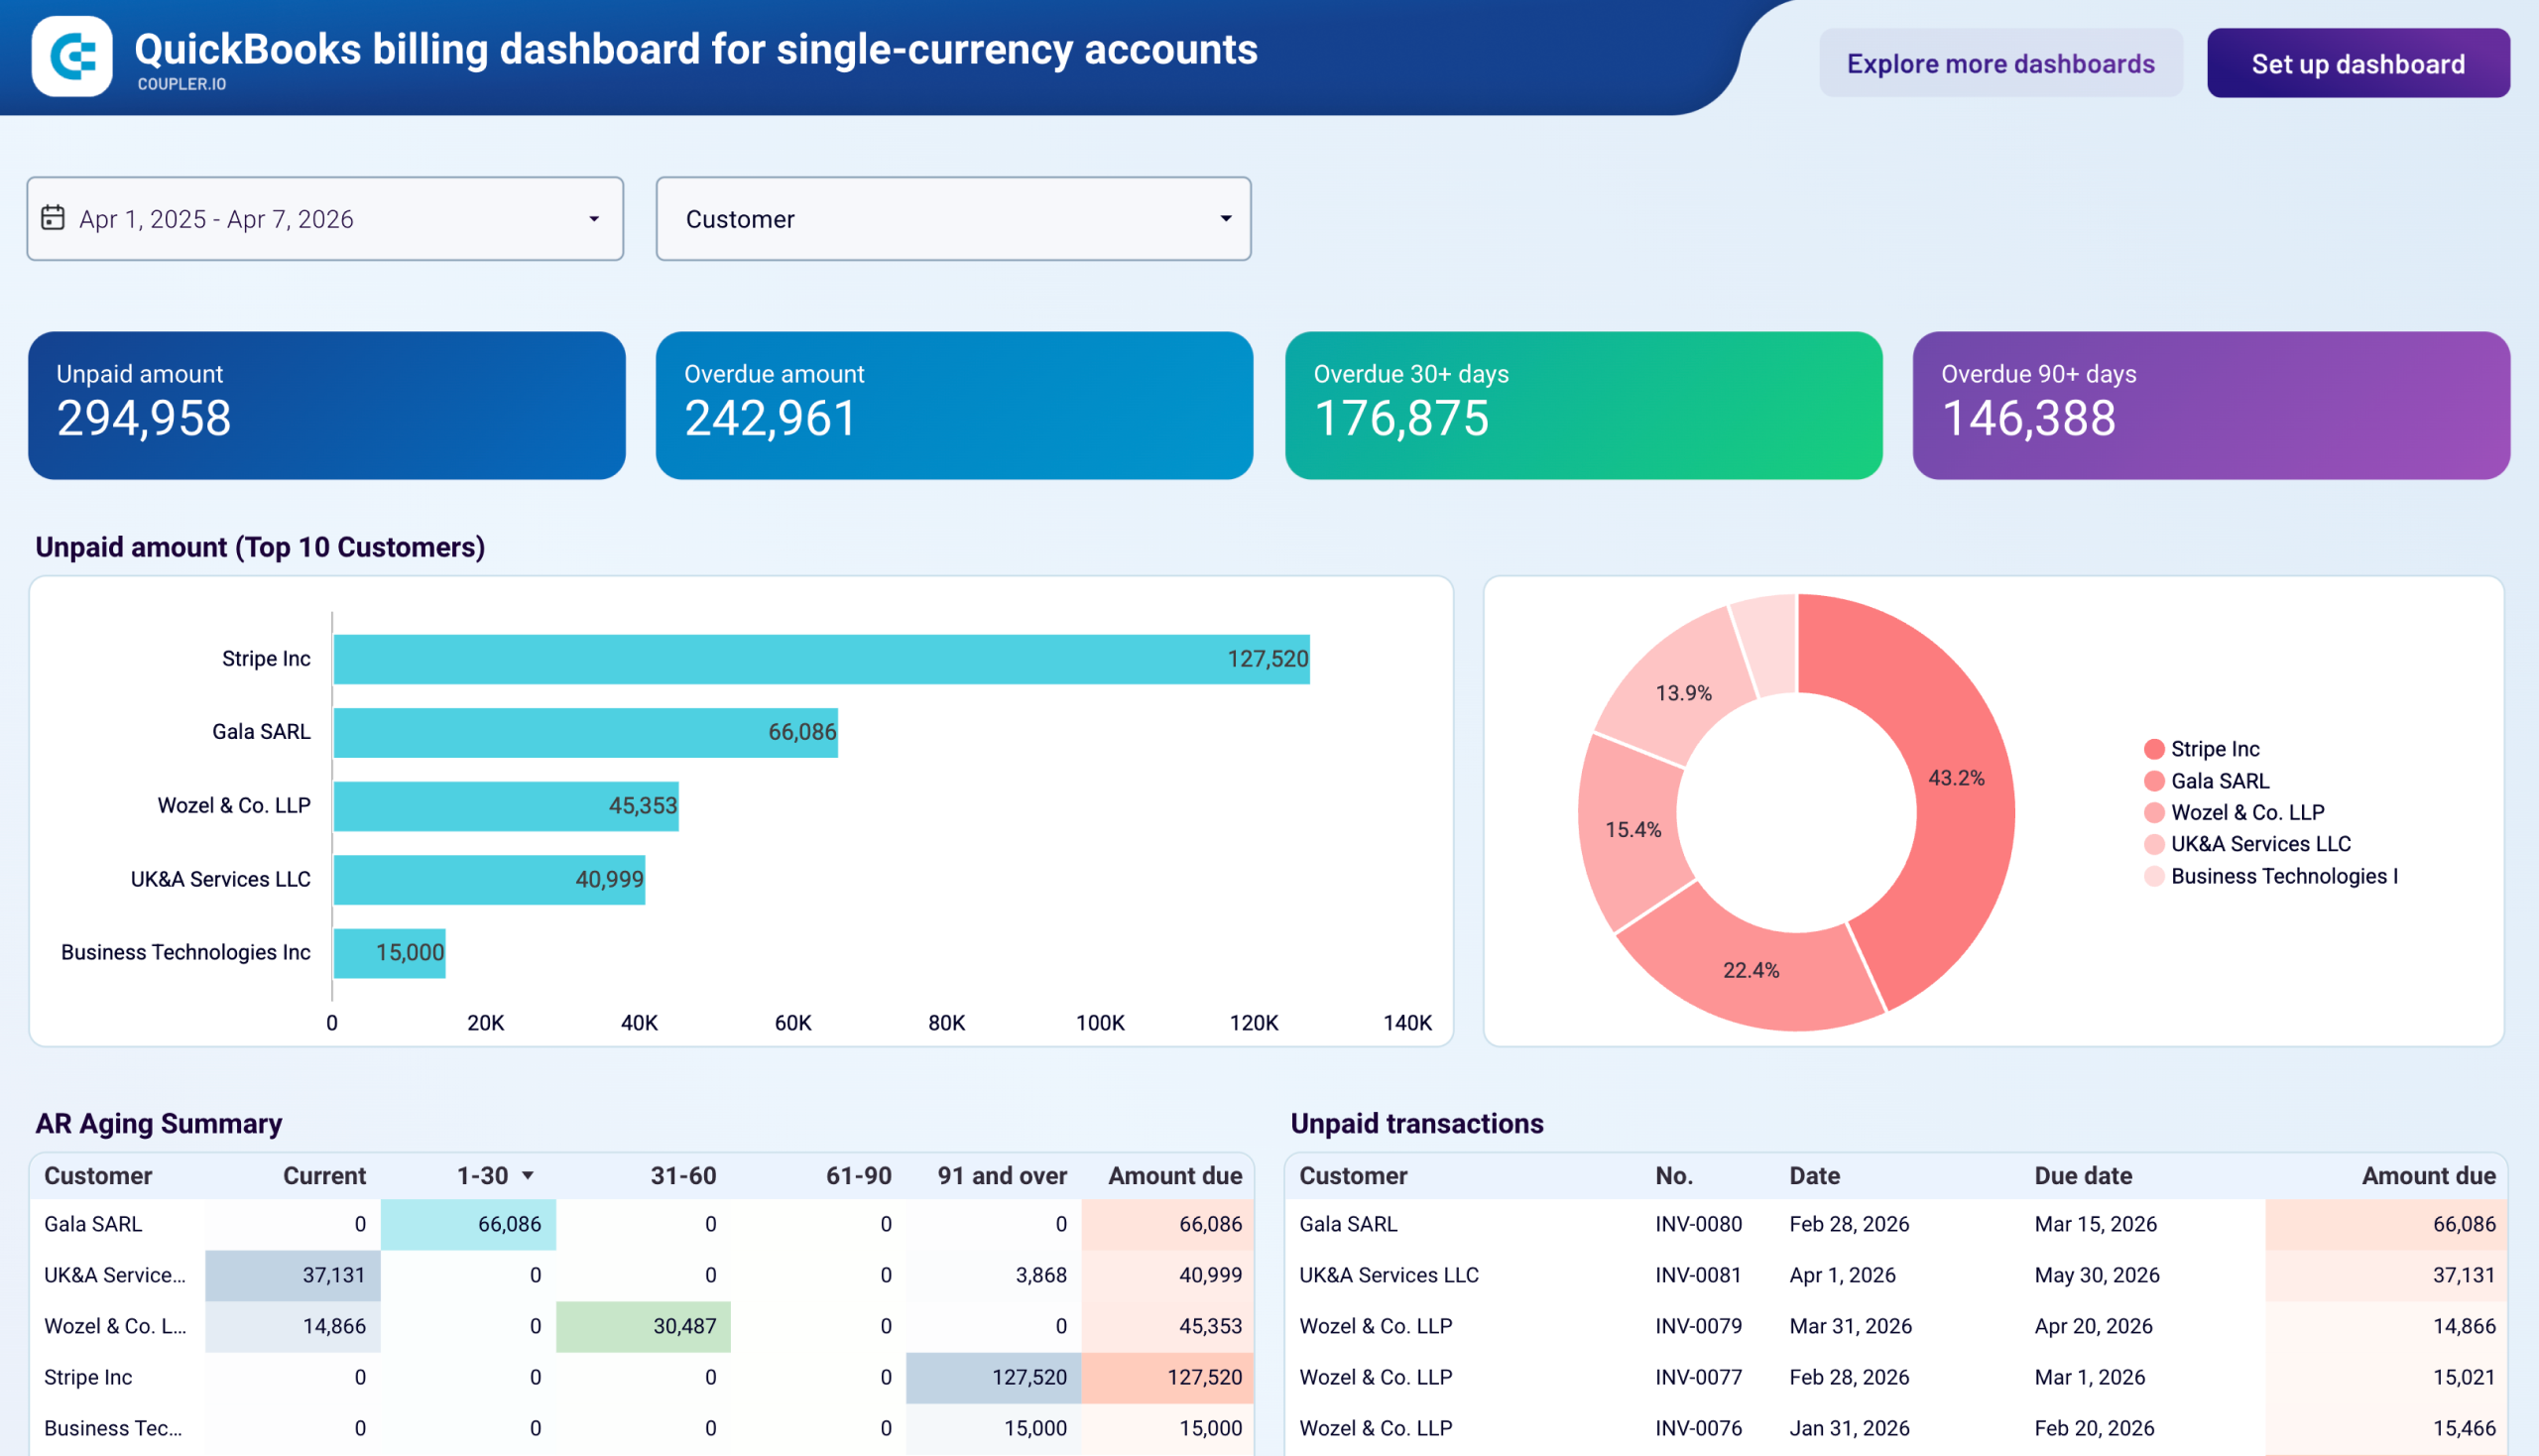
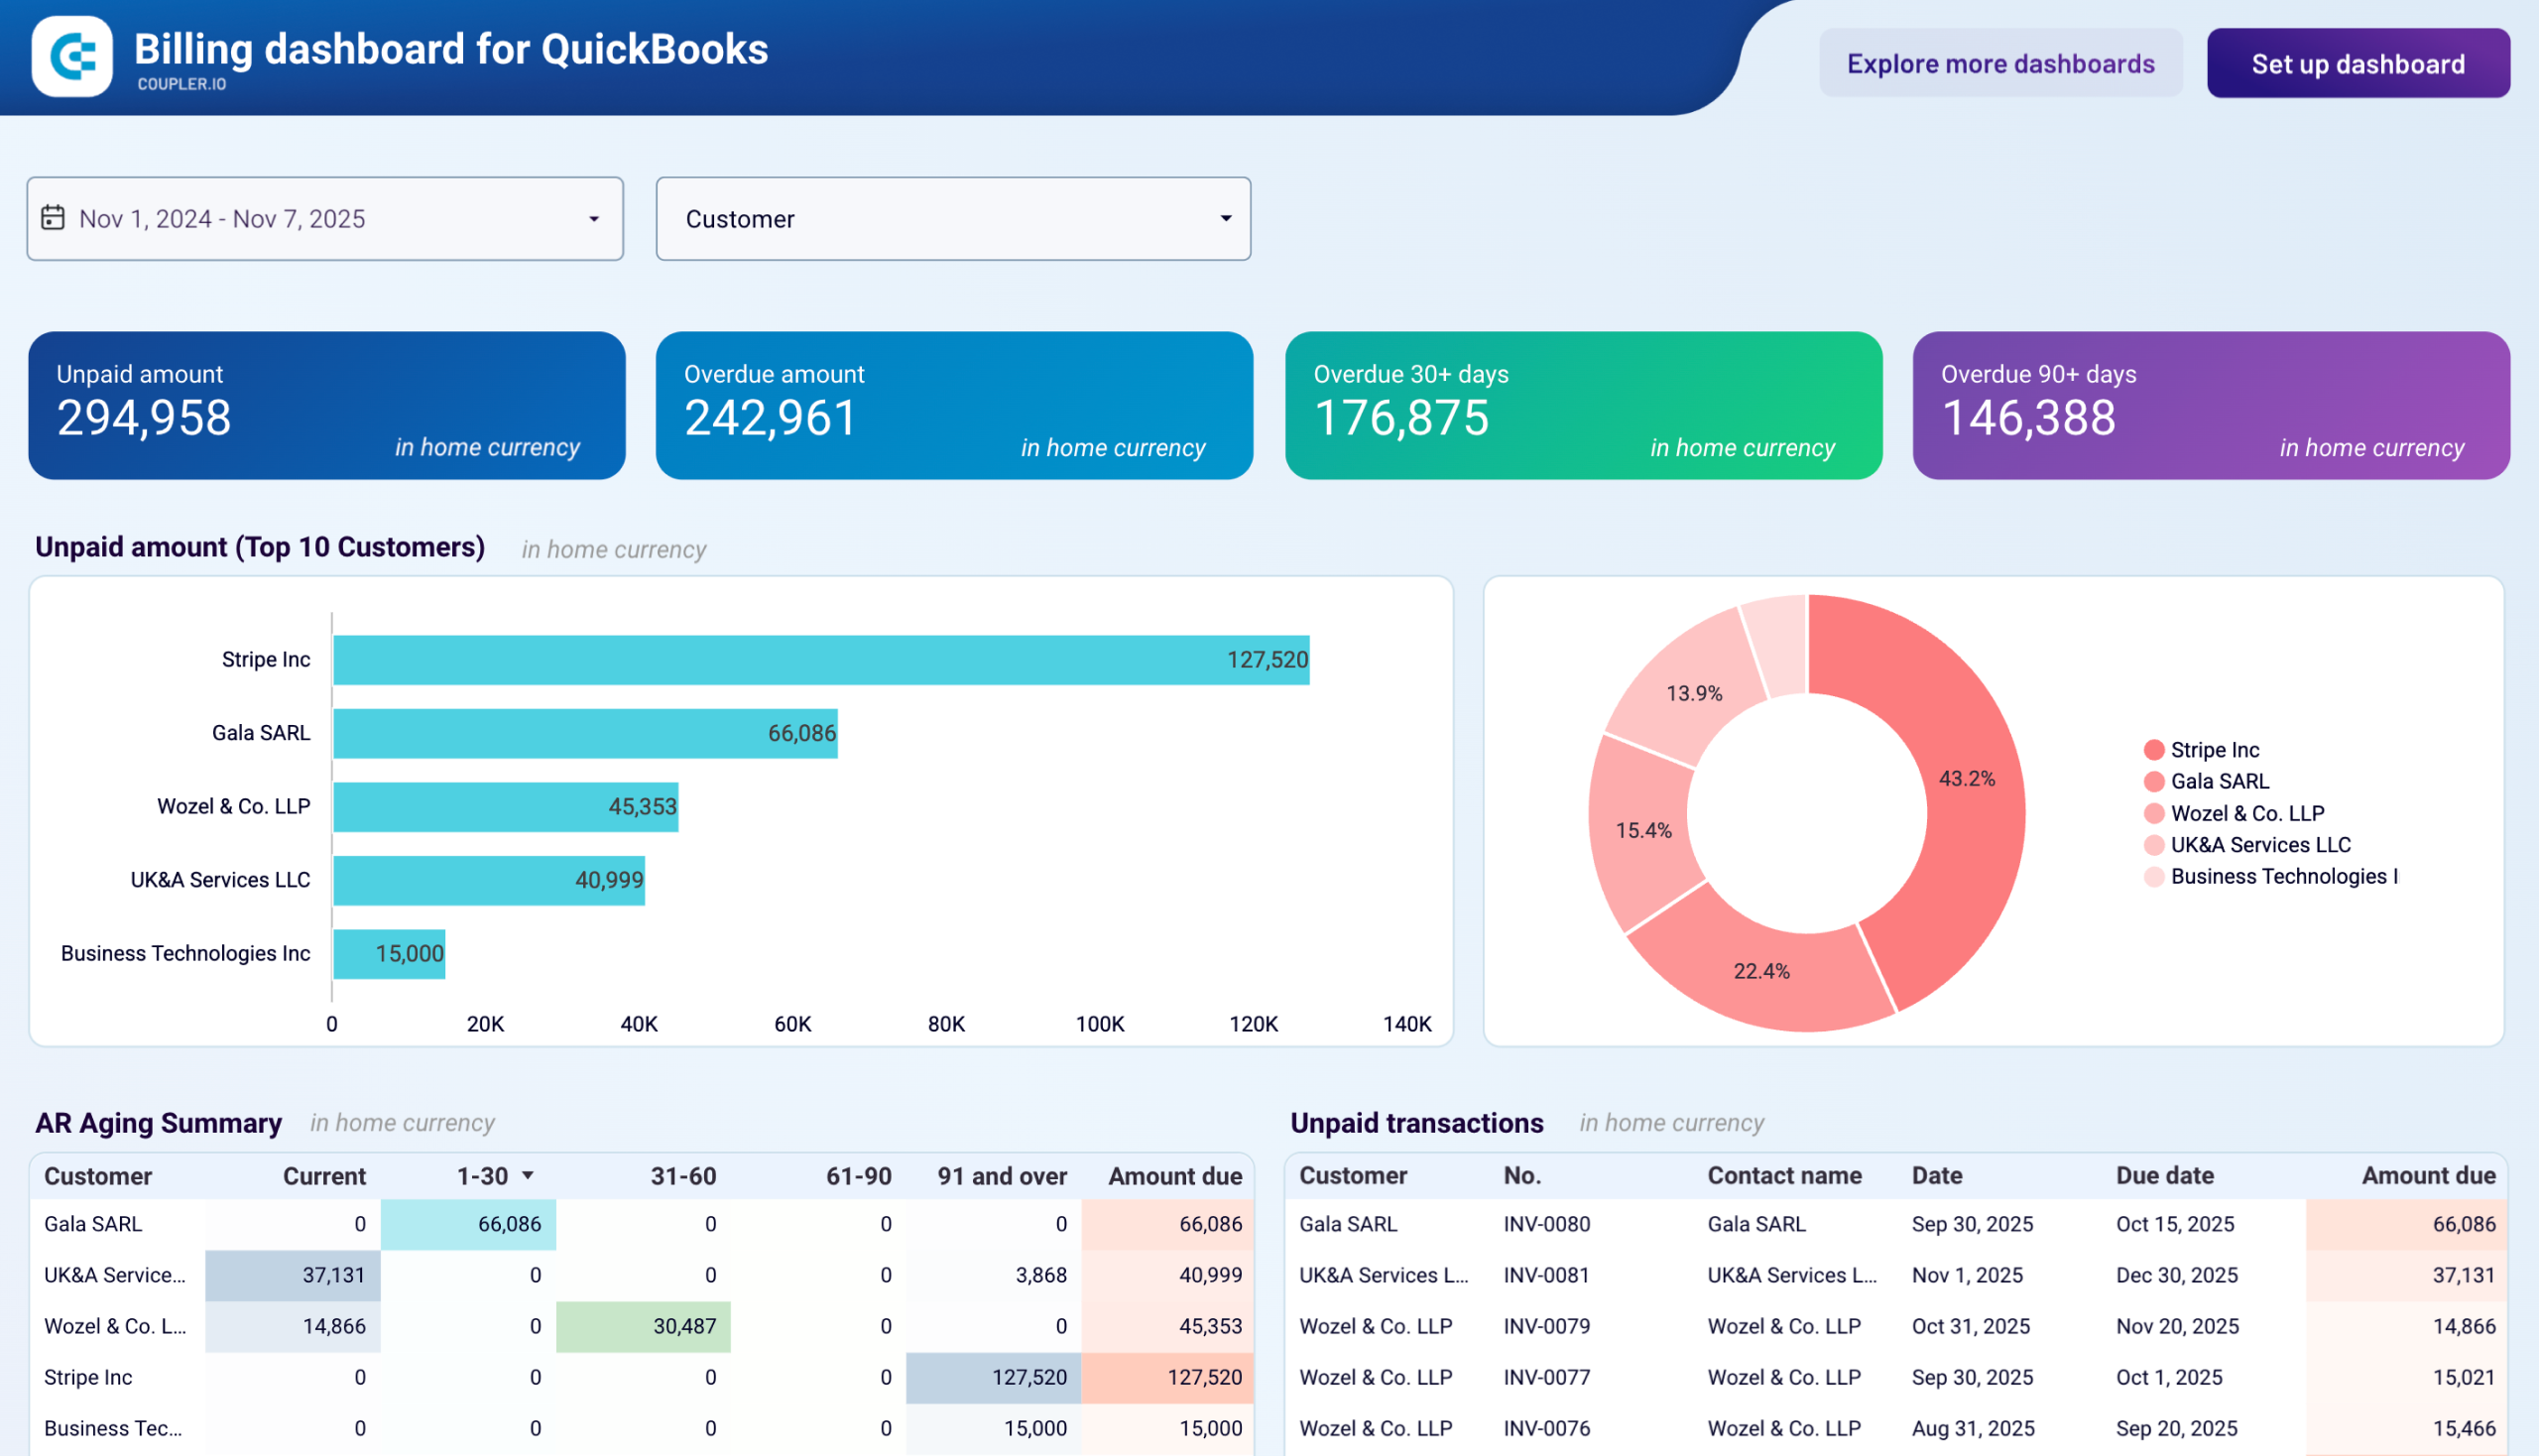
Monitor outstanding customer invoices by aging periods to manage collections, identify overdue accounts, and maintain healthy cash flow. Unpaid invoice amounts may differ from Xero UI because exchange rates are applied differently. Xero UI uses current exchange rate at viewing time, while dataset uses rate from invoice creation date
Access comprehensive transaction data with associated contact details across all Xero transaction types.
Explore individual transactions in Xero, broken down by account, account type, and source type.
Review financial performance of Xero projects without item-level detail. Track costs and revenue at the project level and analyze performance by client contacts.
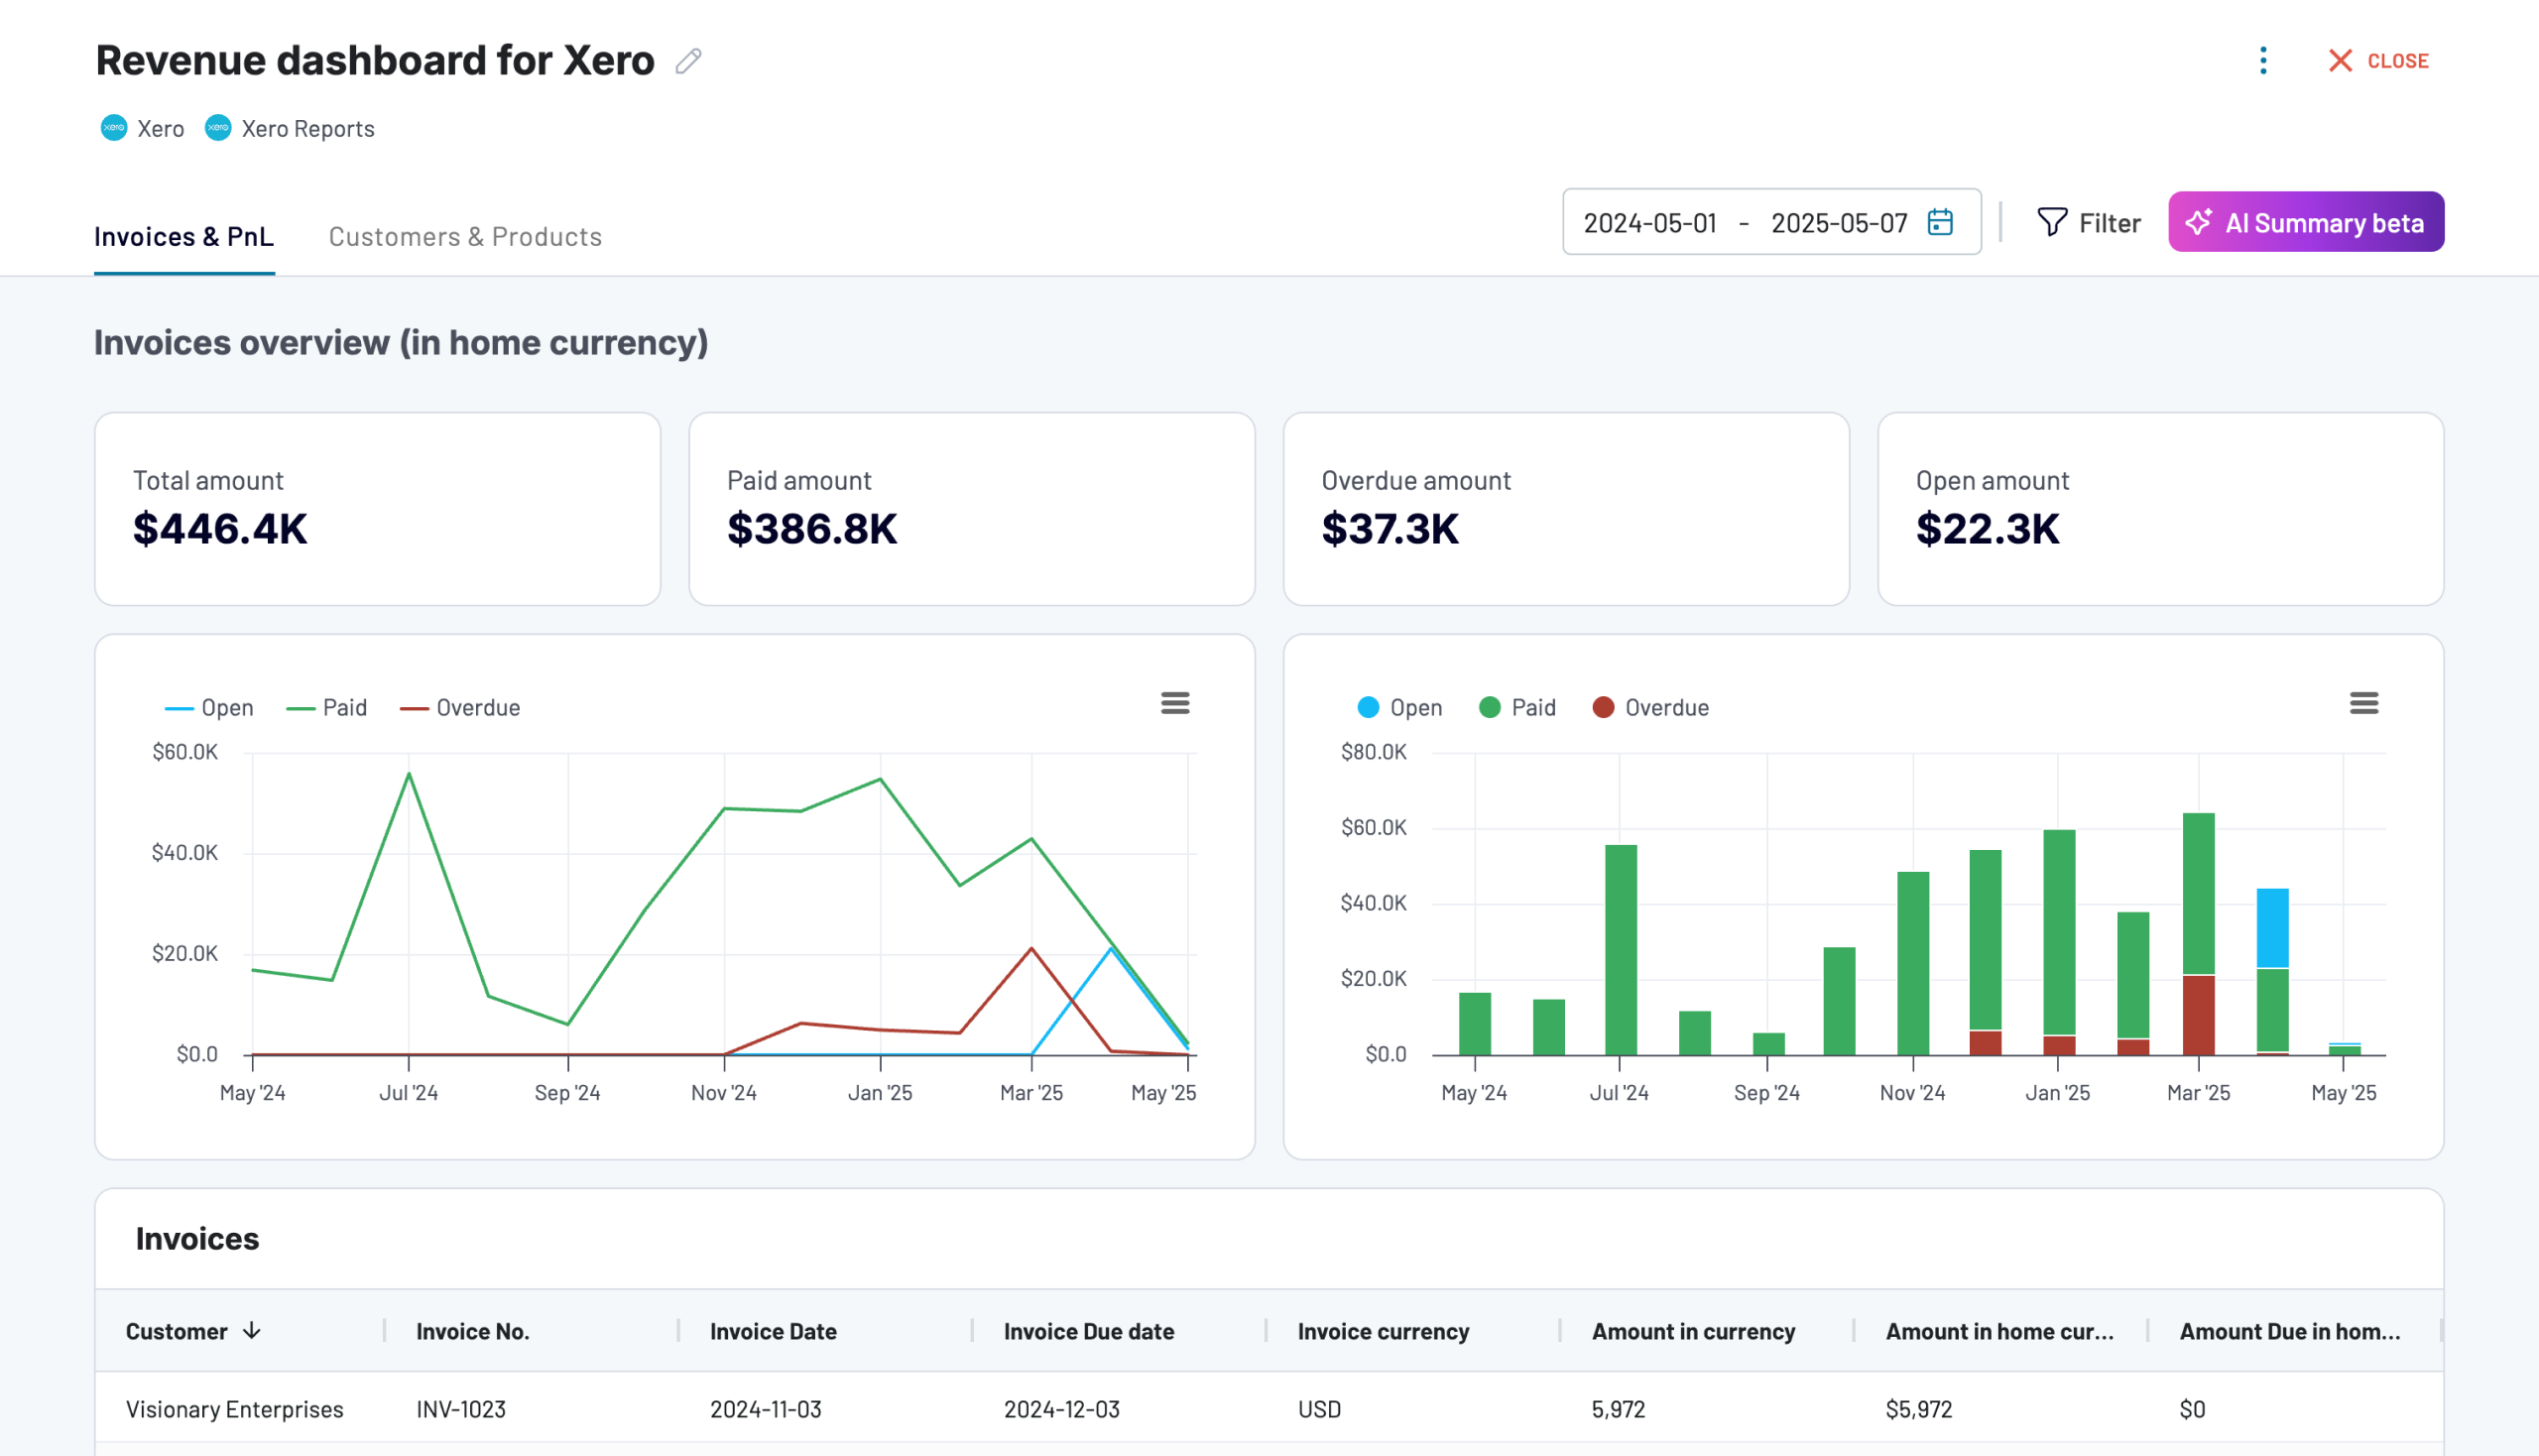
Analyze Xero invoices with line items by sorting through various invoice details such as type, item descriptions, and invoice statuses.
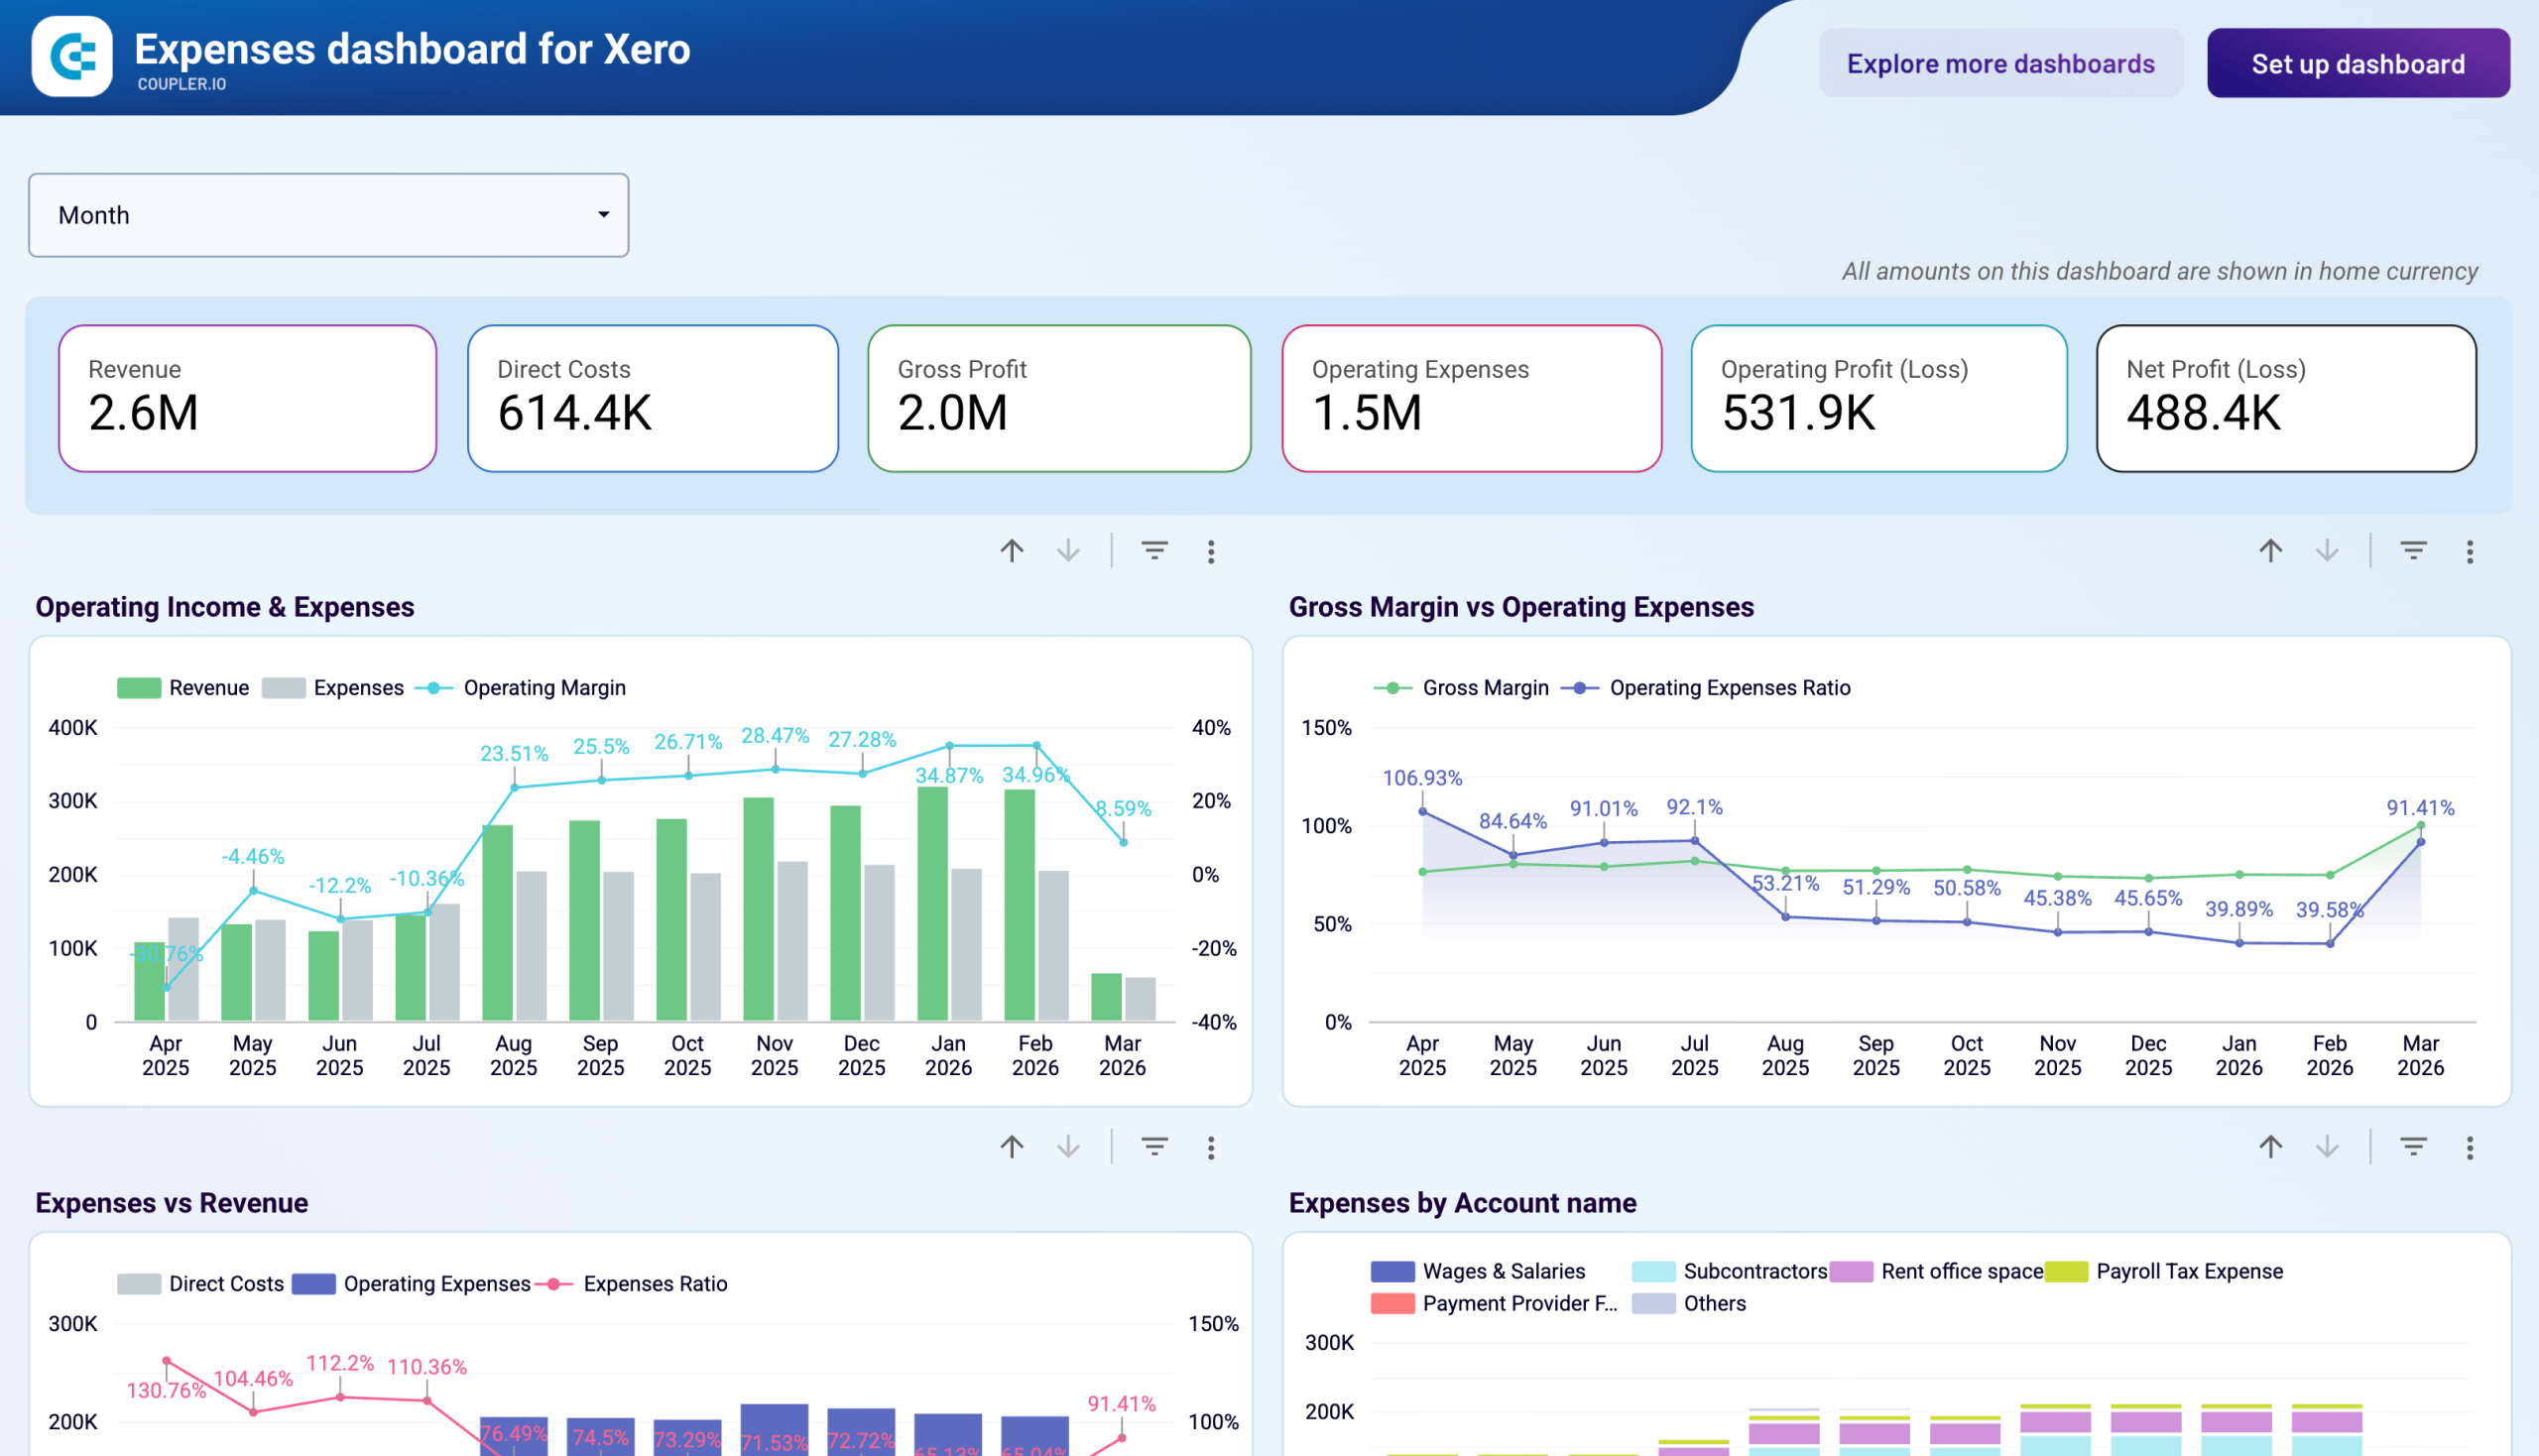
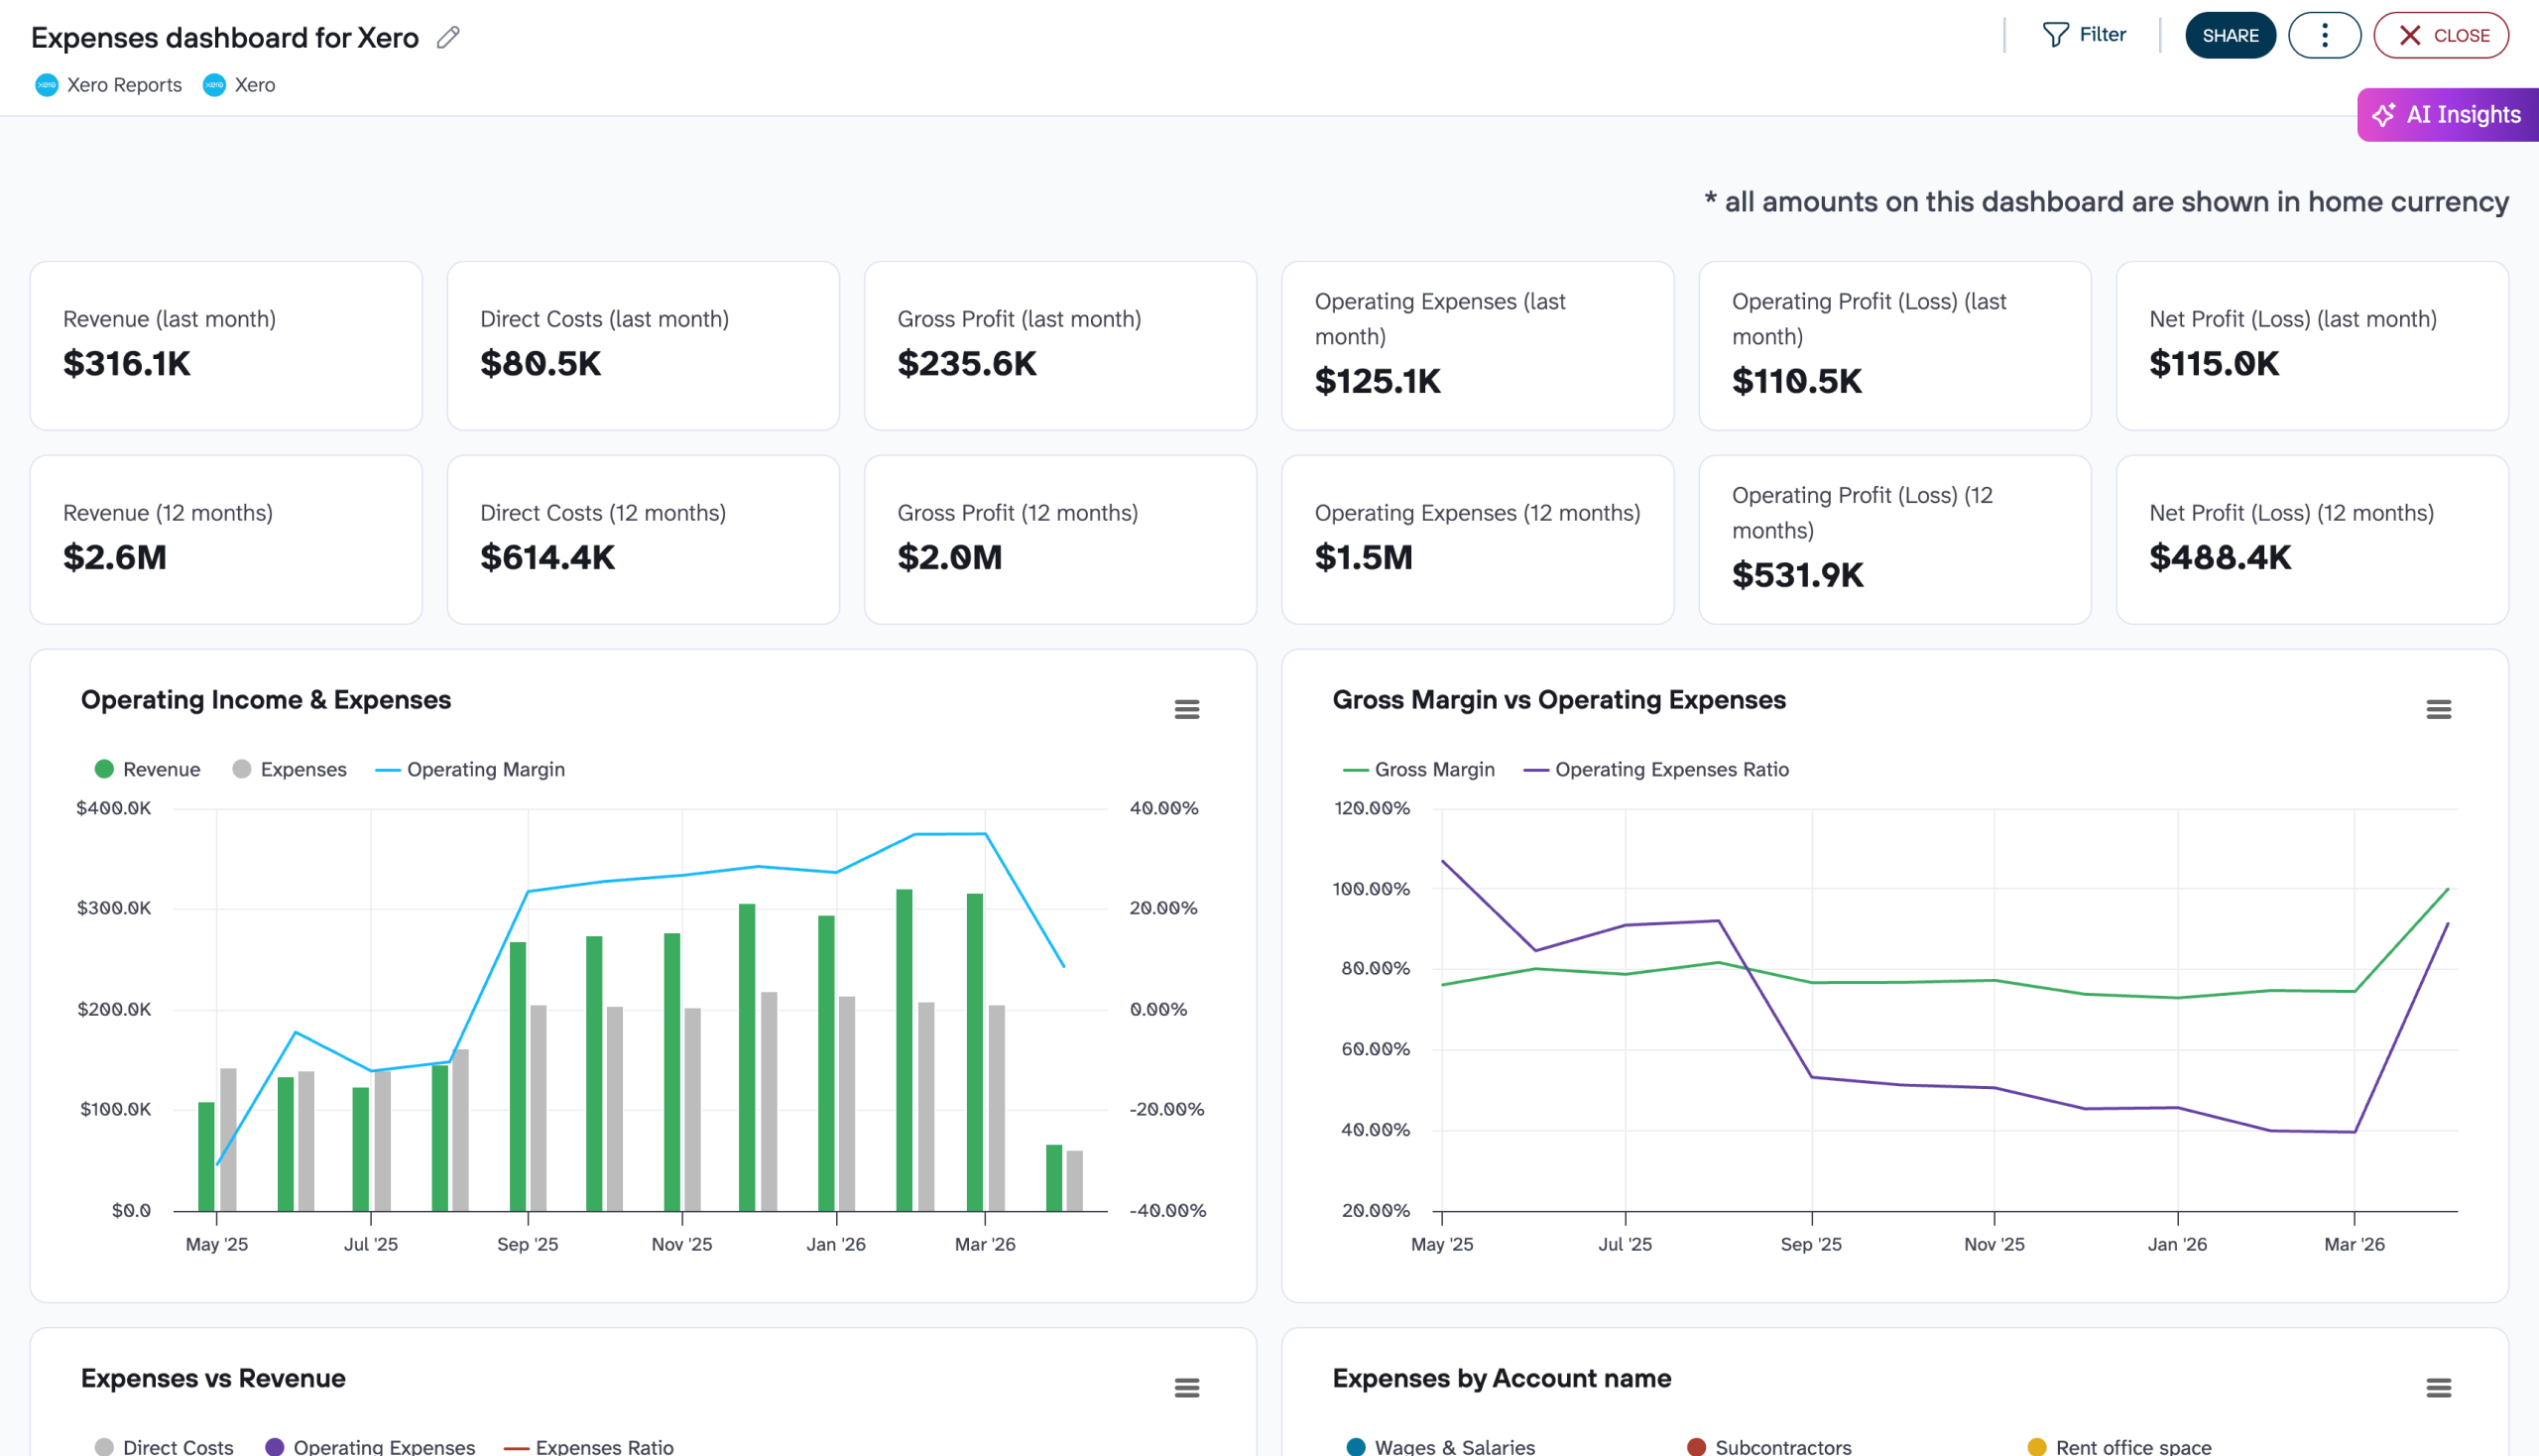
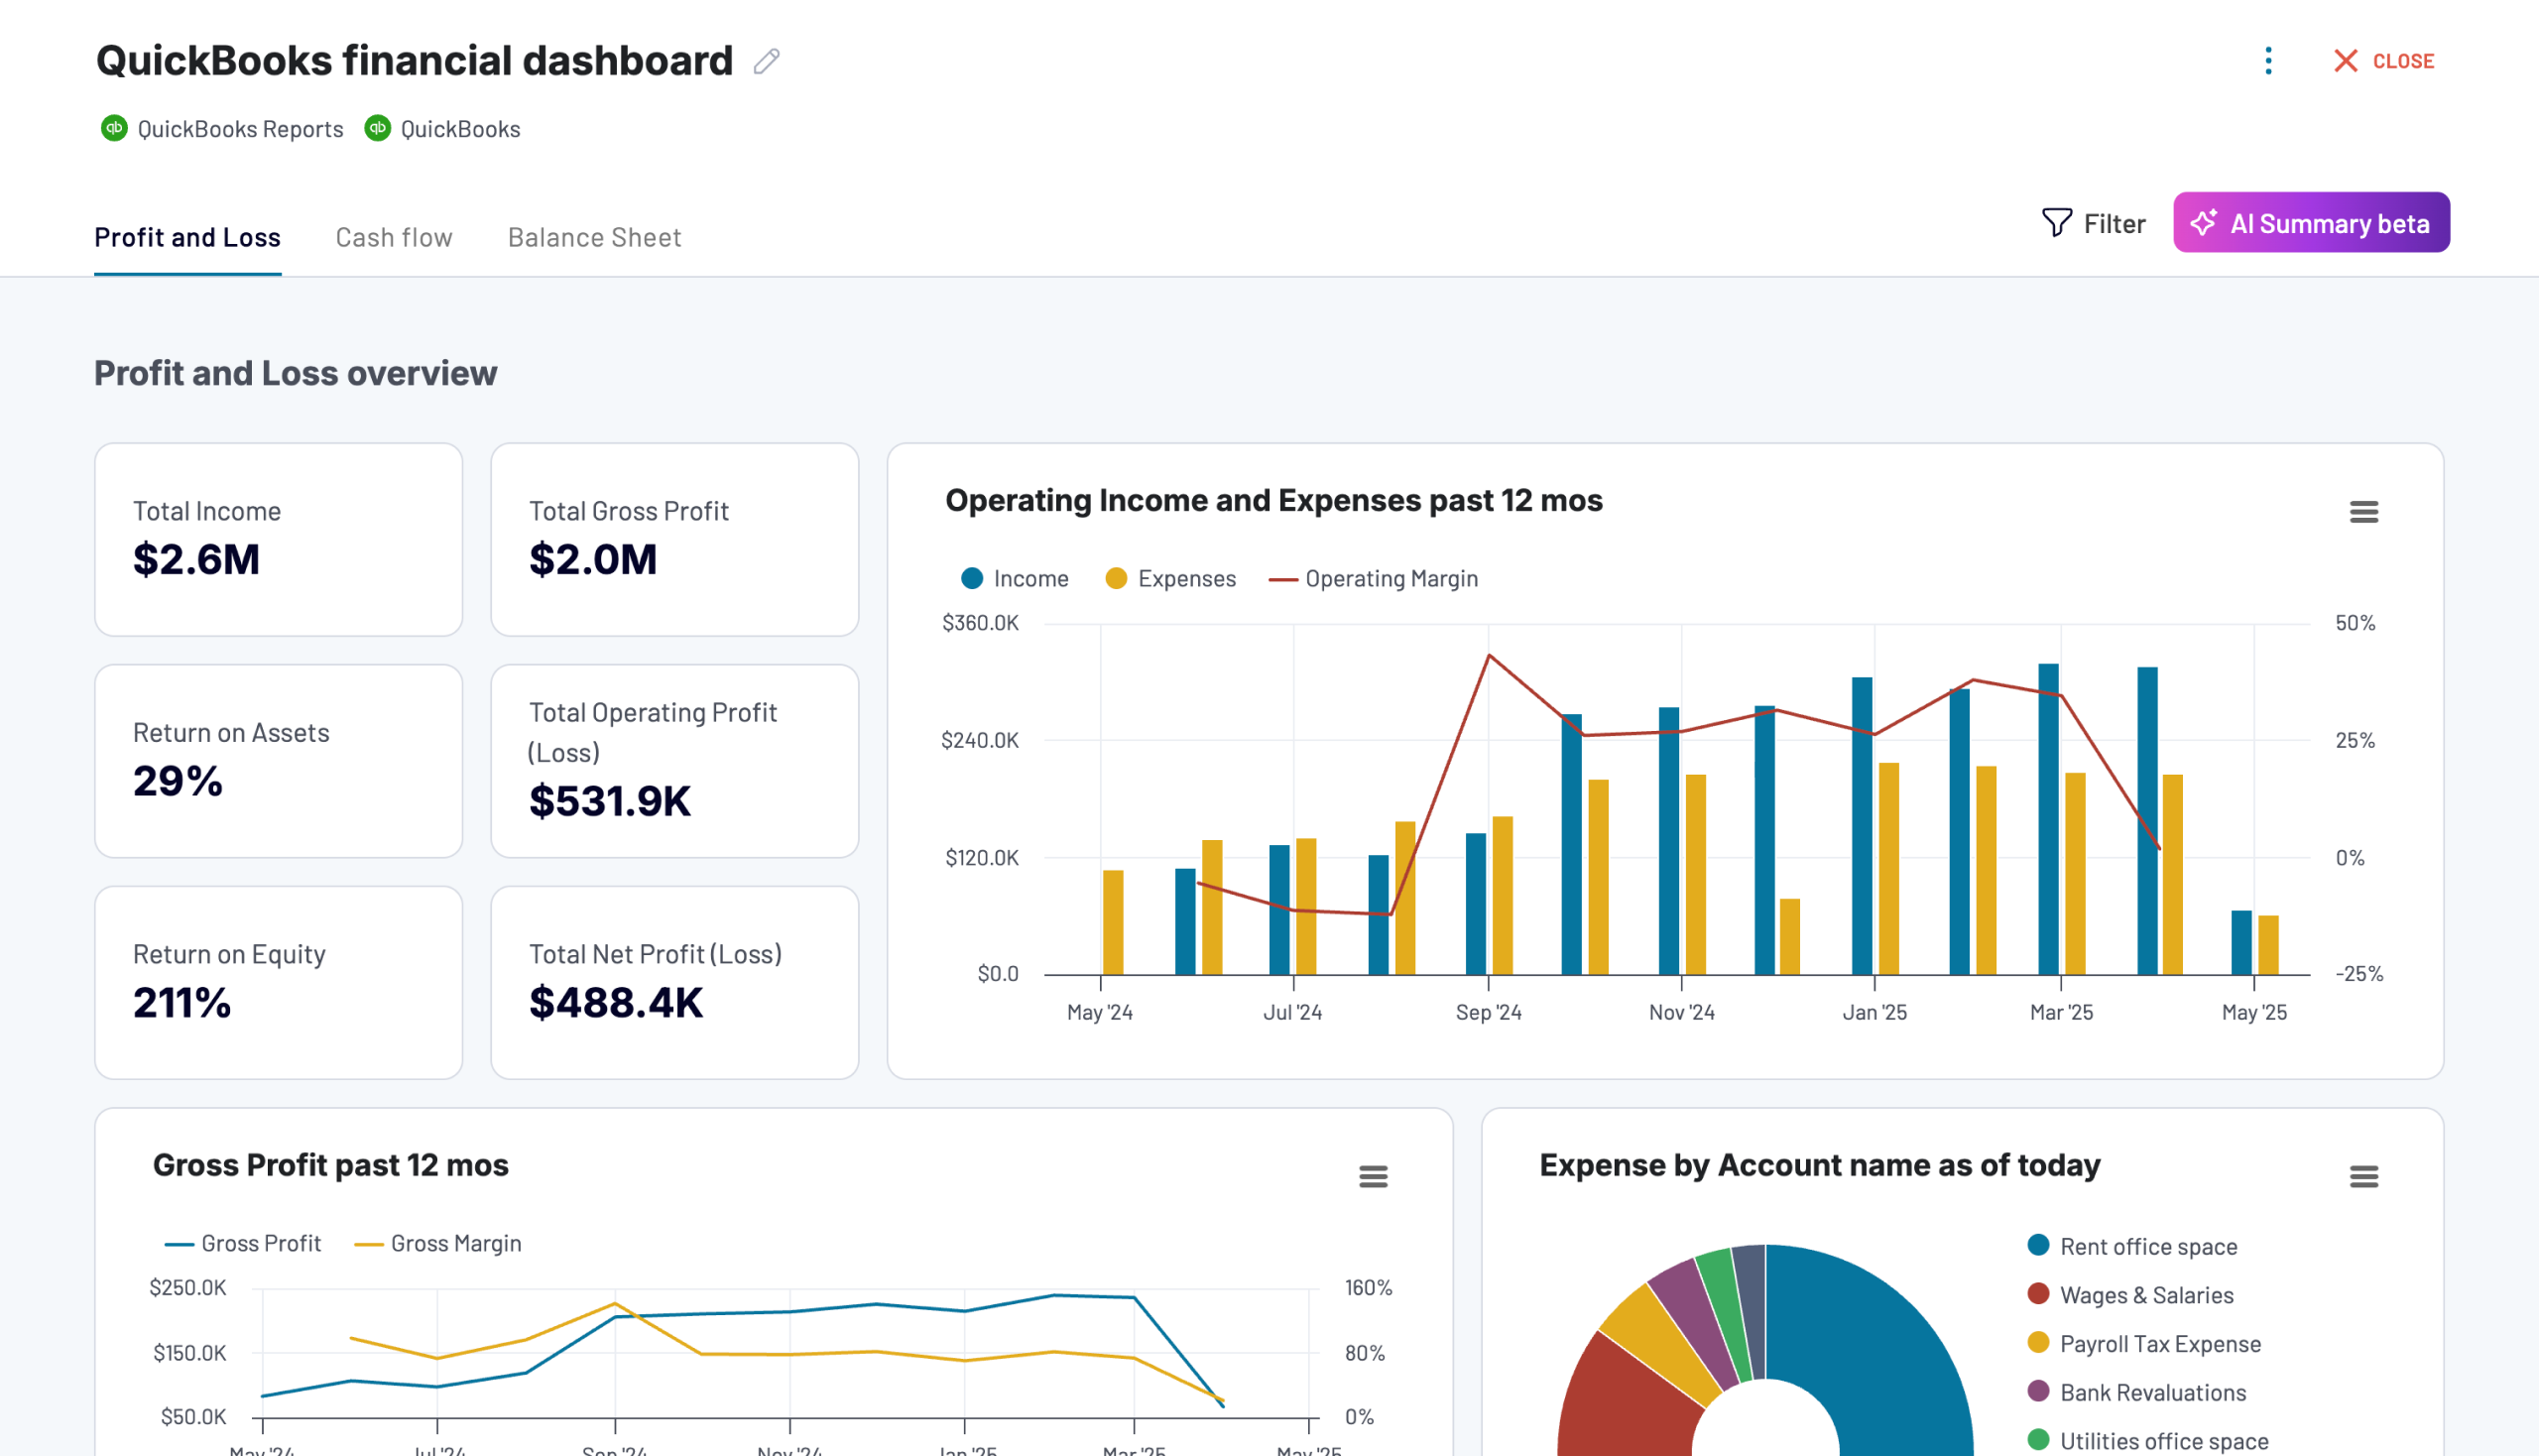
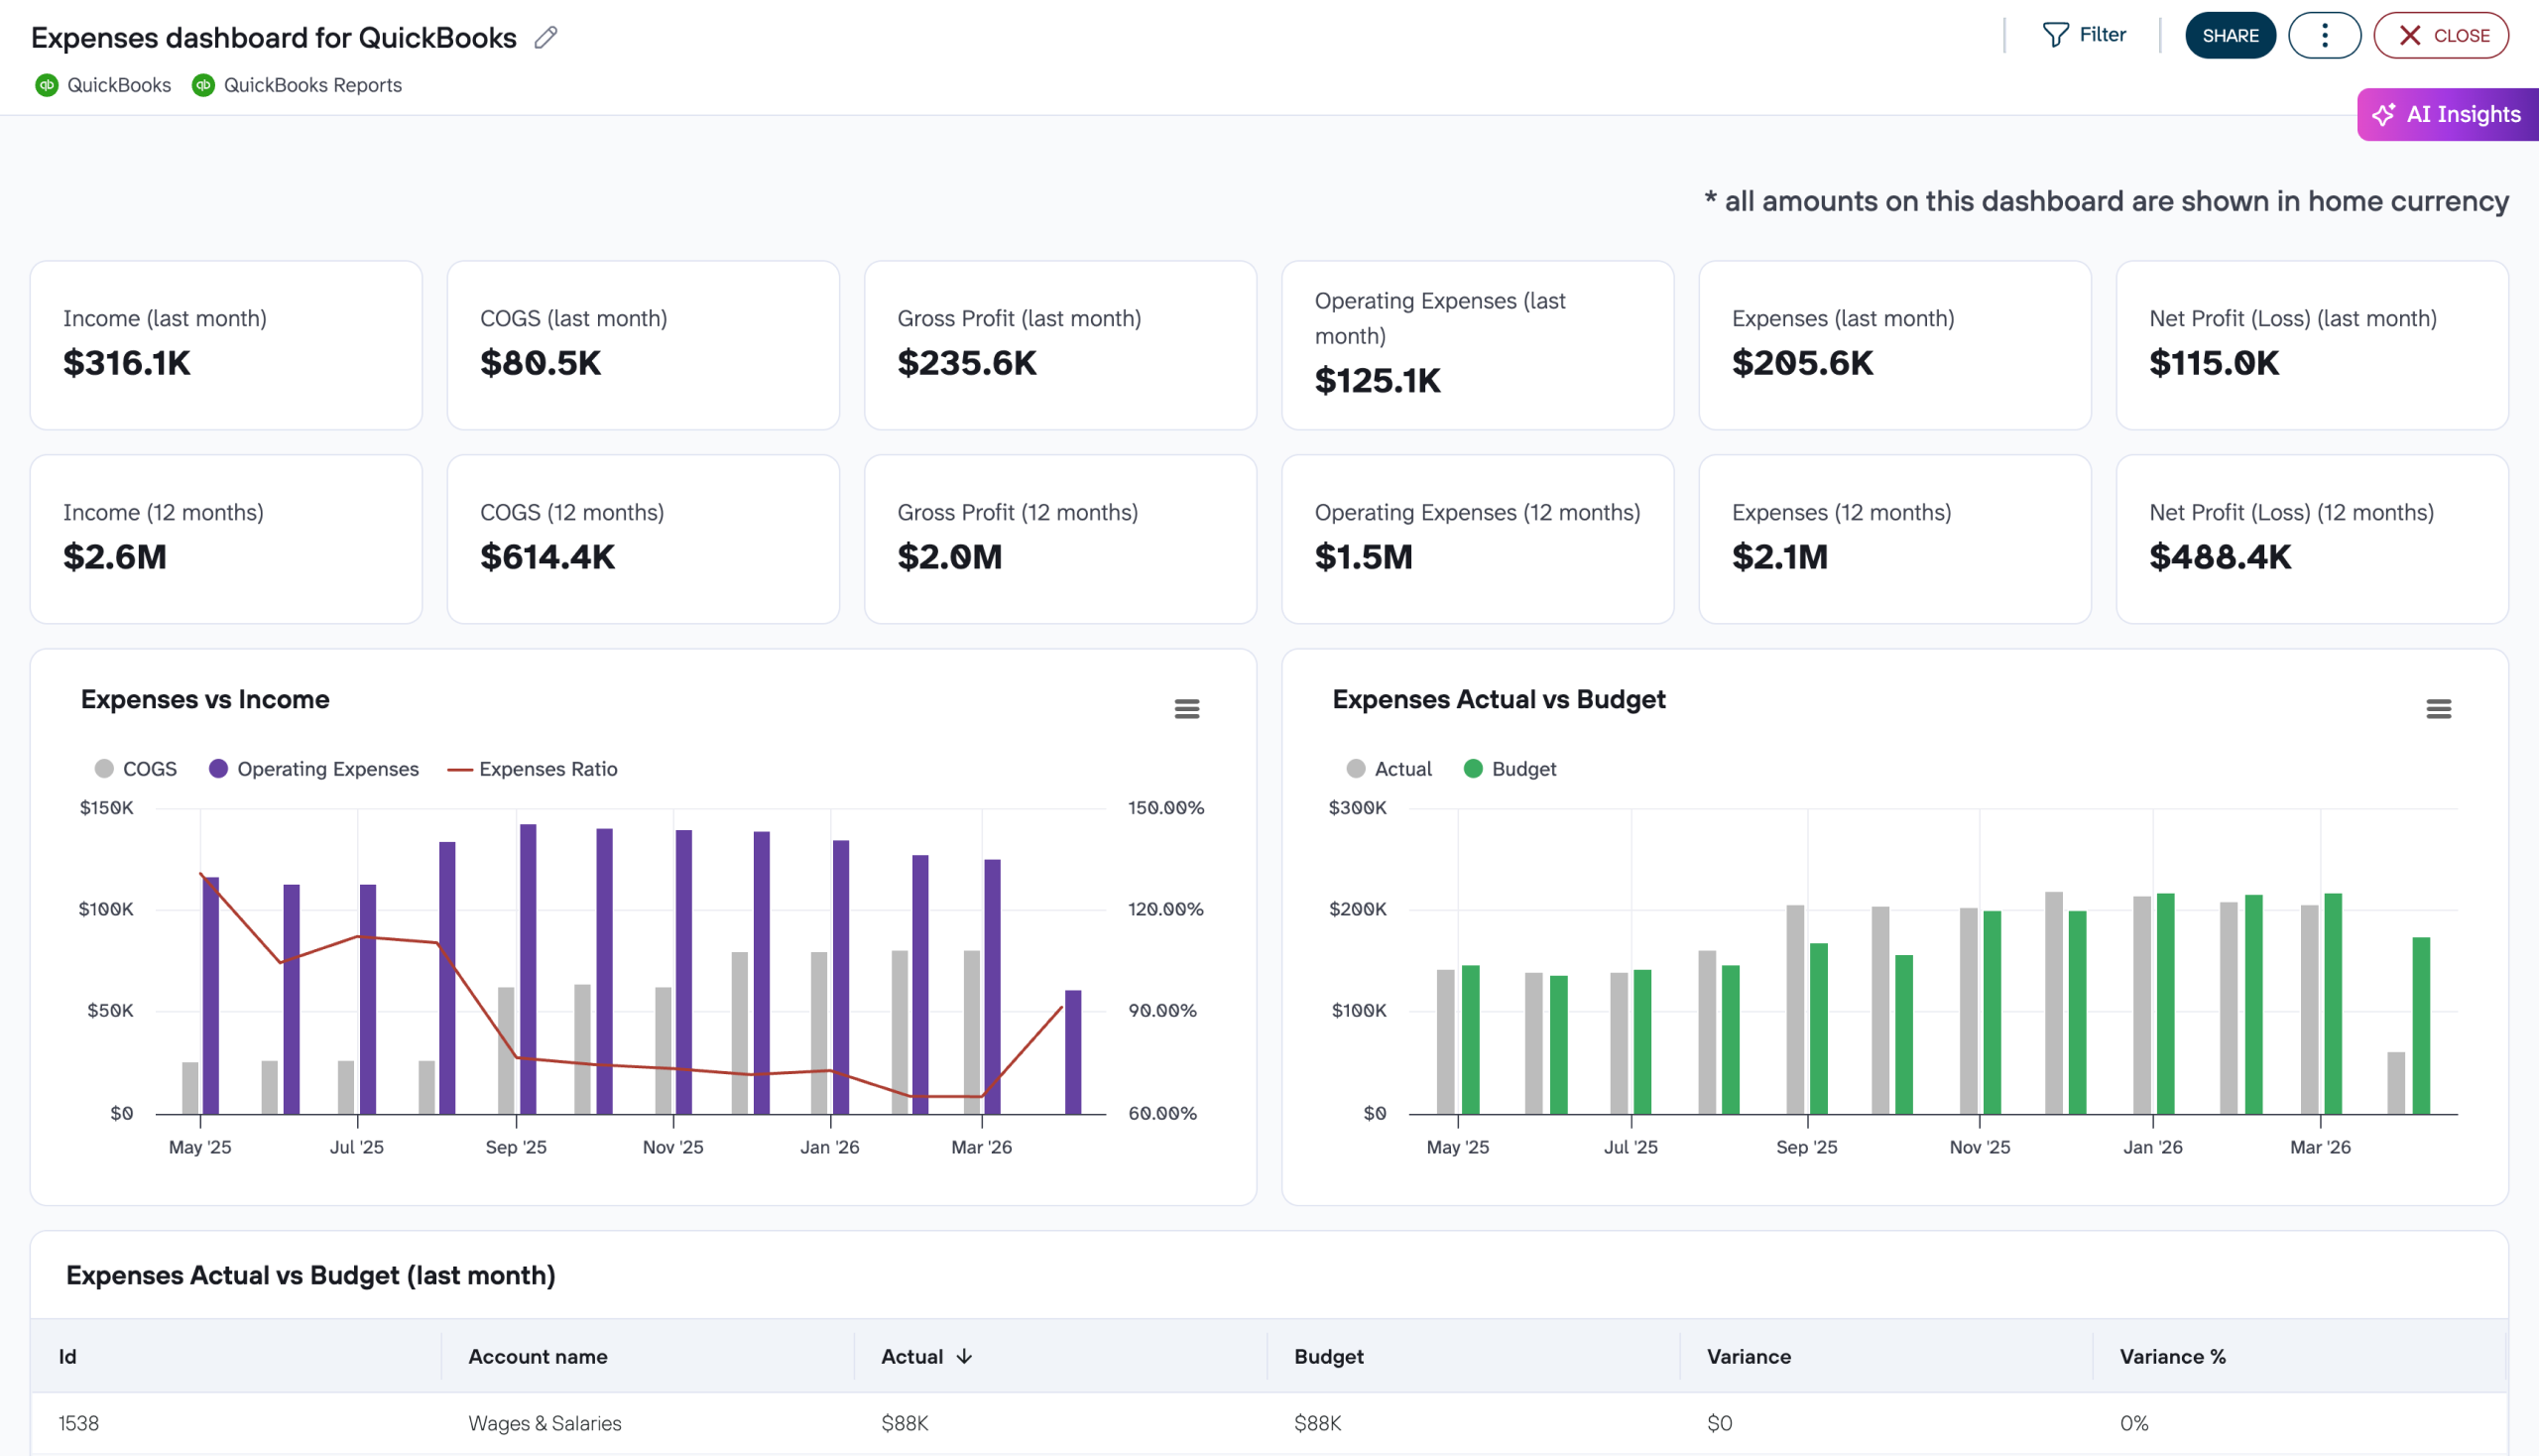
Evaluate your business’s financial performance by reviewing grouped and account-level income and expense details, with instant access to profitability summaries
Review and structure your current year’s financial data to understand account-level performance and overall profitability
Break down your financial position into assets, liabilities, and equity with detailed account-level insights for more accurate financial monitoring
Analyze all bank transactions over the past year by account, status, and reconciliation to gain a clear view of your financial operations and accuracy
Track invoice activity to monitor billing, due dates, and outstanding amounts. Manage accounts receivable and improve cash flow visibility
Examine your financial account setup, including types, groupings, and currencies, to ensure accurate classification and reporting in your accounting system
Monitor credit notes issued in Xero by type, status, and amount to track outstanding credits and assess their impact on cash flow and revenue
about your case. It doesn't cost you a penny.
Connect your favorite apps and get data in minutes


Recognized by industry leaders and community


