Connect Xero to Power BI
Connect Xero to Power BI with Coupler.io to import accounting data automatically. Retrieve data in a few simple steps, organize it to your liking, and transform it in multiple ways. Benefit from easy-to-use reports that give a clear view of your finances.


Connect Xero to Power BI with Coupler.io to simplify reporting

Get and prepare data effortlessly
Export Xero to Power BI without being a coding specialist. Using Coupler.io, you can query your data with ease, adjust the schedule for automated refreshes, and unite records retrieved from different applications within a single interface.

Automate reporting tasks
Quickly automate data reporting from Xero to Power BI. By doing so, you won't spend time on manual tasks such as copying and pasting. On top of that, you'll have a chance to get your data visualized as dashboards using our free templates.

Stand out as a data-driven expert
Earn the trust of clients and stakeholders by delivering insight-packed reports. Count on Coupler.io's automated integration to handle data import and reporting. This way, you'll have the freedom to focus your attention on forward-looking activities.
Export data from Xero to alternative destinations


Quick start with Finance dashboard templates


No such template is available yet.
No worries. Our team will create a template that fits your needs, just tell us more
about your case. It doesn't cost you a penny 😉
Request a custom report
about your case. It doesn't cost you a penny 😉
Export Xero to Power BI automatically with just a few clicks.
Connect similar Finance & Accounting apps and get data in minutes


What to export from Xero to Power BI

Accounts
This data entity provides an overview of financial accounts within the system. It includes essential information such as account status, type, tax type, and class, along with bank account number and type. Export these details for financial tracking and categorization, analysis of account activities and status, and financial planning.
Bank transactions
Connect Xero to Power BI to extract bank transactions data, which refers to the status, type and currency of transactions, along with transaction IDs and bank account IDs. Additionally, it includes contact details associated with each transaction. This info is vital for tracking and reconciling transactions conducted through bank accounts.
Contacts
Contact data is helpful in communication with individuals or entities involved in transactions. It comprises details such as contact ID, status, name, address, phone number, default currency, and bank account details. Use it to maintain up-to-date contact information, efficient communication, and relationship management.
Credit notes
Thanks to credit notes from Xero, you can explore IDs and numbers, currency rates, remaining credit, contact details, and relevant dates. This data entity is useful for managing credit transactions, such as issuing, tracking, and reconciling credit notes. It allows for the analysis of credit activities and monitoring of outstanding credits.
Invoices
Invoices provide insights into billing and payment activities, including payment count, ID, date, amount, and details on the amount paid, due, and credited. It can help you monitor cash flow, manage accounts receivable as well as analyze billing patterns, payment behaviors, and financial performance, which can inform strategic decisions.
Items
Another reason to export Xero to Power BI is item data focused on inventory management and sales performance. It offers details like item IDs, purchase descriptions, unit prices, tax types, etc. By analyzing them, you can optimize inventory levels, enhance sales performance, and identify trends in product demand.
Payments
Here, you get data such as payment IDs, dates, bank amounts, currency rates, payment types, and statuses, as well as account IDs. Import this information from Xero to Power BI to analyze payment activities, ensure timely processing of payments, and maintain accurate financial records for effective cash flow management.
Purchase orders
This is about purchase order IDs and numbers, dates, delivery addresses and instructions, currency details, and contacts. Benefit from this data if you're looking to improve procurement and inventory management processes. Track procurement activities, monitor supplier performance, and manage inventory levels.
How do you connect Xero to Power BI?
Step 1. Connect your Xero account and choose a data entity to export
30 seconds
Step 2. Organize and transform data before loading it to Power BI
30 seconds
Step 3. Connect the Power BI account and copy the integration URL to the desktop app
30 seconds
Step 4. Schedule auto-refreshes to export Xero to Power BI at desired intervals
10 seconds
Pricing plans
- Monthly
- Annual (save 25%)
Your data is secured by industry standards
 SOC 2 Type II
Certified
 Google Cloud
Certified
 GDPR
GDPRCompliant
 HIPAA
HIPAACompliant
Don’t just take our word for it





Dramatically improved our reporting speed by about 60%. The interface is user-friendly, even for team members with no technical background.
Helped solve data processing issues, and customer service is 10/10. It is extremely easy to use, and allows us to extract data from multiple sources.
How to connect Xero to Power BI (detailed guide)
Follow three simple steps to connect Xero to Power BI:
Step 1: Collect data
First, connect your Xero account. Next, choose which data you'd like to export.
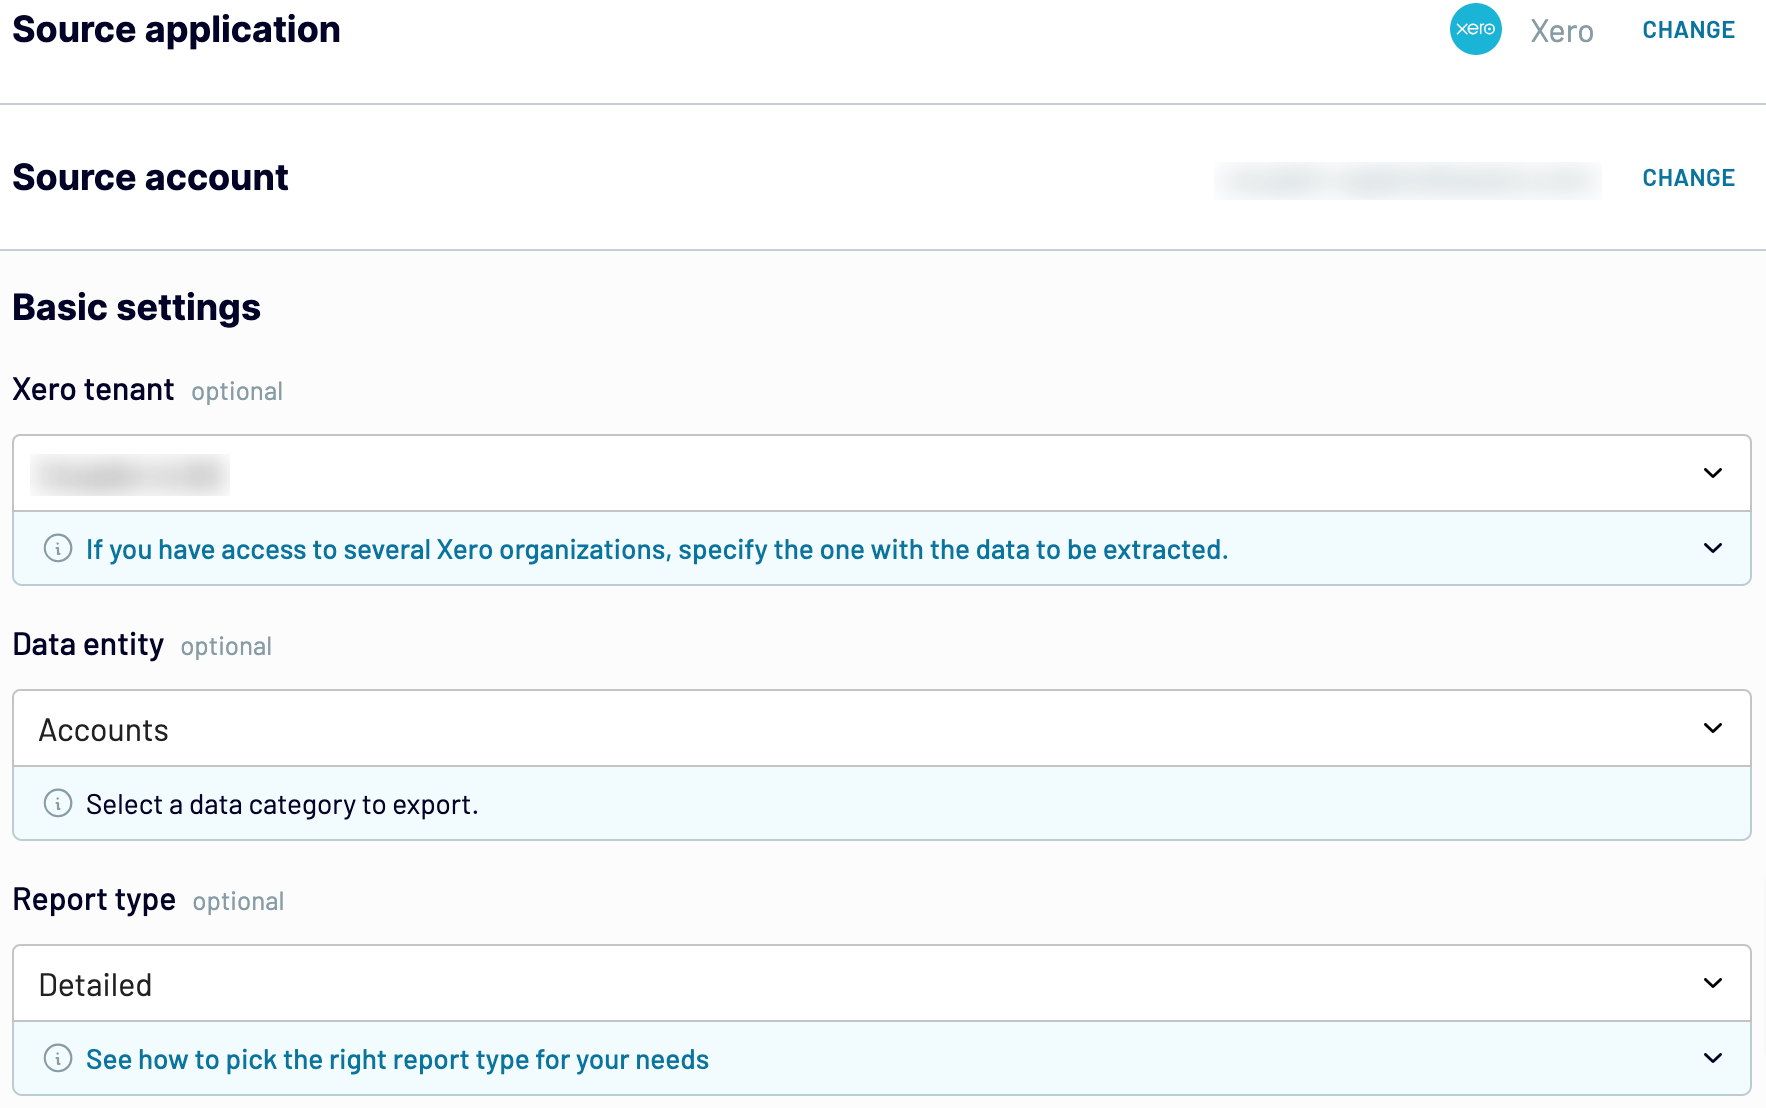
When you're finished with the source settings, proceed to the next step.
Step 2: Organize and transform
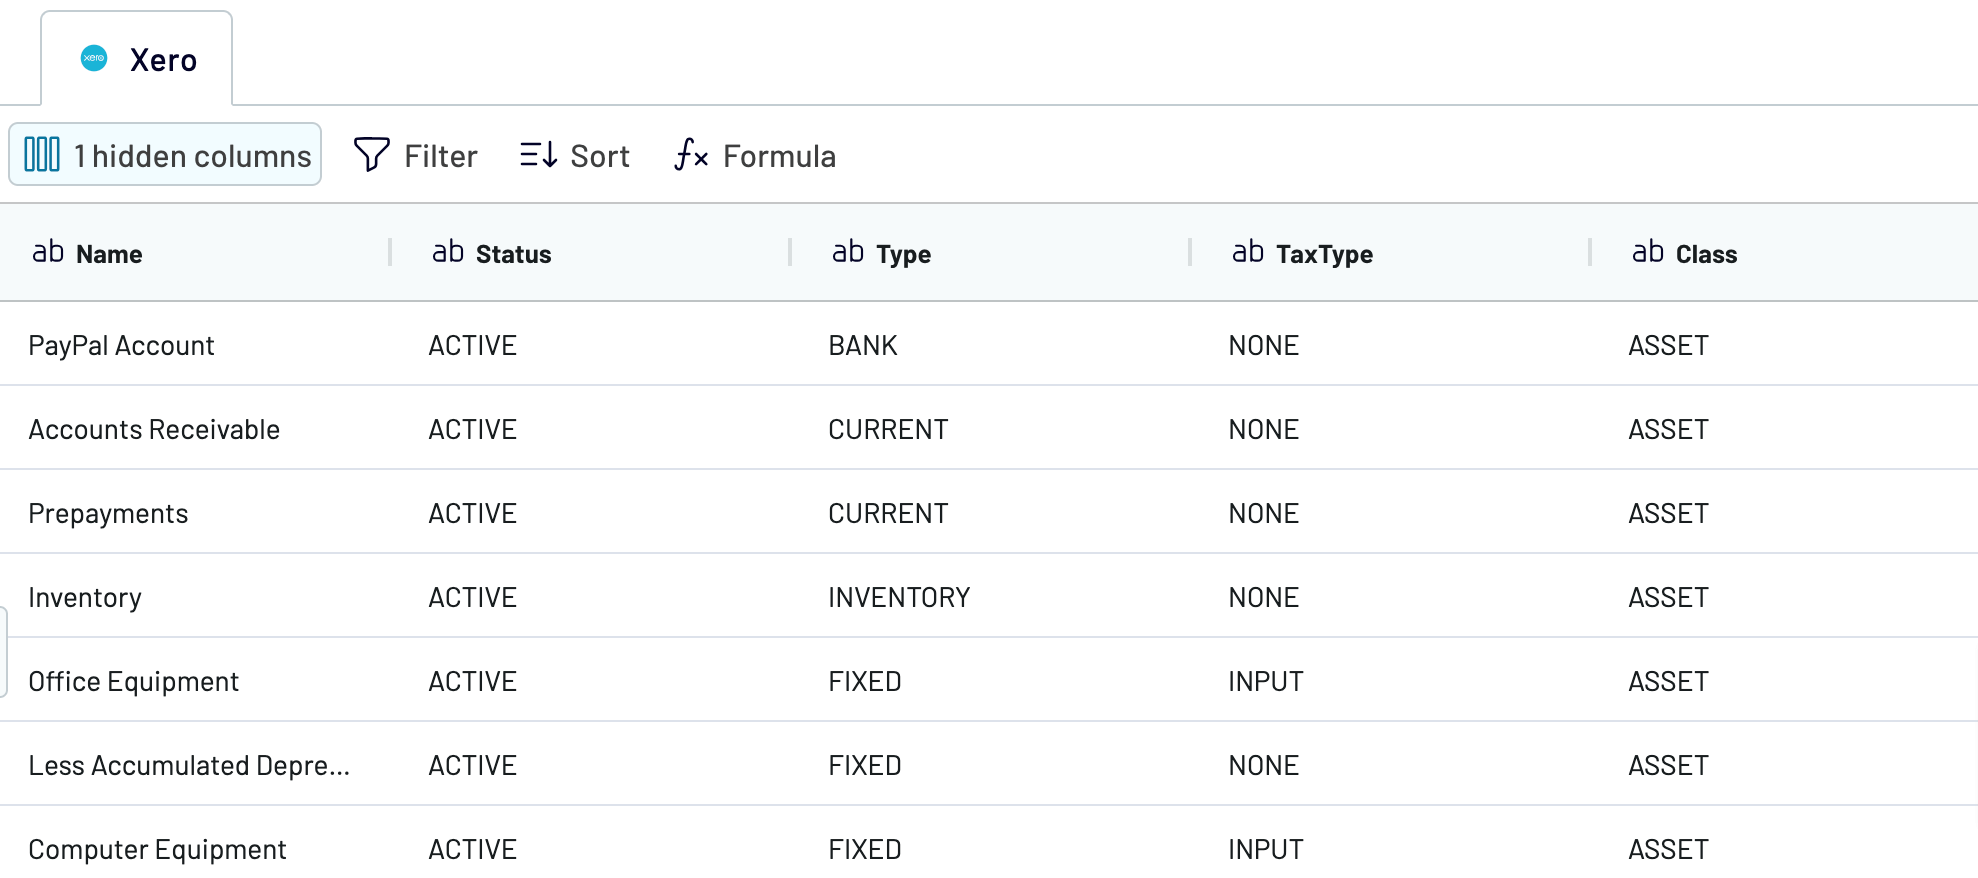
Before you import Xero to Power BI, have a look at your data to check it for accuracy. If necessary, make any of the following adjustments:
By transforming your data as mentioned above, you make sure you get an analysis-ready report after importing.
When you're ready, move to the destination settings.
Step 3: Load and automate
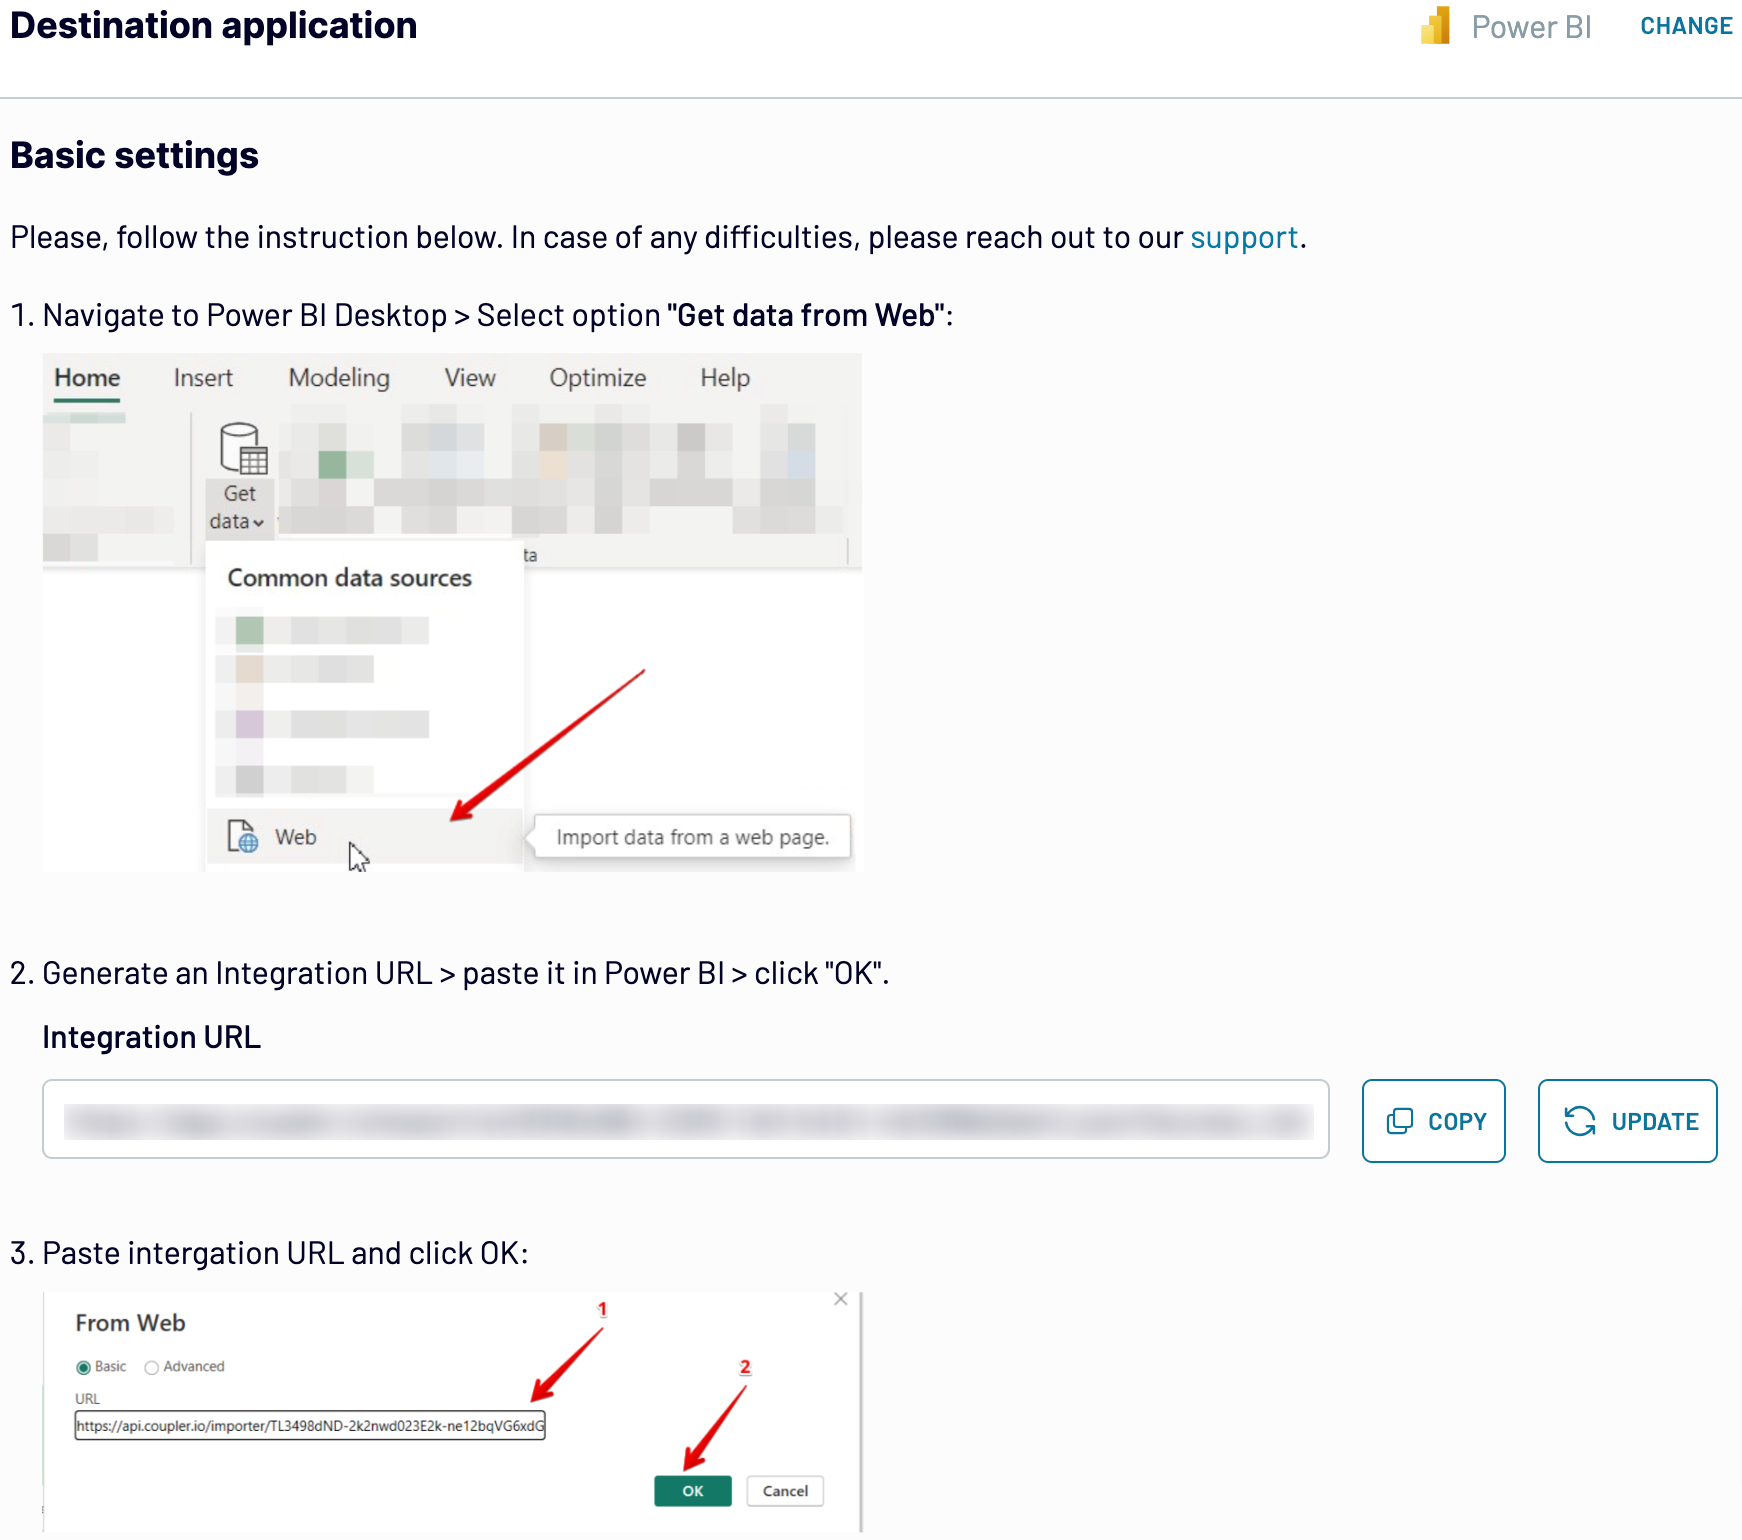
To finally load your data from Xero to Power BI, follow the in-app instructions to generate the integration URL and paste it into the Power BI desktop application.
After that, turn on automatic data refresh and select the preferred frequency. The last thing to do is save and run the importer.
Step 1: Collect data
First, connect your Xero account. Next, choose which data you'd like to export.
When you're finished with the source settings, proceed to the next step.
Step 2: Organize and transform
Before you import Xero to Power BI, have a look at your data to check it for accuracy. If necessary, make any of the following adjustments:
- Edit, rearrange, hide, or add columns.
- Apply various filters and sort your data.
- Create new columns with custom formulas.
- Combine data from multiple accounts or apps.
By transforming your data as mentioned above, you make sure you get an analysis-ready report after importing.
When you're ready, move to the destination settings.
Step 3: Load and automate
To finally load your data from Xero to Power BI, follow the in-app instructions to generate the integration URL and paste it into the Power BI desktop application.
After that, turn on automatic data refresh and select the preferred frequency. The last thing to do is save and run the importer.
Export Xero to Power BI and automate it on schedule
Activate the automated data refresh functionality to make your report self-updating. Choose between the following intervals: monthly, daily, hourly, or every 30 or 15 minutes. If you'd like to adjust this feature even more, specify the days of the week, the time slot, and the time zone.
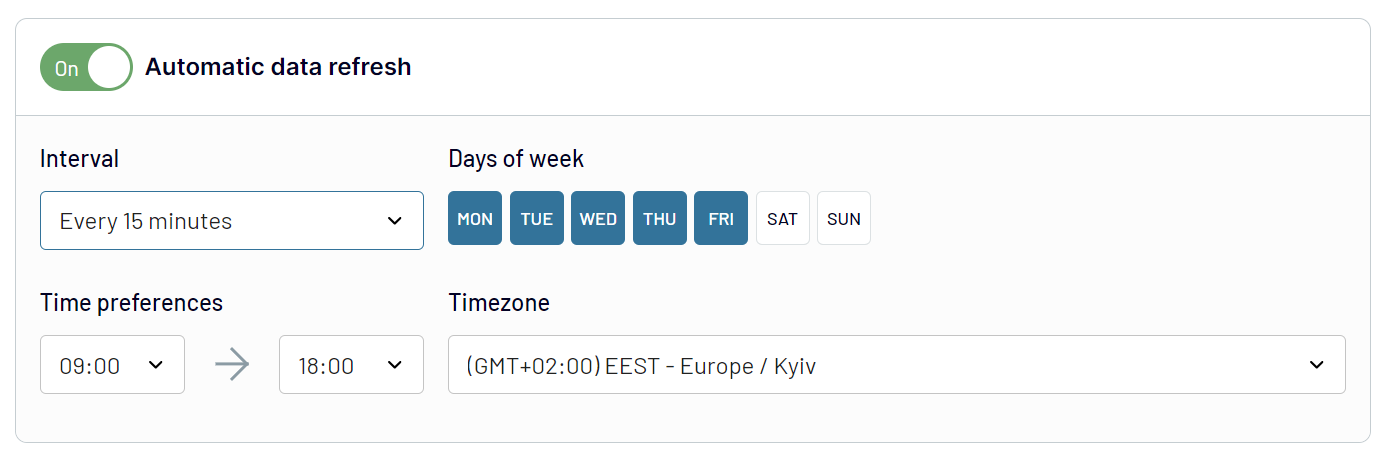
By putting data imports on schedule, you'll rest assured that data in the destination is regularly aligned with the latest changes to the source.
By putting data imports on schedule, you'll rest assured that data in the destination is regularly aligned with the latest changes to the source.
What key metrics can you export from Xero to Power BI?
Profit or loss
Description: Profit or loss indicates the financial performance of a company. The former occurs when total revenue exceeds total expenses, whereas the latter does when expenses surpass revenue.
How to calculate: Calculate profit by subtracting total expenses from total revenue.
Income
Description: Income represents the earnings a company generates from its core business activities, such as selling products or providing services.
How to calculate: Calculate income by summing up all transactions coded to revenue account types.
Expenses
Description: Expenses are the costs (such as salaries, rent, and utilities) incurred by a business in the process of earning revenue.
How to calculate: Calculate expenses by totaling all transactions coded to expense-related account codes.
Cost of goods sold (COGS)
Description: COGS refers to the direct costs (such as raw materials and direct labor) attributable to the production of the goods sold by a company.
How to calculate: Determine COGS by summing up all transactions coded to direct cost account types.
Net profit margin
Description: Net profit margin measures the percentage of revenue that remains as profit after all expenses, including taxes, have been deducted.
How to calculate: Calculate net profit by deducting total expenses from total revenue, then find the percentage of net profit in relation to sales revenue.
Gross profit margin
Description: Gross profit margin shows the percentage of revenue that exceeds the cost of goods sold.
How to calculate: Calculate gross profit by subtracting COGS from sales revenue, then express the gross profit as a percentage of sales revenue.
Average time to get paid
Description: This metric indicates the average duration it takes for a company to receive payment from its customers.
How to calculate: Determine the average accounts receivable by averaging the opening and closing accounts receivable, then divide the result by sales and multiply by the number of days in the period.
Average time to pay suppliers
Description: It measures the average time a company takes to pay its suppliers for purchases.
How to calculate: Find the average accounts payable by averaging the opening and closing accounts payable, then divide the result by the total direct cost and expense account types and multiply by the number of days in the period.
Description: Profit or loss indicates the financial performance of a company. The former occurs when total revenue exceeds total expenses, whereas the latter does when expenses surpass revenue.
How to calculate: Calculate profit by subtracting total expenses from total revenue.
Income
Description: Income represents the earnings a company generates from its core business activities, such as selling products or providing services.
How to calculate: Calculate income by summing up all transactions coded to revenue account types.
Expenses
Description: Expenses are the costs (such as salaries, rent, and utilities) incurred by a business in the process of earning revenue.
How to calculate: Calculate expenses by totaling all transactions coded to expense-related account codes.
Cost of goods sold (COGS)
Description: COGS refers to the direct costs (such as raw materials and direct labor) attributable to the production of the goods sold by a company.
How to calculate: Determine COGS by summing up all transactions coded to direct cost account types.
Net profit margin
Description: Net profit margin measures the percentage of revenue that remains as profit after all expenses, including taxes, have been deducted.
How to calculate: Calculate net profit by deducting total expenses from total revenue, then find the percentage of net profit in relation to sales revenue.
Gross profit margin
Description: Gross profit margin shows the percentage of revenue that exceeds the cost of goods sold.
How to calculate: Calculate gross profit by subtracting COGS from sales revenue, then express the gross profit as a percentage of sales revenue.
Average time to get paid
Description: This metric indicates the average duration it takes for a company to receive payment from its customers.
How to calculate: Determine the average accounts receivable by averaging the opening and closing accounts receivable, then divide the result by sales and multiply by the number of days in the period.
Average time to pay suppliers
Description: It measures the average time a company takes to pay its suppliers for purchases.
How to calculate: Find the average accounts payable by averaging the opening and closing accounts payable, then divide the result by the total direct cost and expense account types and multiply by the number of days in the period.
Export Xero to Power BI or another destination
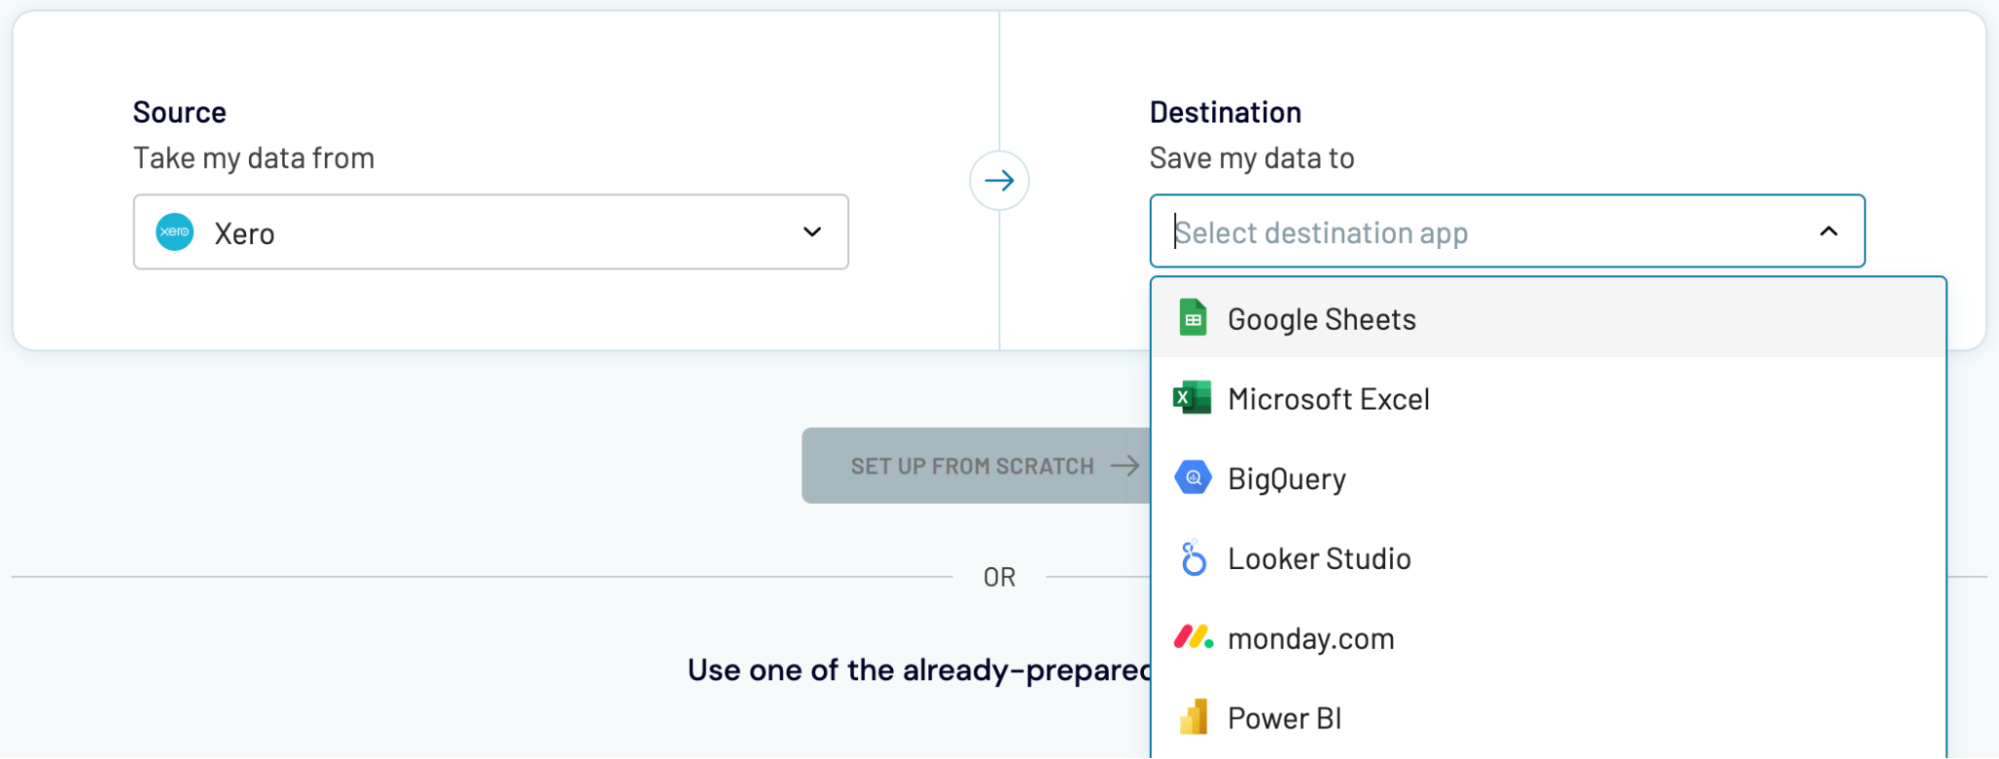
Not only can you connect Xero to Power BI, but Couper.io also enables you to replicate importers and load data into the following apps:
Data imports from Xero into alternative destinations closely resemble the process we've previously described for Power BI.
- Spreadsheet applications: Microsoft Excel and Google Sheets.
- Data warehouses: BigQuery, PostgreSQL, and Redshift.
- Other business intelligence (BI) tools: Data Studio, Tableau, and Qlik Sense.
Data imports from Xero into alternative destinations closely resemble the process we've previously described for Power BI.