Google Sheets dashboard templates for business reporting
Transform your spreadsheet experience with automated Google Sheets dashboard templates that integrate data from advertising platforms, CRM systems, accounting software, and analytics tools. Monitor advertising spend, track sales performance, analyze website traffic, and manage financial metrics through familiar spreadsheet interfaces enhanced with real-time data connections.
Google Sheets dashboard examples for every need


 +2
+2
 +2
+2


 +4
+4


 +3
+3

 +1
+1
 +3
+3


about your case. It doesn't cost you a penny 😉
Choose your white label Google Sheets reporting dashboards to kick off
What is a Google Sheets dashboard?
The familiar Google Sheets interface enables teams to analyze PPC performance, track sales pipelines, monitor financial health, and measure website performance. No need to switch between multiple applications - everything is by hand in one Google Sheets reporting dashboard. Advanced data connections through Coupler.io enable automatic refresh schedules, ensuring your reports reflect the latest business metrics. This approach combines the collaborative features and accessibility of Google Sheets with enterprise-level data integration capabilities.

What reports can you use in Google Sheets dashboards?
Creating effective Google Sheets dashboards requires selecting reports that align with your specific business objectives and operational needs. Based on the analysis of successful implementations across various industries, we recommend incorporating these four core report categories that provide comprehensive business visibility.
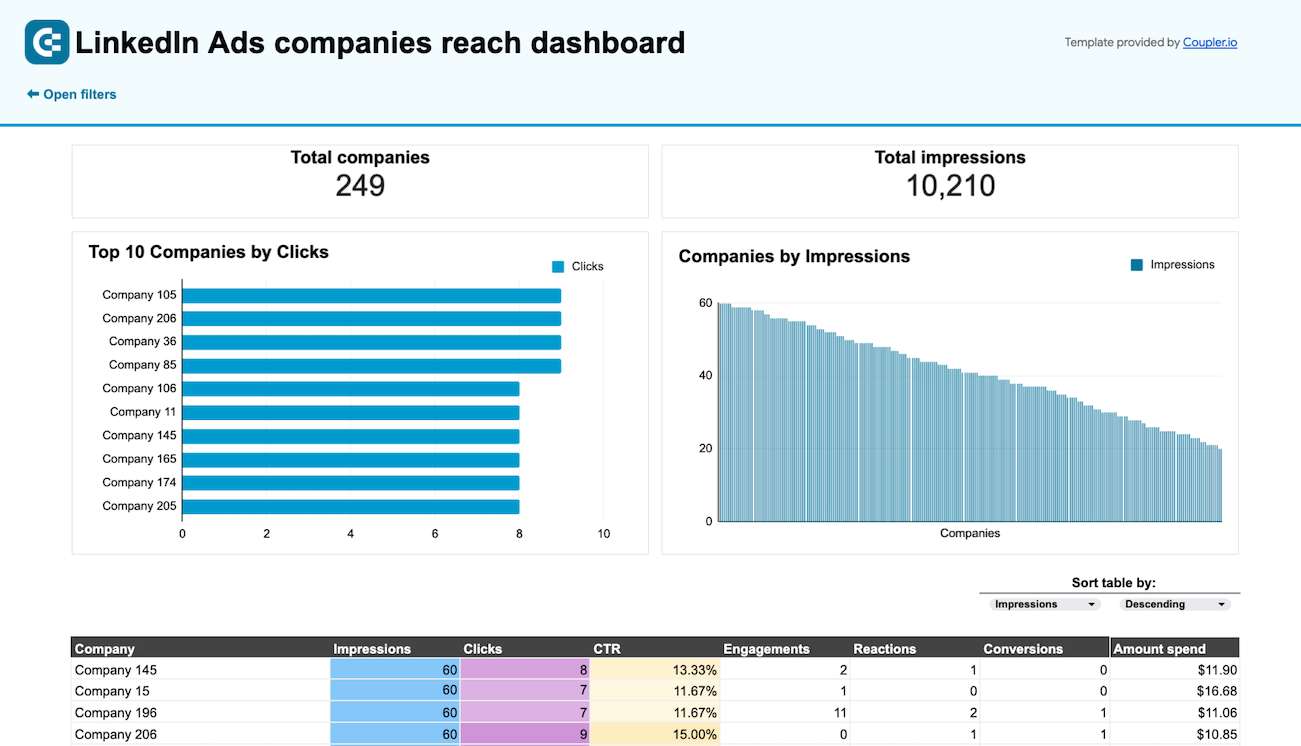
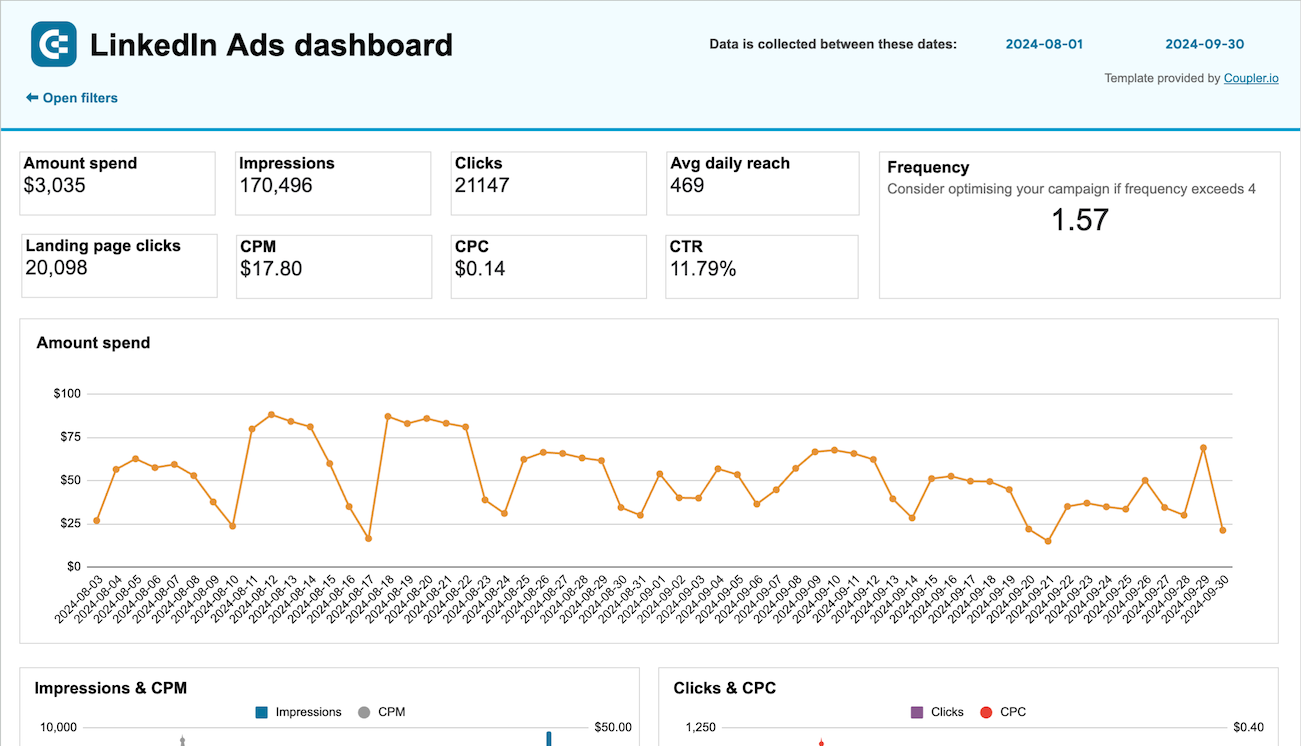
Advertising performance tracking forms the foundation of digital marketing success, requiring visibility into spend allocation, campaign effectiveness, and budget utilization across multiple platforms. These reports consolidate data from Google Ads, Facebook Ads, LinkedIn Ads, and other advertising channels to show impression trends, click performance, cost per acquisition metrics, and conversion tracking. Multi-channel creative performance analysis reveals which ad variations drive the best results, while budget forecasting reports help predict future spending needs and prevent budget overruns. Campaign-level breakdowns enable marketers to identify top-performing initiatives and reallocate resources for maximum return on investment.
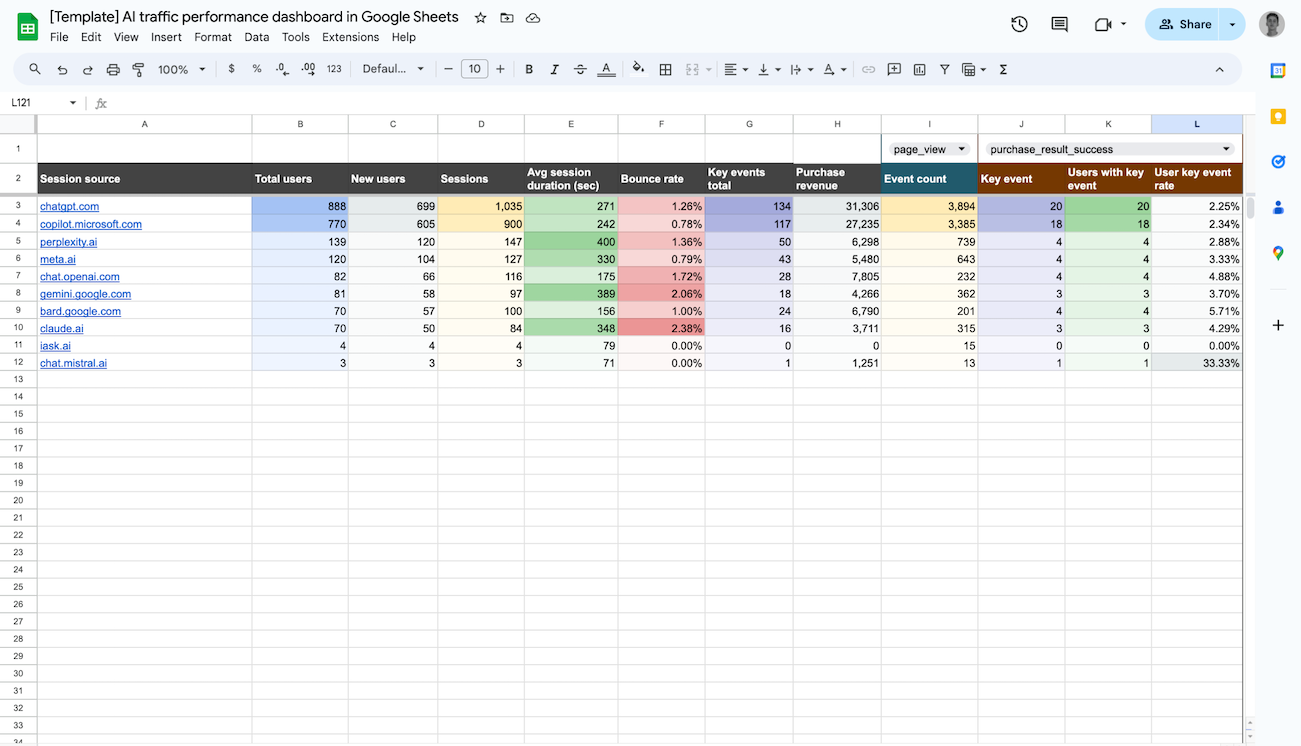
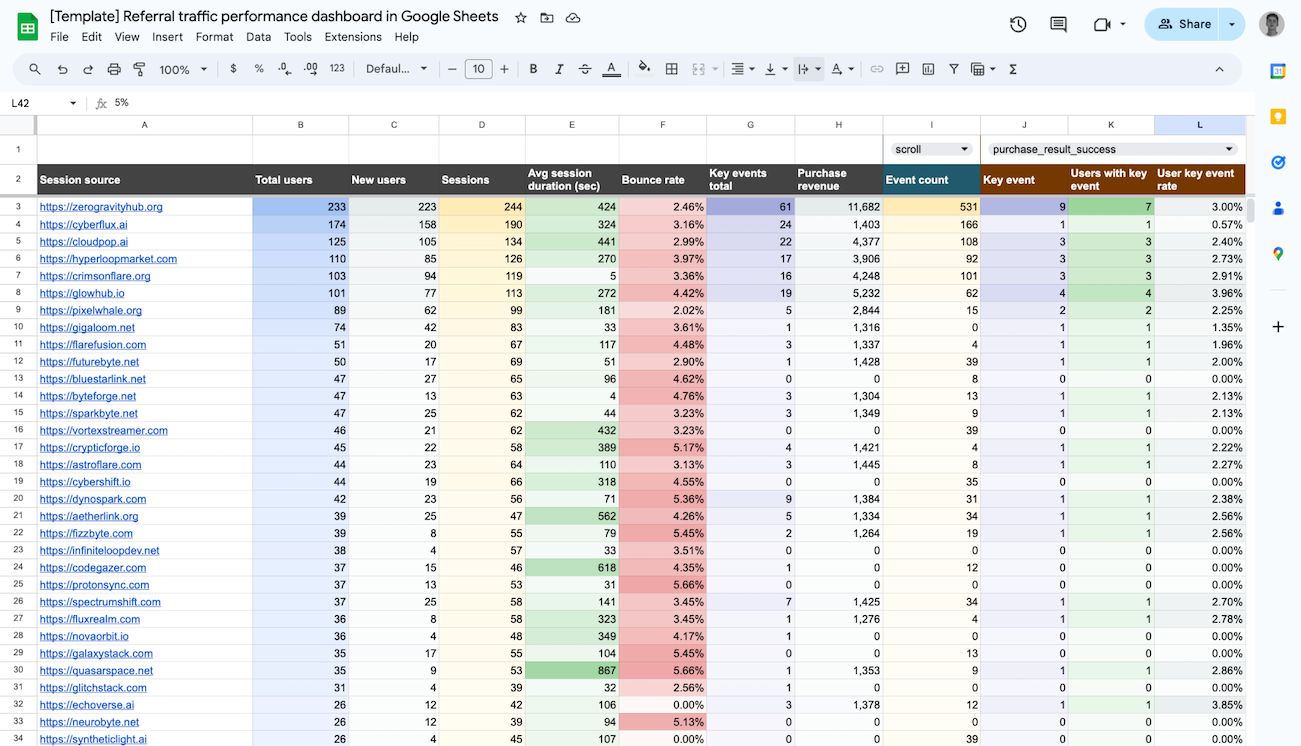
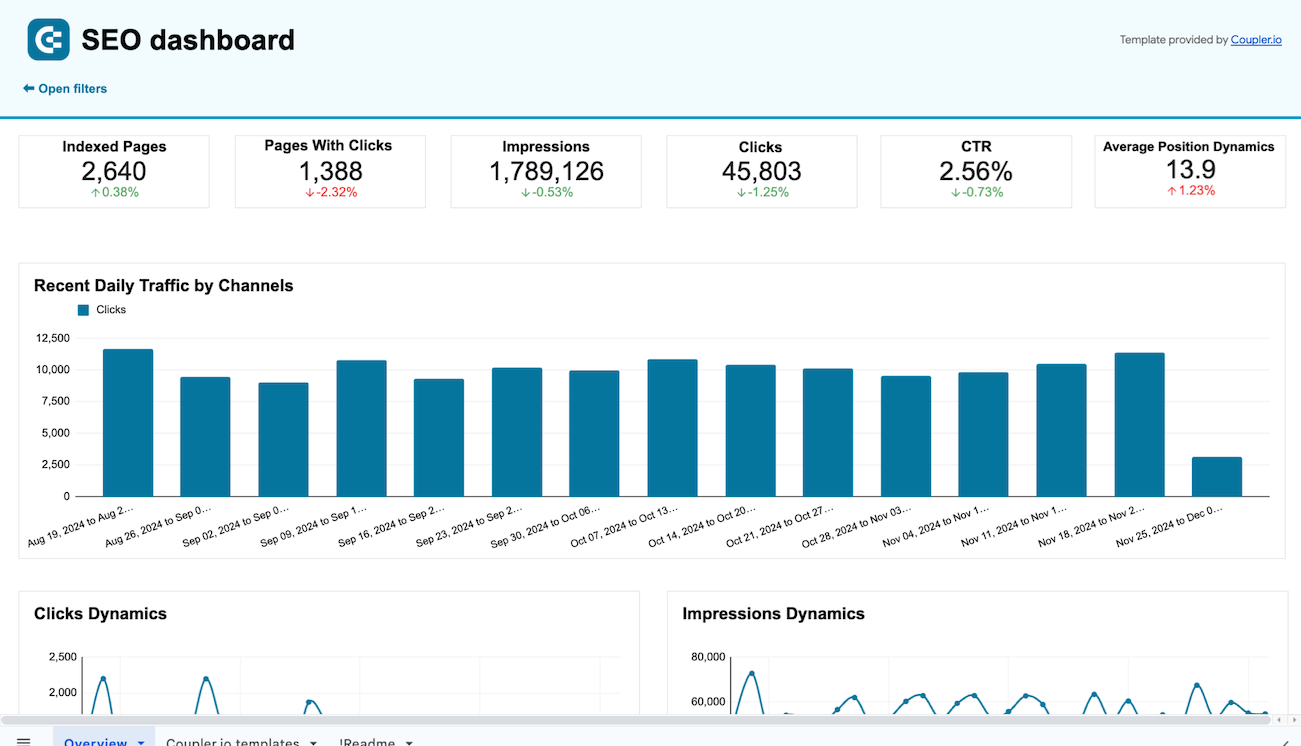
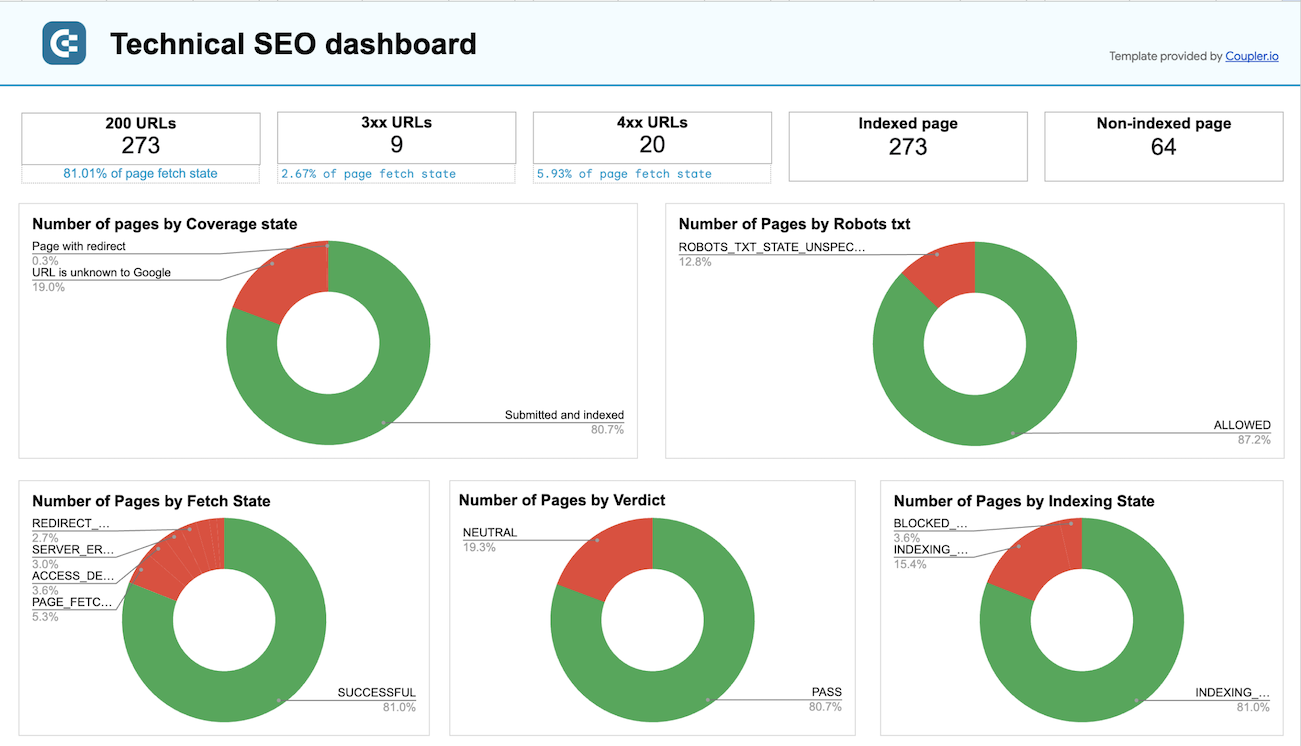
Website performance monitoring requires comprehensive tracking of organic search visibility, user behavior patterns, and traffic source attribution to optimize digital presence effectively. Our Google Sheets dashboard templates contain these reports, including technical SEO analysis showing page indexing status, crawl errors, and site health indicators that impact search rankings. Landing page performance tracking reveals which pages convert visitors most effectively, while referral traffic analysis identifies valuable external sources driving qualified visitors. AI traffic monitoring captures emerging search patterns from artificial intelligence tools, providing insights into how modern search behavior affects website visibility and user acquisition strategies.
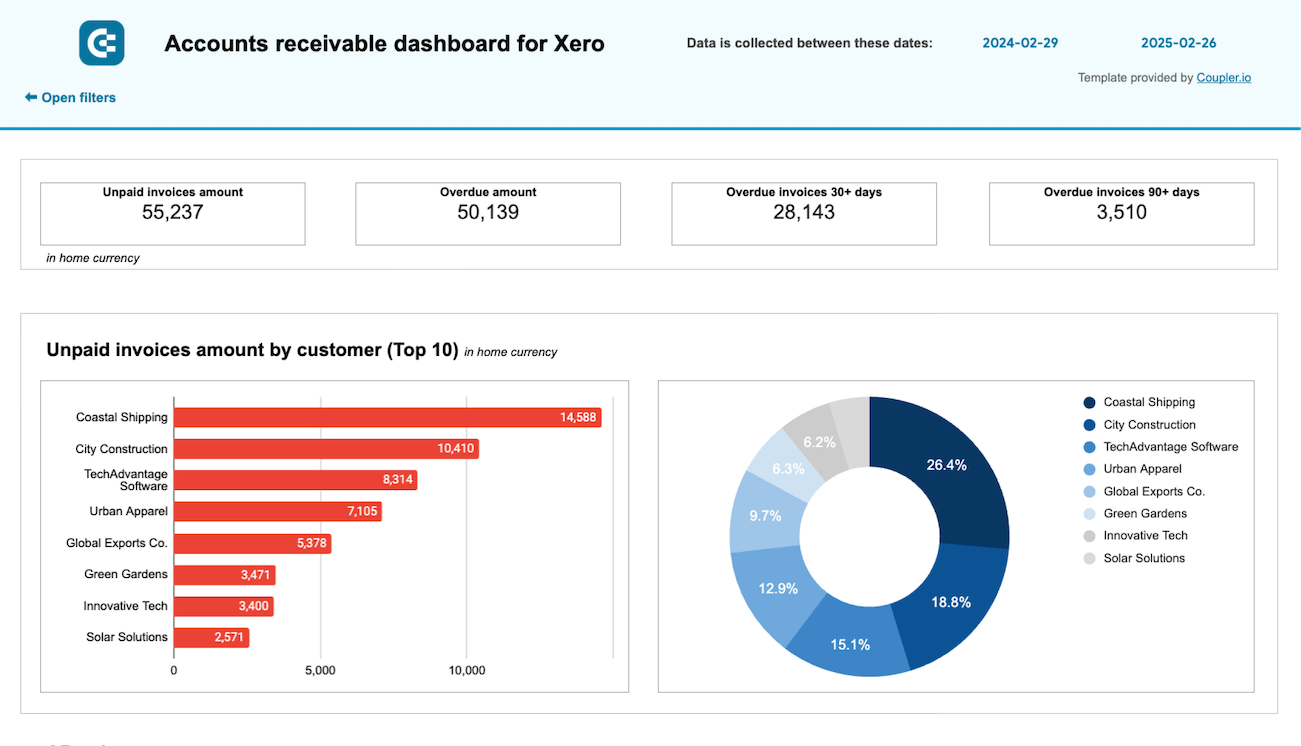
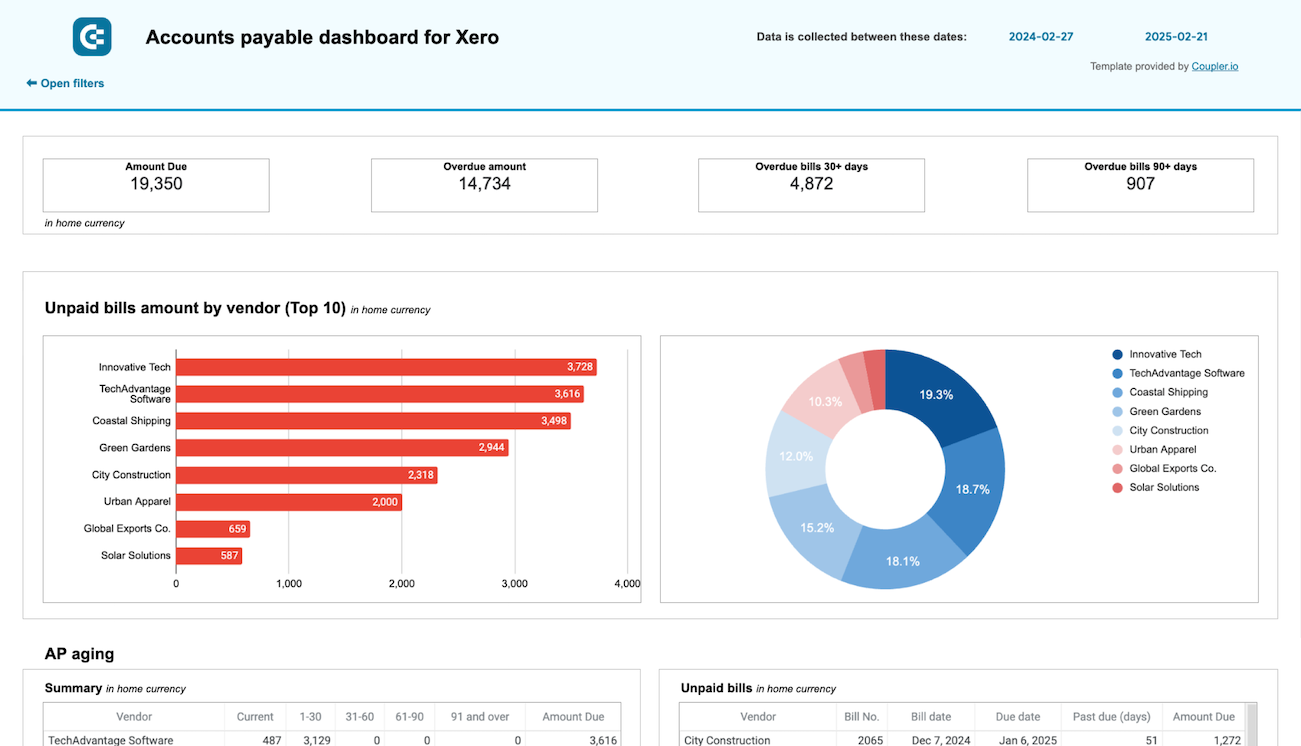
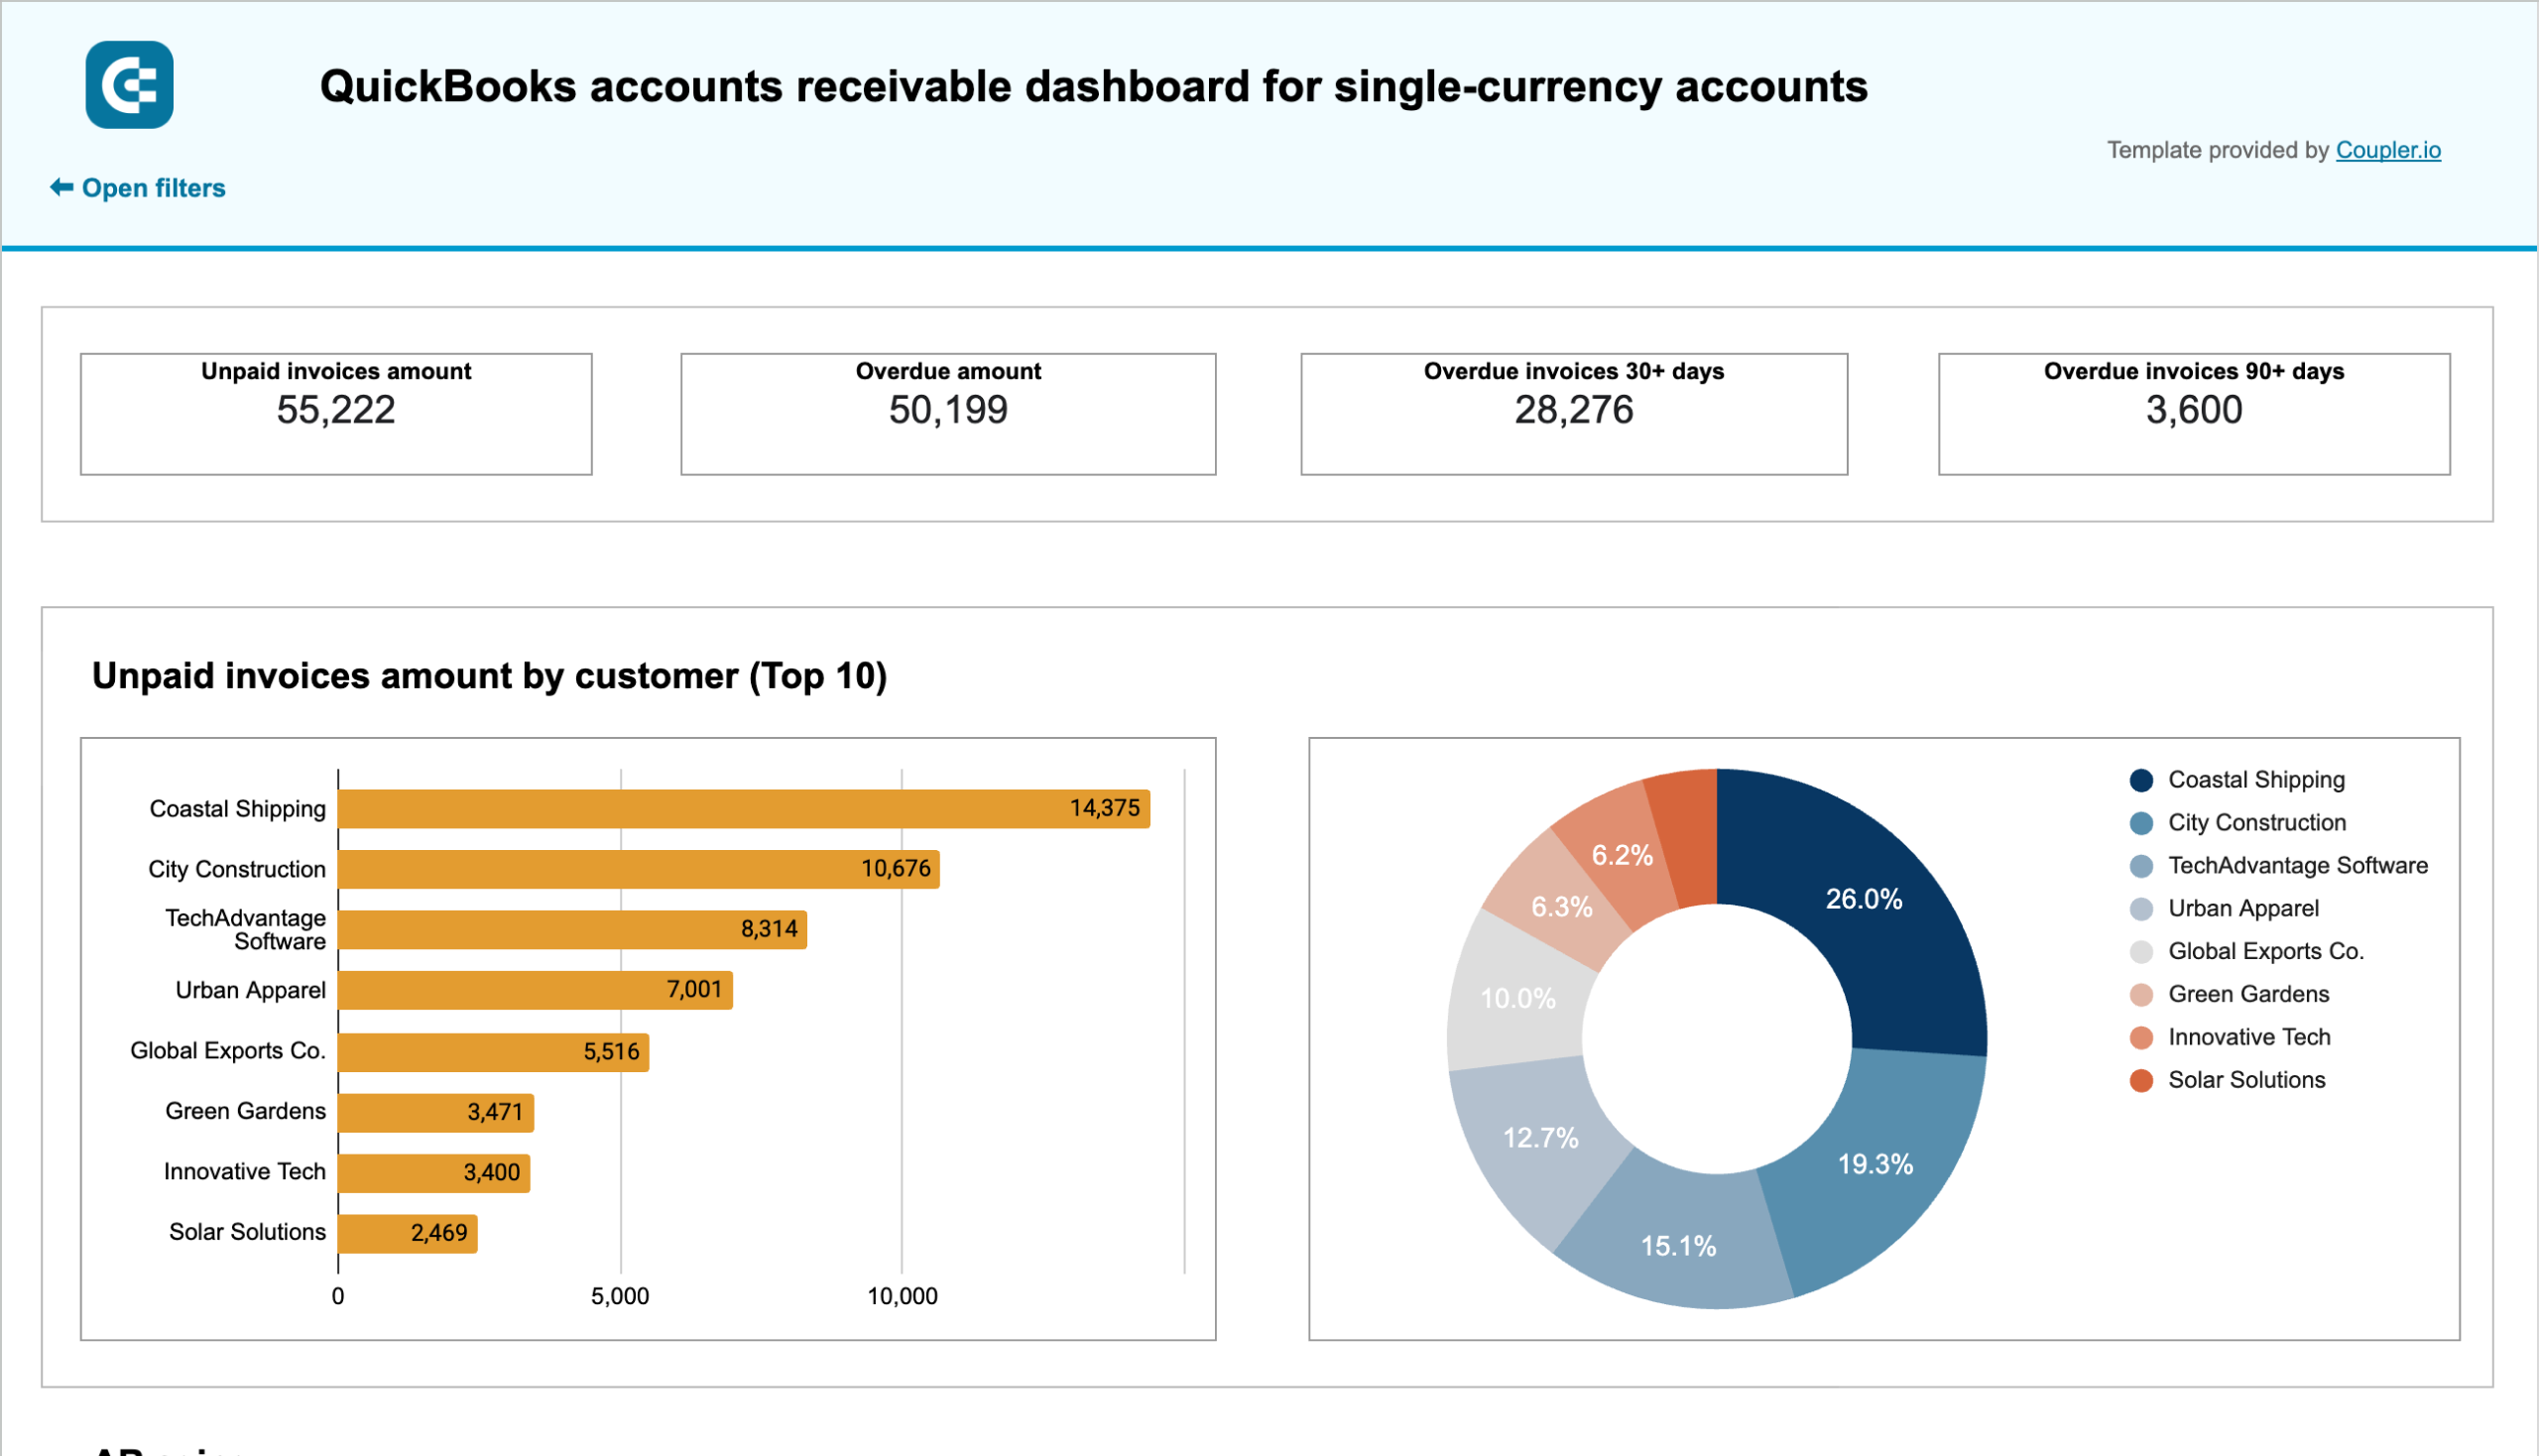
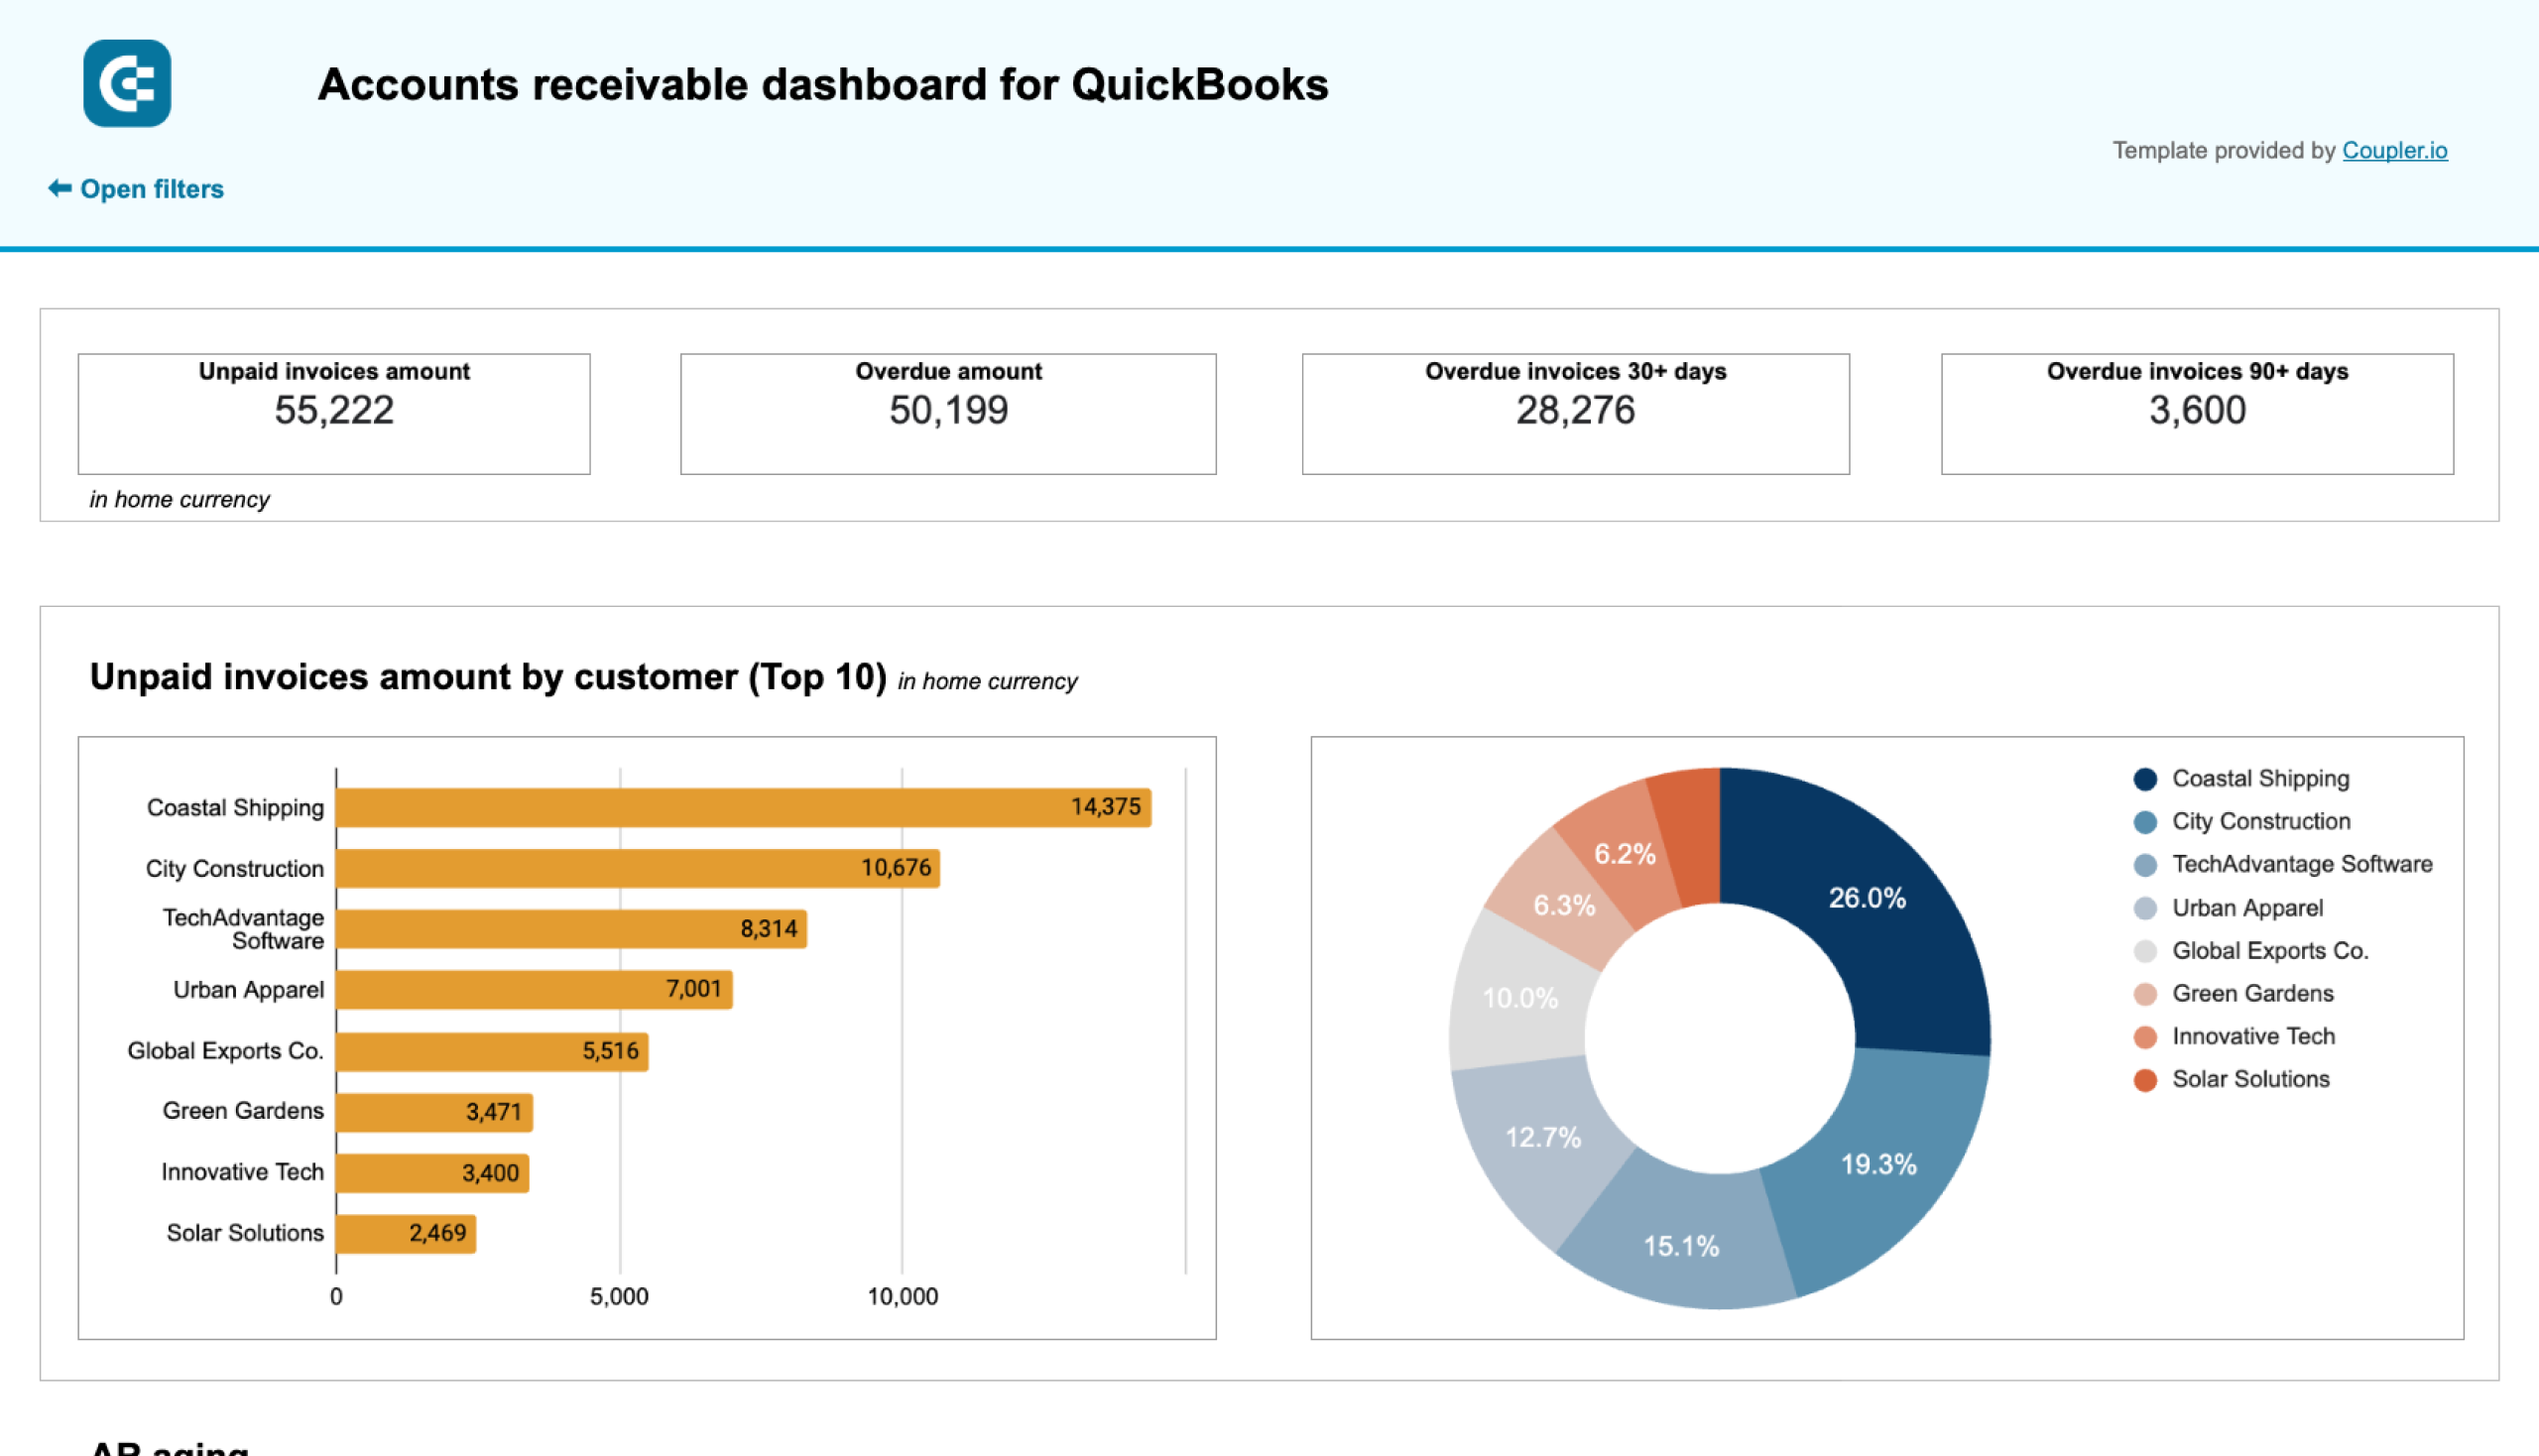
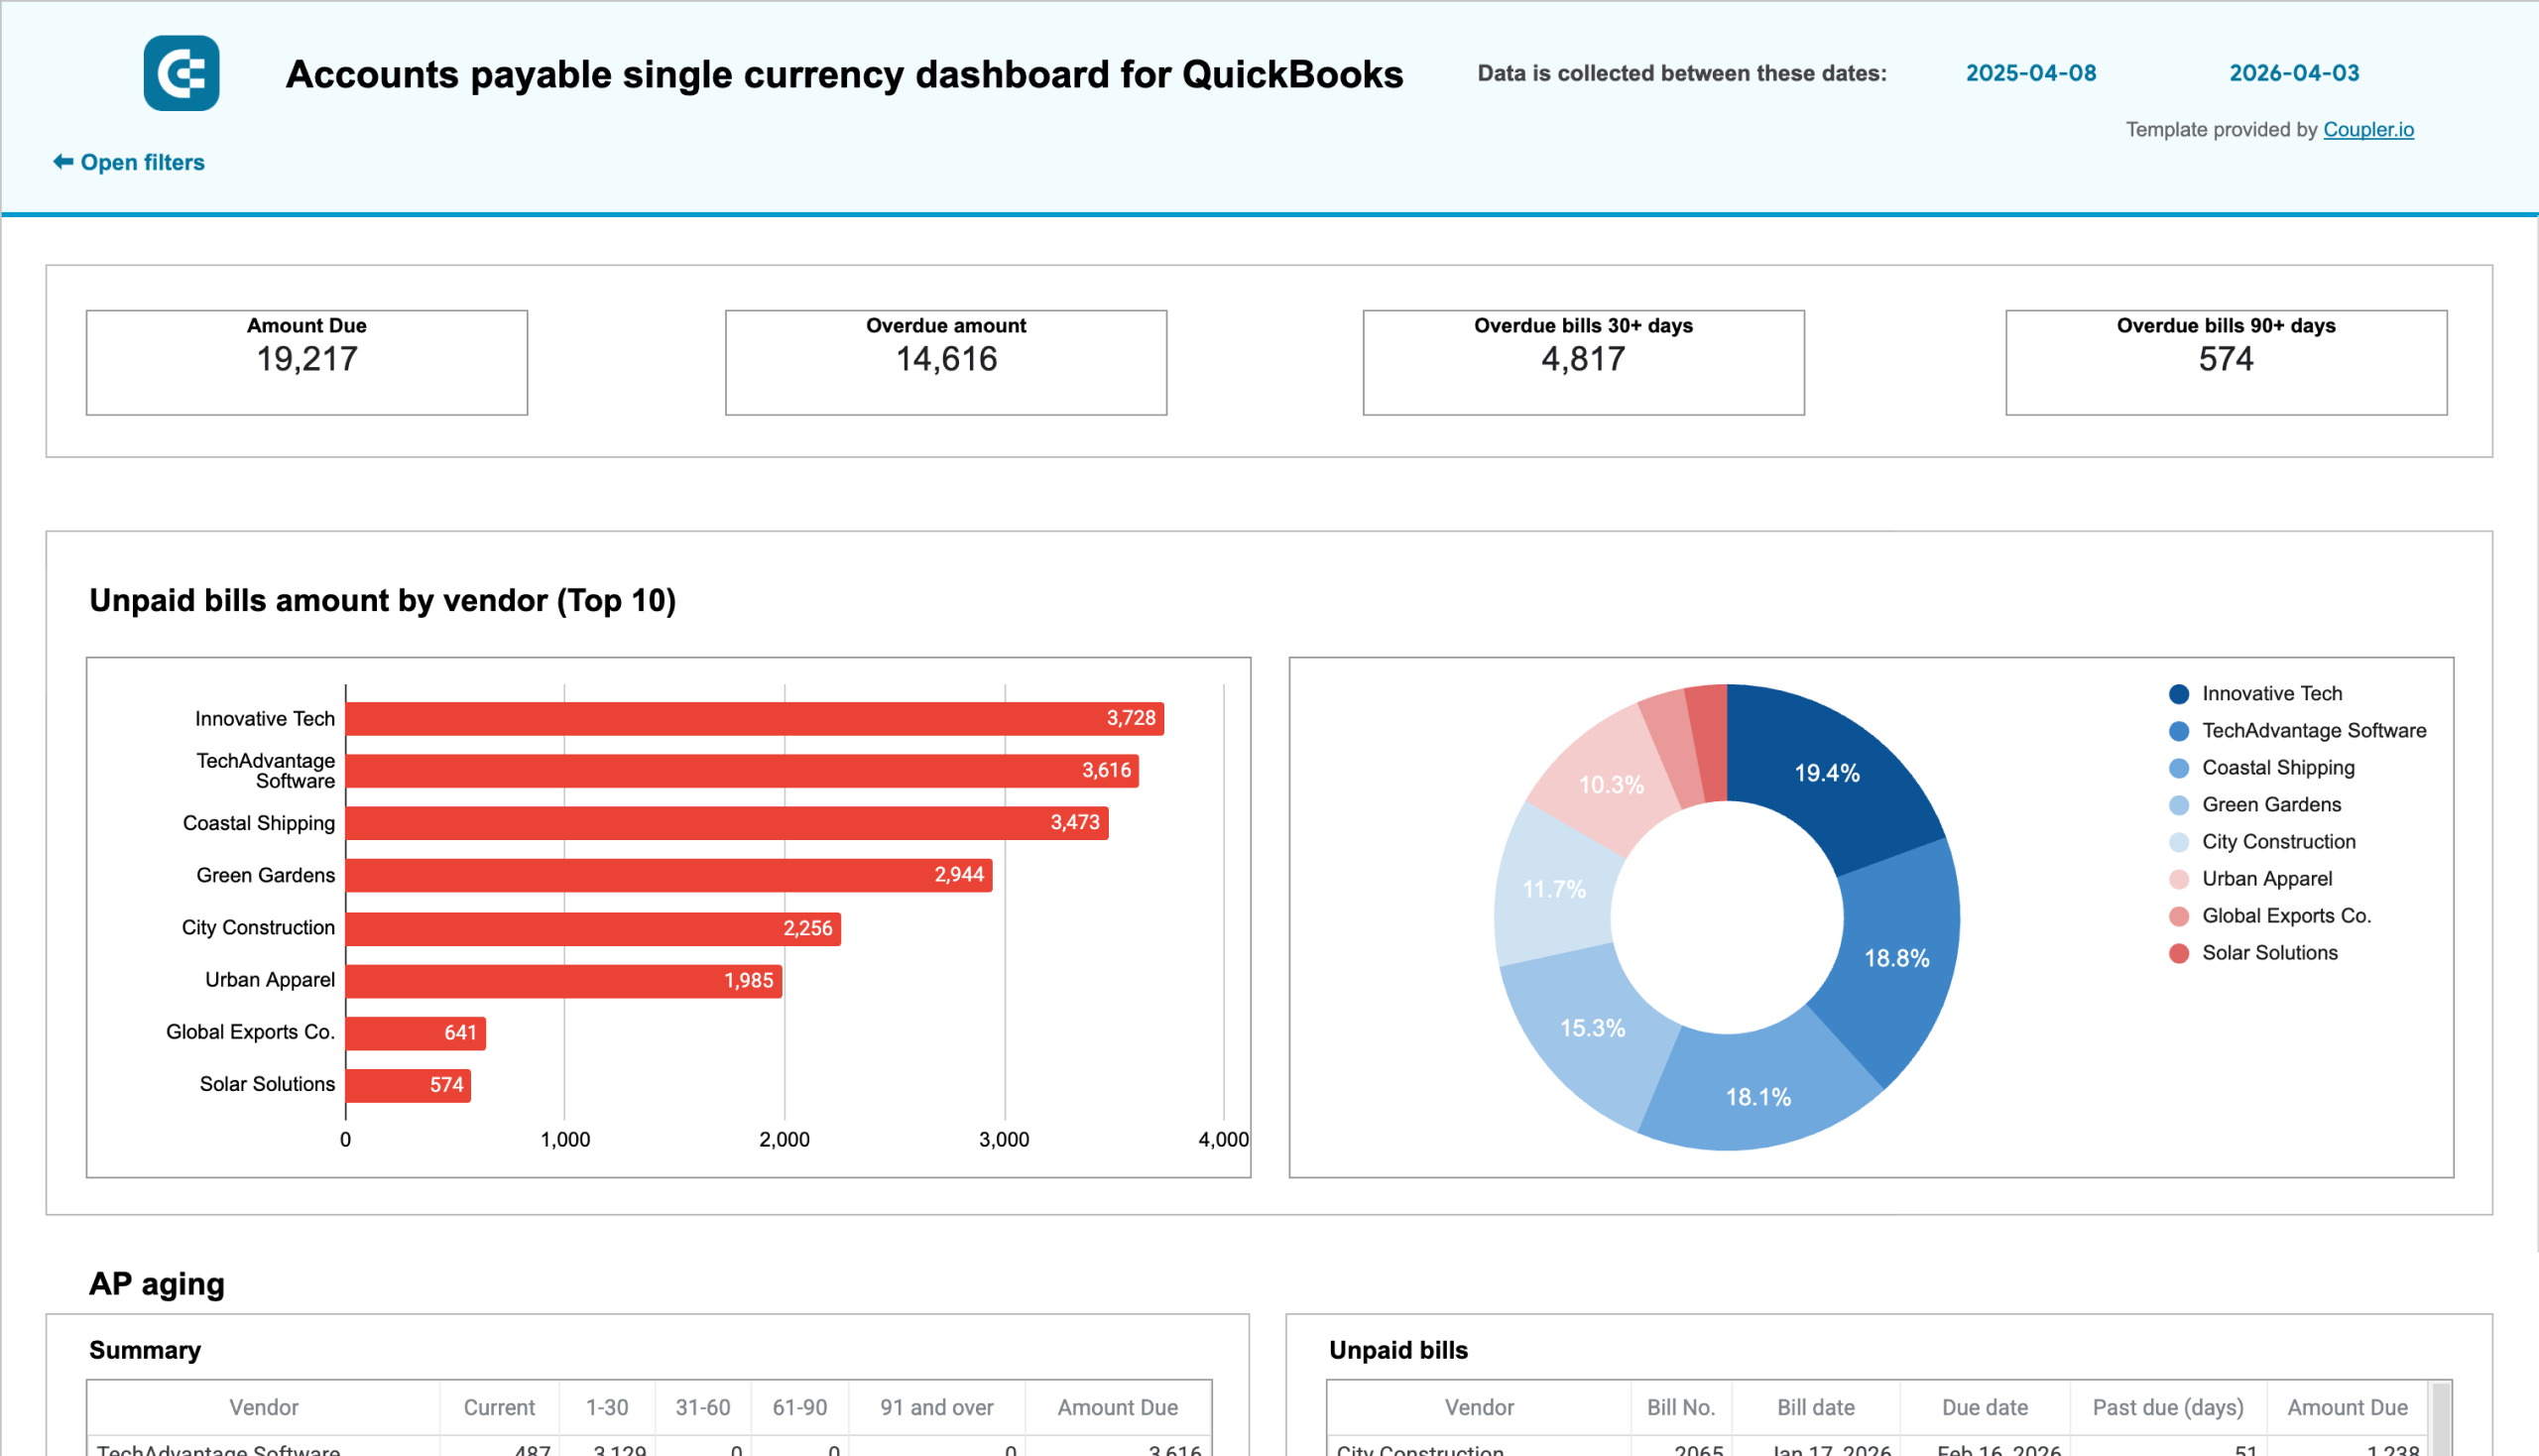
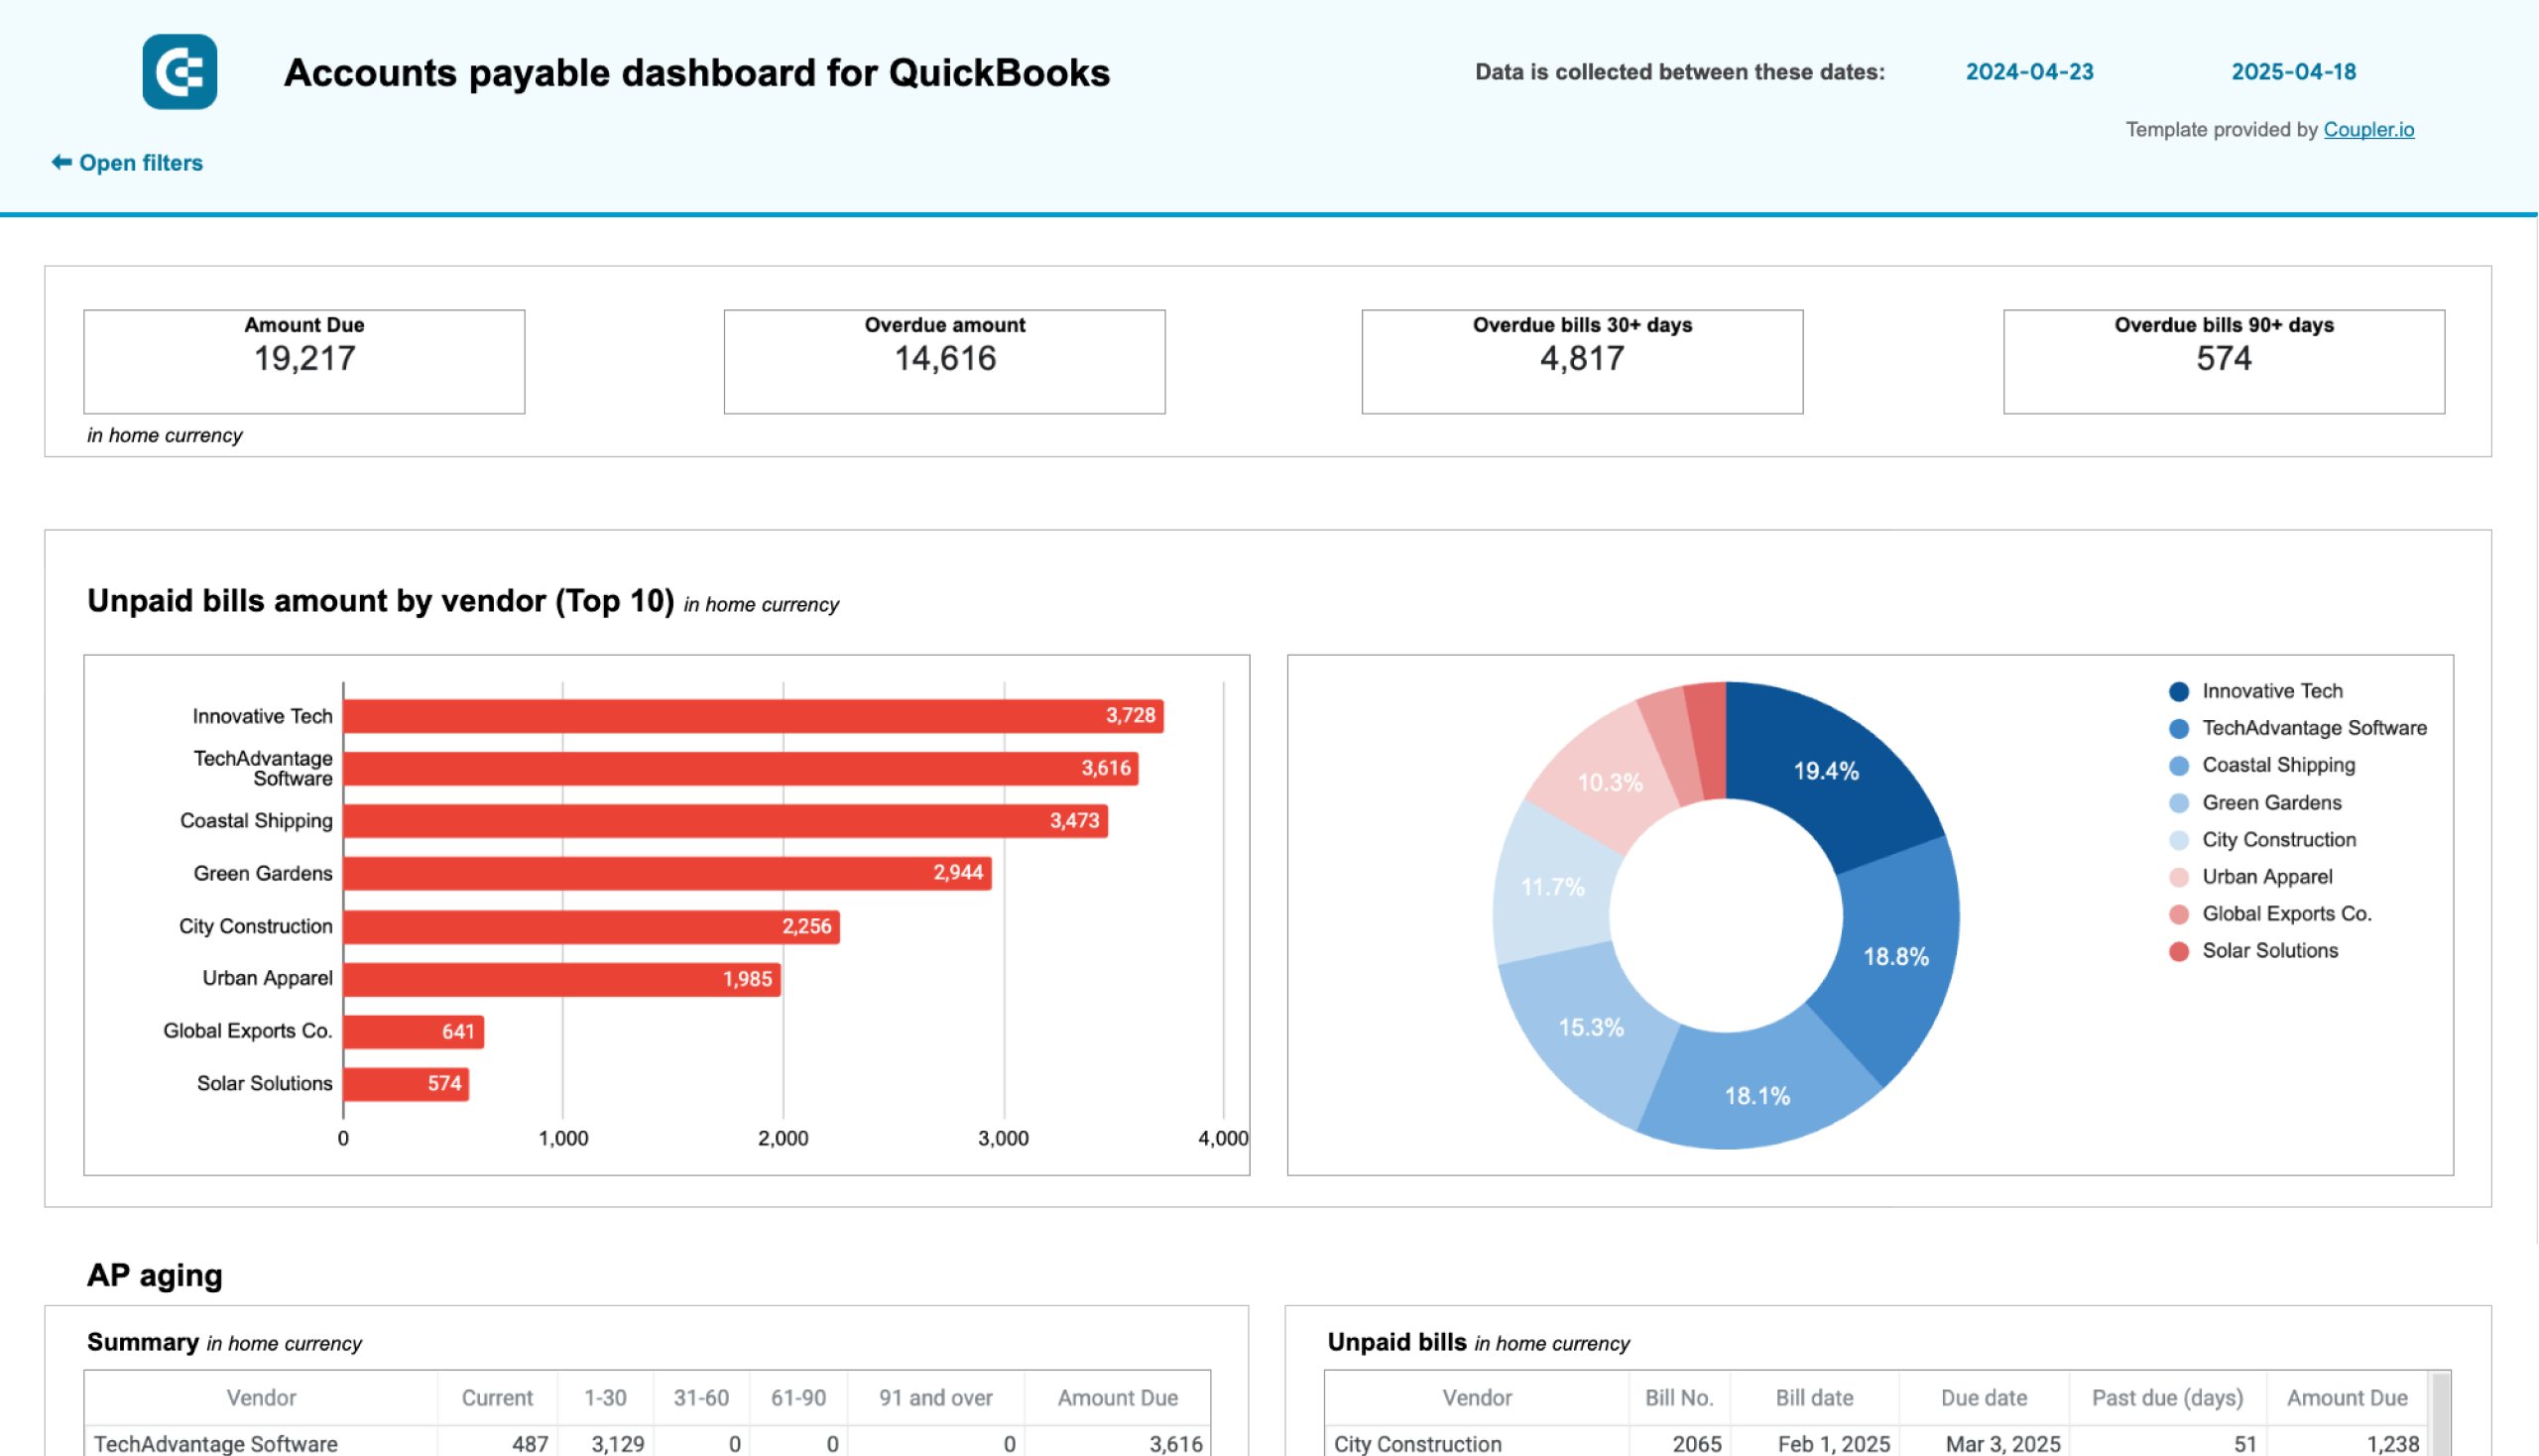
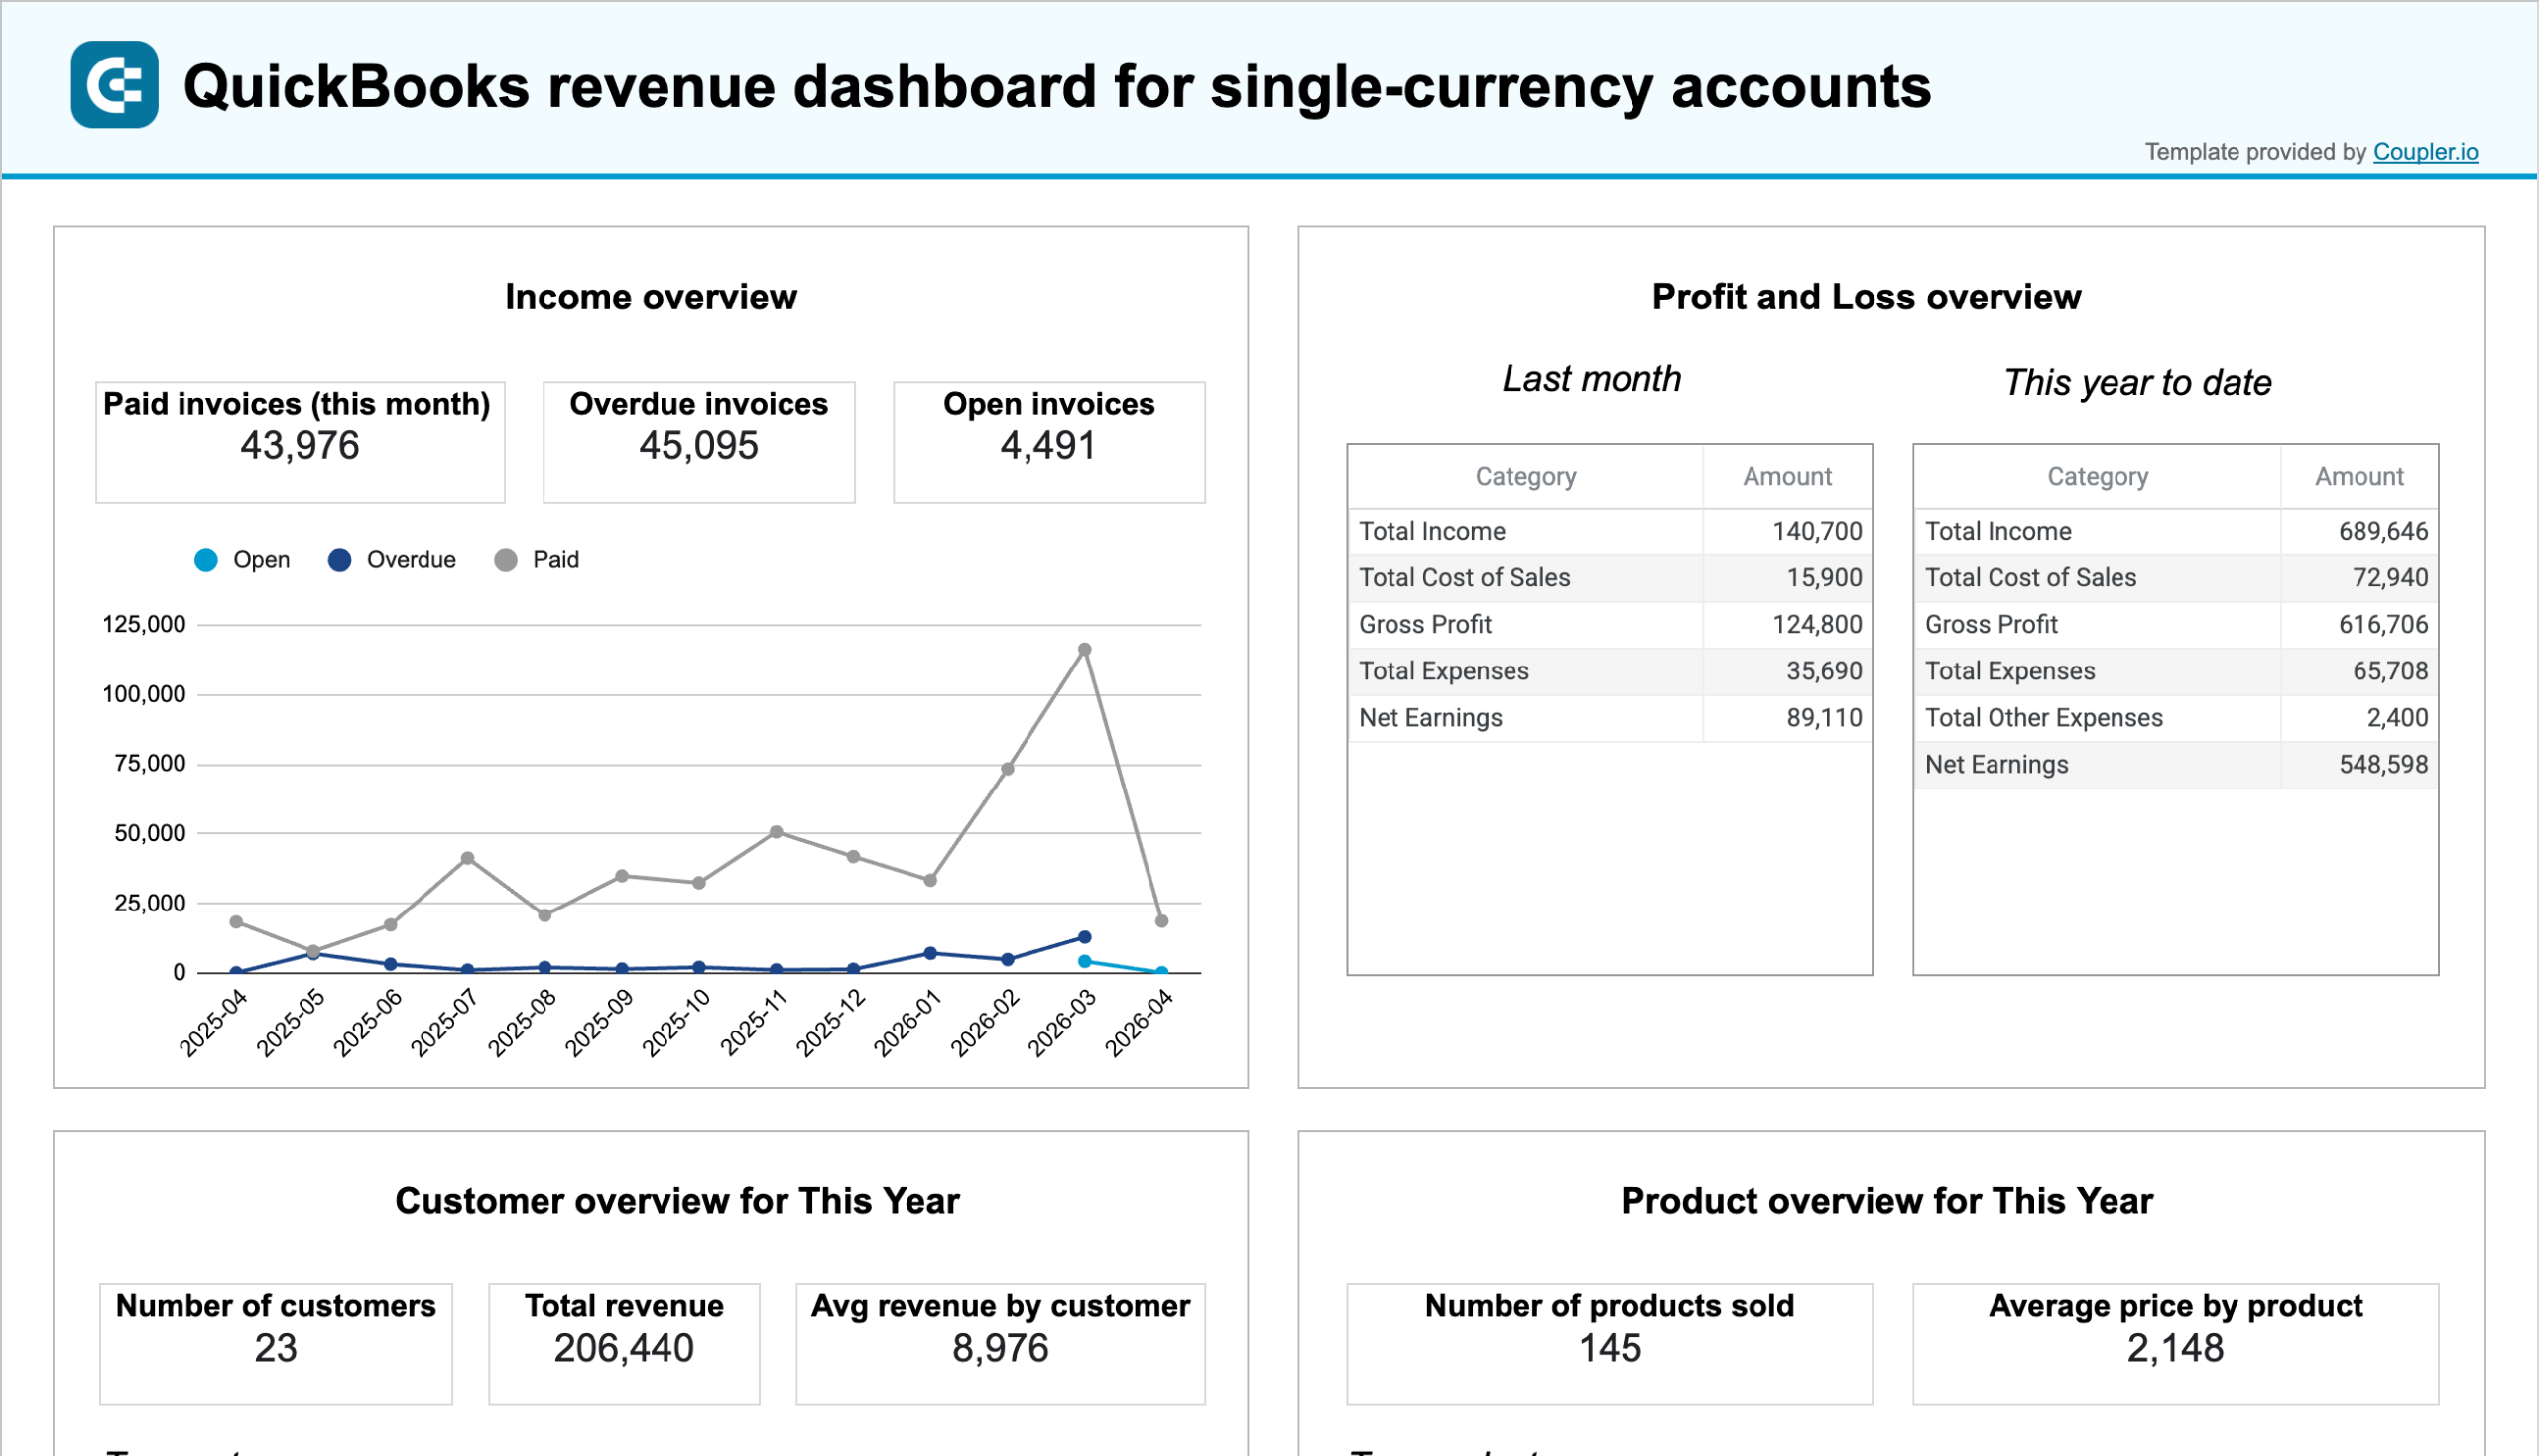
Financial visibility drives strategic decision-making, requiring real-time access to revenue trends, cash flow positions, and account management data from accounting platforms like QuickBooks and Xero. Revenue tracking reports show income patterns across different time periods, customer segments, and product categories to identify growth opportunities and seasonal variations. Accounts receivable management displays outstanding customer payments with aging analysis to prioritize collection efforts and maintain healthy cash flow. Accounts payable tracking monitors vendor obligations and payment schedules to optimize working capital management while maintaining strong supplier relationships through timely payments.
Sales performance optimization depends on detailed pipeline analysis, team productivity tracking, and customer relationship management data that connects marketing efforts to revenue outcomes. CRM dashboards show deal progression through various pipeline stages, helping sales managers identify bottlenecks and coach team members for improved conversion rates. Sales team performance reports compare individual contributor metrics including deal volume, win rates, and revenue generation to recognize top performers and address training needs. Customer acquisition analysis tracks lead sources and conversion pathways, enabling sales and marketing alignment for more effective prospect targeting and nurturing strategies.
What insights you can get with the Google Sheets reporting dashboard
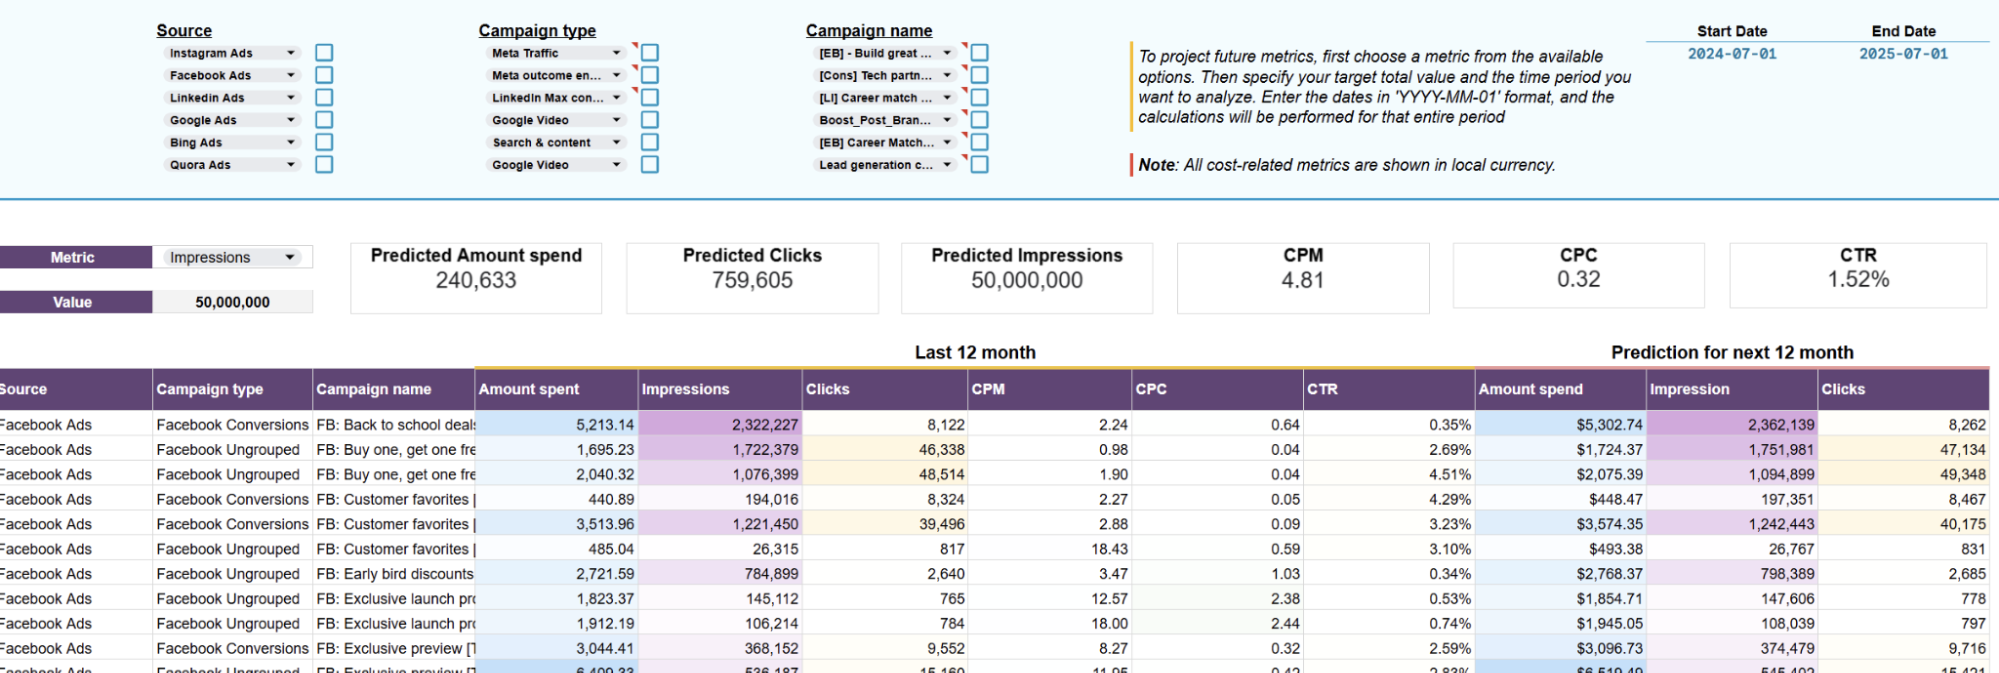
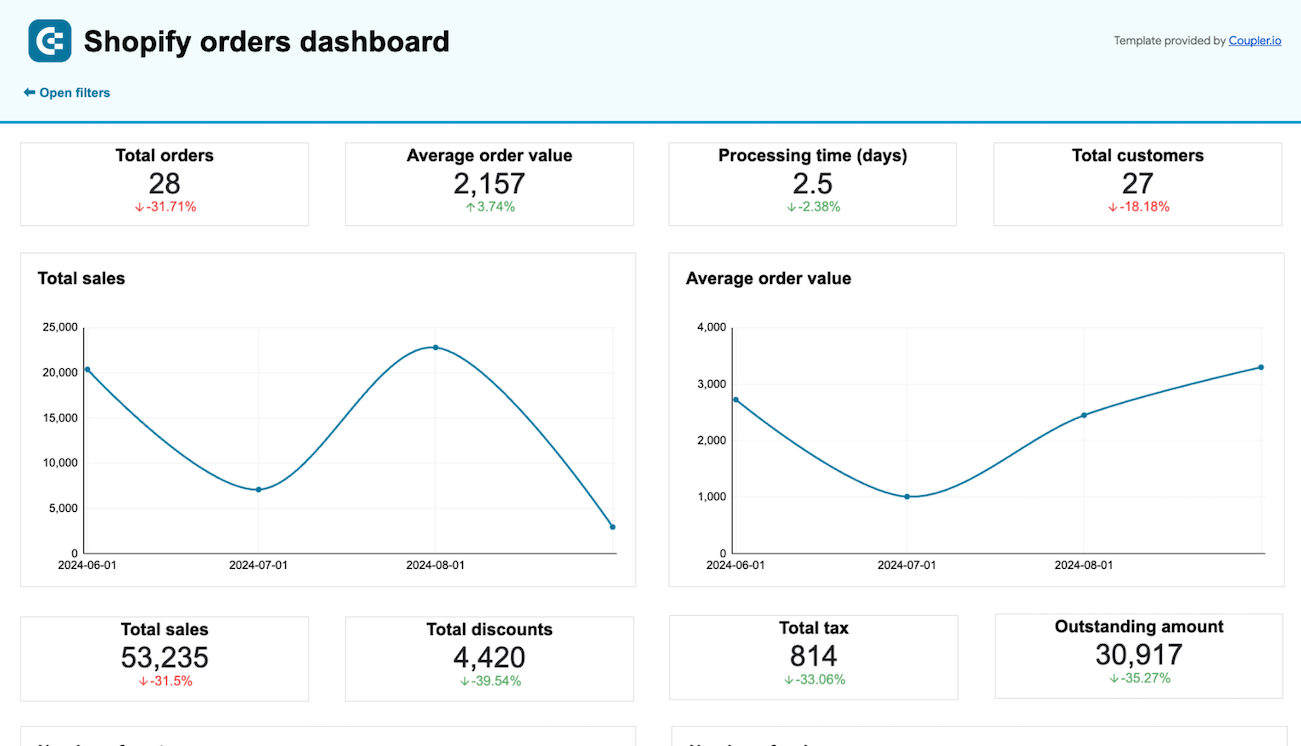
The advertising budget forecast dashboard provides real-time visibility into your advertising spend across multiple platforms with predictive analytics that help prevent budget overruns. Track allocated budgets versus actual spending with color-coded alerts that immediately flag when campaigns are on track to exceed their monthly allocations. Daily spending rates and projected total spend calculations enable proactive budget management, allowing marketing teams to pause or adjust campaigns before overspending occurs. This insight is crucial for maintaining advertising ROI and ensuring marketing investments align with business objectives.
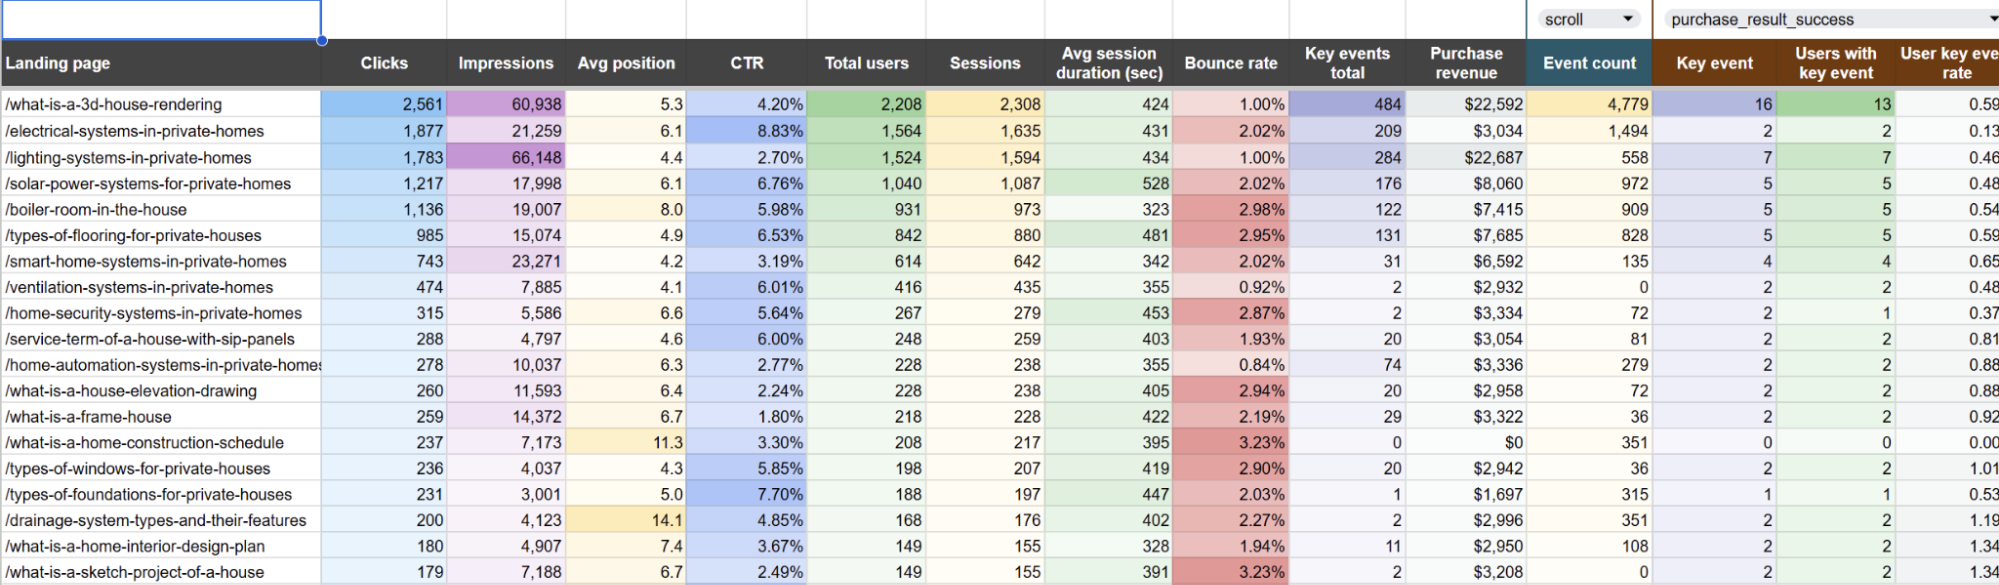
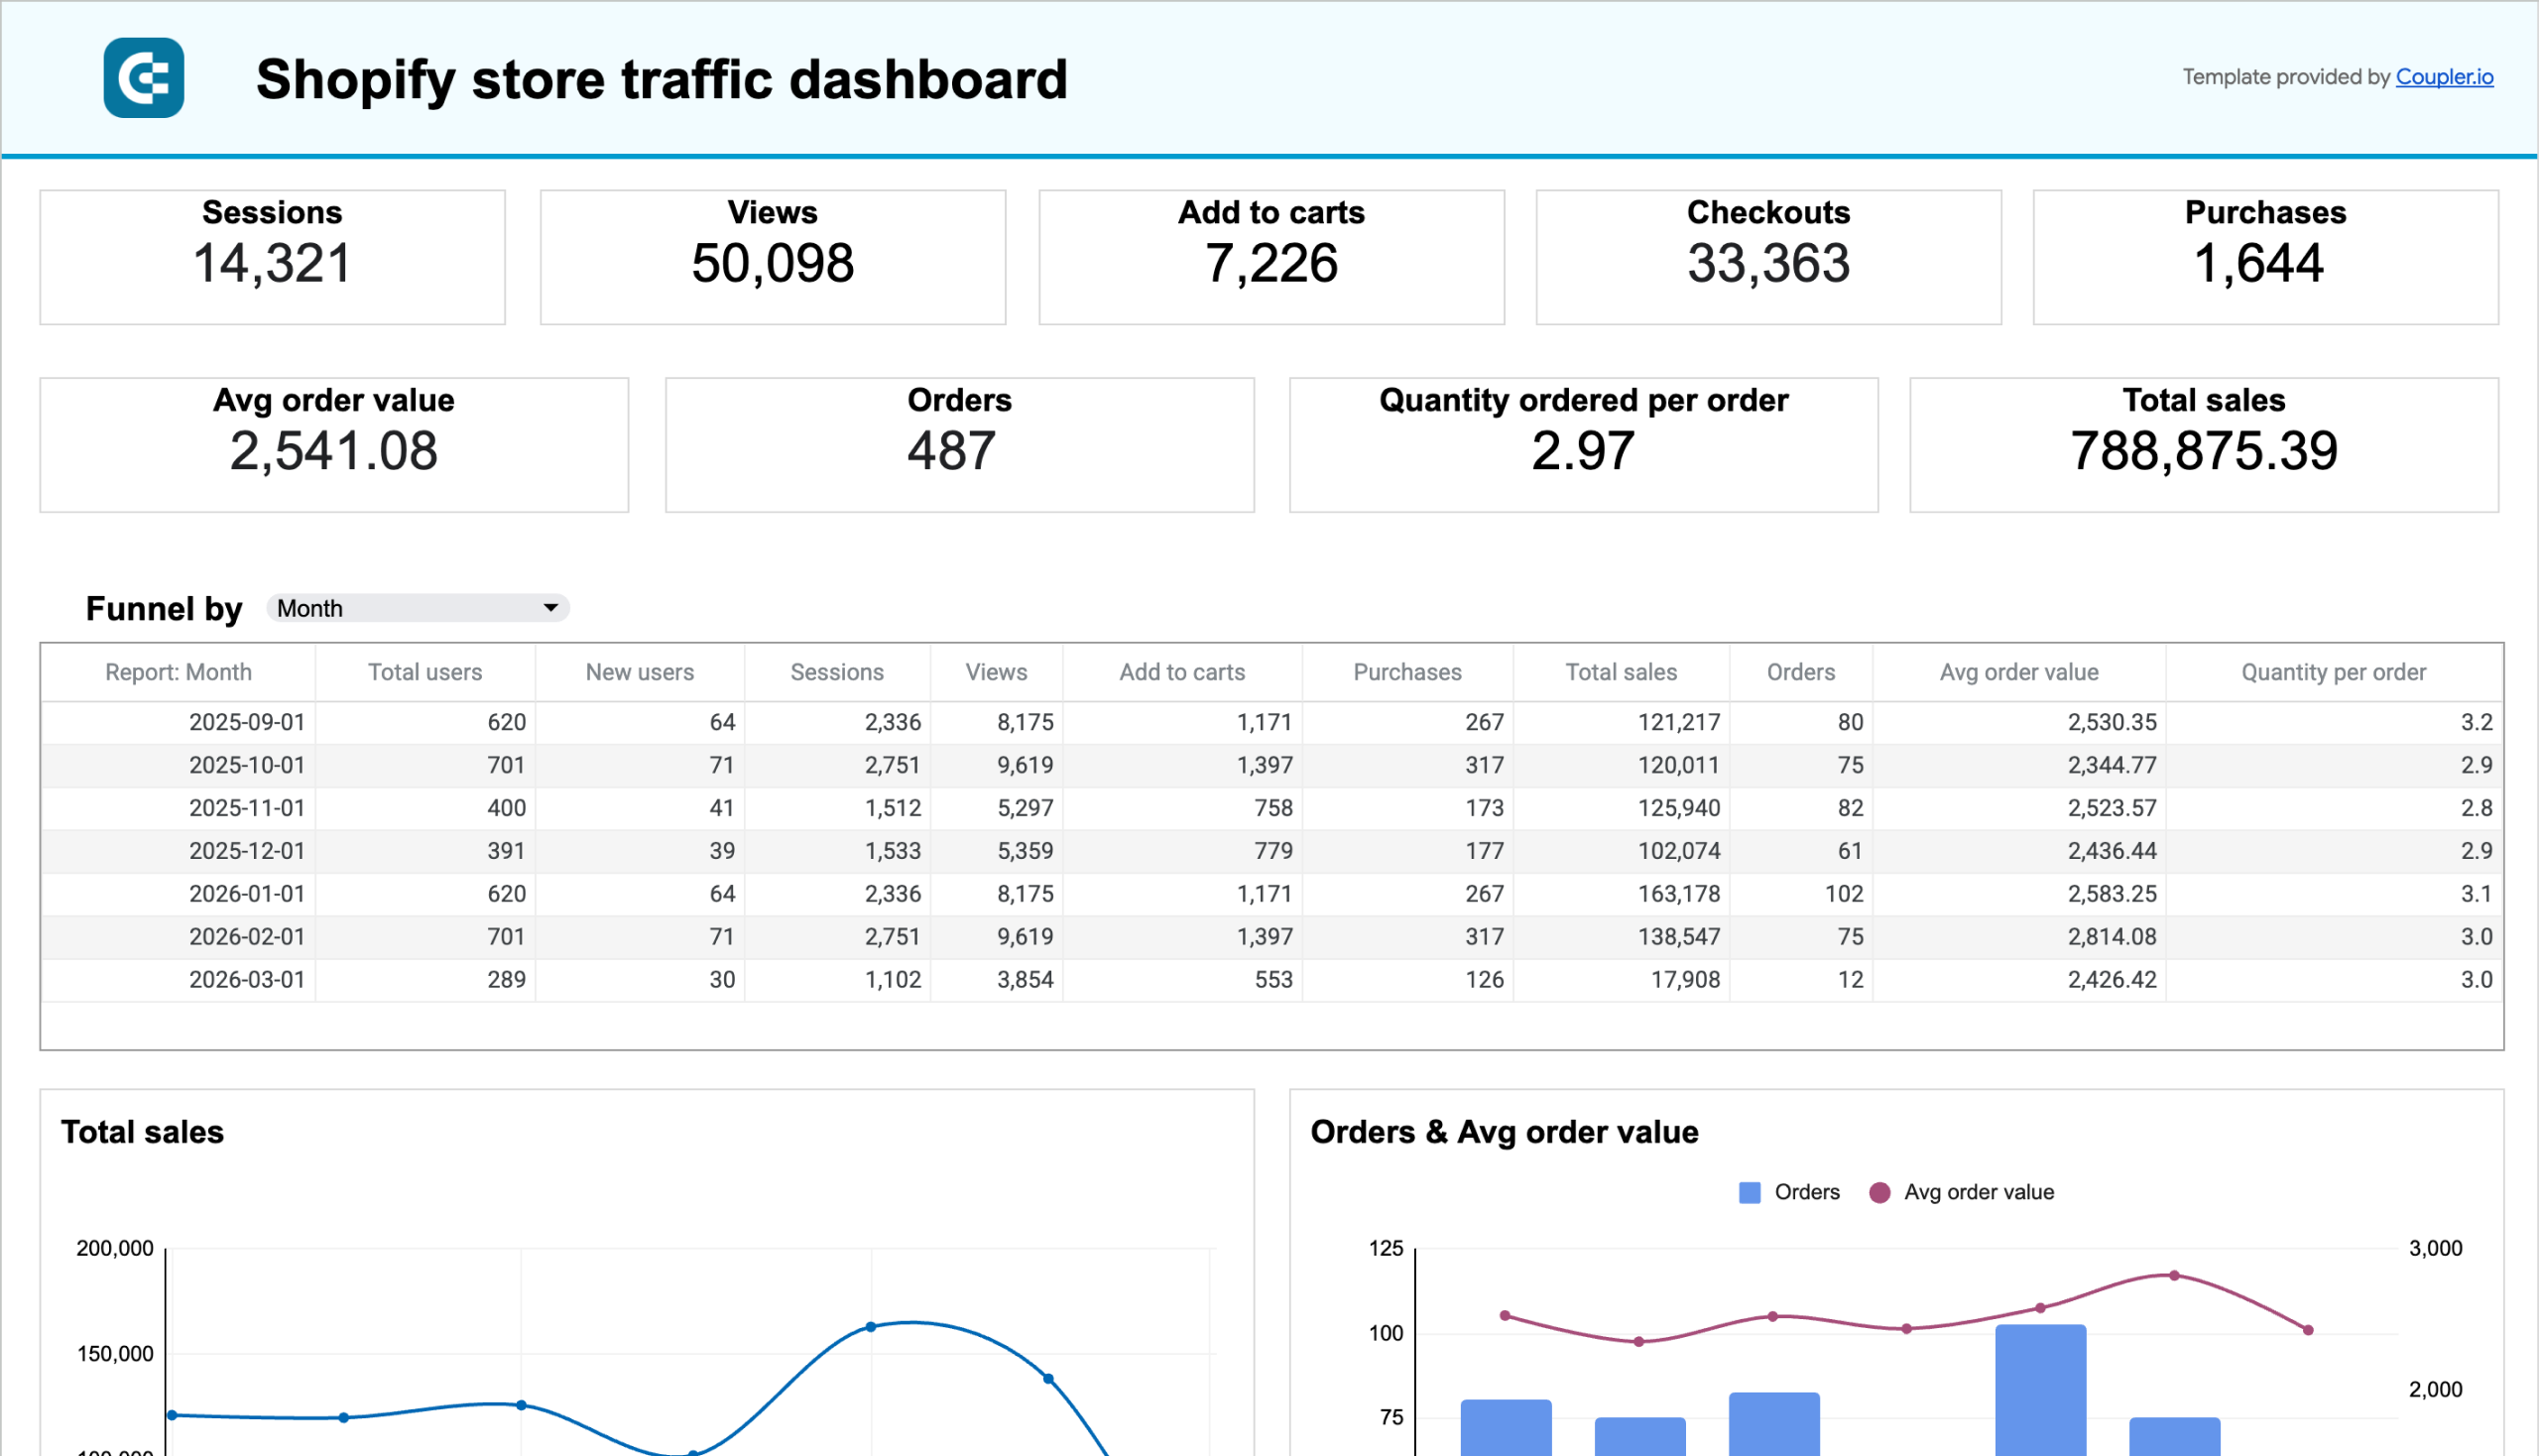
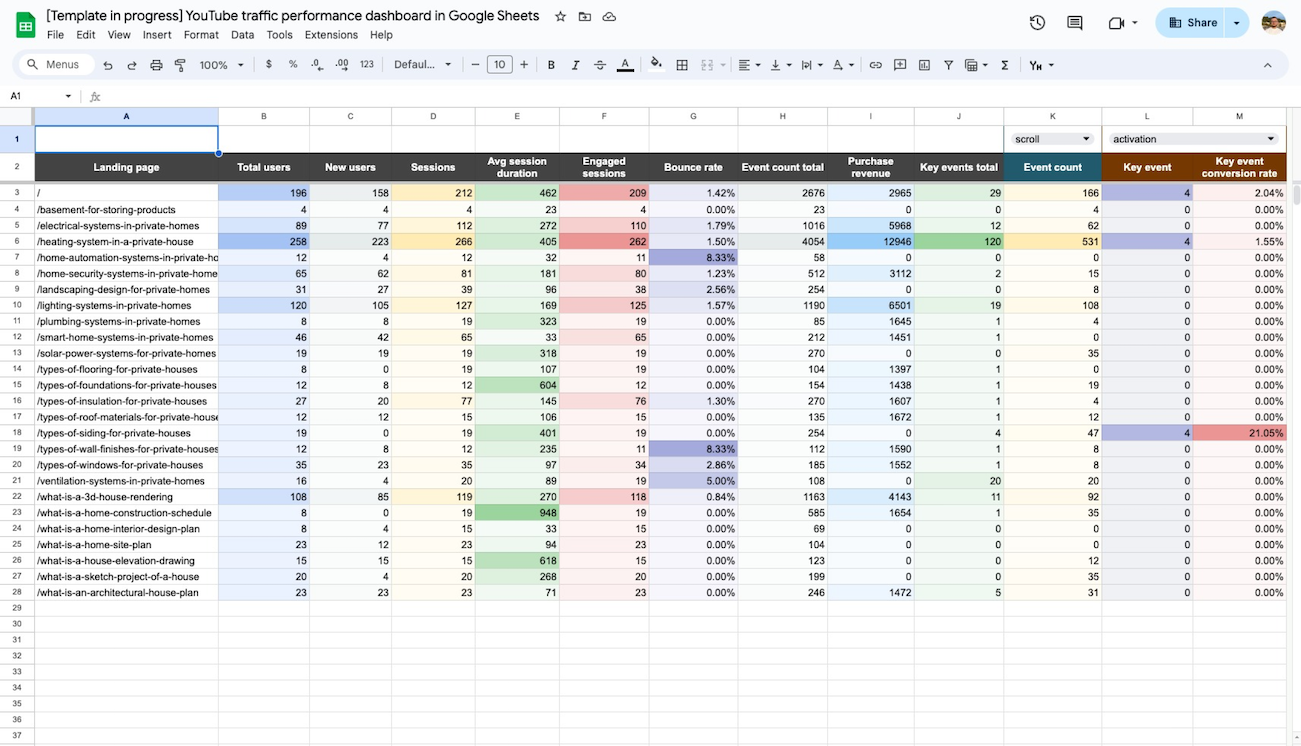
The landing page performance dashboard combines Google Search Console and Google Analytics data to show how effectively your pages drive traffic, engage visitors, and convert them into customers. Monitor key performance metrics including impressions, clicks, average position, total users, sessions, bounce rate, and conversion events for each landing page. Identify high-traffic pages with low conversion rates to investigate potential user experience issues or content alignment problems. This comprehensive view enables data-driven optimization of your most valuable web properties for improved business outcomes.
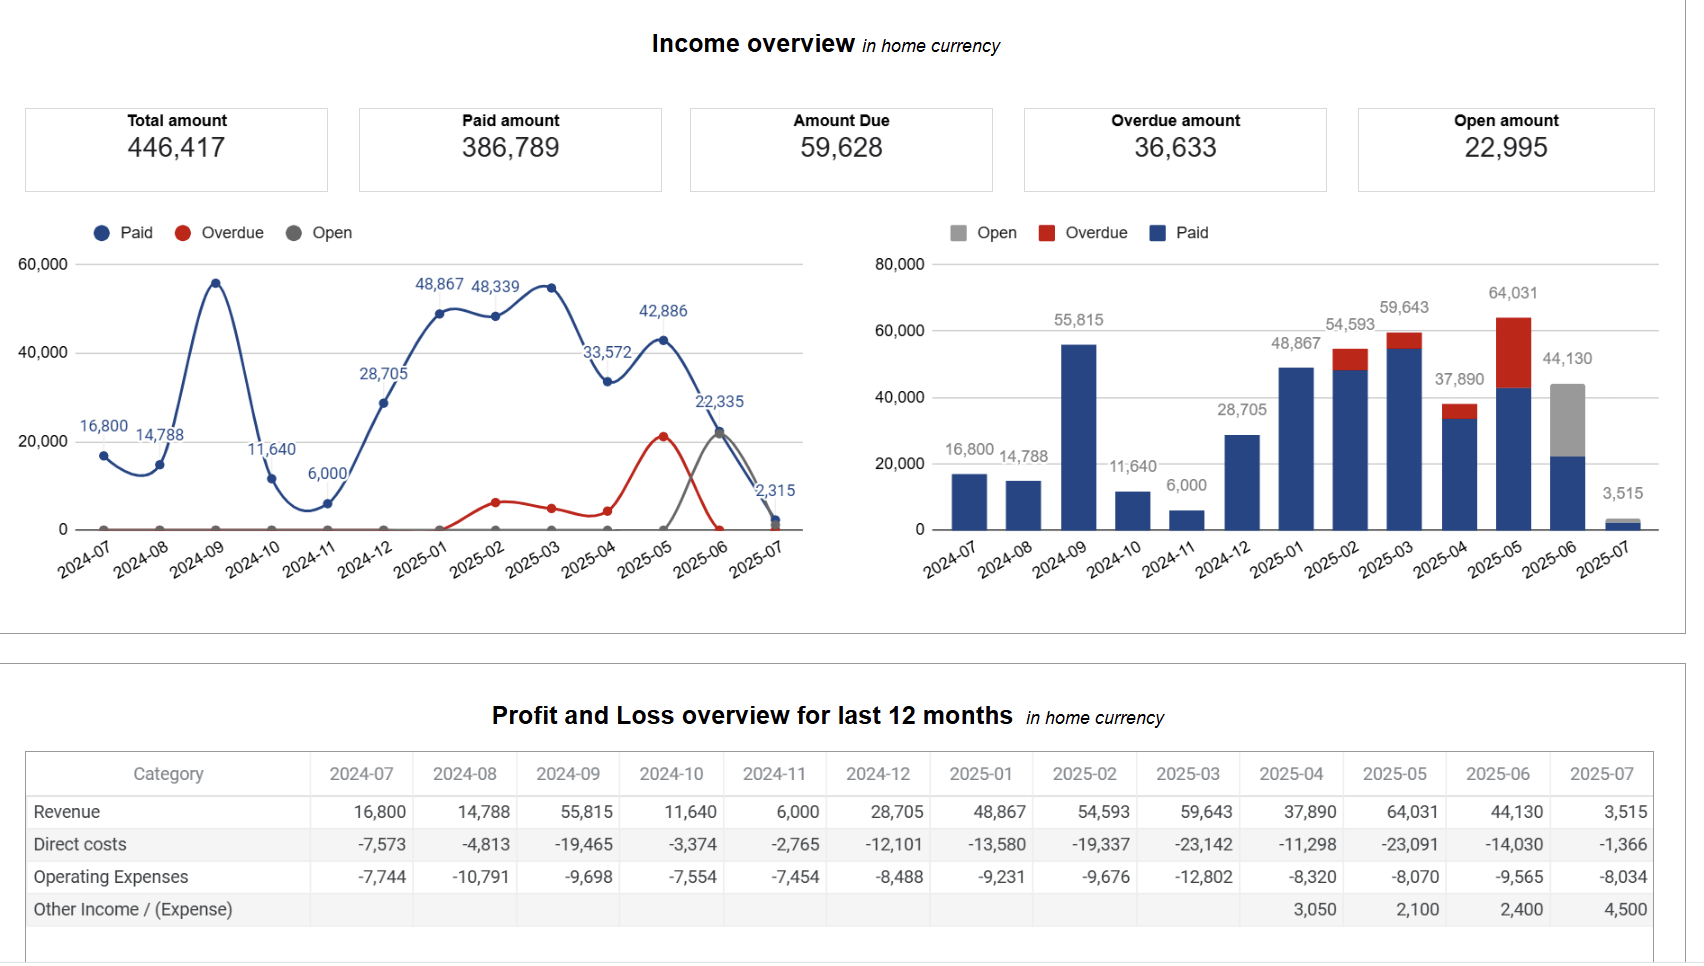
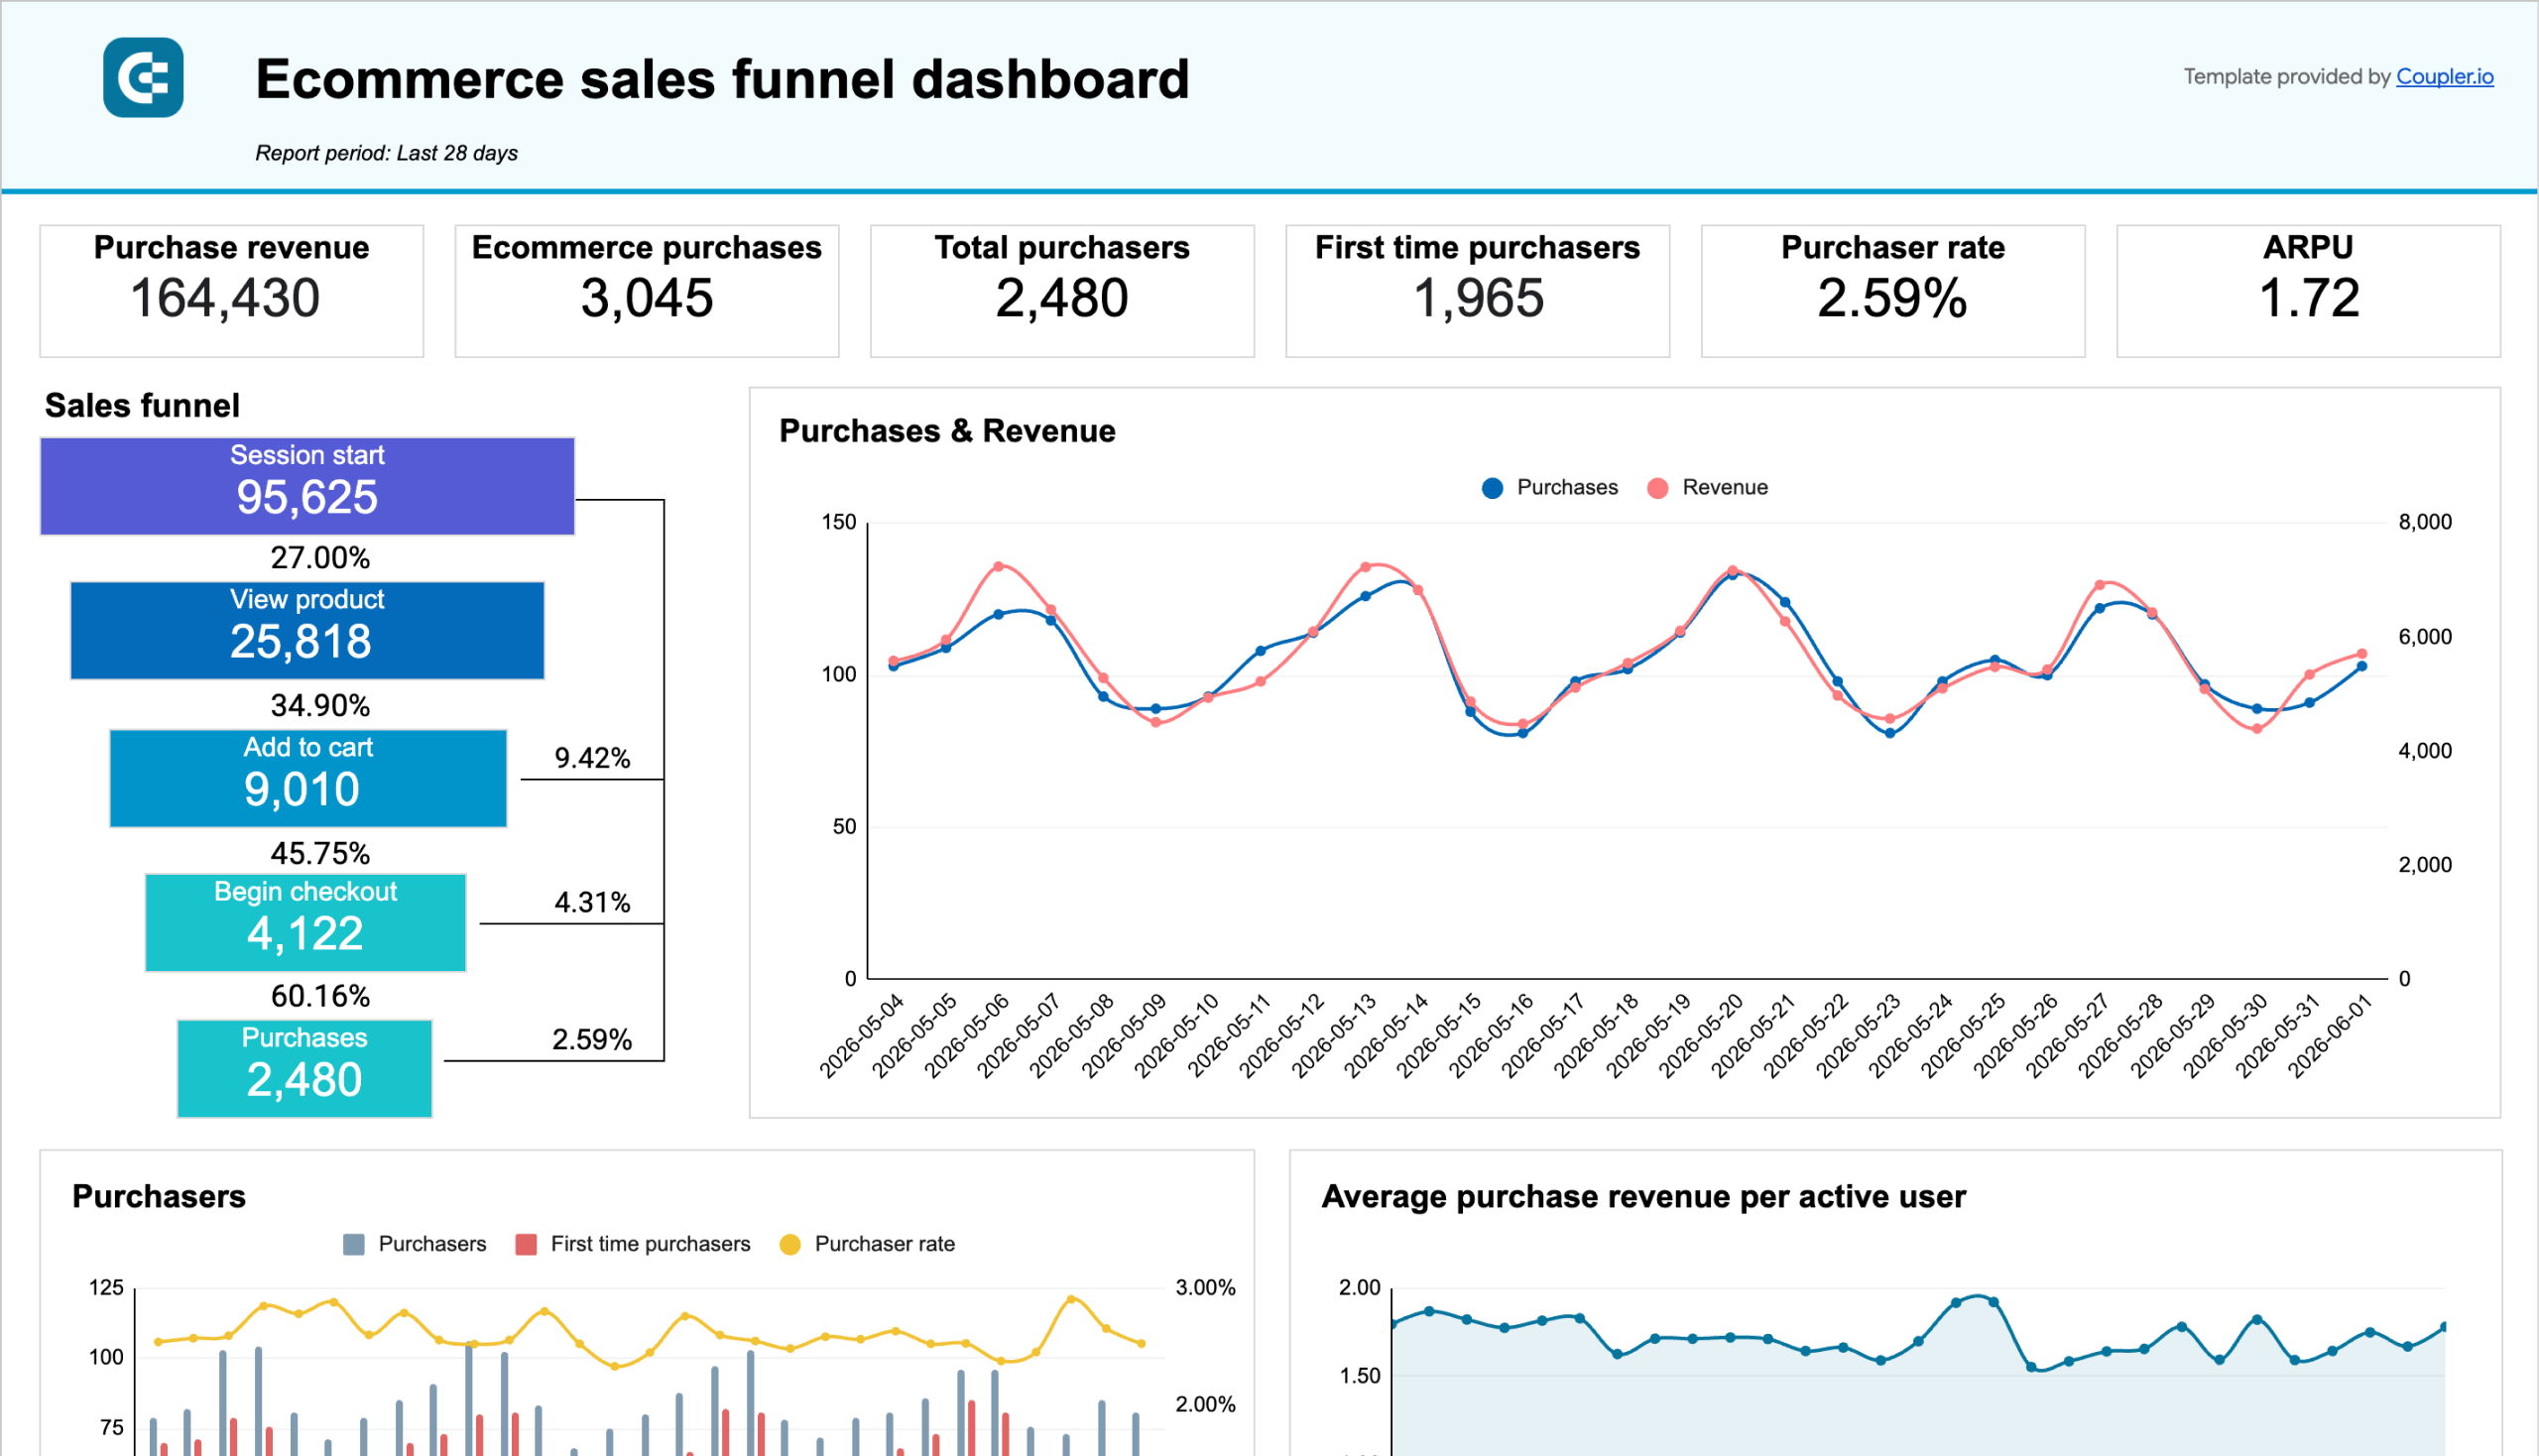
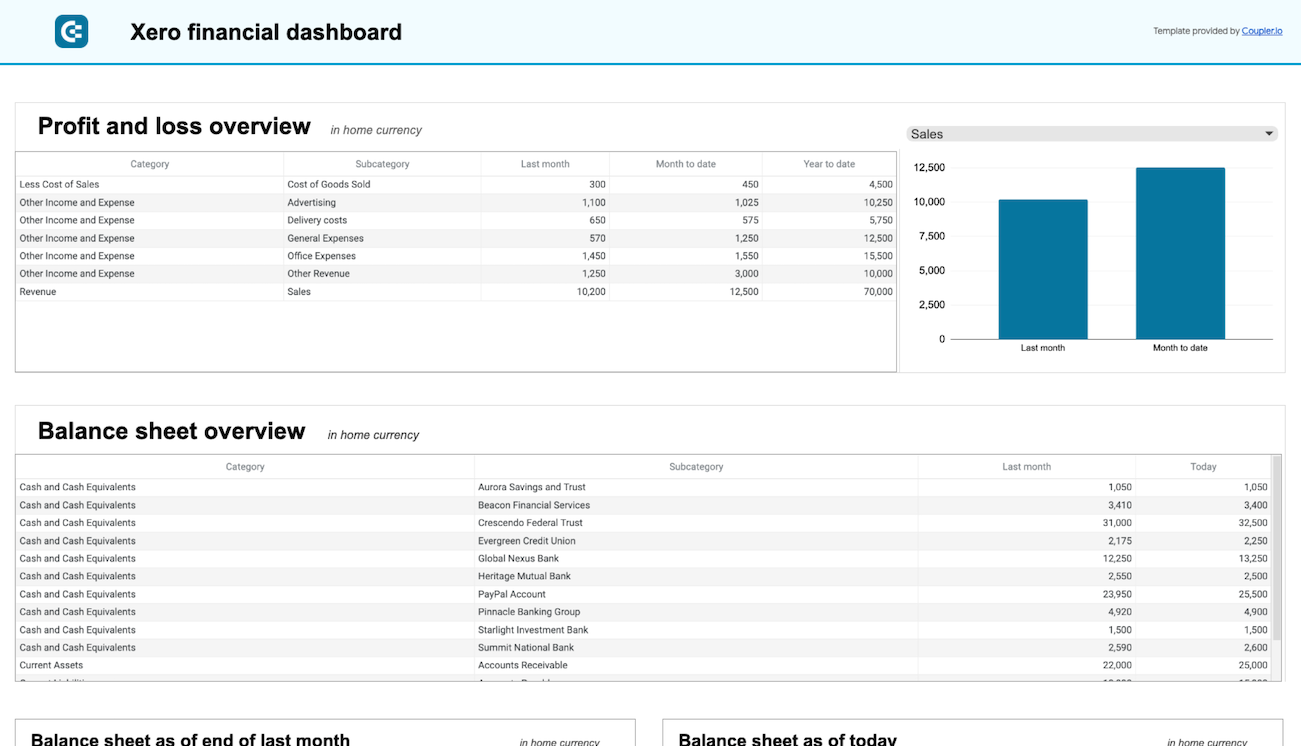
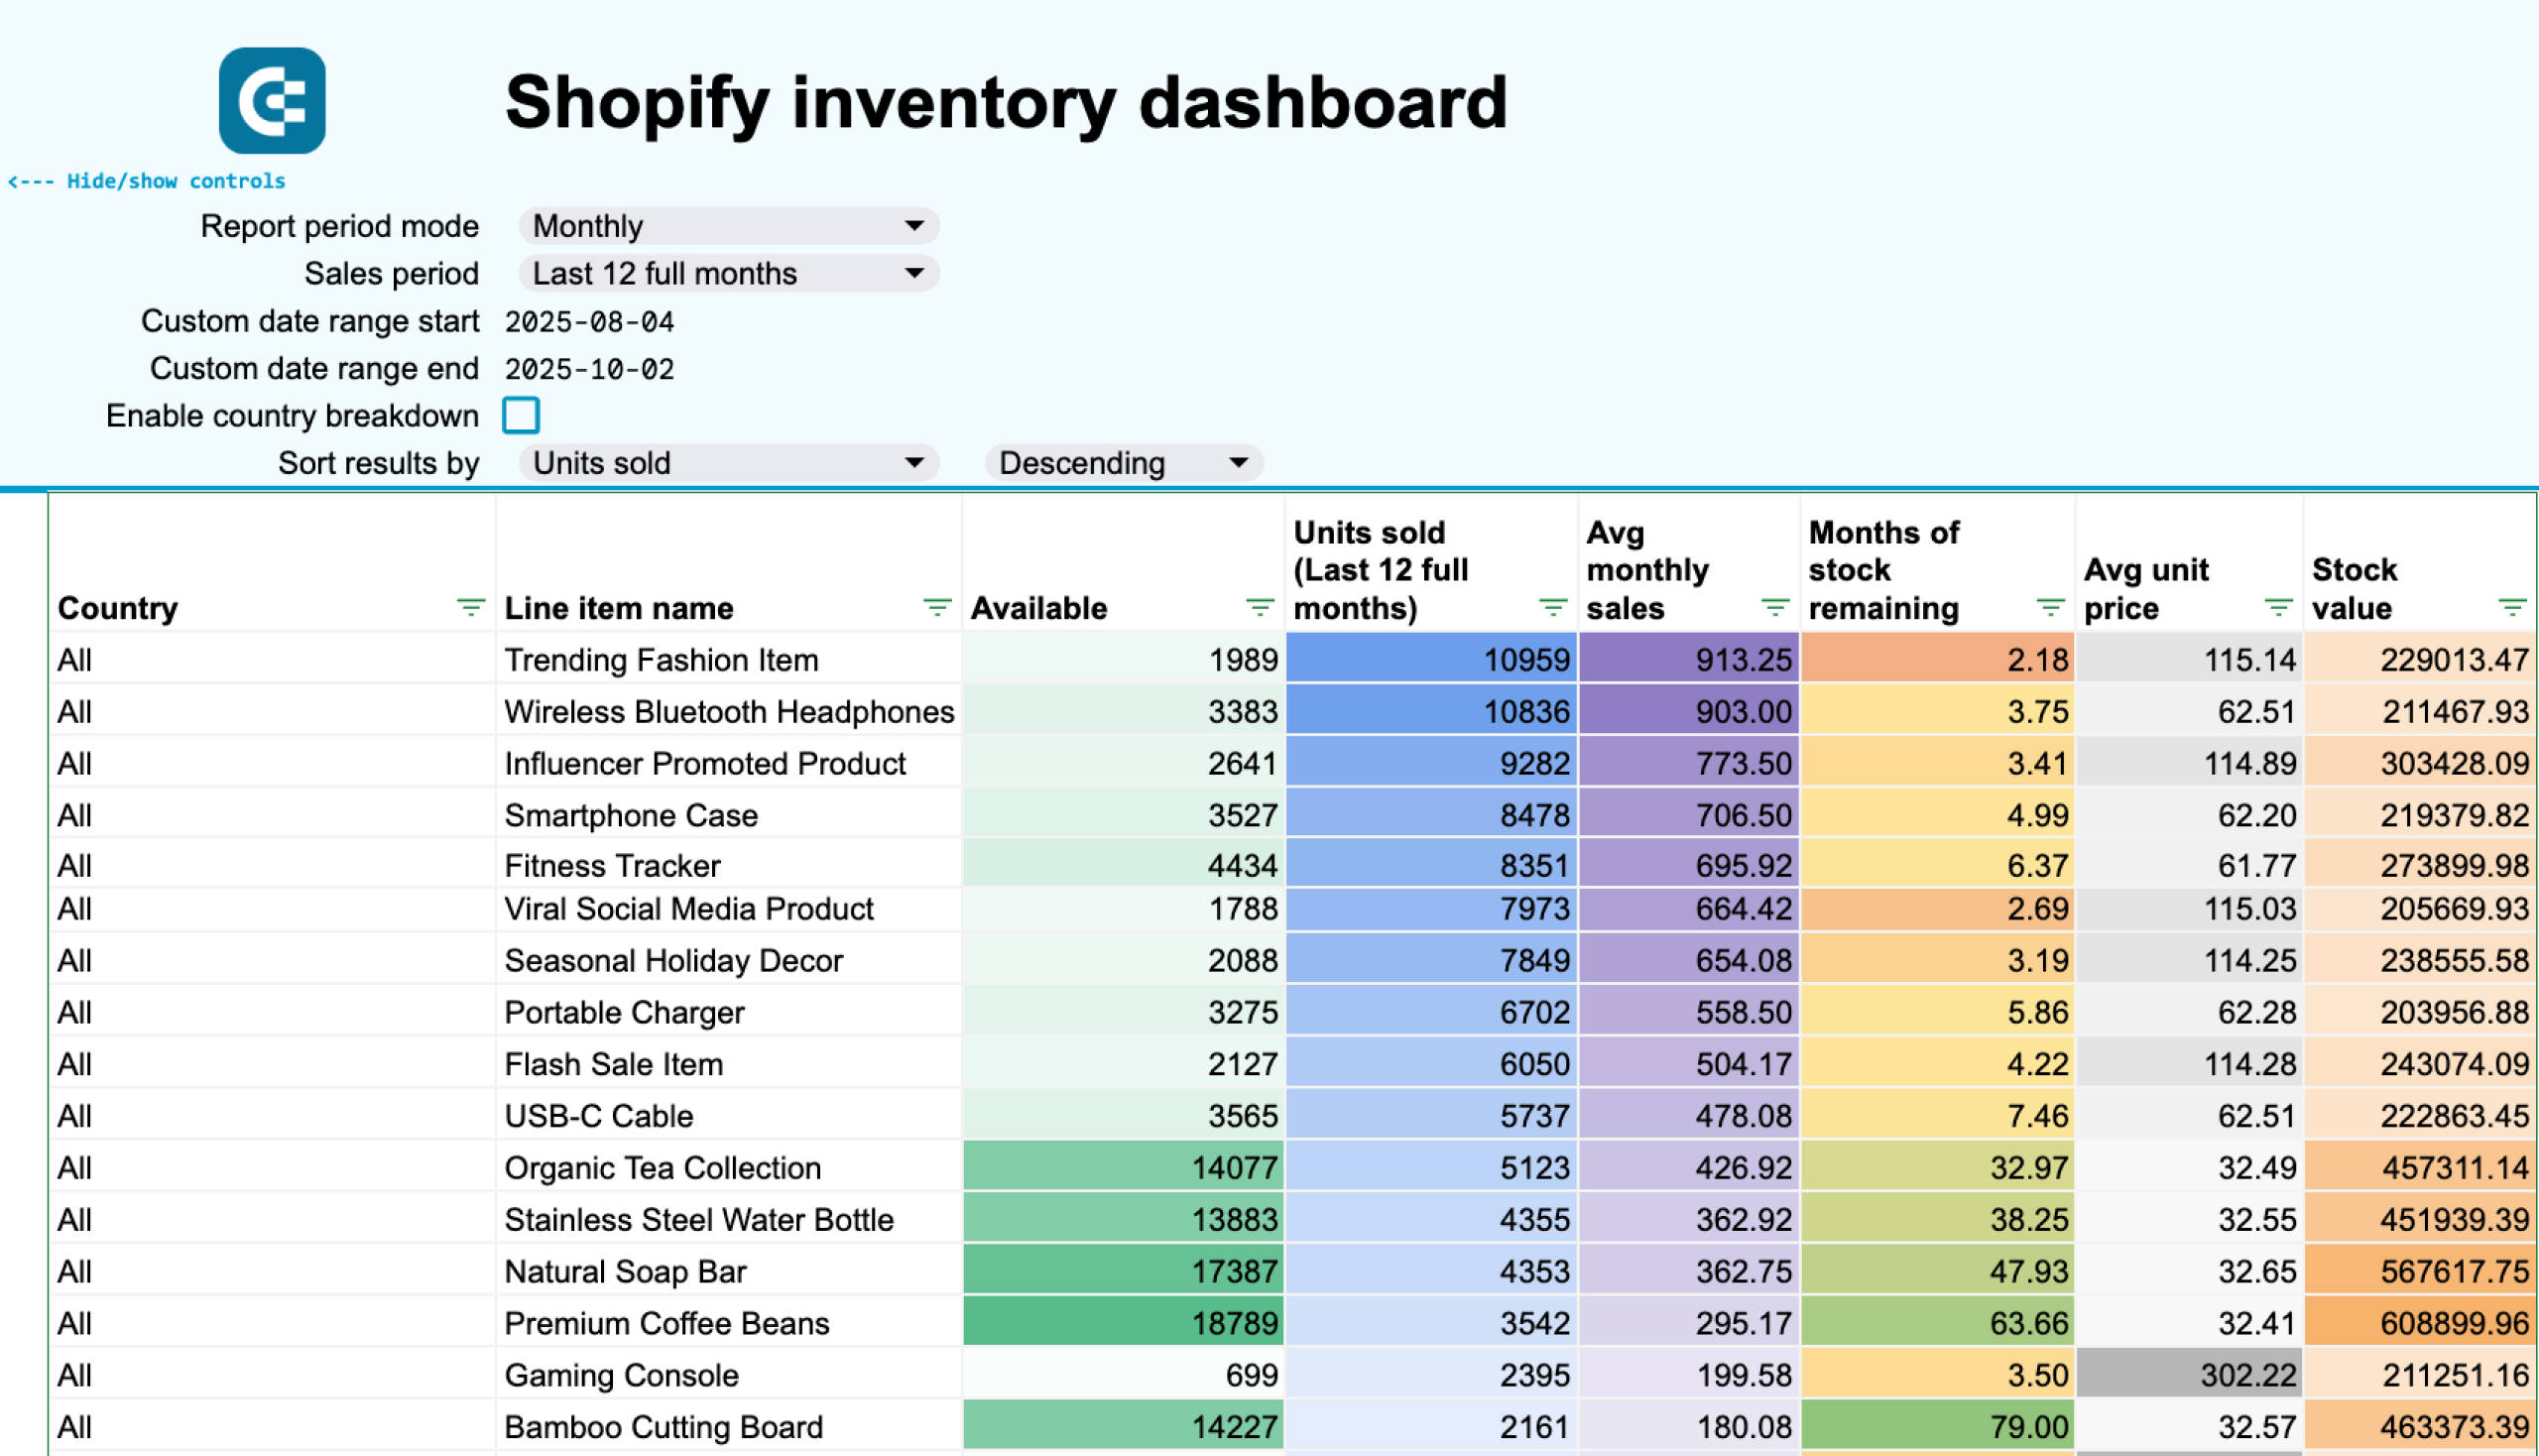
The revenue dashboard for Xero provides comprehensive income monitoring with detailed breakdowns by customers and products over 12-month periods to identify seasonal patterns and growth opportunities. Track overall revenue trends while analyzing which customers contribute most to your business success through targeted revenue contribution analysis. Product performance insights reveal your highest-generating offerings, enabling strategic inventory management and sales focus adjustments. This financial visibility supports better decision-making around customer retention strategies and product development priorities.
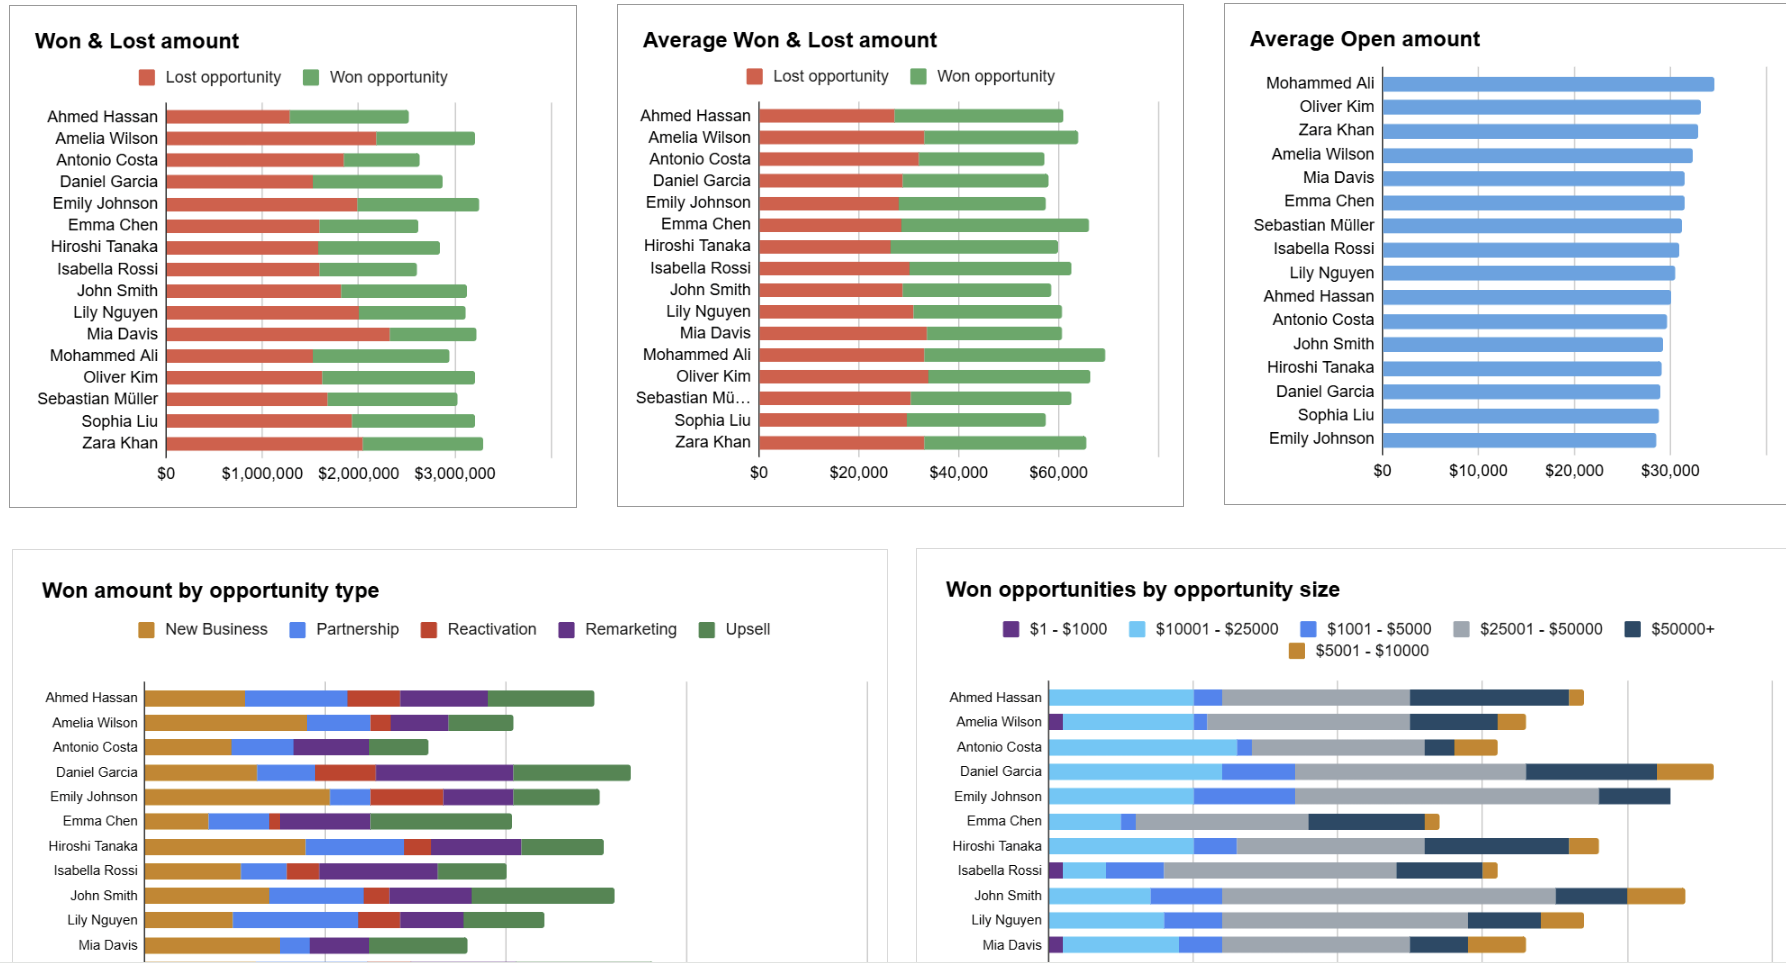
The sales team performance dashboard for Salesforce enables detailed analysis of individual team member effectiveness through win rates, deal volumes, and revenue generation metrics. Compare performance across different deal types, geographic regions, and customer segments to identify patterns that contribute to sales success. Monitor team member specializations and allocate high-value opportunities to your most effective sales representatives based on historical performance data. This insight drives strategic team management decisions and helps optimize sales resource allocation for maximum revenue impact.
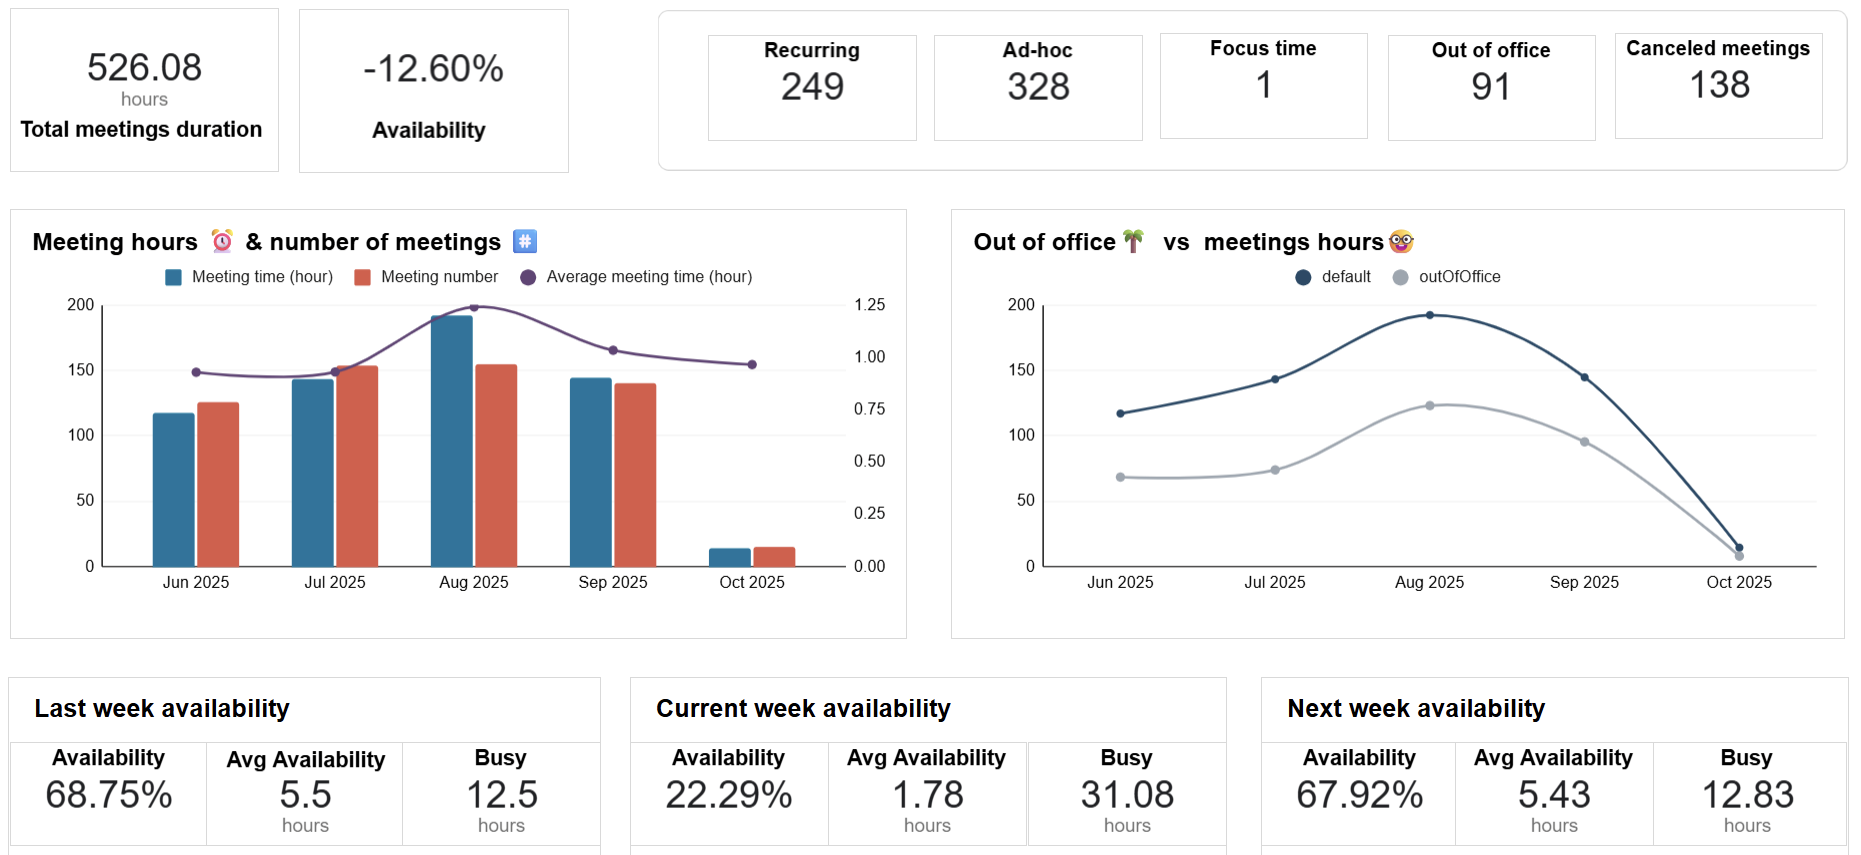
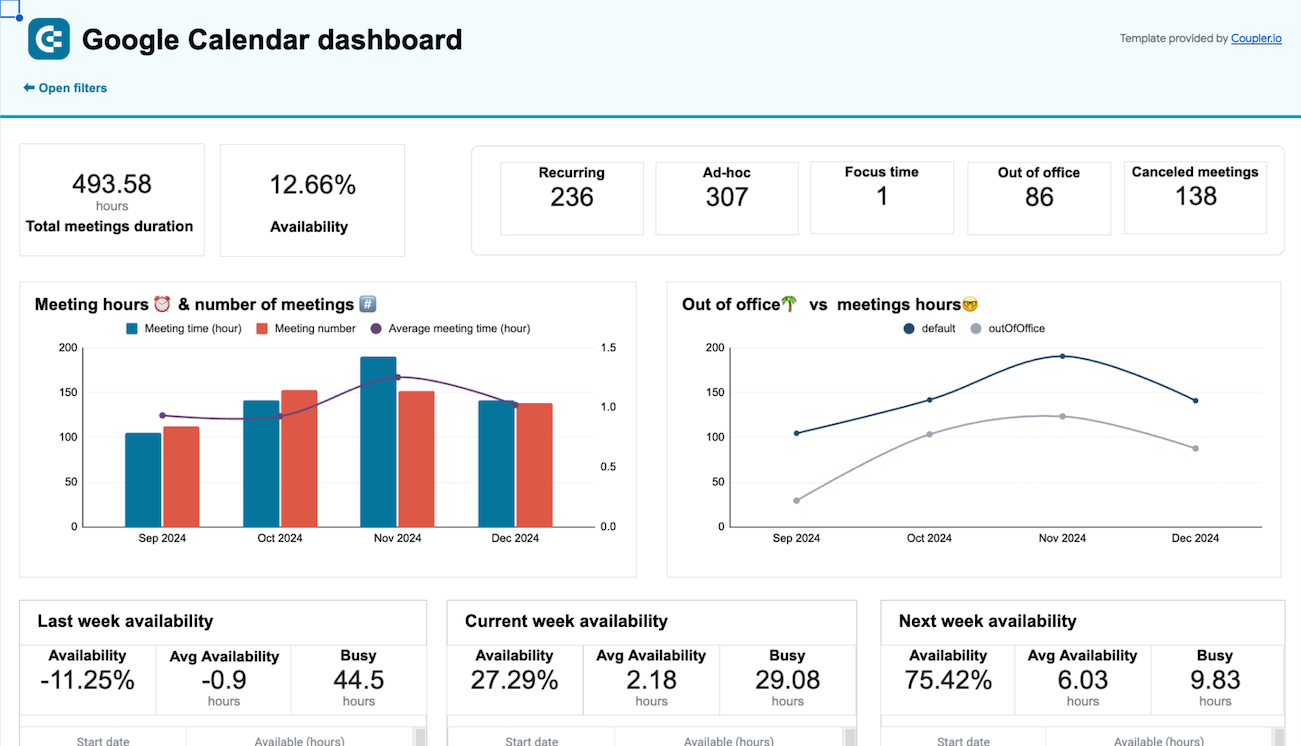
The Google Calendar availability dashboard provides a comprehensive analysis of meeting patterns, time allocation, and schedule efficiency to help optimize productivity and work-life balance. Track total meeting hours, availability percentages, and meeting types across weekly periods to identify time management opportunities. Monitor busy versus available hours with detailed breakdowns by week, enabling better planning for important projects and focused work sessions. This insight helps professionals and managers make data-driven decisions about calendar management and meeting optimization for improved productivity.
How to use the Google Sheets dashboard template?
