SEO dashboard examples and reporting templates
Transform scattered search data into a strategic advantage with automated SEO reporting dashboards. They let you analyze complex search patterns, expose technical barriers, and reveal the exact content driving your visibility. Instead of wrestling with platform limitations and manual exports, gain instant access to actionable insights that connect search visibility directly to business outcomes.
SEO dashboard examples for every need


about your case. It doesn't cost you a penny 😉
What is an SEO dashboard?
For marketers and SEO specialists, custom SEO dashboards eliminate the tedious process of manual data collection and unify disparate metrics that tell the complete story of your search presence. They reveal hidden patterns in keyword performance, highlight critical technical issues before they impact rankings, and track the tangible business impact of your optimization efforts. With the automated connector by Coupler.io, your Looker Studio SEO dashboard stays constantly refreshed. This ensures decisions are based on the relevant data rather than last month's snapshots.

Choose your SEO dashboard template to kick off
What reports should be included on a meaningful SEO dashboard?
The most effective SEO reporting dashboards integrate four critical perspectives that connect technical performance, content effectiveness, user behavior, and competitive positioning. Unlike traditional reports that isolate metrics, these interconnected views reveal the complete search ecosystem.
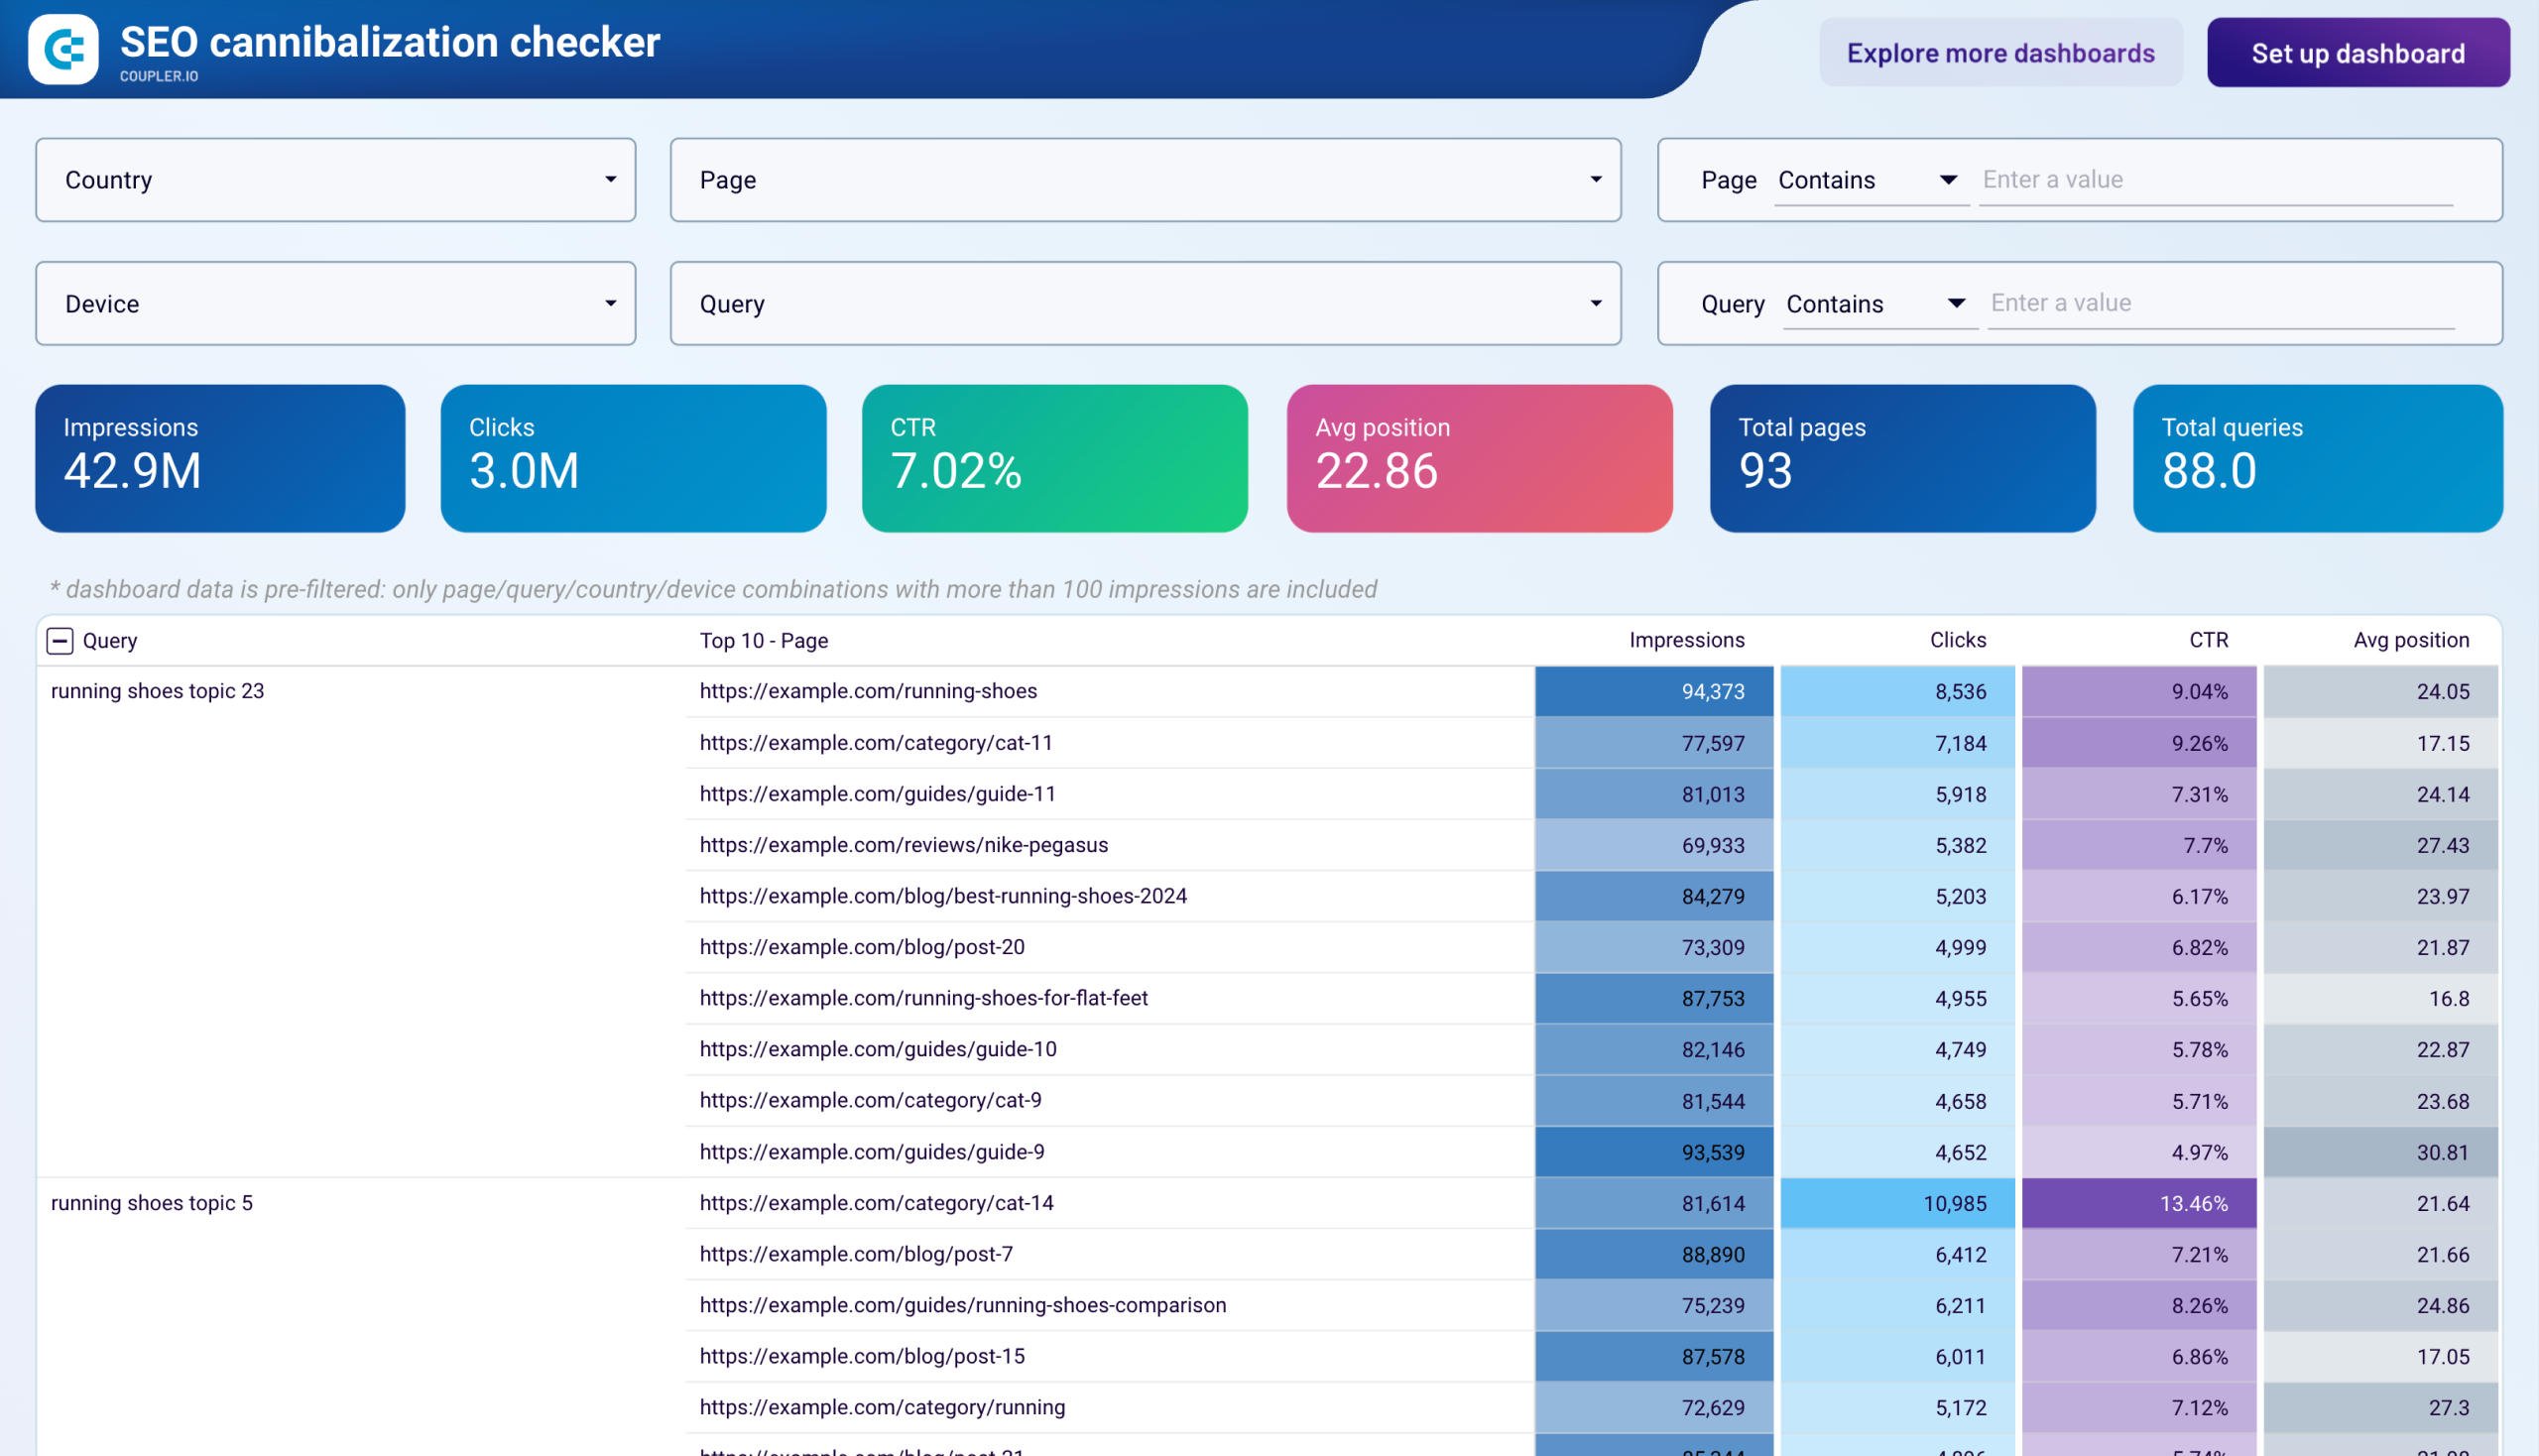
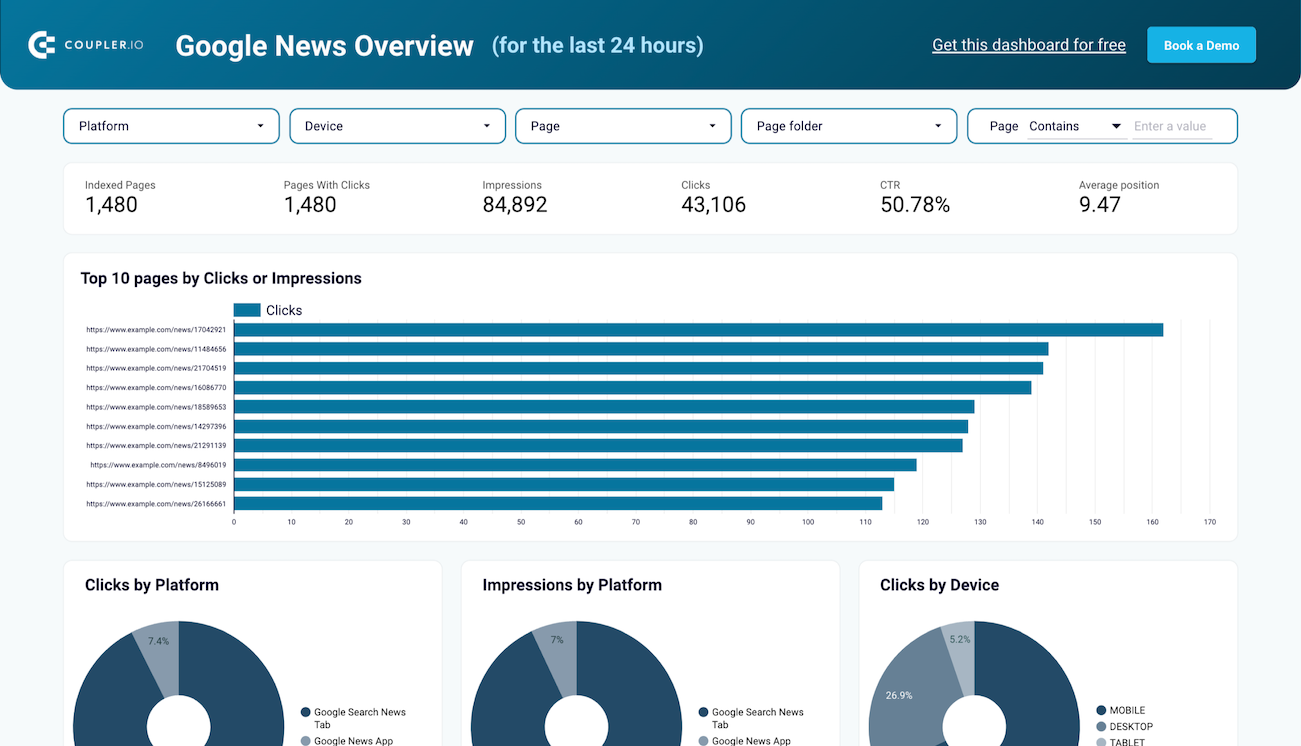
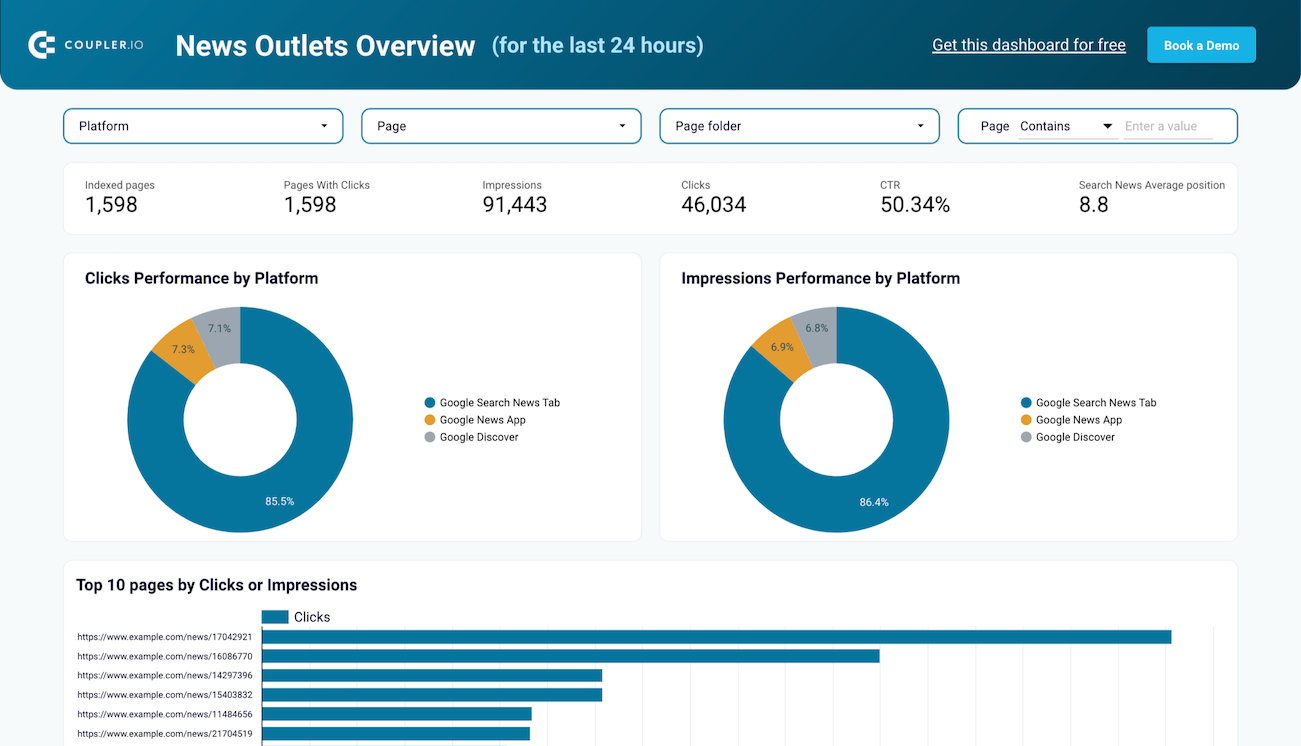
The foundation of SEO intelligence starts with understanding exactly which search terms drive traffic to specific pages. This report organizes your website's pages by clicks with up to 10 queries per page ranked by performance. Unlike basic keyword lists, it reveals the actual language users employ to find your content, exposing relevance gaps, keyword cannibalization, and untapped ranking opportunities. When you see which pages accidentally rank for unrelated terms or which keywords drive traffic to multiple competing pages, your content strategy gains immediate clarity.
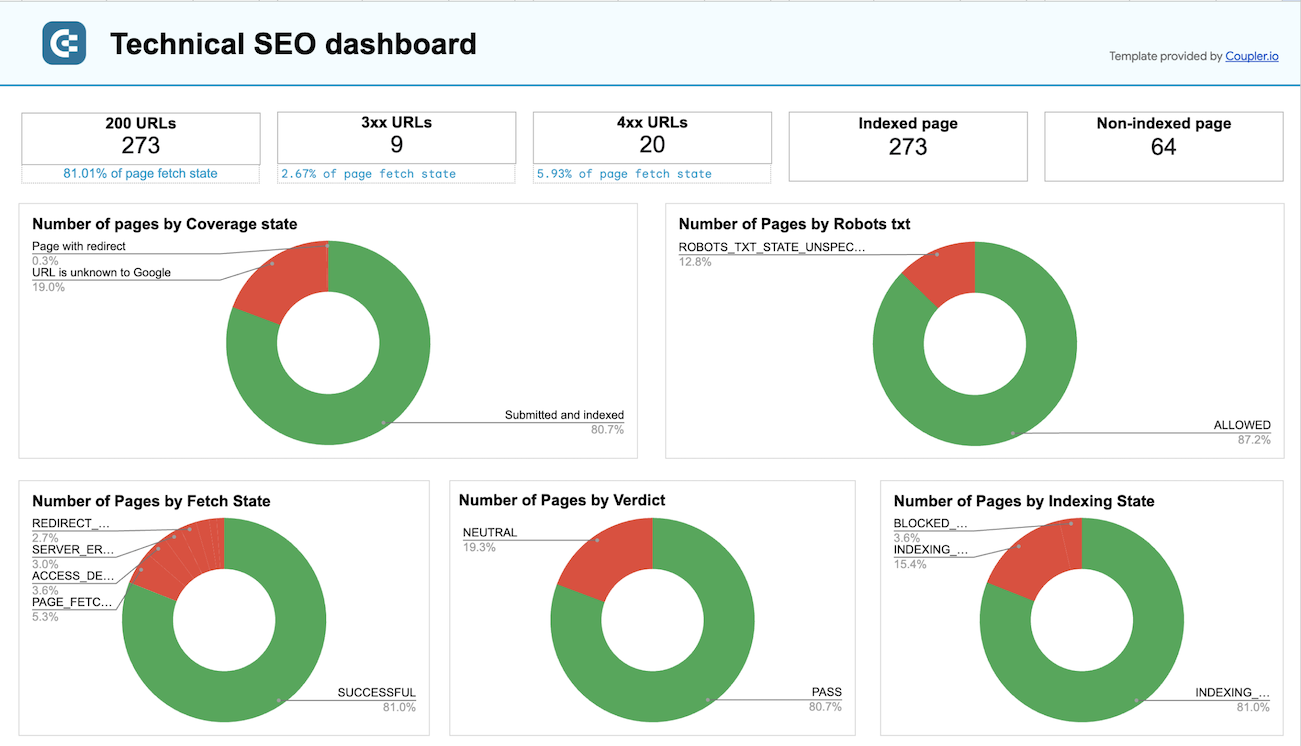
Beneath the surface of your visible SEO performance lies the critical infrastructure that search engines evaluate. This report serves as your early warning system that tracks indexation status, renders problems, and identifies crawlability issues and robots.txt configurations. The categorization of pages by their indexation state and rendering quality shows whether your website is fully accessible to search engines versus content that remains invisible due to technical barriers. This proactive monitoring identifies emerging technical problems before they trigger ranking declines.
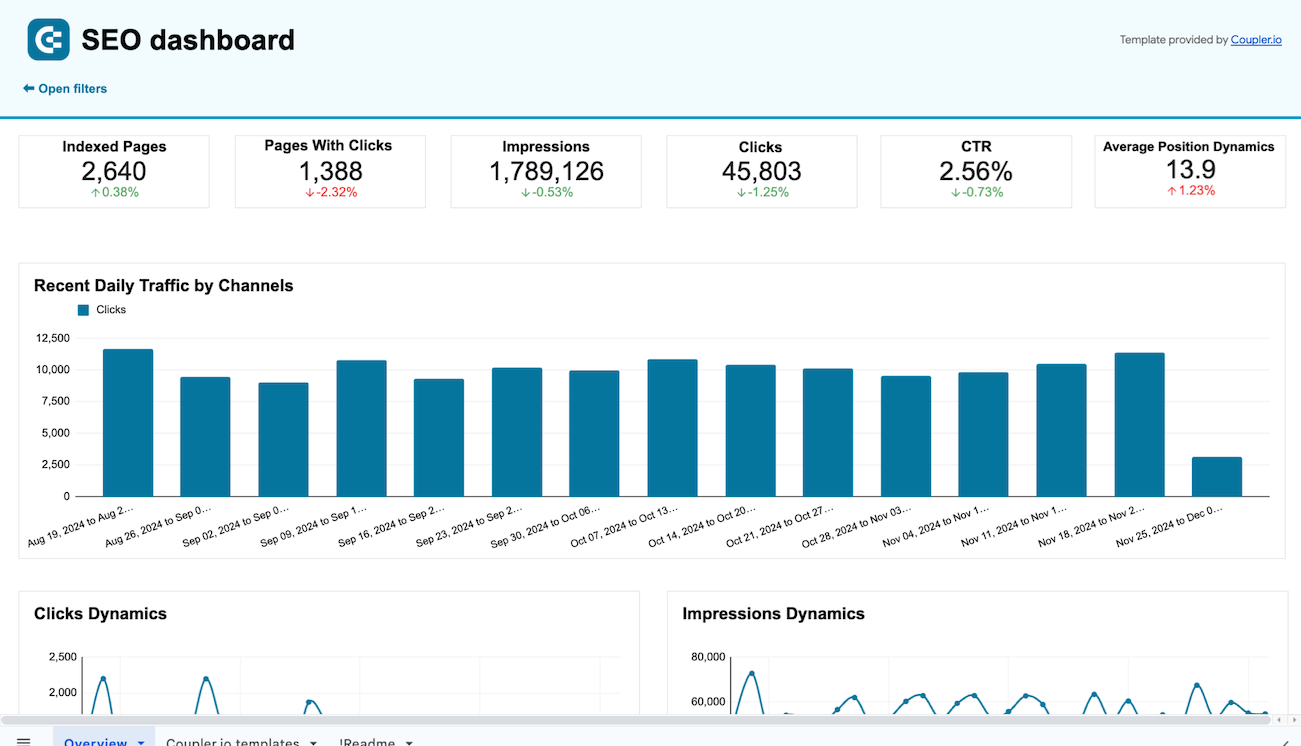
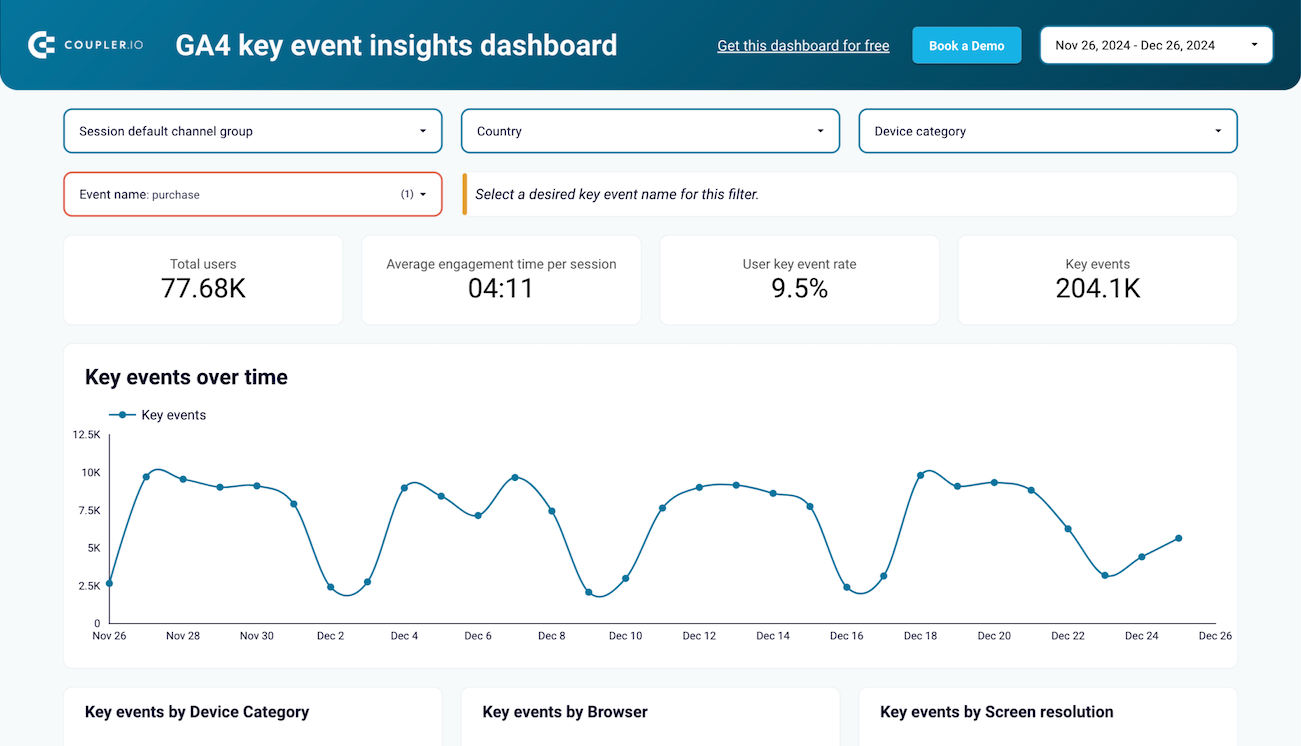
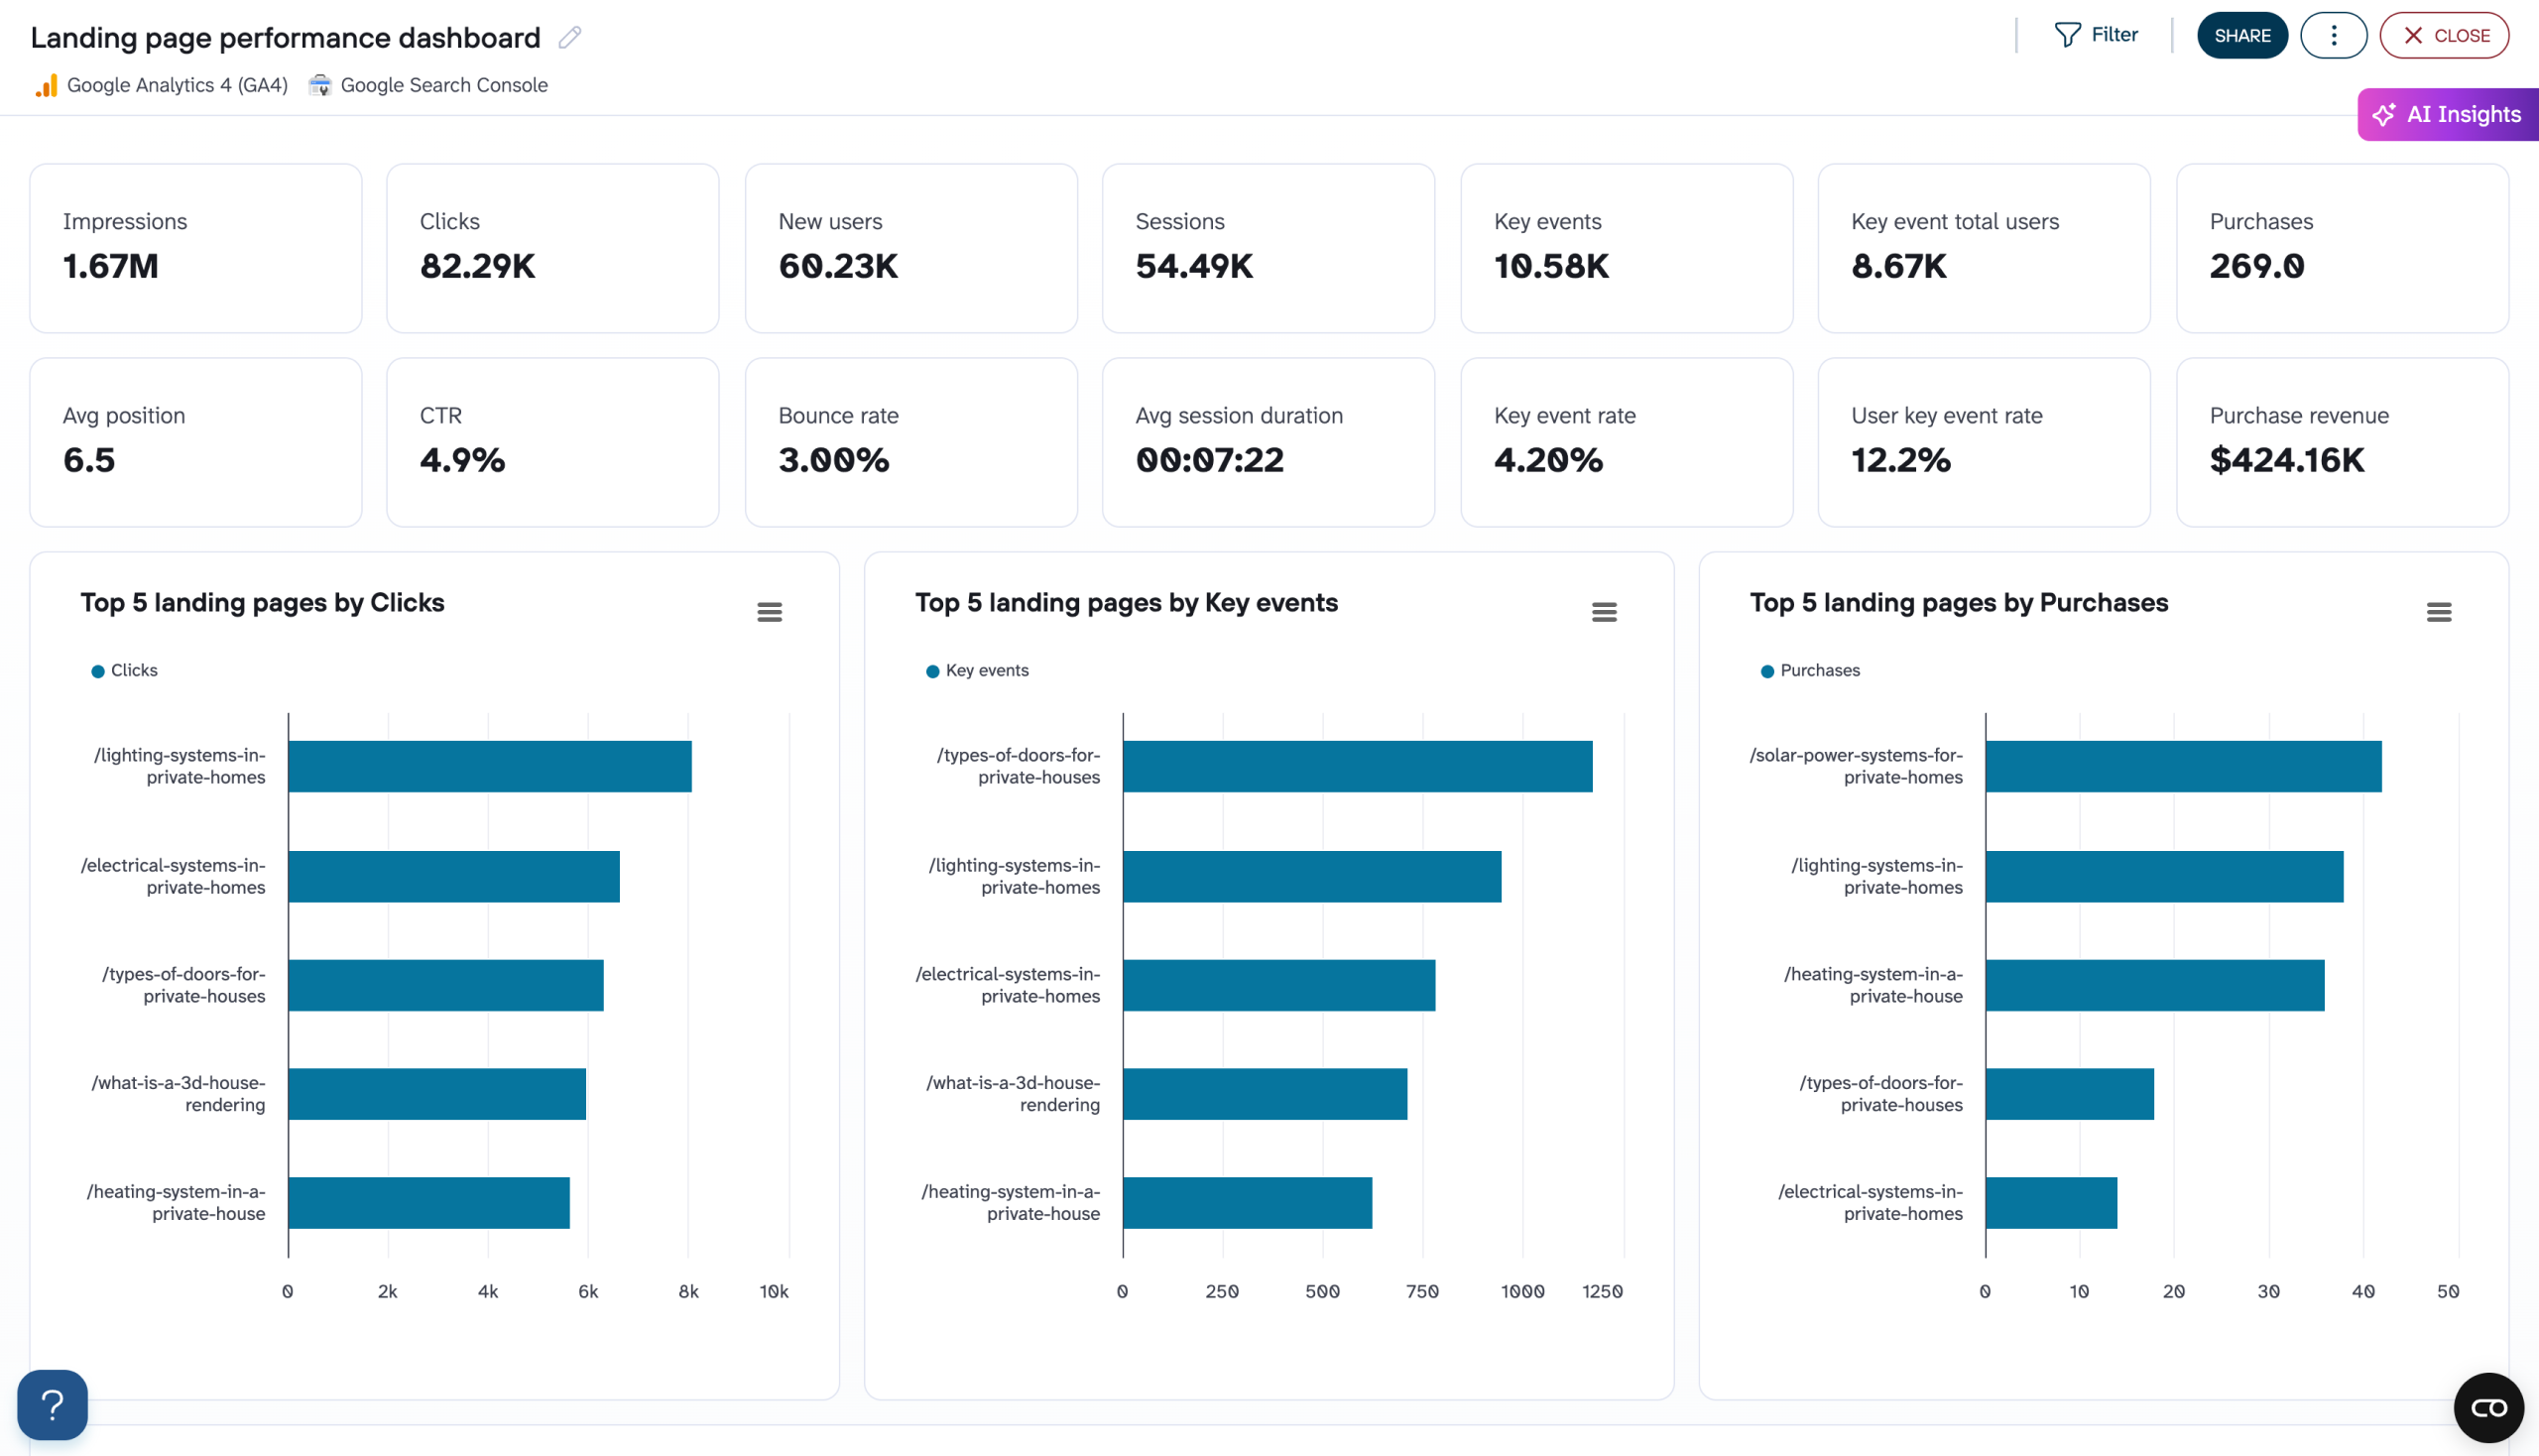
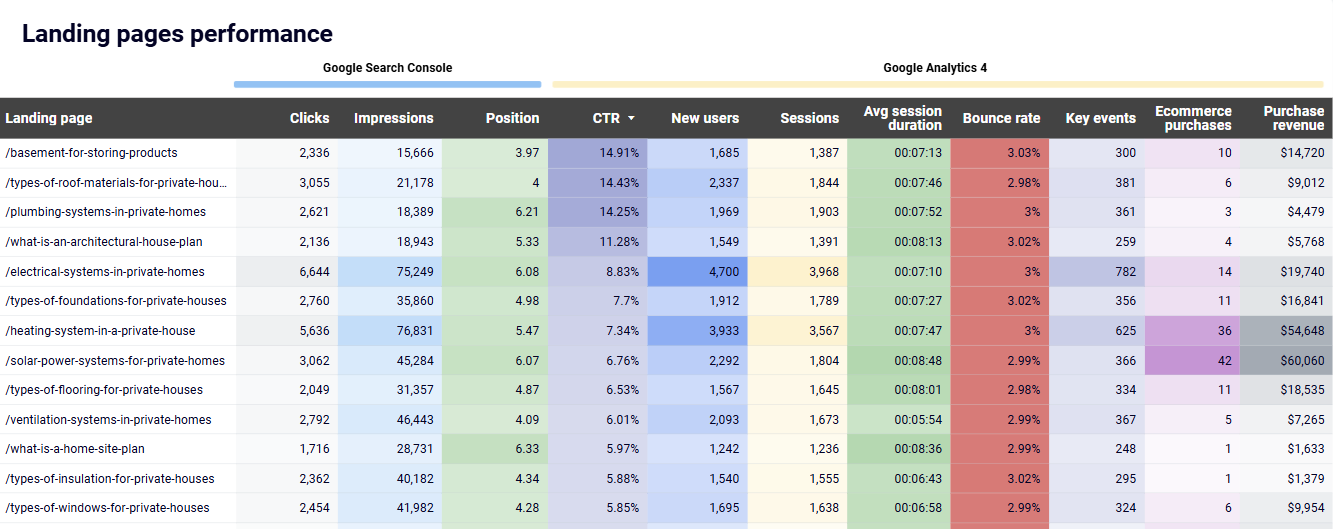
Search visibility only creates value when it drives meaningful user engagement. This report connects search metrics with page performance data for each landing page. By analyzing clicks, impressions, CTR, and position alongside user engagement metrics like bounce rate and session duration, you identify which pages attract search traffic but fail to satisfy user intent. The report highlights your top-performing pages by clicks and engagement. With this insight, you can replicate successful content patterns while flagging underperforming pages for immediate optimization.
Strategic search marketing requires coordinated efforts across both organic and paid channels. This report visualizes the relationship between your SEO performance and PPC campaigns. By tracking impression overlap, click distribution, and position comparisons between organic listings and paid placements, you identify opportunities to optimize budget allocation. You can spend more where organic strength can replace paid spend or where temporary paid campaigns can supplement areas of organic weakness. This holistic view prevents the common pitfall of organic and paid teams working in isolation with conflicting priorities.
What insights you can get with the SEO reporting dashboard
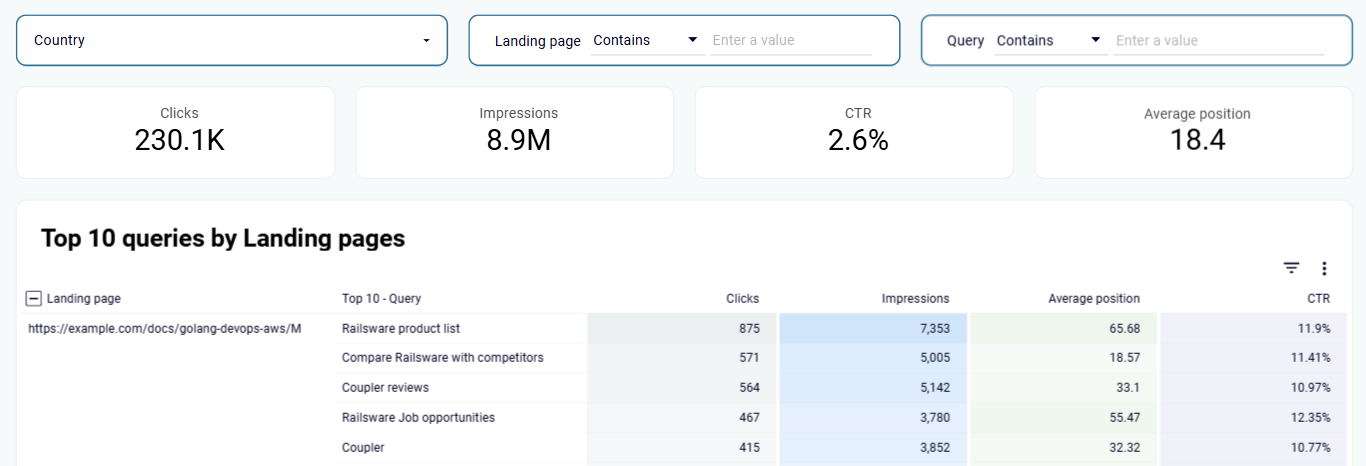
Reveal mismatches between user search intent and your landing page content by examining which queries actually drive traffic to each page. When your product page unexpectedly ranks for how-to queries or your blog content attracts purchase-intent searches, you've discovered critical optimization opportunities. This insight helps restructure content to match user expectations or create dedicated pages for distinct search intents, significantly improving conversion rates and search positioning.
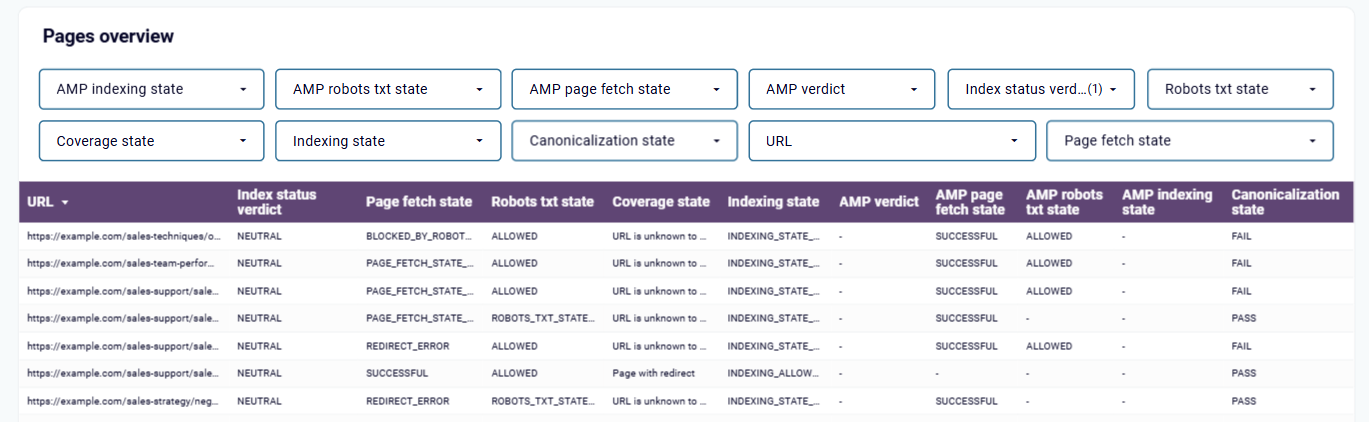
Discover exactly which portions of your website remain unseen by search engines despite being fully published. The SEO dashboard features technical diagnostics track pages trapped in submission limbo, blocked by robots directives, or suffering from rendering failures that prevent indexation. This early warning system identifies precise technical barriers blocking your content from search results, often revealing that up to 30% of website content never appears in search due to fixable technical issues.
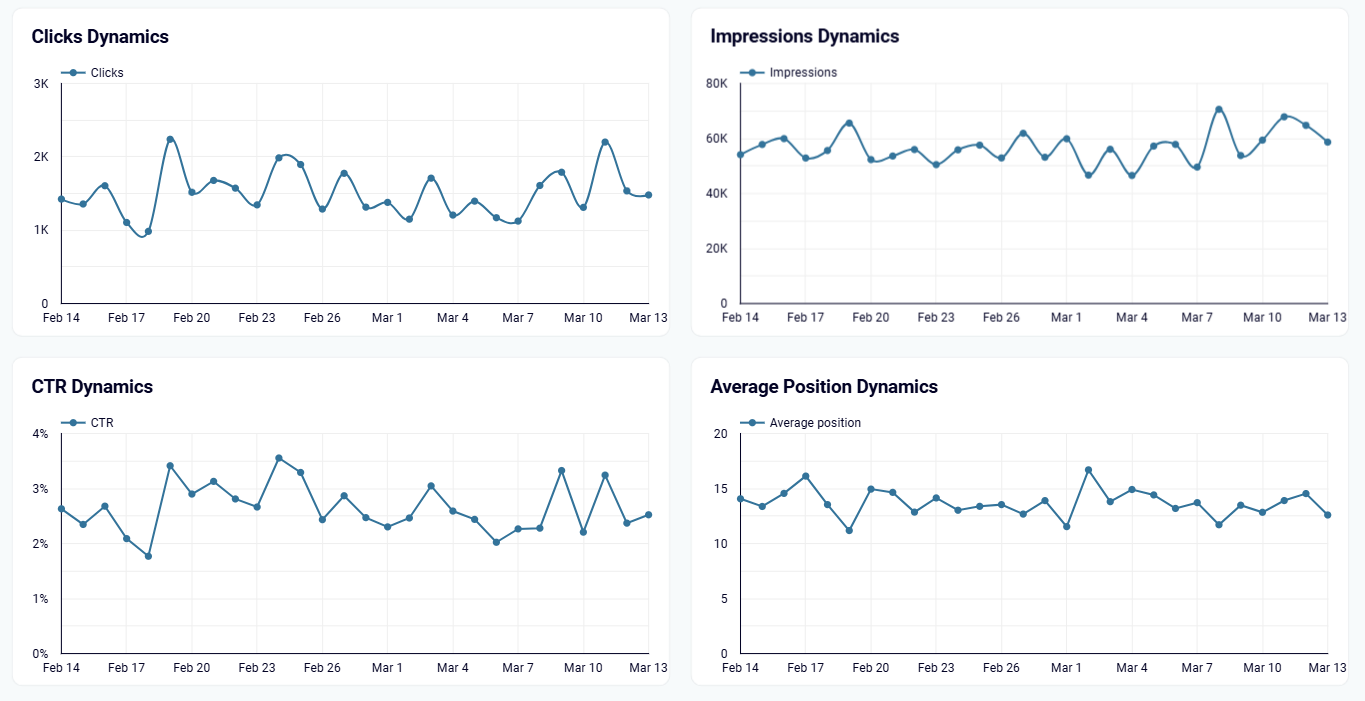
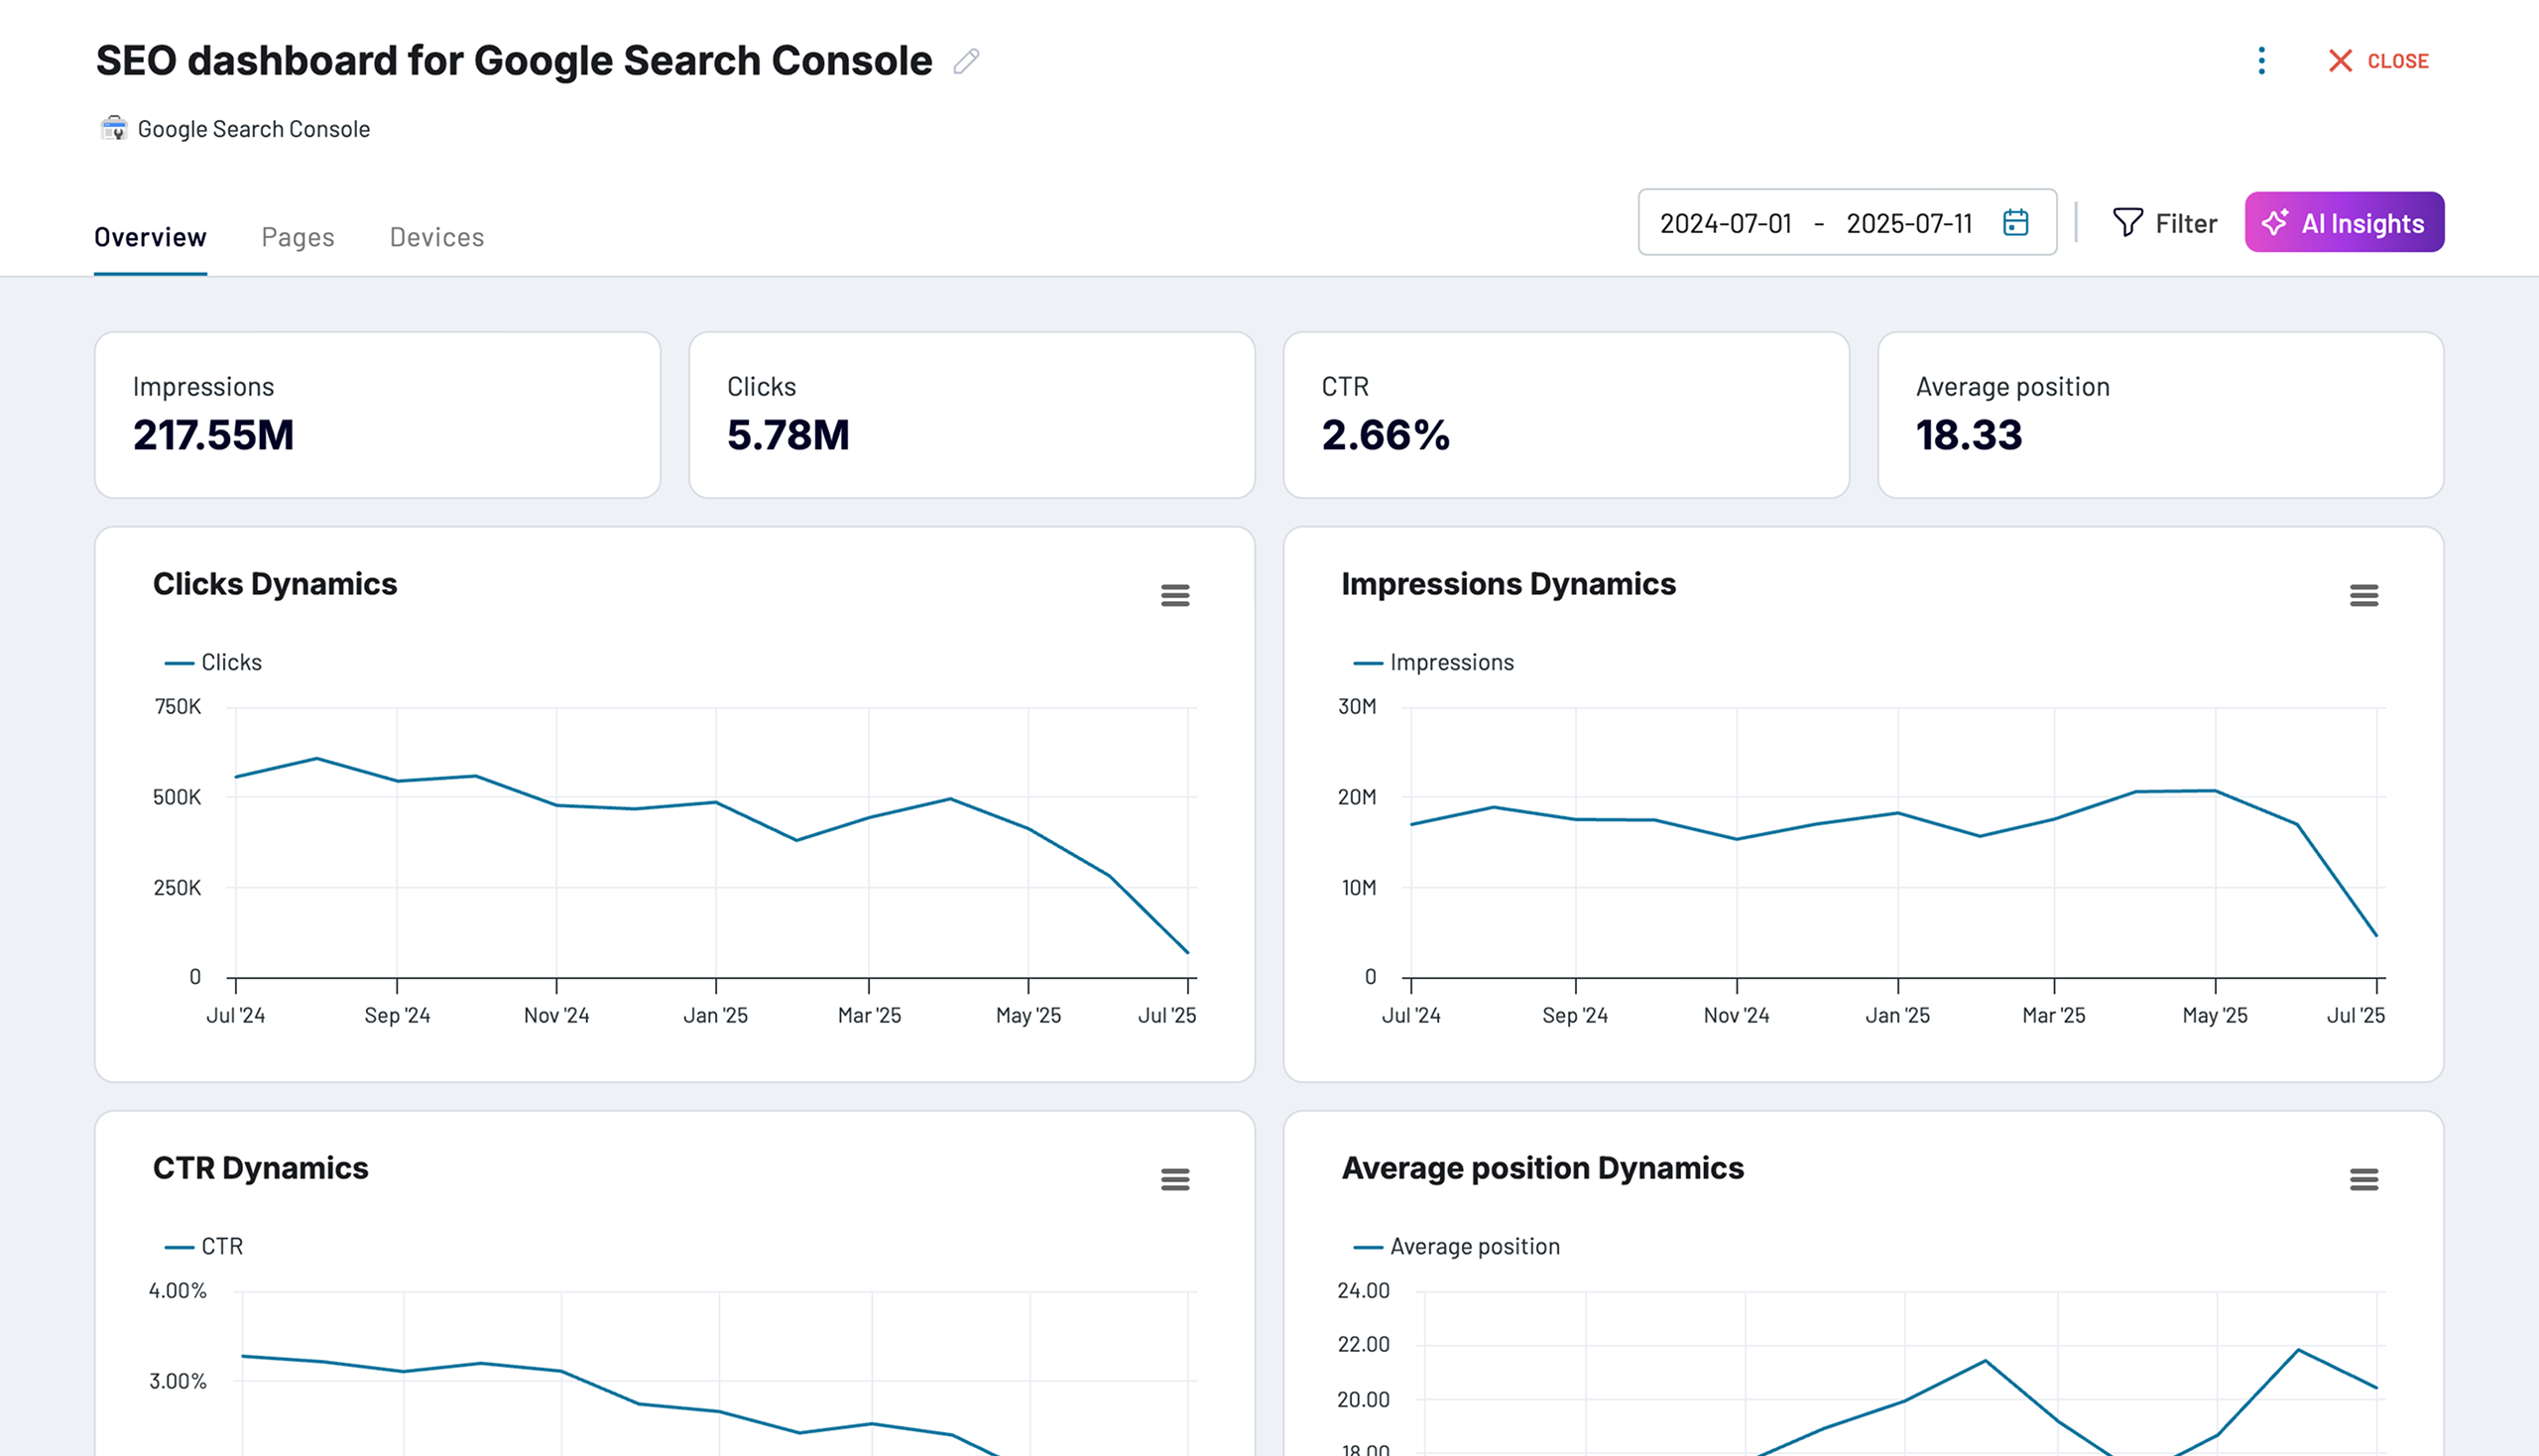
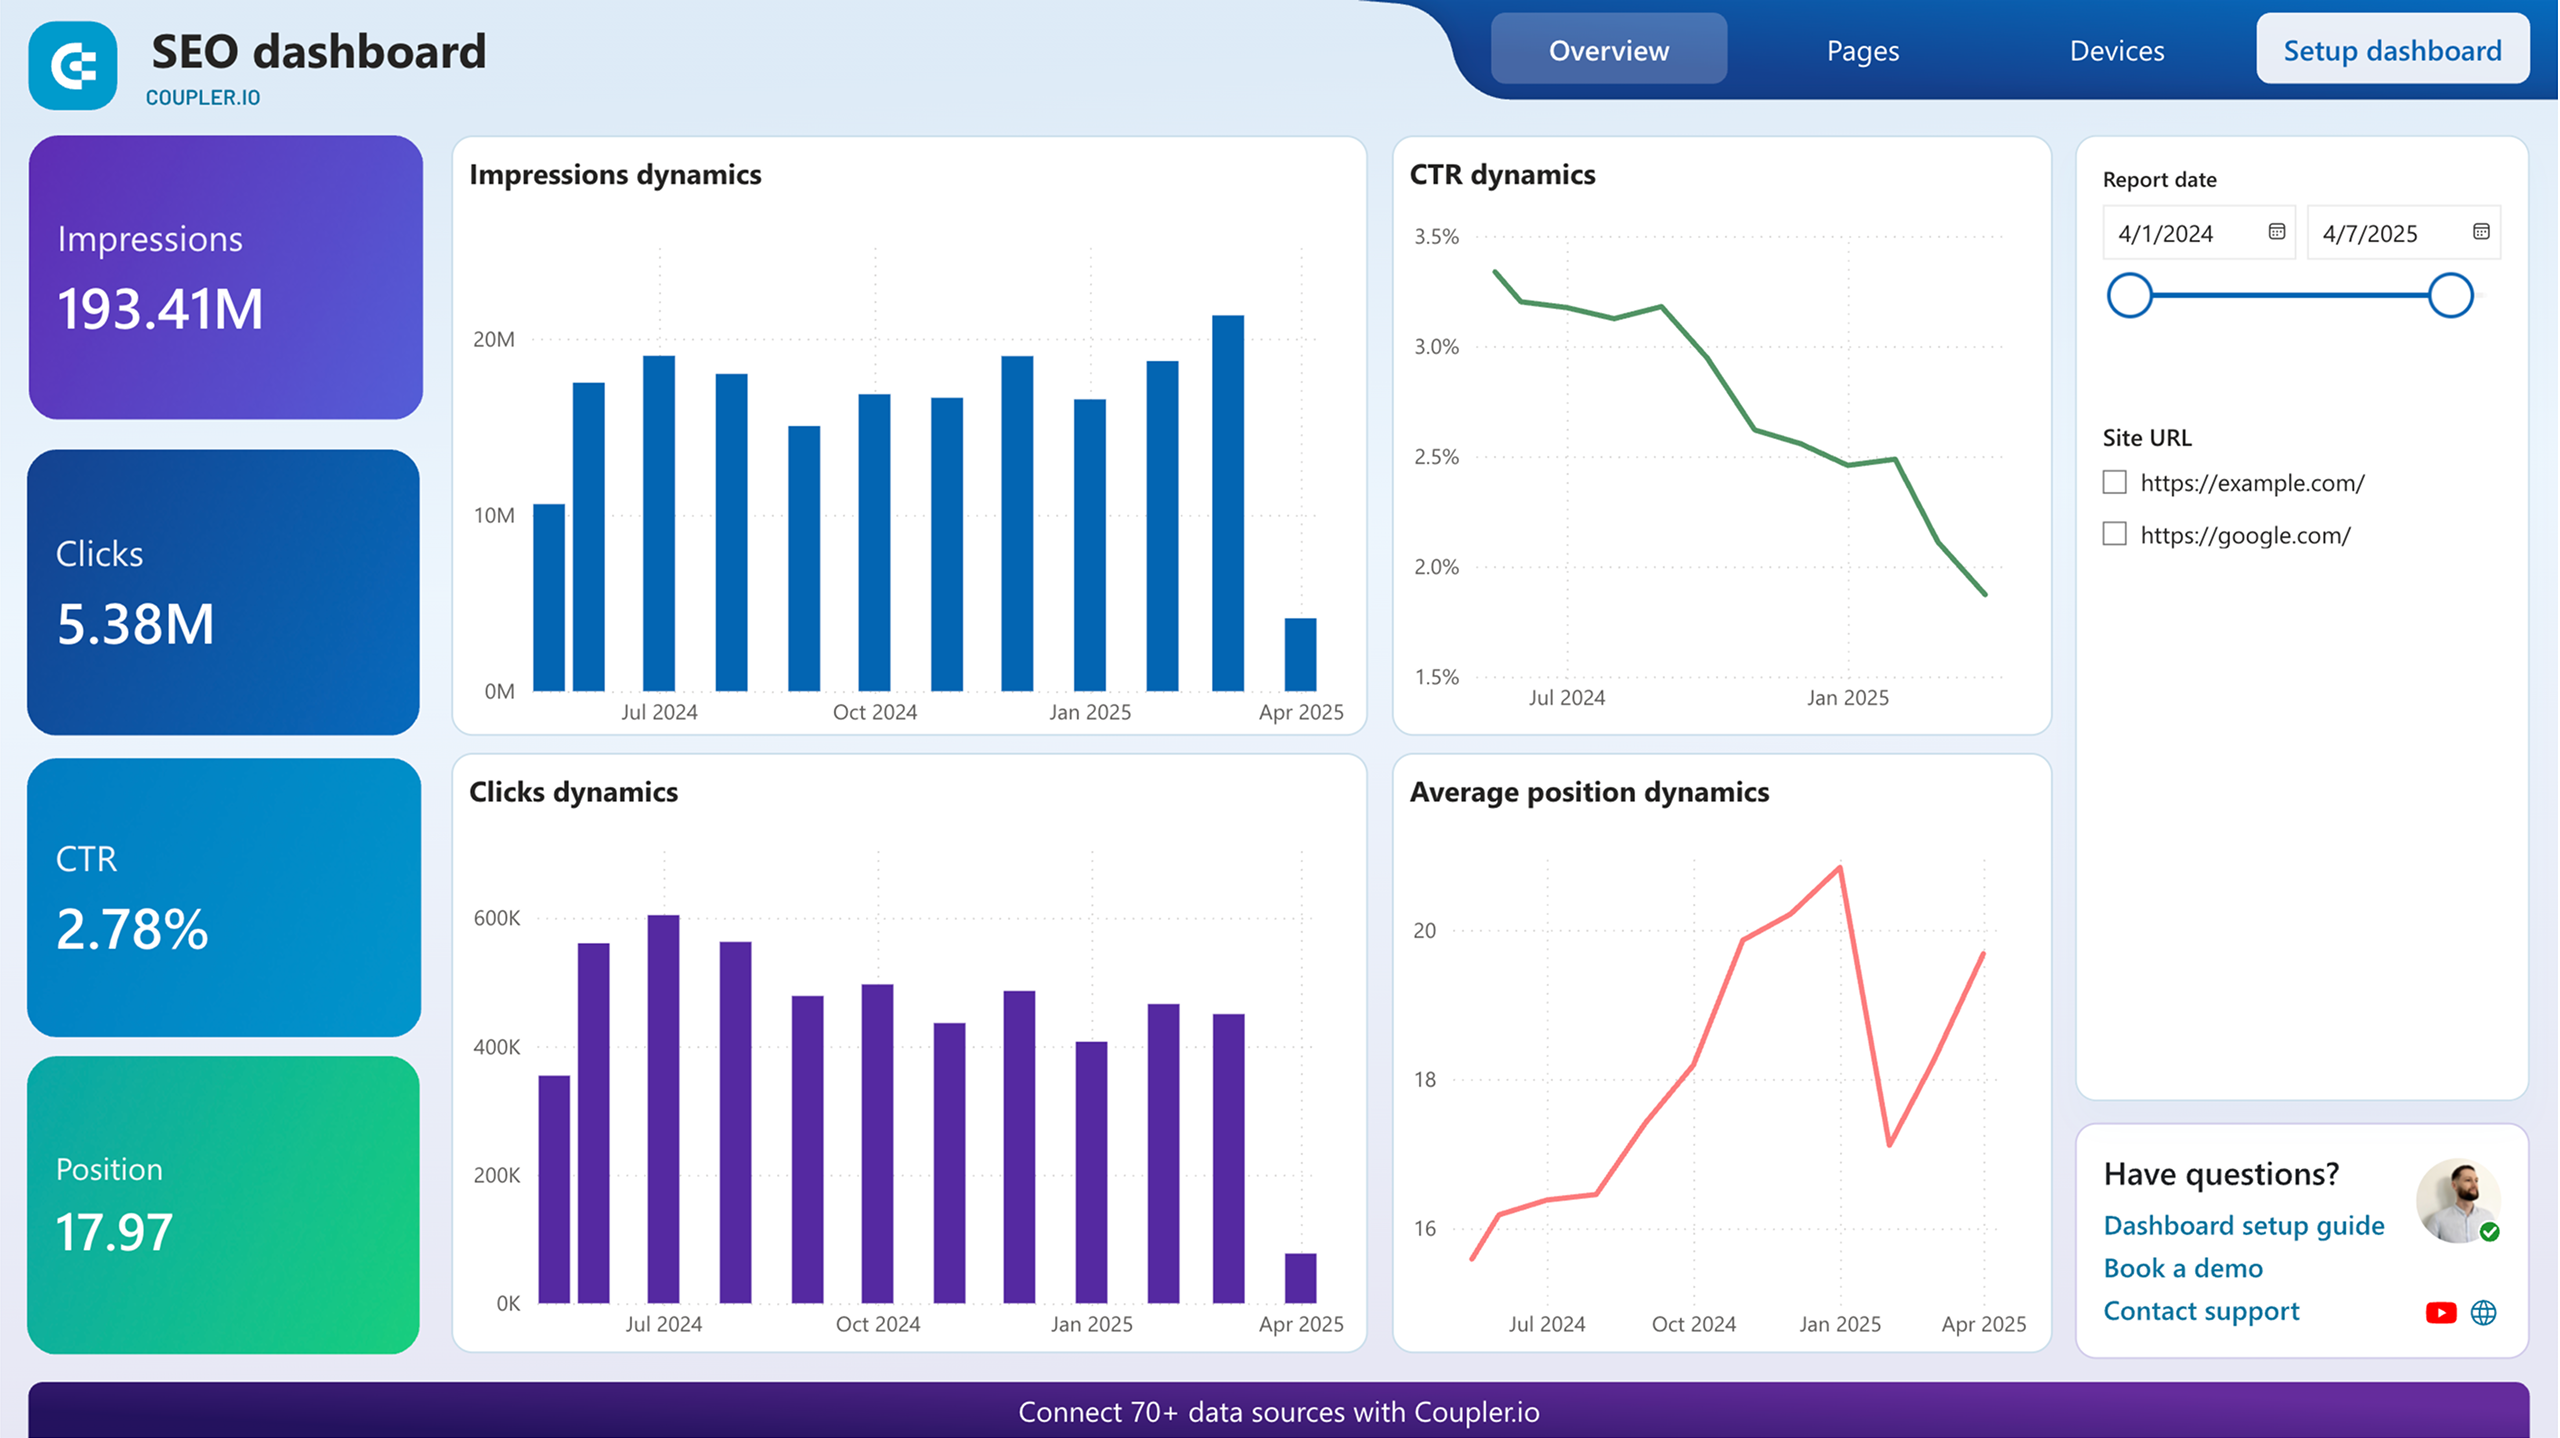
Map the precise impact of algorithm updates, content changes, and competitor movements through multi-dimensional trend analysis. Unlike static reports, the dashboard visualizes the correlation between position changes, click fluctuations, and impression growth across customizable time periods. This dynamic perspective transforms abstract SEO metrics into clear performance patterns, revealing exactly when changes began affecting traffic and which initiatives actually moved the needle on search visibility.
Uncover which pages successfully convert search visibility into meaningful user engagement. The SEO dashboard template connects search metrics with page performance indicators, revealing which landing pages fail to satisfy user expectations despite strong search visibility. This precise diagnostic shows which content requires immediate optimization to improve engagement metrics and better serve the search intent that's driving traffic, transforming ranking success into actual business outcomes.
How to create SEO dashboards?

Metrics you can track with the SEO dashboard template
Request custom dashboard
From building custom dashboards to setting up data analytics from scratch, we're here to help you succeed. Contact us to discuss your case and possible solutions
Contact us