Accounts payable dashboard examples and reporting templates
The accounts payable dashboard provided by Coupler.io is a pre-set template that transfers your billing data to Looker Studio with no code. Use the pre-built connectors to QuickBooks and Xero and set them up in a few clicks using the enclosed instructions. See how your financial data flows into a dashboard and gets transformed into insightful information.
Accounts Payable dashboards for every need


about your case. It doesn't cost you a penny 😉
Choose your accounts payable dashboard template to kick off
What is an accounts payable dashboard?
This template also provides a 360-degree view of the accounts payable landscape. You can track unpaid amounts with the highest value and see which vendor they are associated with. It’s also possible to review the paid bills and define your debt repayment trends. All these insights are provided in a clear and digestible format, saving you time and effort in comprehending complex financial information. You can easily share these findings with other team members across your organization or with external stakeholders. The accounts payable dashboard template is your go-to solution for prioritizing bill payments and budget planning.

What reports should be included on a meaningful accounts payable dashboard
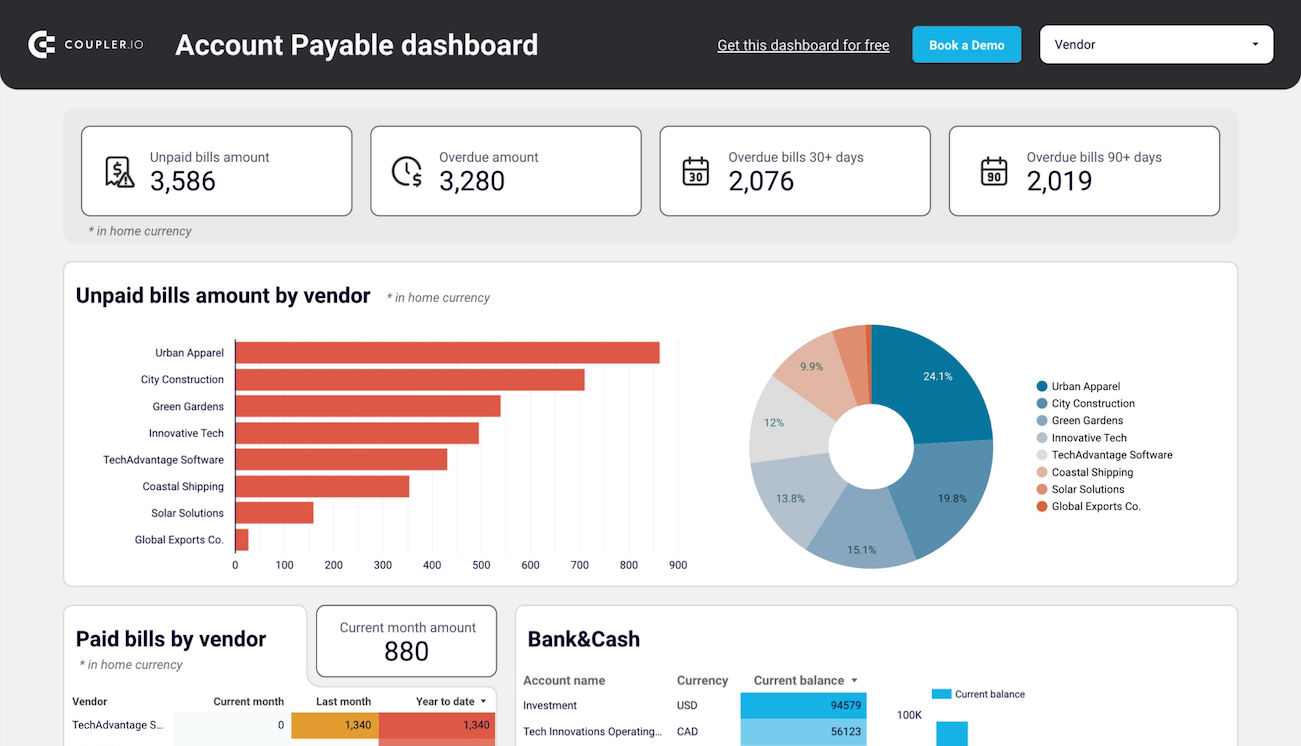
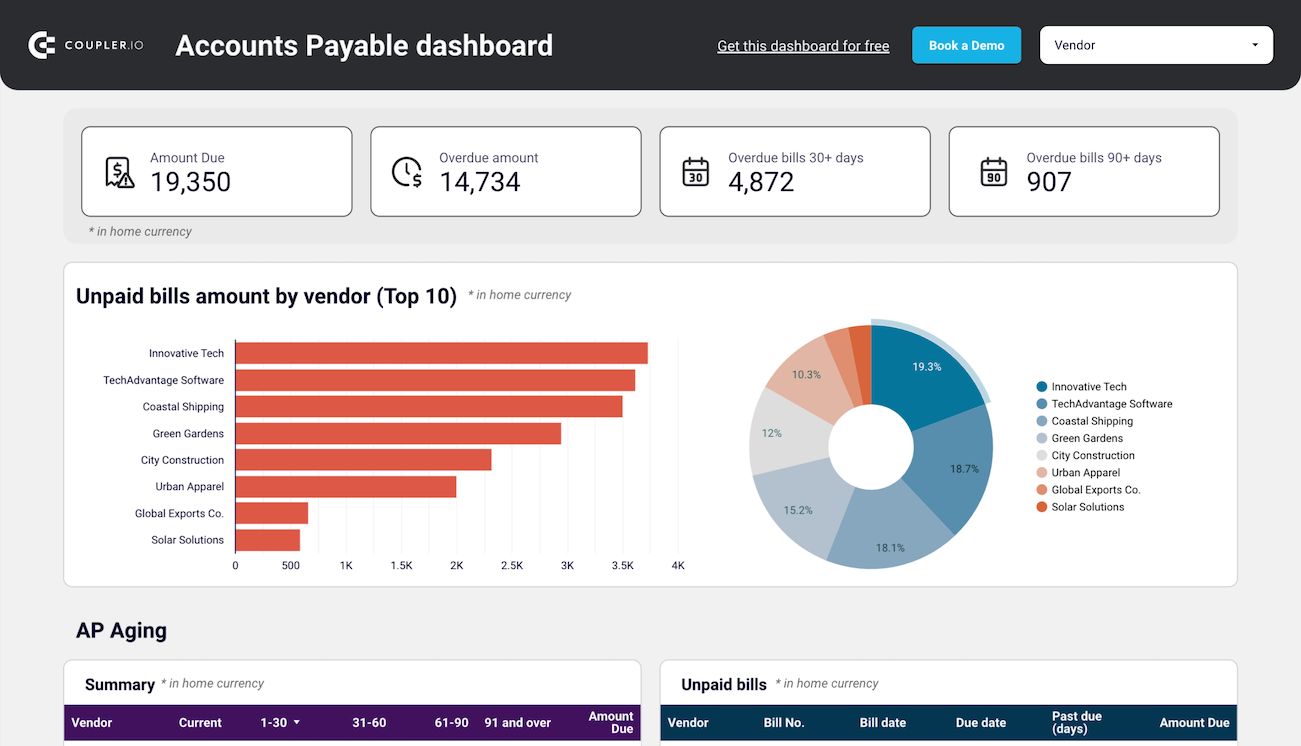
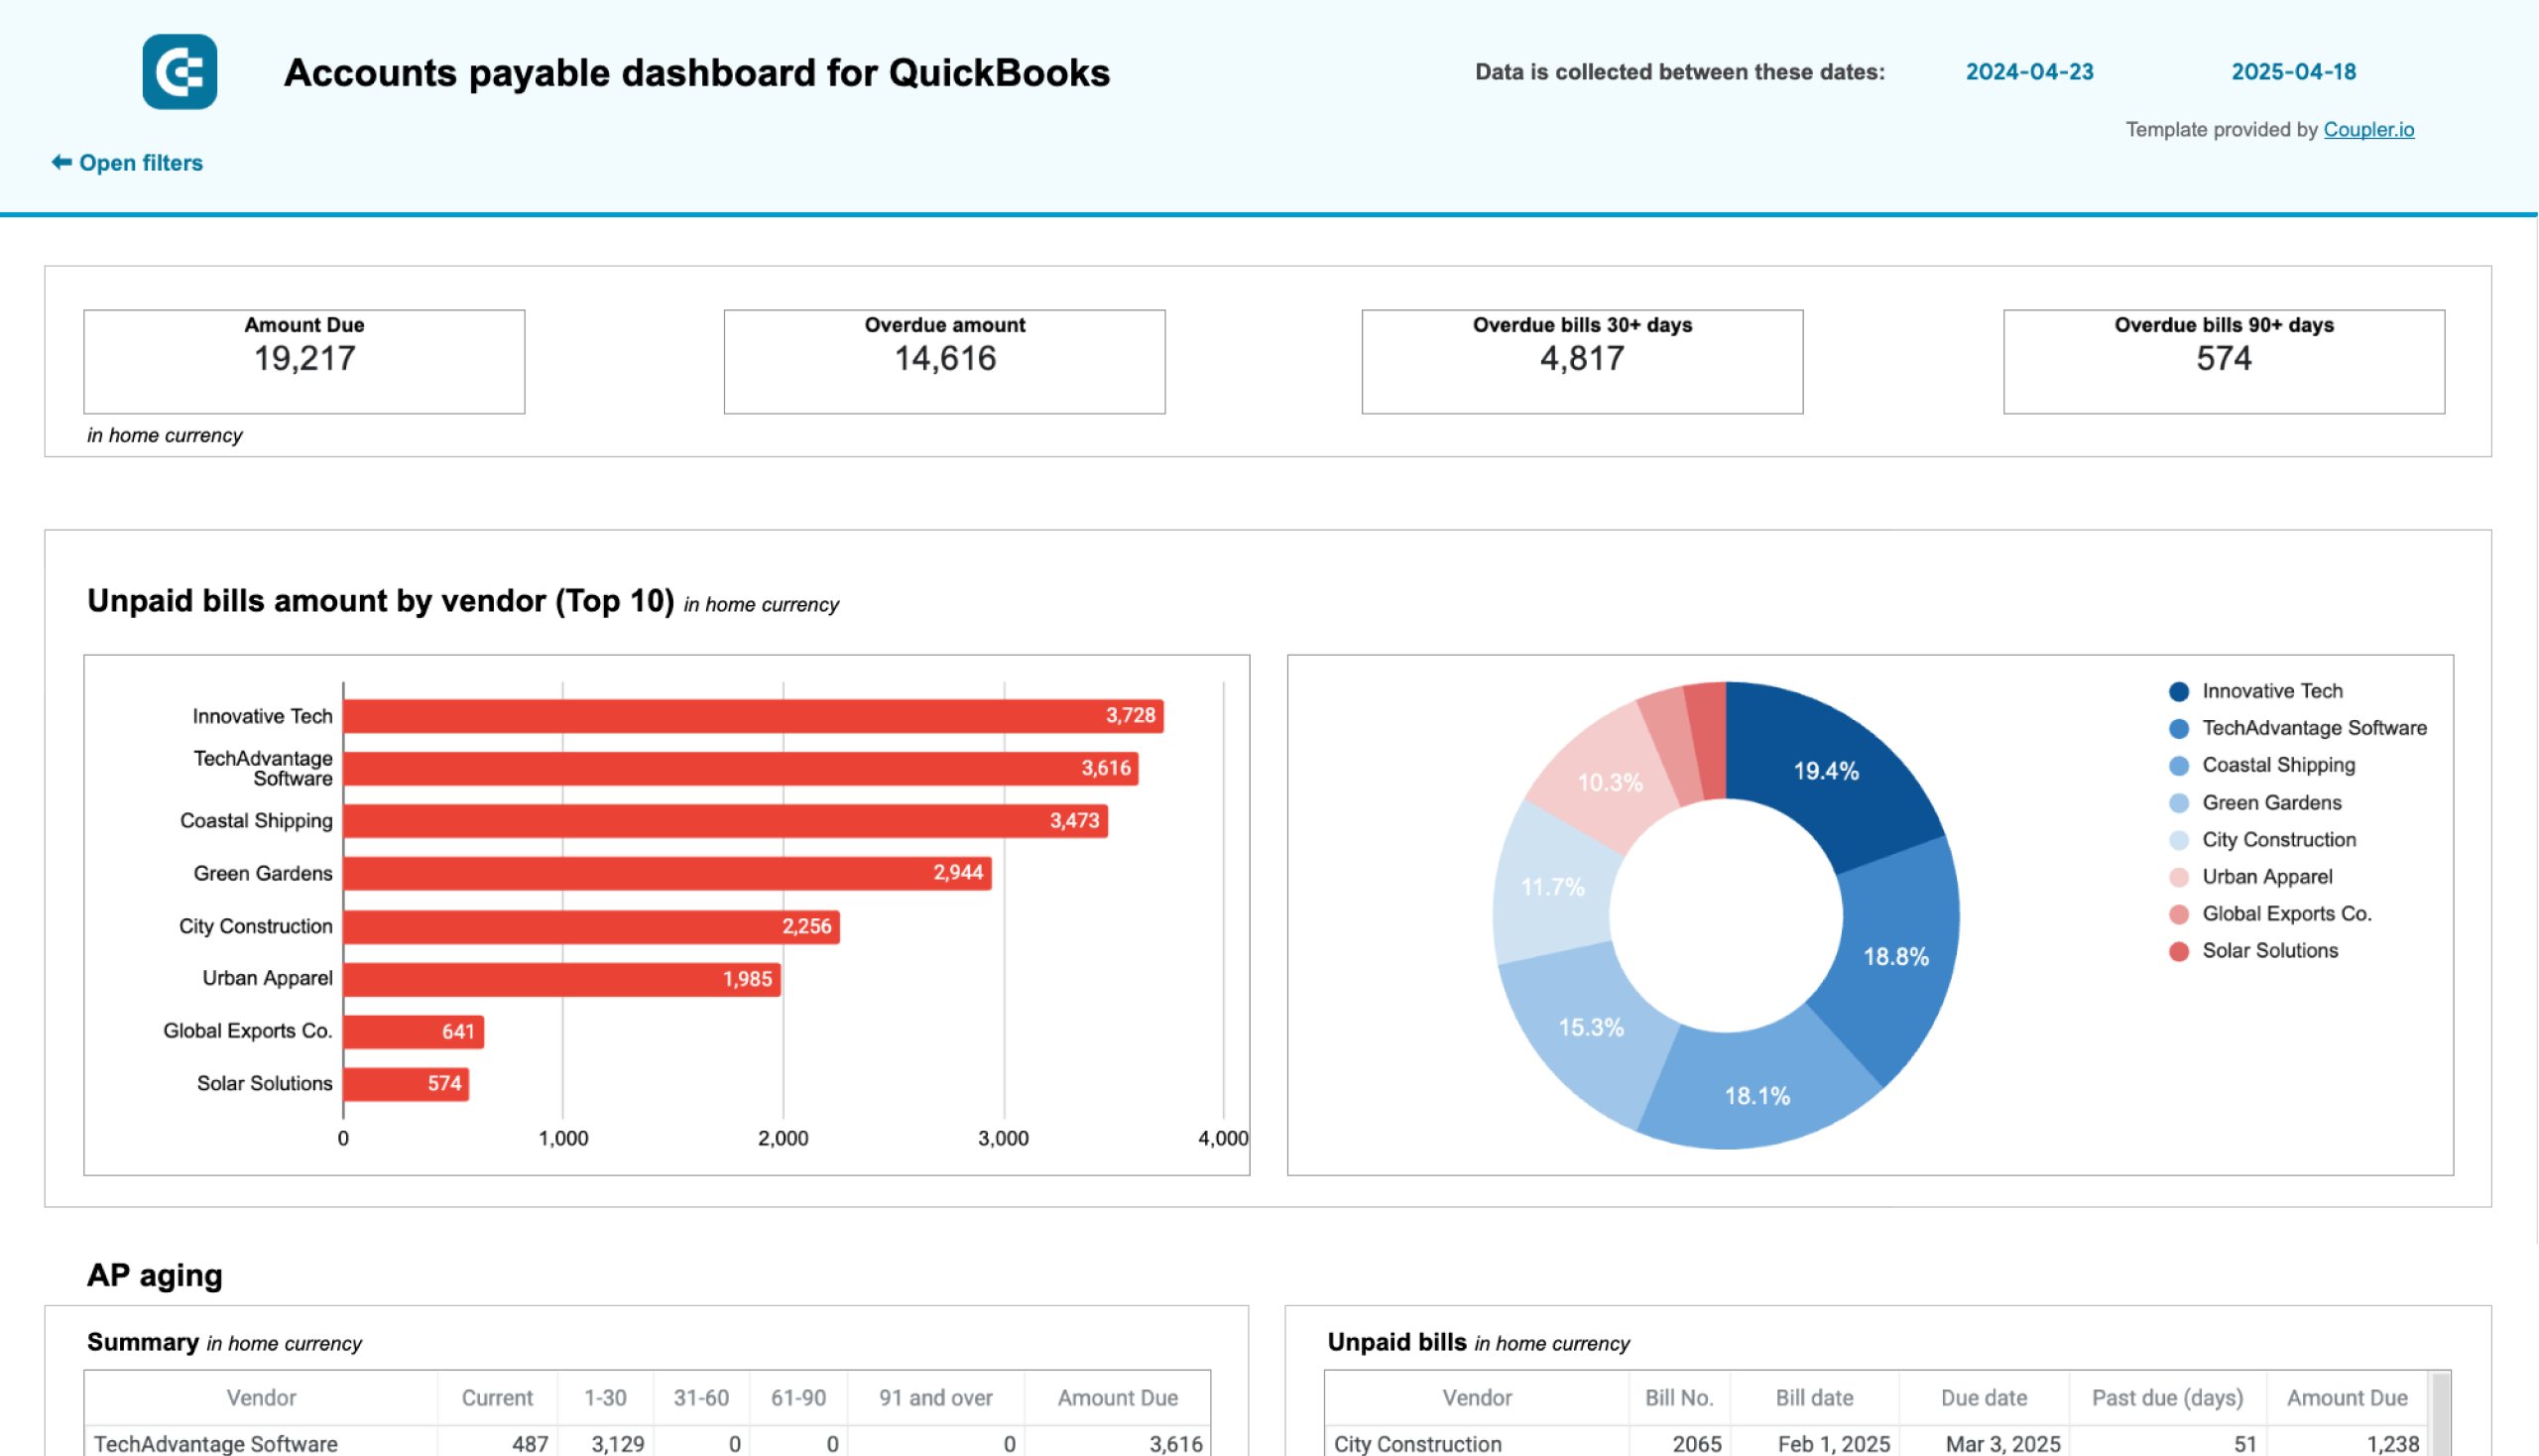
This dashboard provides a clear overview of accounts payable through a number of scorecards. Monitor the total due amount of current bills and the overdue amount for older bills. Observe all your creditors along with the credit debt you owe each of them.
On the accounts payable KPI dashboard, you can see the share of each vendor in your accounts payable profile using a donut chart. Get insights into your major creditors and explore the distribution of unpaid bills across them. Decide which payments to which creditors need to be made first.
Monitor all the bills with their corresponding details using our accounts payable dashboard. It allows you to apply sorting based on multiple criteria such as vendor, amount, due date, currency, and others. You can observe all bills, both paid and unpaid ones, and focus on those that interest you most. That way, you have all consolidated information on your bills in one place which can help you keep track of billing operations.
This dashboard shows the distribution of overdue amounts by vendor and period. You can discover creditors to which you owe the highest amount in total. Feel free to sort the unpaid invoices for each time frame (under 30 days, 31-60 days, 61-90 days, 90+ days) to find vendors associated with bills that expired a long time ago. Use this information to keep track of overdue bills and set payment schedules.
This dashboard contains a scorecard with the monetary value of all bills paid in the current month. Below, you can see a table with the vendors and the associated payments you made to them for the current month, last month, and from the beginning of the year. Discover which vendors you regularly make payments for and which ones receive less credit amount. Use this dashboard to decide on how to distribute your cash to pay debts in the current accounting period.
On the accounts payable dashboard, you can find a chart showing cash distribution across your bank accounts. It shows how much money on each of your business accounts across different banks is available. Monitor the account balance for various currencies your business works with. See how to use the available cash to ensure credit debt compliance for the selected vendors.
What insights you can get with the accounts payable dashboard
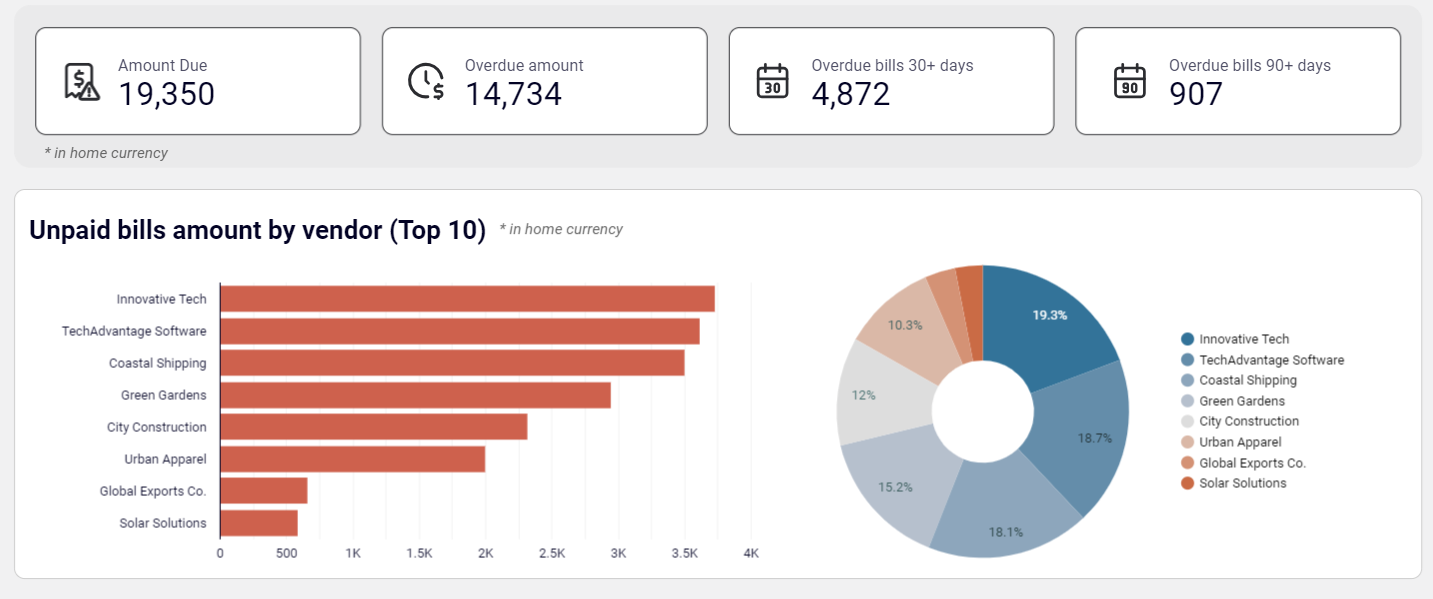
This dashboard provides a chart for unpaid bills. That way, you can observe the total due amount for the current accounting period and the credit debt with deadlines of 30+ days. Explore all vendors and their share in your account payable landscape. All this helps to identify major creditors and prioritize payments.
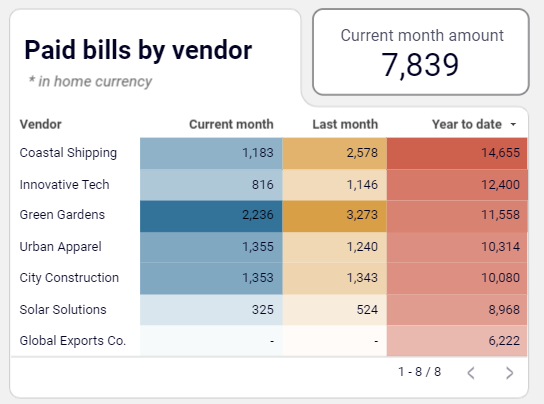
On the dashboard, there is a table with a detailed breakdown of bills you have already paid to your creditors. Discover vendors that received the highest amounts in the current and previous periods. Use this information to plan your billing schedules for the next accounting stages.
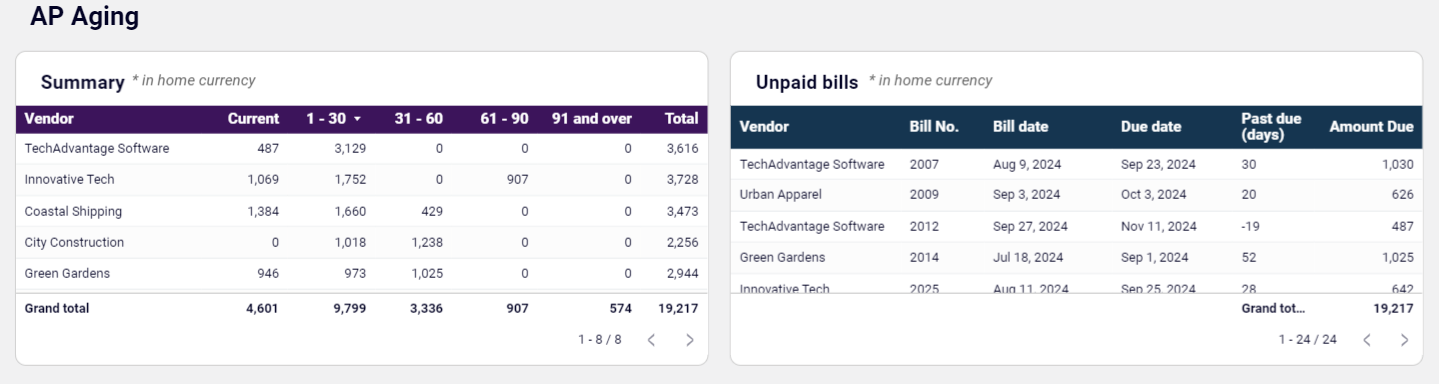
This dashboard presents the distribution of all overdue bills for vendors and periods. Find the list of vendors associated with the highest value of all overdue bills. Use this information to decide on which credit debts should be paid urgently.
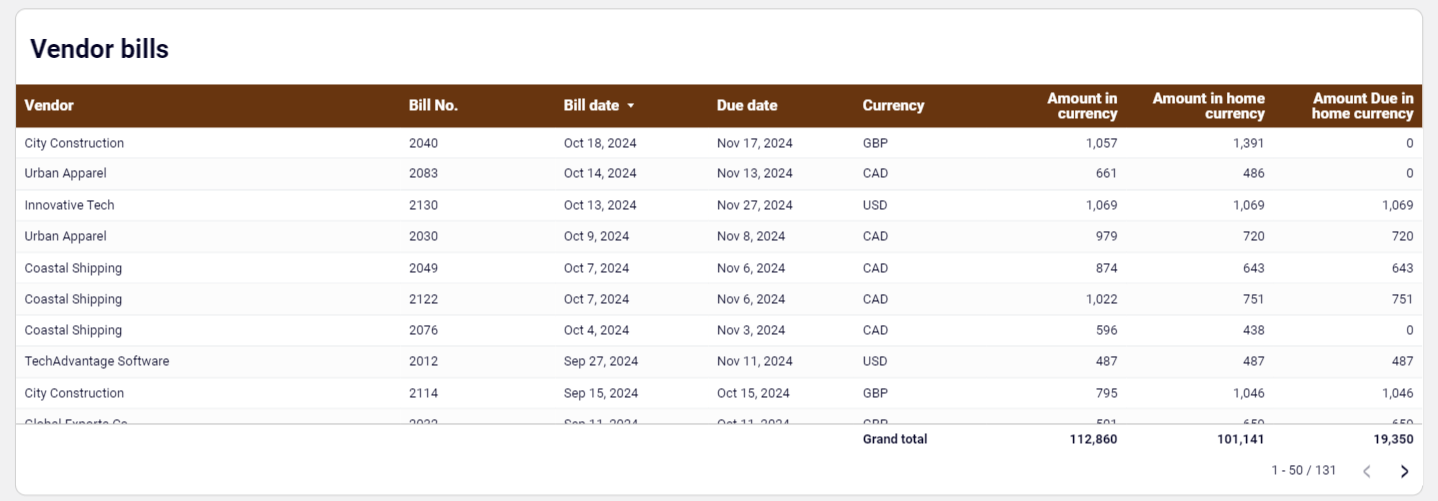
This dashboard provides a complete overview of all your bills in one place. For your convenience, it’s possible to sort bills by vendor, amount, currency, and due date. Arrange them using the selected criteria to prioritize payments and manage billing cycles.
How to create an accounts payable dashboard?

Metrics you can track with the accounts payable dashboard templates
This metric shows the monetary value of all unpaid bills in the selected currency for the specified reporting period. Track the amount due to see how much money your business owes vendors in total. Check whether it is possible to close all monthly obligations on time.
The overdue amount reflects the sum of money for unpaid bills with past deadlines. Control this value to understand how much money you currently owe creditors. Decide which bills should be paid first and prioritize other outgoing financial transactions.
This metric depicts the value of all unpaid bills with the deadline passed 90+ days ago. View the AP Aging table to discover vendors associated with unpaid bills that expired over three months ago. For your convenience, the table rows are sorted by the creditors with the highest due amount. Decide how to prioritize payments to those vendors.
This is the value of all unpaid bills that expired a month ago or even earlier. Analyze those bills in terms of amount and vendors, and think of which ones should be prioritized. See how this part of the account payable correlates with your current balance.
Opening balance reflects the amount of money at your disposal at the beginning of the specific accounting period. Track this metric to ensure stability and transparency of accounting operations. Compare the opening balance metric to the closing balance report to check your business's financial health.
This amount reflects the sum of money your business has received from sales. It includes all customer payments, deposits, and other sources of revenue sent to your bank account. Observe how cash received correlates with due and overdue amounts to plan your billing activities for the current accounting period.
This KPI shows the amount your business spends on operational needs, debt payments, and other expenses. Control the levels of cash spent to make sure it doesn’t exceed the company’s cash resources at disposal. Use this metric to assess your business expenses and manage cash flow effectively.
The current balance reflects the value of all monetary resources at your company’s disposal. See the distribution of current balances across various bank accounts. Think of how the available resources can be used to make payments to your vendors.