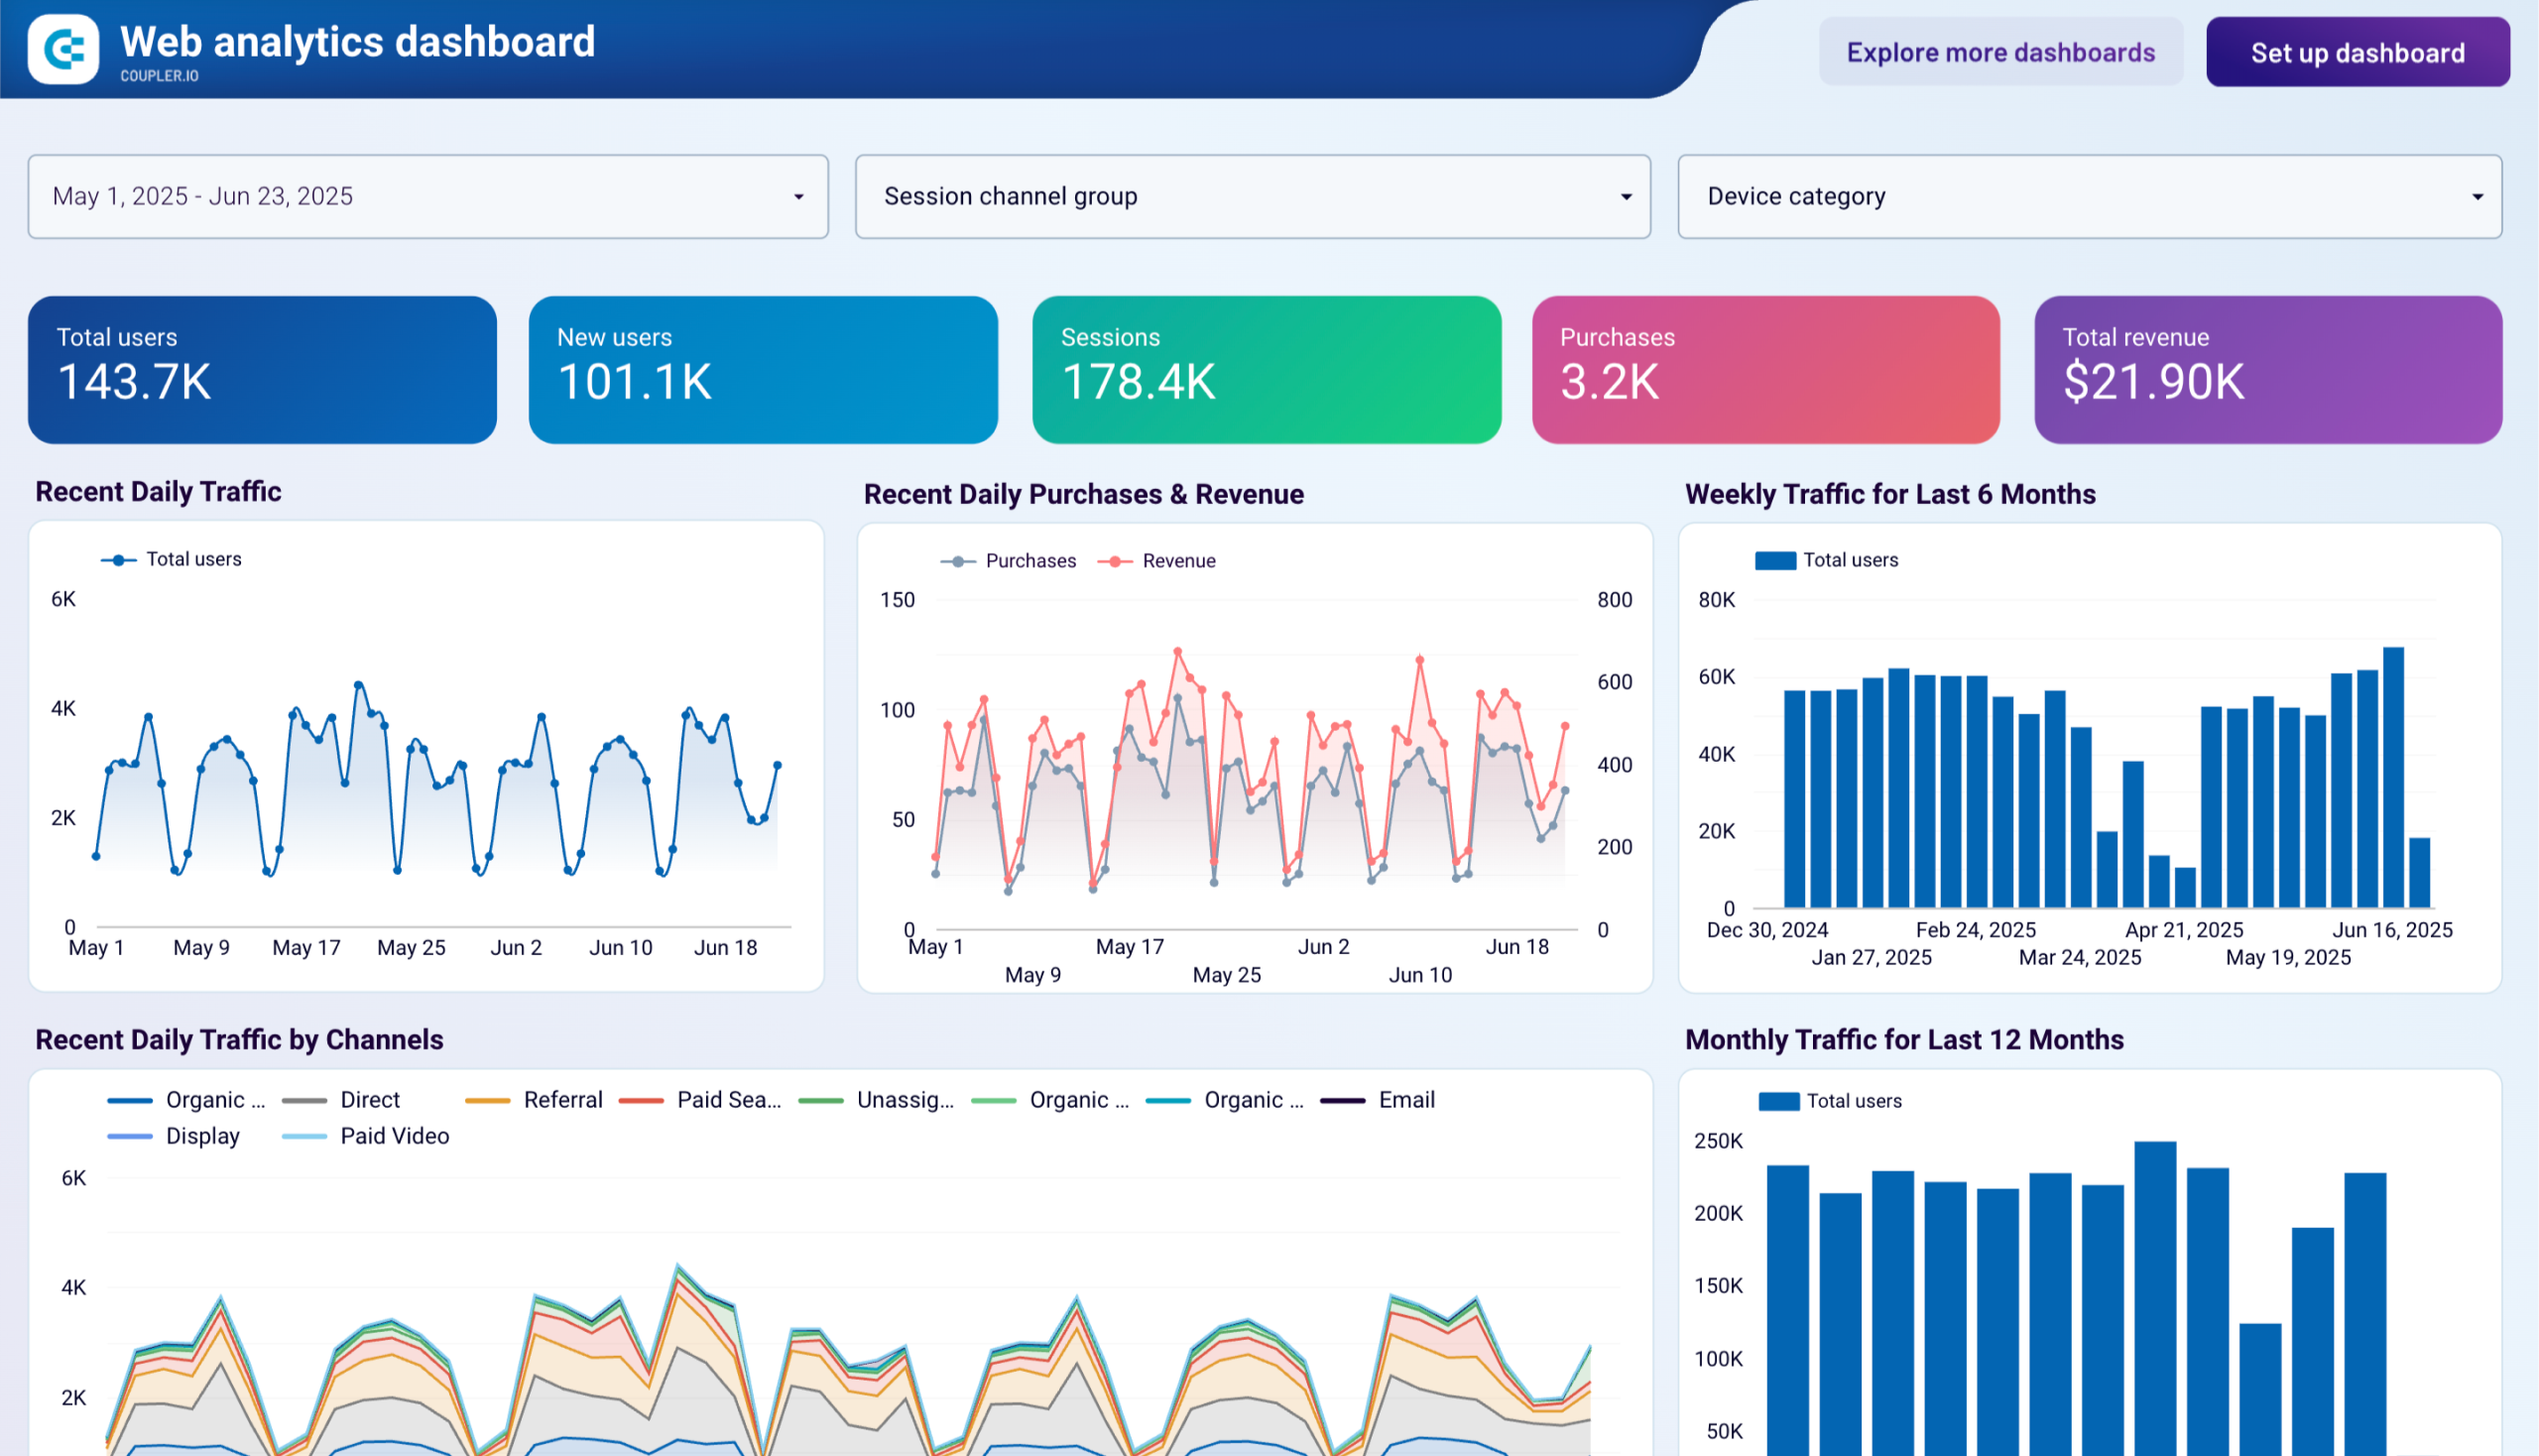
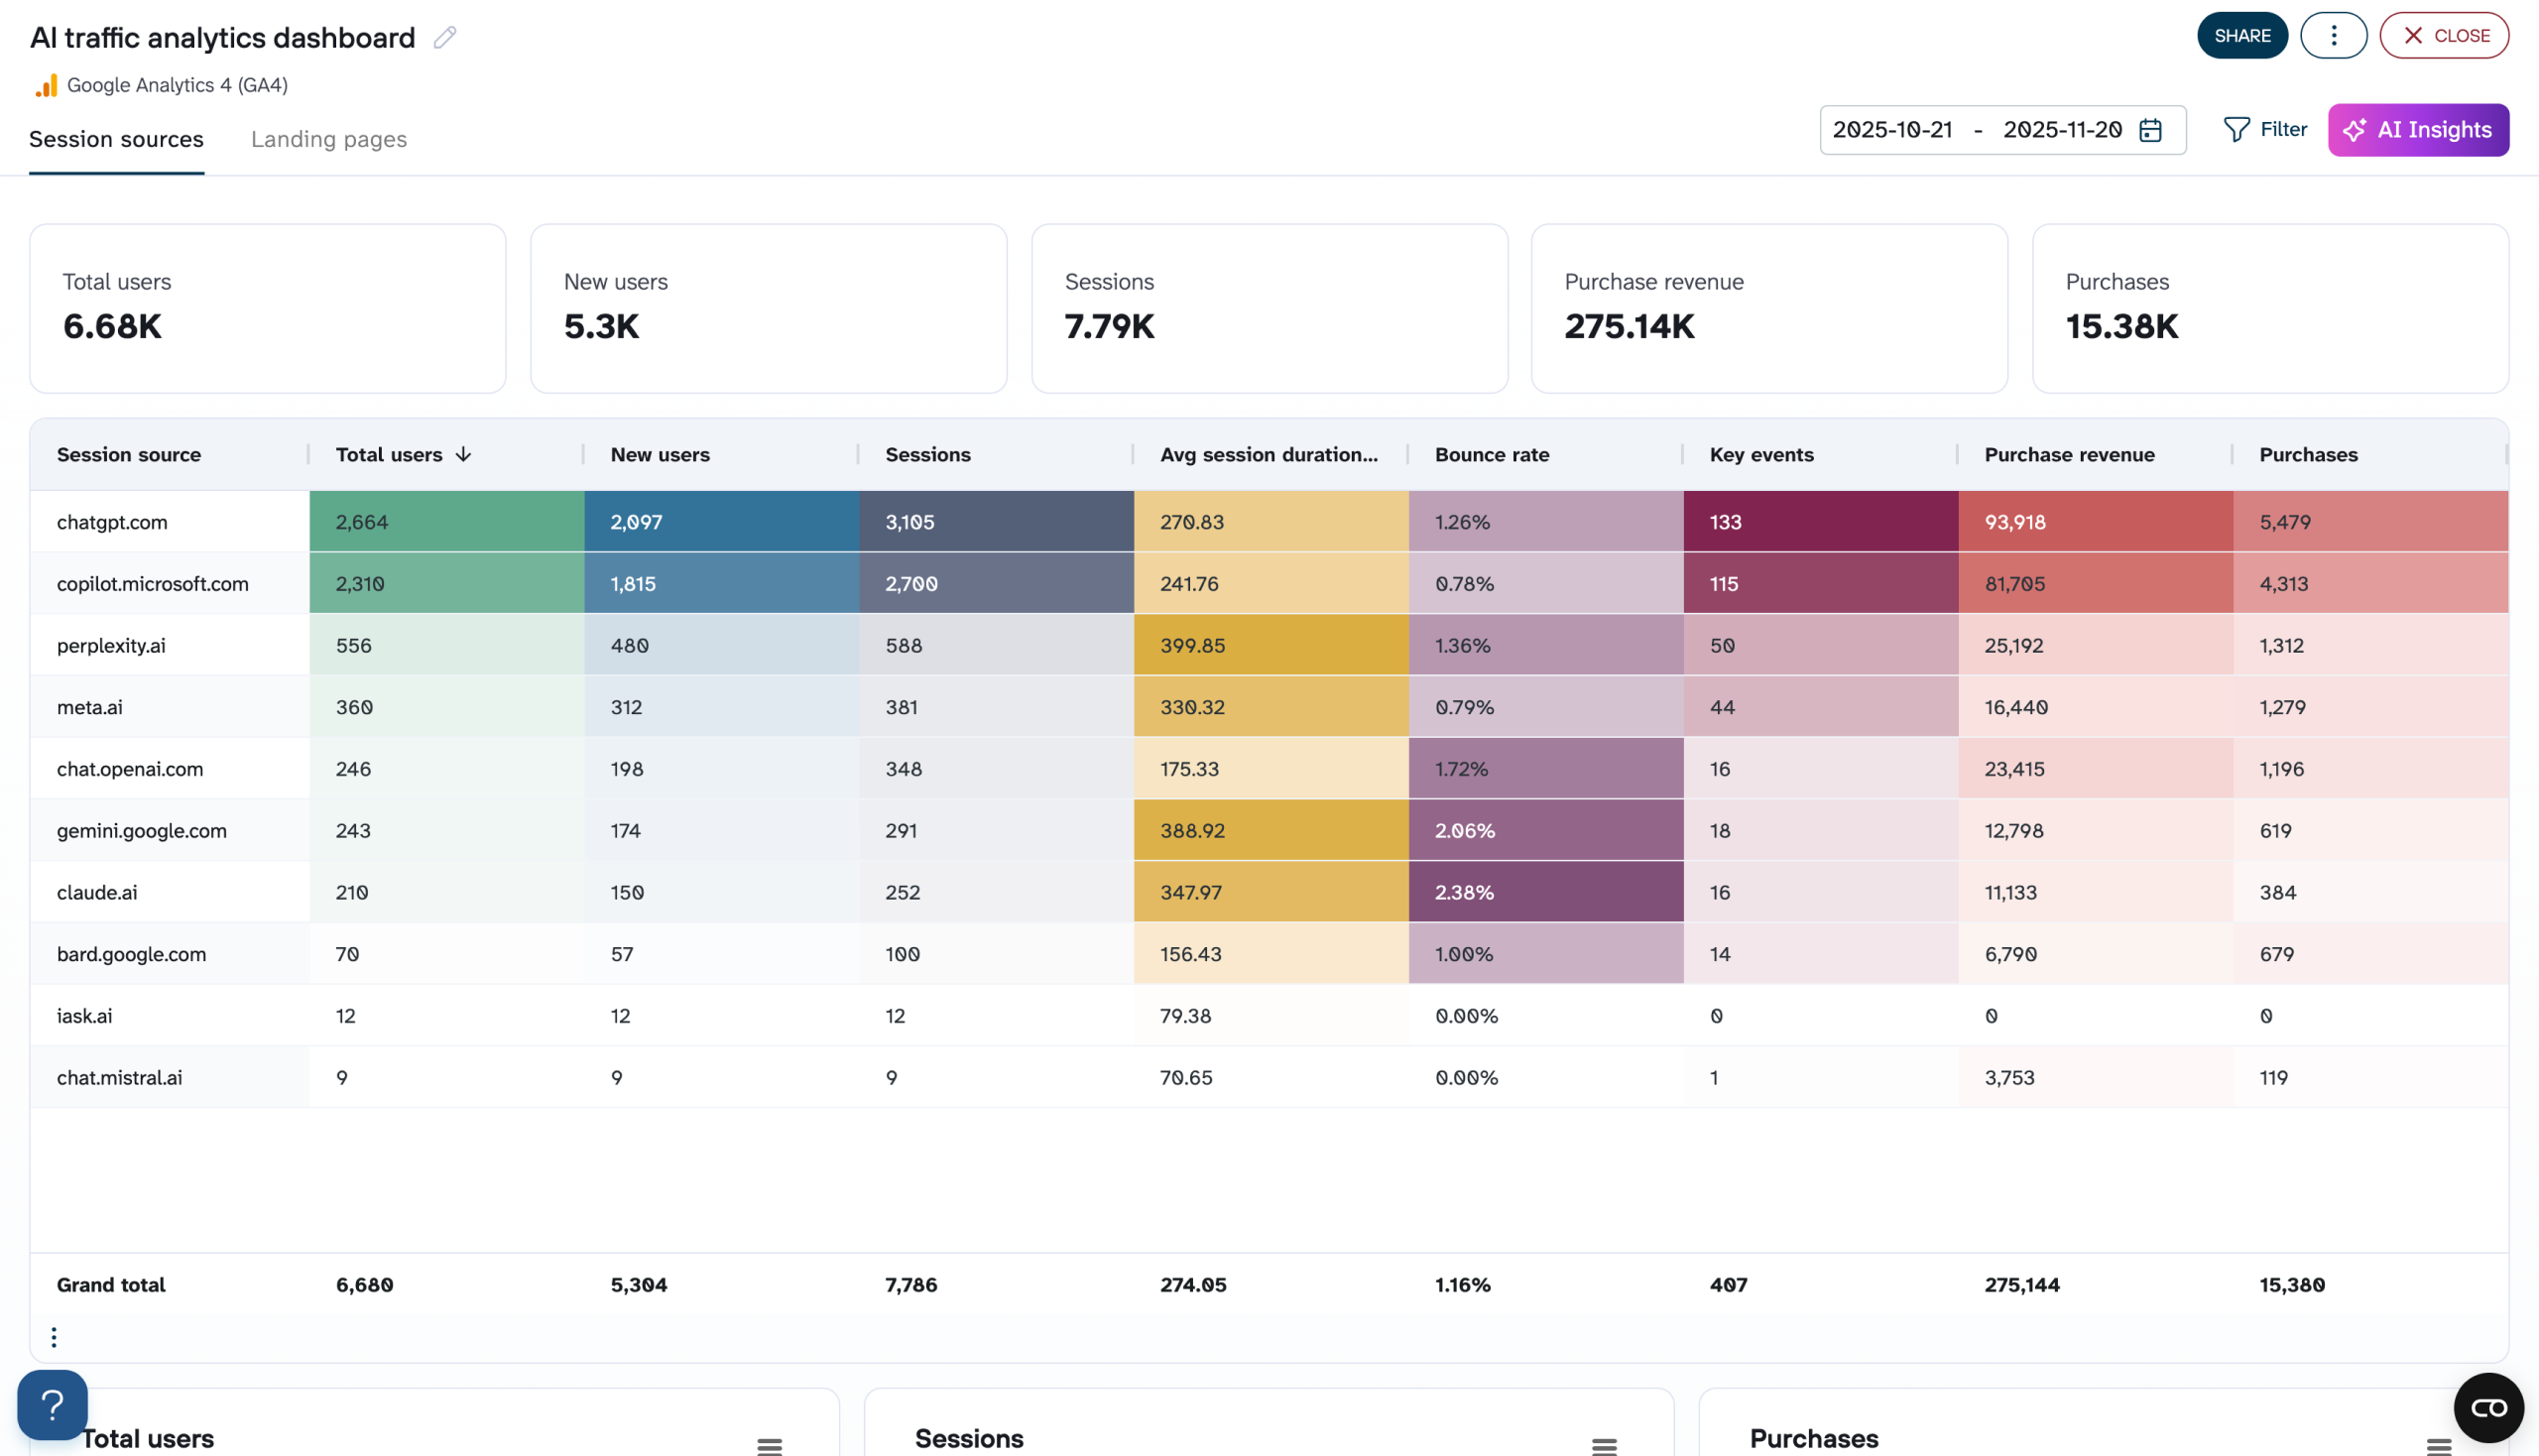
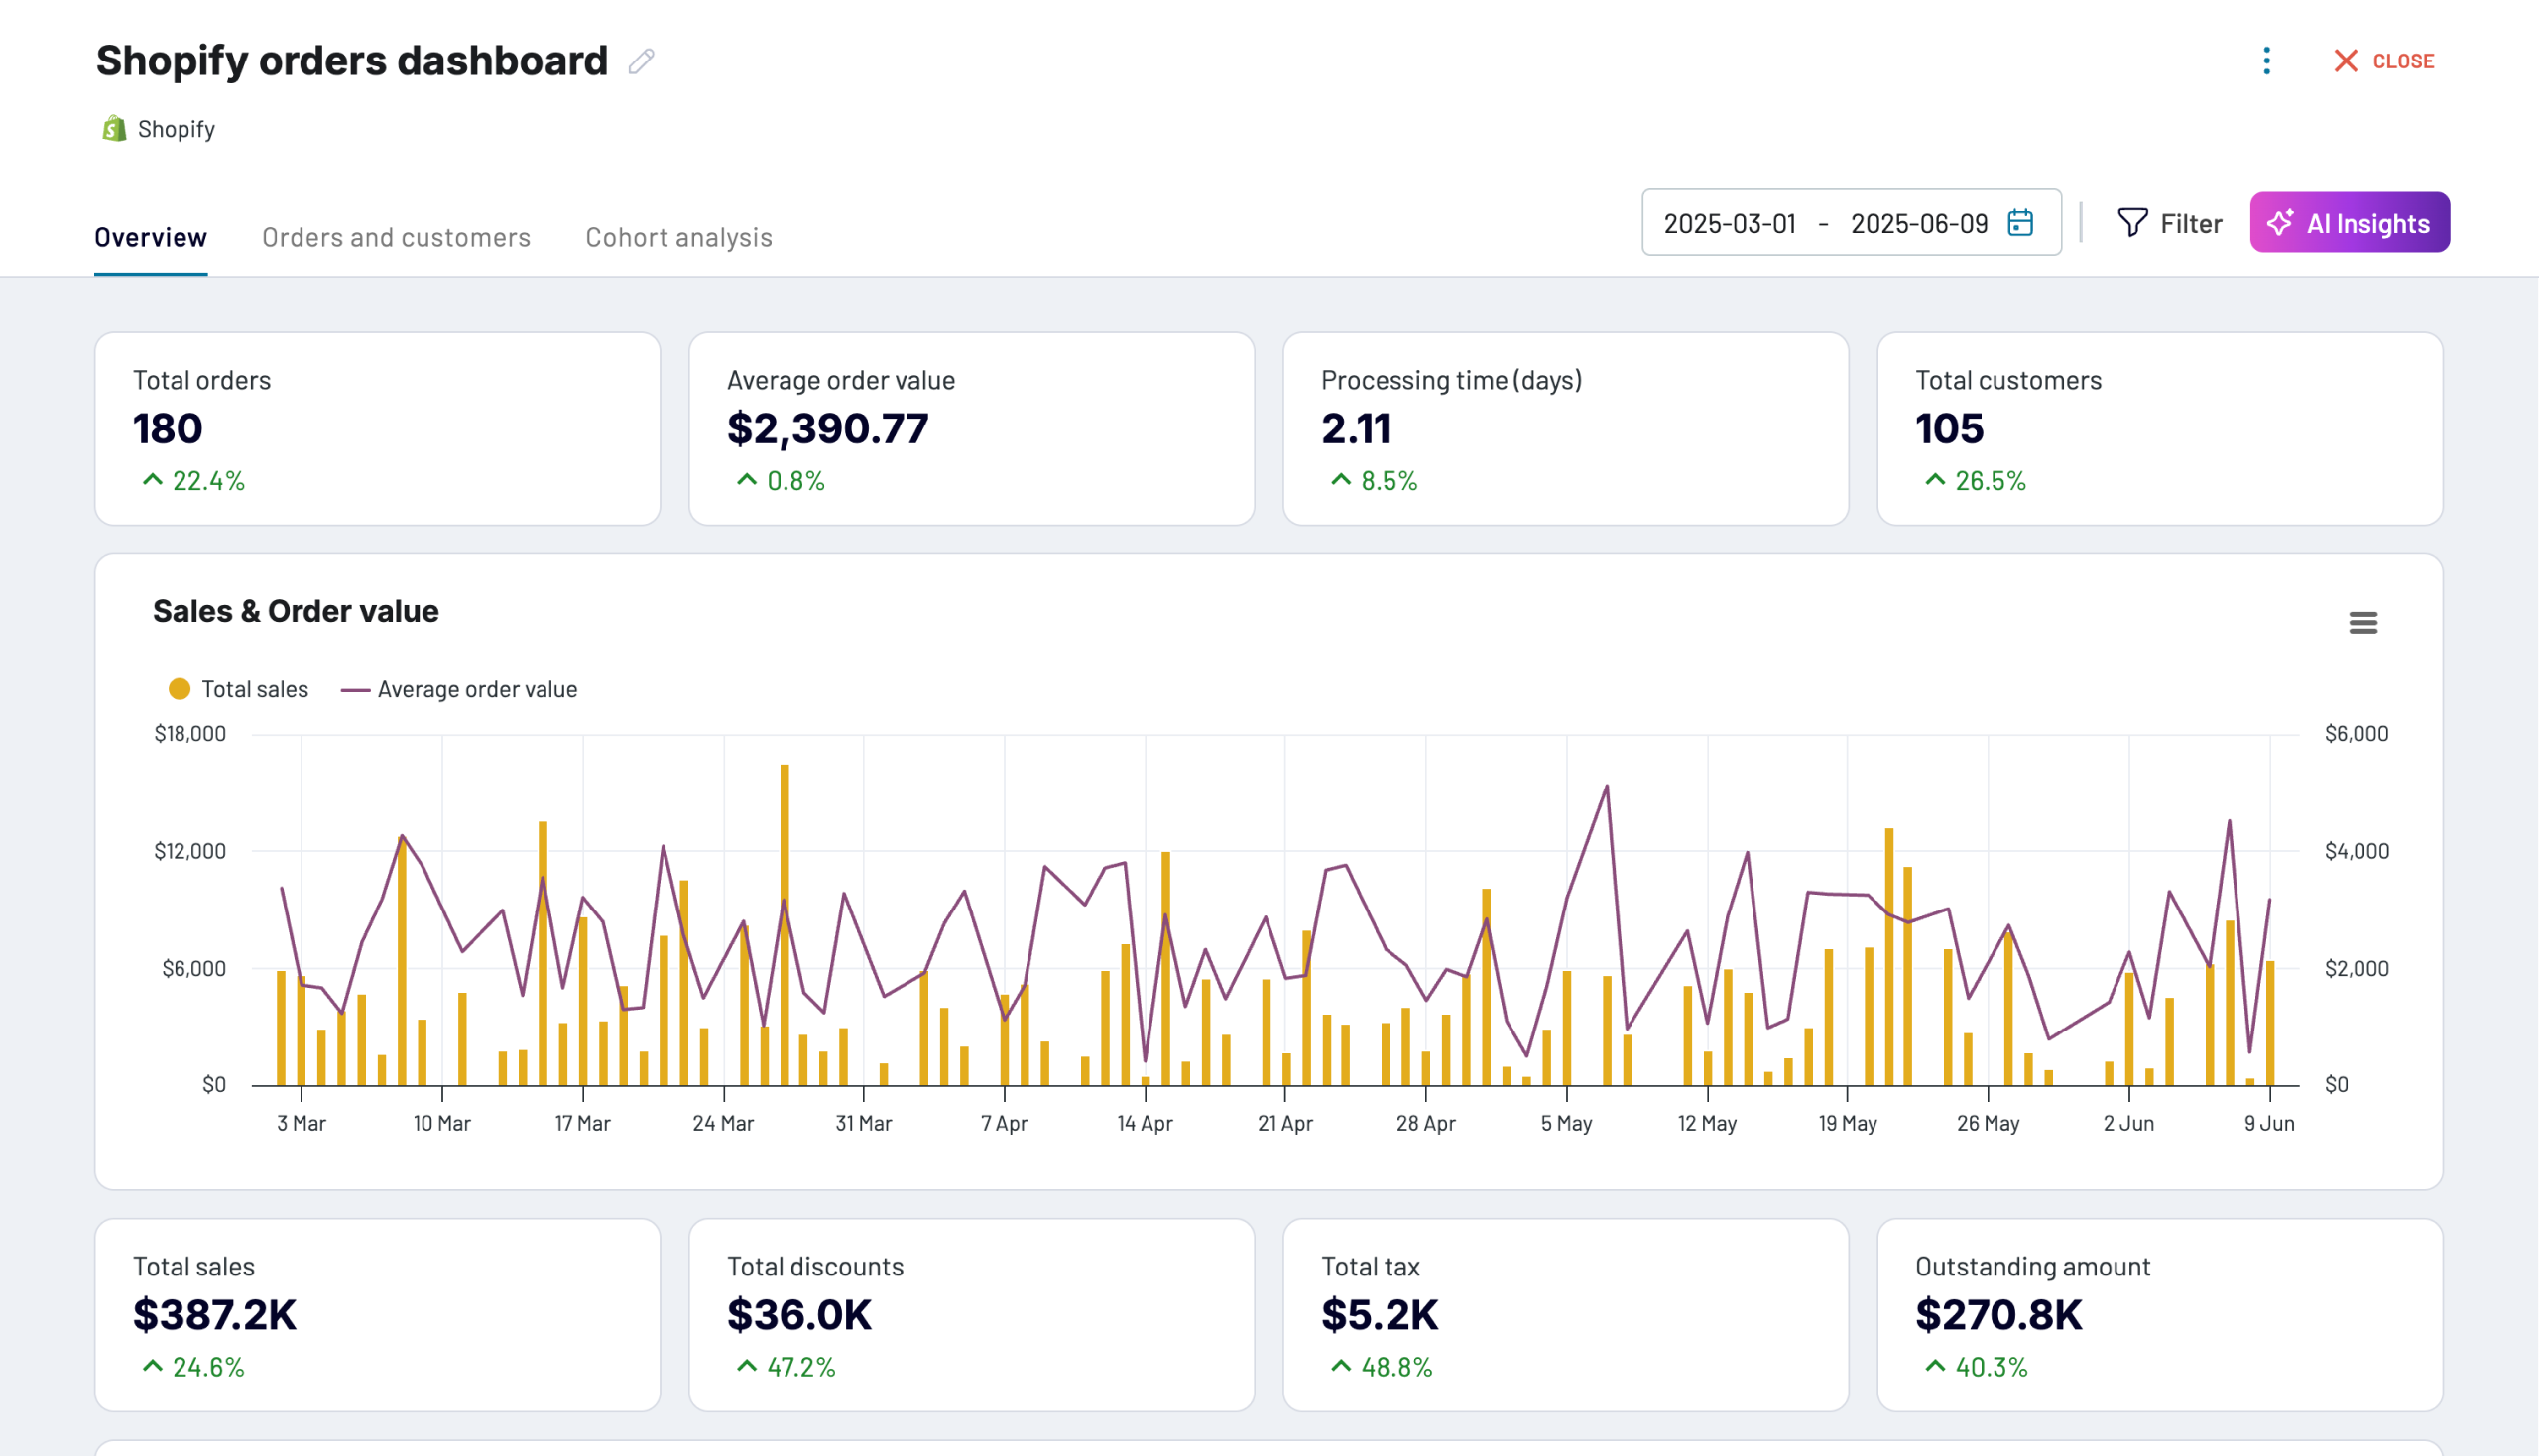
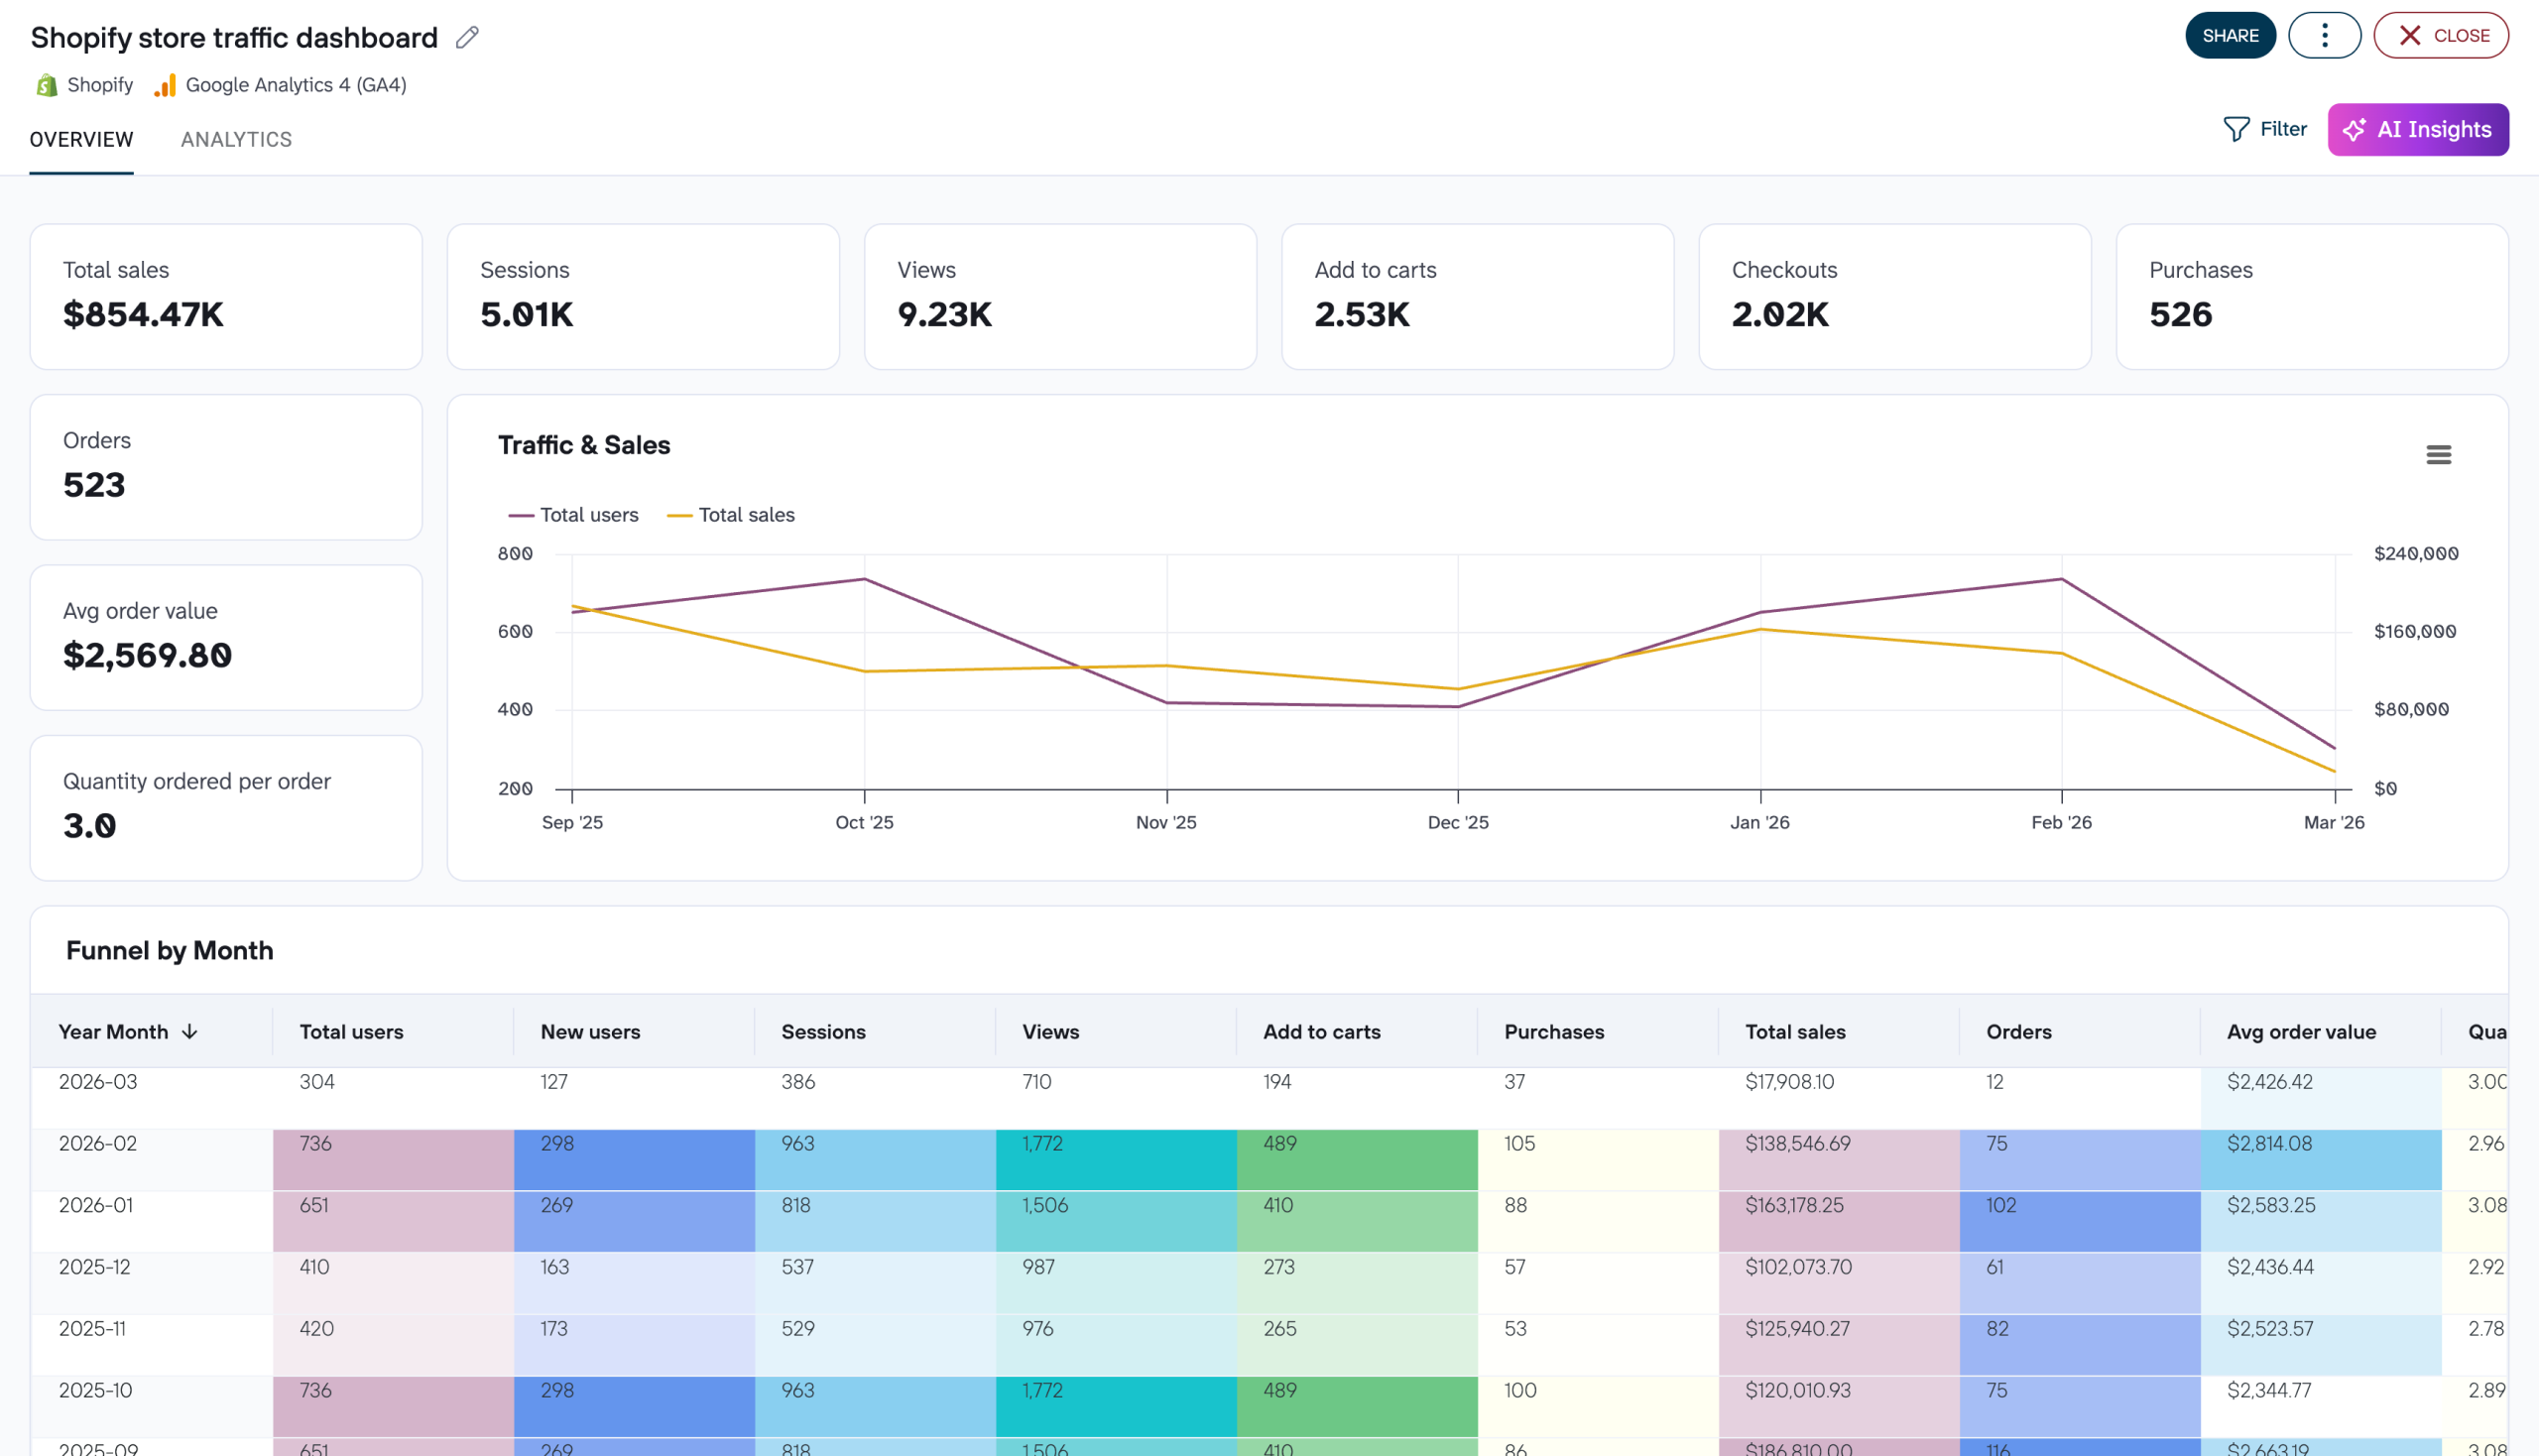
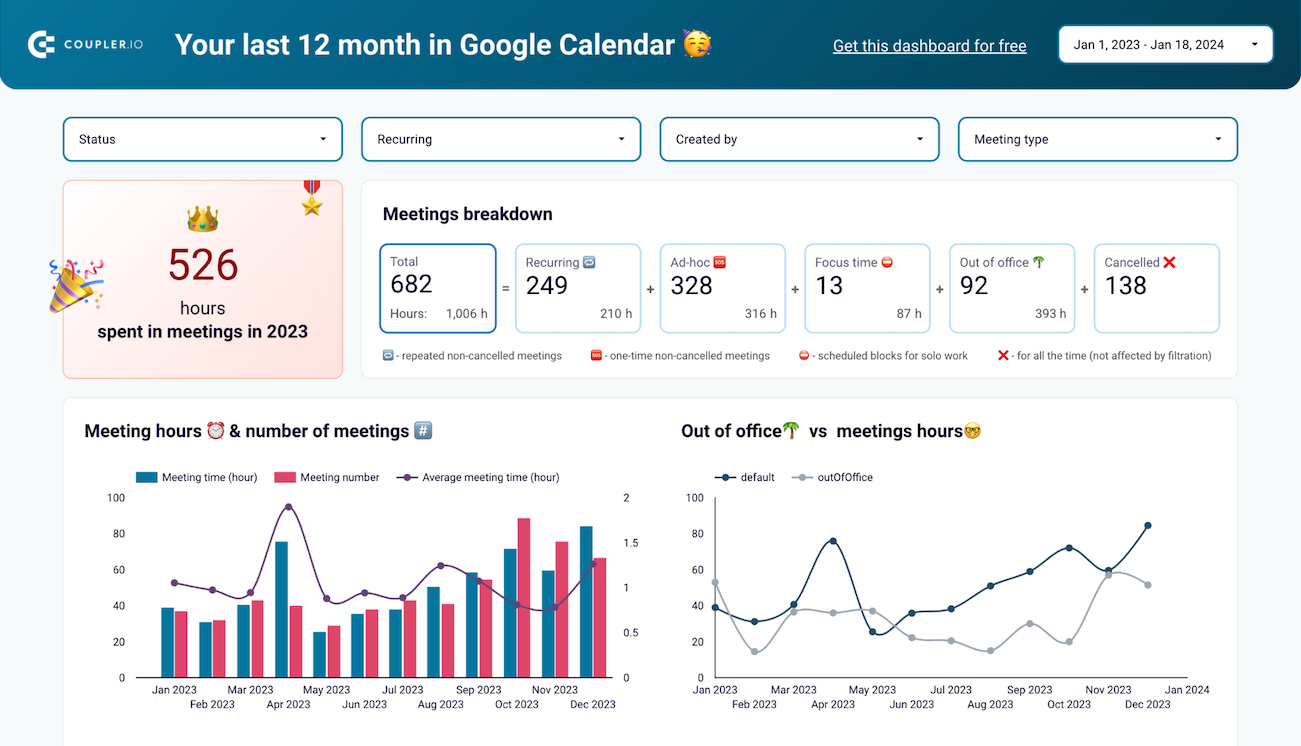
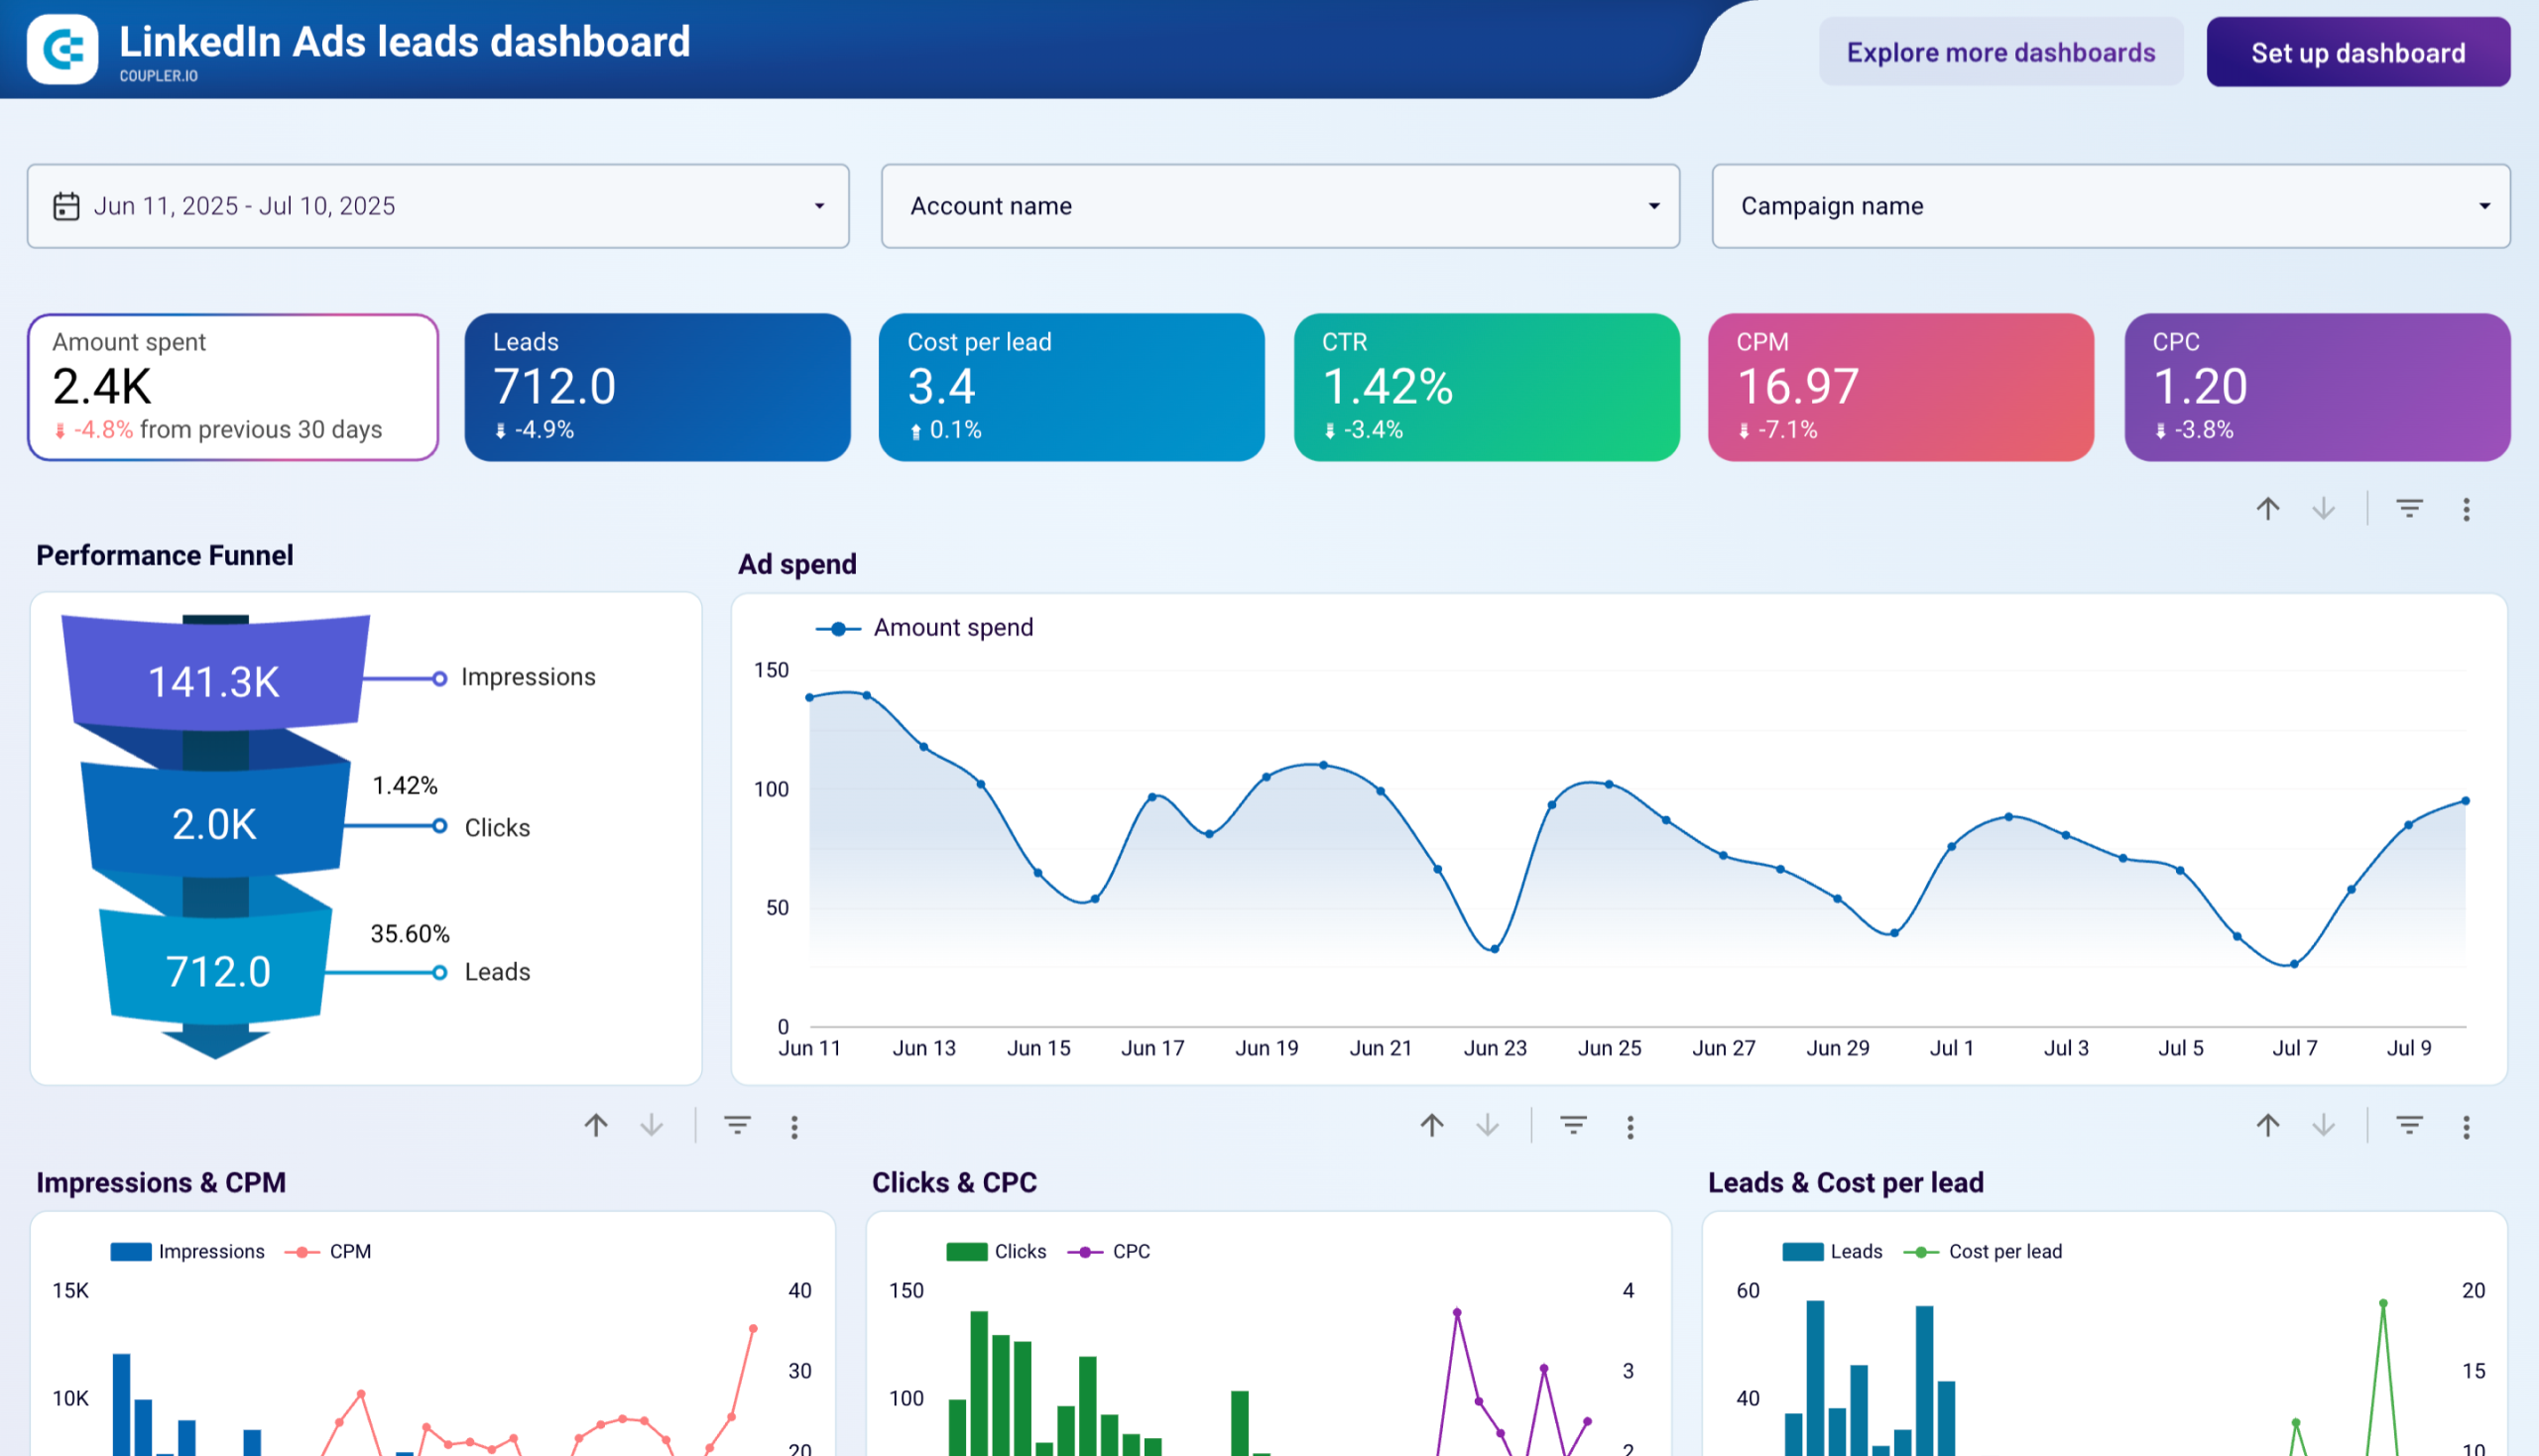
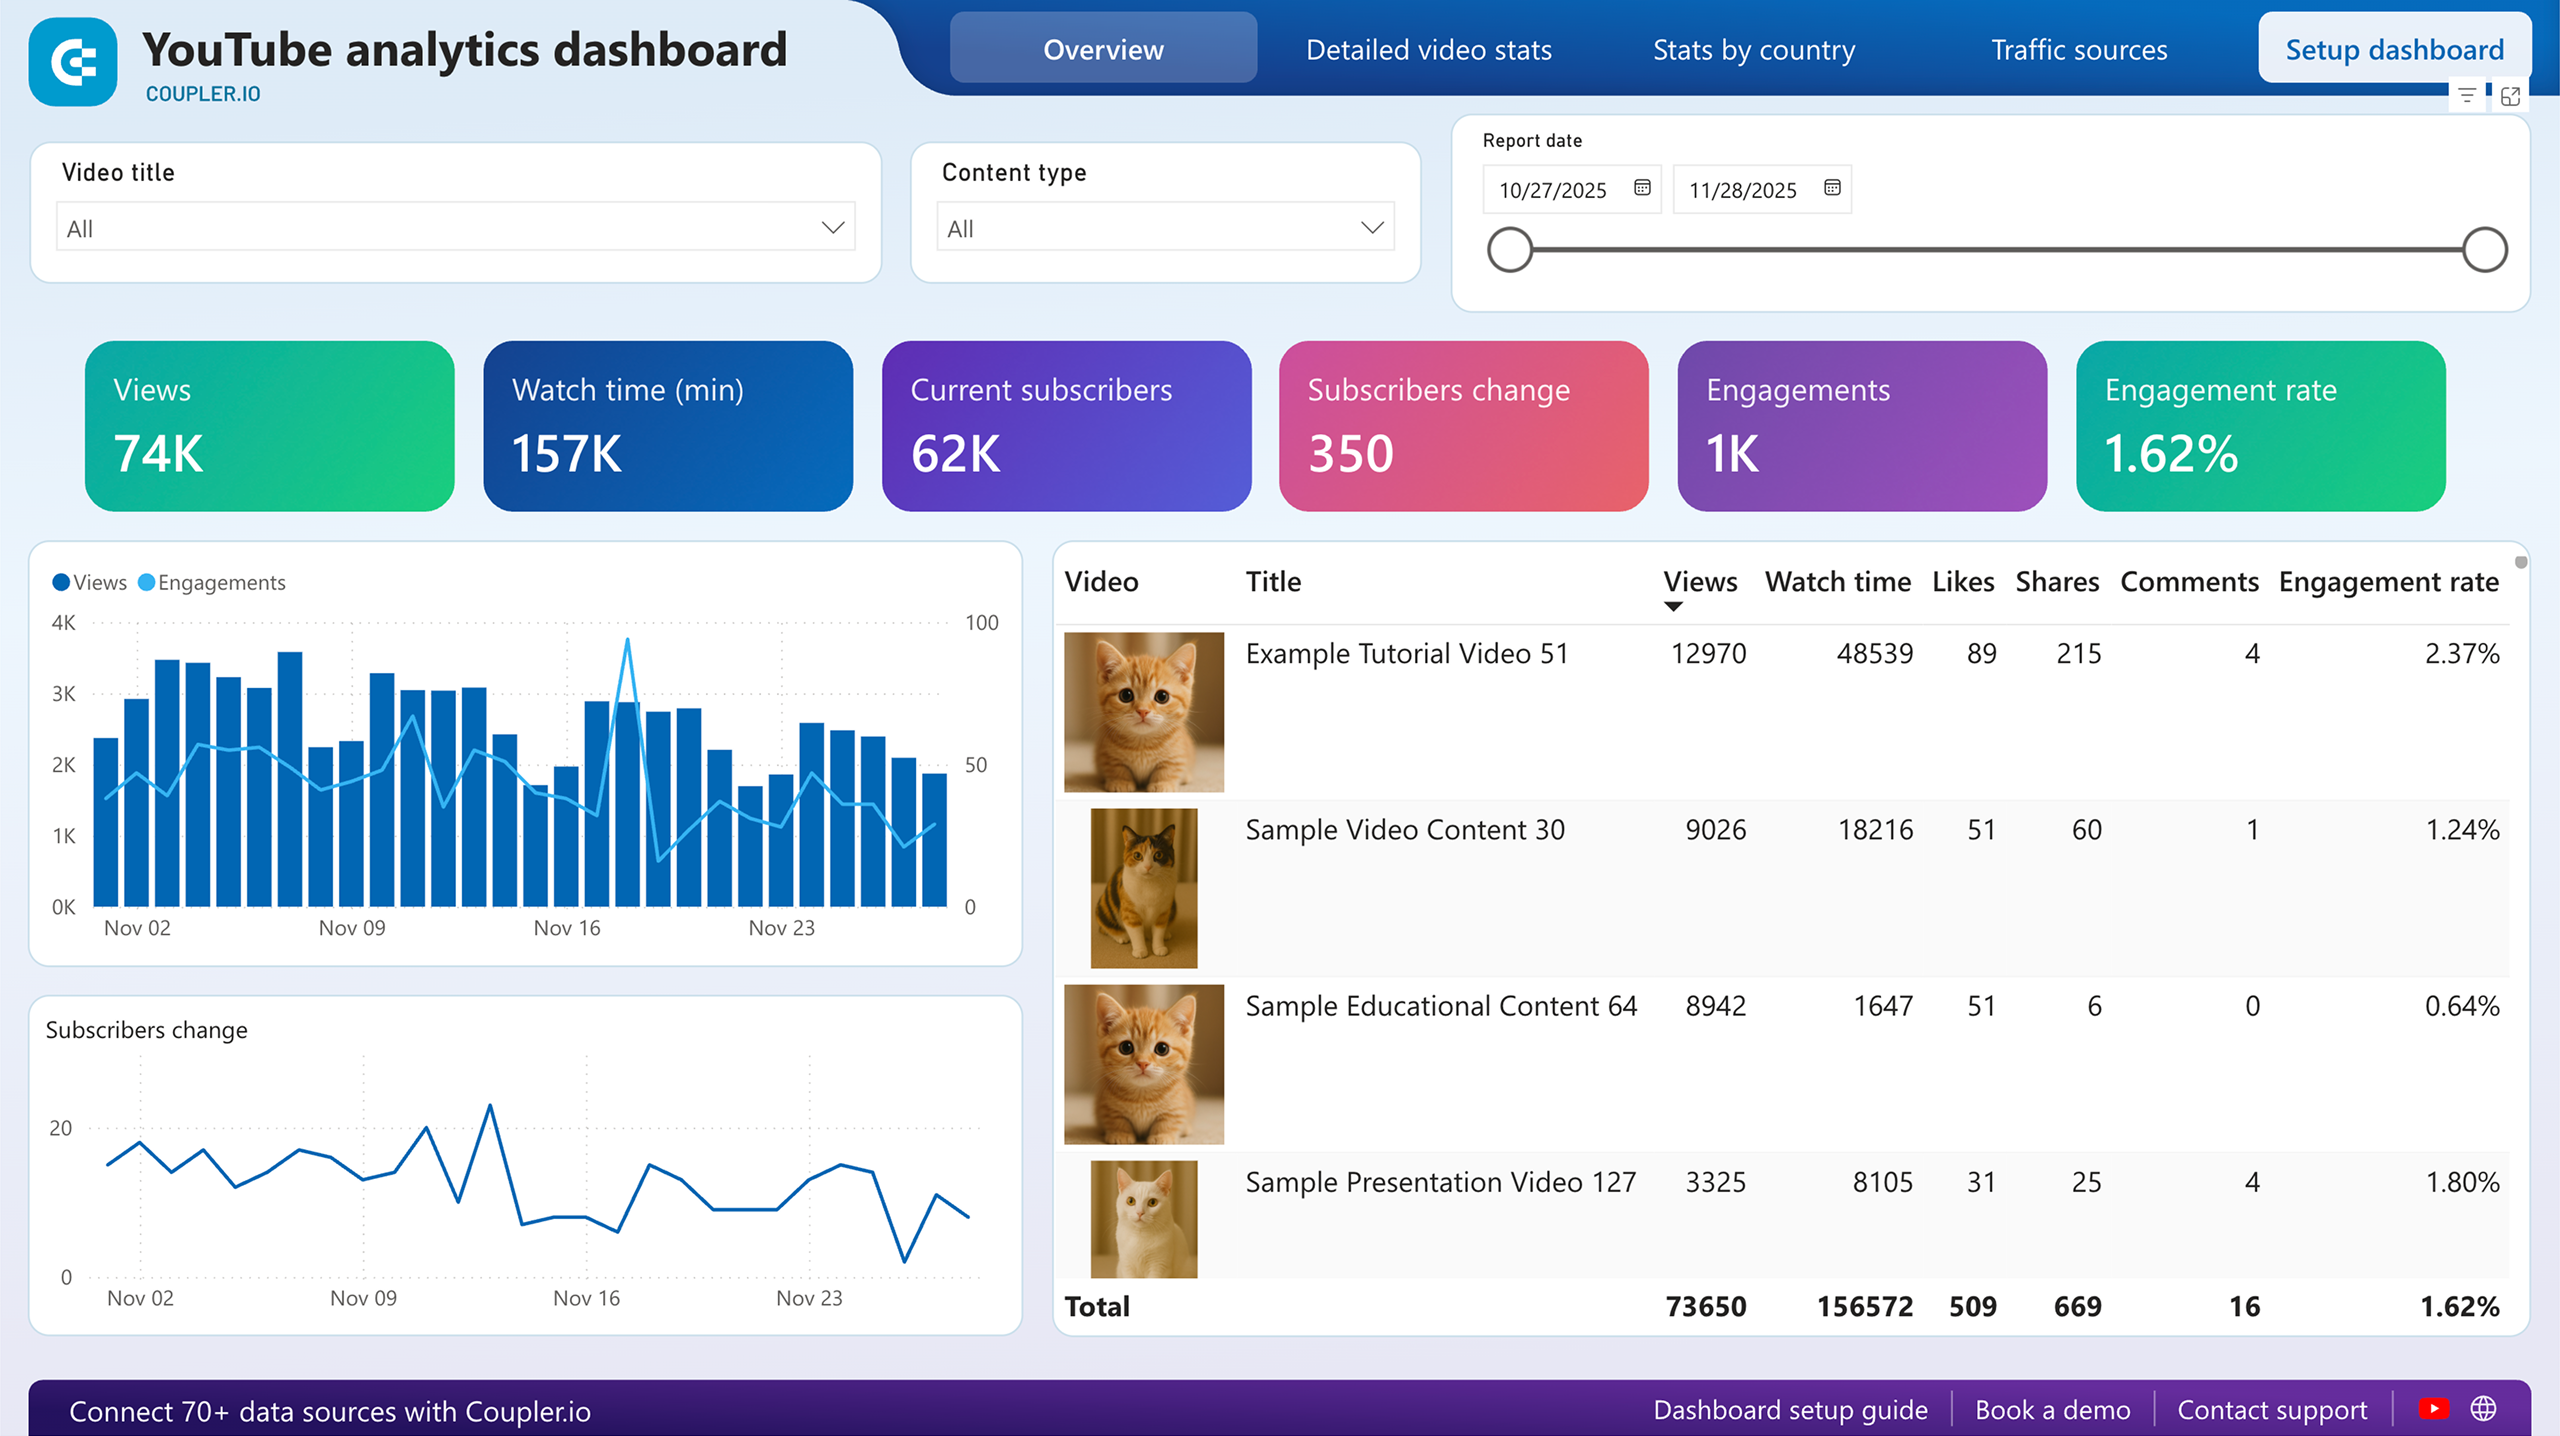
Quick overview of the YouTube Analytics dashboard template
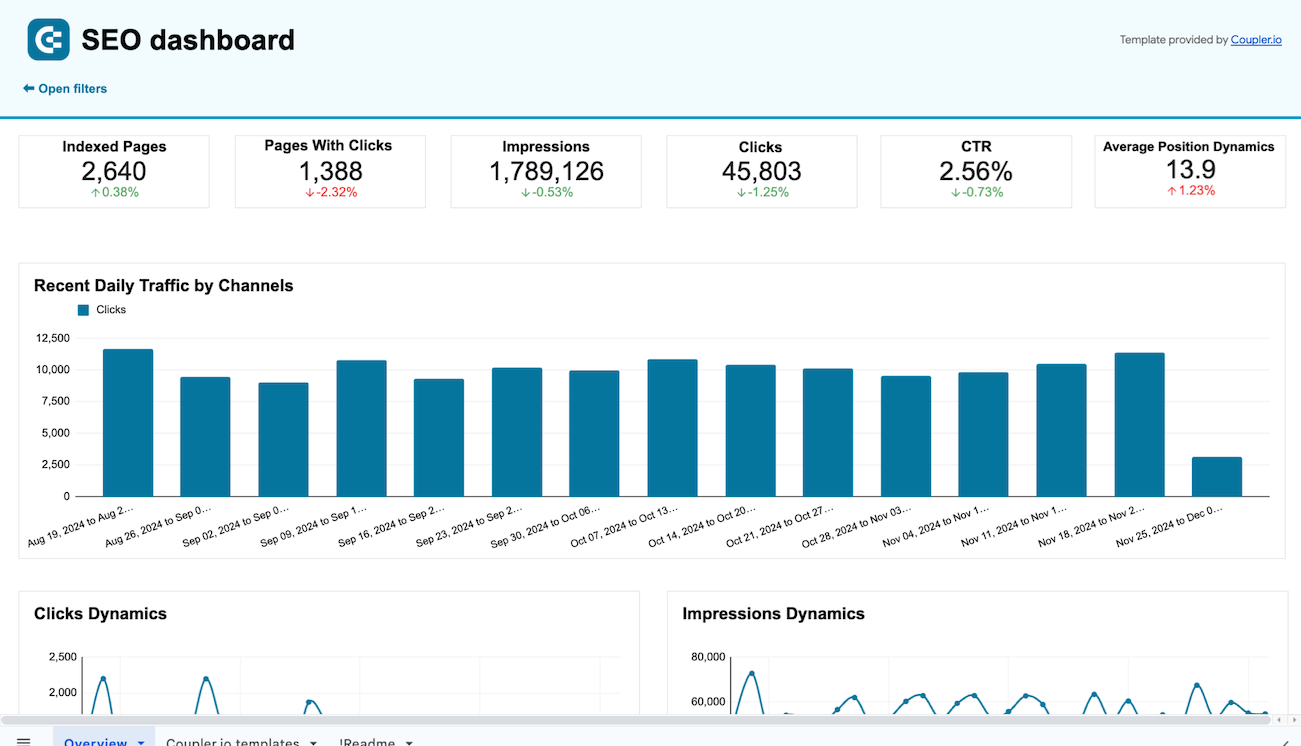
Access essential channel metrics and derive insights into how your channel is growing.

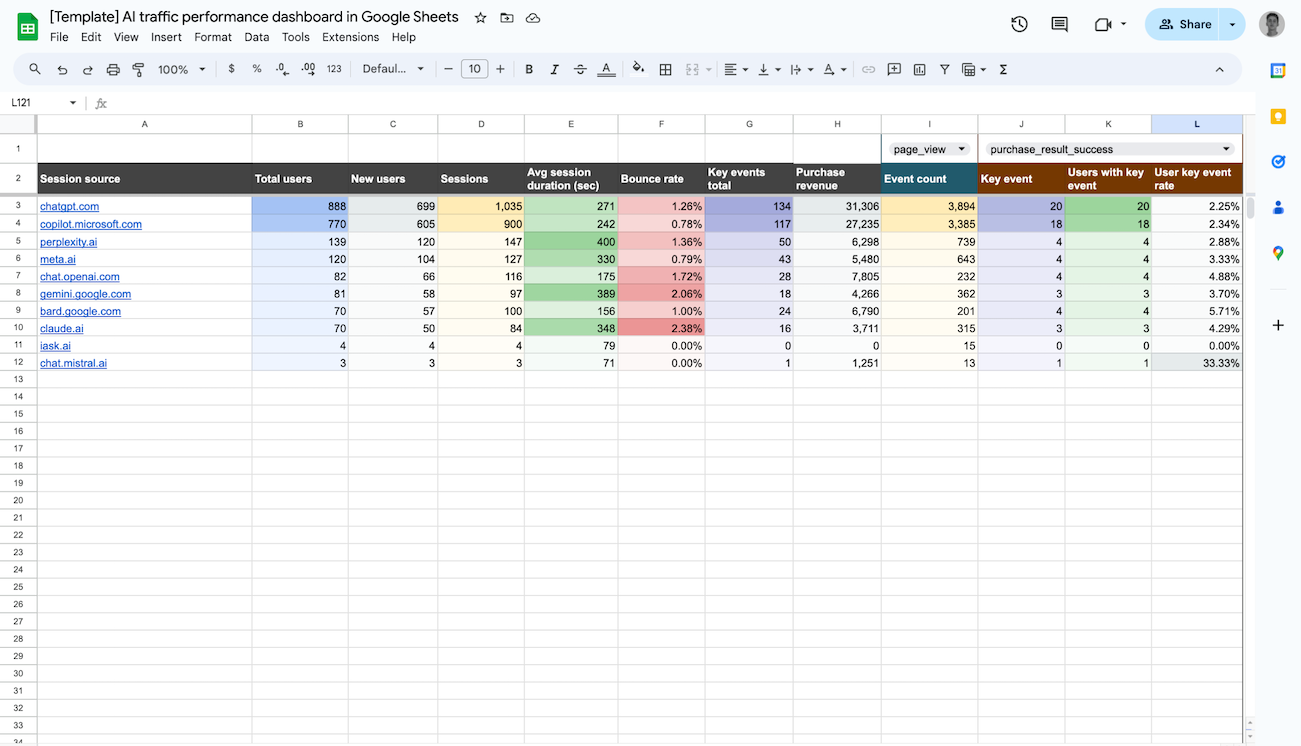
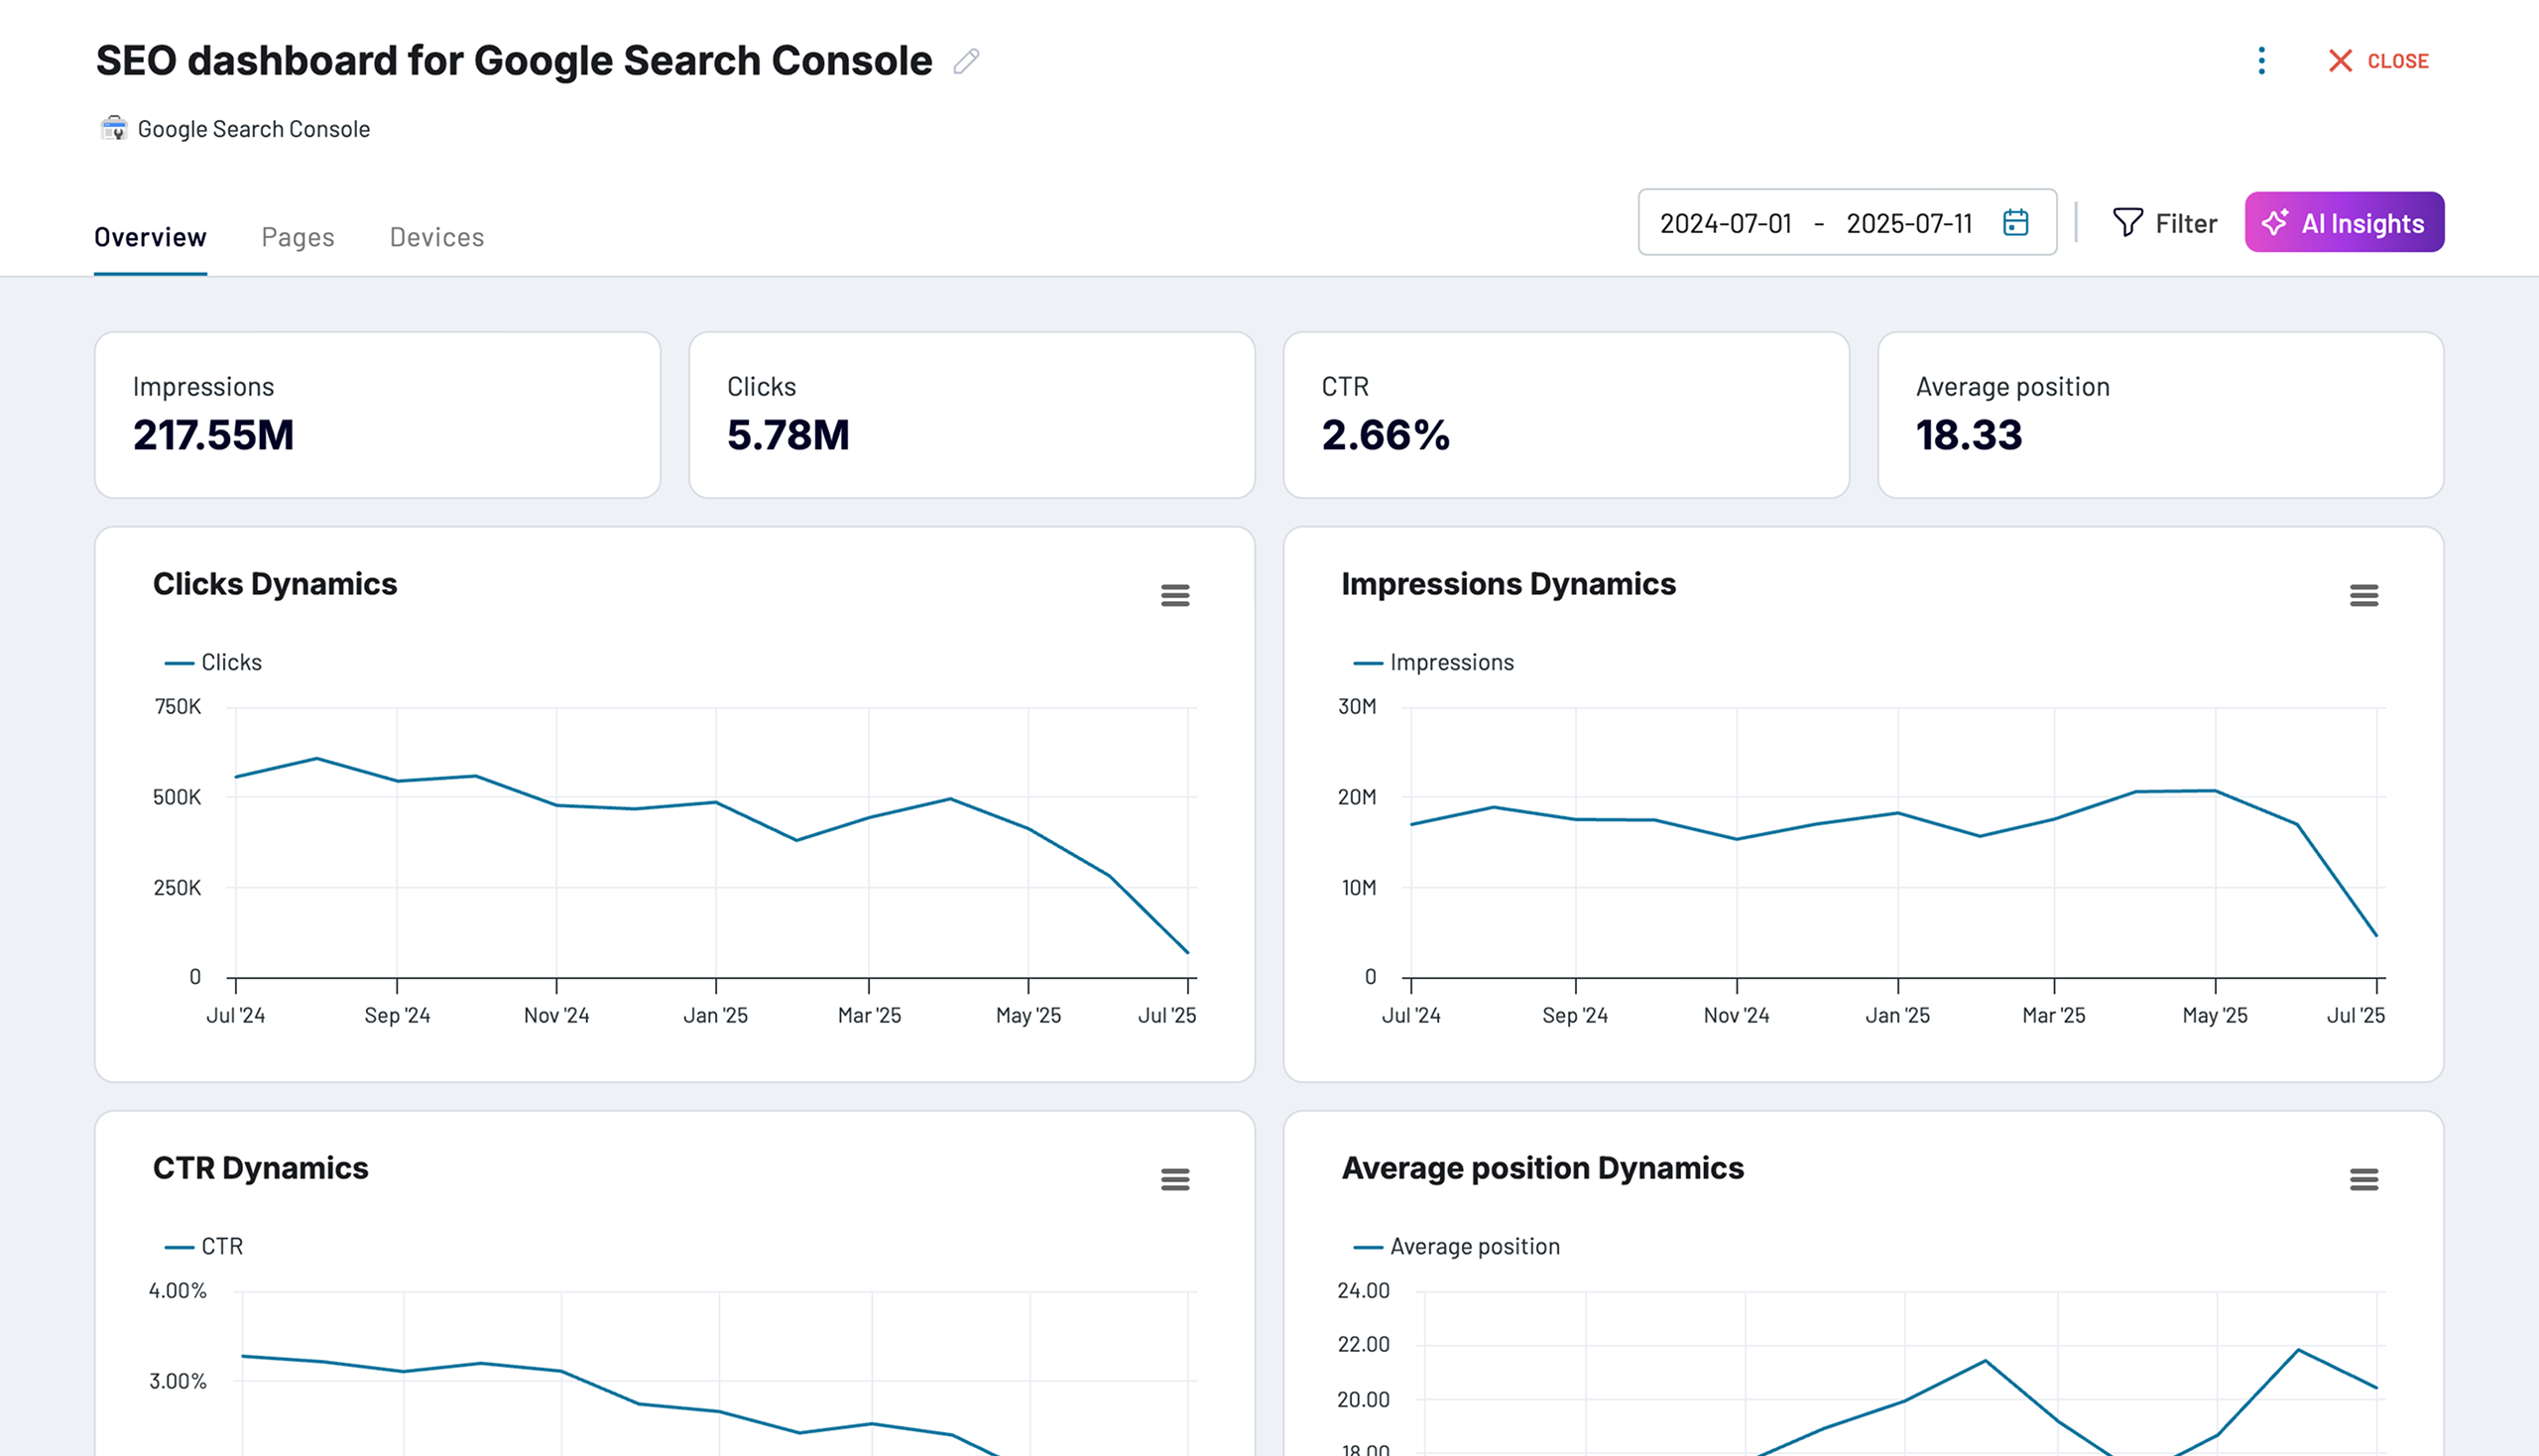
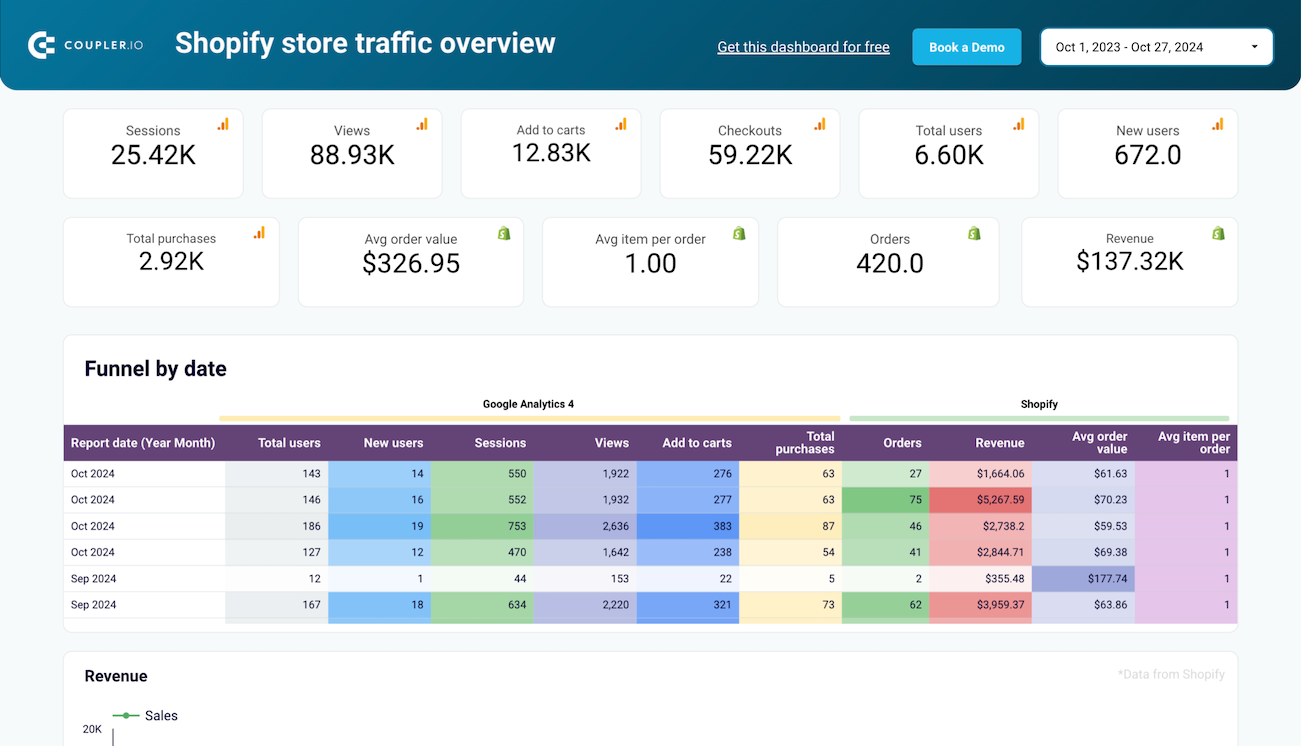
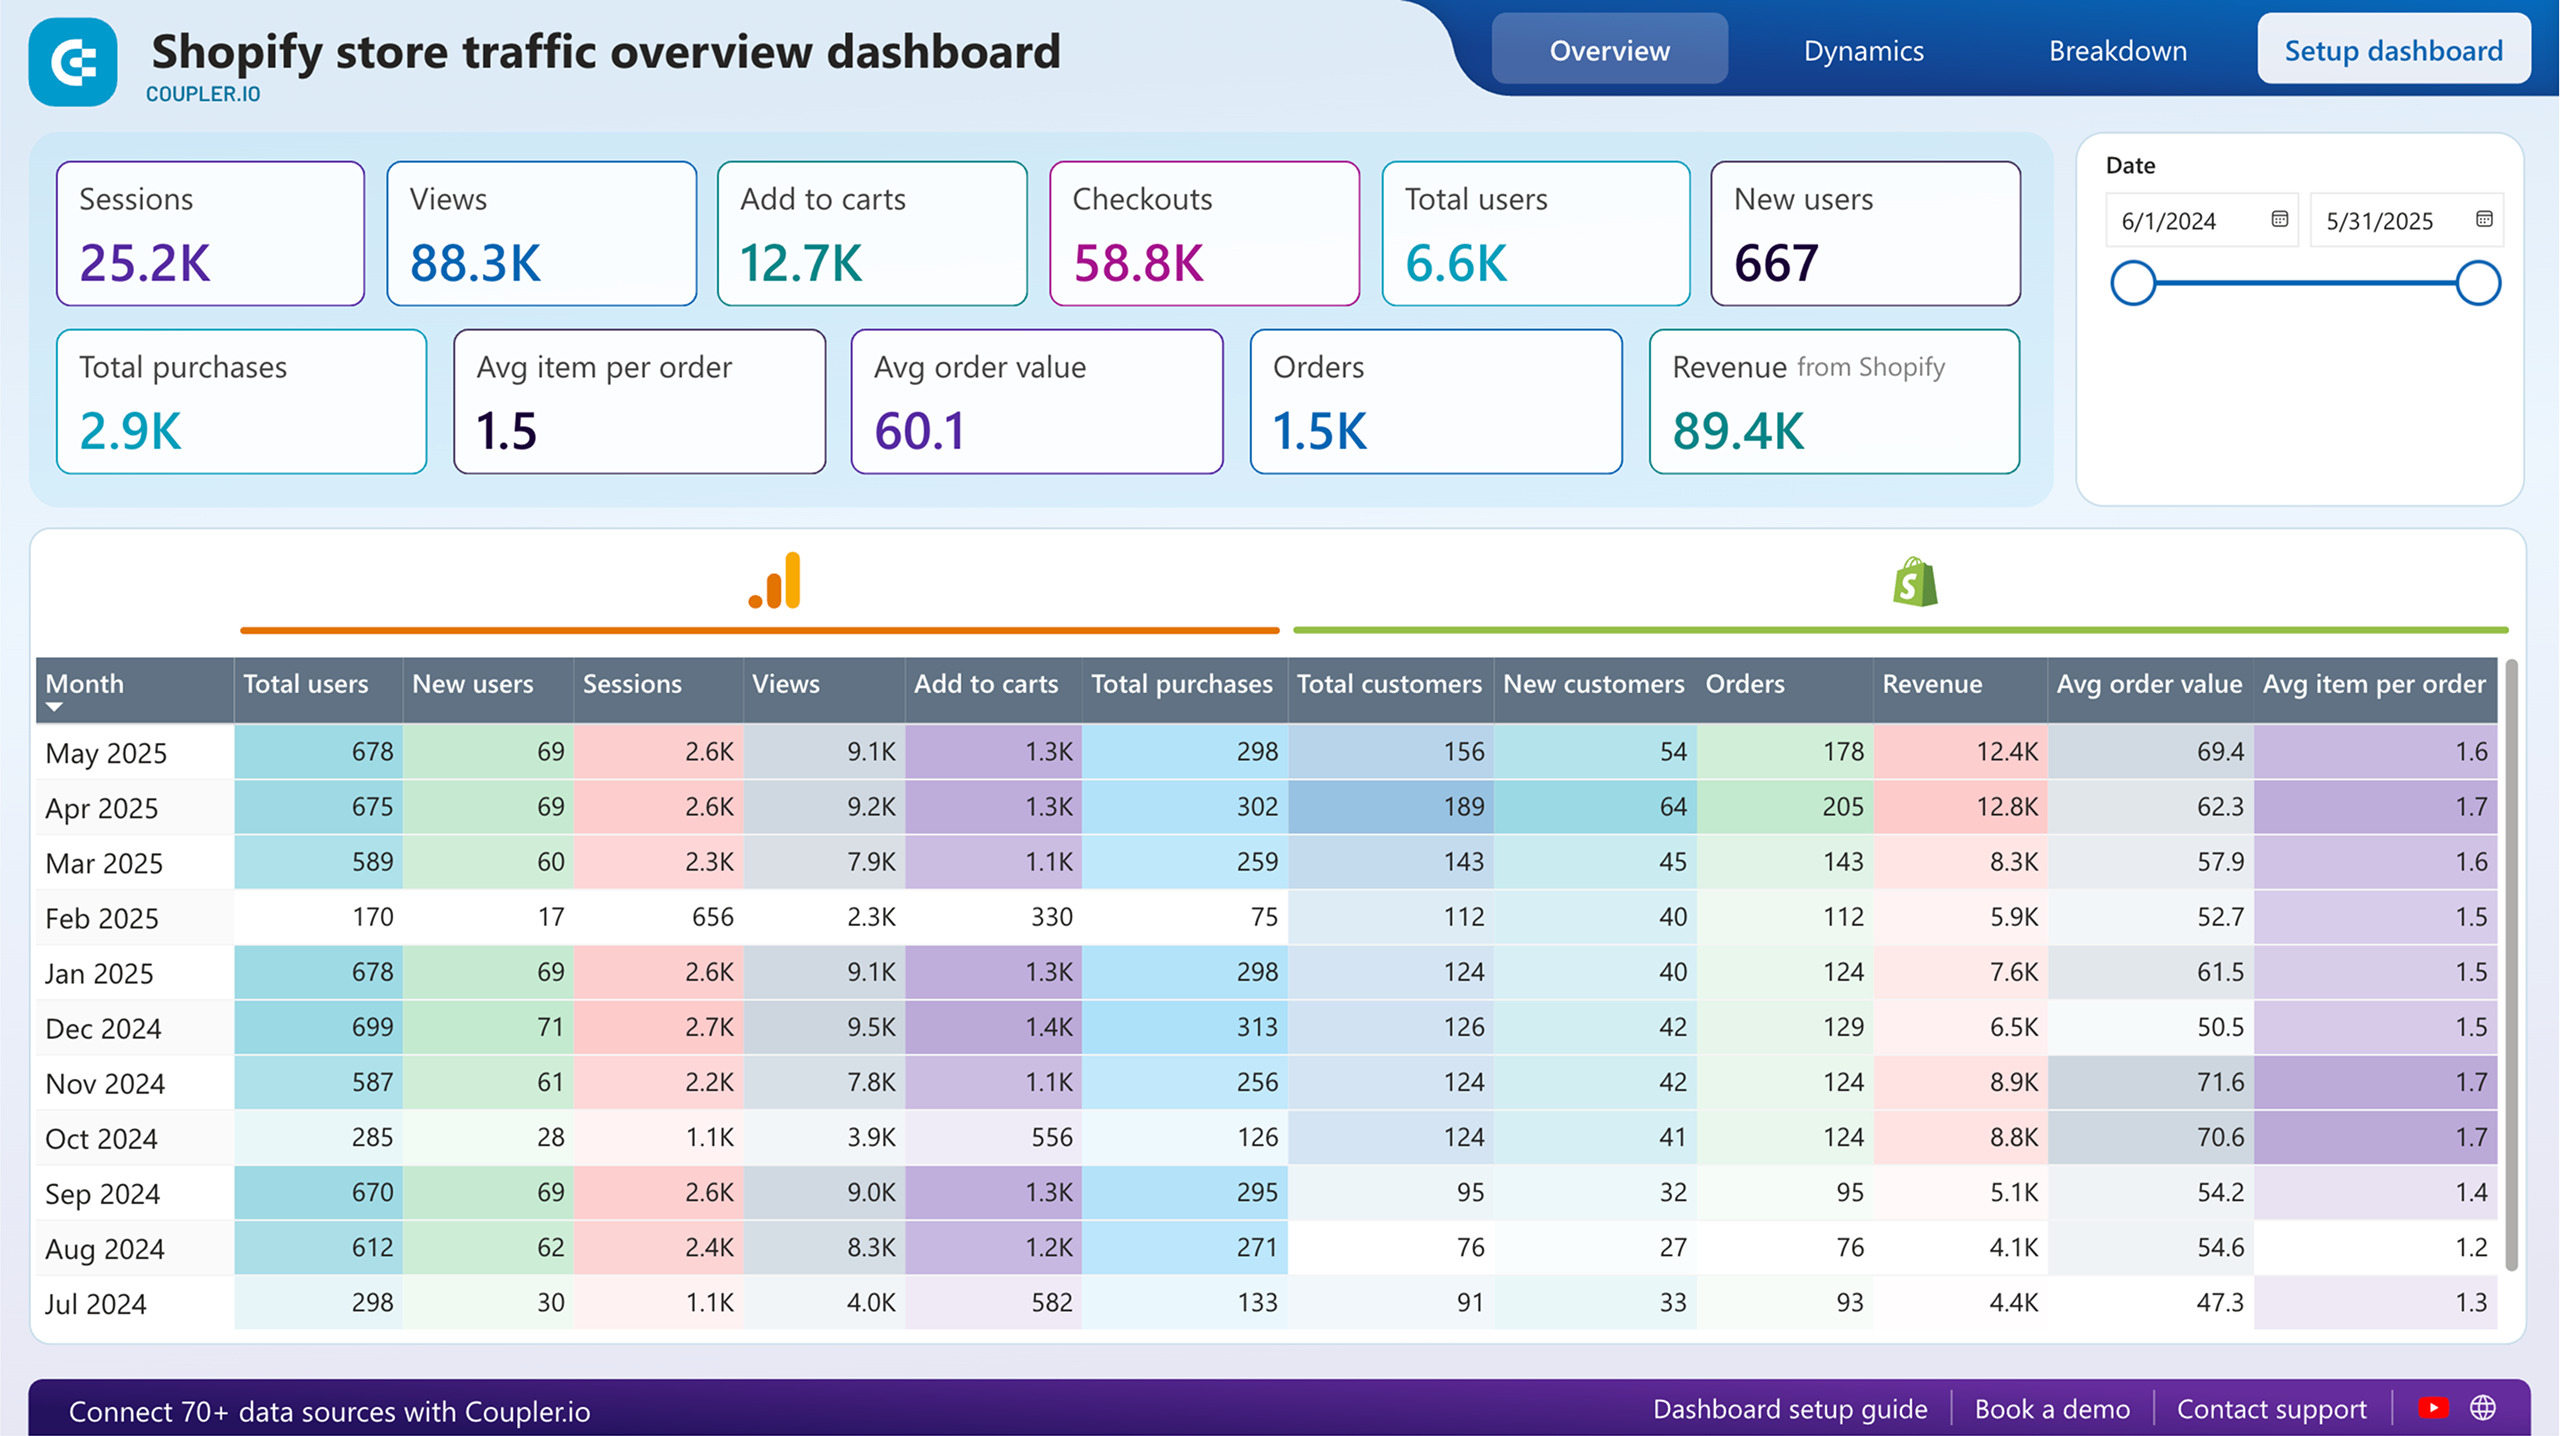
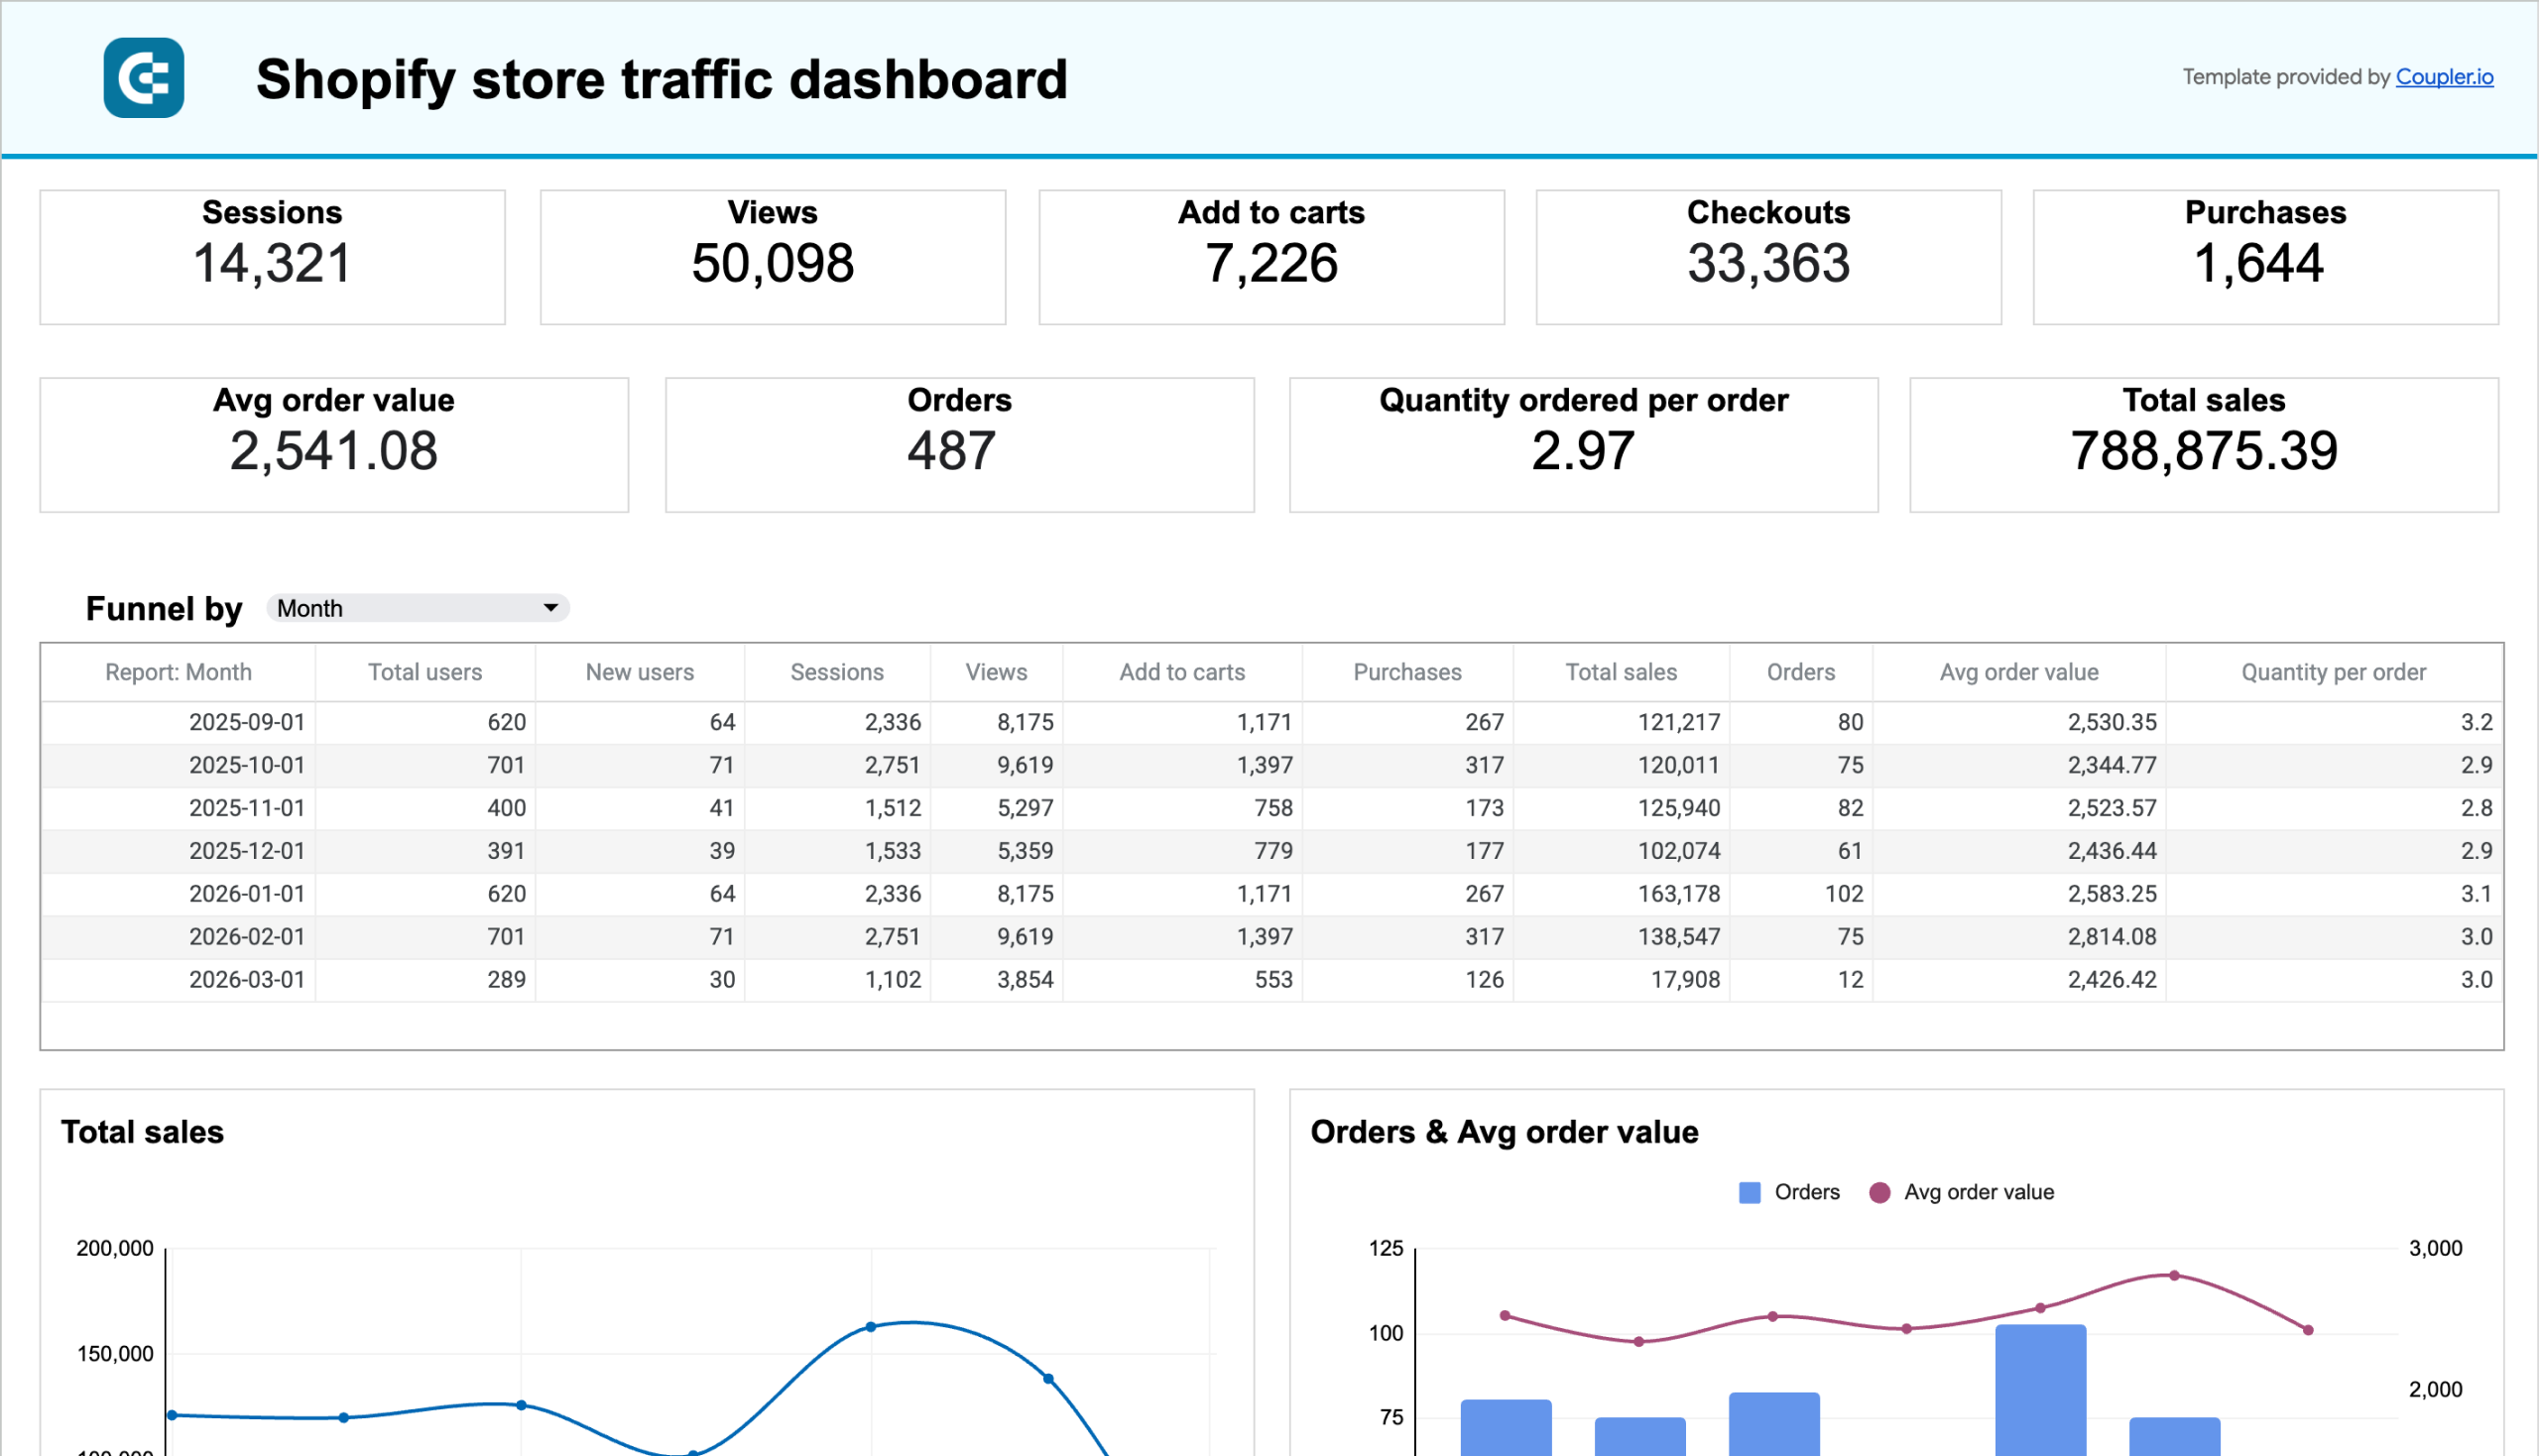
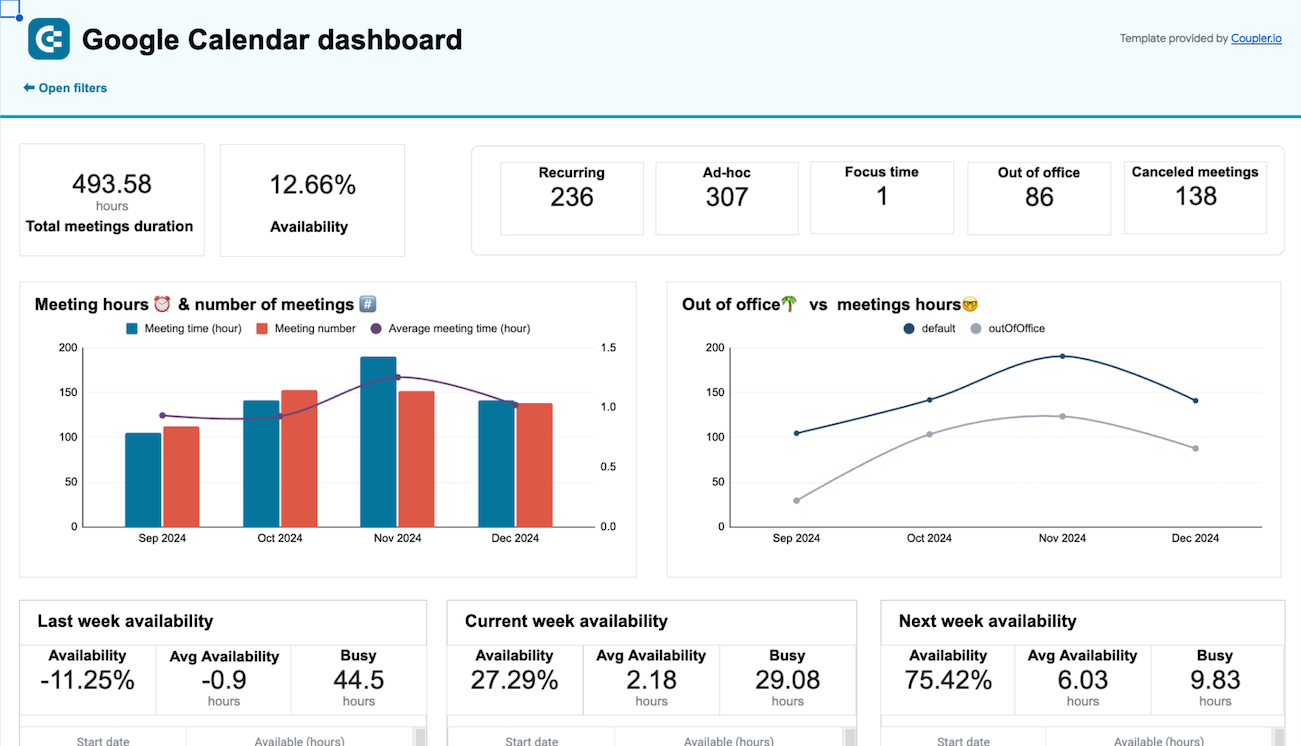
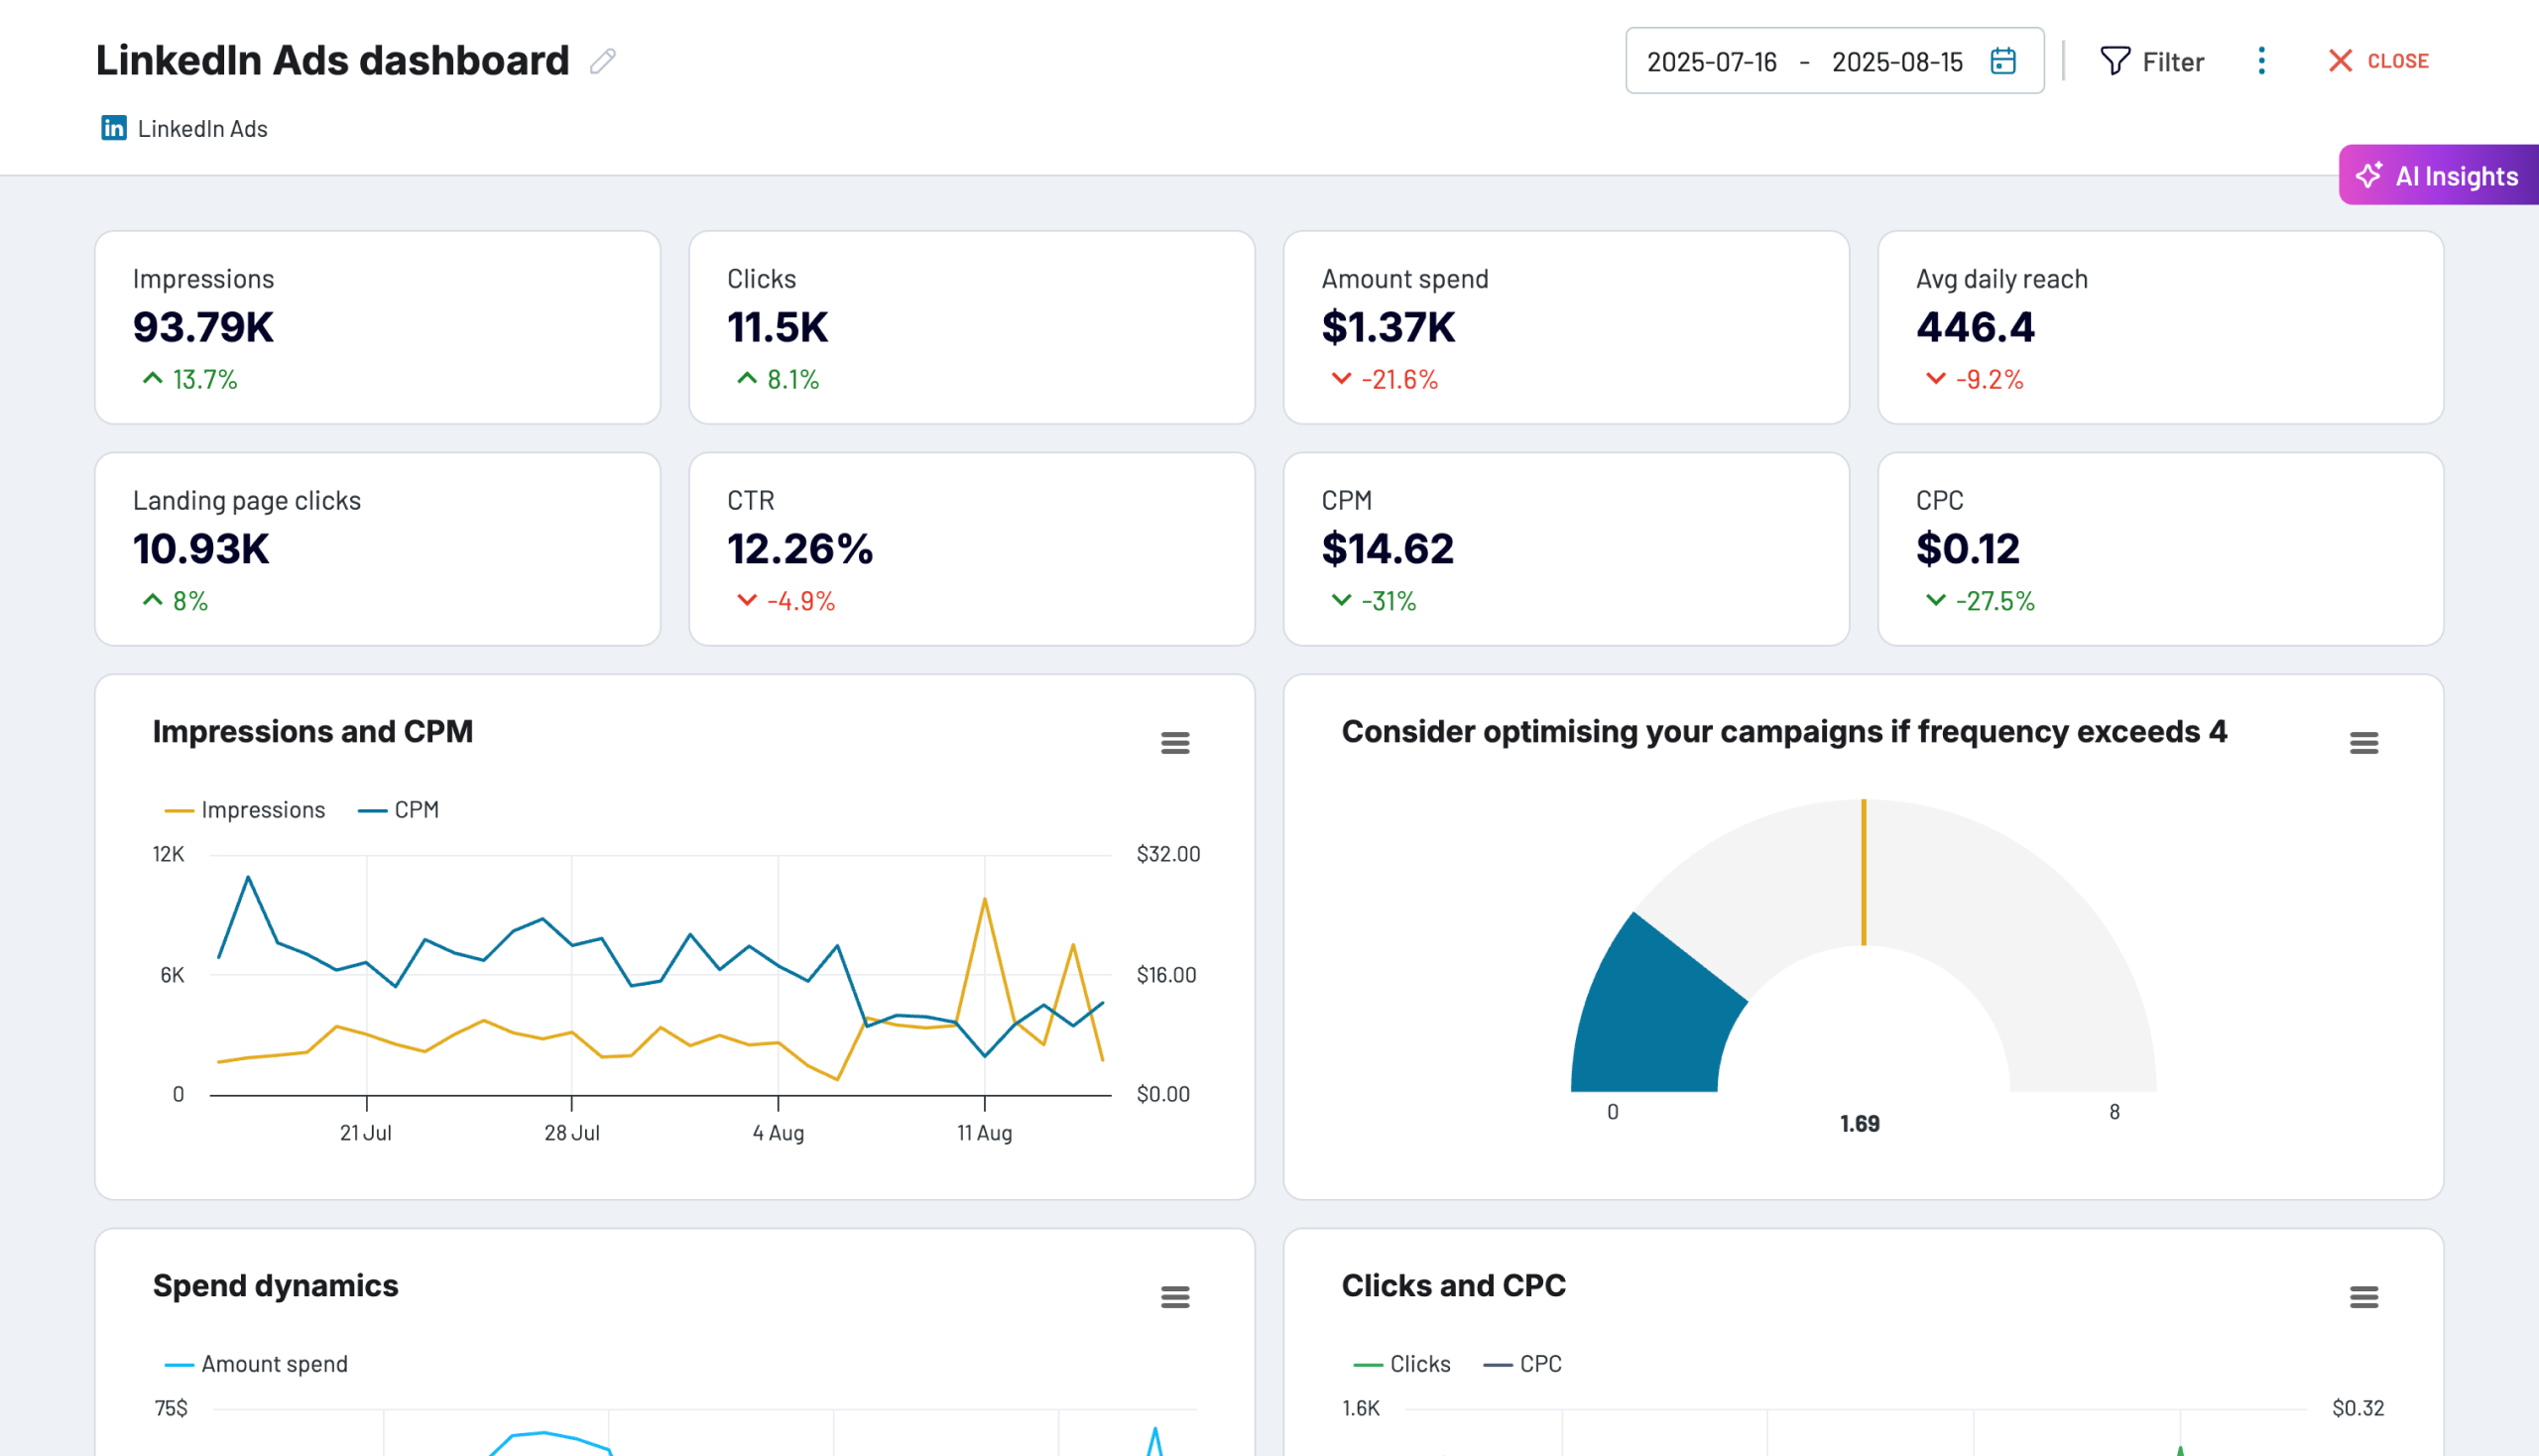
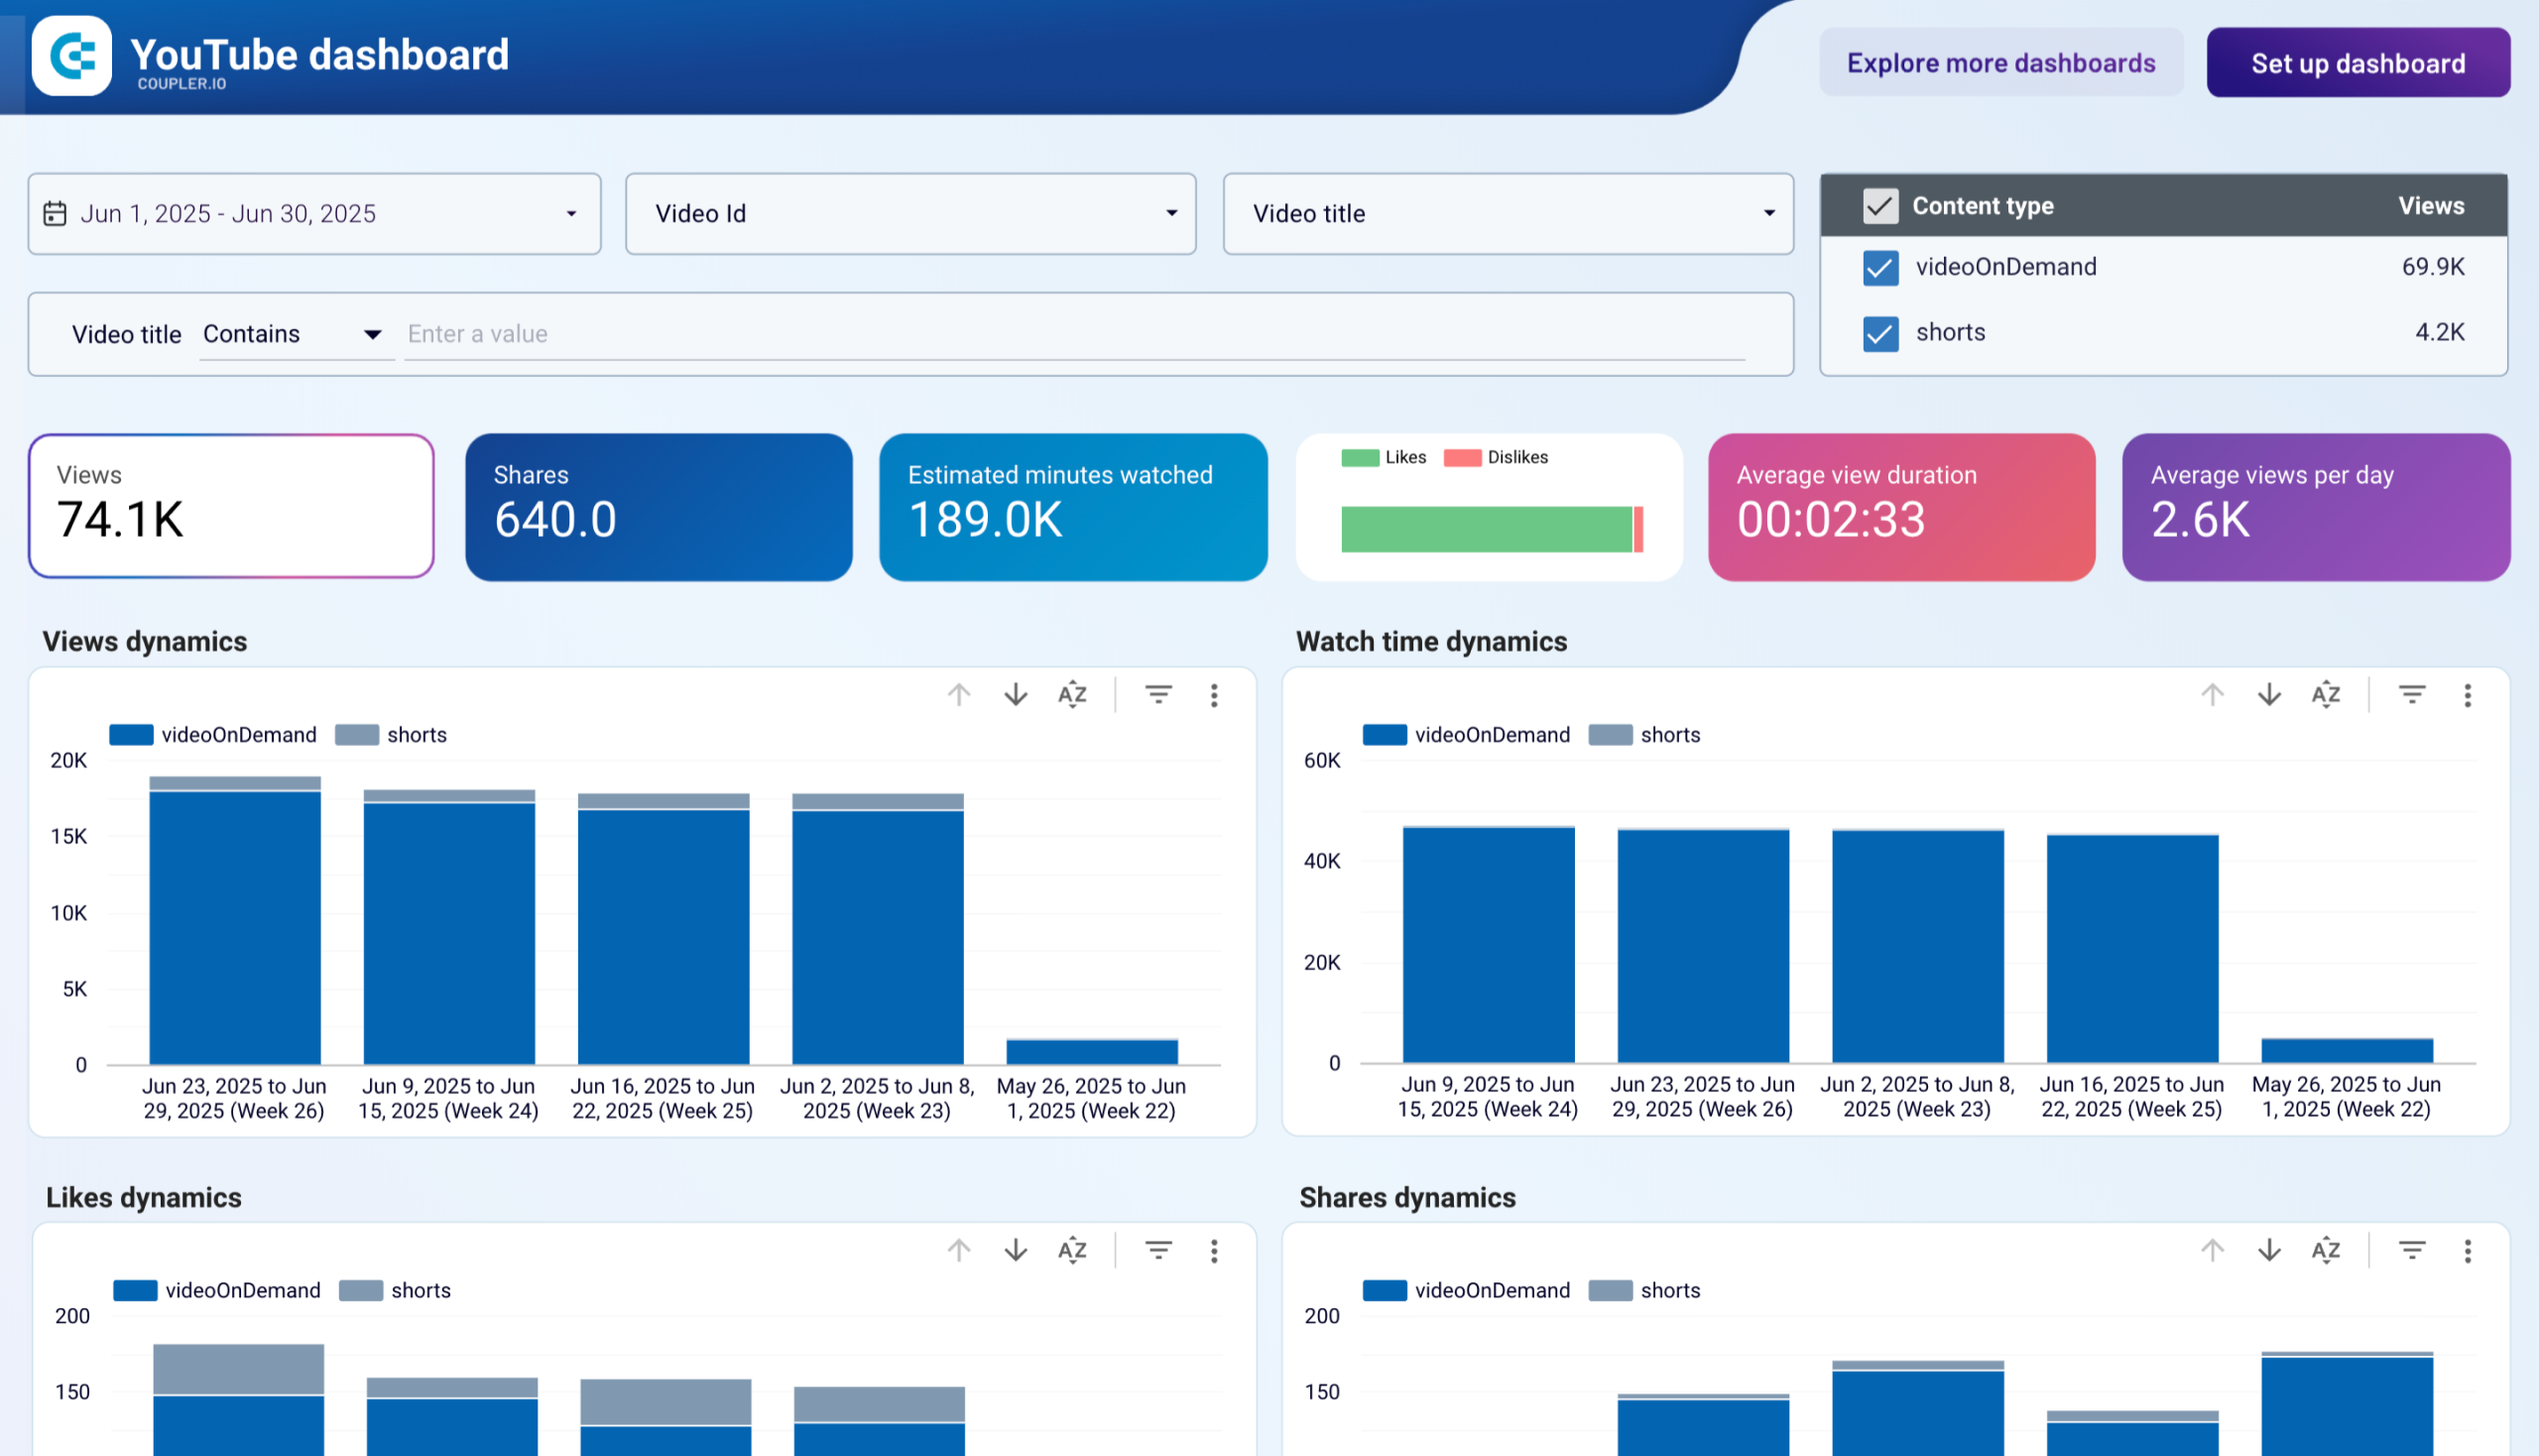
Analyze the progress of your channel based on various metrics dynamics over time.

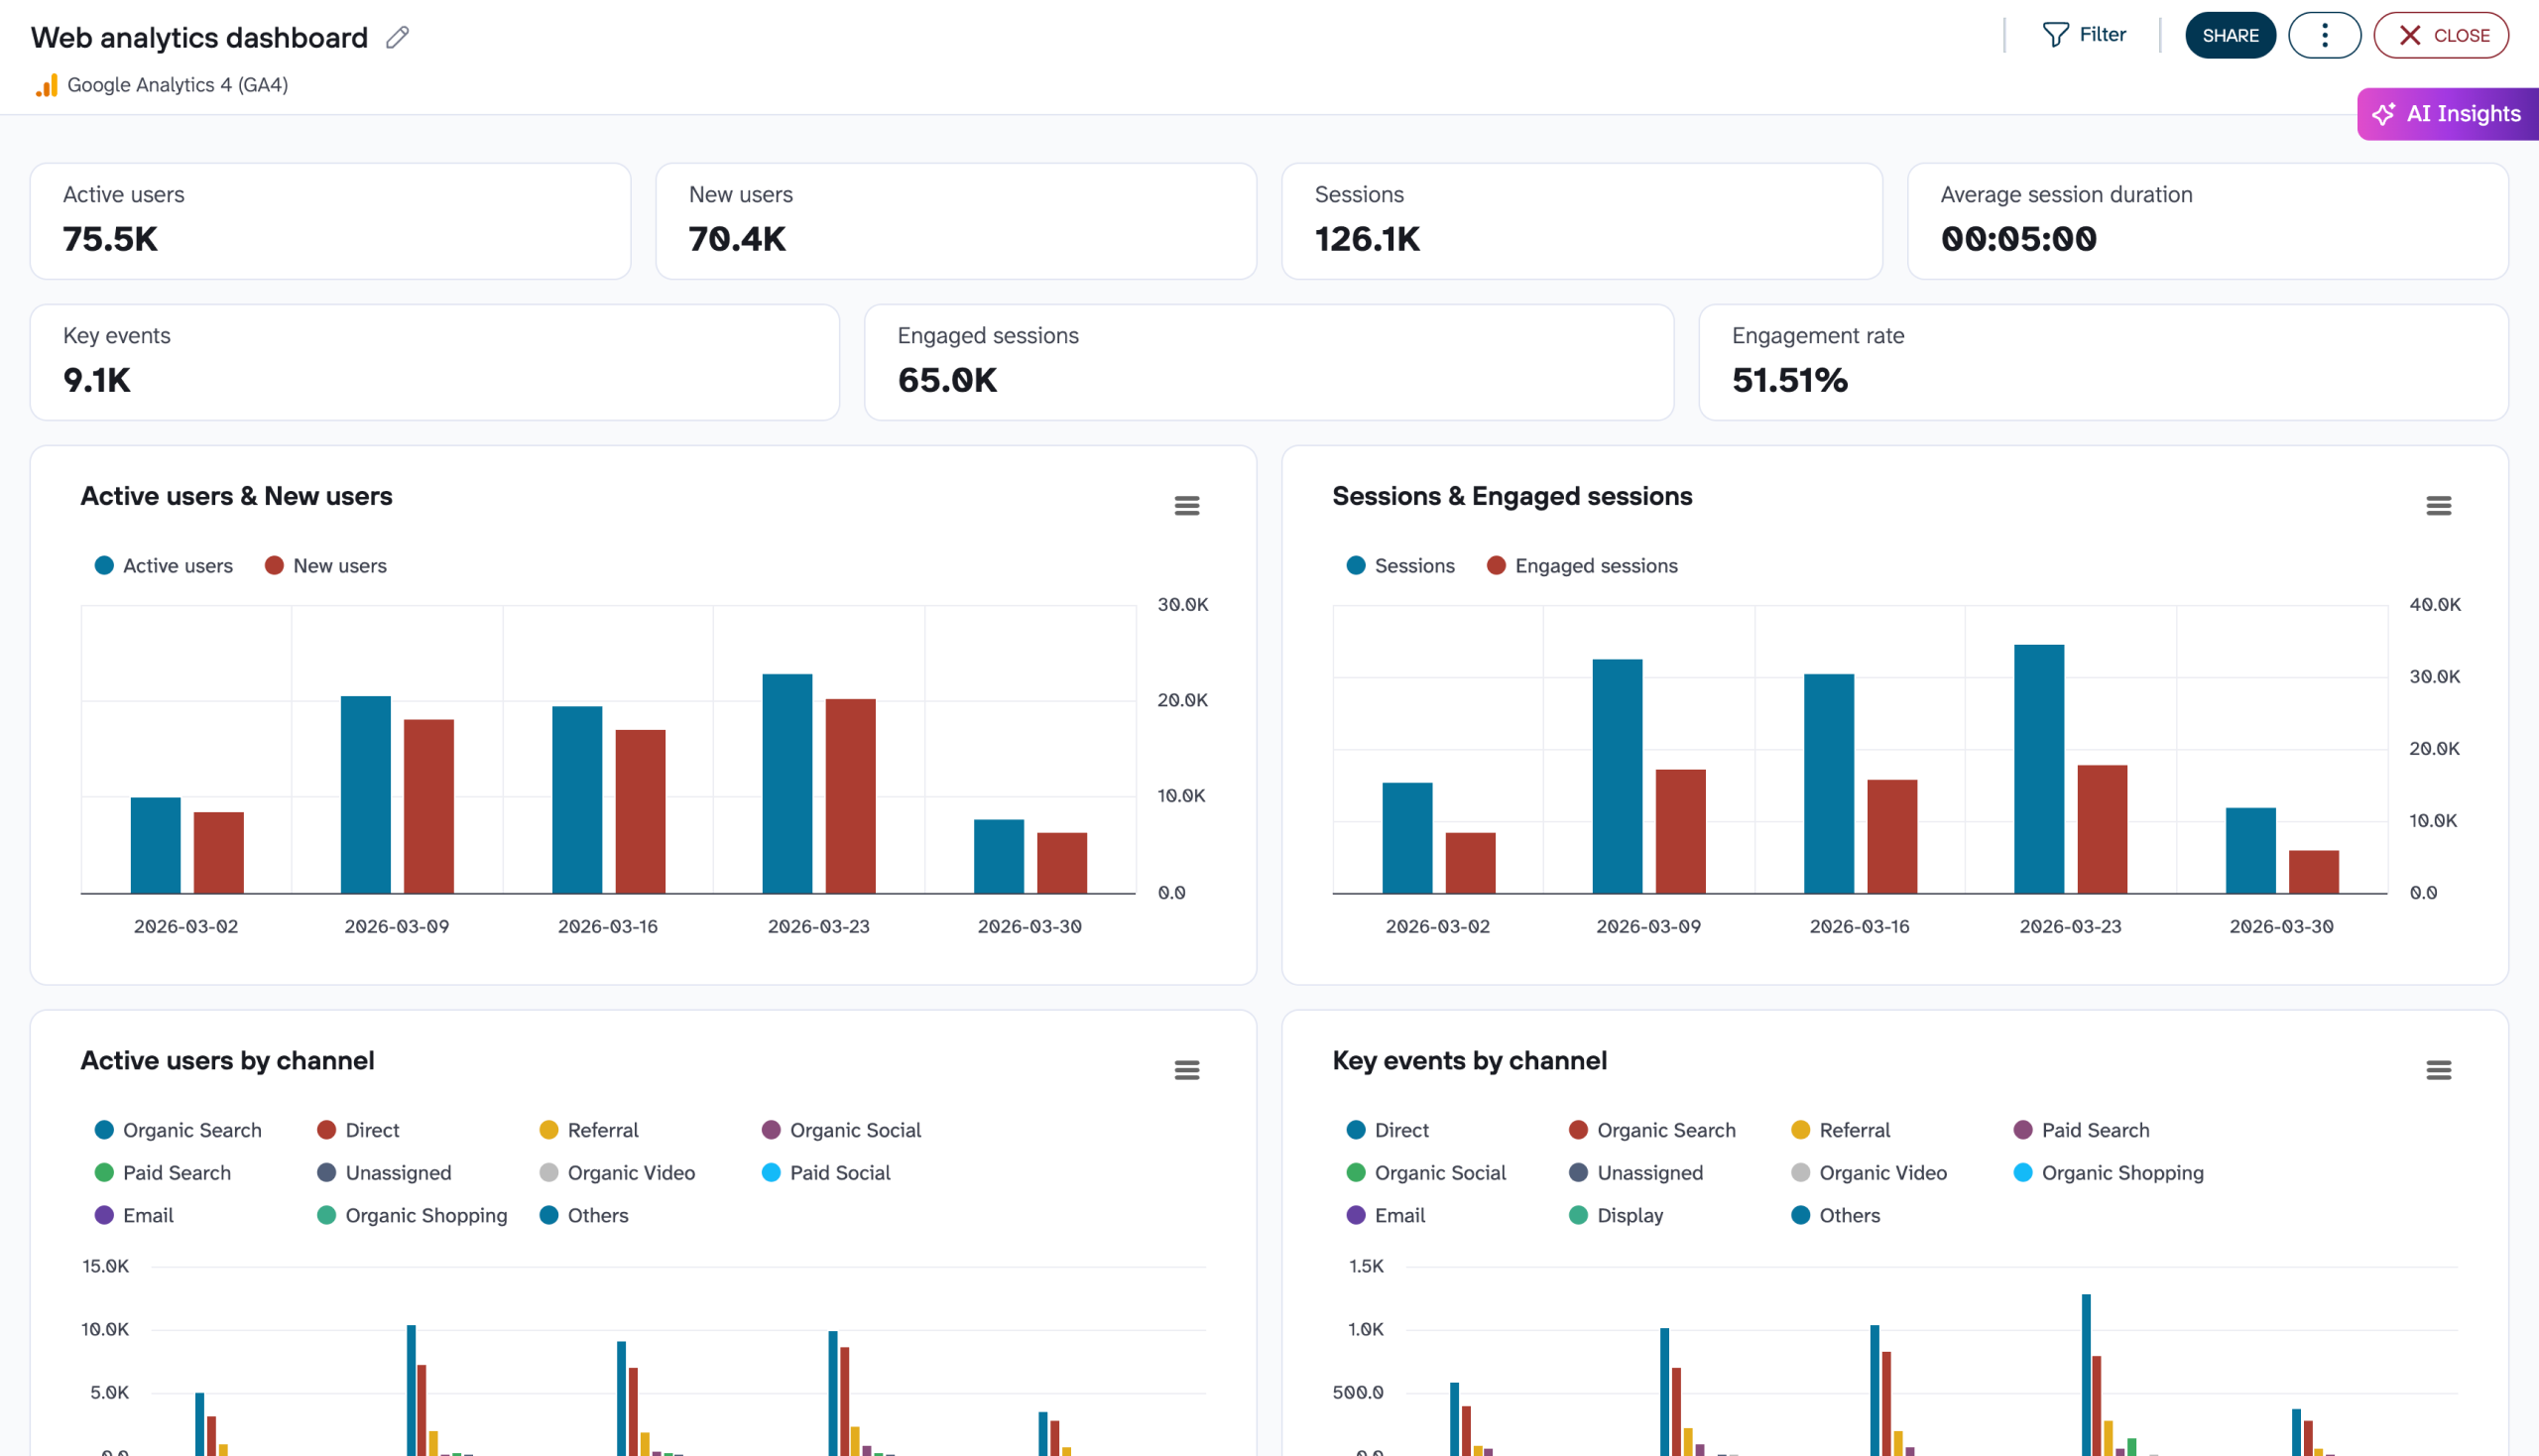
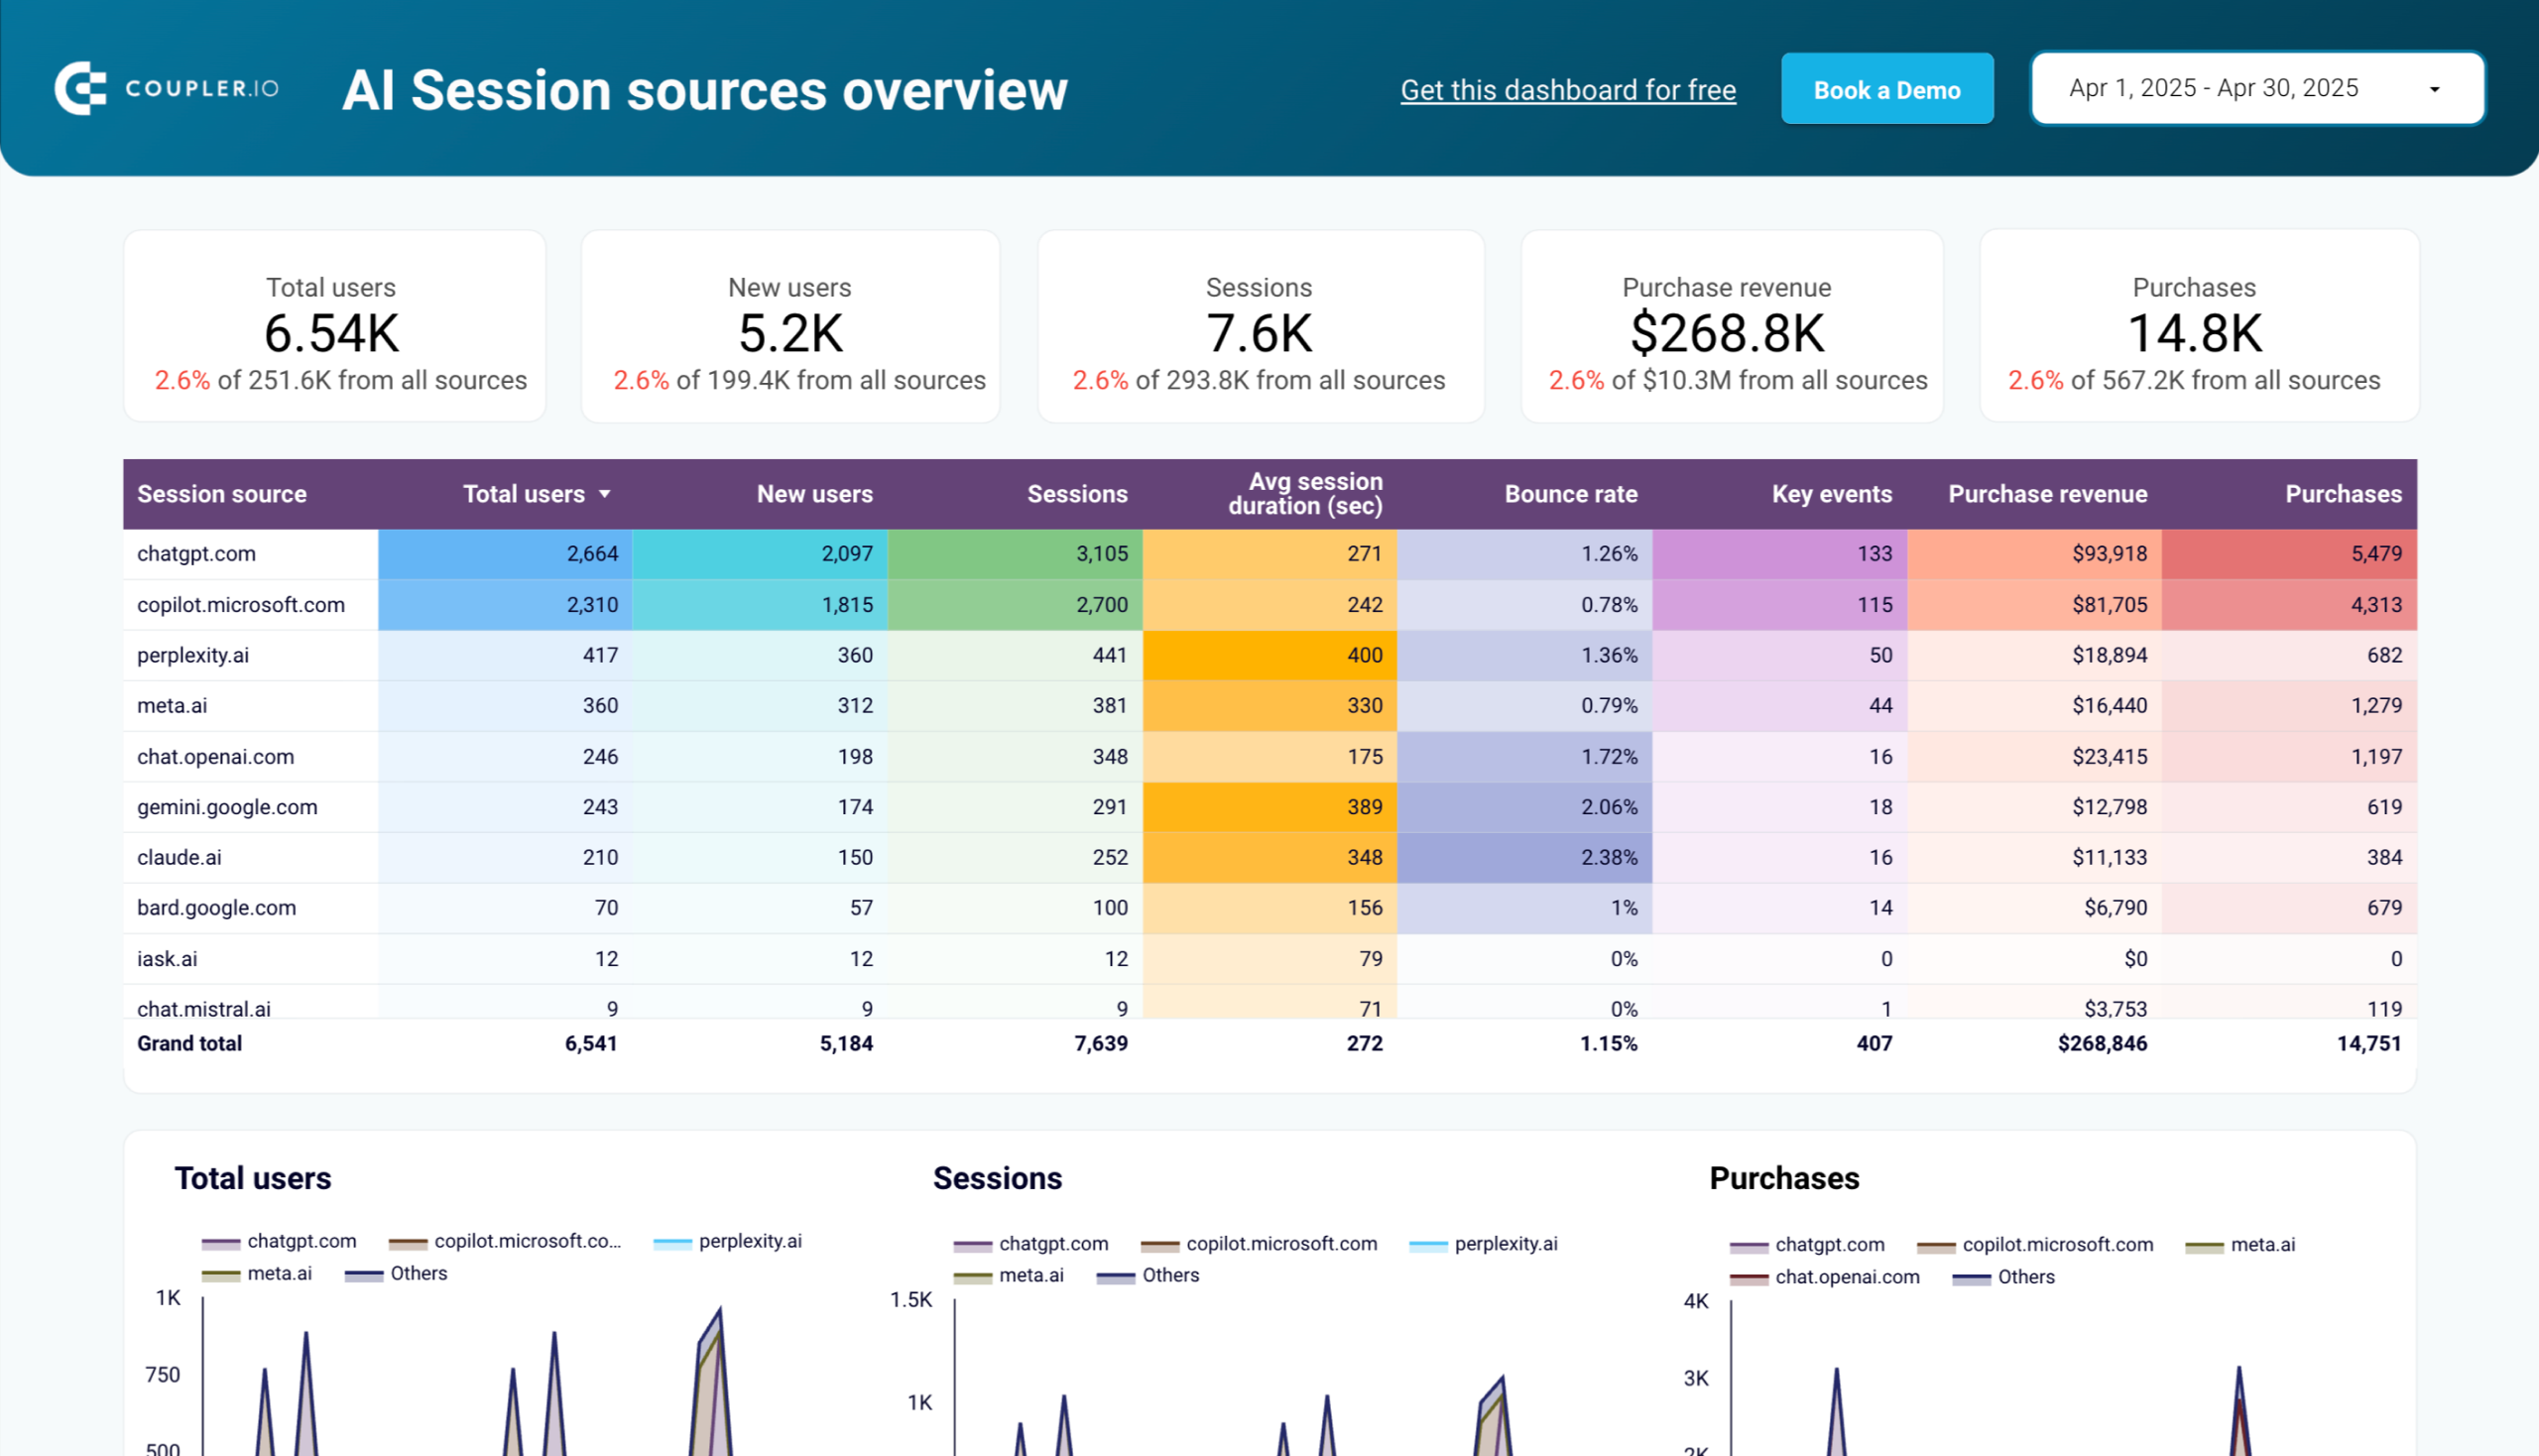
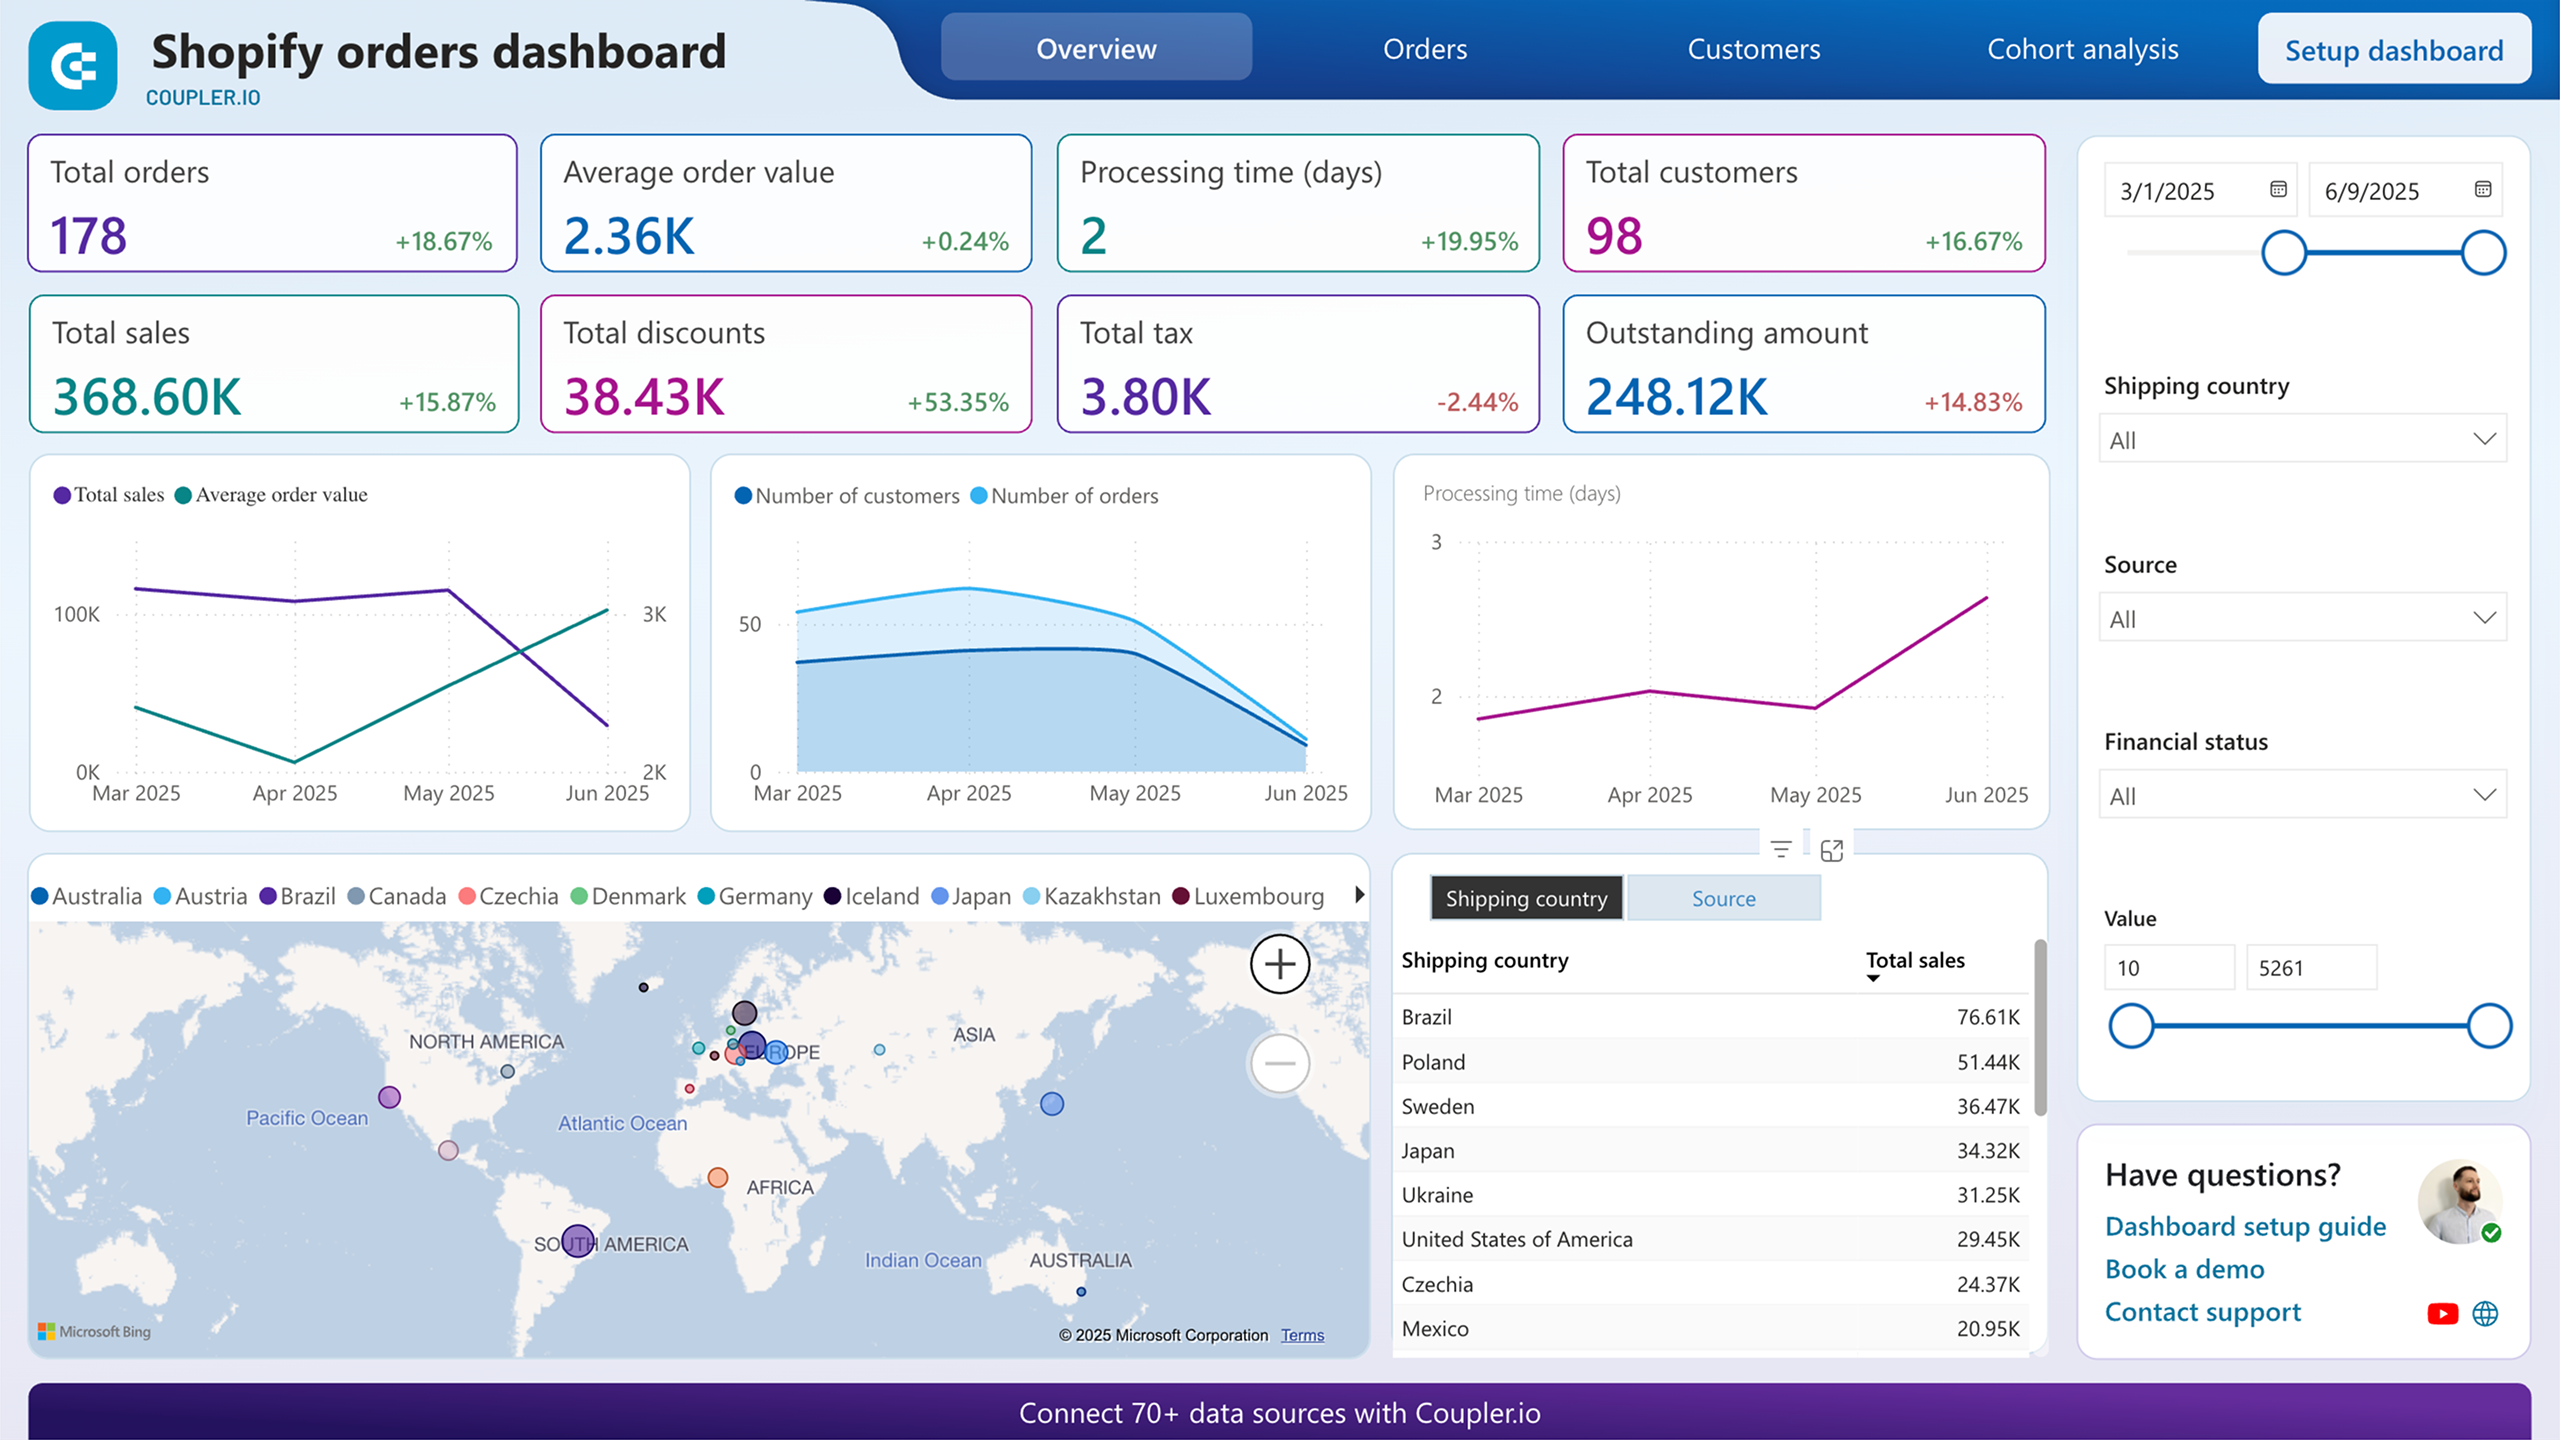
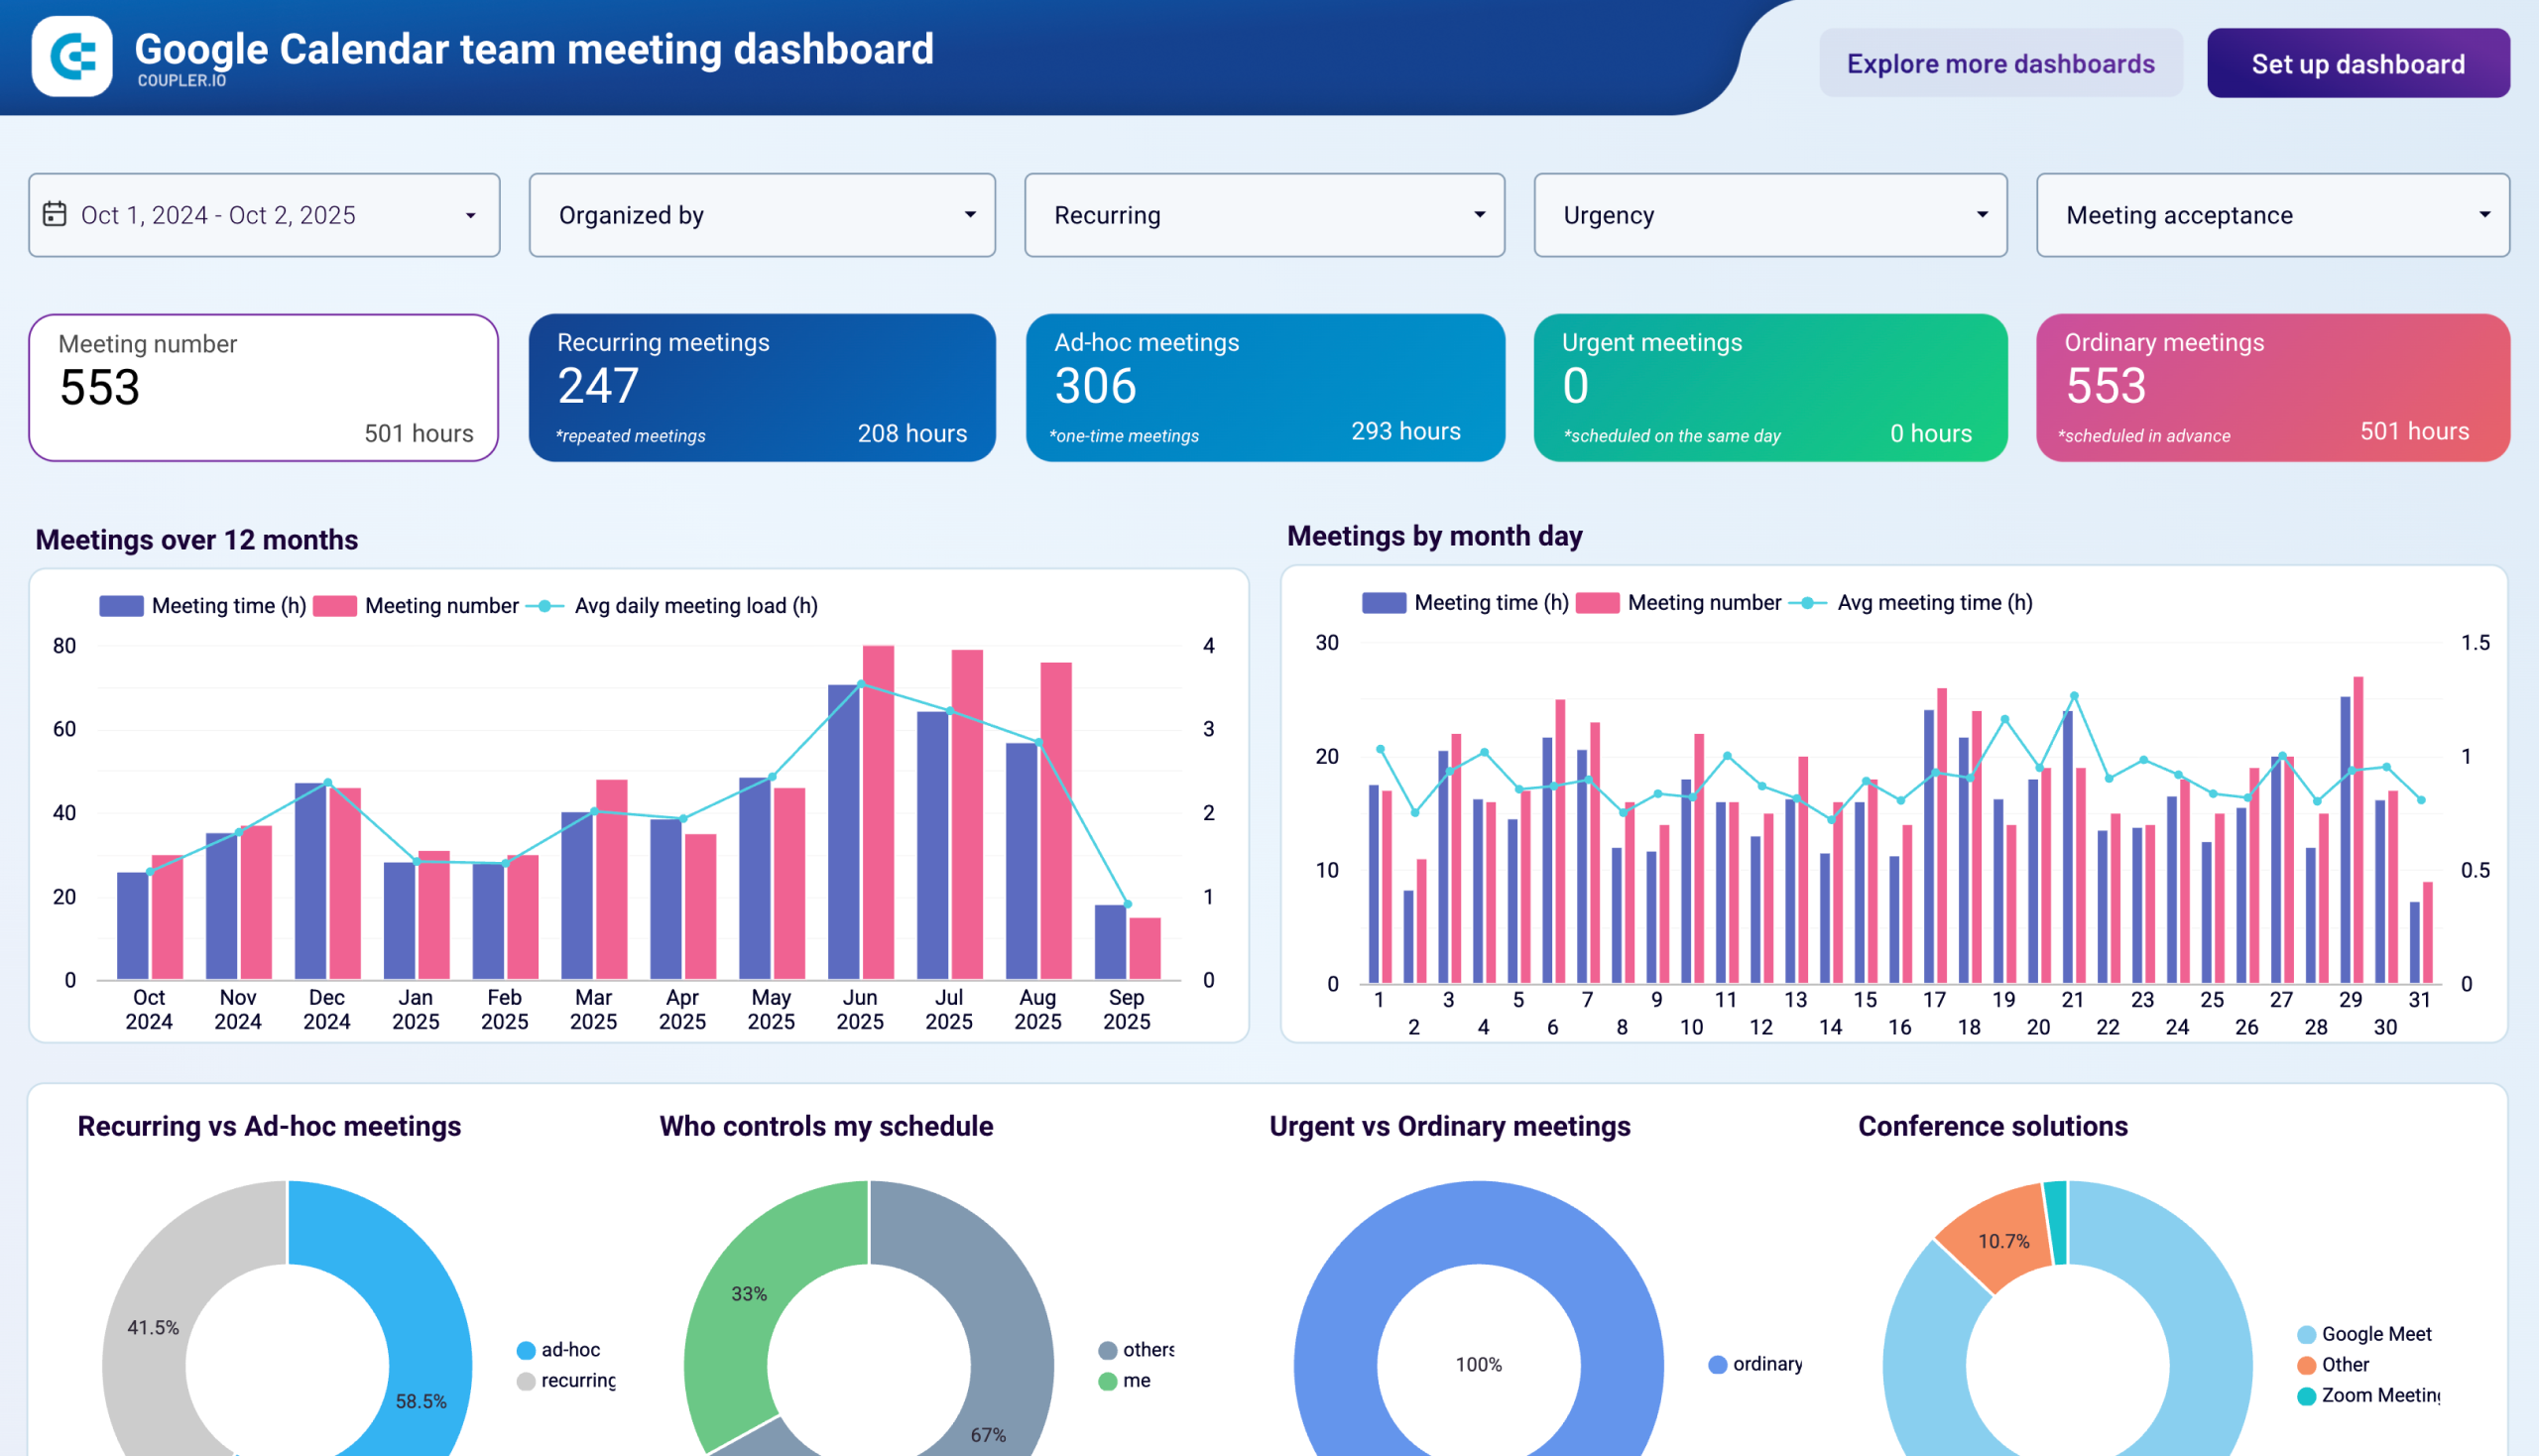
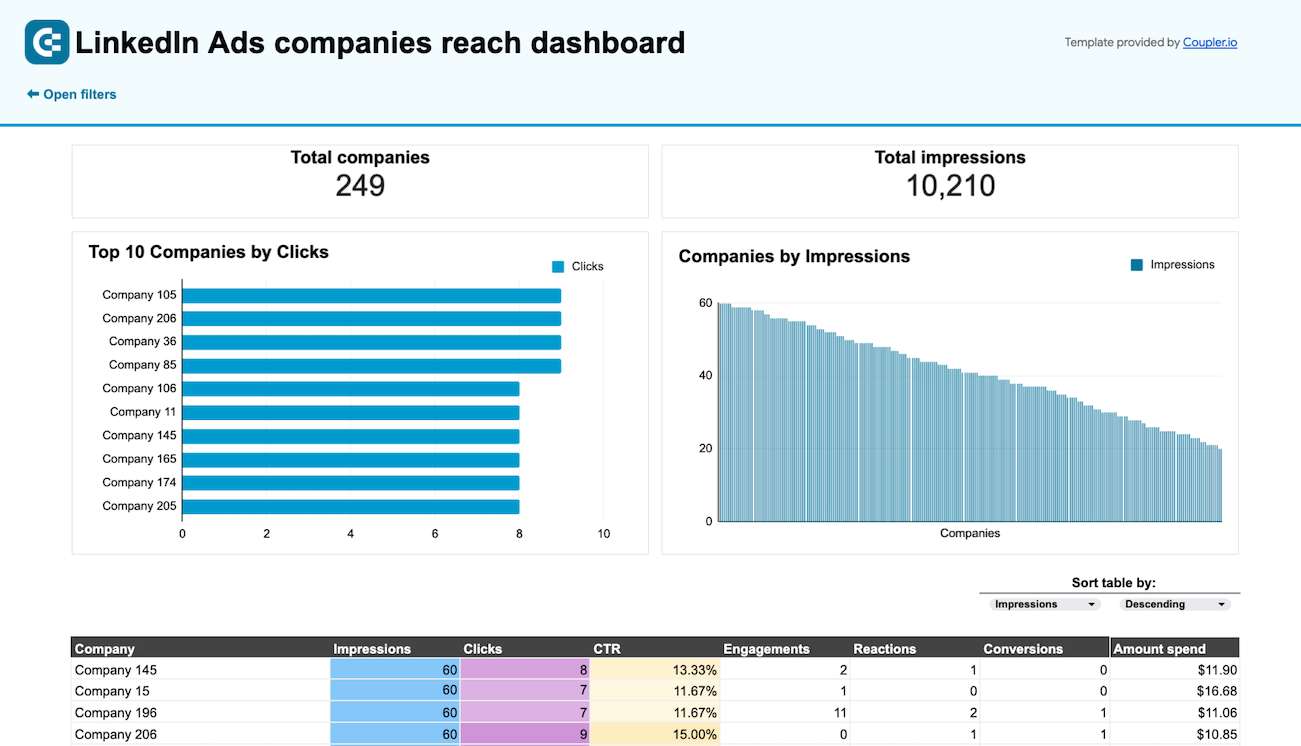
Understand who your audience is and where they come from to better tailor your content.

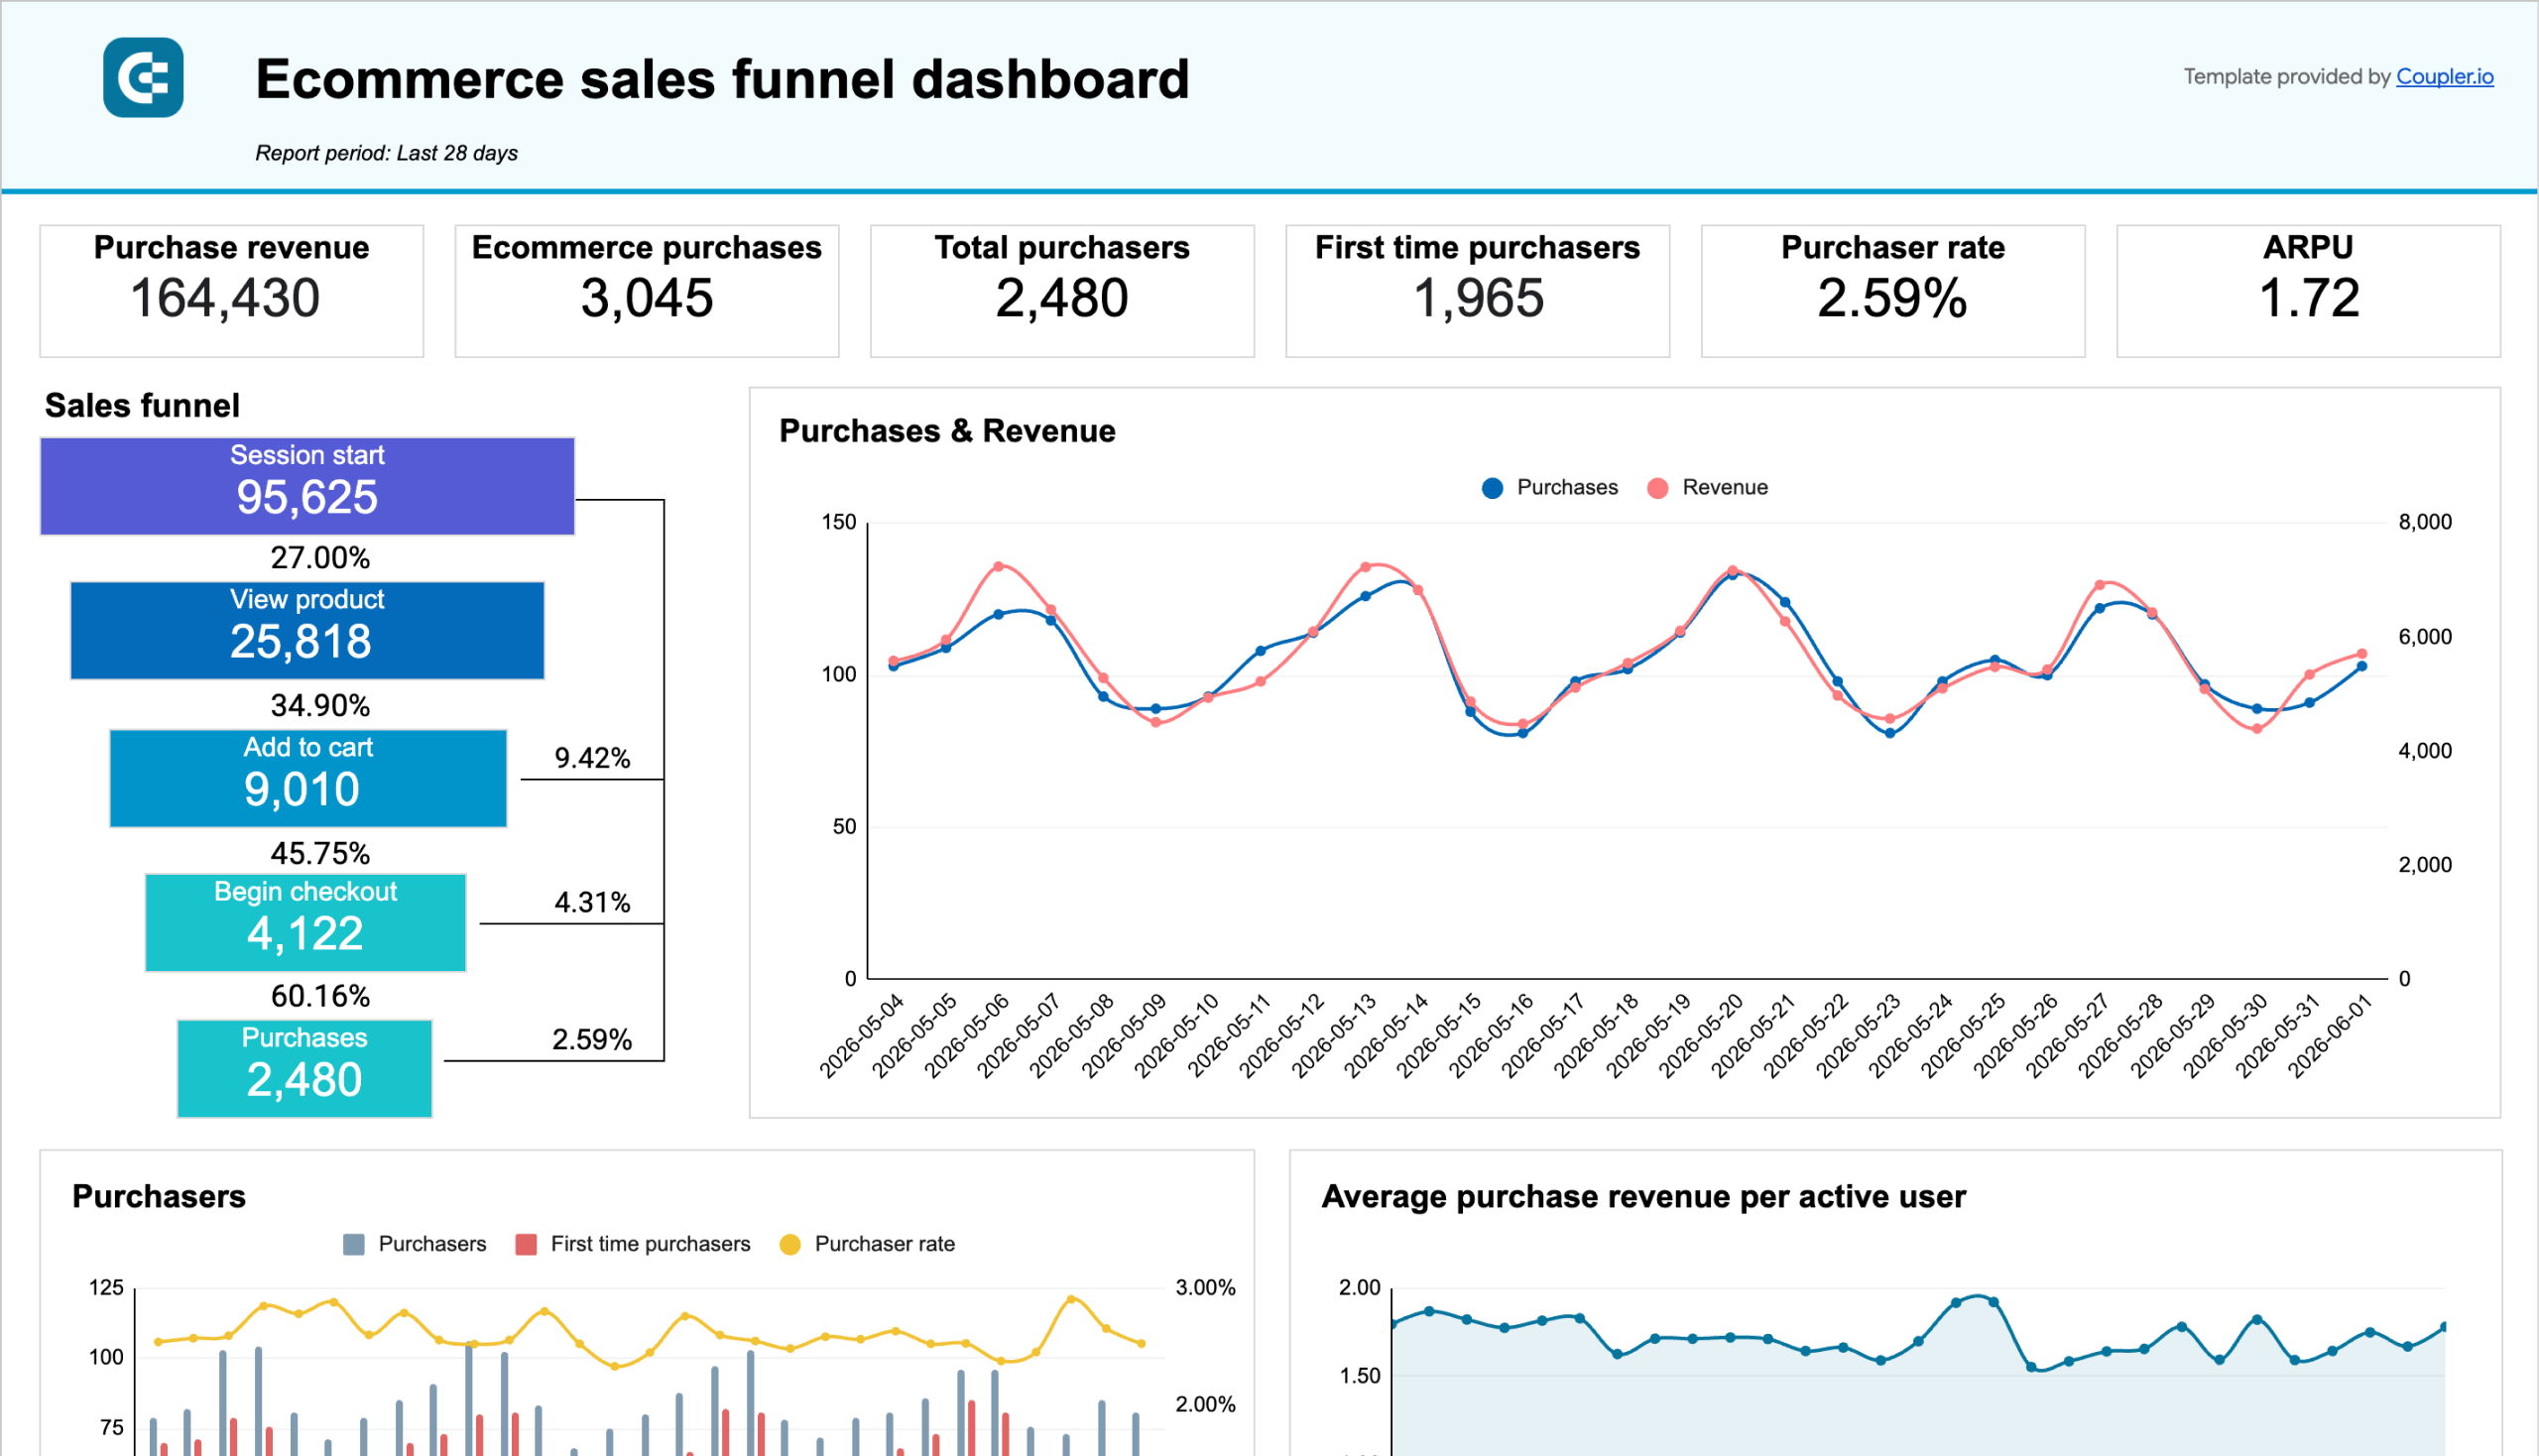
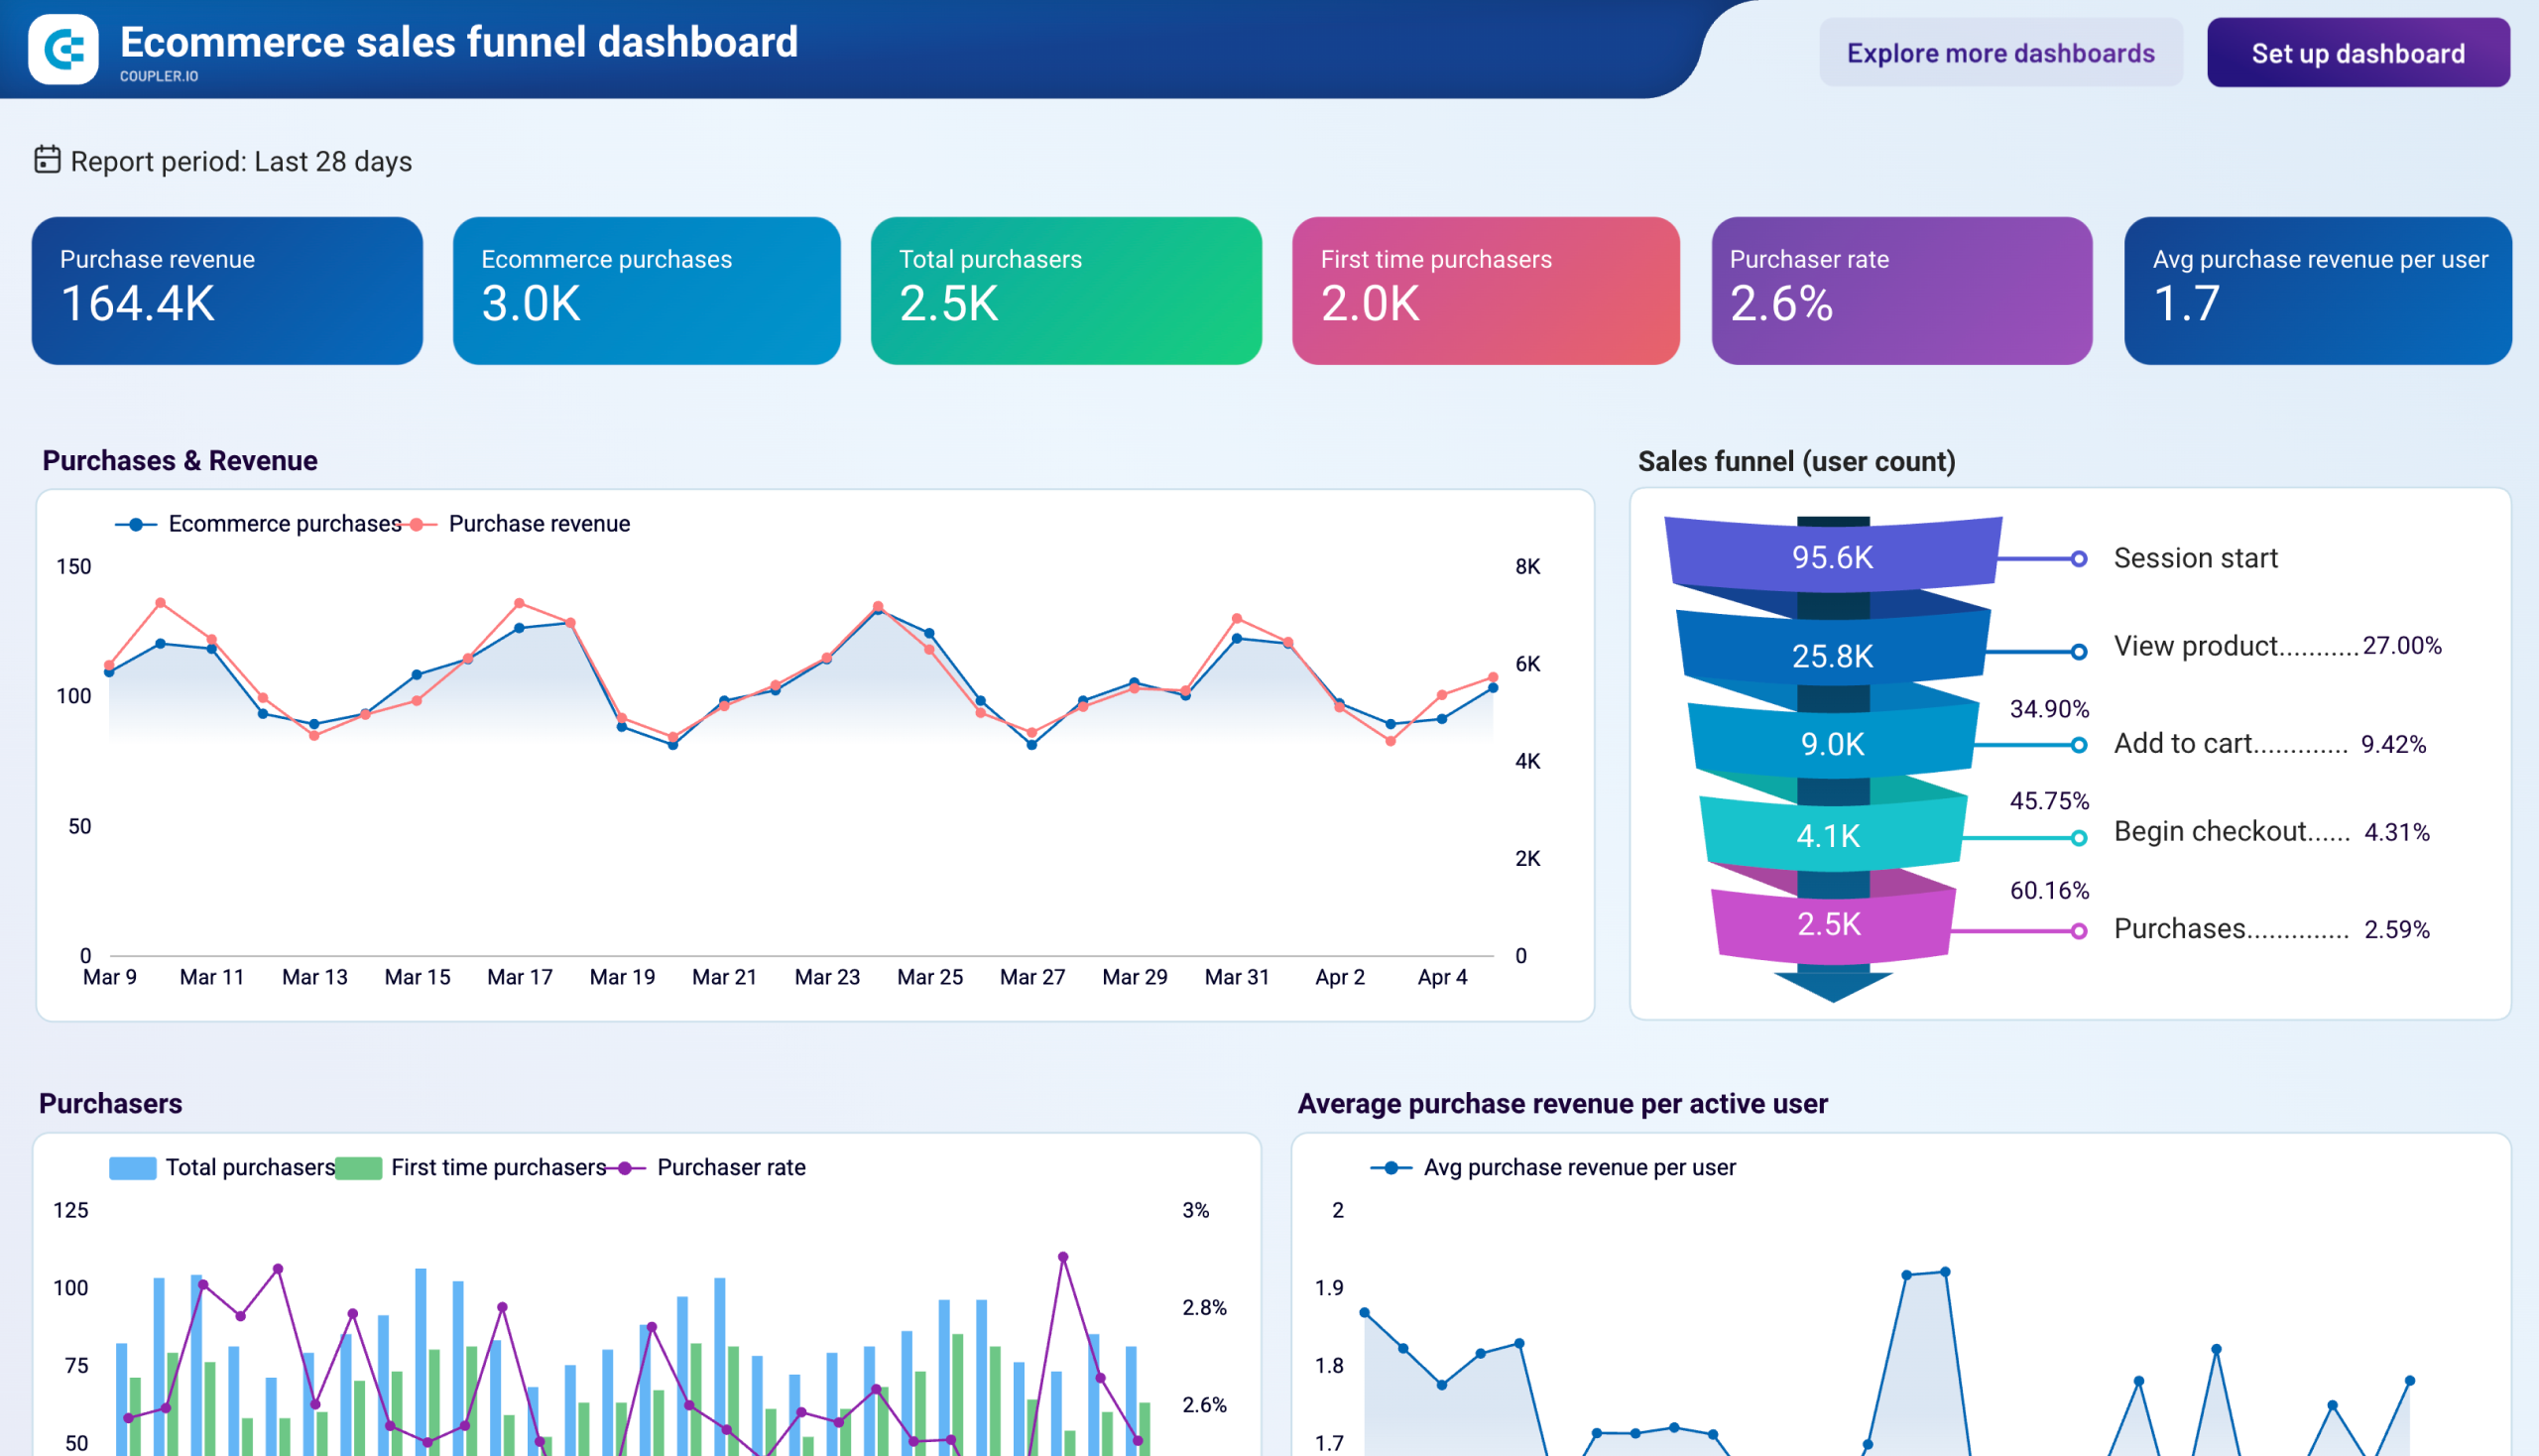
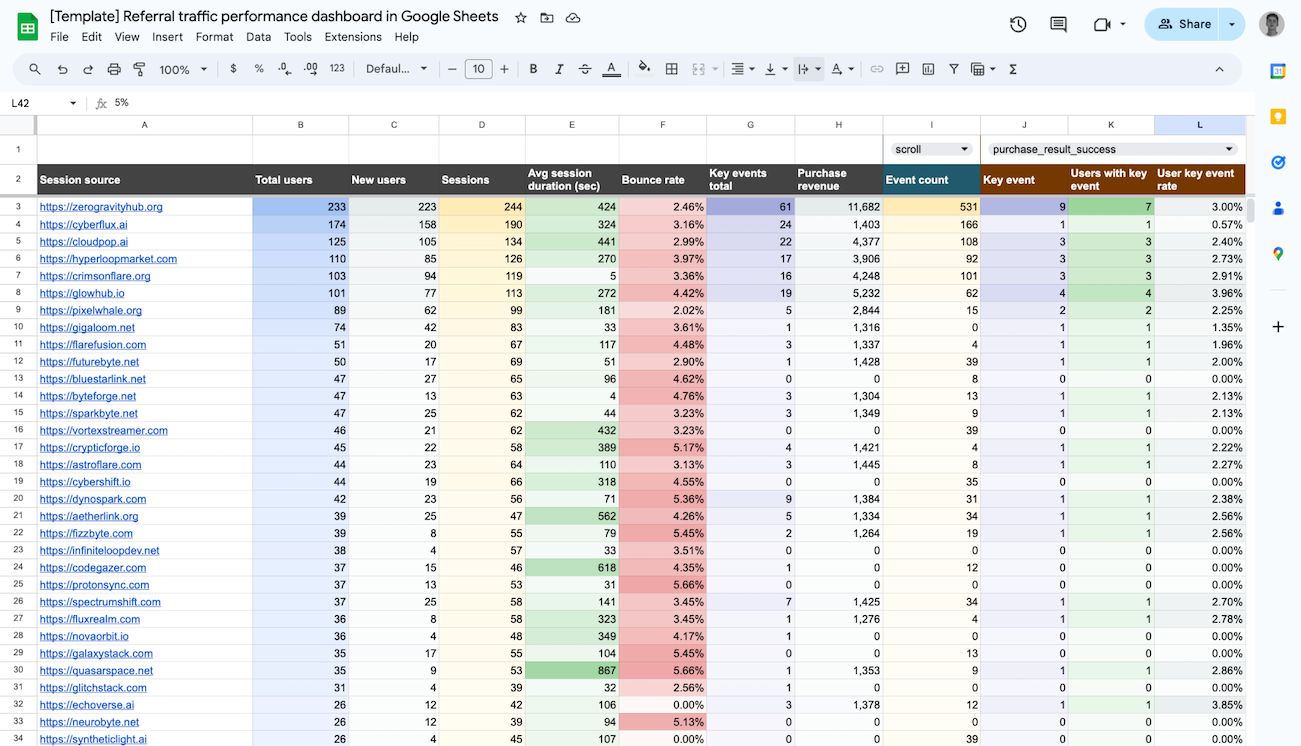
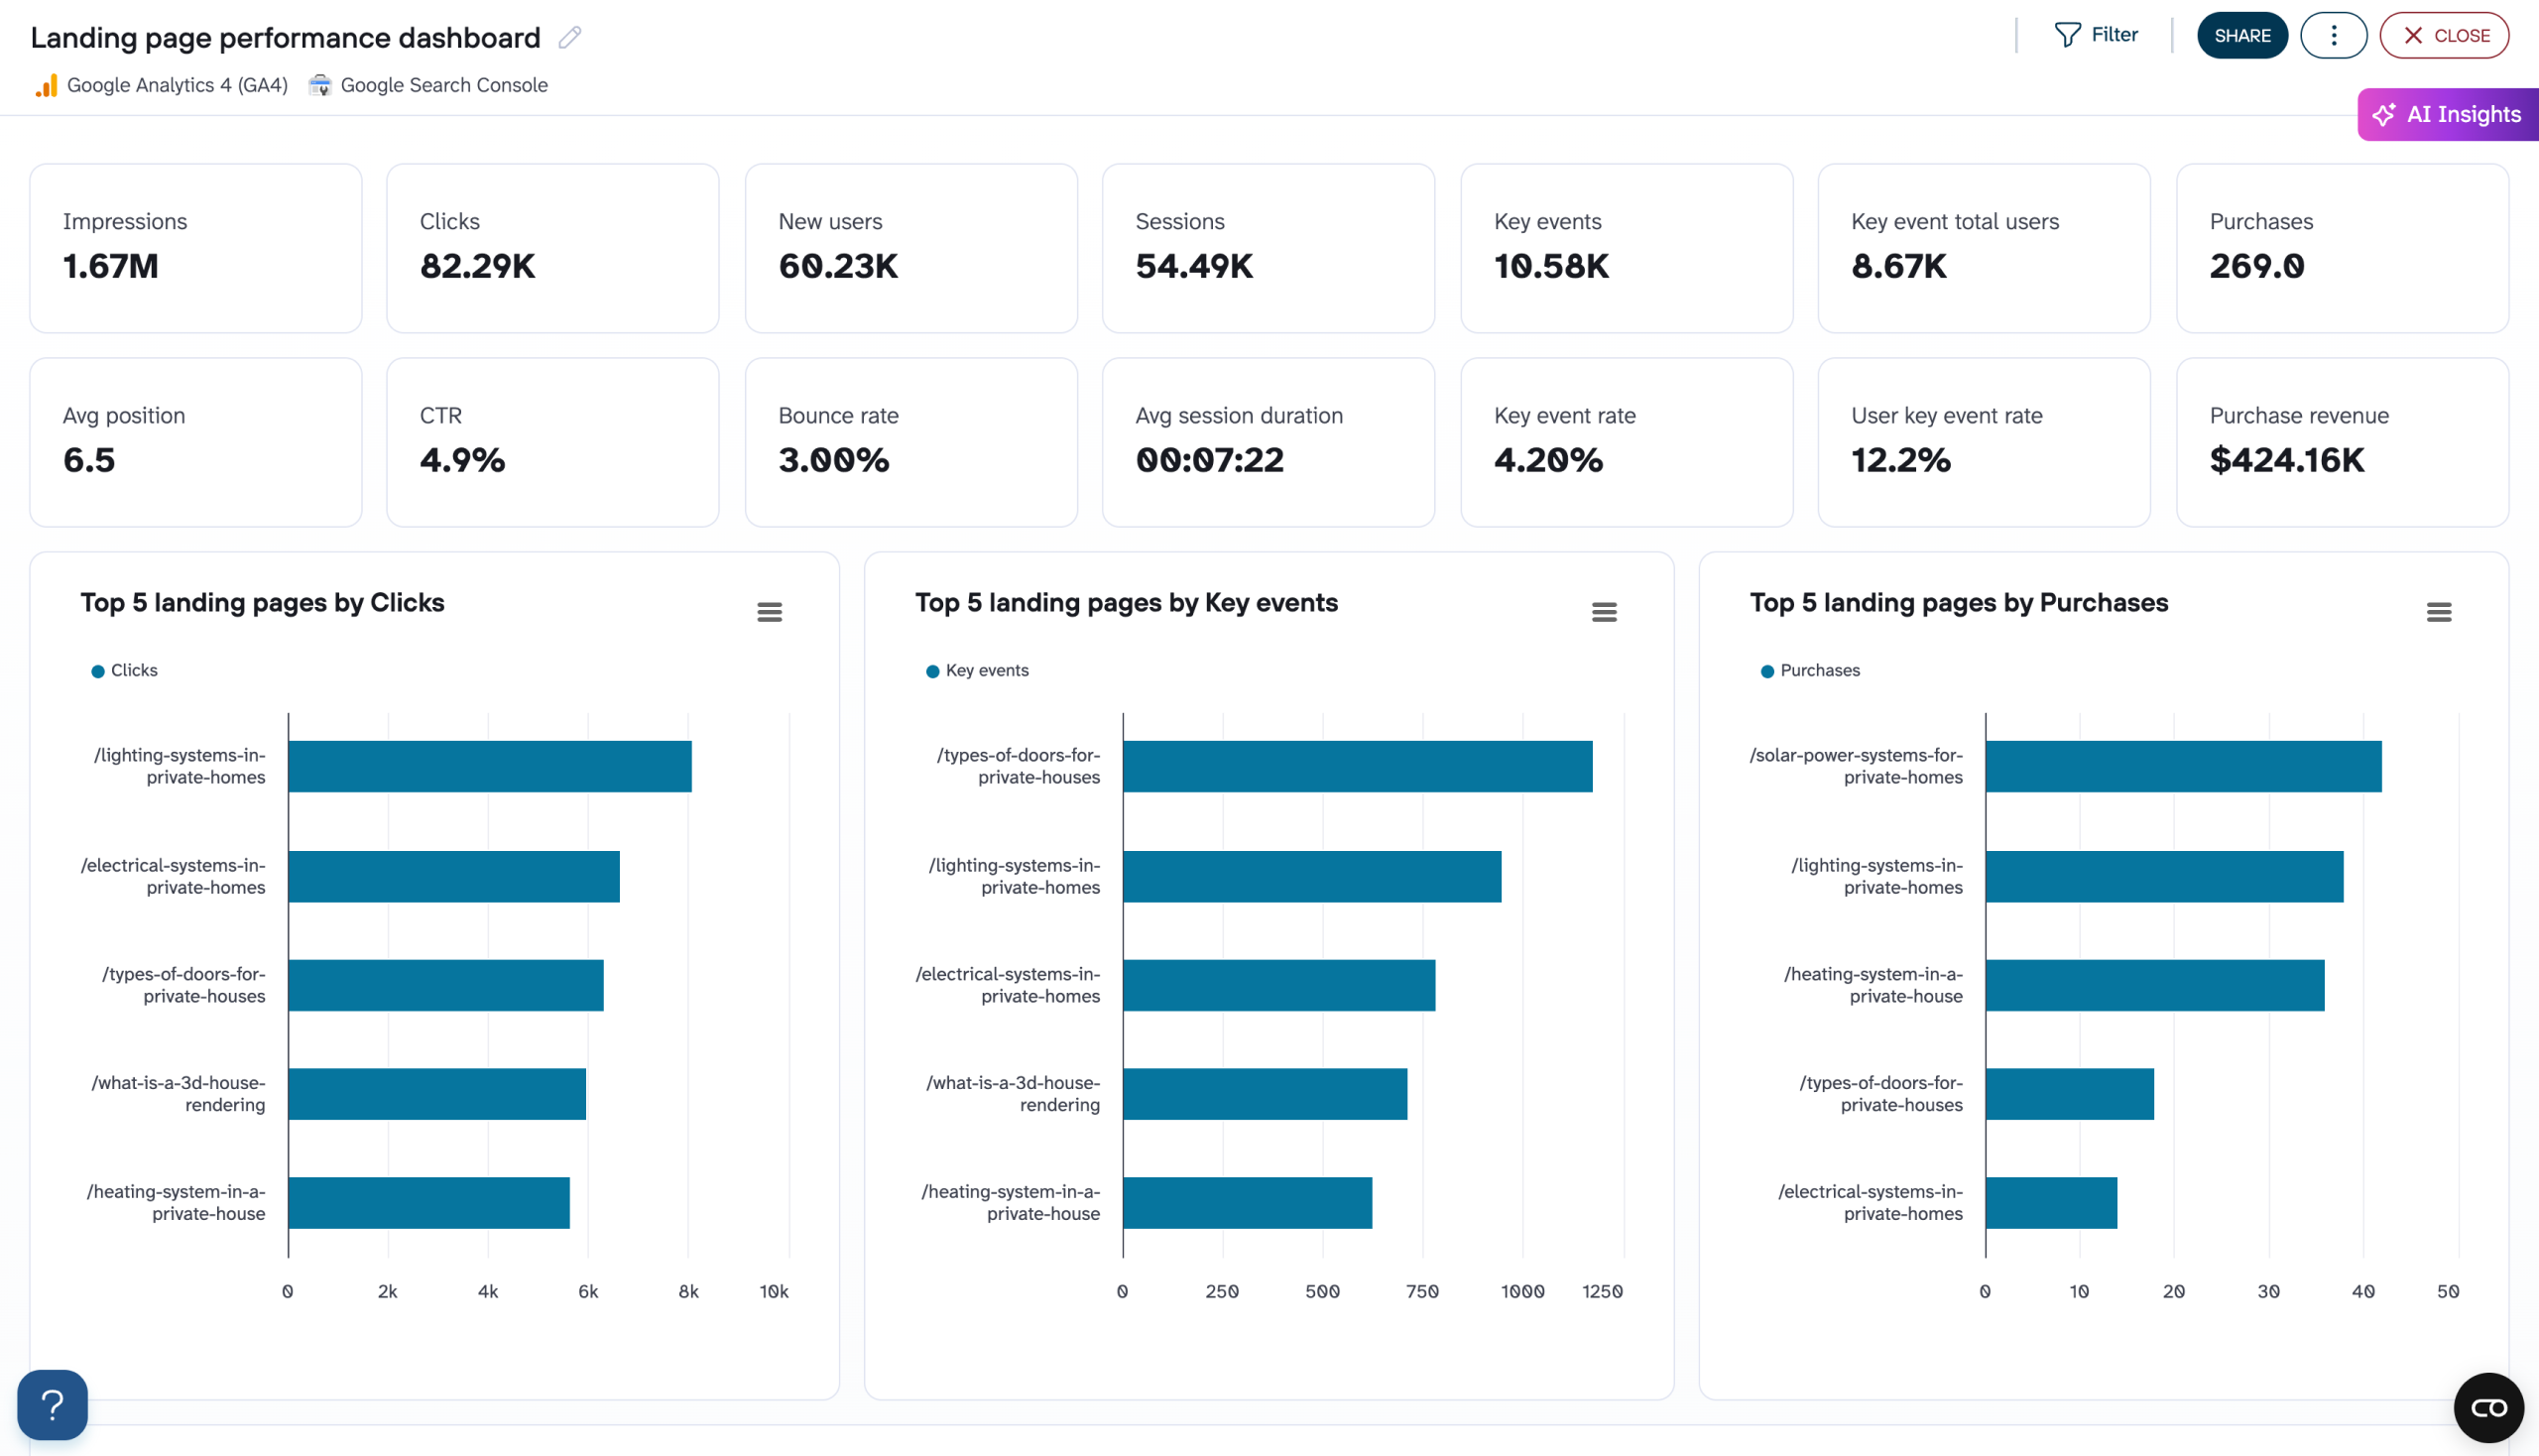
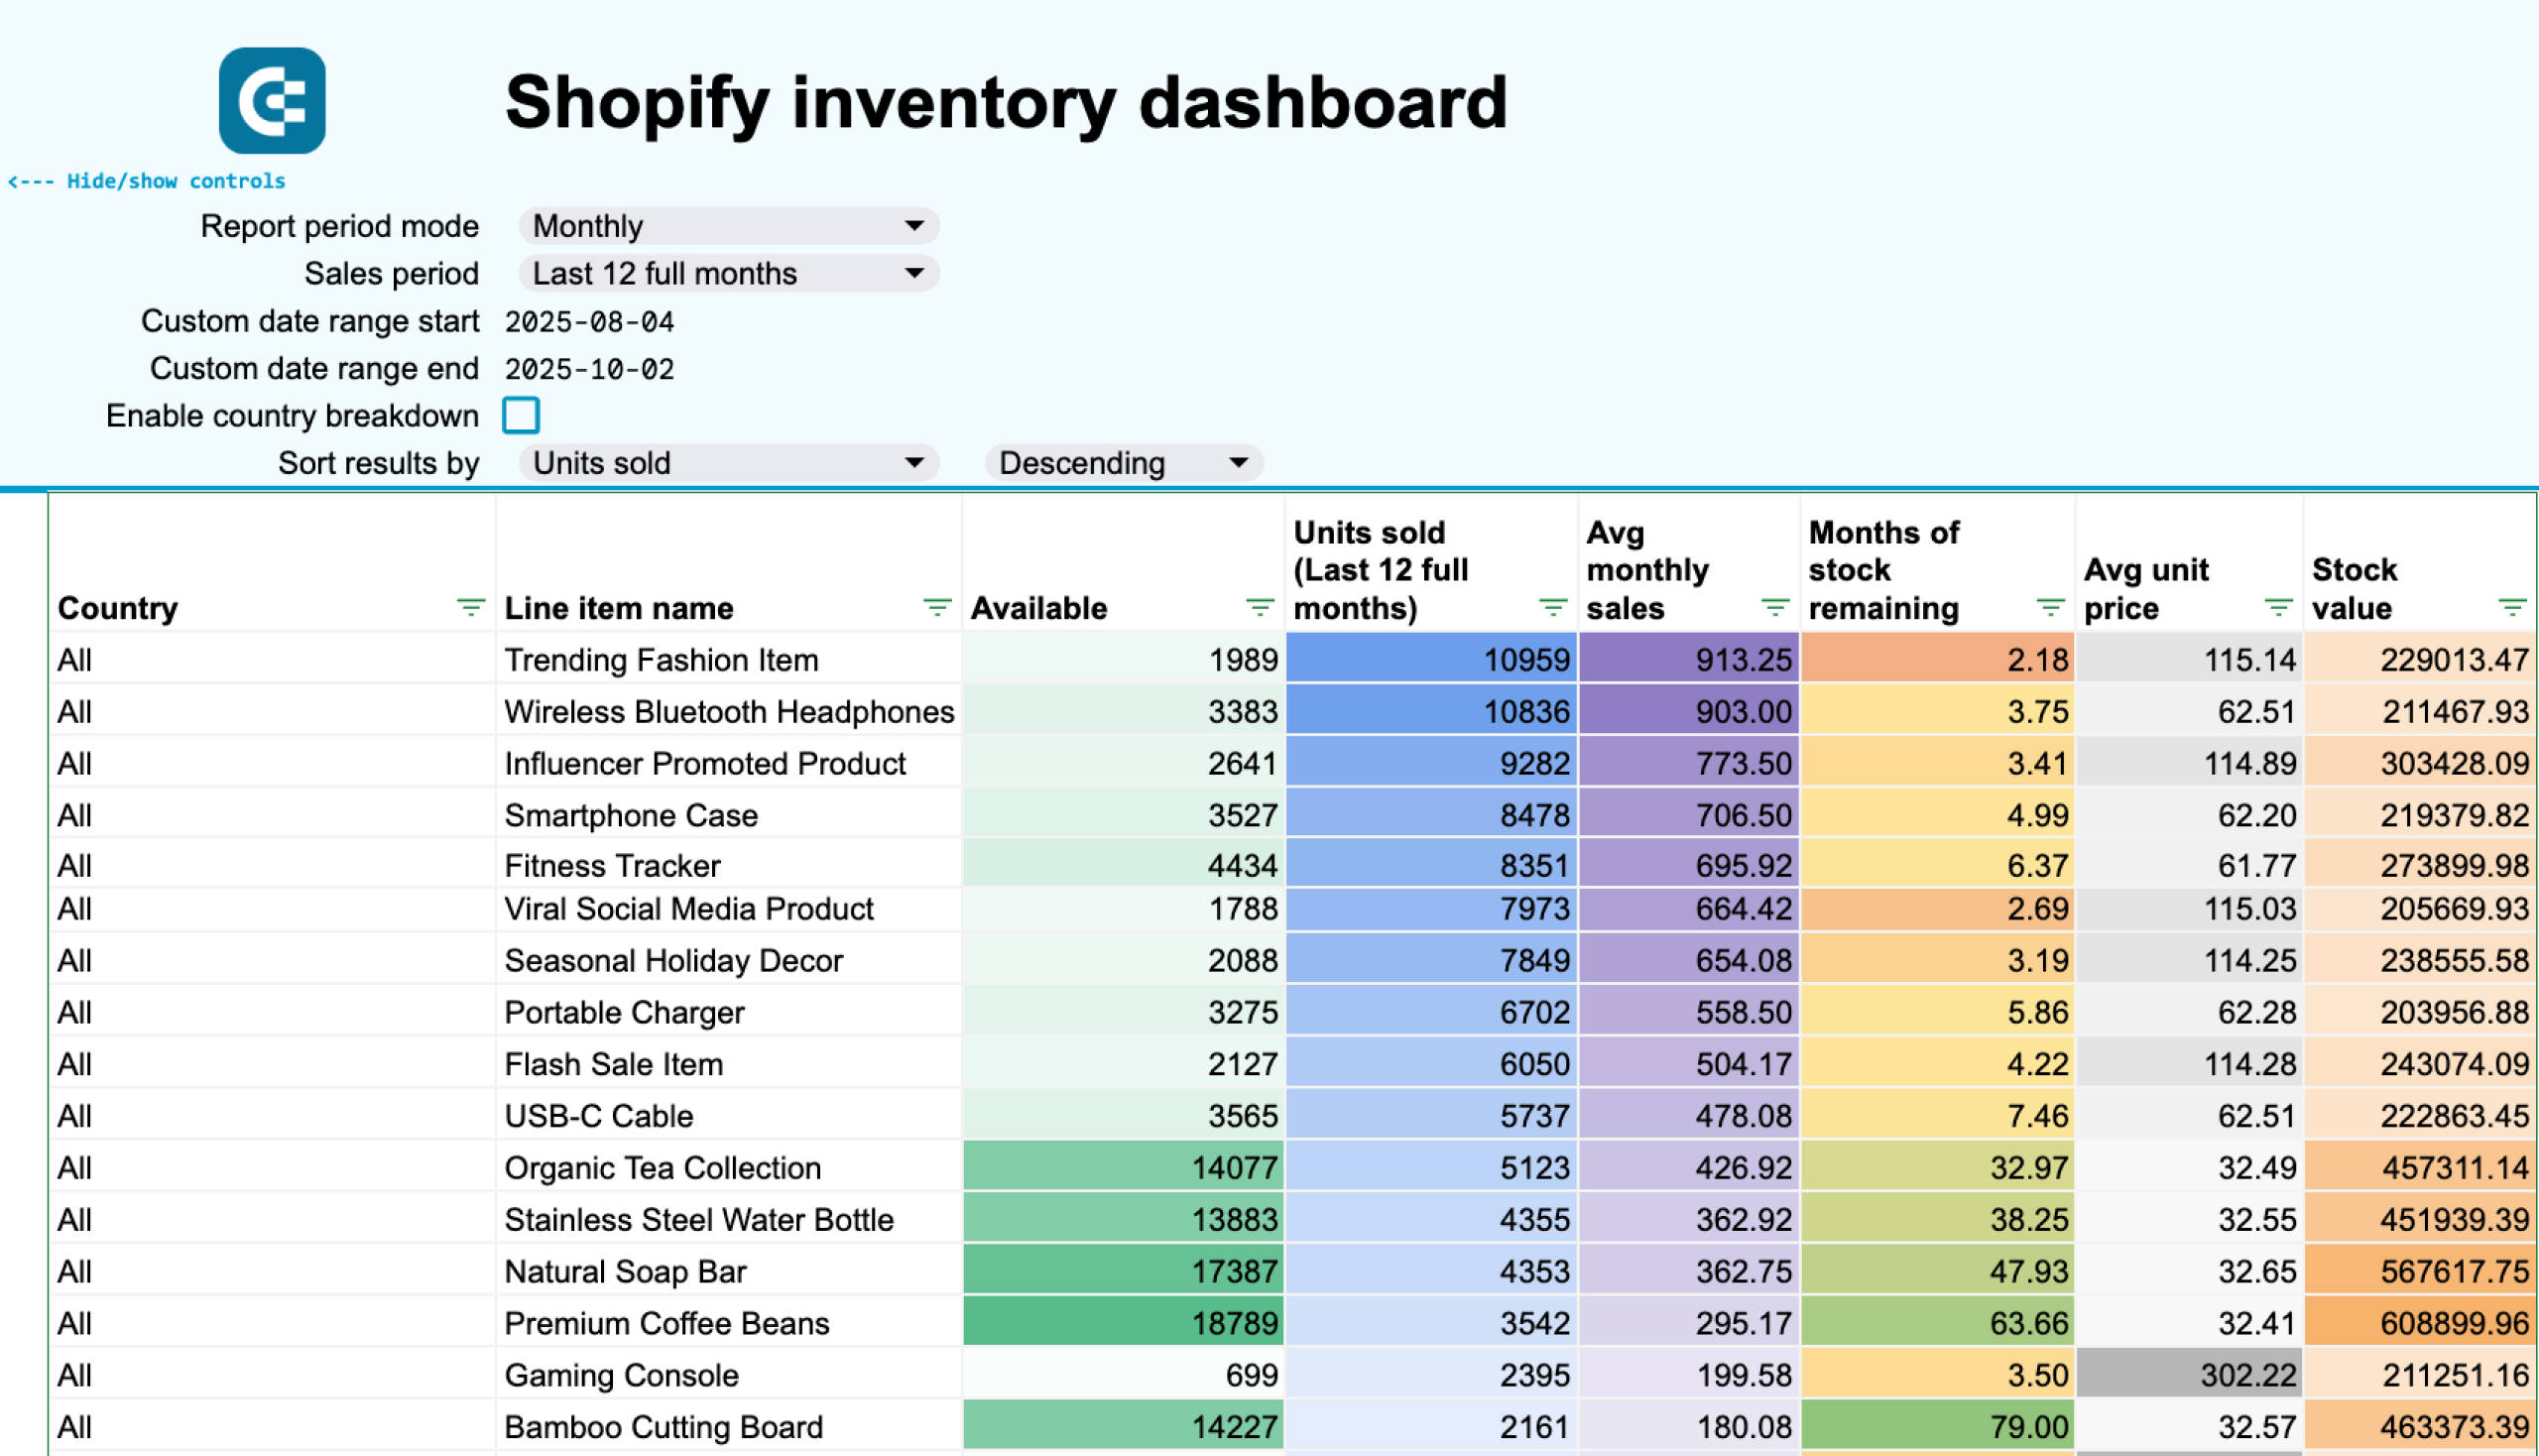
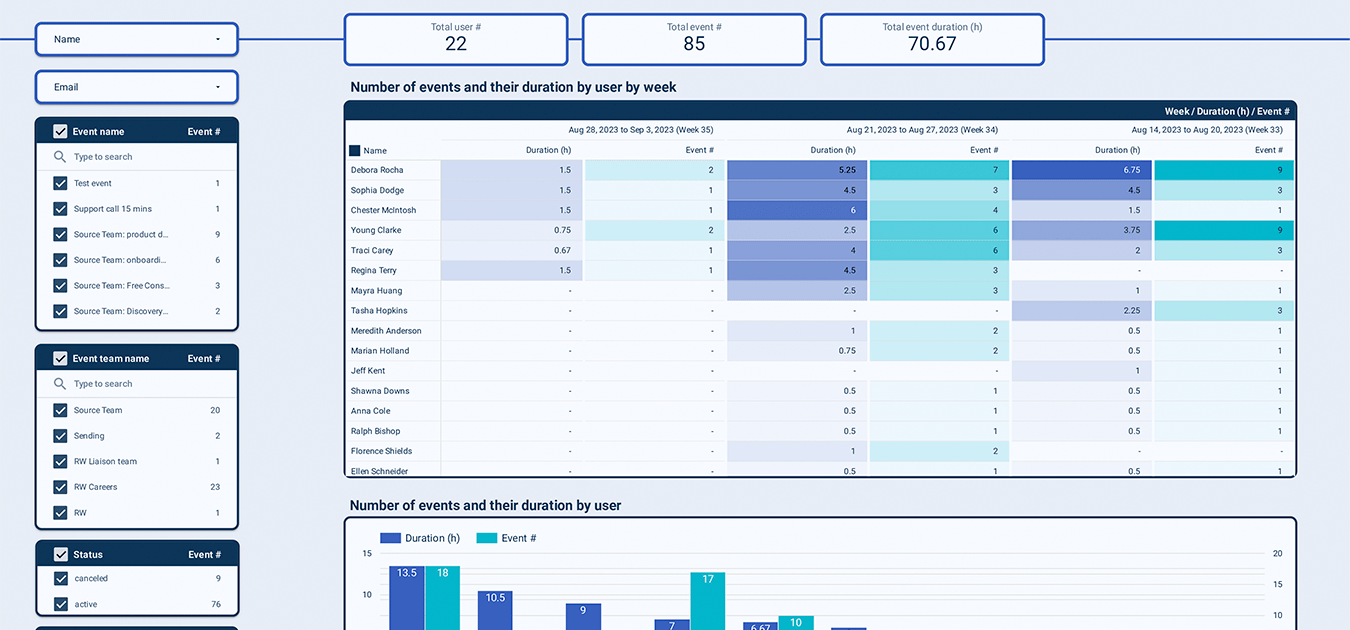
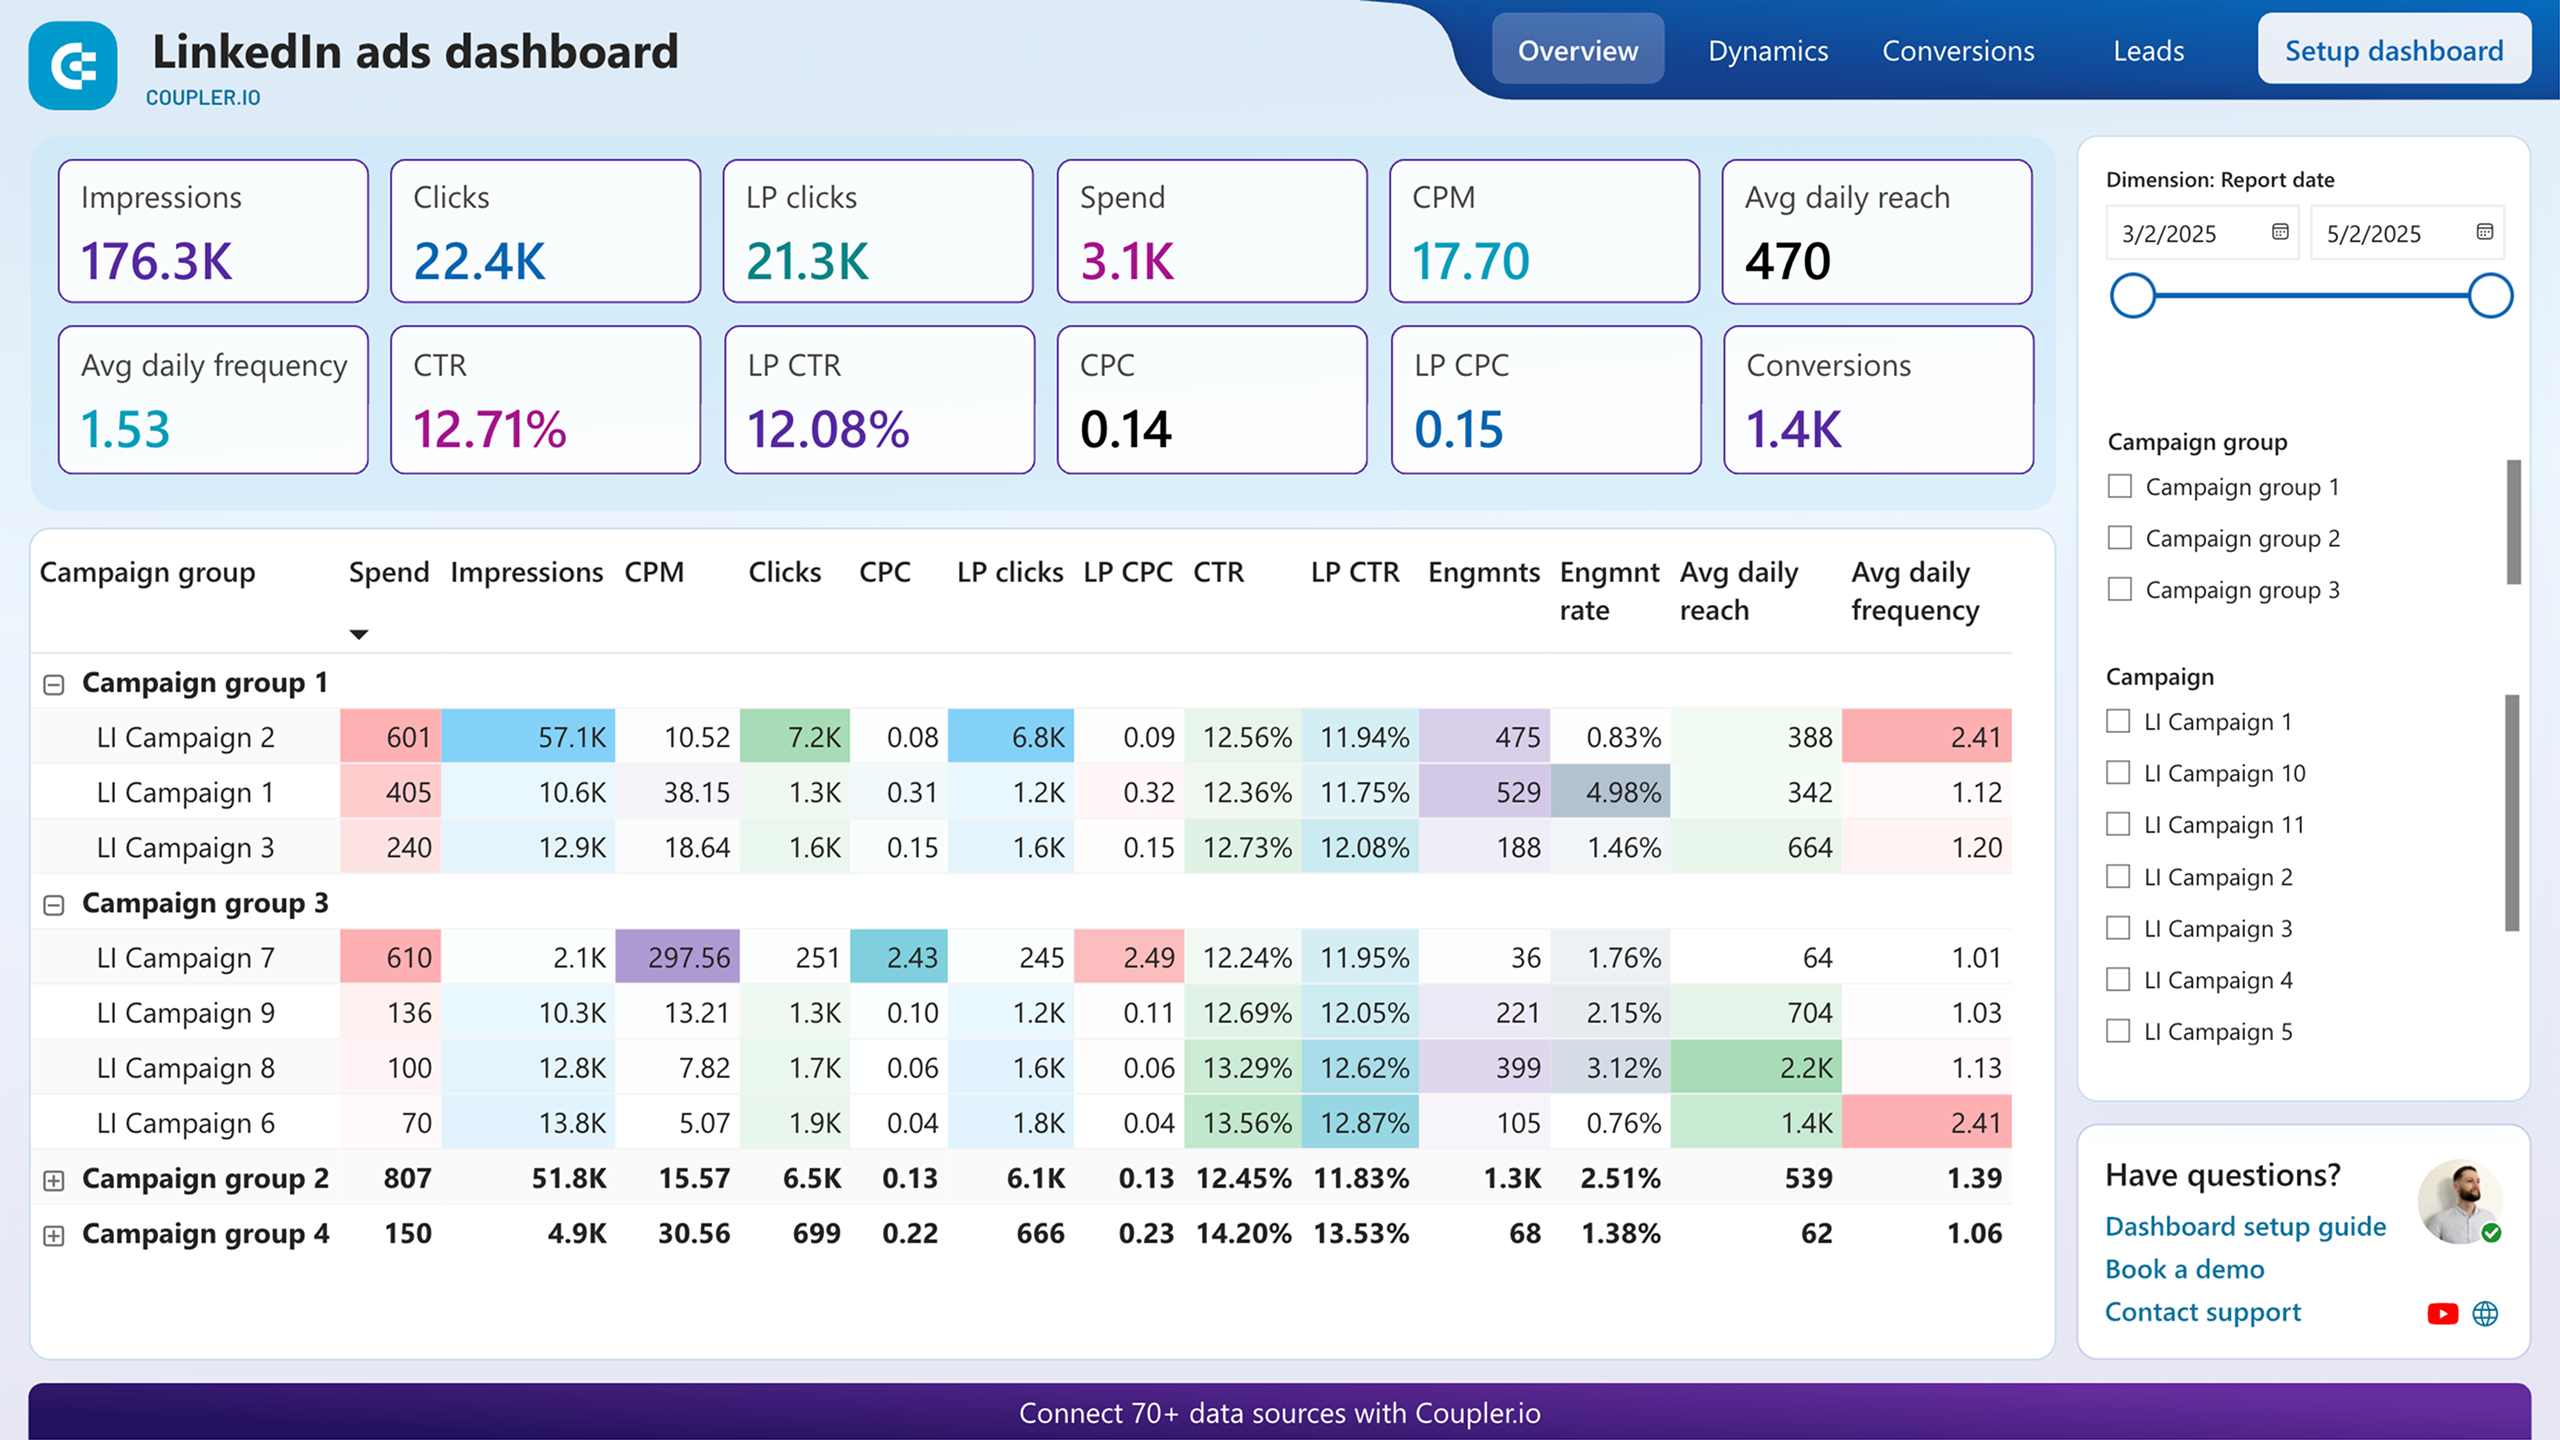
Analyze the performance of each video to understand which ones are the most engaging and influence channel growth the most.


Acquire peace of mind with our YouTube Analytics dashboard
Ready-to-use analytical tool
Start tracking key metrics without any complex setups. Connect the dashboard to your YouTube channel with just a few clicks by following the instructions inside.
Automated data refresh
With Coupler.io under the hood, get the charts populated with the latest data from your YouTube channel. Set up the desired refresh frequency, up to every 15 minutes.
White-label template
Customize the template to fit your needs by adjusting metrics, visuals, etc. Easily share channel insights with stakeholders at the click of a button.
No need to build a YouTube analytics dashboard from scratch.
Use our fully automated template!
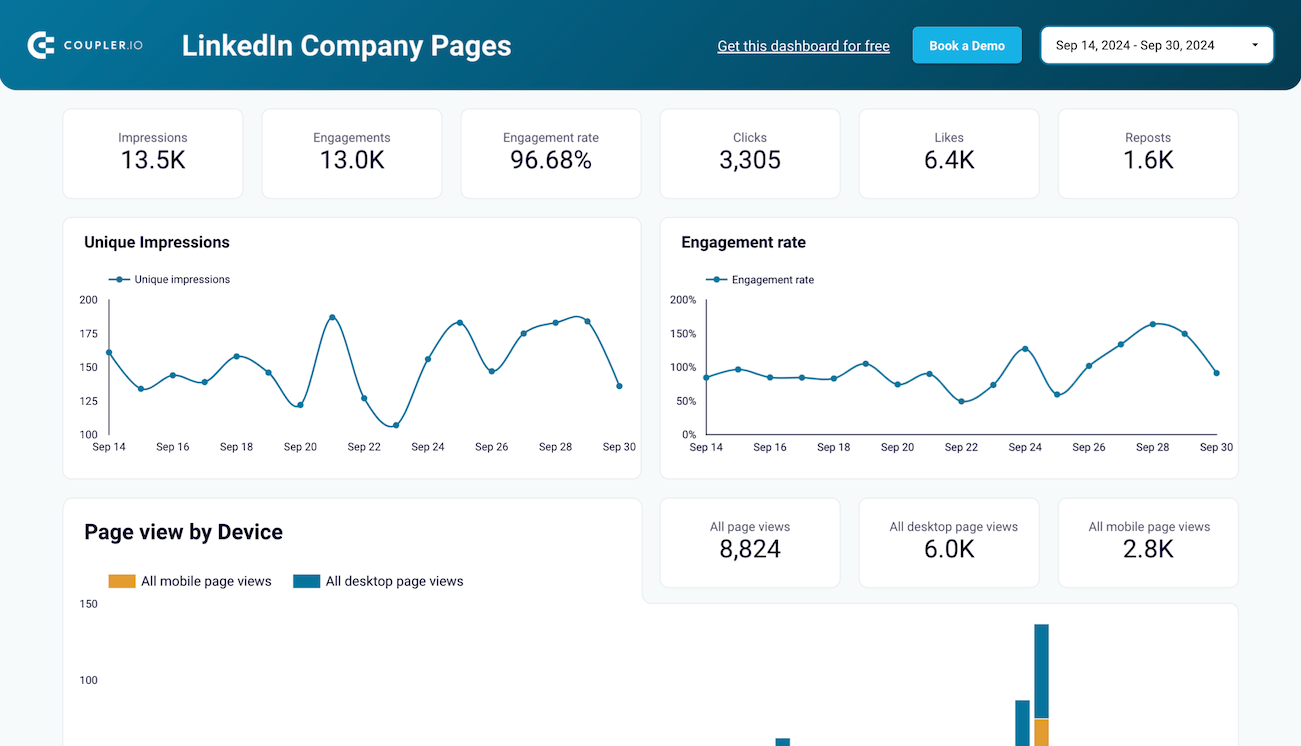
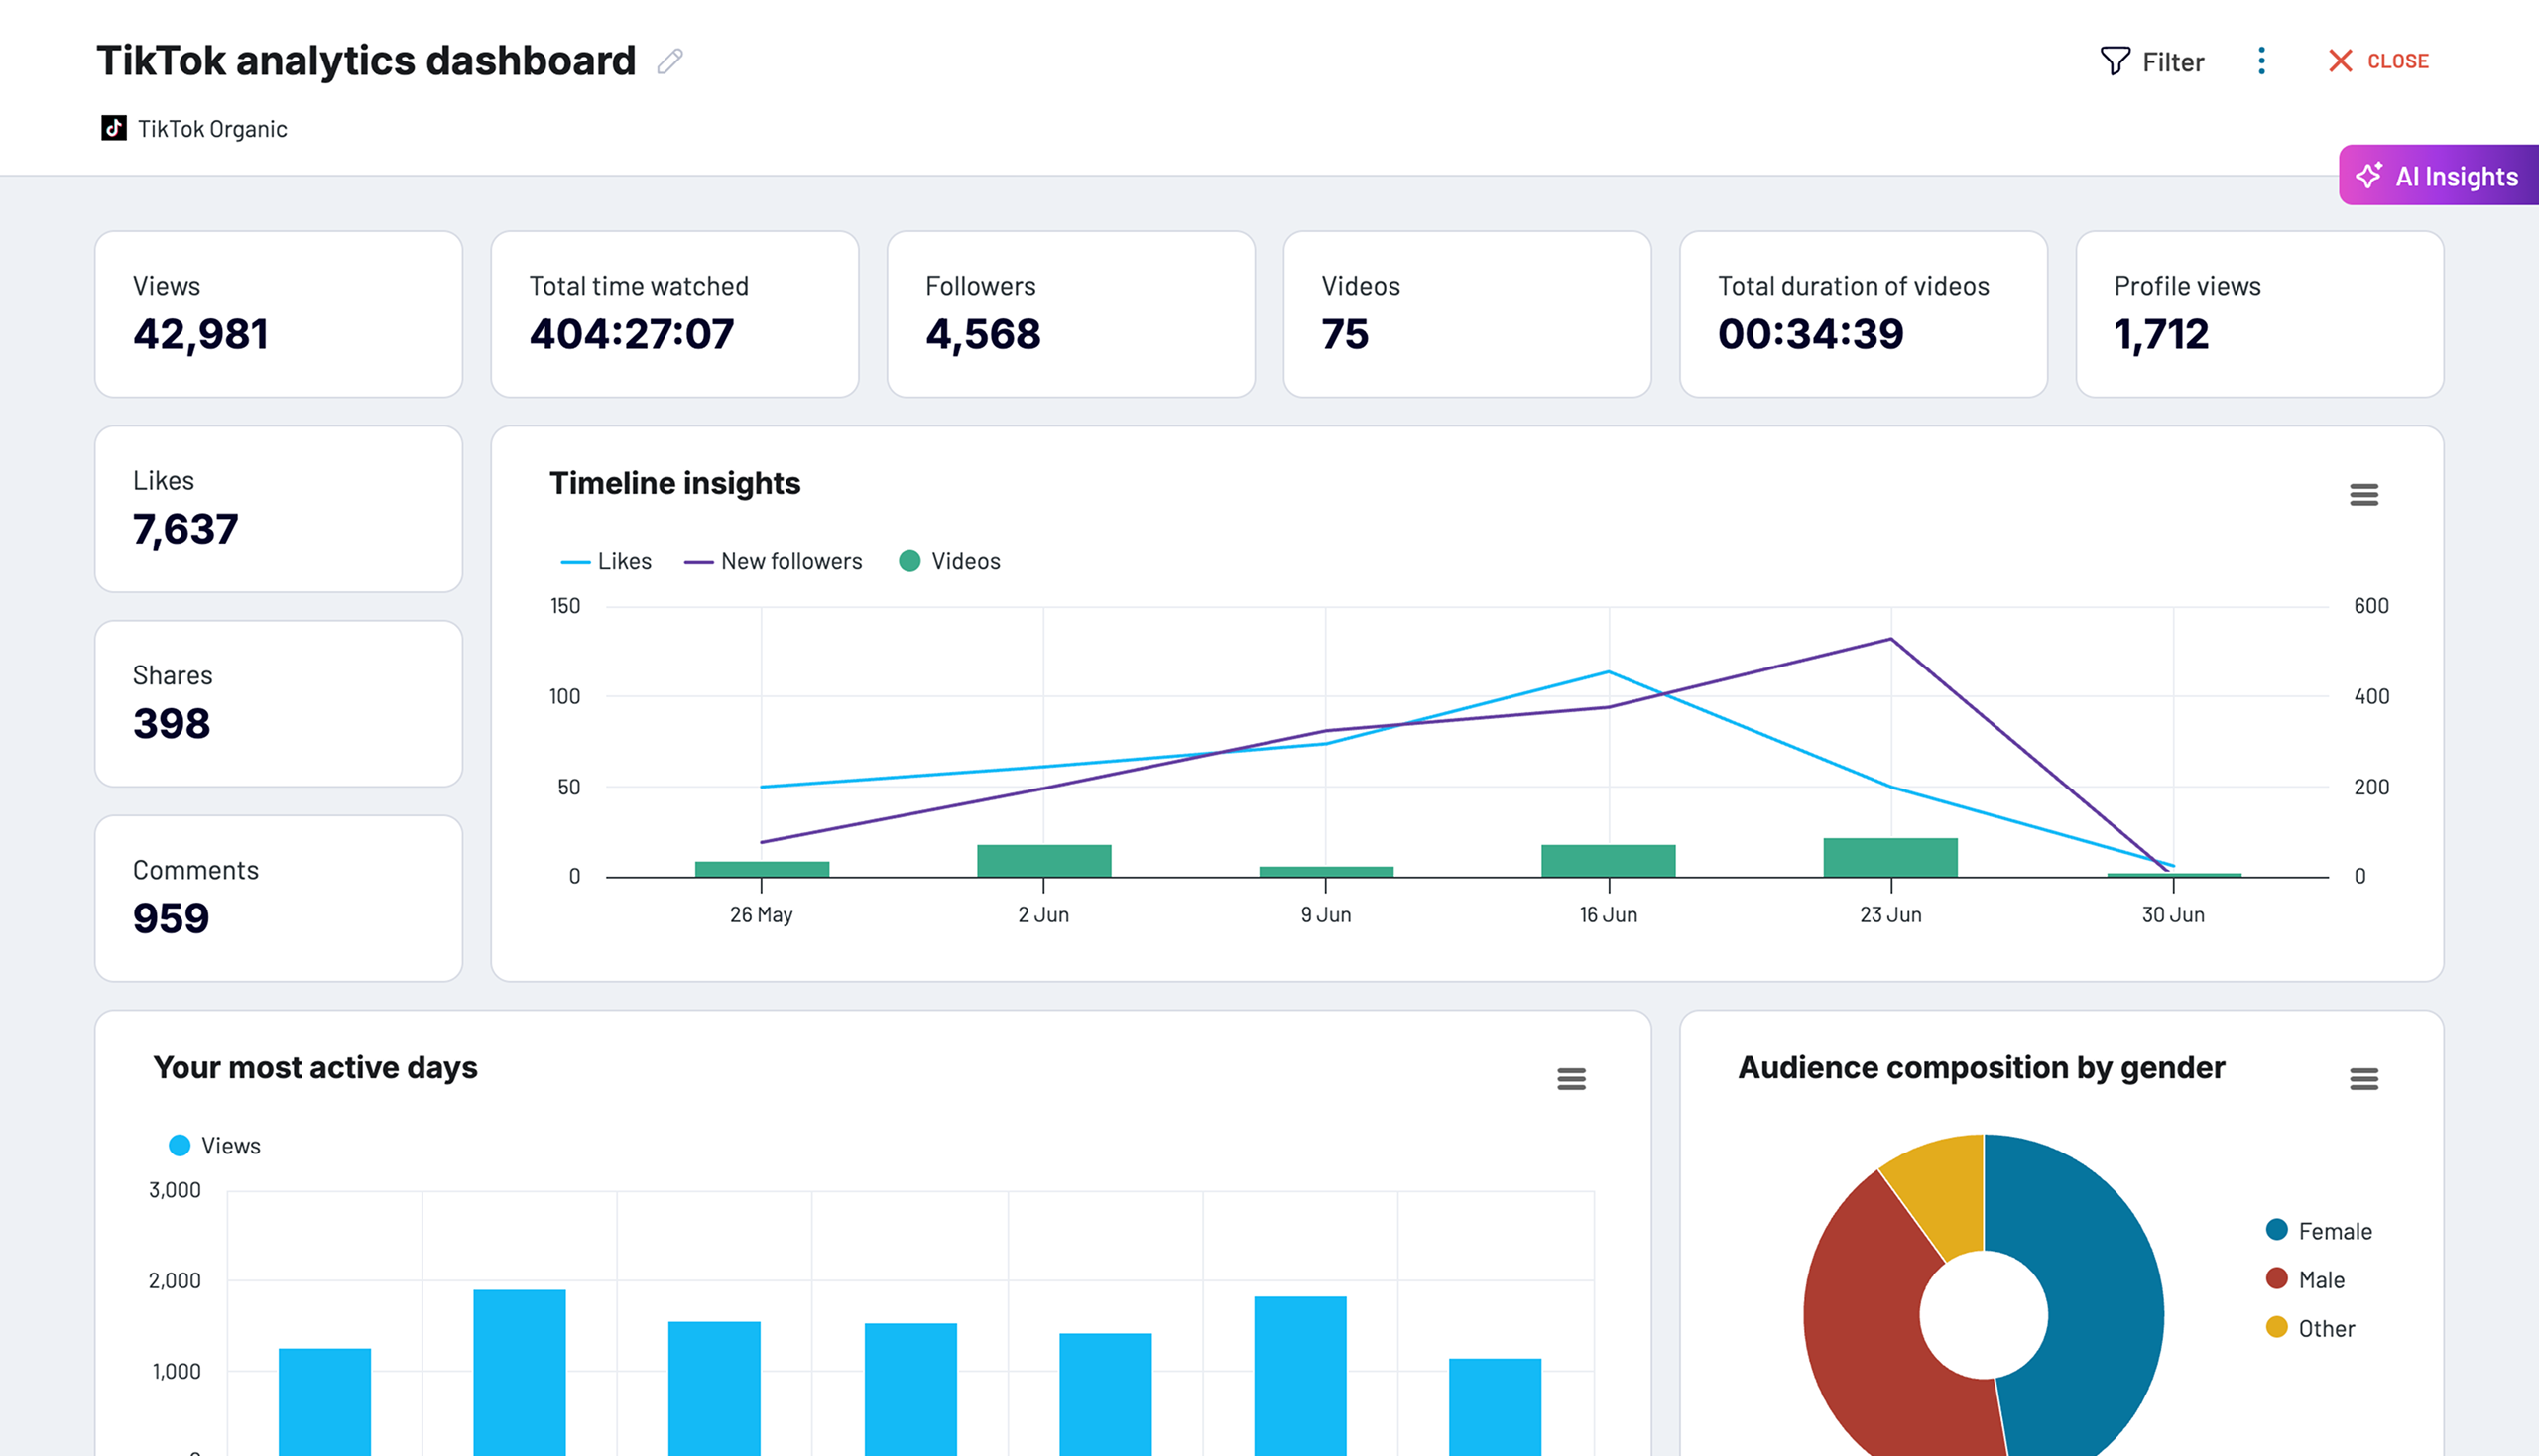
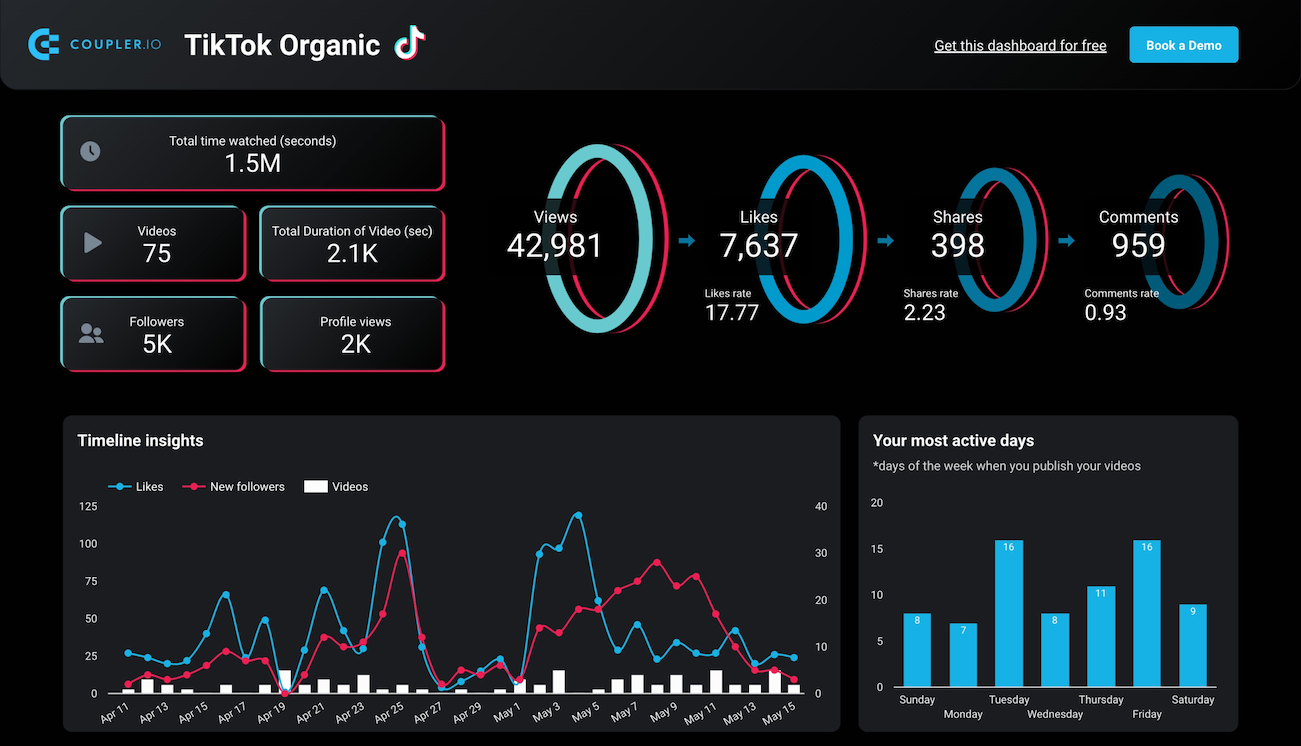
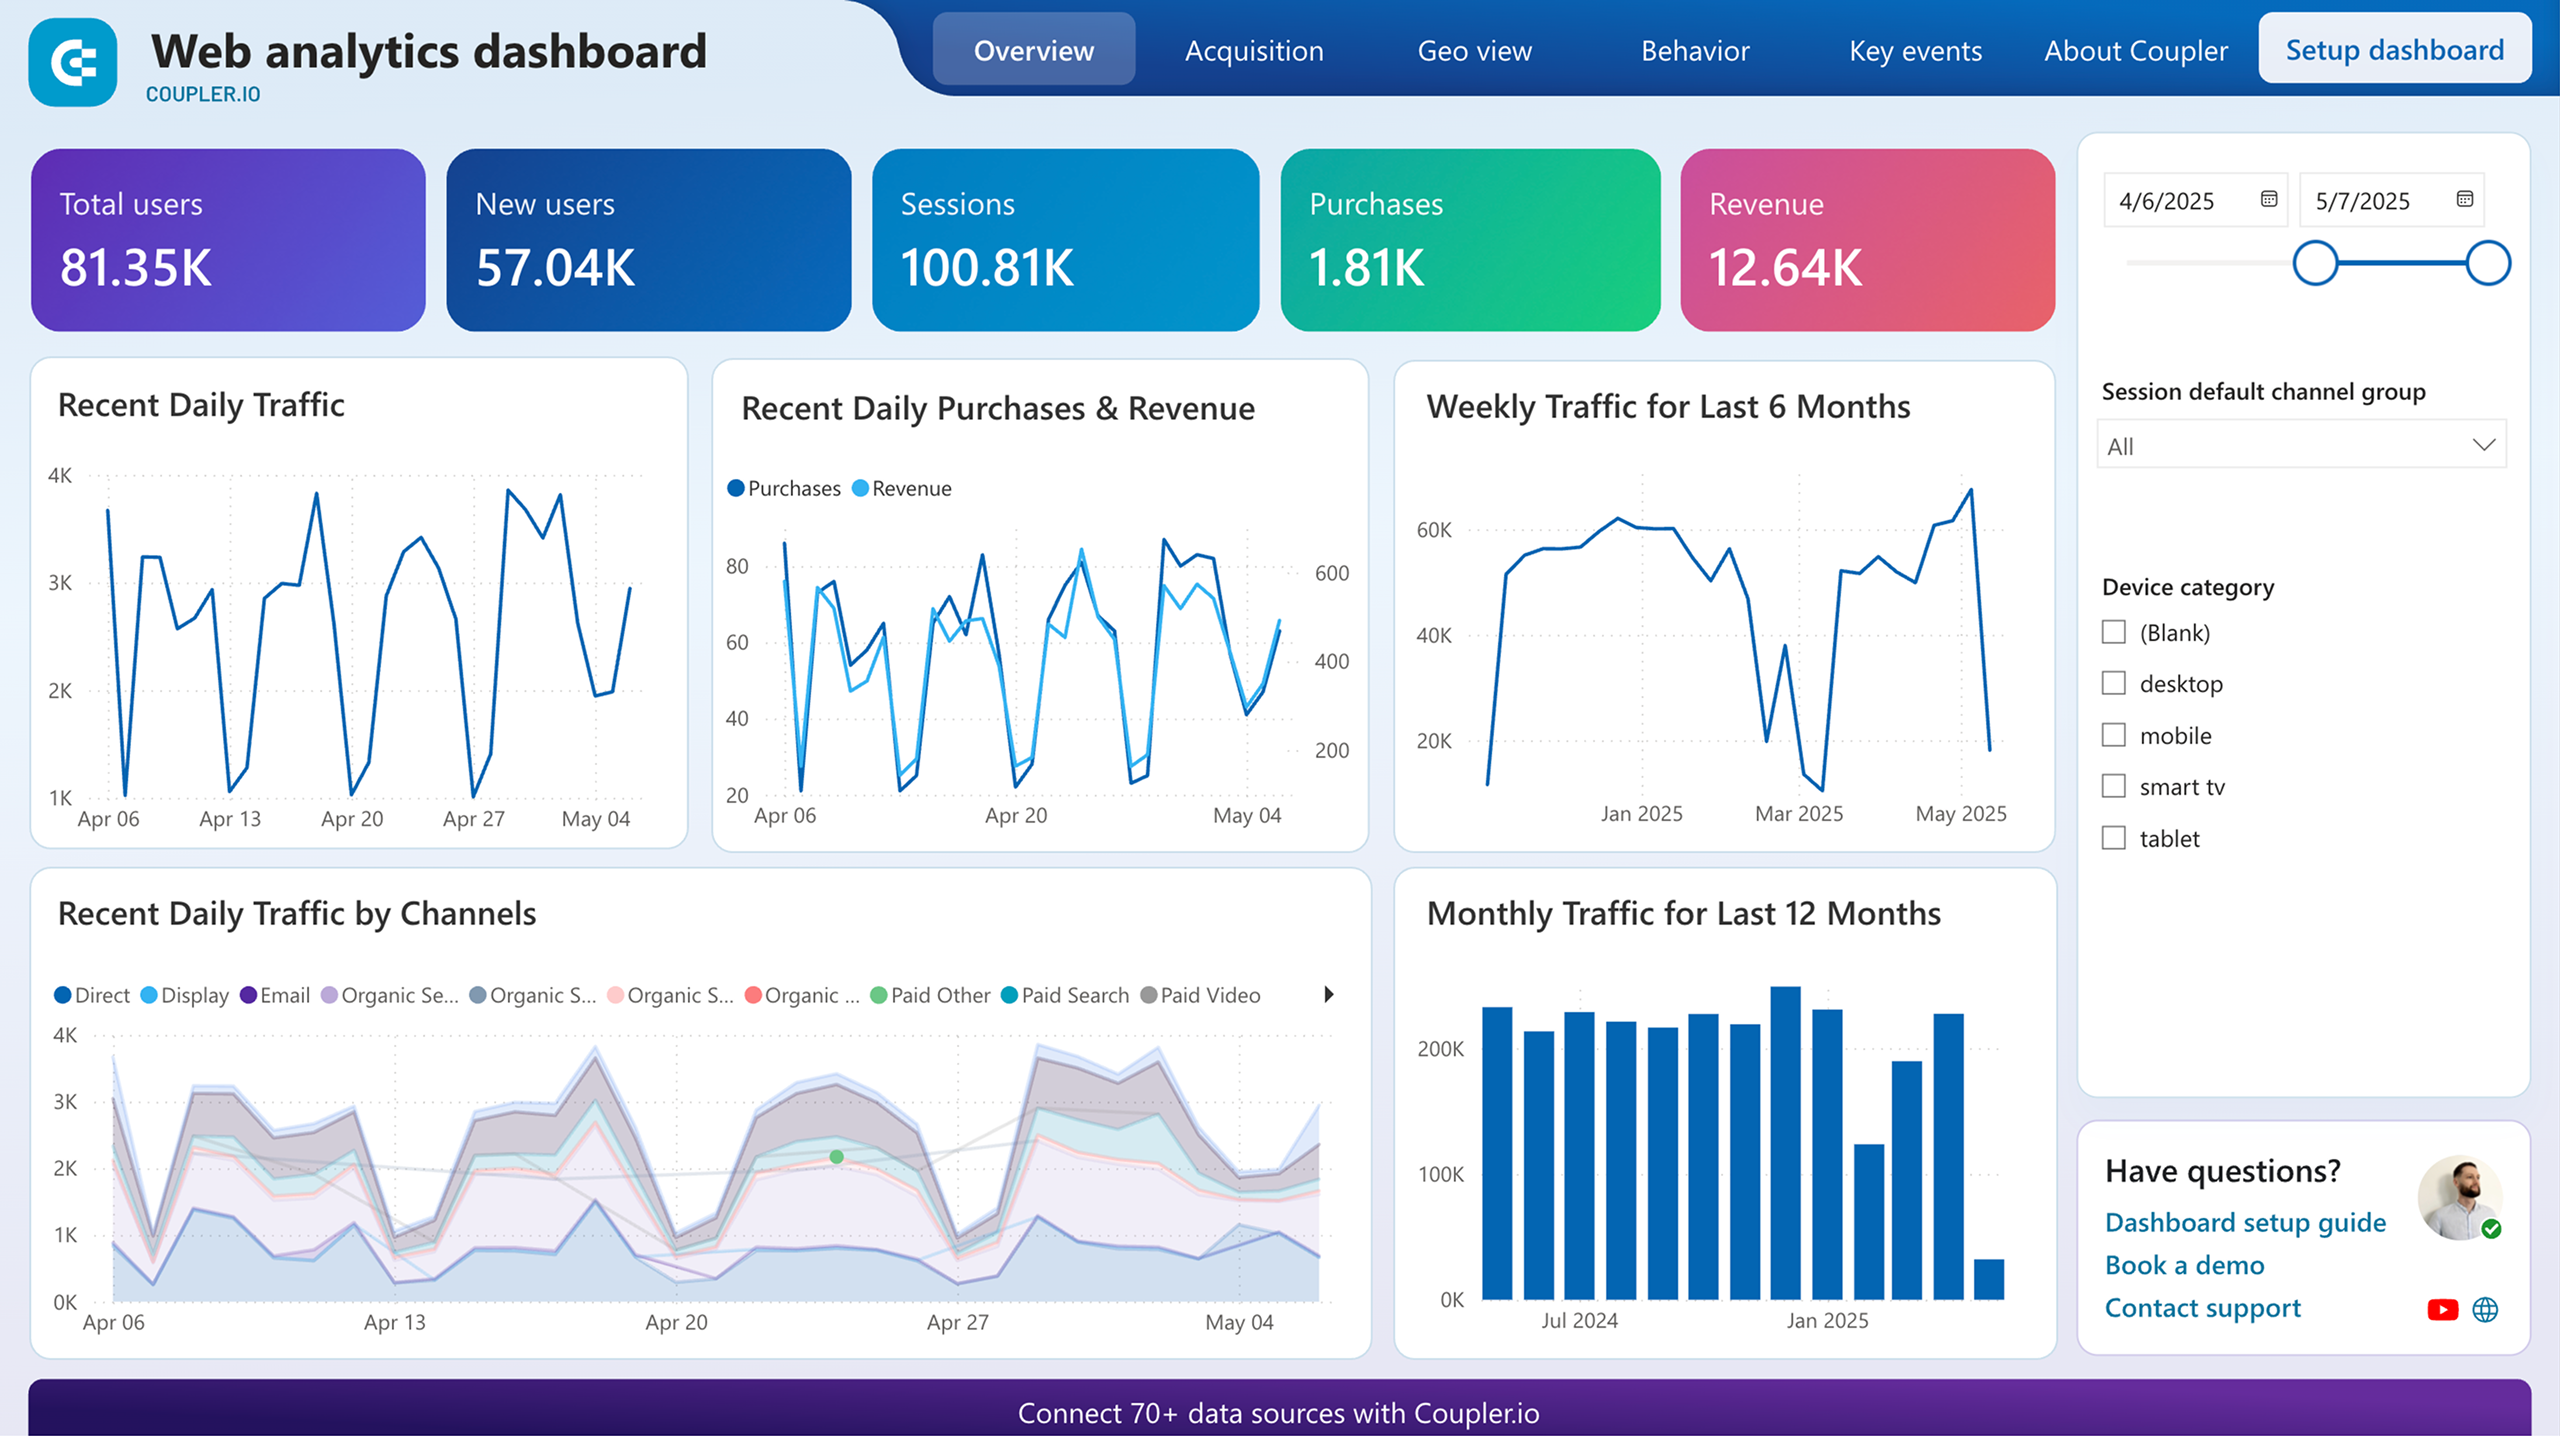
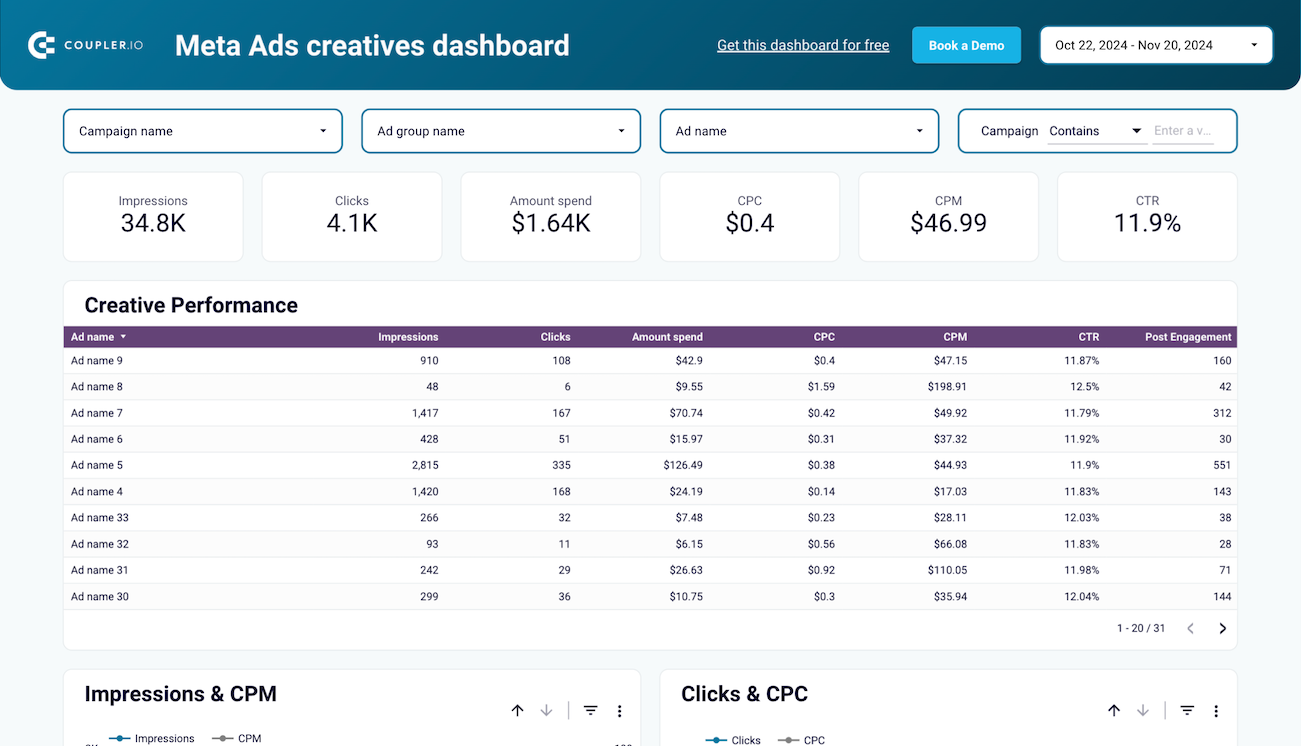
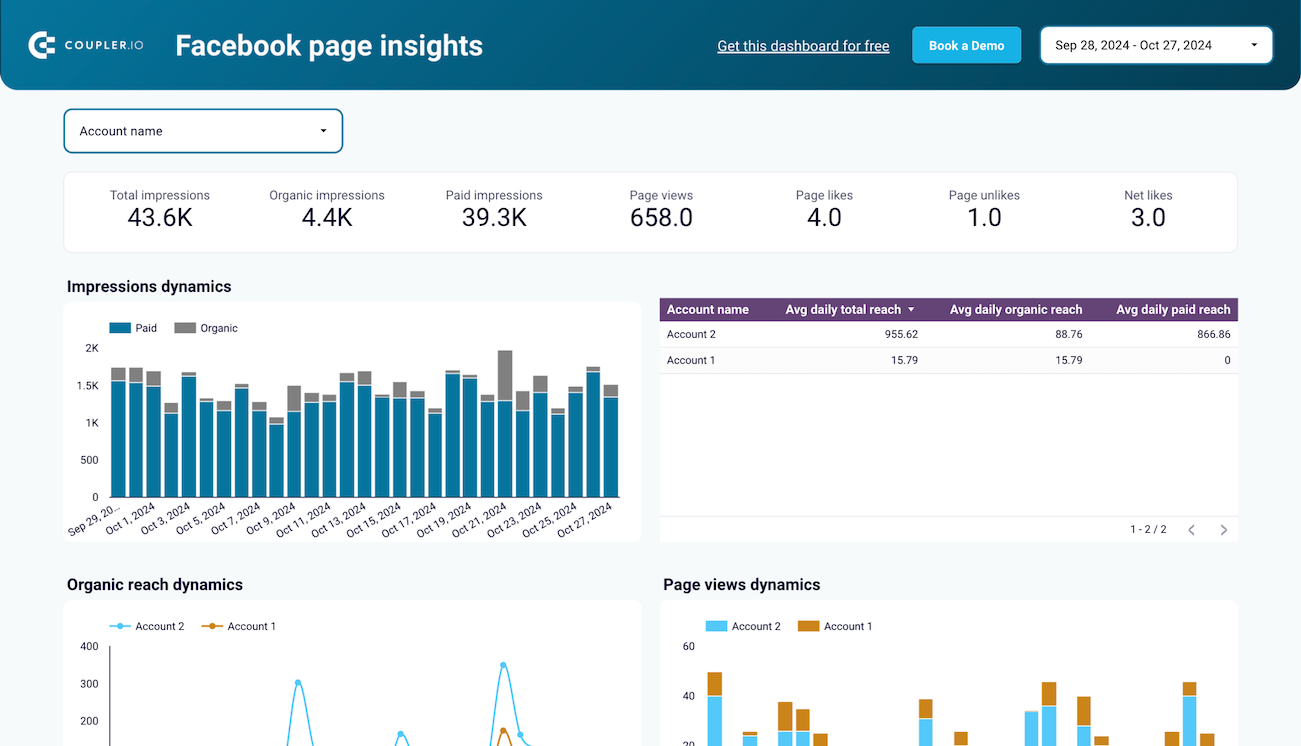
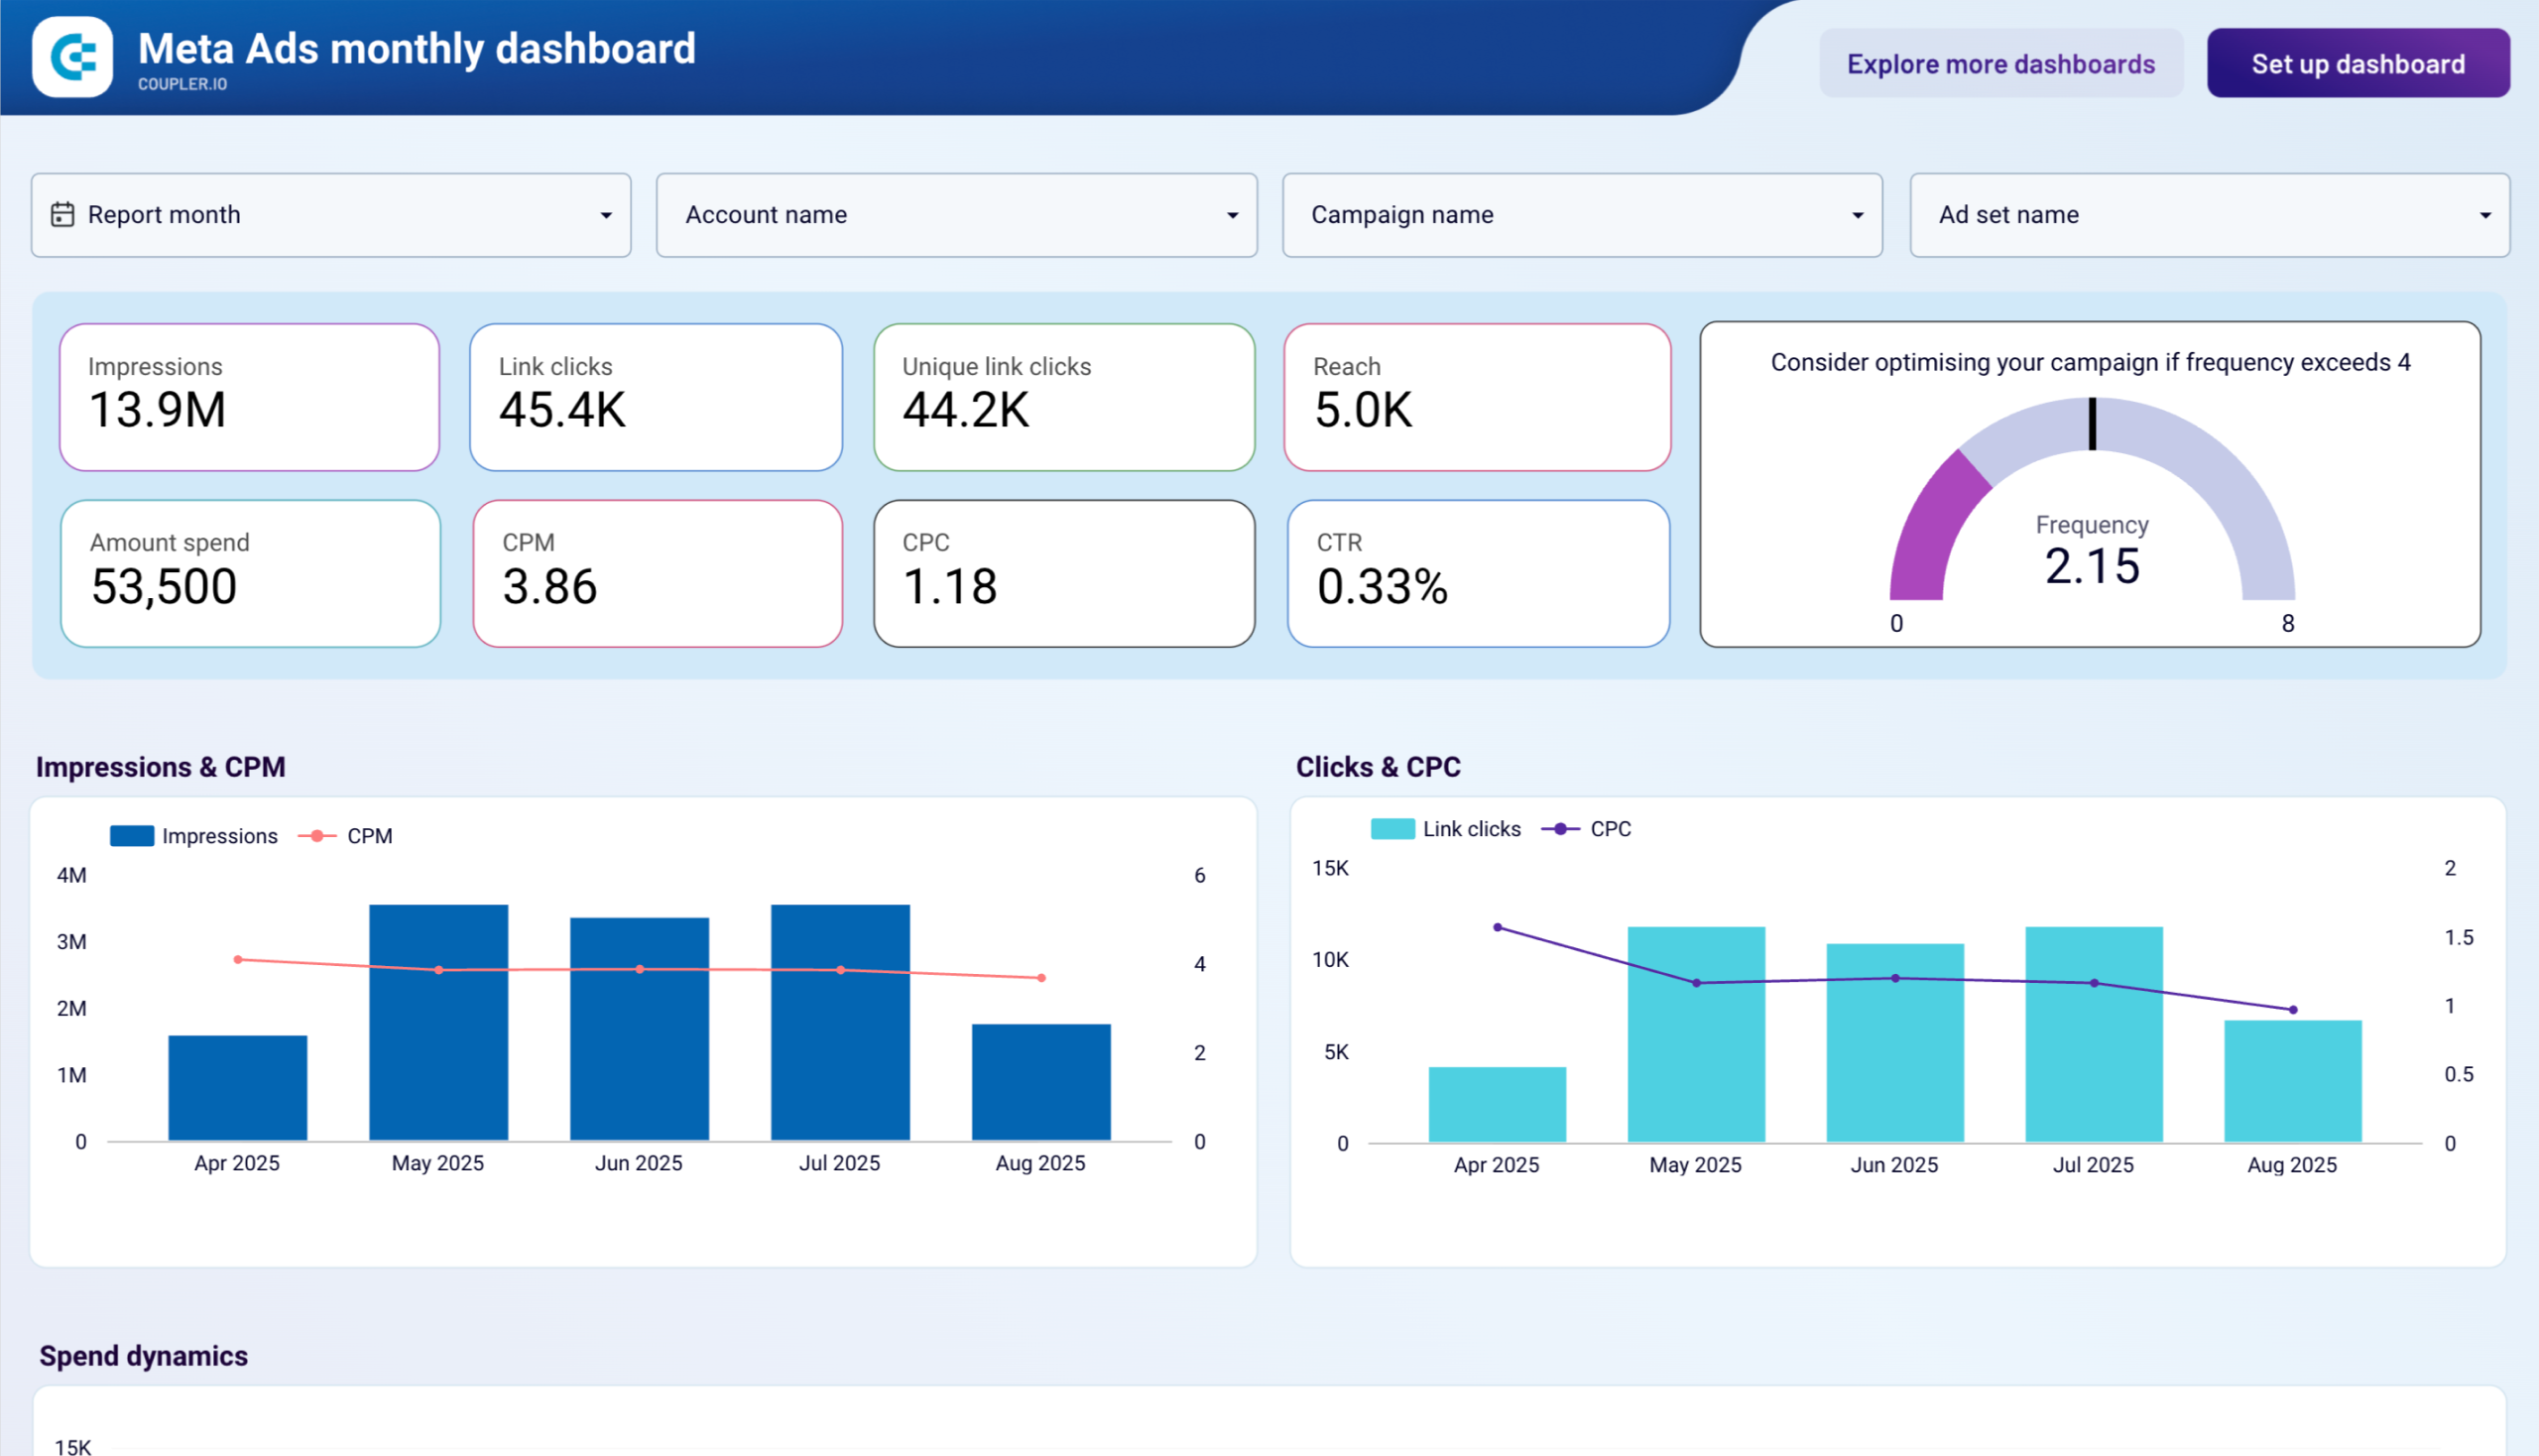
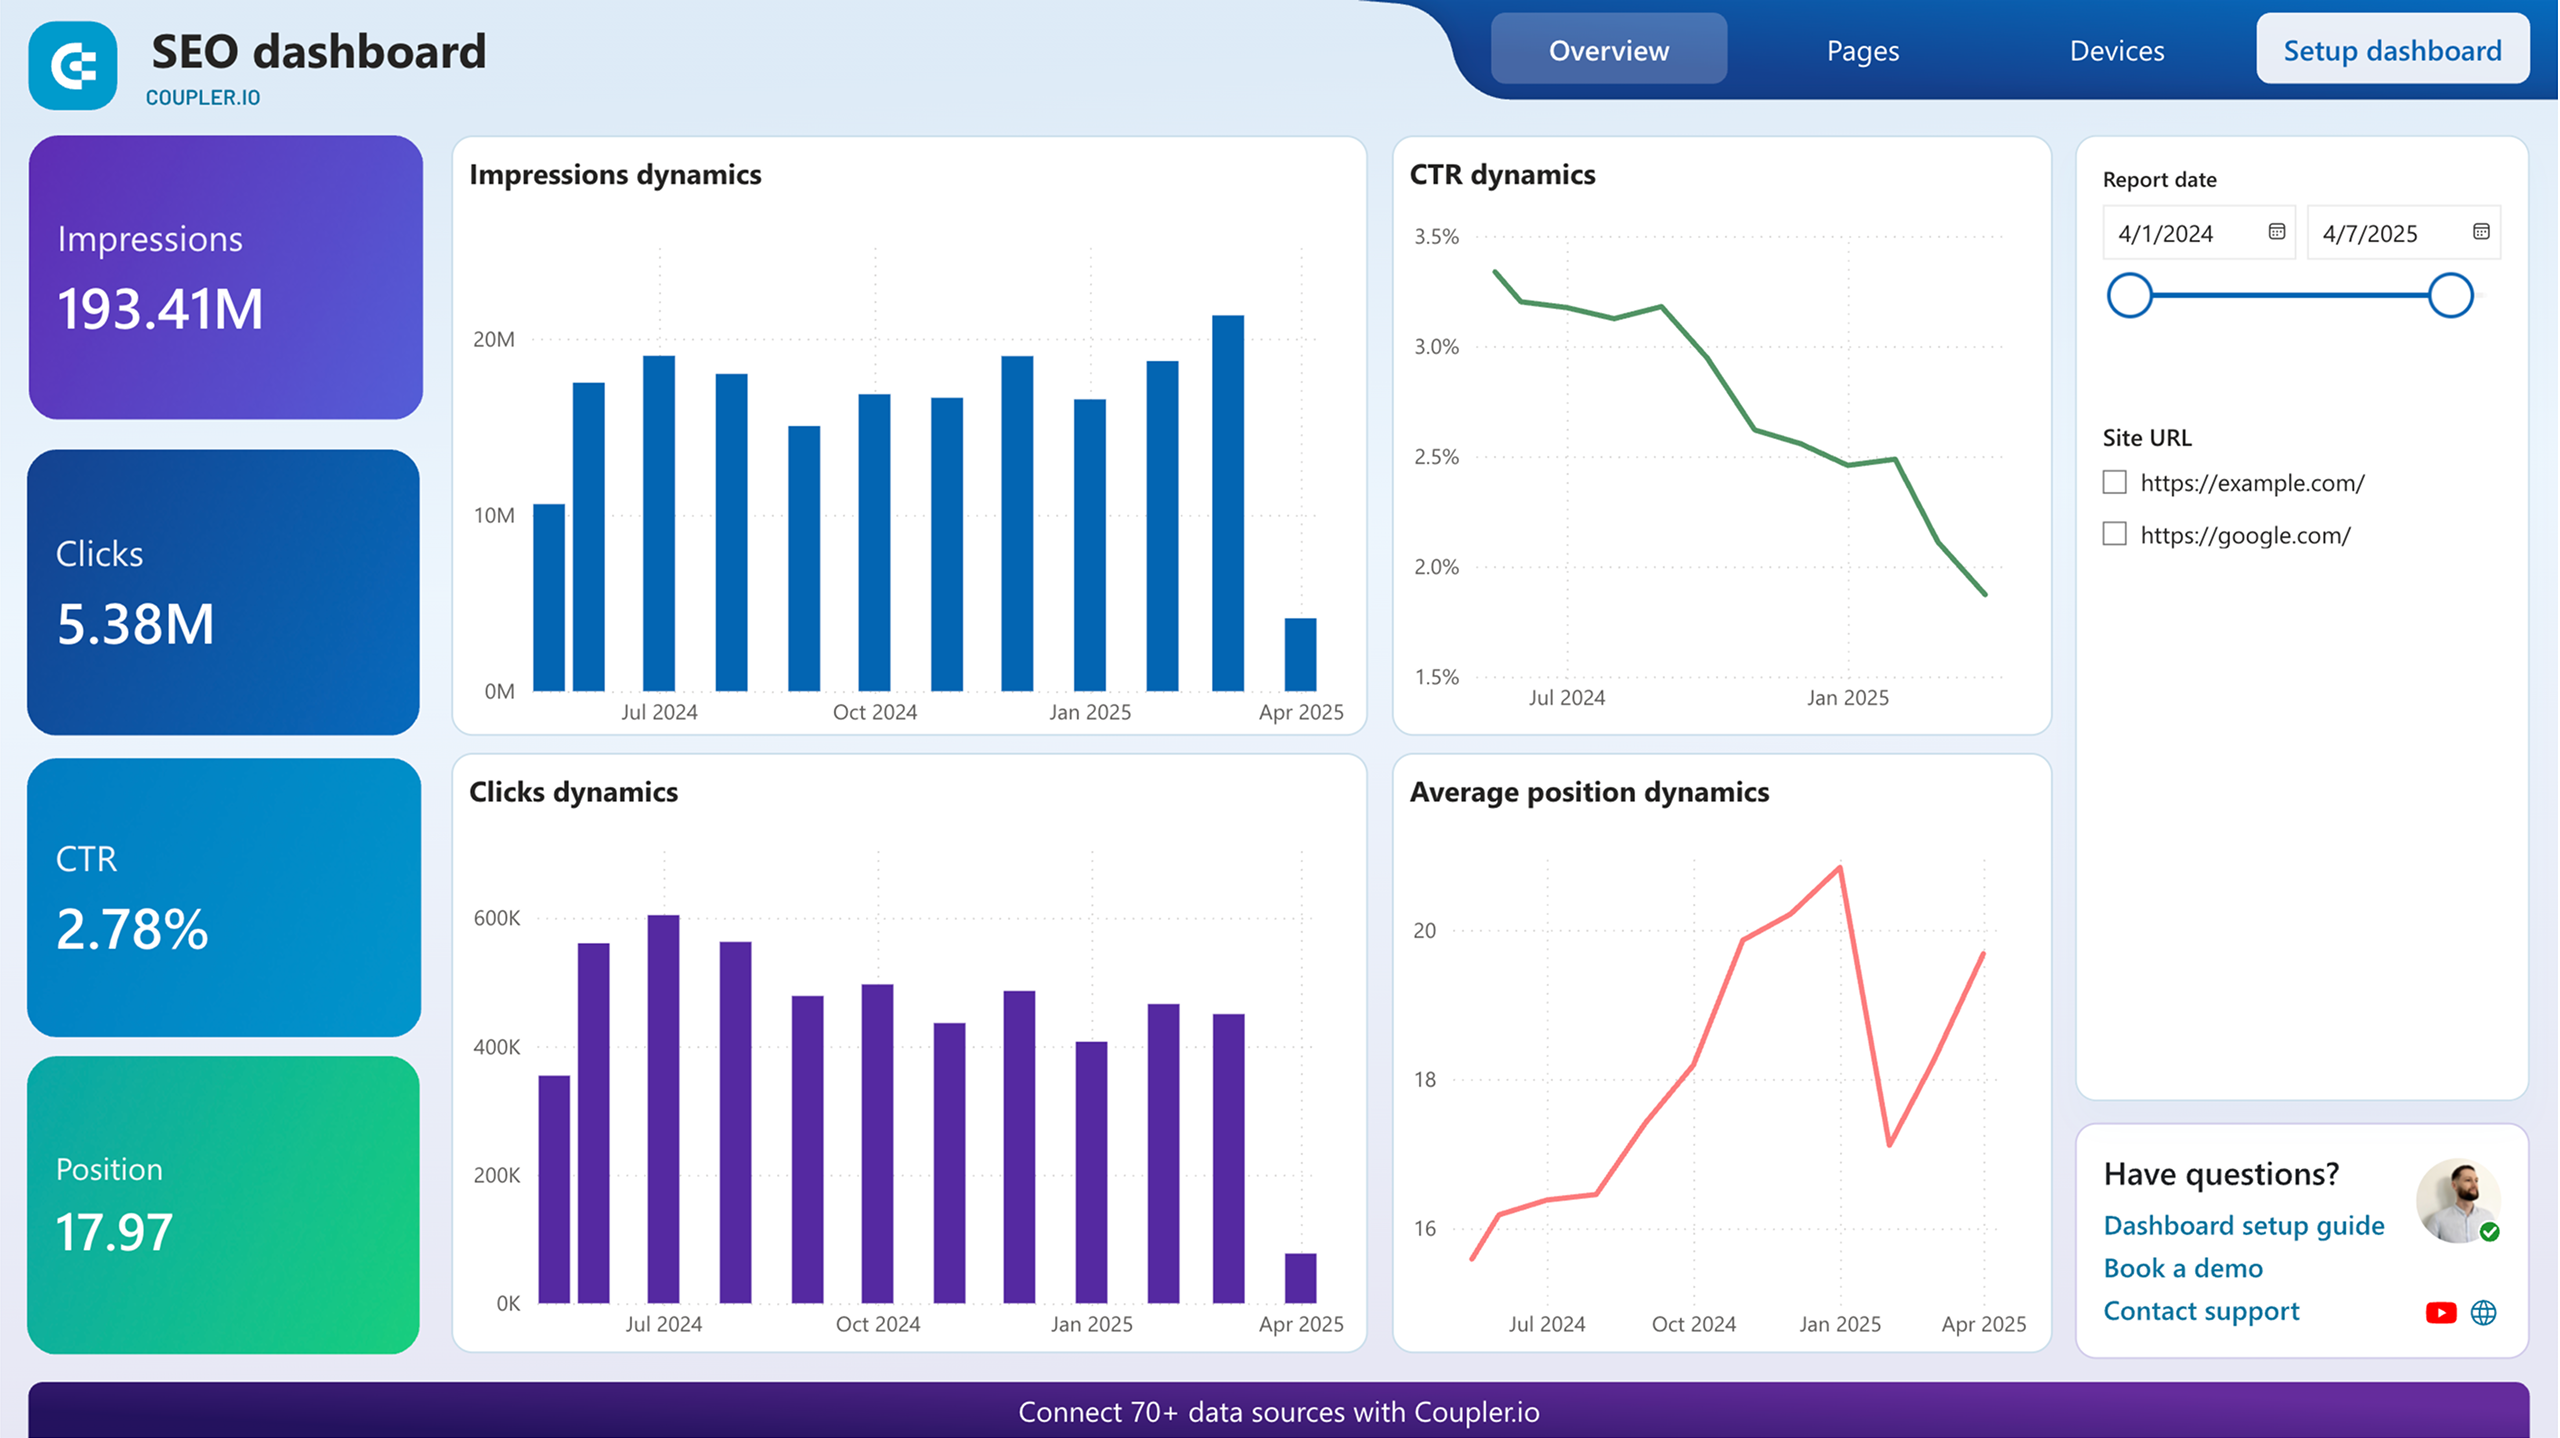
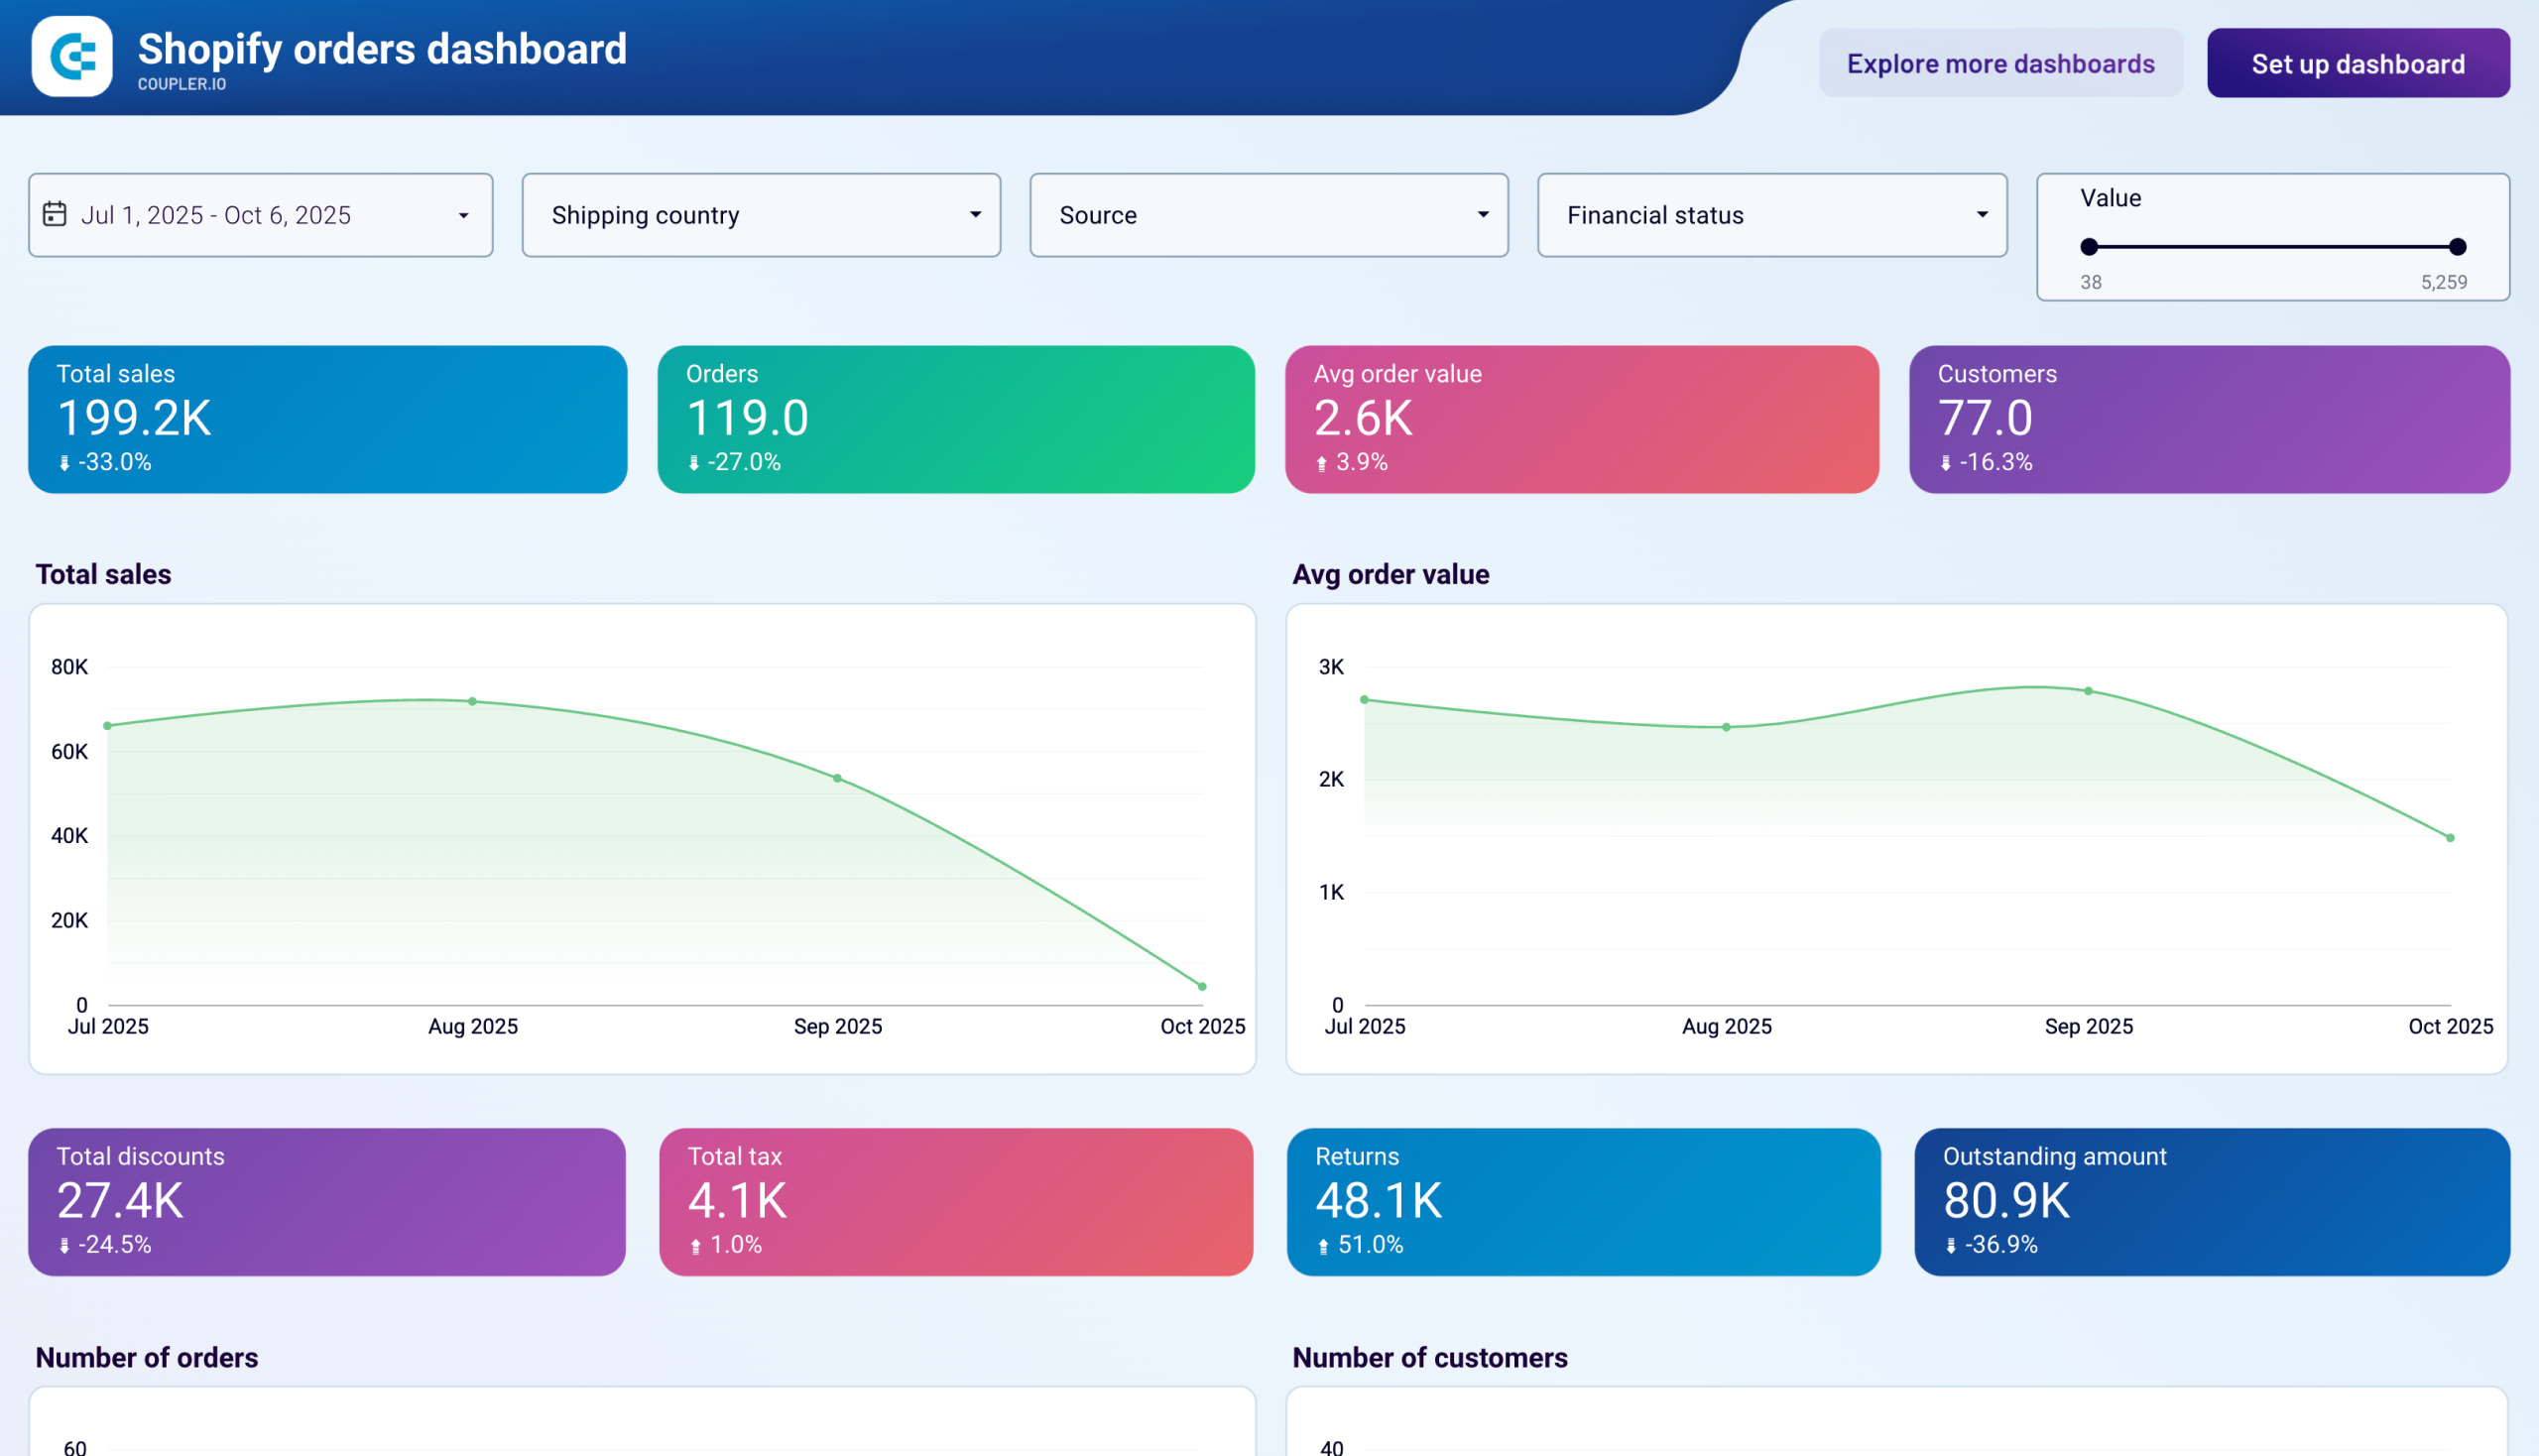
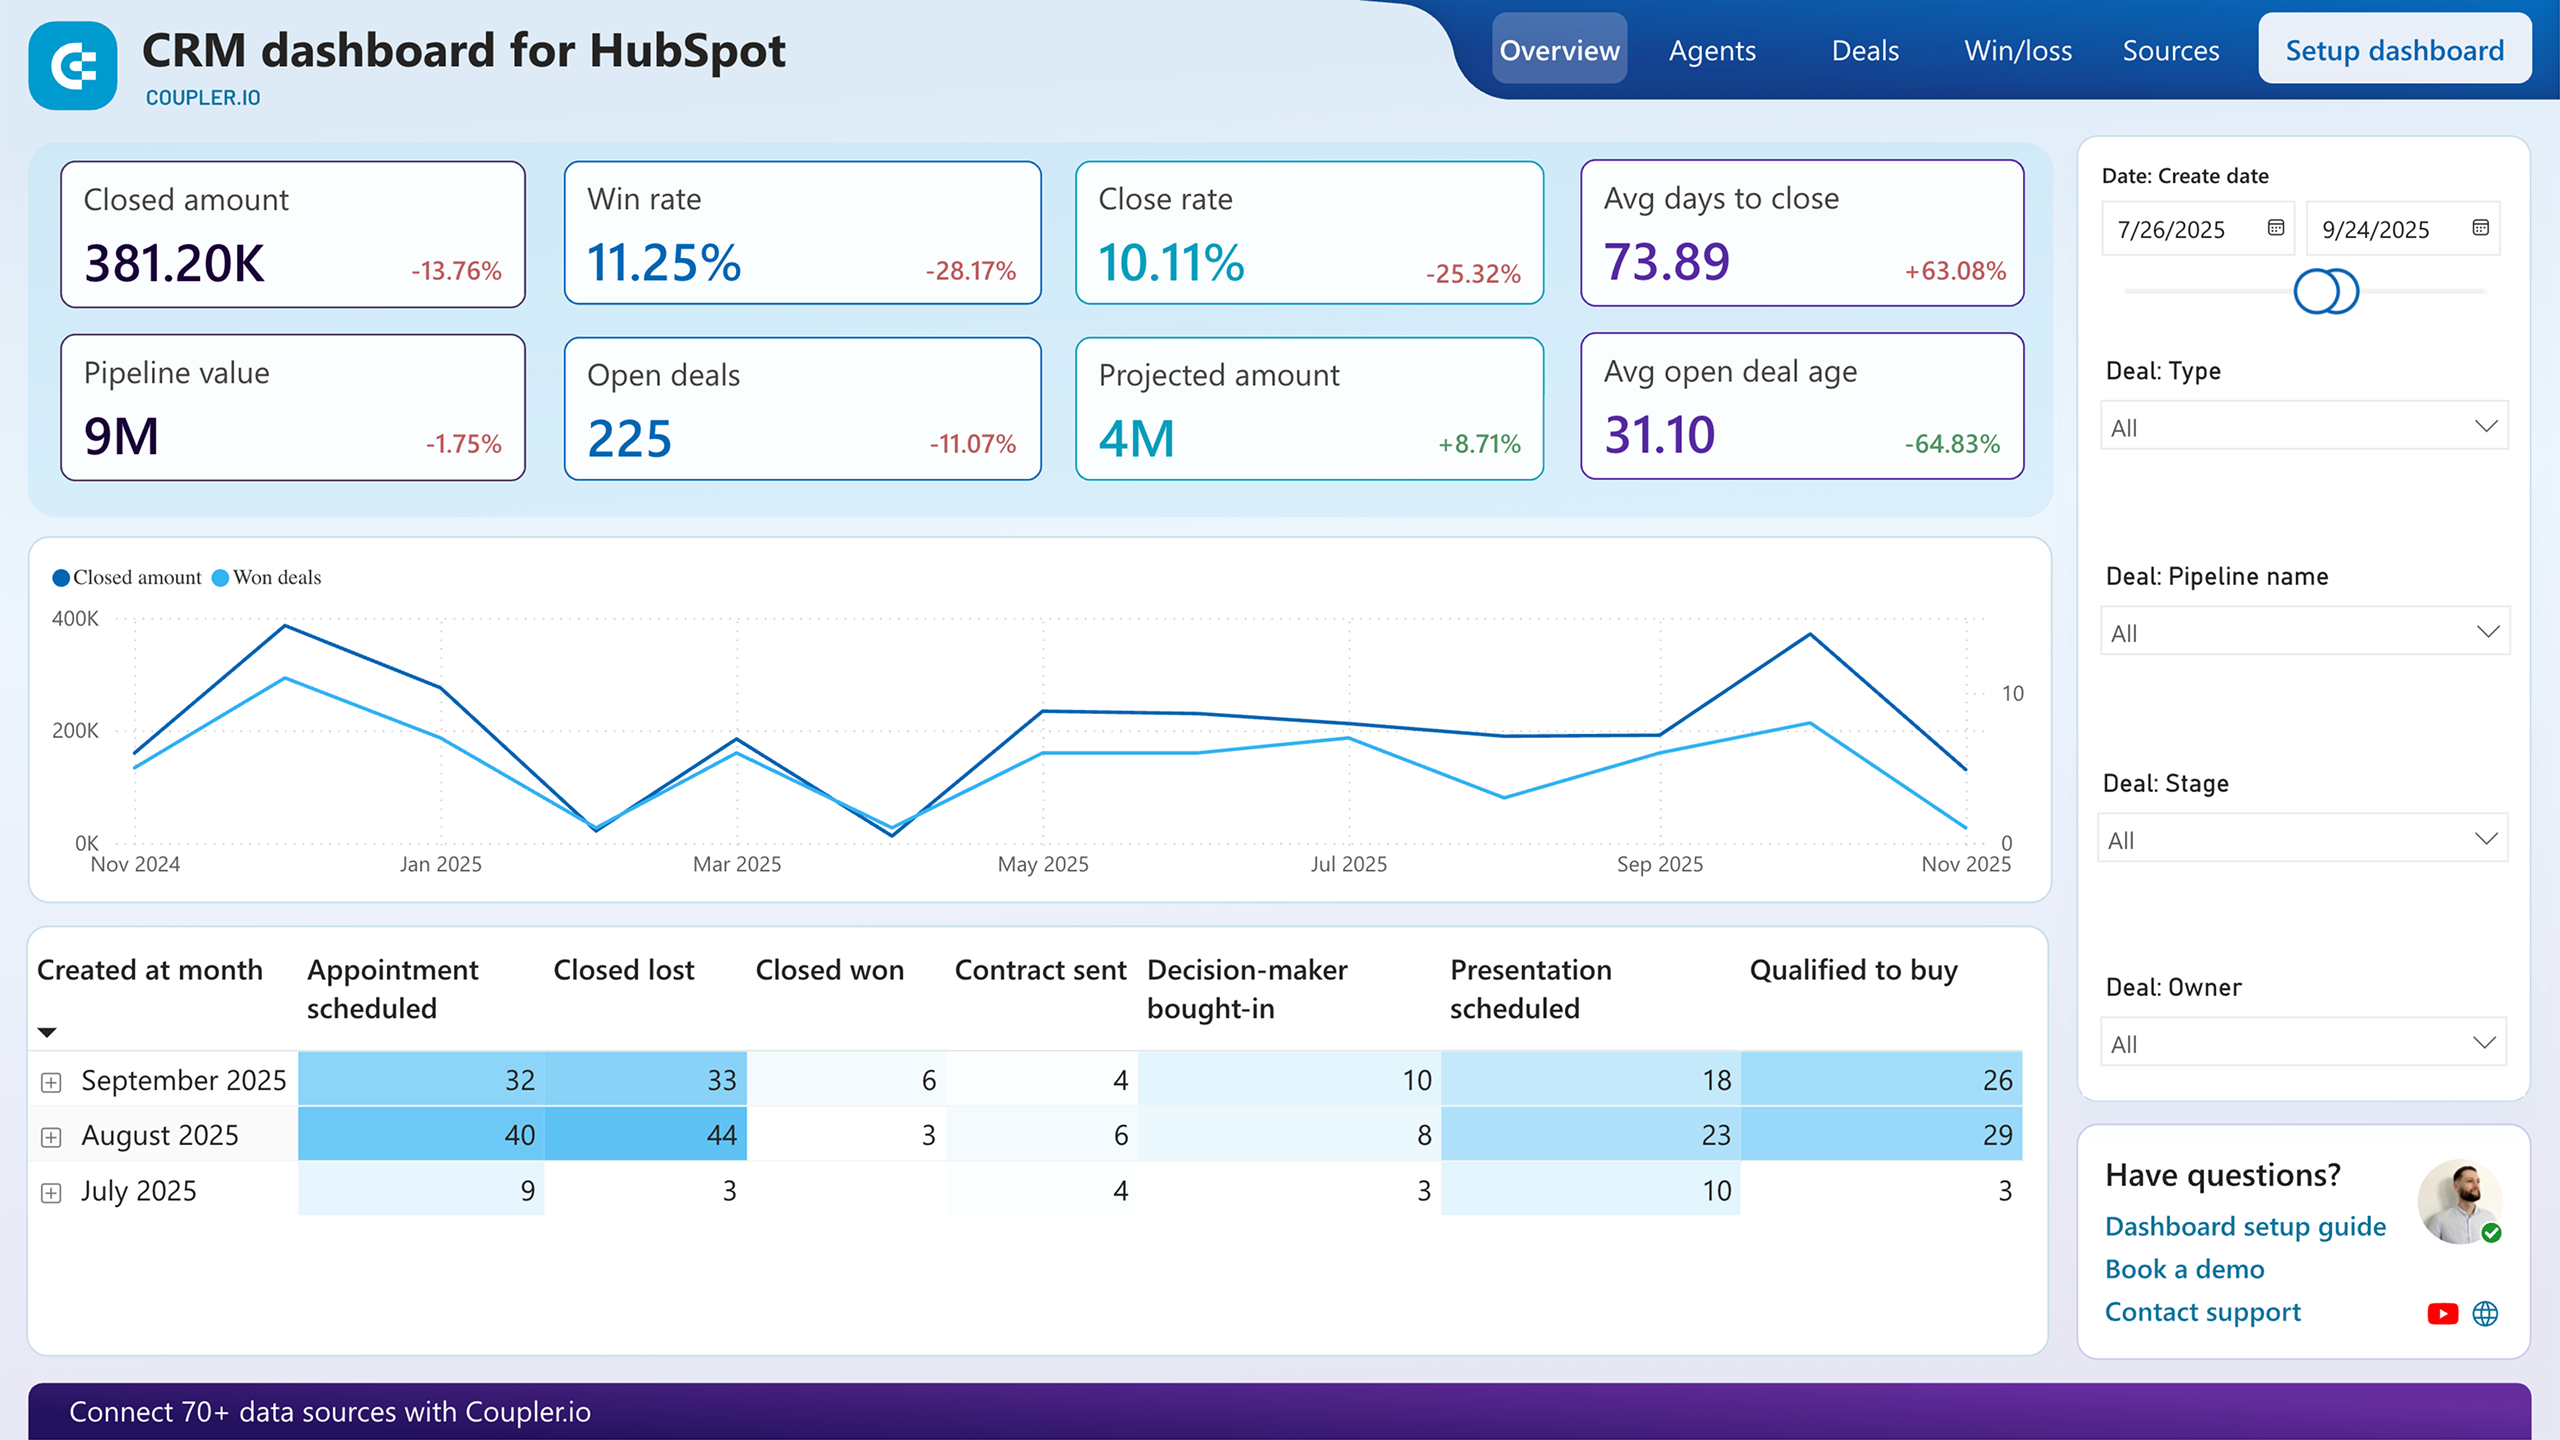
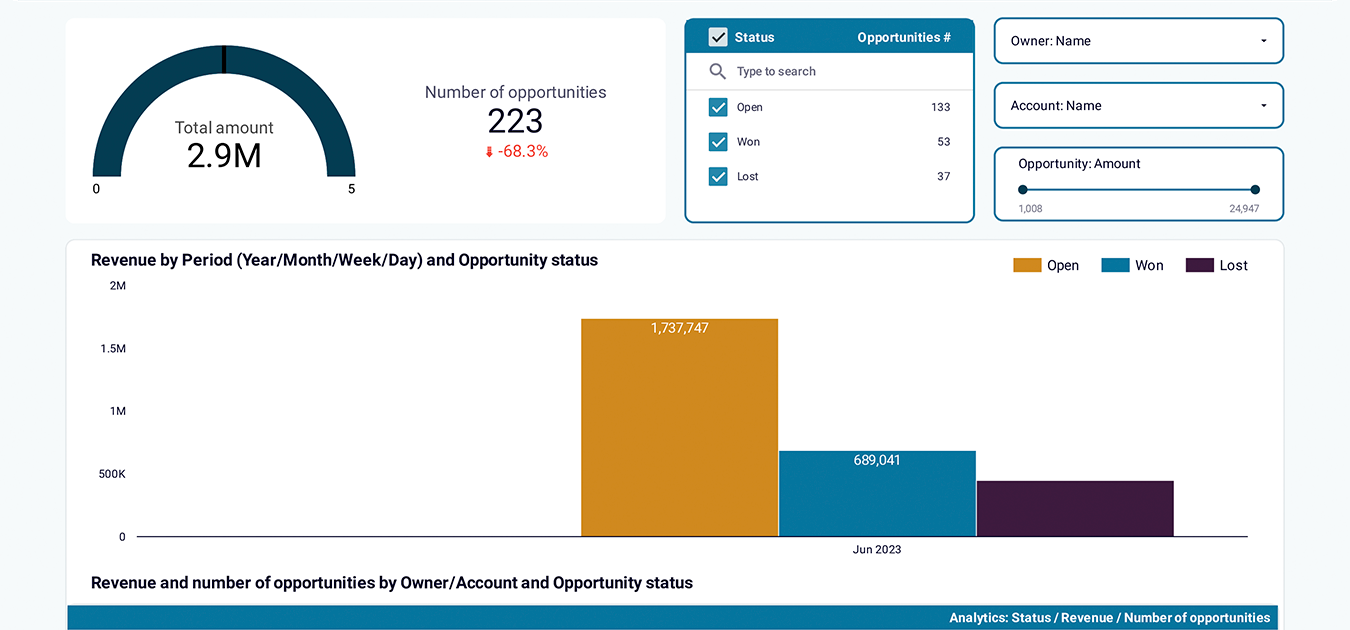
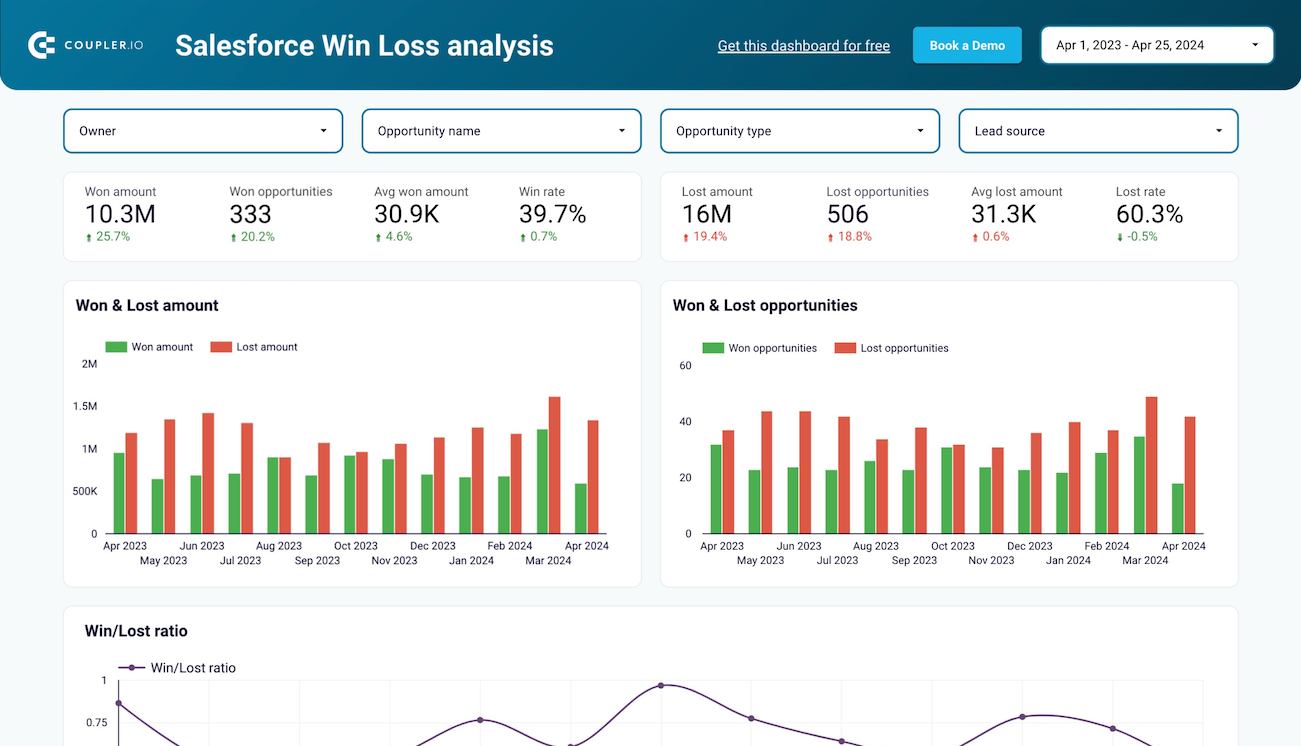
Check out the Coupler.io dashboard gallery
Multi-channel ad creatives performance dashboard
PPC multi-channel dashboard
All-in-one marketing dashboard
Facebook Ads dashboard
All-in-one social media analytics dashboard
All-in-one social media dashboard
Web analytics dashboard
Flex Hard: Your PPC 2025 Wrapped
All-in-one social media analytics dashboard
Multi-channel creatives performance dashboard
All-in-one marketing dashboard
PPC multi-channel dashboard
QuickBooks revenue dashboard
Billing dashboard for Xero
Xero financial dashboard
Revenue dashboard for Xero
Accounts receivable dashboard for Xero
Accounts payable dashboard for Xero
Google Ads dashboard
Google Analytics PPC dashboard
PPC monthly budget by campaign group - dashboard
PPC monthly budget dashboard
LinkedIn company page performance dashboard
TikTok analytics dashboard
Web analytics dashboard
Google Analytics dashboard for multiple properties
X (Twitter) Ads dashboard
Bing Ads dashboard
Facebook Ads dashboard
Instagram business dashboard
Brand awareness general dashboard
Facebook Ads & Brand awareness dashboard
Shopify marketing funnel dashboard
Shopify marketing funnel analytics
QuickBooks financial dashboard
Quickbooks financial dashboard
Accounts receivable dashboard for QuickBooks
Accounts payable dashboard for QuickBooks
QuickBooks revenue dashboard
Google Ads leads dashboard
Google Search Ads performance tracker + editor
Google Ads creatives dashboard
Quality score analytics dashboard for Google Ads
Google Ads dashboard
Keyword performance dashboard for Google Ads
Google Ads monthly dashboard
Branded organic search vs. paid campaign performance dashboard for Google
PPC multi-channel dashboard
Multi-channel creatives performance dashboard
AI traffic vs Organic traffic dashboard
Advertising budget forecast dashboard
PPC multi-channel dashboard with budget
Top search query performance dashboard
GA4 key event insights dashboard
AI traffic analytics dashboard
Referral traffic performance dashboard
Landing page performance dashboard
SEO dashboard for Google Search Console
Technical SEO dashboard
Google News dashboard
News Outlets dashboard
Search types and appearance from Google Search Console
Global SEO performance dashboard
Customer acquisition dashboard for Pipedrive
Sales KPI dashboard for Pipedrive
CRM dashboard for Pipedrive
Google Ads and Meta Ads campaign performance dashboard
PPC multi-channel dashboard
Apple Search Ads dashboard
TikTok Ads dashboard
Snapchat Ads dashboard
Quora Ads dashboard
Google Ads dashboard
Facebook Ads performance for mobile apps dashboard
Facebook Ads ecommerce performance dashboard
Facebook Ads leads breakdown dashboard
Facebook Ads purchases breakdown dashboard
Facebook Ads dashboard
Meta Ads creatives dashboard
Facebook page insights dashboard
Meta Ads monthly dashboard
SEO dashboard for Google Search Console
Shopify sales funnel dashboard
Shopify store traffic dashboard
Shopify inventory dashboard
Shopify orders dashboard
Marketing and sales performance dashboard for HubSpot
HubSpot marketing performance dashboard
Customer acquisition dashboard for HubSpot
Sales KPI dashboard for HubSpot
CRM dashboard for HubSpot
Salesforce CRM dashboard
CRM dashboard for Salesforce
Salesforce dashboard
Sales team performance dashboard for Salesforce
Salesforce Win Loss analysis dashboard
Sales team performance dashboard for Salesforce
Salesforce sales analytics dashboard
Stripe revenue growth dashboard
Mailchimp email campaign performance dashboard for Shopify store
Email marketing analytics dashboard for Mailchimp
Mailchimp analytics dashboard
Klaviyo analytics dashboard
Email marketing analytics dashboard for Klaviyo
Klaviyo email campaign performance dashboard for Shopify store
Brand awareness dashboard
Time tracking dashboard for Harvest
Time tracking dashboard for Clockify
GoHighLevel customer acquisition dashboard
GoHighLevel sales KPI dashboard
WooCommerce Orders dashboard
WooCommerce marketing funnel
Intercom dashboard
Google Business Profile dashboard
Google Calendar dashboard
Google Calendar availability & meeting hours dashboard
Google Calendar team meeting dashboard
Calendly event dashboard
LinkedIn Ads leads dashboard
LinkedIn Ads companies reach dashboard
LinkedIn Ads creatives dashboard
LinkedIn page and ads analytics dashboard
LinkedIn Ads dashboard
LinkedIn Ads monthly dashboard
Website traffic from YouTube - performance analysis dashboard
YouTube KPIs dashboard
YouTube dashboard
Web analytics dashboard in Tableau
PPC multi-channel dashboard in Tableau
Web analytics dashboard
No such template is available yet.
No worries. Our team will create a template that fits your needs, just tell us more
about your case. It doesn't cost you a penny 😉
Request a custom report
about your case. It doesn't cost you a penny 😉
Essential YouTube metrics to track on the analytics dashboard
Views
This metric shows the total number of views across all videos on your YouTube channel. The number of views indicates how popular your content is and which reach you’re getting. Tracking this metric allows you to understand which videos attract the audience and which topics resonate with it the most.
Average view duration
The average view duration indicates the average time viewers are spending watching videos on your YouTube channel. This metric is essential for evaluating the viewer engagement and attractiveness of your content. A short duration is typically an indicator that viewers are not engaging with or interested in your content.
New subscribers
Tracking how many new subscribers joined your channel during a specific period, usually per month is an essential metric for monitoring channel growth. A stable and steady inflow of new subscribers indicates that your content strategy is effective and you have a connection with your audience.
Likes
This metric shows how many times viewers clicked 'Like' on your videos. The number of likes is a direct measure of audience enjoyment. The low number of likes usually indicates that the content is not that popular and vice versa. This metric can influence how your videos are recommended on YouTube.
Dislikes
This metric shows how many times viewers clicked 'dislike' on your videos. The number of dislikes is an insight into audience dissatisfaction with your content. A certain number of dislikes is normal. However, an unusually high number can indicate that the content resonated with the audience in an undesired manner.
Comments
This metric shows how many comments viewers left on your videos. Tracking comments is crucial to evaluate audience engagement and feedback. Comments make your content more recommended on YouTube, so a higher number of comments is what you need to aim at.
Shares
The metric shows how often viewers shared your videos on different platforms. The number of shares is an indicator of content virality. High share counts mean that content resonates with the audience and gains their advocacy. This, in turn, increases views and affects the associated metrics.
Average click-through rate (CTR)
CTR in YouTube Analytics shows the percentage of viewers who clicked on your video after seeing the thumbnail. This metric allows you to assess the efficiency of thumbnails and titles. It helps you to understand how effective they are at grabbing viewers’ attention and enticing them to watch your content.
Card teaser impressions
This metric shows the number of times card teasers are shown to viewers in your videos. This number allows you to understand how often viewers see your additional content prompts, including links to other videos, webpages, and so on.
Card teaser clicks
This metric shows the number of times viewers clicked on your card teasers. Clicks on card teasers allow you to assess the efficiency of these prompts in terms of engaging viewers and driving action, such as visiting a page or watching another video.
Frequently asked questions
Yes, it is! We designed our YouTube Analytics dashboard template with security in mind. The template is equipped with a reliable and secure data connector by Coupler.io that automates data flow from YouTube Analytics to the dashboard. It adheres to strict data privacy protocols and ensures the protection of your information from unauthorized access.
Yes you can! If your Google account is associated with multiple YouTube channels, then you’ll only need to select the needed channels when configuring the built-in connector.
If you want to blend data from multiple Google accounts and hence separate YouTube channels, this is also possible. However, this requires some reconfiguration of the connector. You can do this yourself or ask our data experts to help you with this.
By default, Coupler.io will update the dashboard at a close to real-time frequency - every 15 minutes. However, you can change the configuration to have the data refresh every hour or every day. It’s also possible to configure the days of the week, time preference, and time zone for your automatic data updates.
While the dashboard isn't instantaneous, this frequency allows you to receive up-to-date information to make timely, informed decisions.
On the YouTube Analytics dashboard, we have provided a few charts that display dynamics or trends for different metrics from a time range perspective. This allows you to compare performance in the long run.
If you want to change or add metrics for comparison, you can easily do this. Our dashboard template is designed with customizability in mind so you won’t have any issues with adapting it for your reporting needs. For more advanced cases, feel free to contact our data expert service for assistance.
Our YouTube Analytics dashboard template is designed in Looker Studio, which allows you to export data as a CSV or Excel file. However, with Coupler.io as a built-in connector, it’s much easier to use it for exporting data to the required destination. All you need is to make a copy of your existing importer and change the destination app to the one you need: Google Sheets, Microsoft Excel, BigQuery, Power BI, or monday.com.
The heart of this analytics dashboard is a data connector by Coupler.io. It allows you to automate data flow from YouTube Analytics to the dashboard on a custom schedule. The data lands into the dashboard in the form of charts, scorecards, and tables. So, you get analysis-ready data without any effort.
The process of data collection, organization, and visualization is fully automatic. You won’t have to make anything except for a few clicks to start using this YouTube Analytics dashboard.
