Inventory dashboard examples and reporting templates
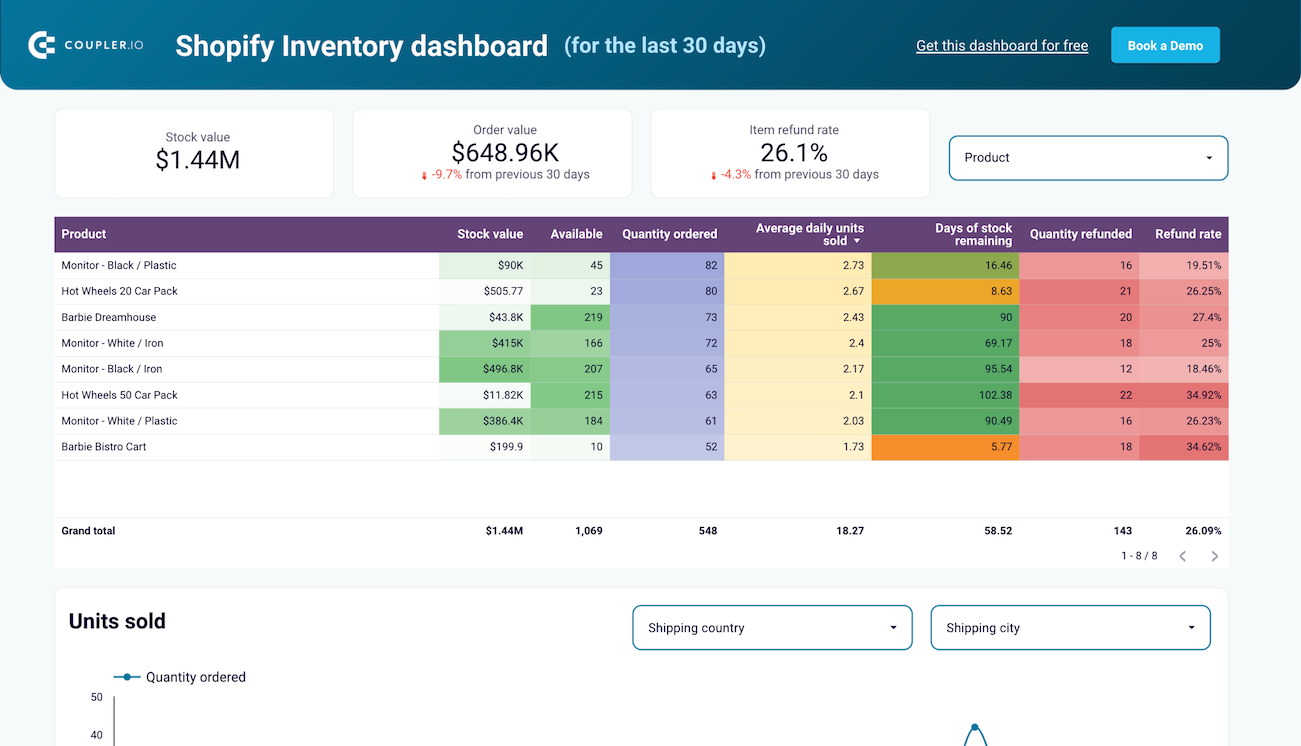
Transform your Shopify inventory management with automated dashboards that track stock levels, predict shortages, and optimize fulfillment across multiple locations. Connect your Shopify store through Coupler.io to use our inventory dashboard that provides insights into performance, return patterns, and procurement needs without manual data exports.
Specifically visualized for

Looker Studio
Three challenges this inventory dashboard template helps resolve
- Prevent stock shortages by calculating days of inventory remaining and identifying products that need immediate procurement attention before stockouts occur.
- Reduce return-related losses by analyzing geographic return patterns and identifying problematic regions or products that require strategic adjustments.
- Optimize multi-location fulfillment by balancing inventory distribution across warehouses to minimize shipping costs and prevent regional stockouts.
What you will learn from the inventory dashboard
You can use our inventory tracking dashboard to optimize your Shopify store's stock management and prevent costly shortages or overstock situations. Simply connect your Shopify account through Coupler.io, and you'll discover:
- Which products need immediate restocking? Calculate "Days of stock remaining" for every SKU to plan procurement and logistics effectively. This critical metric helps store owners predict potential shortages before they happen, ensuring continuous product availability and preventing lost sales opportunities.
- Which countries generate the highest return rates? Identify geographic patterns in product returns to address region-specific shipping or product issues. Understanding return patterns helps you make informed decisions about international sales strategies, whether to adjust pricing, improve product descriptions for specific markets, or evaluate return shipping costs.
- How do daily sales correlate with advertising spend? Monitor order volume trends alongside your promotional activities to evaluate campaign effectiveness. When sales remain flat despite increased ad spend, this insight signals the need to reconsider advertising settings, targeting, or creative strategies to improve return on investment.
- How should inventory be distributed across locations? Compare stock availability across multiple warehouse locations to optimize product distribution and reduce shipping costs. This prevents situations where you have excess inventory in one location while experiencing stockouts in another, improving fulfillment efficiency and customer satisfaction.
What reports you get with our inventory dashboards
An effective inventory management dashboard requires visibility into stock levels, demand patterns, and fulfillment efficiency across your entire operation. The most valuable inventory dashboards combine real-time stock data with predictive analytics to prevent shortages while optimizing costs. Here are the essential reports that transform raw inventory data into actionable business insights.
Product-level inventory tracking with procurement alerts
The Shopify inventory dashboard provides detailed SKU-level reporting that calculates "Days of stock remaining" for each product. This automated calculation helps store owners plan procurement and logistics effectively by predicting potential shortages before they happen. Unlike Shopify's native interface, this report organizes all products with key inventory metrics in one comprehensive view.
Geographic return analysis for international optimization
Track return rates by shipping country to identify regions with problematic return patterns that may indicate shipping issues, product mismatches, or pricing problems. This analysis enables store owners to make informed decisions about international sales strategies, whether to adjust regional pricing, improve product descriptions, or evaluate the cost-effectiveness of serving specific markets.
Multi-location inventory distribution monitoring
Compare stock availability across all warehouse locations to prevent imbalances where excess inventory sits in one location while stockouts occur in another. This report in the inventory analysis dashboard is particularly valuable for businesses with multi-country storage facilities. With its help, you can optimize fulfillment efficiency and reduce shipping costs by ensuring proper inventory distribution.
How to create an inventory reporting dashboard?
Step 1
1
Go to the Readme tab where you can see instructions on how to set up the inventory dashboard template.
Step 2
2
Click the button to set up the Coupler.io connector for your Shopify store account.
Step 3
3
Follow the instructions to prepare and load data to the dashboard.
Step 4
4
Go back to Coupler.io to configure the schedule for the data refresh of your inventory reporting dashboard.


 Shopify