Enterprise SEO dashboard examples and reporting templates
Transform your organization's search visibility with powerful enterprise SEO dashboards that consolidate data from Google Search Console, Google Analytics, and technical crawl data. Track performance across multiple domains, identify cross-market opportunities, monitor technical website health, and make strategic decisions based on real-time insights—all without the manual data extraction that slows down enterprise teams.
Enterprise SEO dashboard examples for every need


 +6
+6


 +6
+6

about your case. It doesn't cost you a penny 😉
Choose your white label SEO dashboard for enterprise to kick off
What is an enterprise SEO dashboard?
The key distinguishing factor of SEO dashboards for enterprise is their ability to handle complexity at scale—tracking thousands of keywords across multiple websites, comparing performance between markets, identifying technical issues before they impact rankings, and providing customized views for different teams within the organization. With Coupler.io's automated data refresh capabilities, these dashboards ensure your organization always has access to the most current SEO data, enabling faster response to algorithm updates, competitor movements, and market opportunities.

What reports should be included on a meaningful enterprise SEO dashboard?
A truly effective SEO dashboard for enterprise requires several specialized reports that provide multi-dimensional visibility into your organization's search presence. Based on our analysis of high-performing enterprise SEO operations, we recommend incorporating these essential report types:
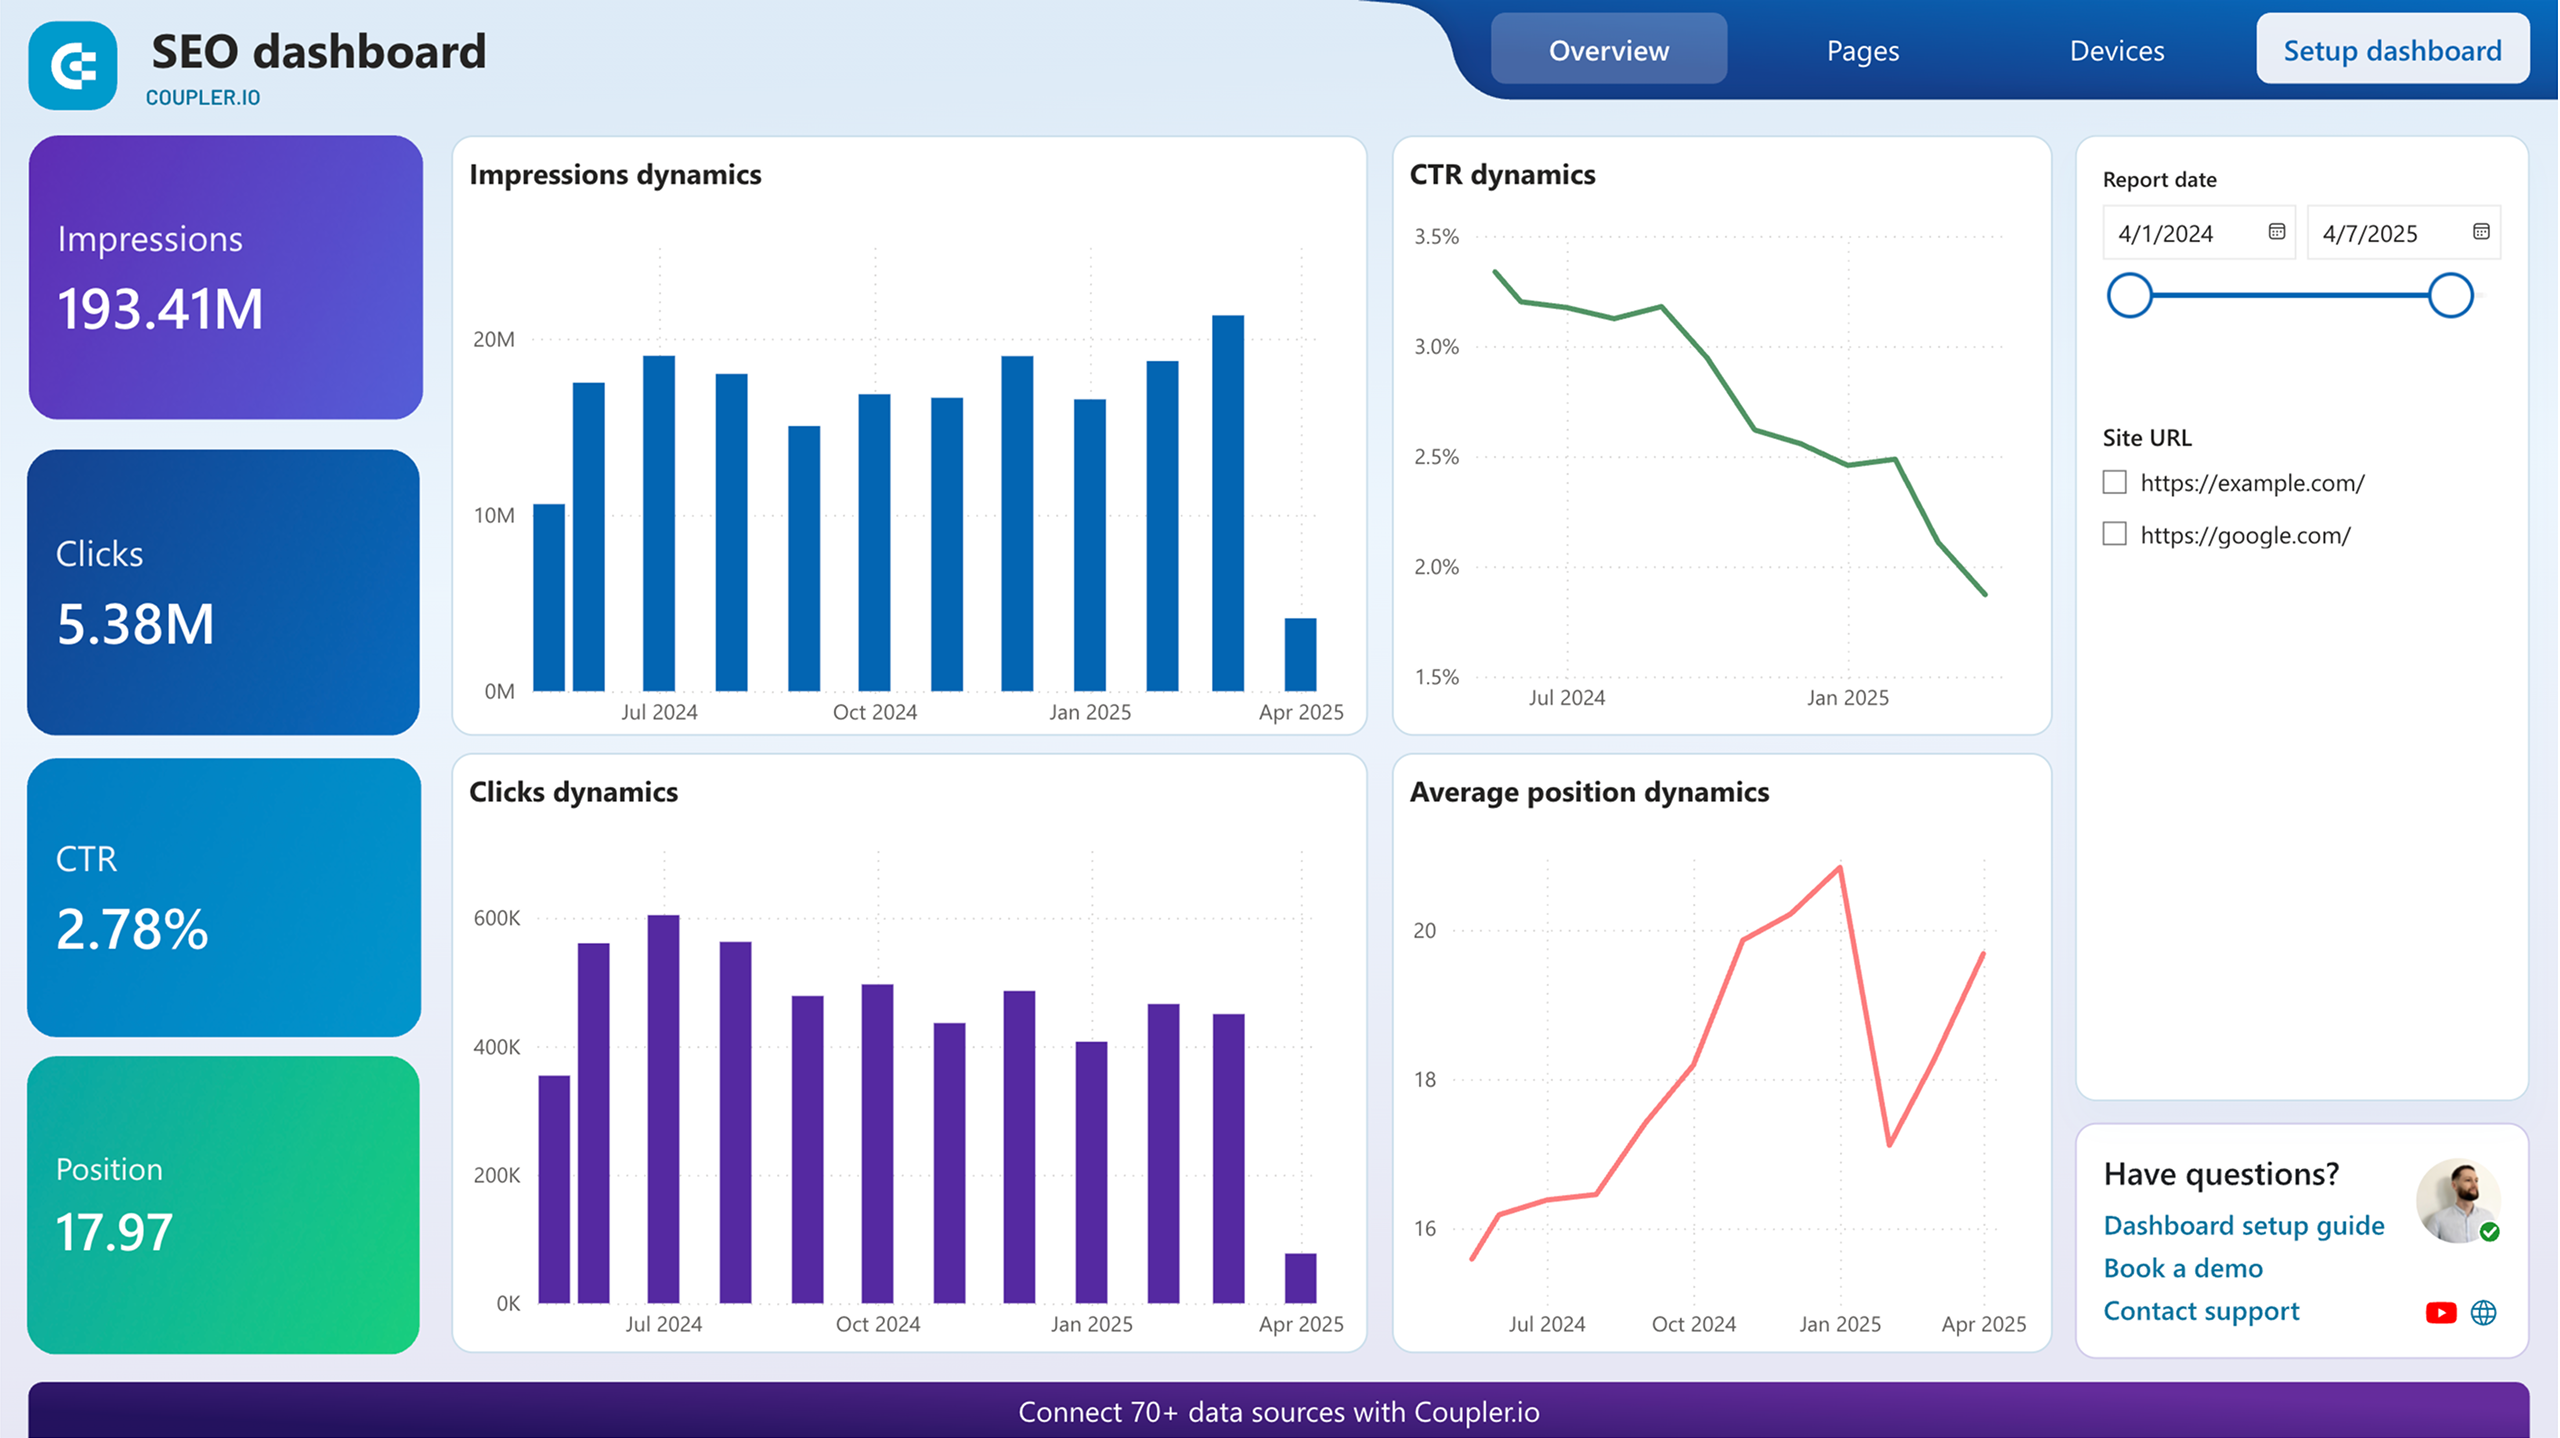
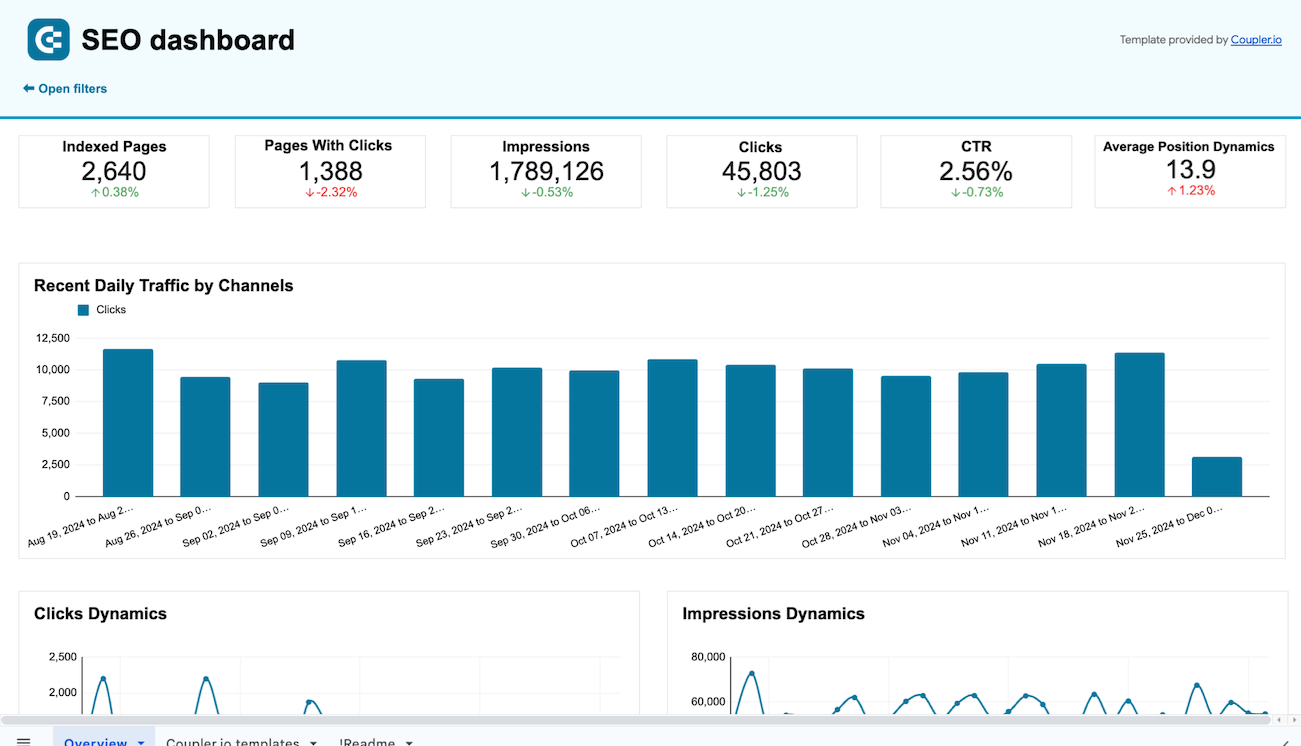
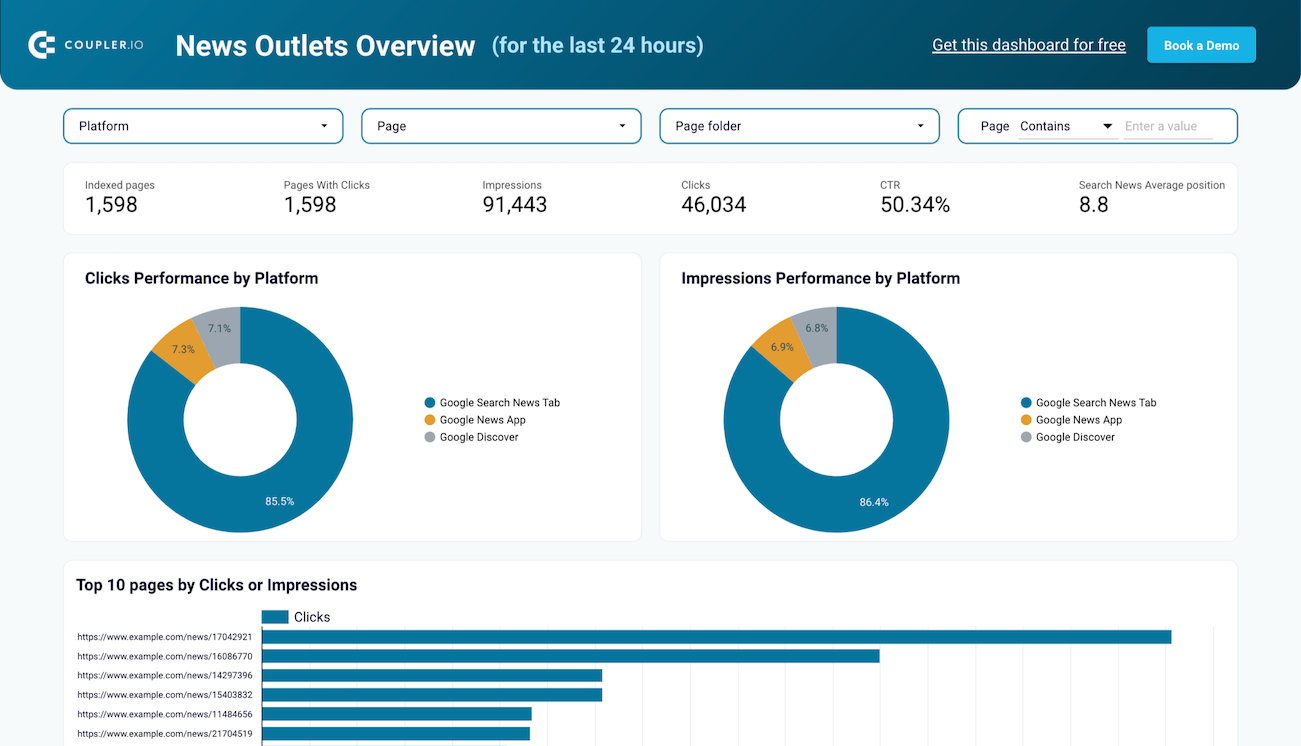
The performance overview report delivers macro-level insights into organic search trends across all your domains and markets. It tracks weekly and monthly changes in key metrics like clicks, impressions, and average position to provide a bird's-eye view of your SEO health. This report helps leadership teams quickly assess if the overall search strategy is moving in the right direction and identify which properties or markets are driving growth or experiencing declines. With historical trending data, you can correlate organic performance with marketing initiatives, algorithm updates, or seasonal patterns to inform future strategy.
The best and worst performers report provides a critical comparative analysis of your content assets. It automatically identifies pages that have gained the most traffic month-over-month alongside those showing concerning declines. This side-by-side comparison helps SEO teams prioritize urgent attention for underperforming high-value pages while also revealing successful content patterns that can be replicated. The report helps eliminate guesswork in content strategy by highlighting exactly which pages need optimization, technical fixes, or content refreshes based on real performance data rather than assumptions.
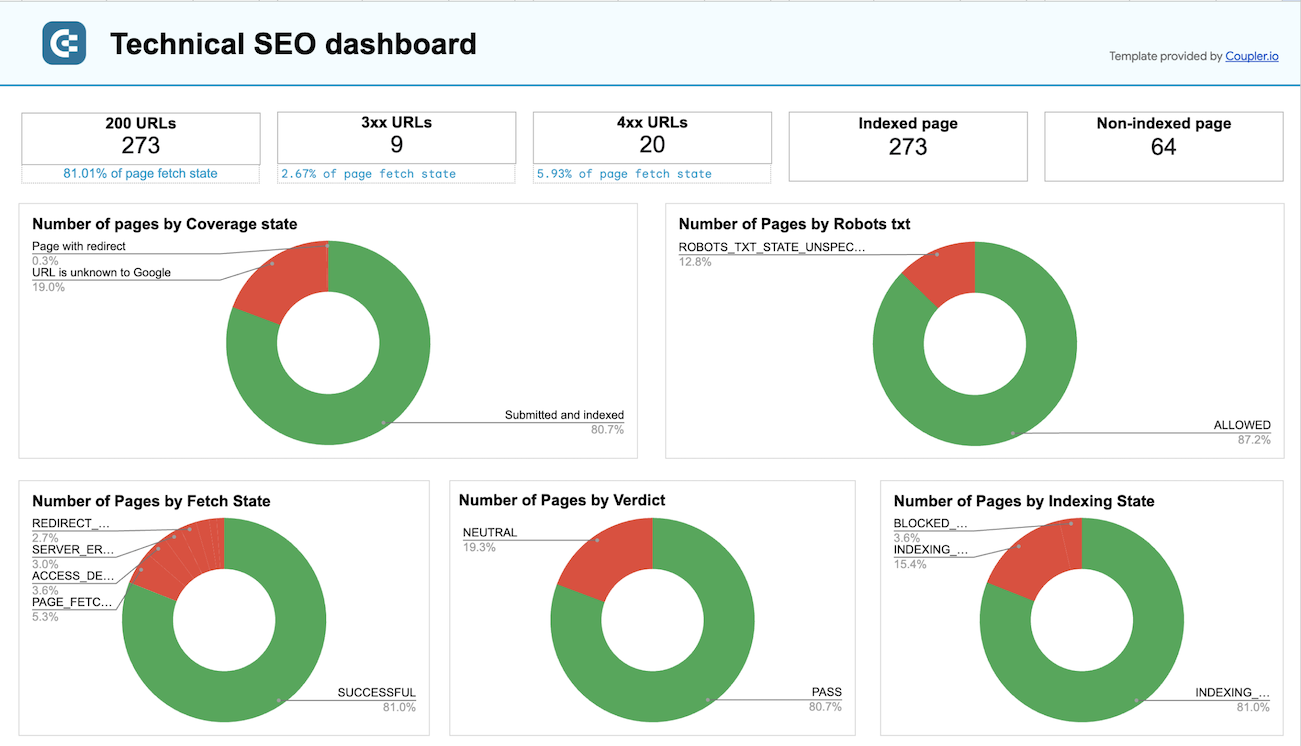
The technical SEO health report functions as your website's diagnostic system, monitoring indexation status, crawlability, and technical problems that could impact rankings. This report provides a clear categorization of URLs by their status in search engines, helping engineering teams prioritize fixes for critical issues like robots.txt blocks, rendering problems, or mobile usability concerns. With this report, technical SEO managers can communicate priorities to development teams with supporting data, track progress on resolving issues, and quantify the business impact of technical improvements to search visibility.
The international SEO performance report delivers market-by-market visibility for global enterprises operating across multiple countries and languages. It tracks organic traffic dynamics for your top markets over time, compares relative growth rates between regions, and identifies emerging opportunities in new territories. This report helps international SEO teams allocate resources effectively between markets, identify successful strategies that can be cross-applied between regions, and detect market-specific issues that require localized solutions. It's an essential tool for organizations looking to maximize global search visibility while respecting regional differences.
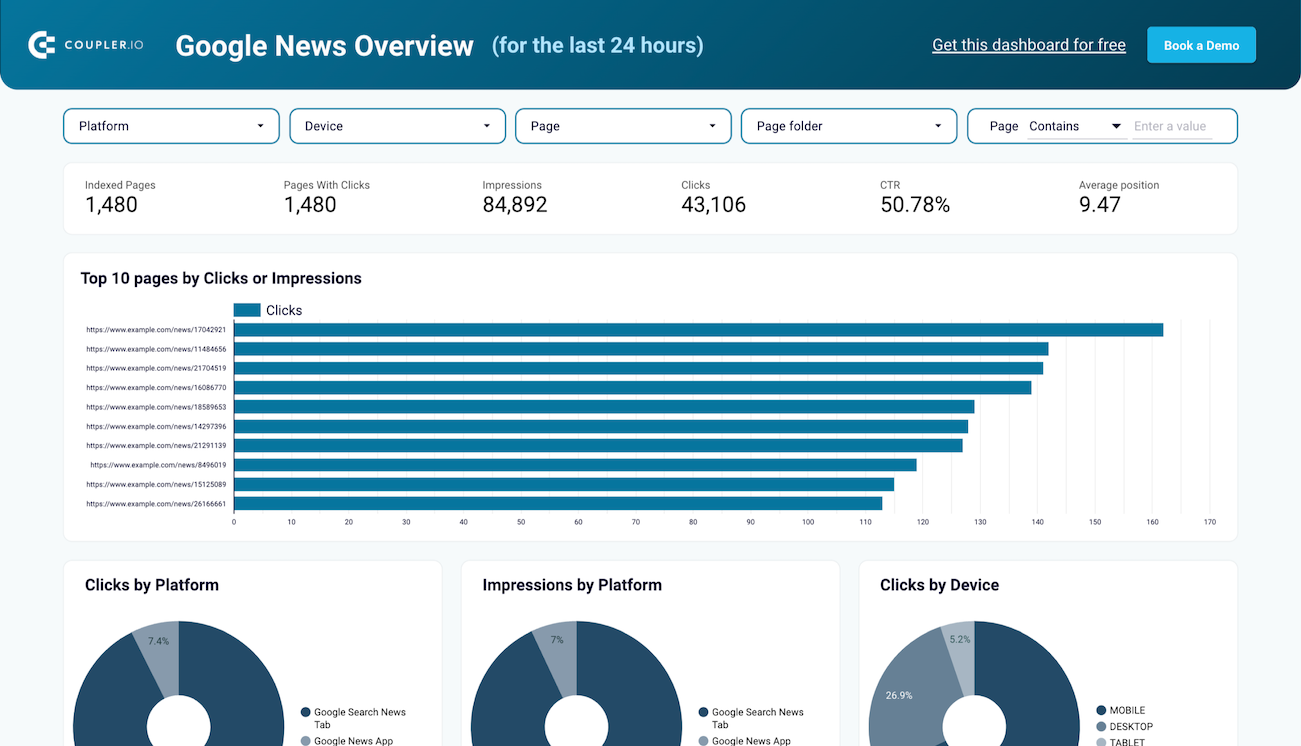
The search query intelligence report organizes your most valuable keywords by landing page, giving you a structured view of which queries drive traffic to each part of your site. It helps identify opportunities for content expansion, reveals potential keyword cannibalization issues between pages, and shows how users actually discover your content versus how you intended them to find it. This report is crucial for content strategists who need to align existing assets with search demand and discover gaps in content coverage that competitors might be exploiting.
What insights you can get with a SEO dashboard for enterprise
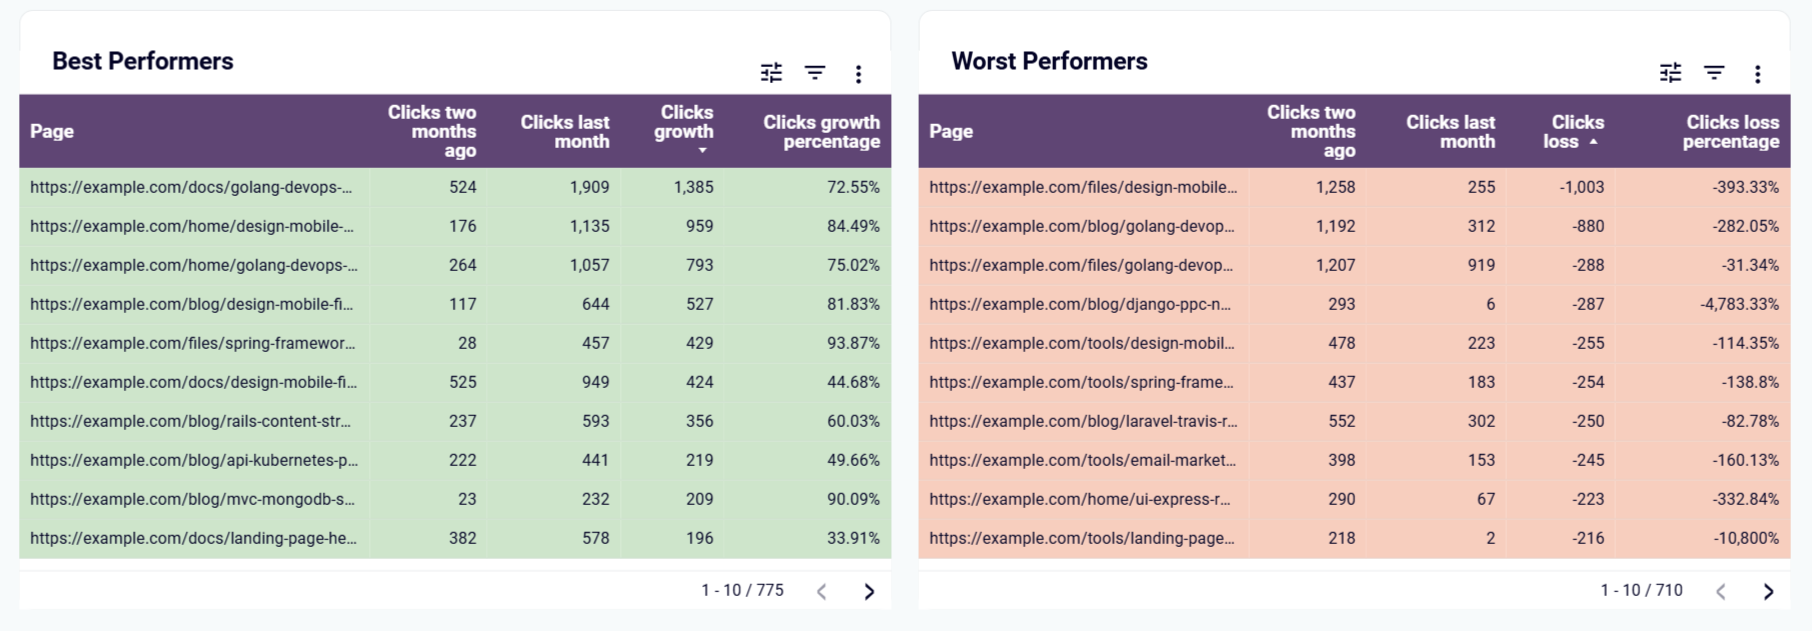
Quickly identify content that's gaining or losing momentum with side-by-side tables comparing the current month's performance against previous periods. This insight flags pages with significant traffic changes before they become problems, allowing SEO teams to investigate or replicate what's working. In one client case, this insight helped identify a 30% traffic drop to key product pages following an unnoticed canonicalization issue, enabling immediate remediation.
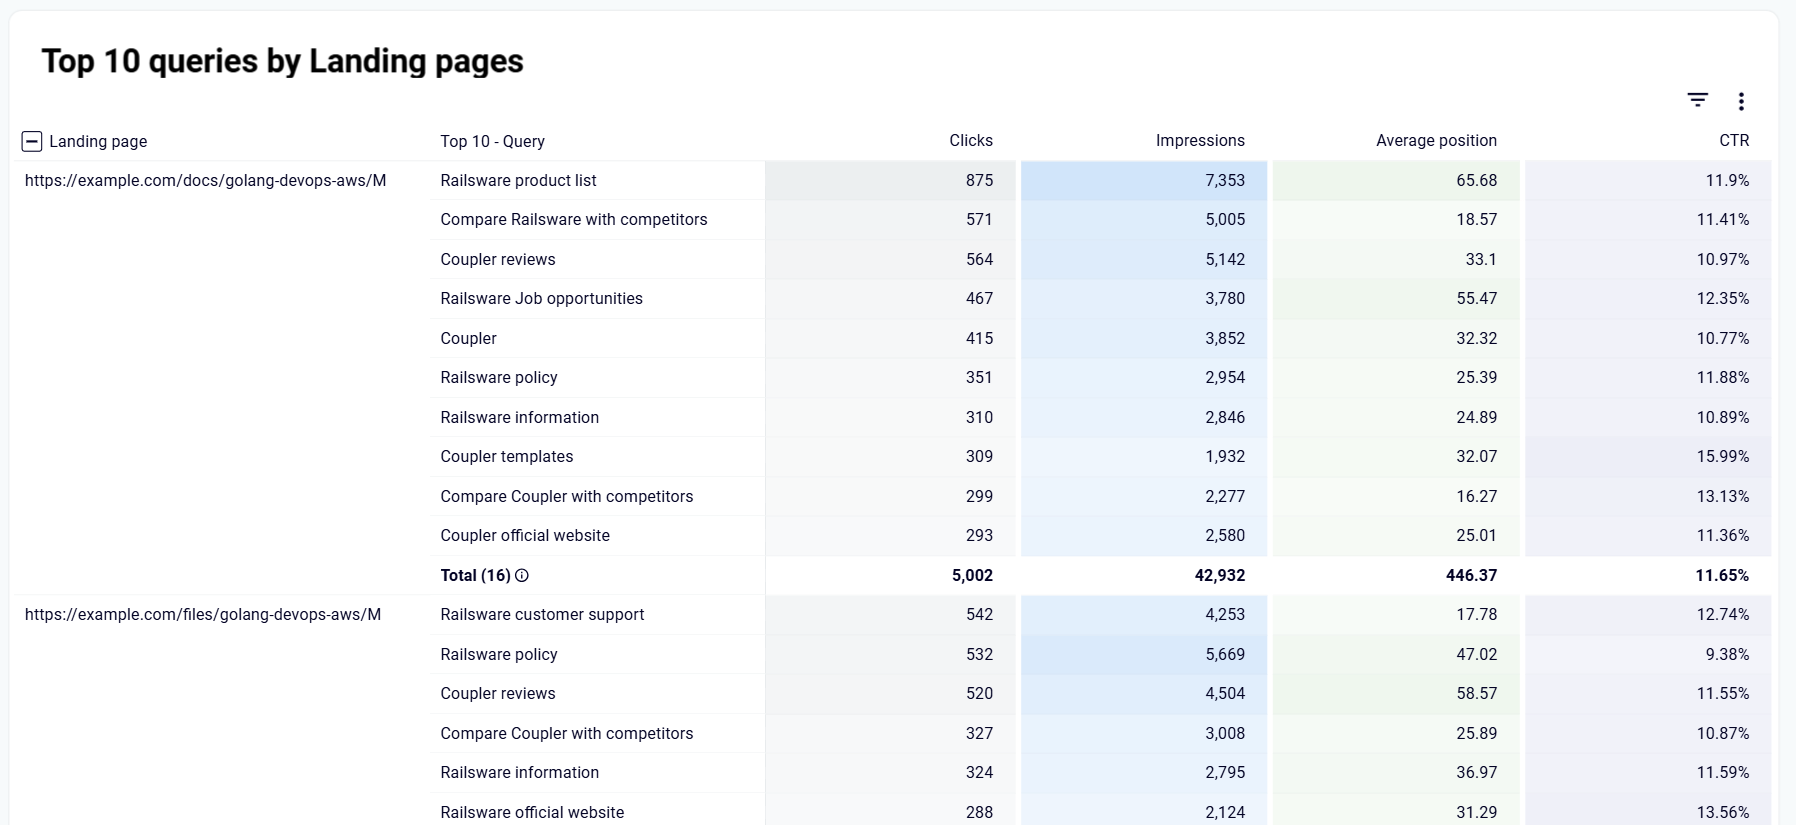
The dashboard reveals the top 10 search queries driving traffic to each of your important landing pages, organized in a clear, structured format. This intelligence exposes mismatches between user intent and content, opportunities to optimize for additional keywords, and potential keyword cannibalization across your site. You can easily filter by specific URL sections to focus on product categories, blog content, or support documentation.
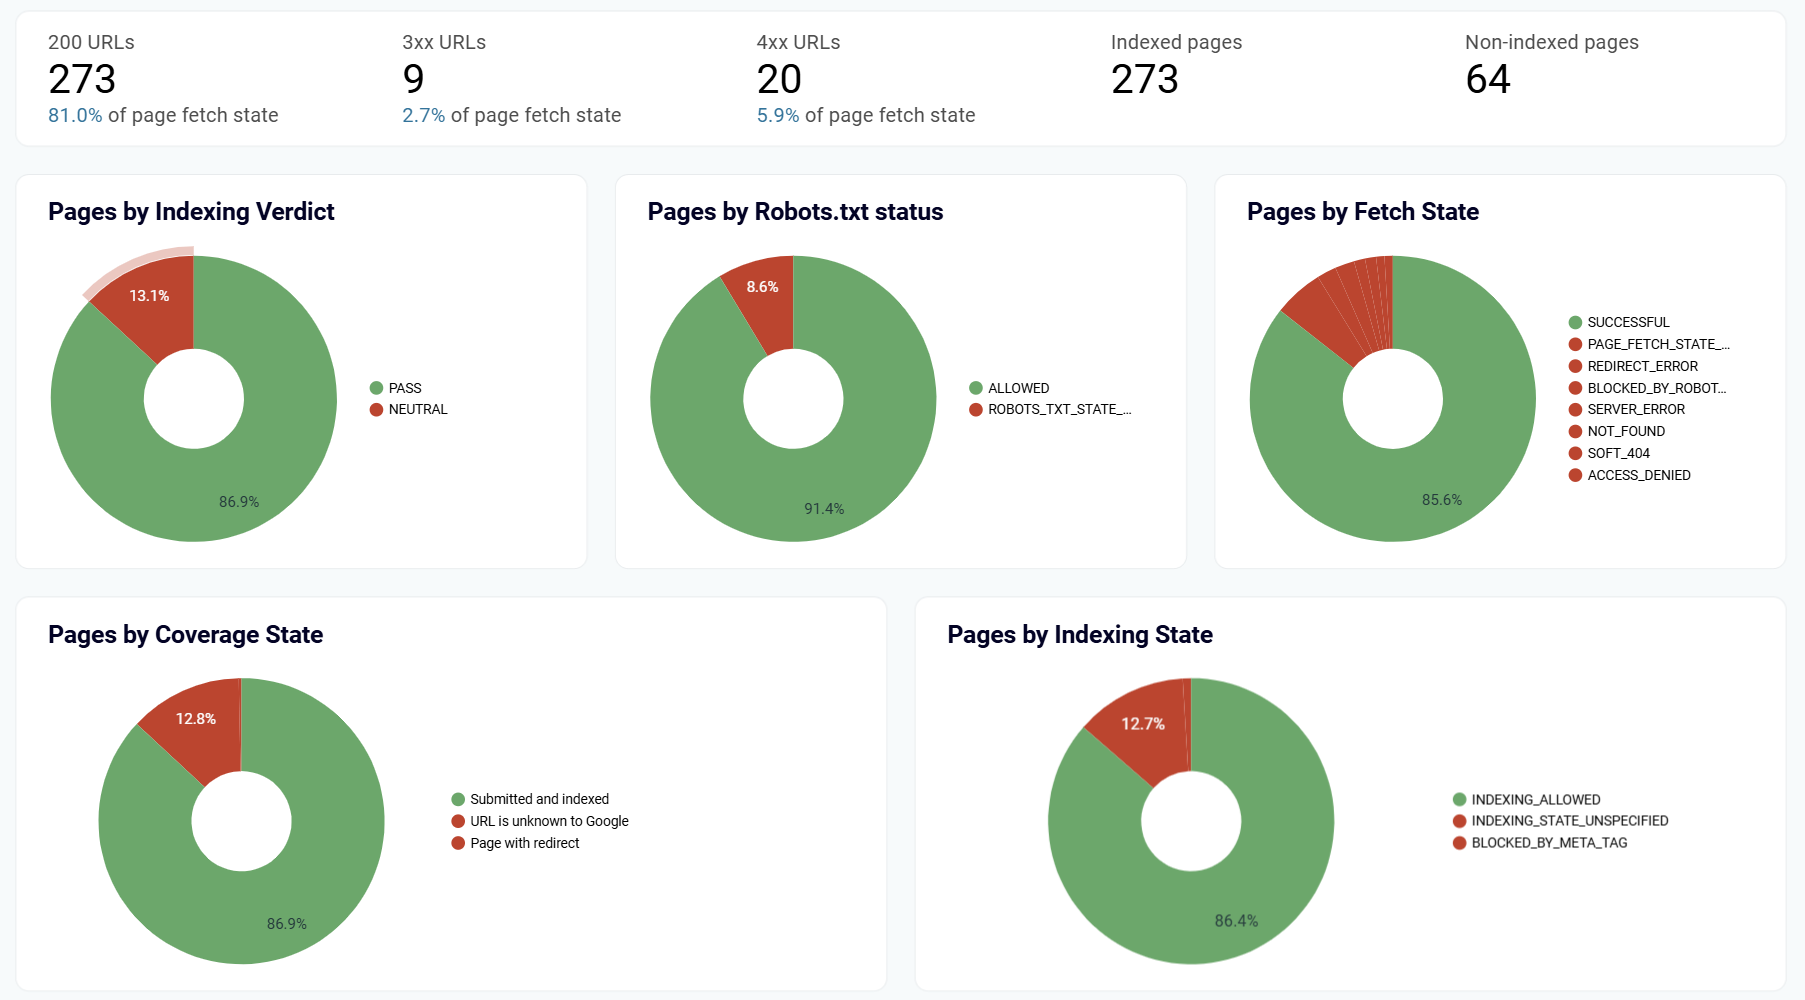
Monitor your entire website's technical SEO health with a comprehensive status overview showing the distribution of pages across critical states like indexation, crawlability, and rendering status. The SEO dashboard for enterprise uses visual indicators to highlight concerning technical patterns, such as increasing numbers of blocked pages or rendering issues. This insight helps prioritize development resources toward fixing the most impactful technical problems.
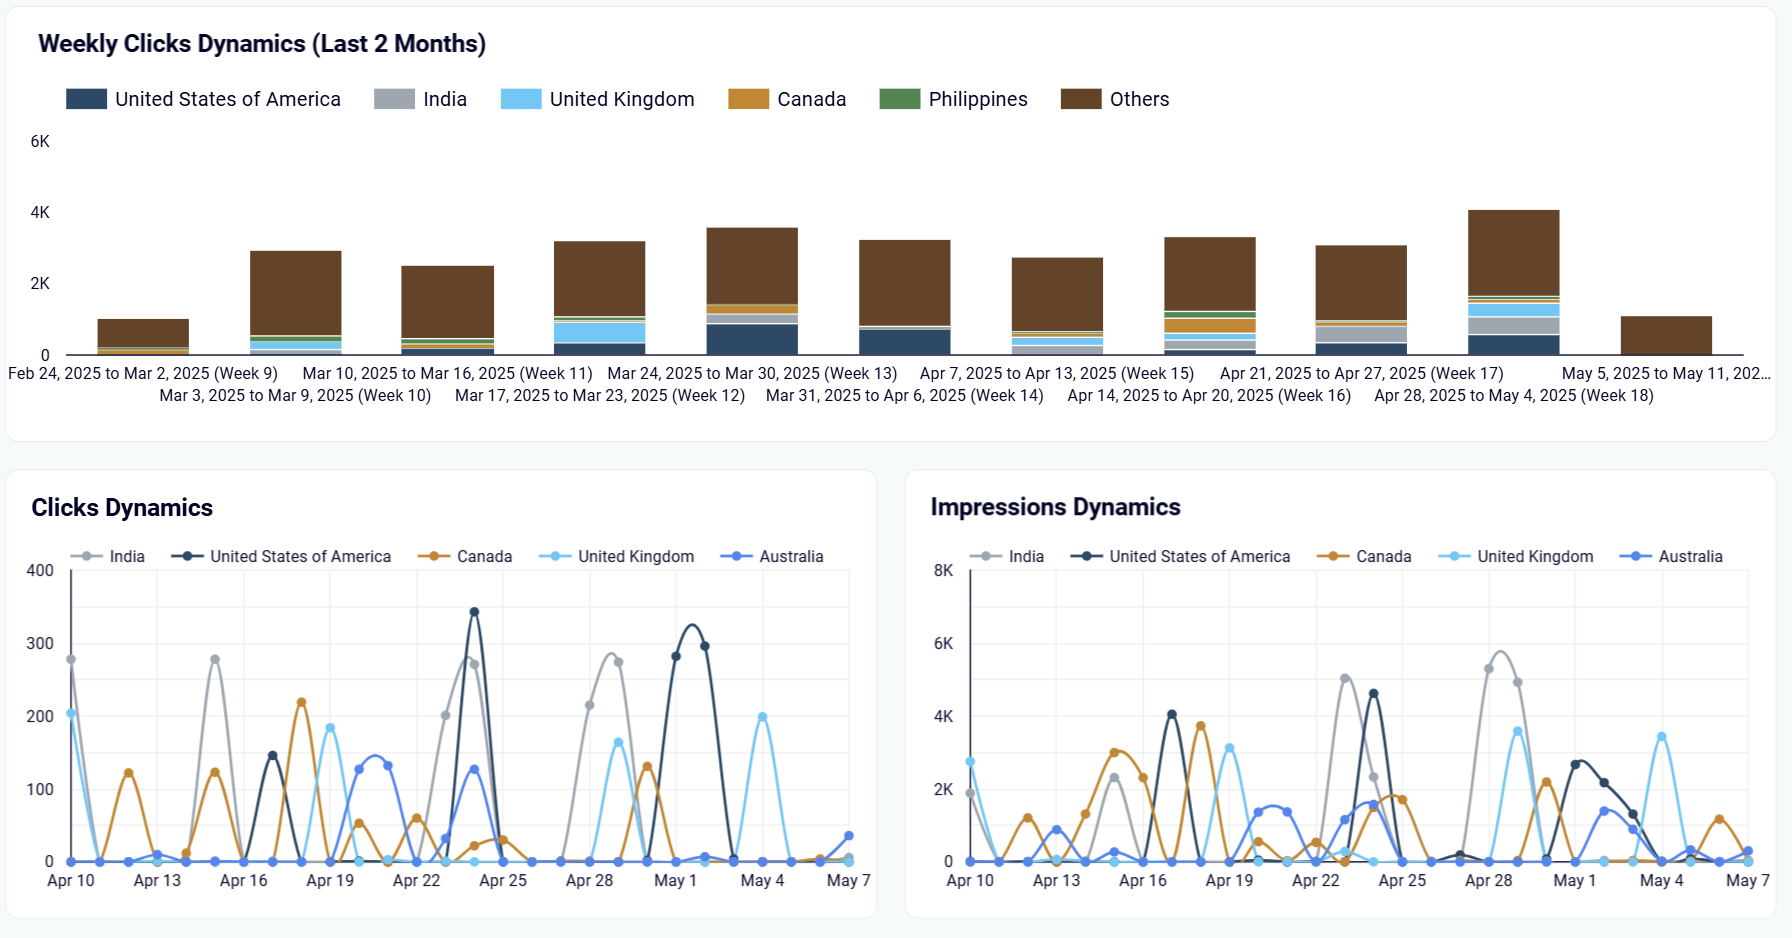
Track organic search performance across your international markets with detailed time-series analysis of traffic from top countries. The dashboard visualizes two-month comparison trends for your top-performing regions, making it simple to identify which markets are growing, plateauing, or declining. International SEO teams use this insight to validate localization strategies and identify regions that need additional optimization attention.
How to create an enterprise SEO dashboard?

Metrics you can track with an enterprise SEO dashboard template
Track how users from different devices (mobile, desktop, tablet) interact with your search listings, revealing potential gaps in device-specific optimization. This metric helps prioritize responsive design improvements and informs mobile-first strategies, especially crucial as Google emphasizes mobile experience in rankings across enterprise websites with complex layouts.
Monitor your site's ranking trajectory with rolling time comparisons showing whether your overall search visibility is improving or declining. This metric serves as an early warning system for algorithm updates or competitive shifts, allowing enterprise SEO teams to isolate the specific sections, keywords or markets being affected before significant traffic losses occur.
Analyze how effectively your search listings convert impressions into actual site visits over time, broken down by page types, market segments, or content categories. This ratio helps identify opportunities to improve meta titles and descriptions across large content libraries, and quantifies the impact of SERP appearance enhancements like structured data implementation.
Monitor what percentage of your submitted pages are successfully indexed by search engines to identify potential crawl budget issues or content quality concerns. Enterprise sites with thousands of pages particularly benefit from this metric, as it reveals systemic indexation problems that might be caused by internal linking structure, content duplication, or technical barriers.
Track the distribution of technical issues across your site categorized by type (robots.txt blocks, rendering issues, mobile usability problems) and severity. This metric helps engineering teams prioritize fixes based on potential search impact rather than arbitrary technical assessments, creating a data-driven approach to technical SEO resource allocation.
Visualize how organic traffic is distributed across your target markets, revealing which countries are delivering the strongest search performance relative to your overall traffic profile. This metric helps international SEO teams identify untapped market potential and validate whether localization efforts are delivering proportional traffic returns across your global footprint.
Monitor the proportion of traffic coming from brand-specific searches compared to non-branded discovery, helping evaluate how effectively your SEO strategy is expanding audience reach beyond existing brand awareness. This perspective is particularly valuable for enterprises investing in both brand marketing and organic search, providing insights into their complementary effects.
Identify how many cases of keyword cannibalization exist across your site, where multiple pages compete for the same search terms. This metric is especially critical for large enterprises with decentralized content creation, helping detect unintentional internal competition that dilutes search authority and confuses both users and search engines.
Track how many unique search queries are driving traffic to your site over time, revealing whether your content strategy is expanding your search footprint or becoming too narrowly focused. This metric helps enterprise content teams ensure they're building comprehensive topical authority rather than over-optimizing for a limited set of keywords.
Measure how effectively each landing page converts its organic traffic into meaningful user actions with a composite score that factors in engagement metrics, conversion rates, and bounce rates. This efficiency perspective helps content teams identify which pages deserve traffic improvement efforts based on their business impact, not just their current traffic levels.