Sales team performance dashboard examples and reporting templates
Monitor individual sales rep performance and team dynamics with automated sales team performance dashboards that consolidate data from Salesforce, HubSpot, and Pipedrive. Track win rates, analyze deal progression, and identify top performers with real-time insights from your CRM platforms.
Sales team performance dashboard examples for every need


about your case. It doesn't cost you a penny 😉
What is a sales team performance dashboard?
Unlike a static report, our sales team dashboard offers dynamic filtering capabilities. This enables managers to segment performance by deal type, territory, lead source, and time periods. Through automated data integration via Coupler.io, our dashboard templates ensure managers access current information without manual data compilation, creating a centralized view of team productivity and individual contributions to revenue goals.

Choose your white label sales team performance dashboard templates to kick off
What reports should be included in sales team performance dashboards?
Effective sales team performance dashboard templates require specific reports that provide comprehensive visibility into both individual and collective team performance. Based on analysis of successful Salesforce, HubSpot, and Pipedrive implementations, we recommend incorporating these four critical report types that enable managers to make data-driven decisions about coaching, territory assignment, and process optimization.
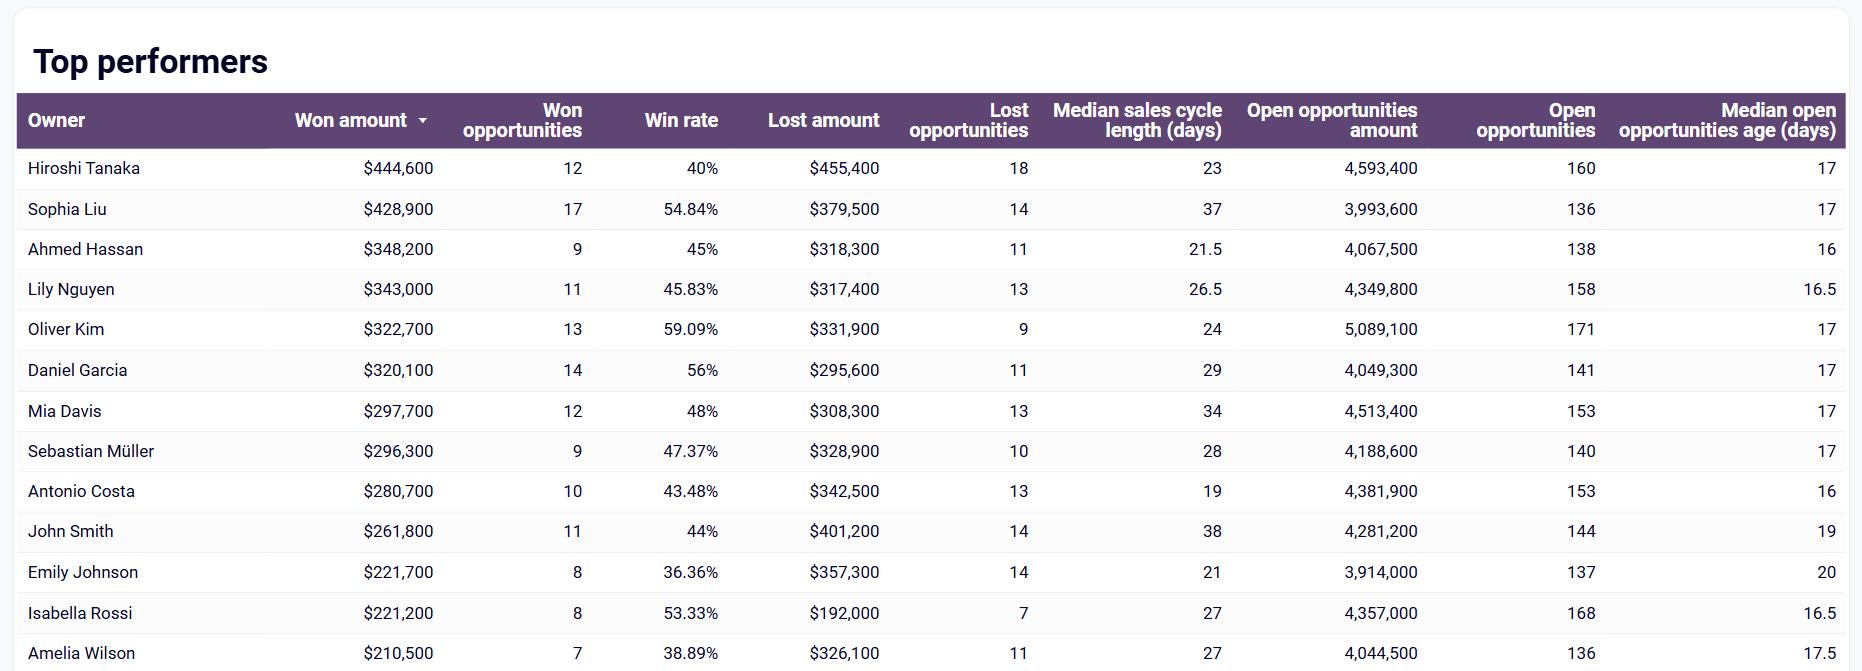
Sales team performance dashboards must include detailed individual metrics that compare each representative's performance across key indicators. This report displays win rates, average deal values, closure times, and pipeline velocity for every team member. The analysis helps identify coaching opportunities and recognize high performers who can mentor struggling colleagues. By tracking individual trends over time, managers can spot performance changes early and provide targeted support where needed.
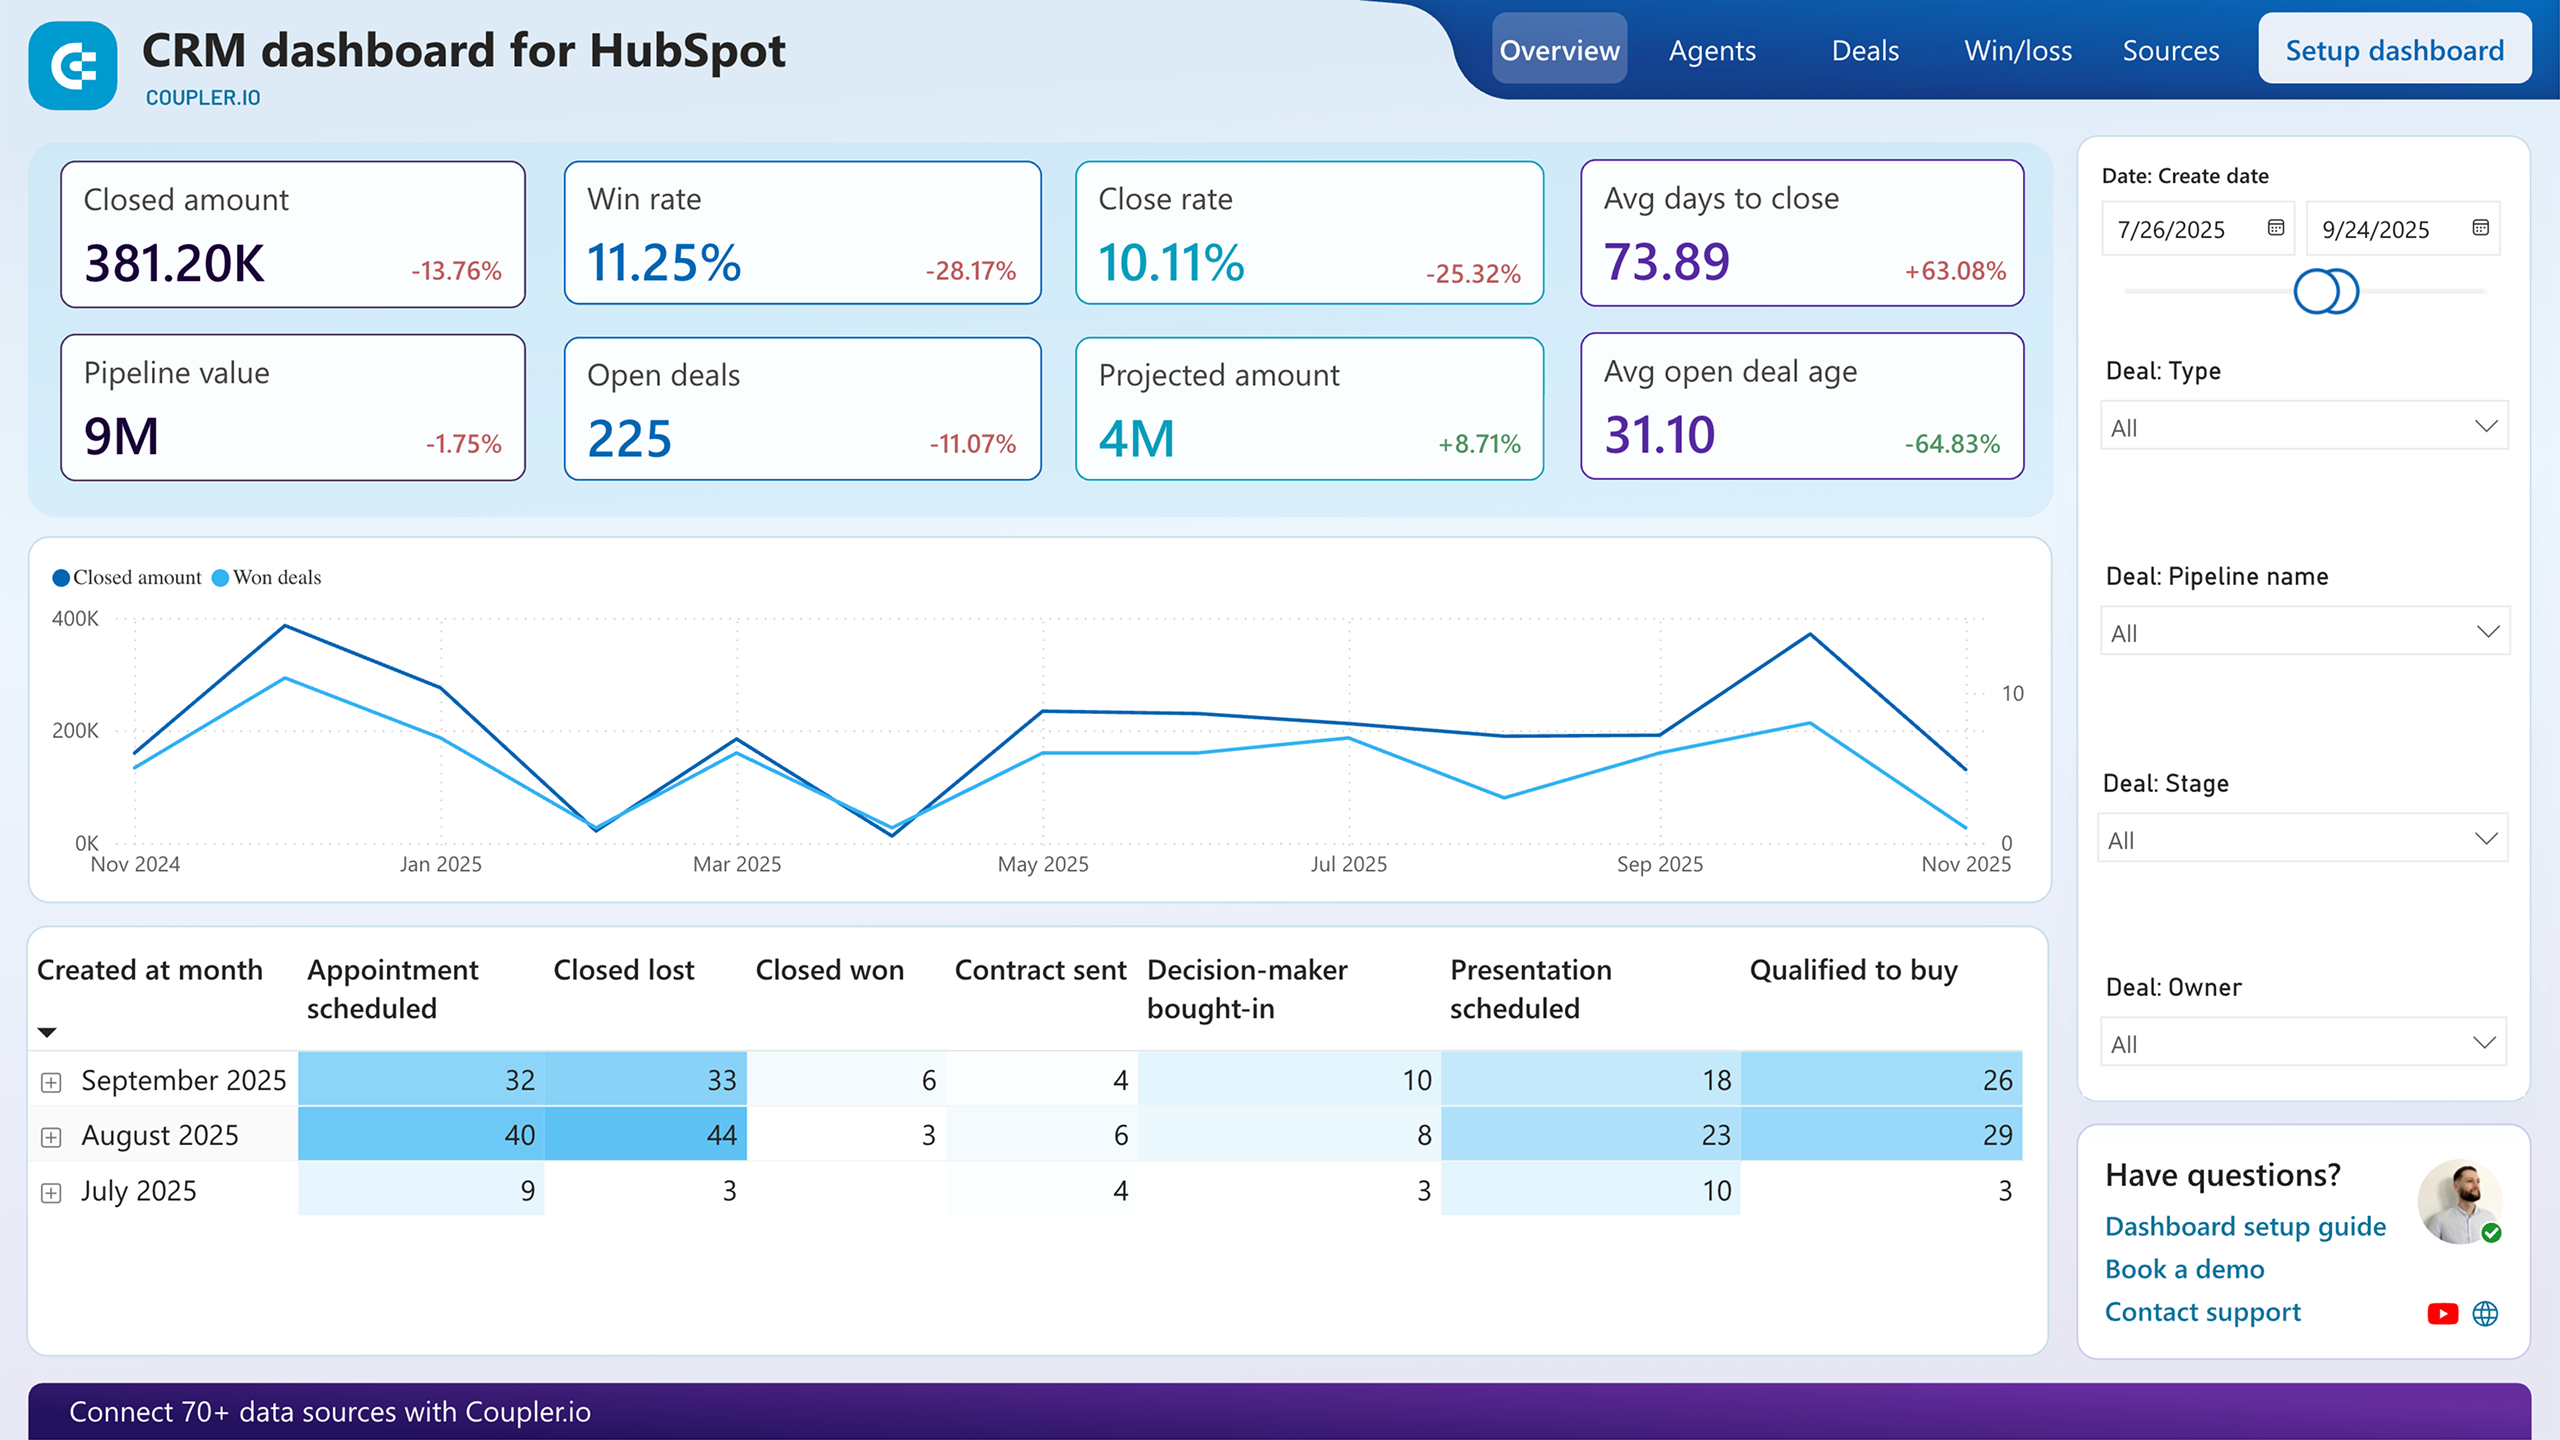
Pipeline analysis reveals how effectively each sales representative moves prospects through different sales stages. This report shows the distribution of deals across pipeline phases for individual reps, highlighting where bottlenecks occur and which team members excel at specific stages. Understanding pipeline performance by team member enables managers to redistribute leads strategically and provide stage-specific training to improve overall conversion rates.
Comparative performance reporting allows managers to benchmark individual representatives against team averages and top performers. This analysis includes revenue rankings, deal count comparisons, and conversion rate variations across the sales team. The report identifies performance gaps and successful strategies that can be replicated across the team, fostering a culture of continuous improvement and knowledge sharing.
Understanding why deals are lost provides valuable insights for team improvement and individual development. This report categorizes lost opportunities by reason, sales representative, and deal characteristics, revealing patterns that indicate training needs or process improvements. By analyzing lost deal trends, managers can address systemic issues and help representatives avoid common pitfalls that impact their success rates.
What insights you can get with the sales team performance dashboard
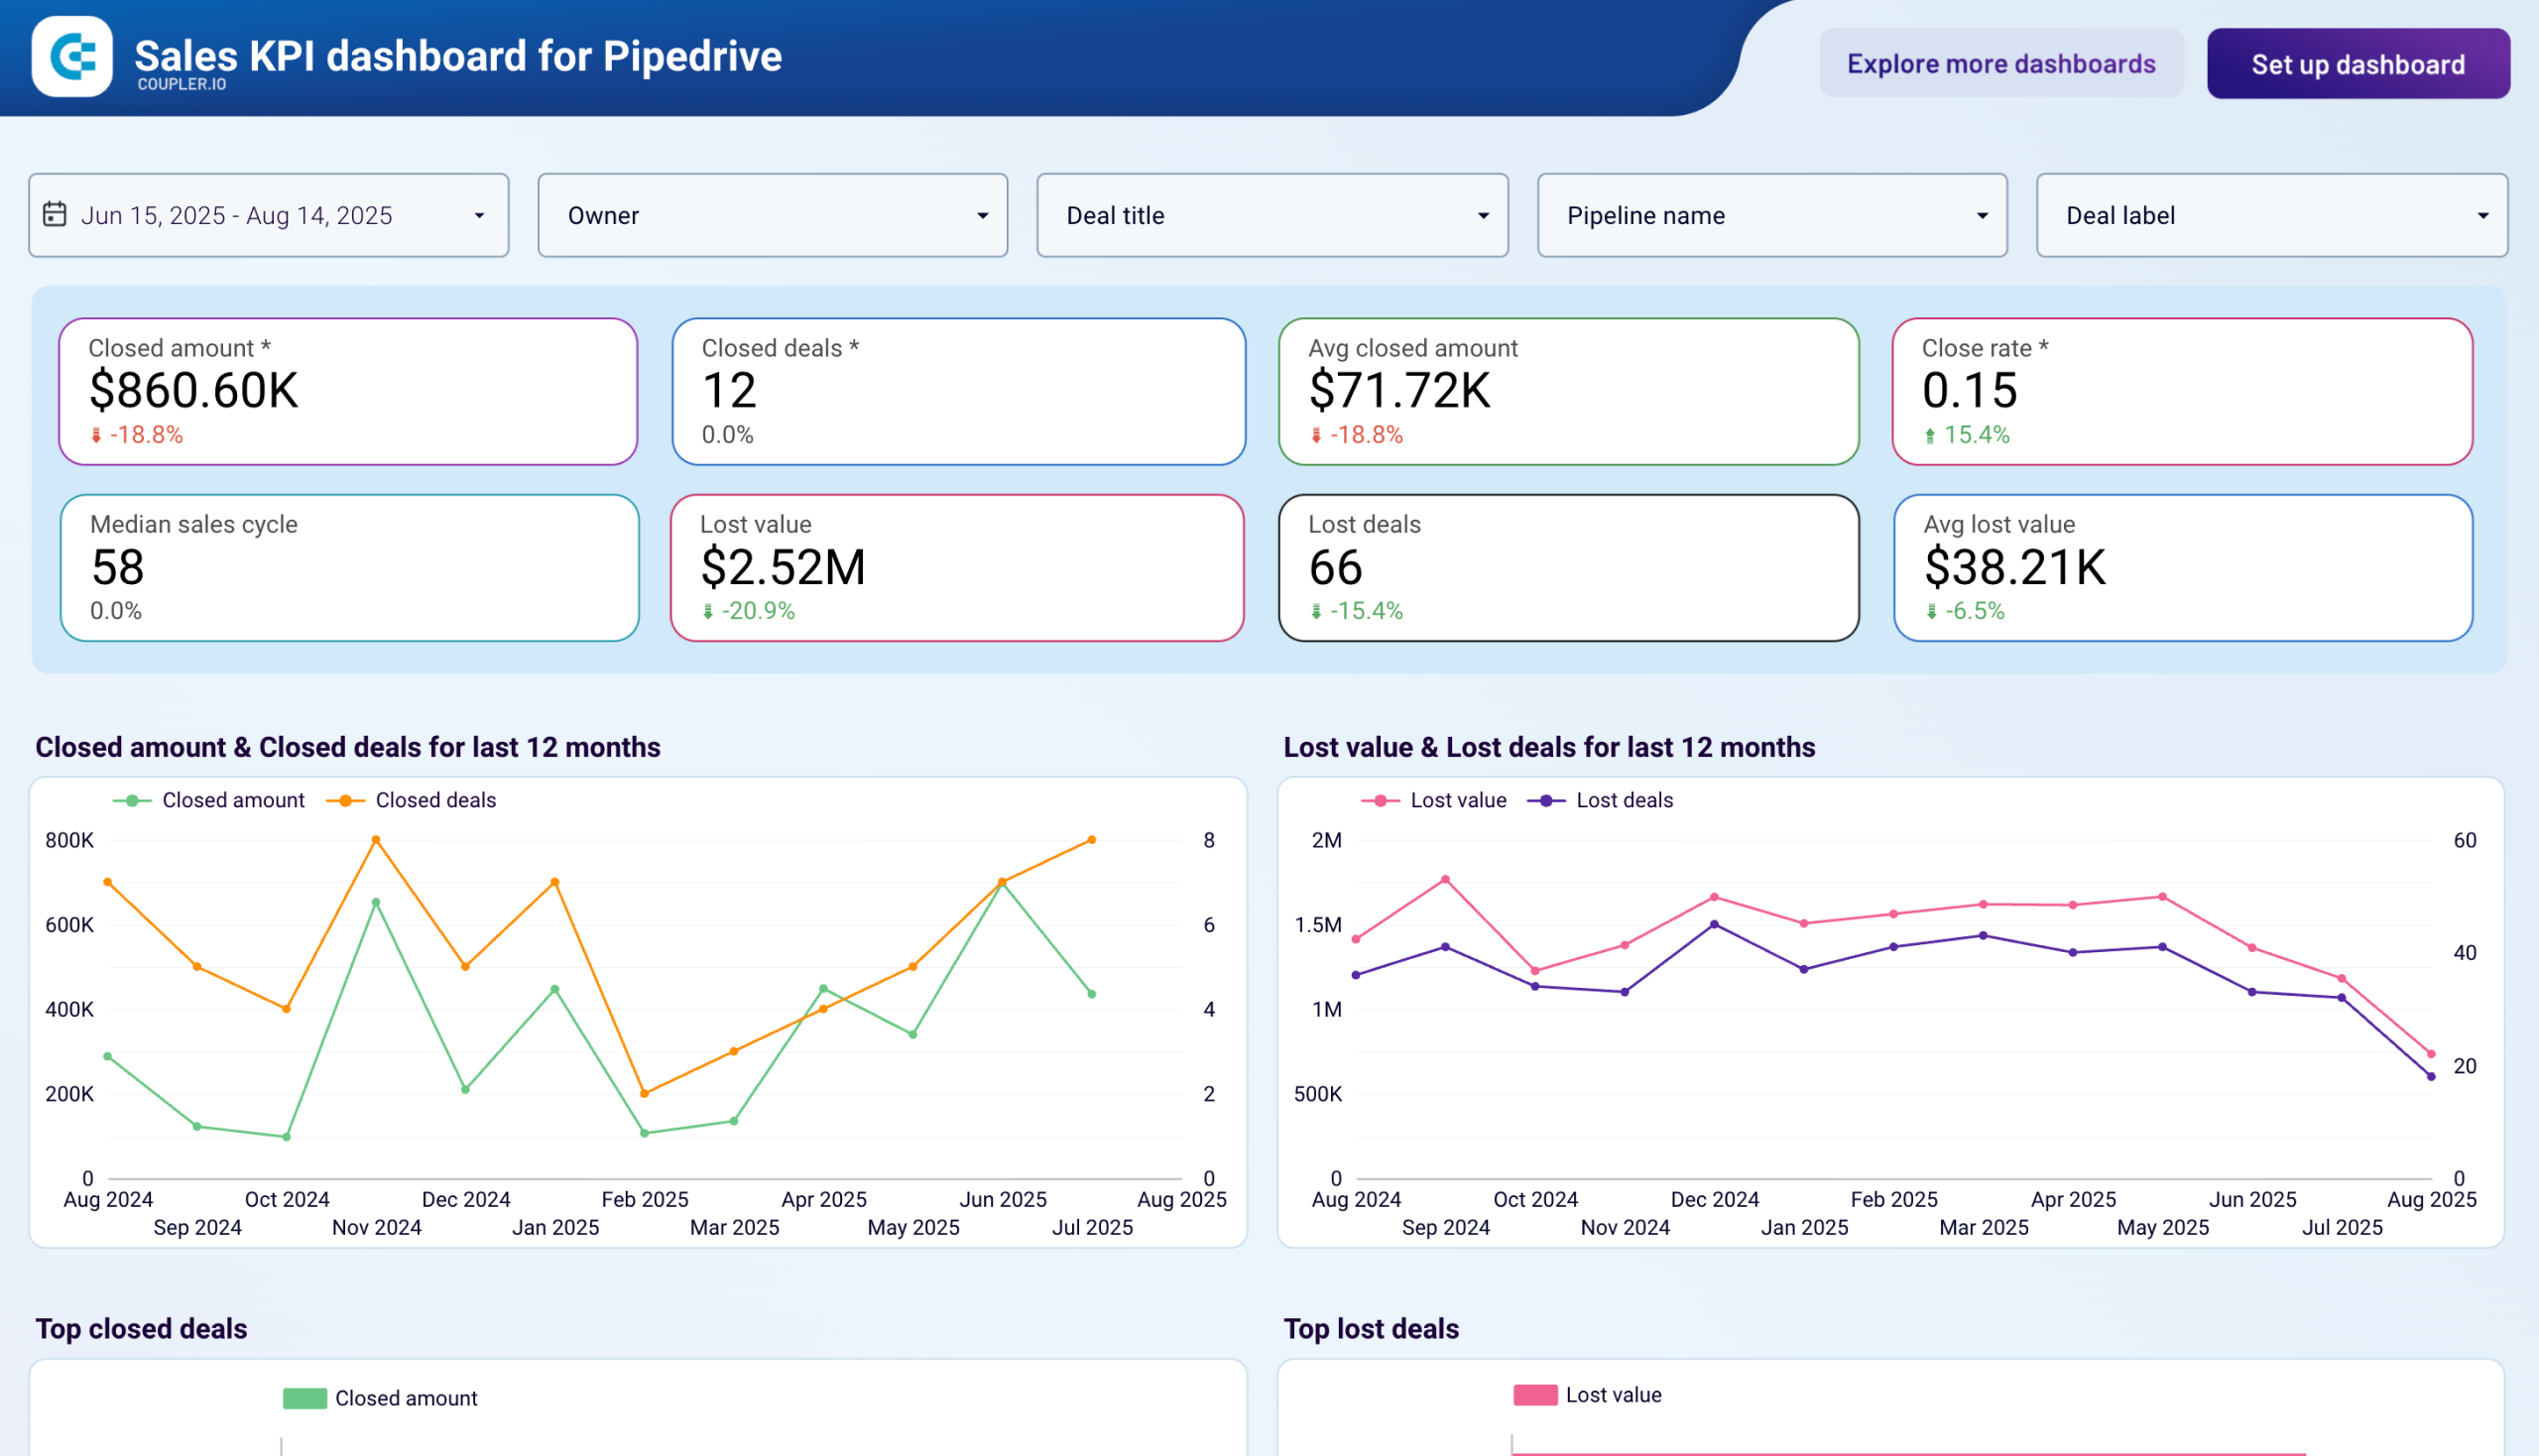
Assess performance trends across different team members and deal types to identify best practices that drive success. Compare win rates, average deal sizes, and closure times between representatives to understand which approaches generate the strongest results. This analysis helps managers recognize top performers and replicate their strategies across the team for improved overall performance.
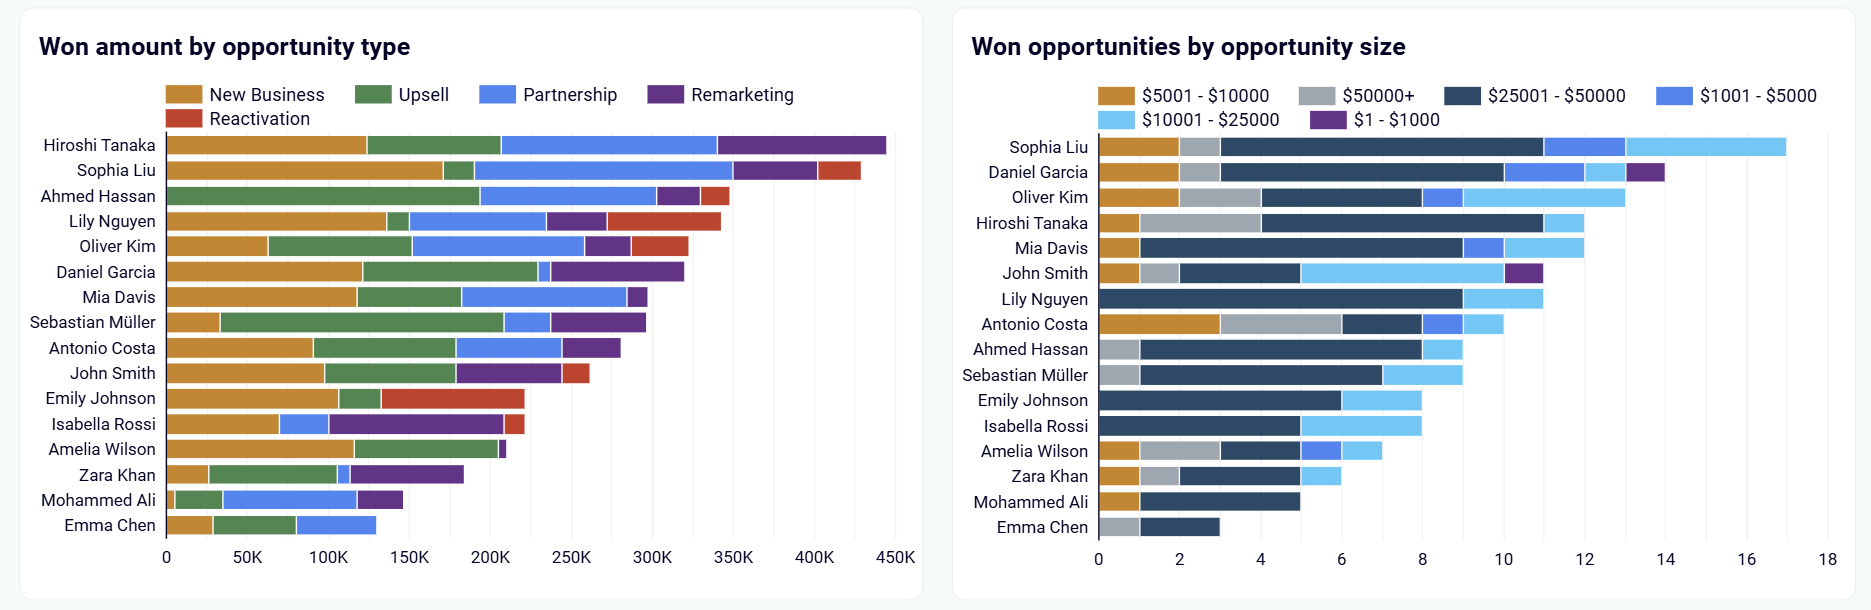
Analyze won opportunities by deal type and size to understand each team member's specialization and strengths. Compare revenue distribution across opportunity types to identify which representatives excel at specific deal categories. This insight reveals individual expertise areas and helps managers assign opportunities strategically based on proven success patterns.
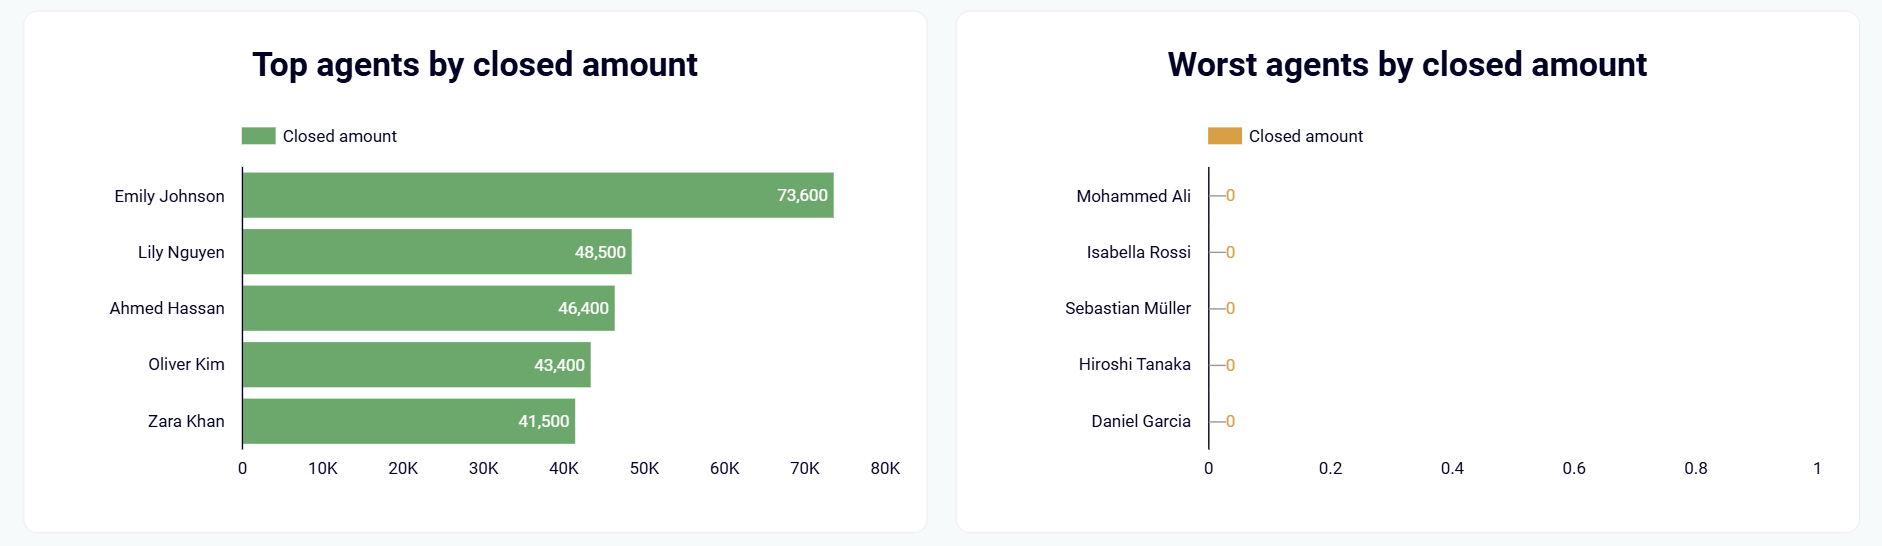
Identify your highest and lowest revenue generators through side-by-side comparison of closed deal amounts across all team members. This visualization immediately highlights performance gaps and helps managers focus attention on representatives who need additional support while recognizing top achievers for their contributions to team success.
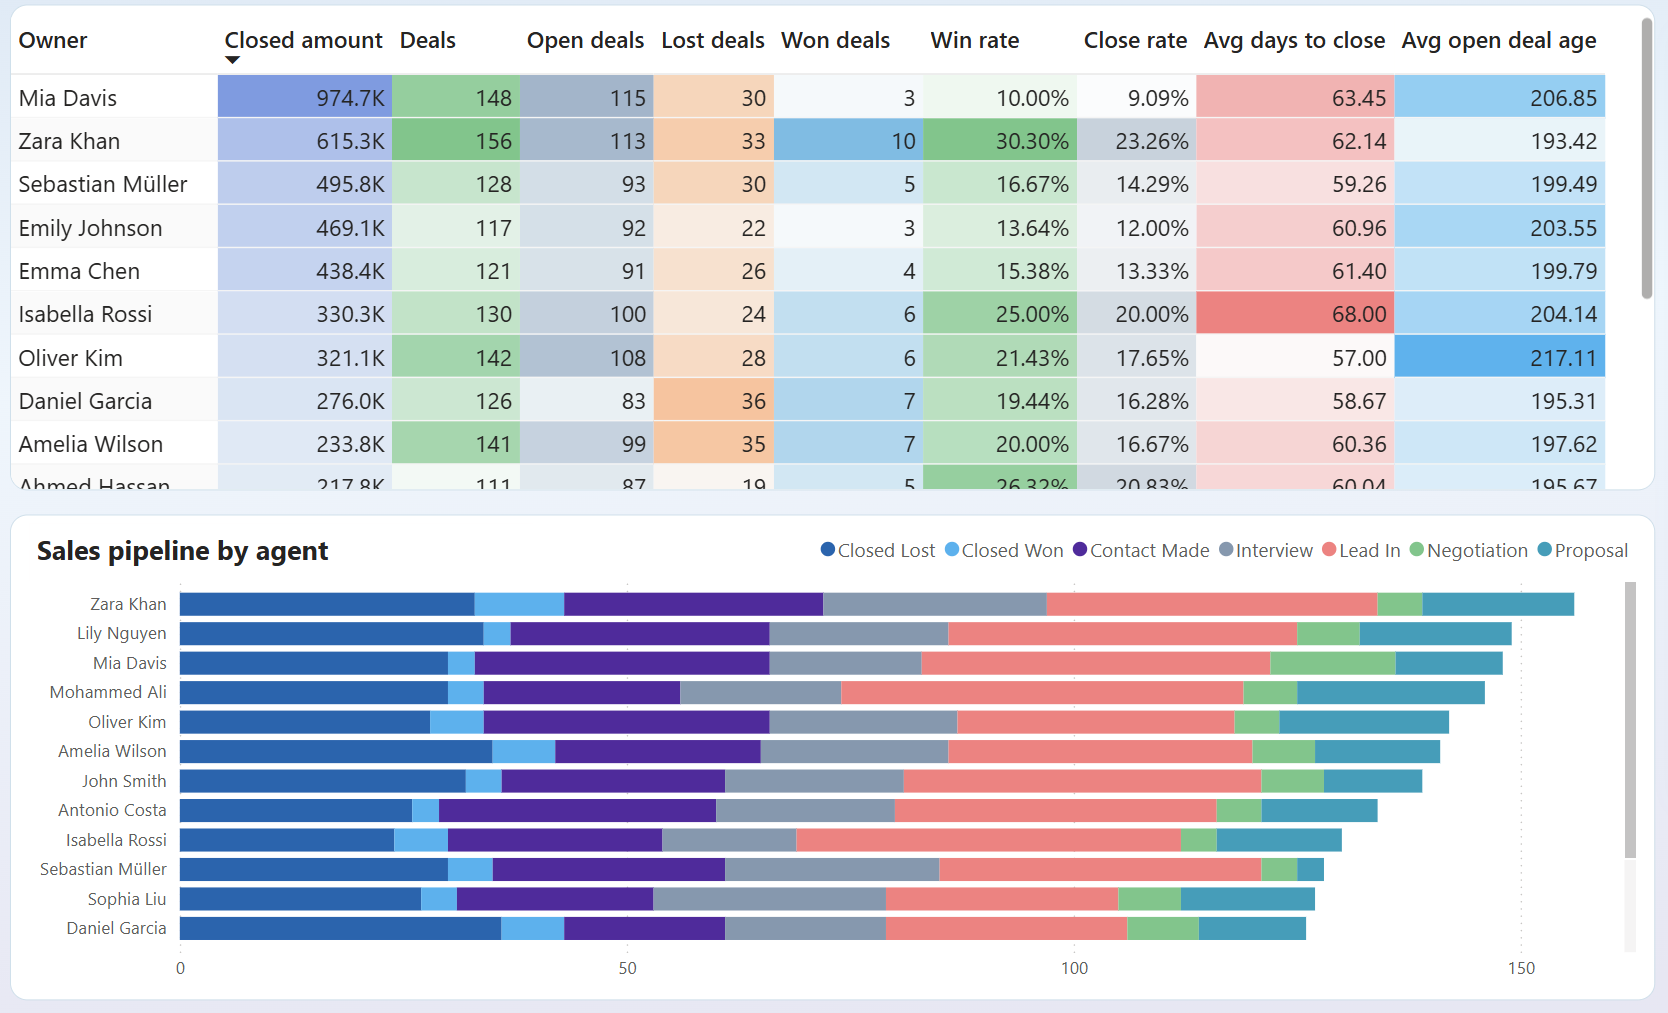
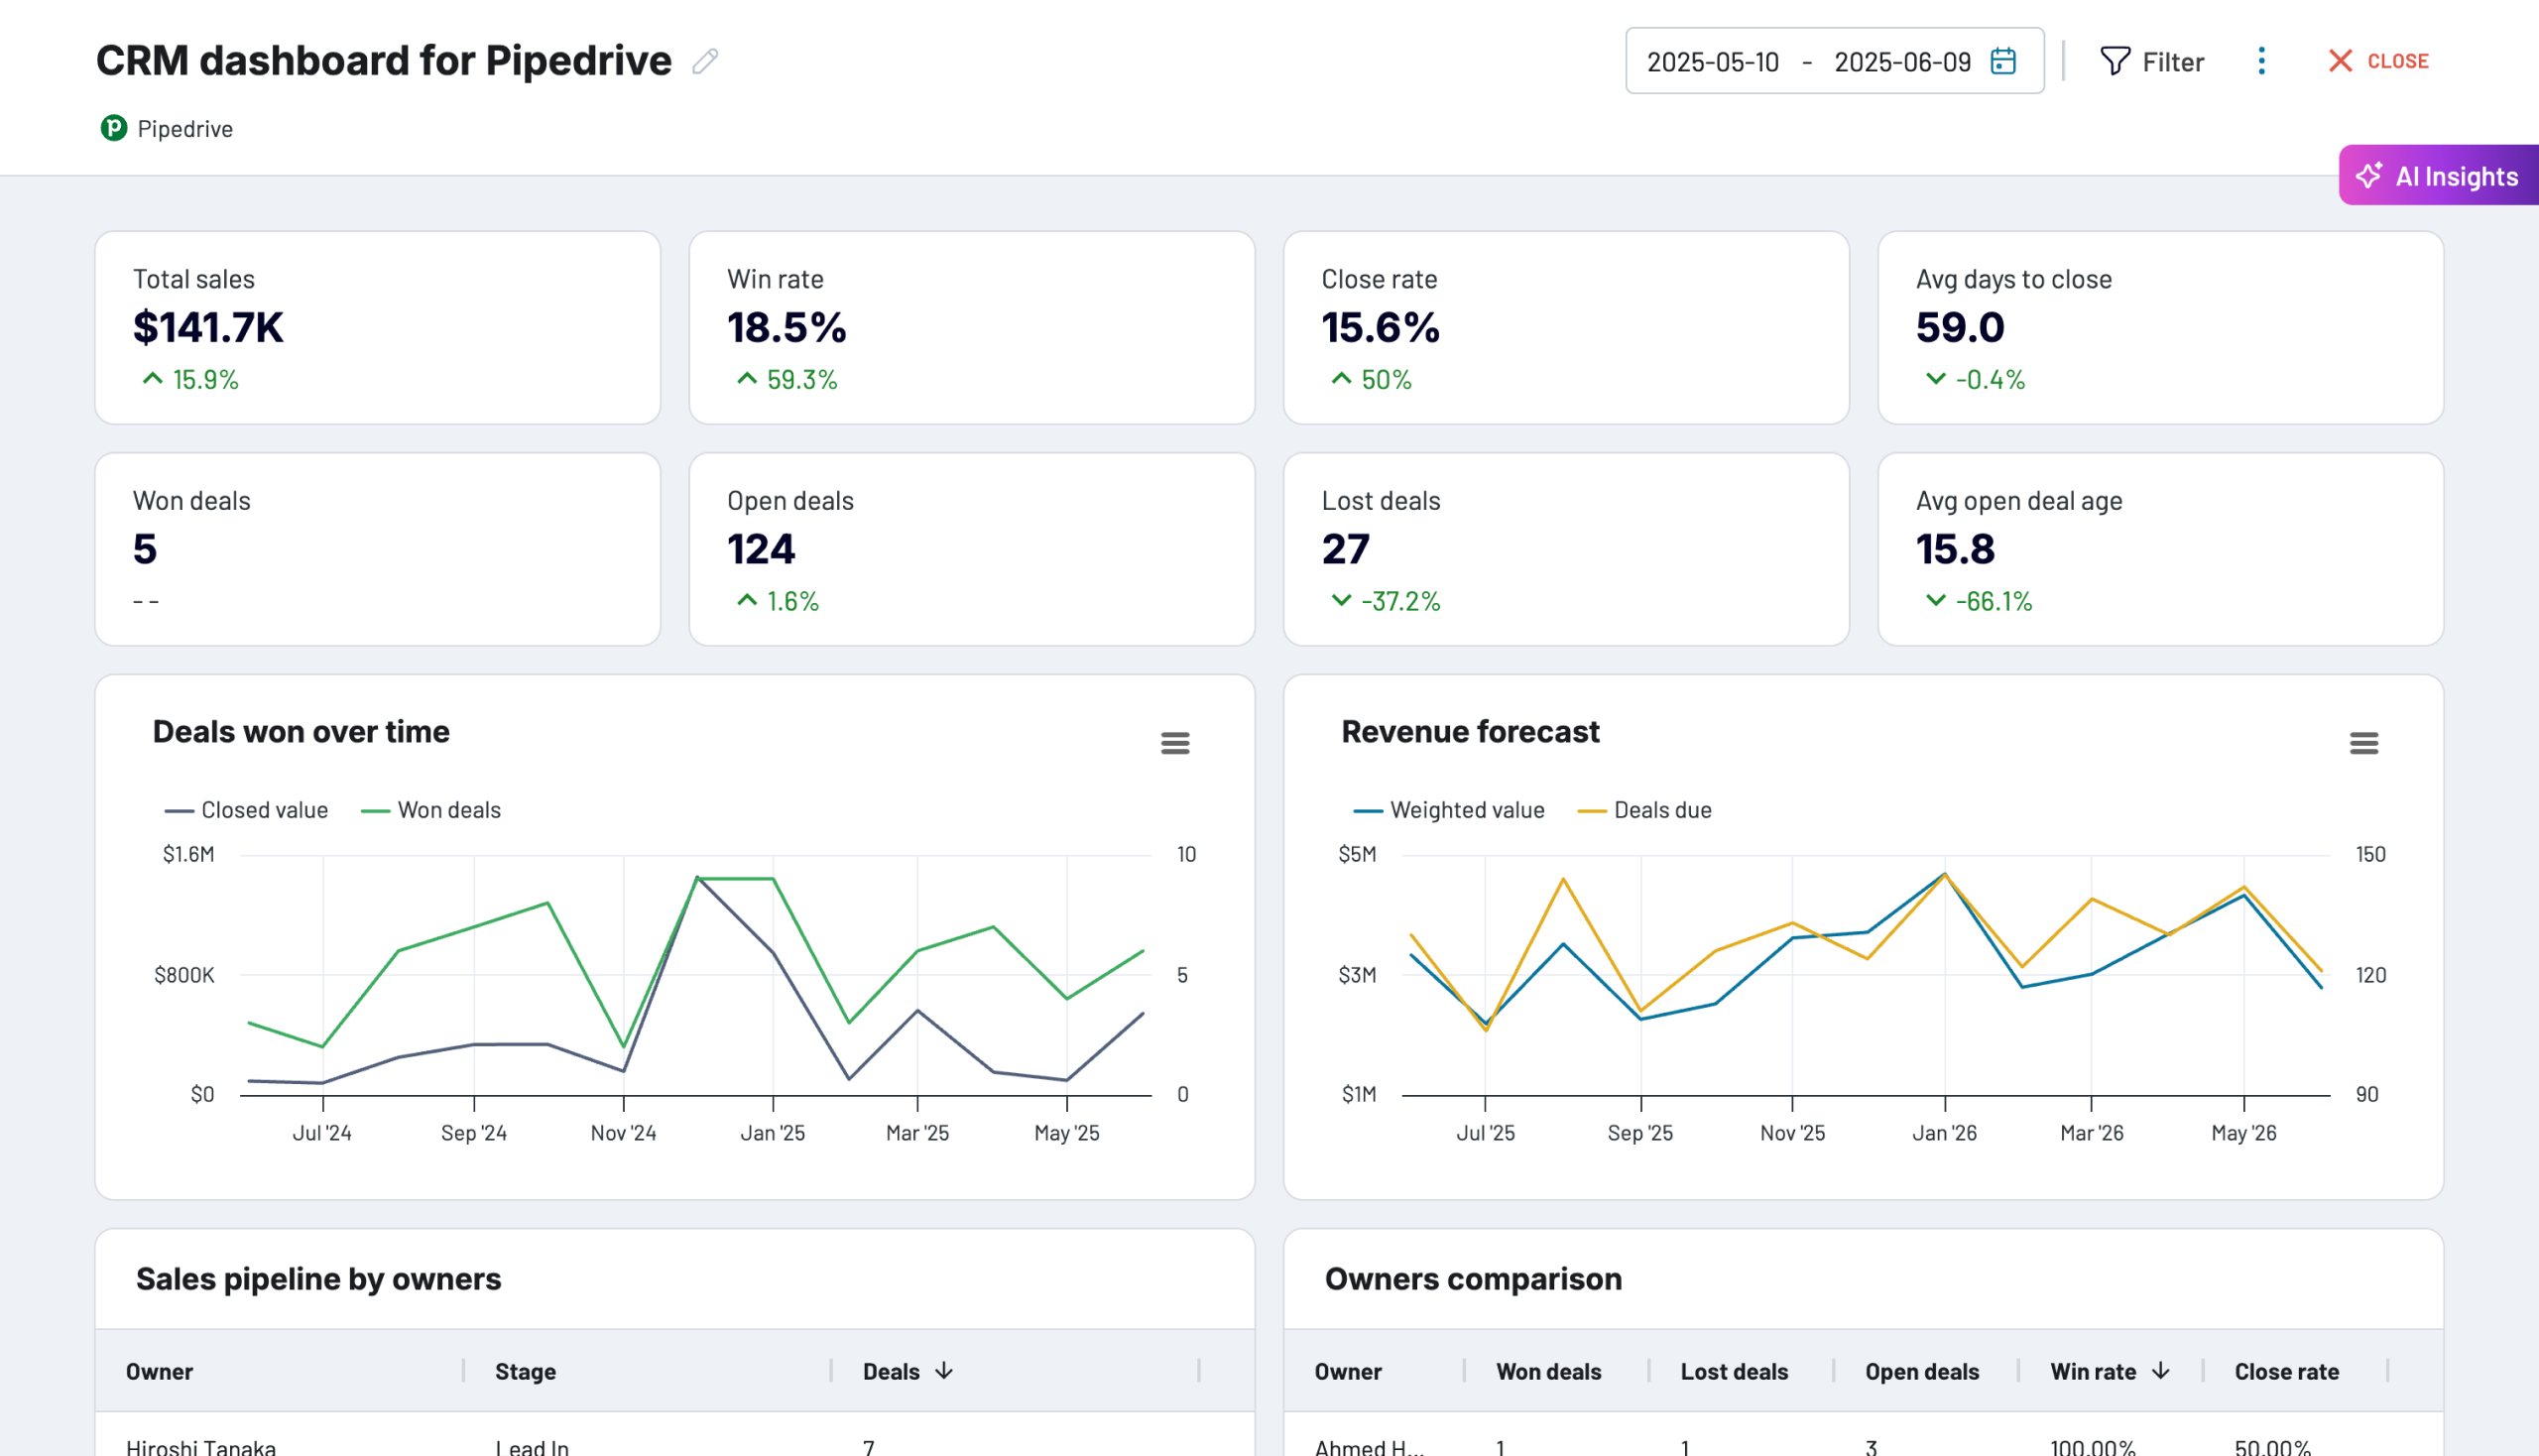
Monitor how individual representatives manage their deal pipelines across different sales stages from lead-in to closed opportunities. This comprehensive view shows each team member's pipeline health, win rate, and stage-specific conversion rates, enabling managers to provide targeted guidance for improved pipeline management and faster deal closure.
How to create a sales team performance dashboard?

Metrics you can track with a sales team performance dashboard template
More Sales team performance Dashboards
Request custom dashboard
From building custom dashboards to setting up data analytics from scratch, we're here to help you succeed. Contact us to discuss your case and possible solutions
Contact us