PPC dashboard examples and reporting templates
Optimize your advertising performance with automated PPC reporting dashboards that consolidate data from Google Ads, Meta Ads, LinkedIn, and other platforms. Track campaign metrics, monitor keyword performance, analyze creative effectiveness, and make strategic decisions based on real-time insights from your advertising accounts.
PPC dashboard examples for every need


 +3
+3


 +3
+3
 +1
+1
 +4
+4
 +4
+4

 +2
+2

 +2
+2


 +3
+3

 +1
+1
 +3
+3

 +2
+2


 +6
+6

 +5
+5
 +6
+6

 +5
+5
 +4
+4
 +5
+5
 +5
+5


 +1
+1
 +3
+3
 +3
+3


 +1
+1

 +1
+1

 +2
+2
 +3
+3

 +4
+4
about your case. It doesn't cost you a penny 😉
What is a PPC dashboard?
Modern PPC dashboards go beyond platform-specific interfaces and allow you to track cross-channel performance, monitor keyword effectiveness, analyze creative impact, and identify budget optimization opportunities. With automated data refreshing through Coupler.io, these ppc dashboard templates ensure you're always working with the most up-to-date information without manual data exports or consolidation. They create a single source of truth for your advertising performance across multiple platforms.

Choose your PPC dashboard template to kick off
What reports should be included on a meaningful PPC dashboard?
A comprehensive PPC dashboard should include several key reports that provide complete visibility into your advertising performance. Based on our analysis of multi-platform advertising campaigns, we recommend incorporating these four essential report types:
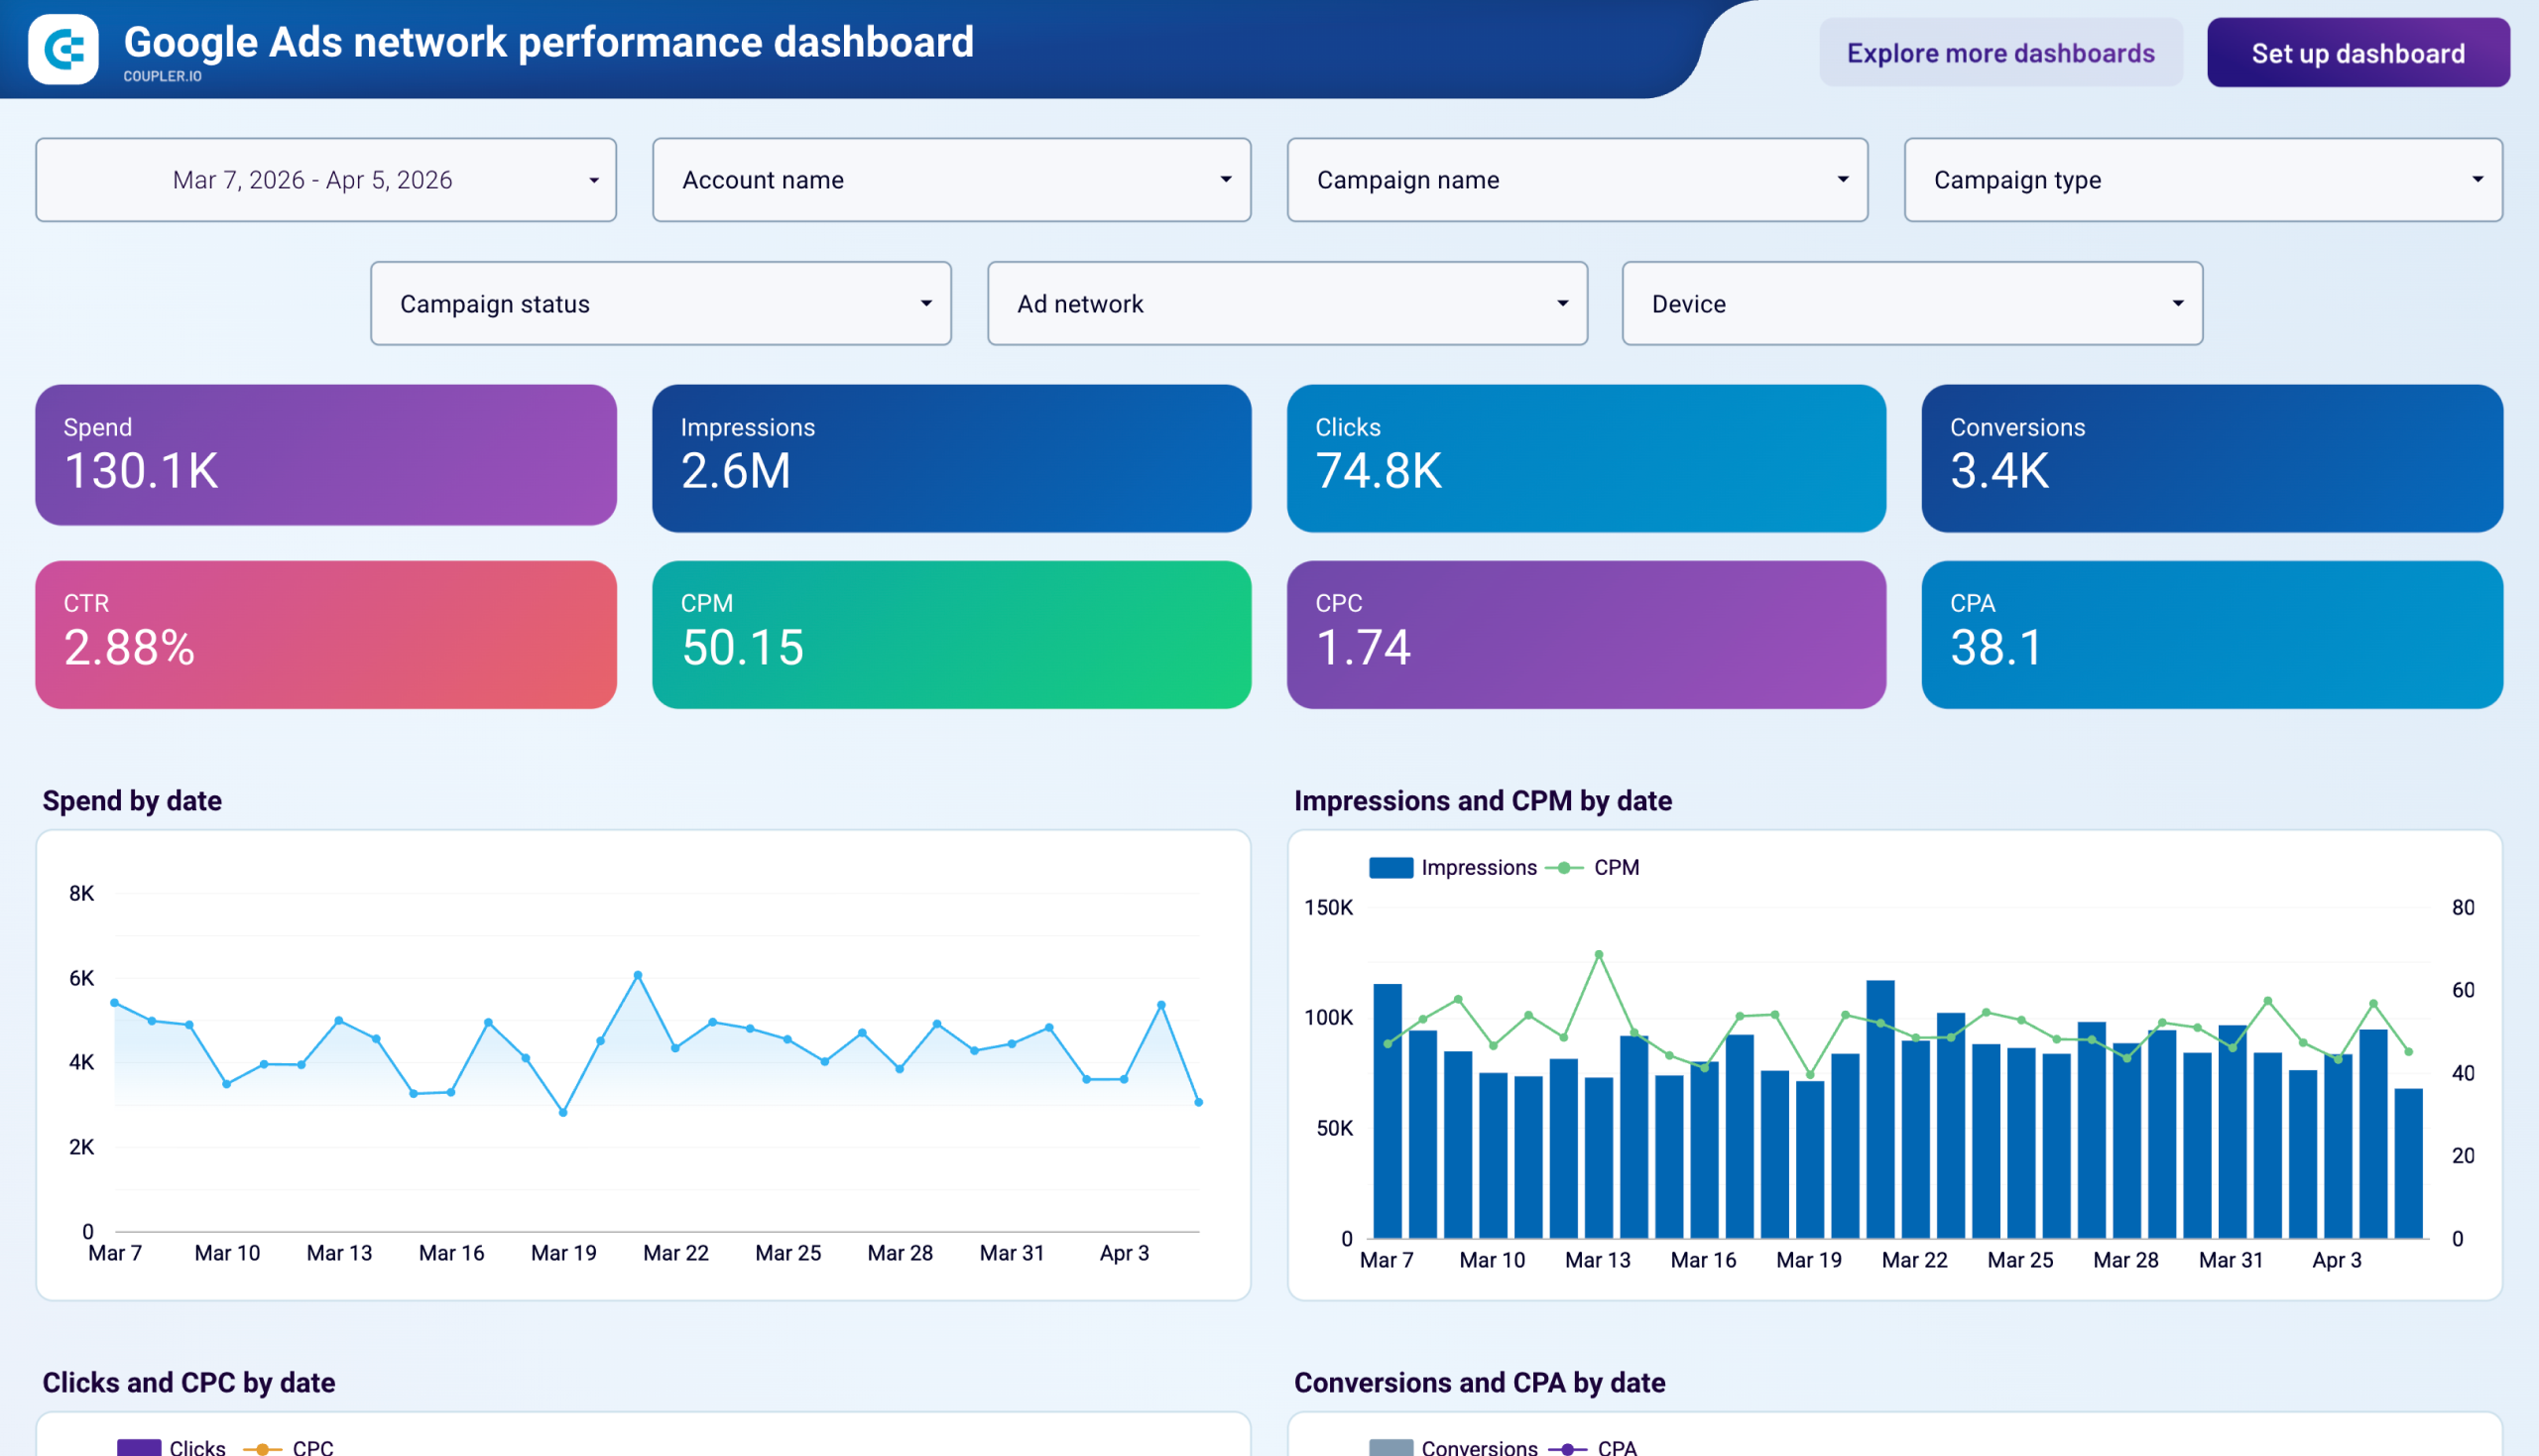
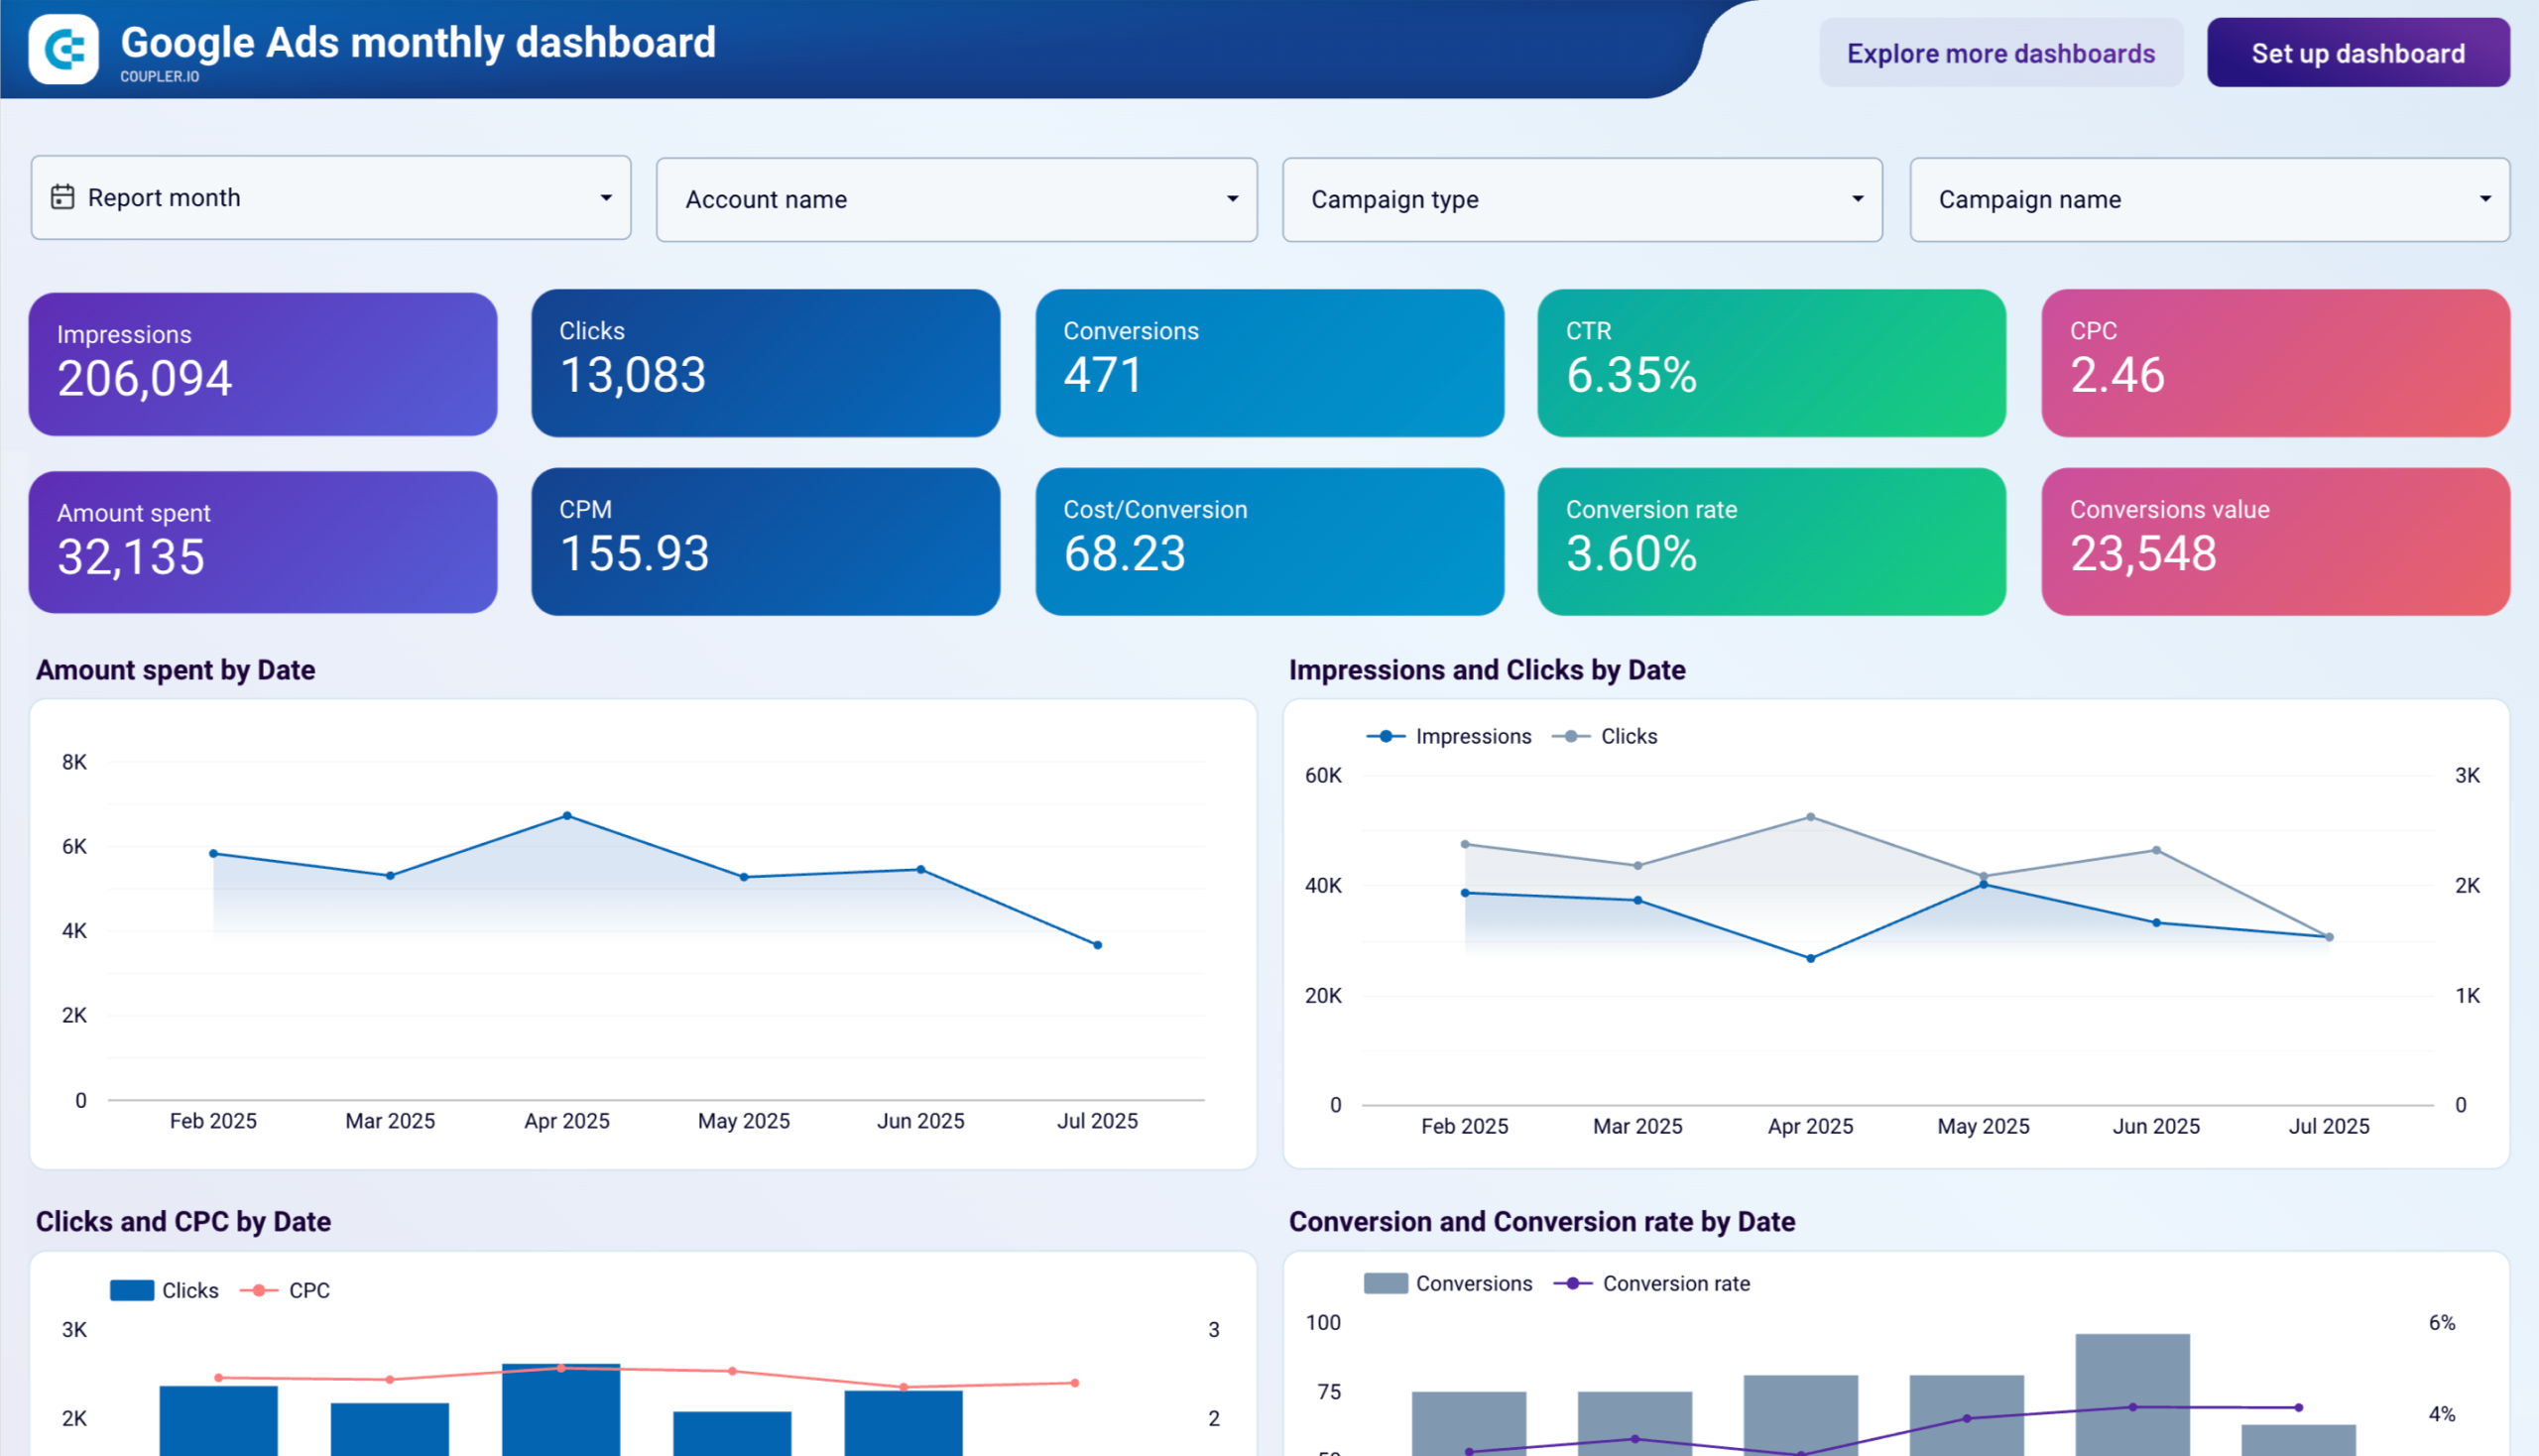
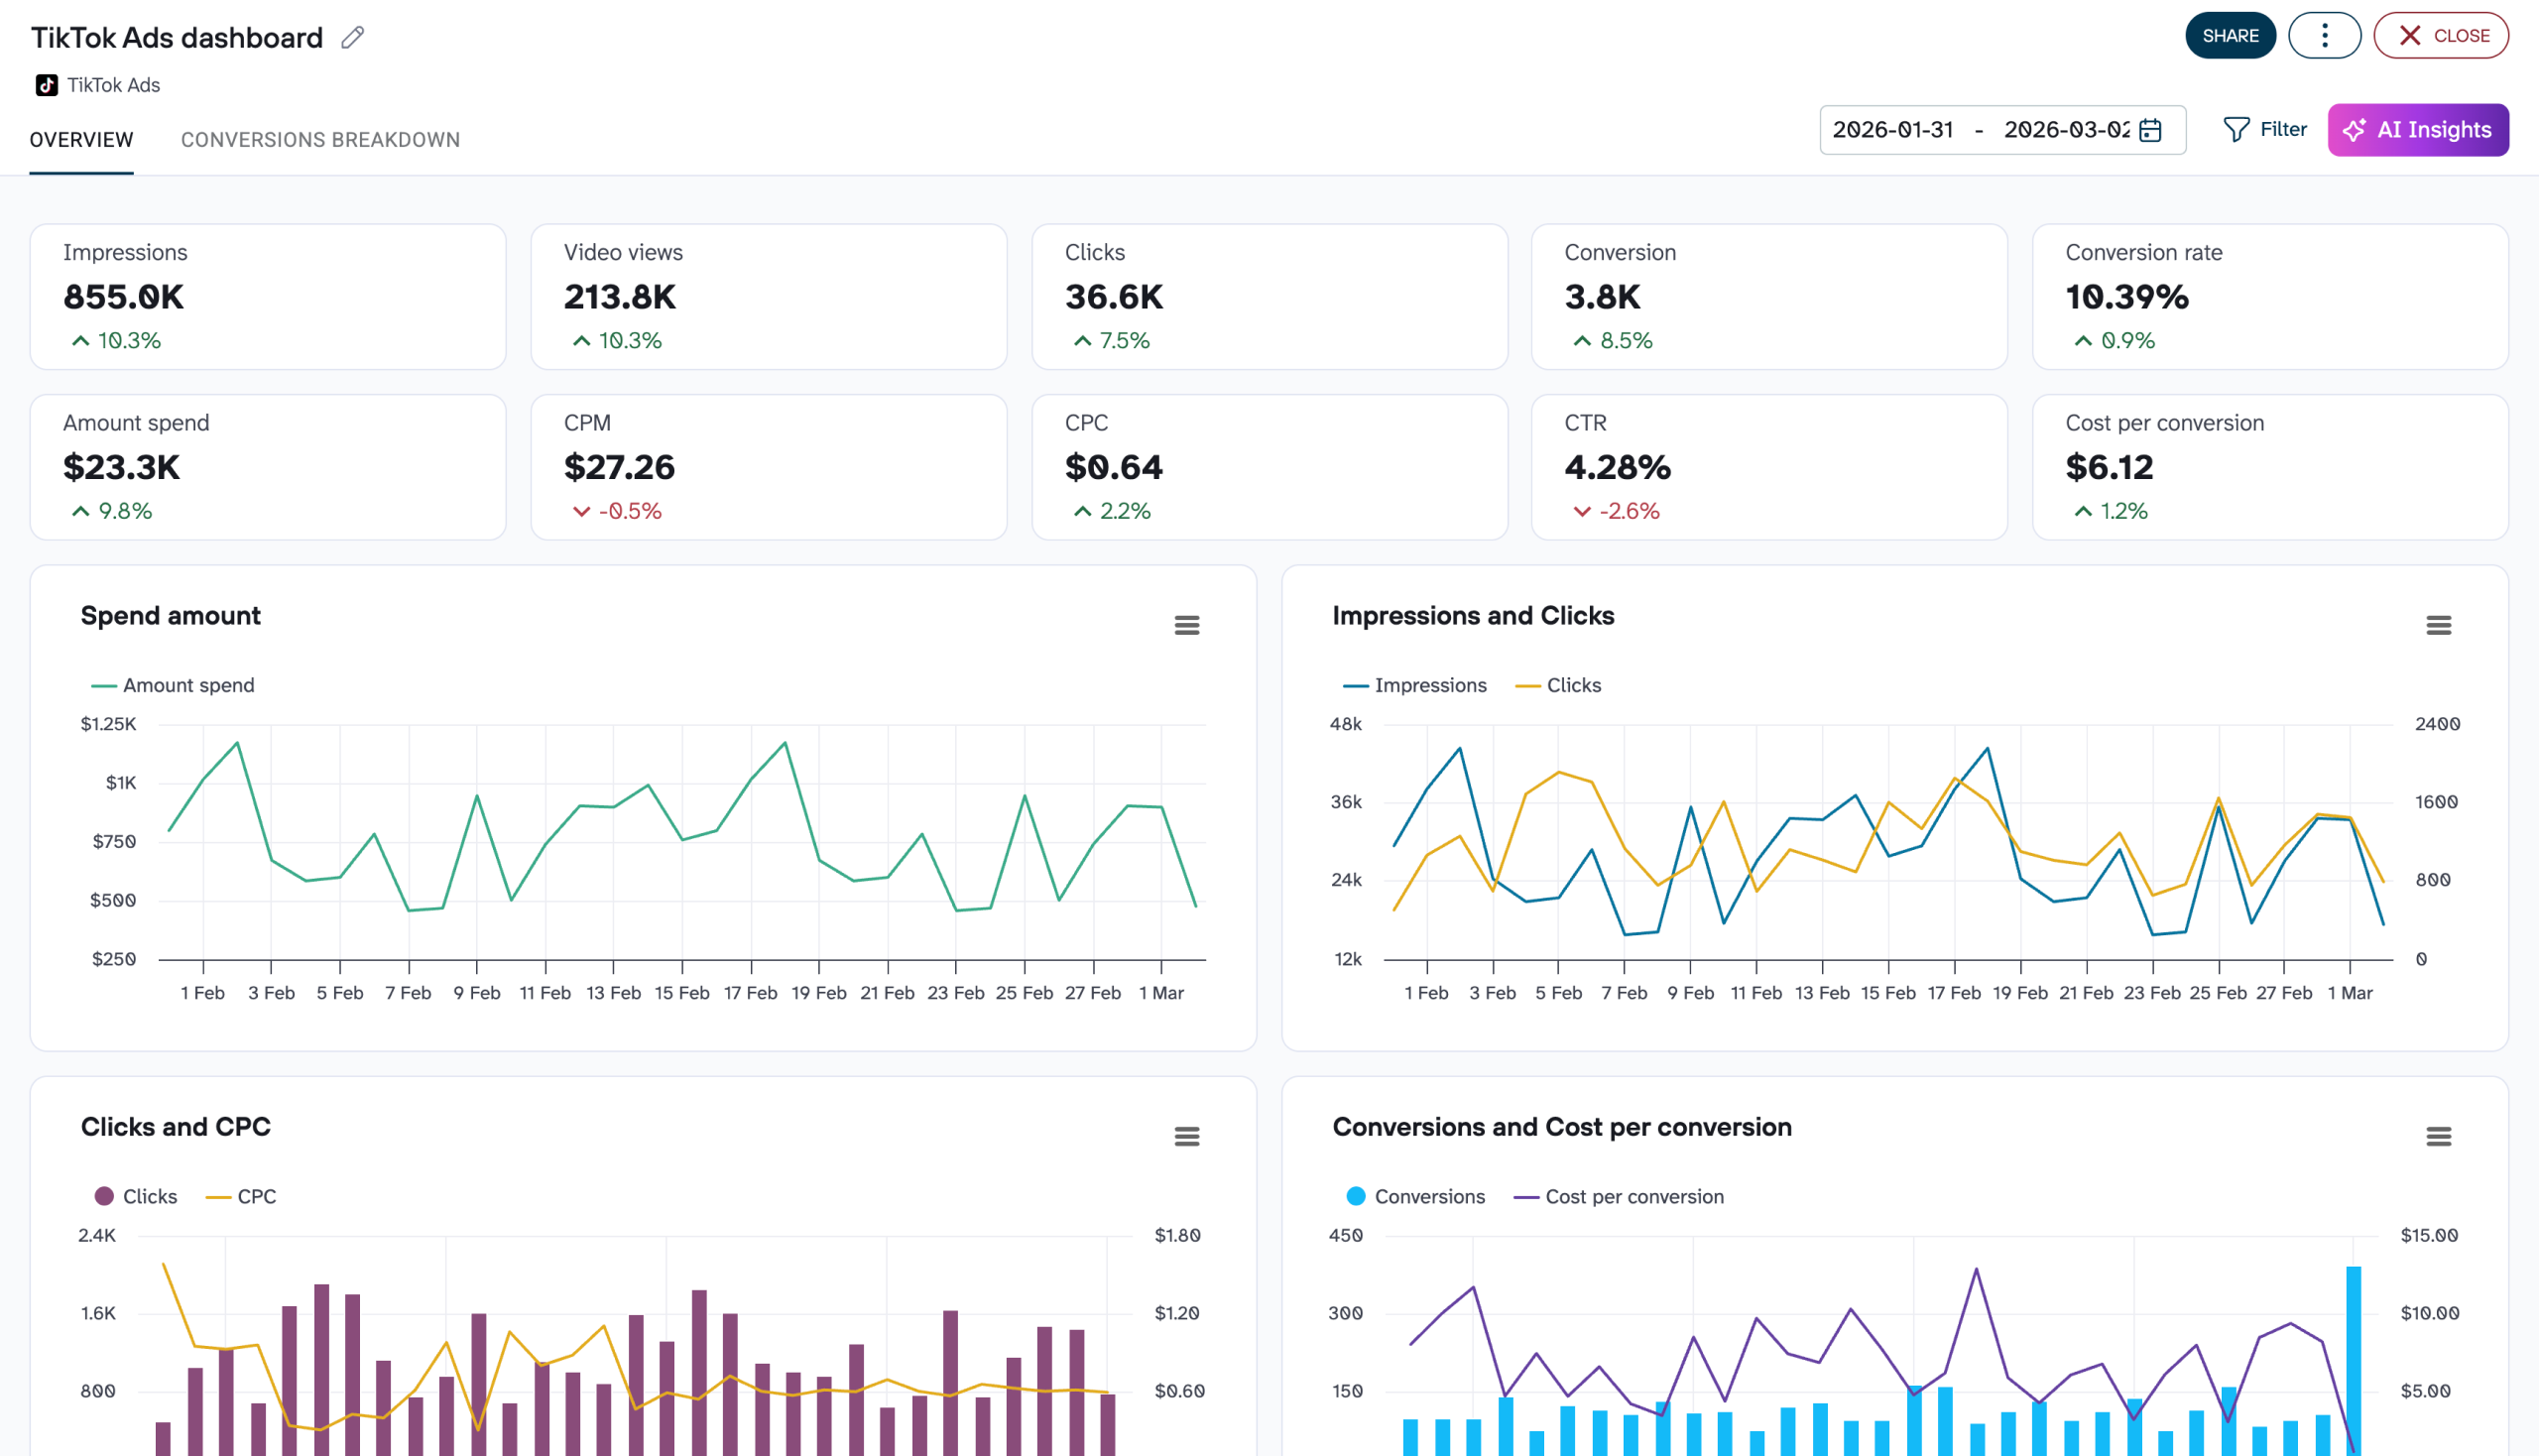
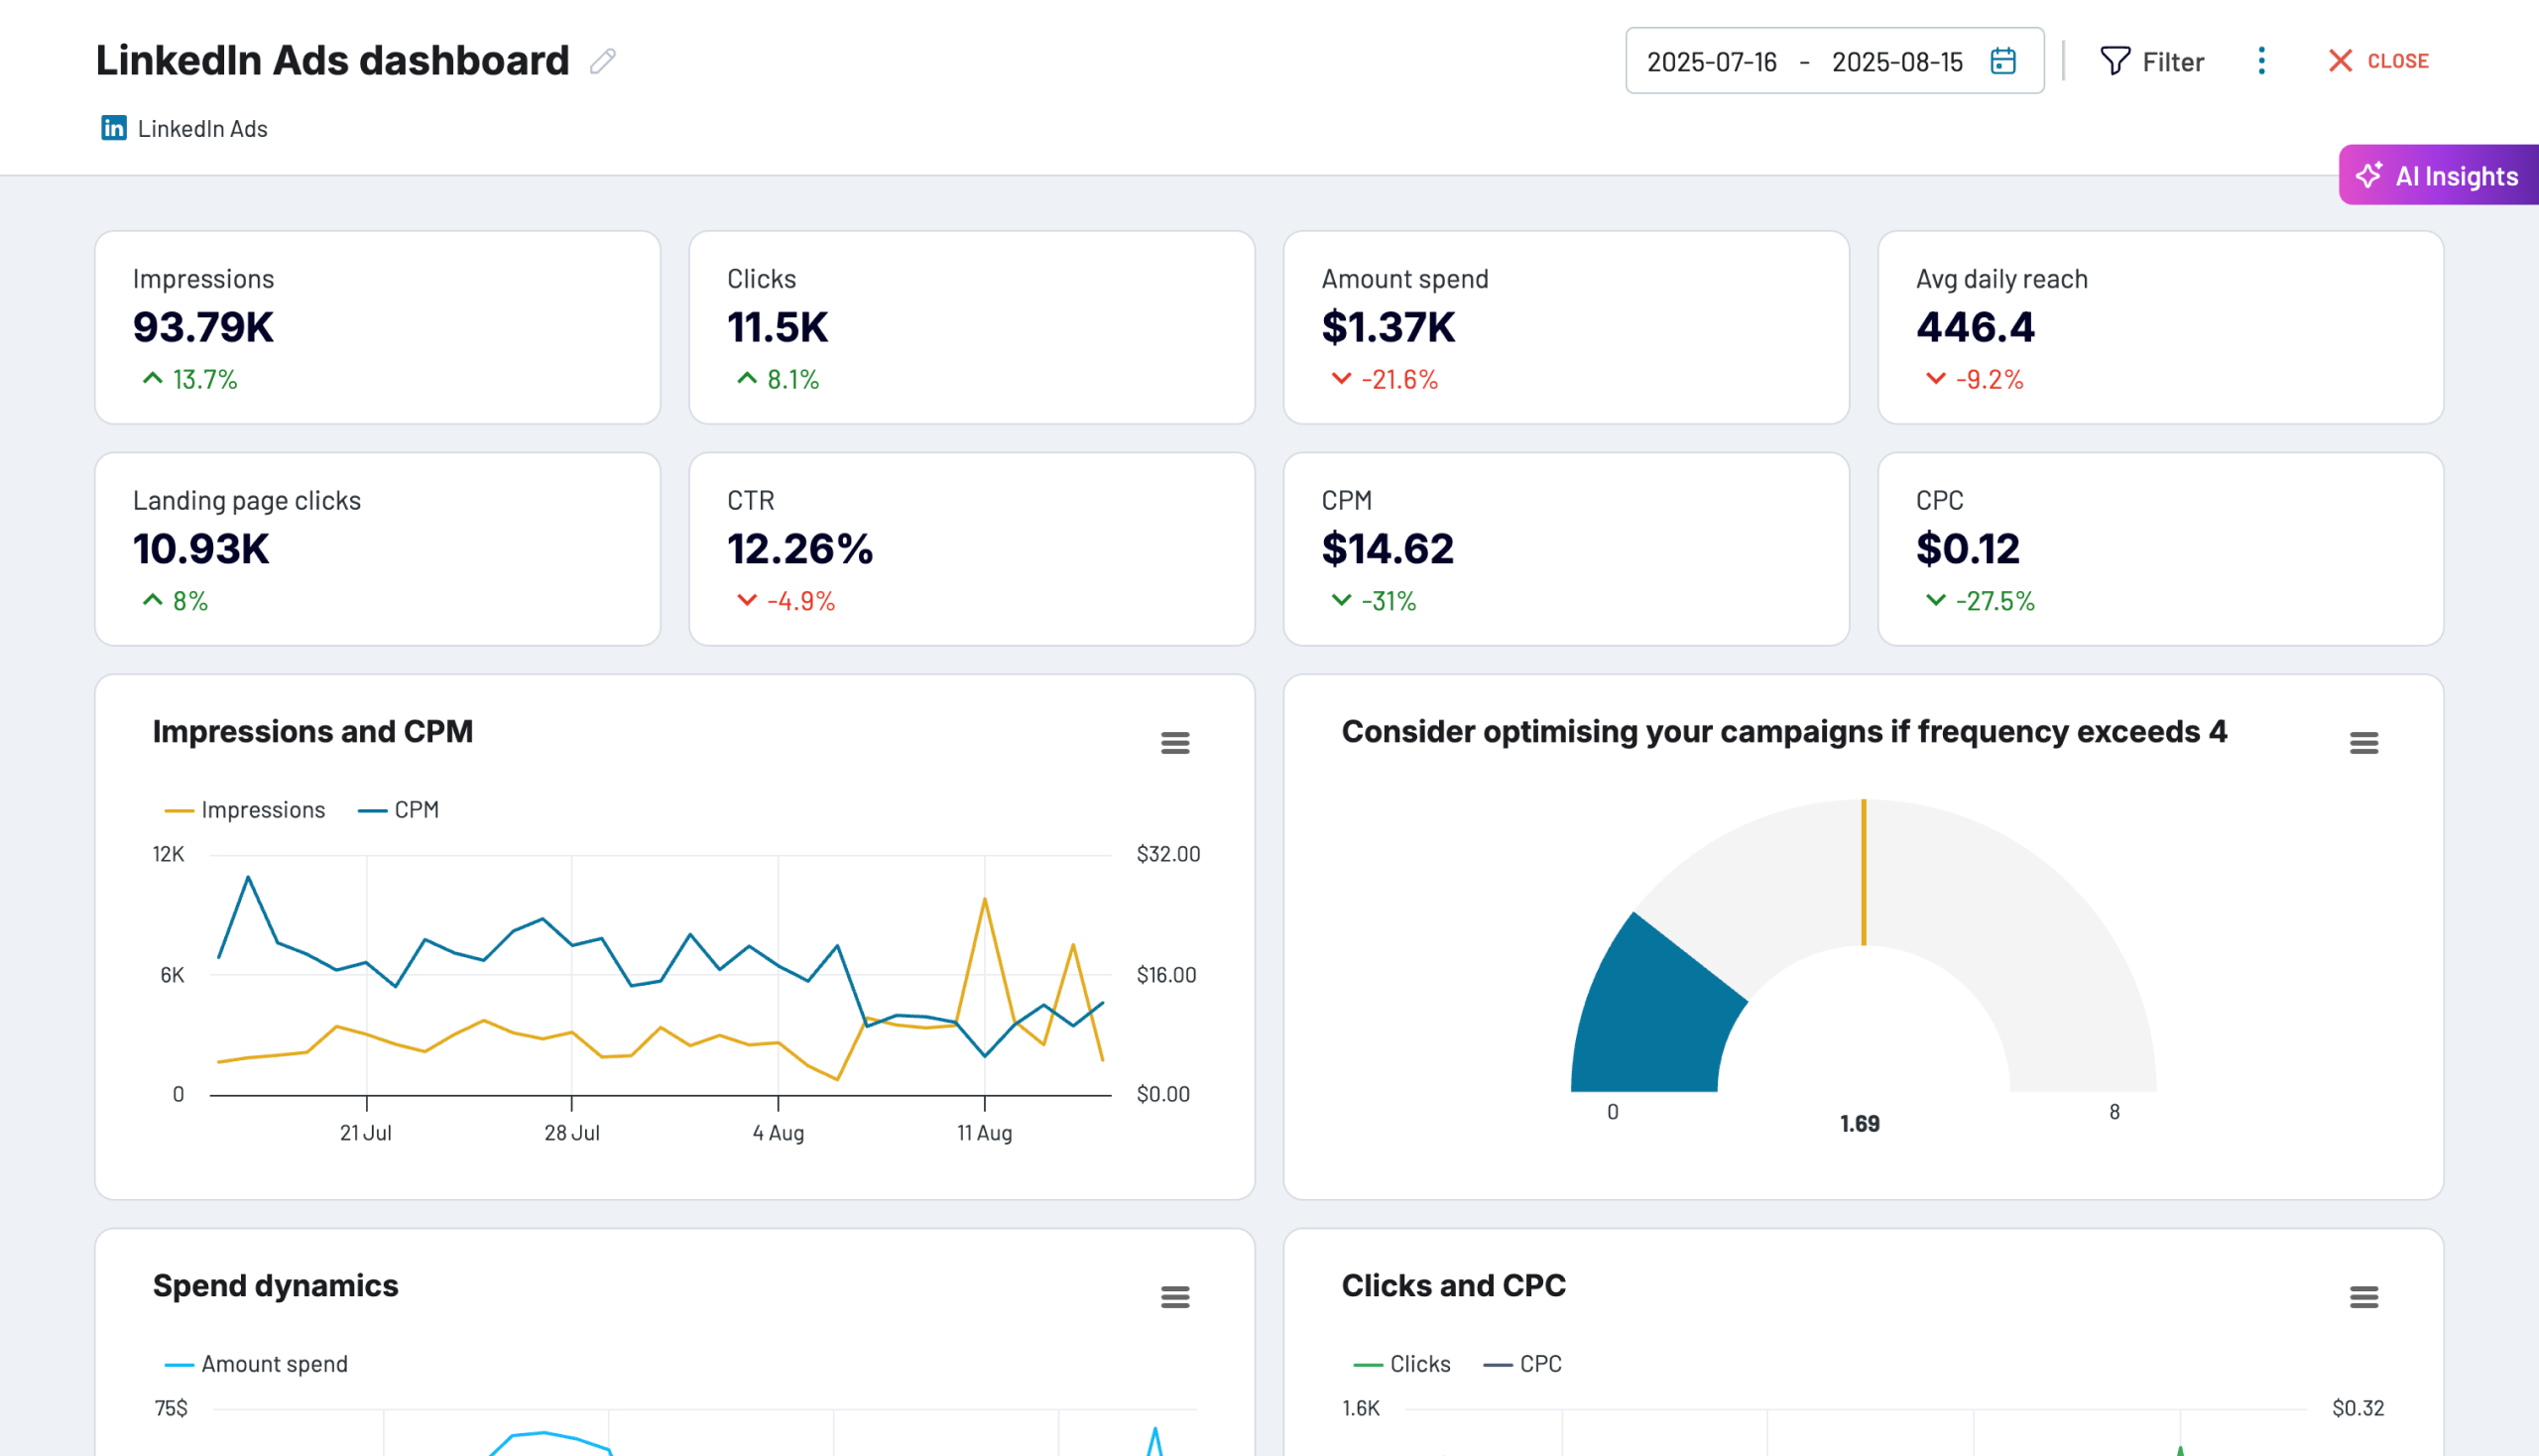
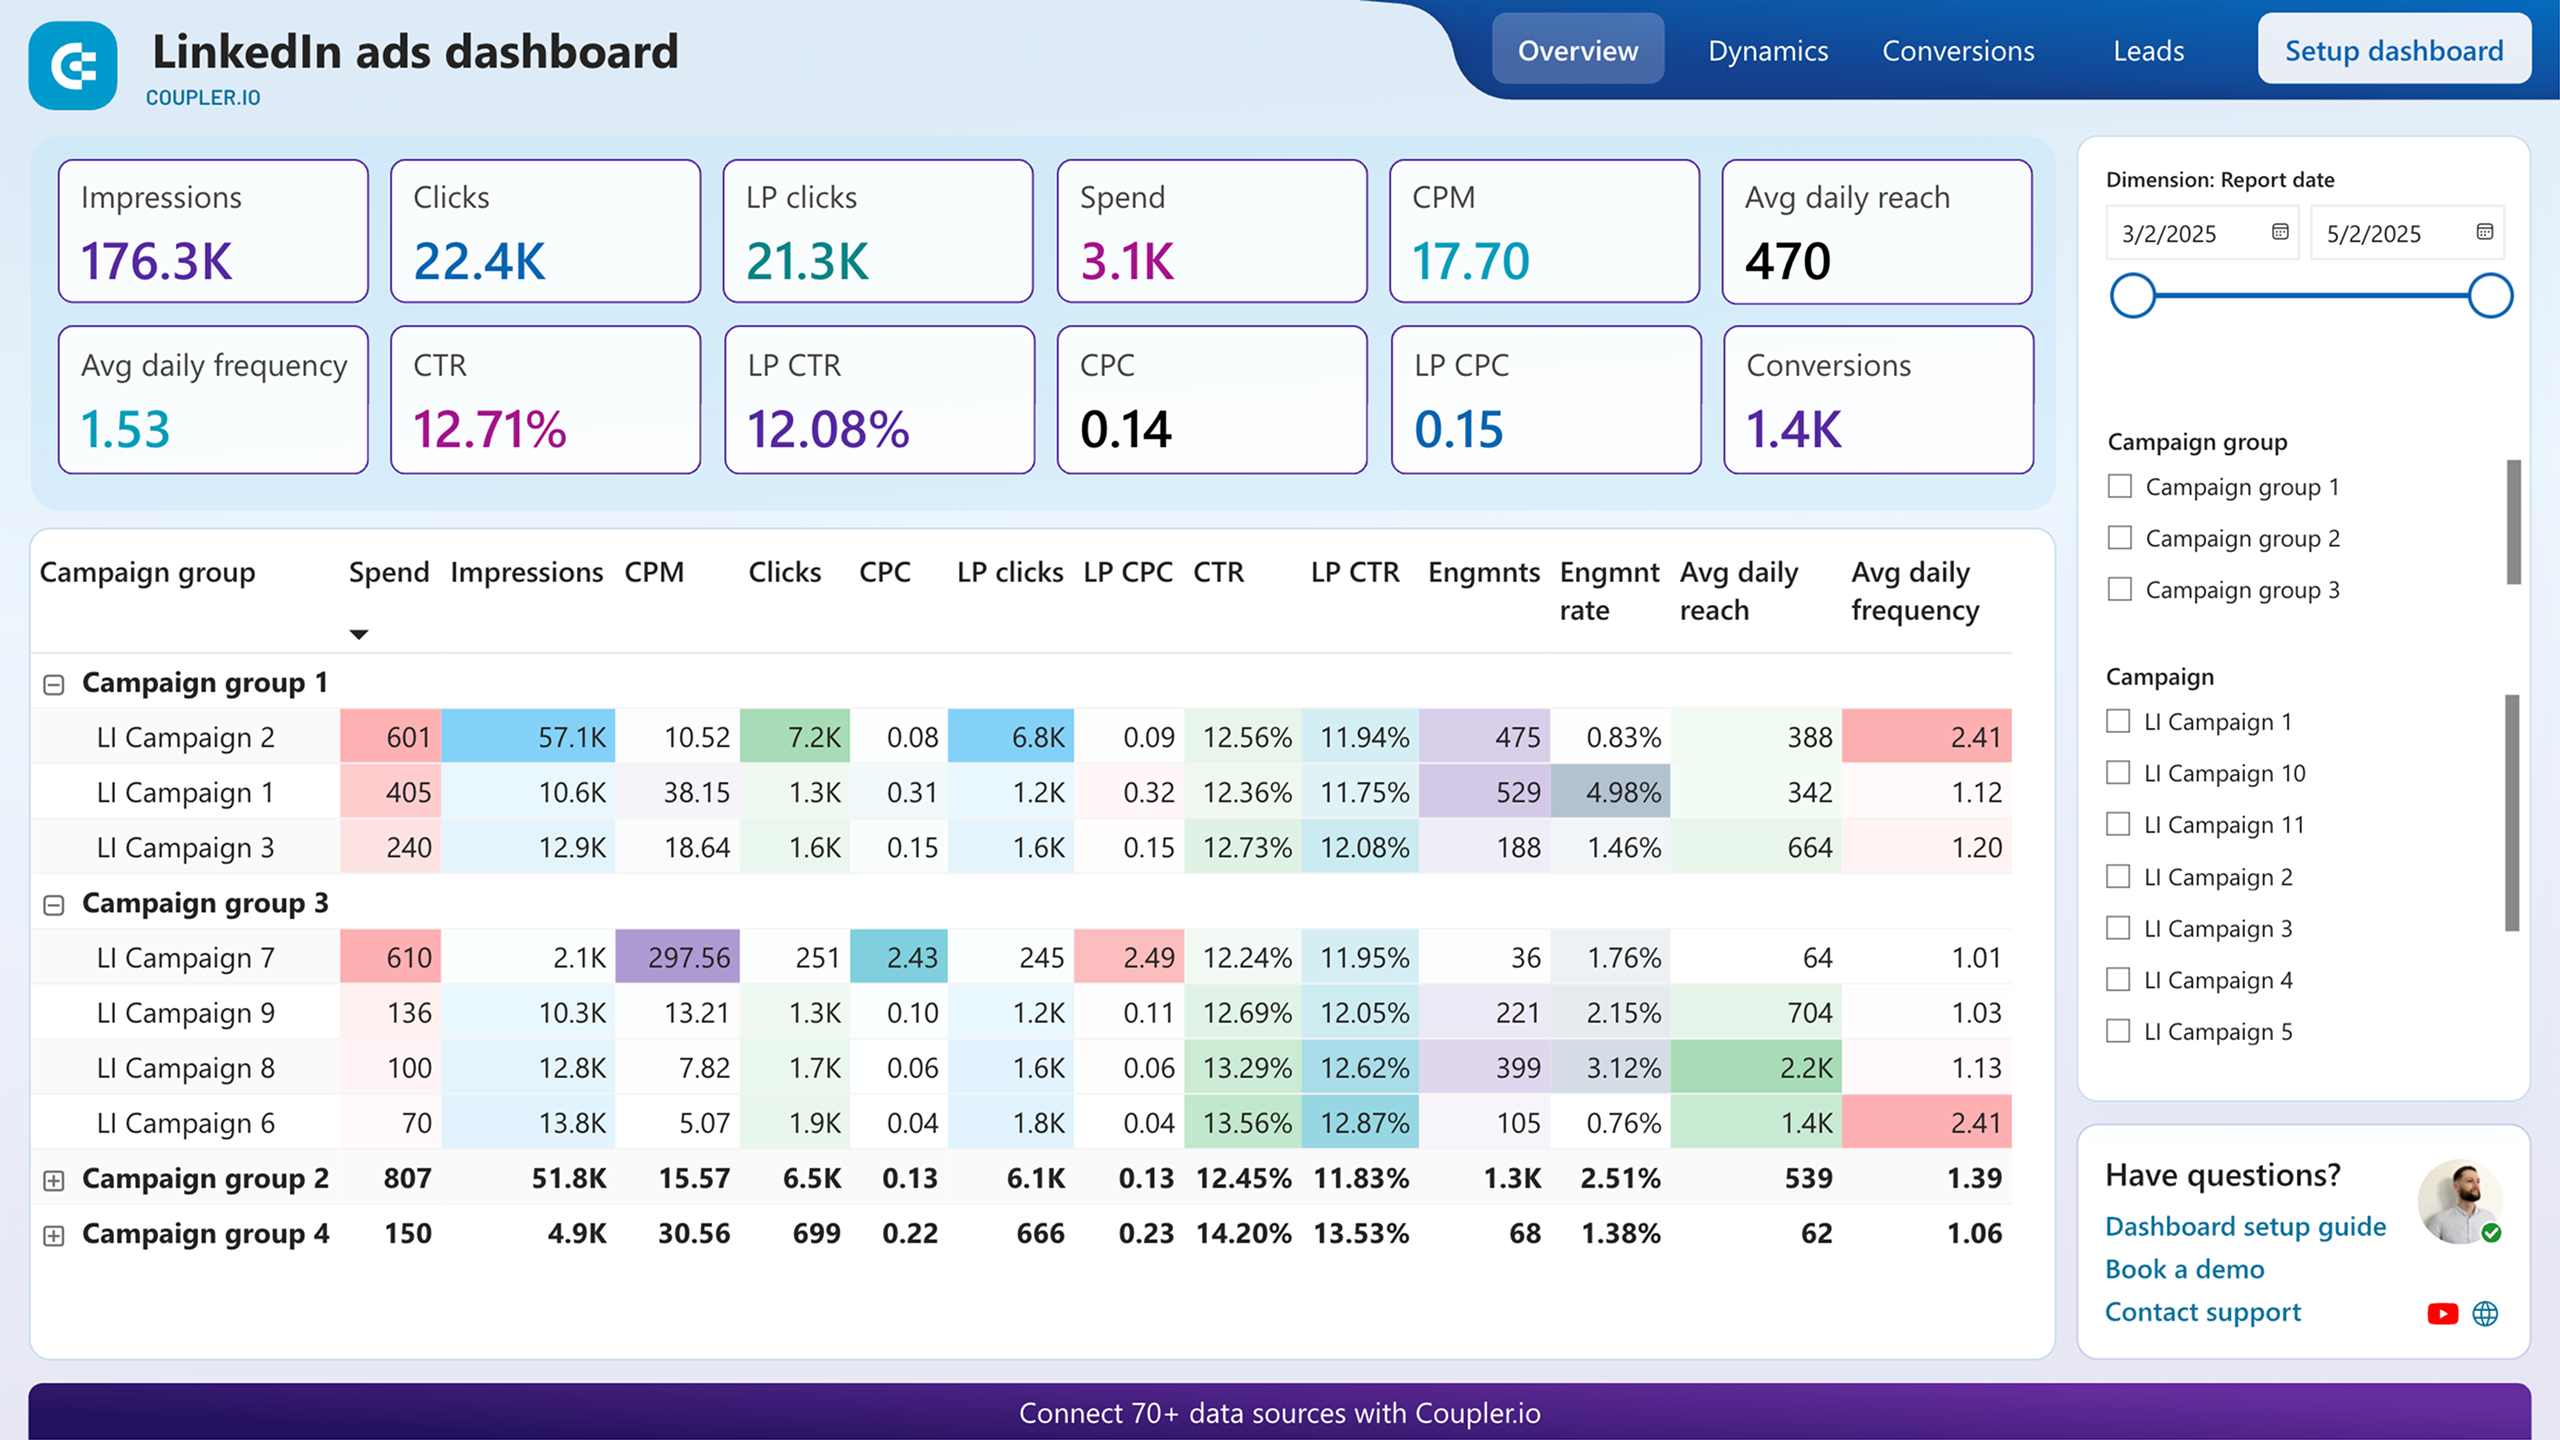
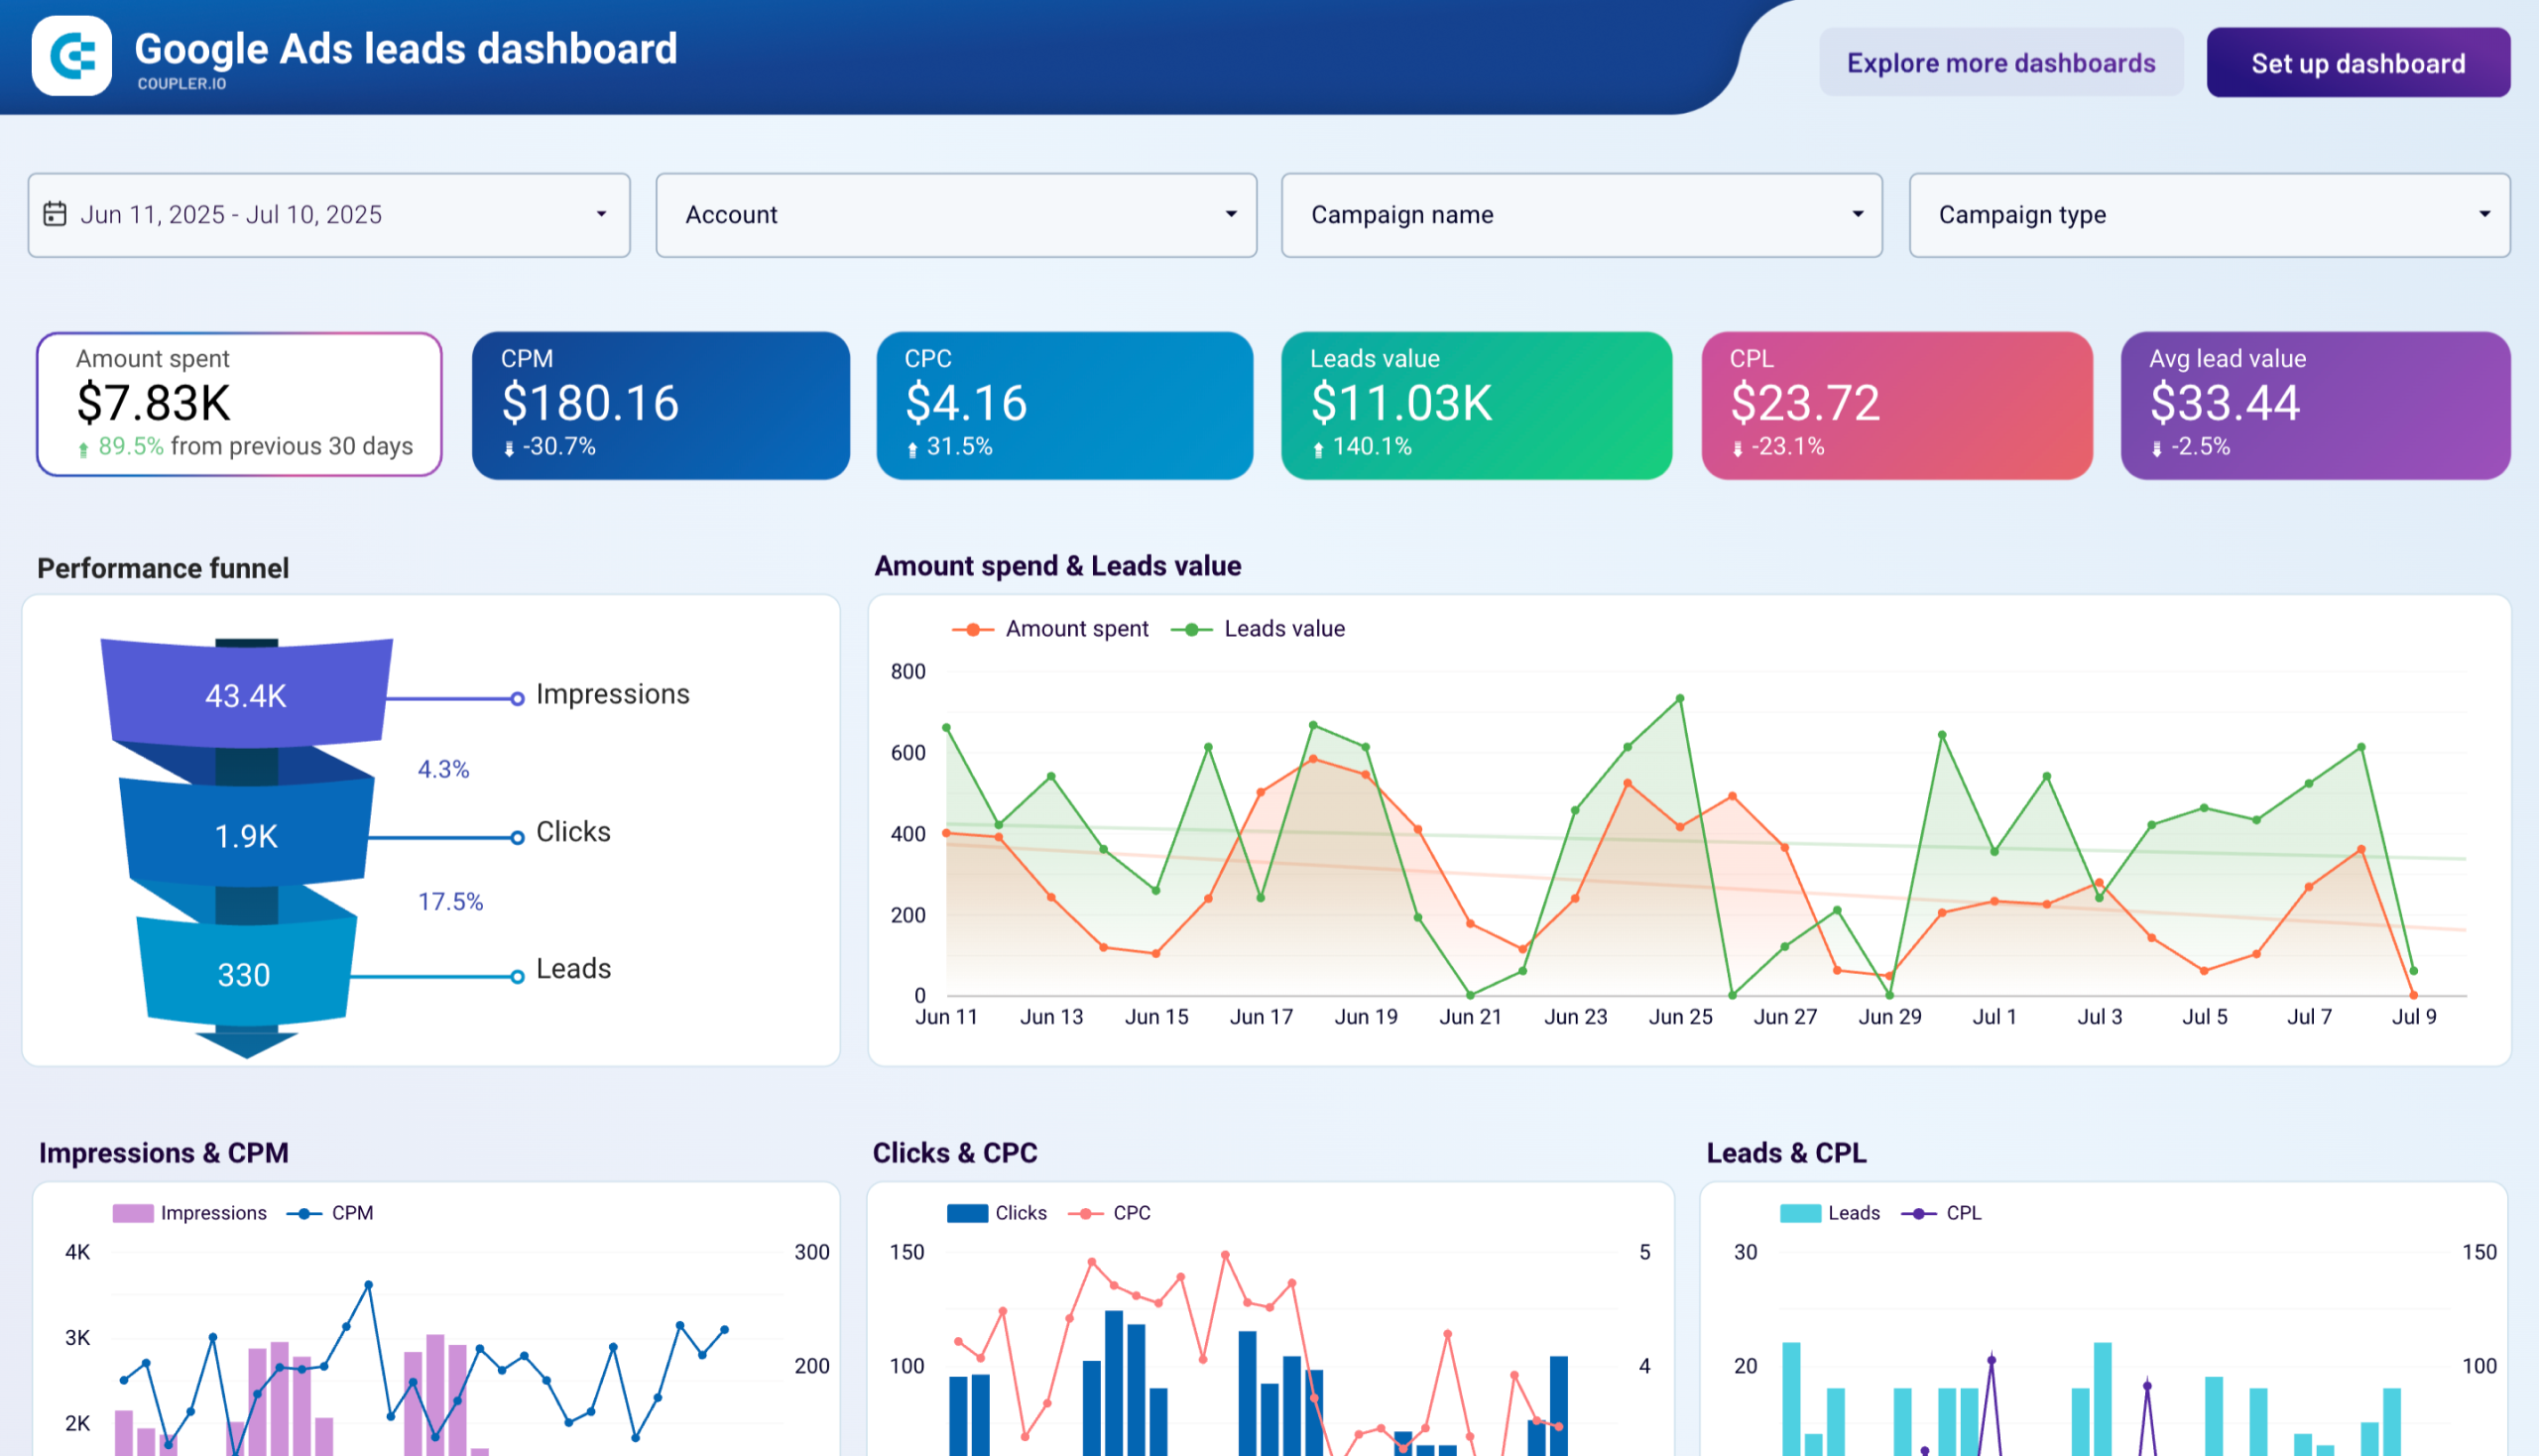
The campaign performance report provides a cross-platform overview of your advertising efforts, showing impressions, clicks, CTR, and cost metrics for each campaign. This multi-channel campaign report allows you to identify your highest-performing initiatives and underperforming campaigns that need optimization. With platform-by-platform breakdowns, you can understand which advertising channels deliver the best results for your specific goals and allocate your budget accordingly.
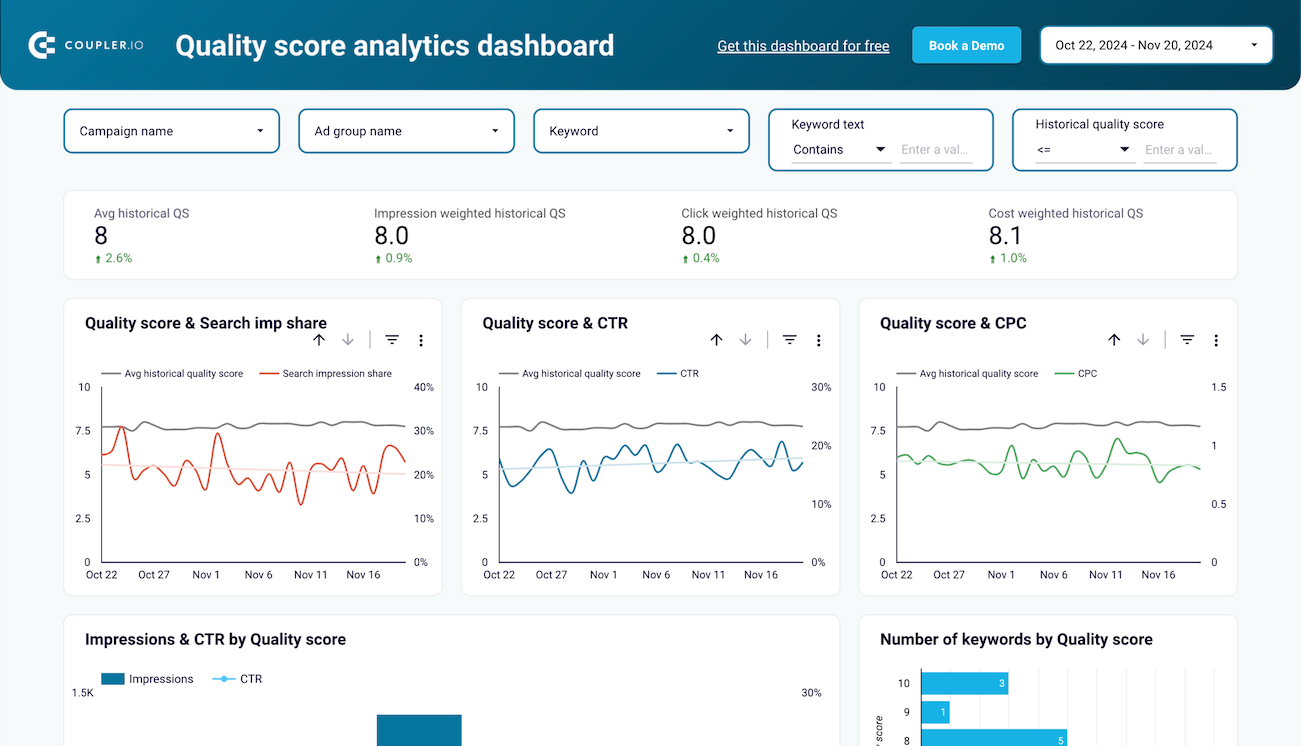
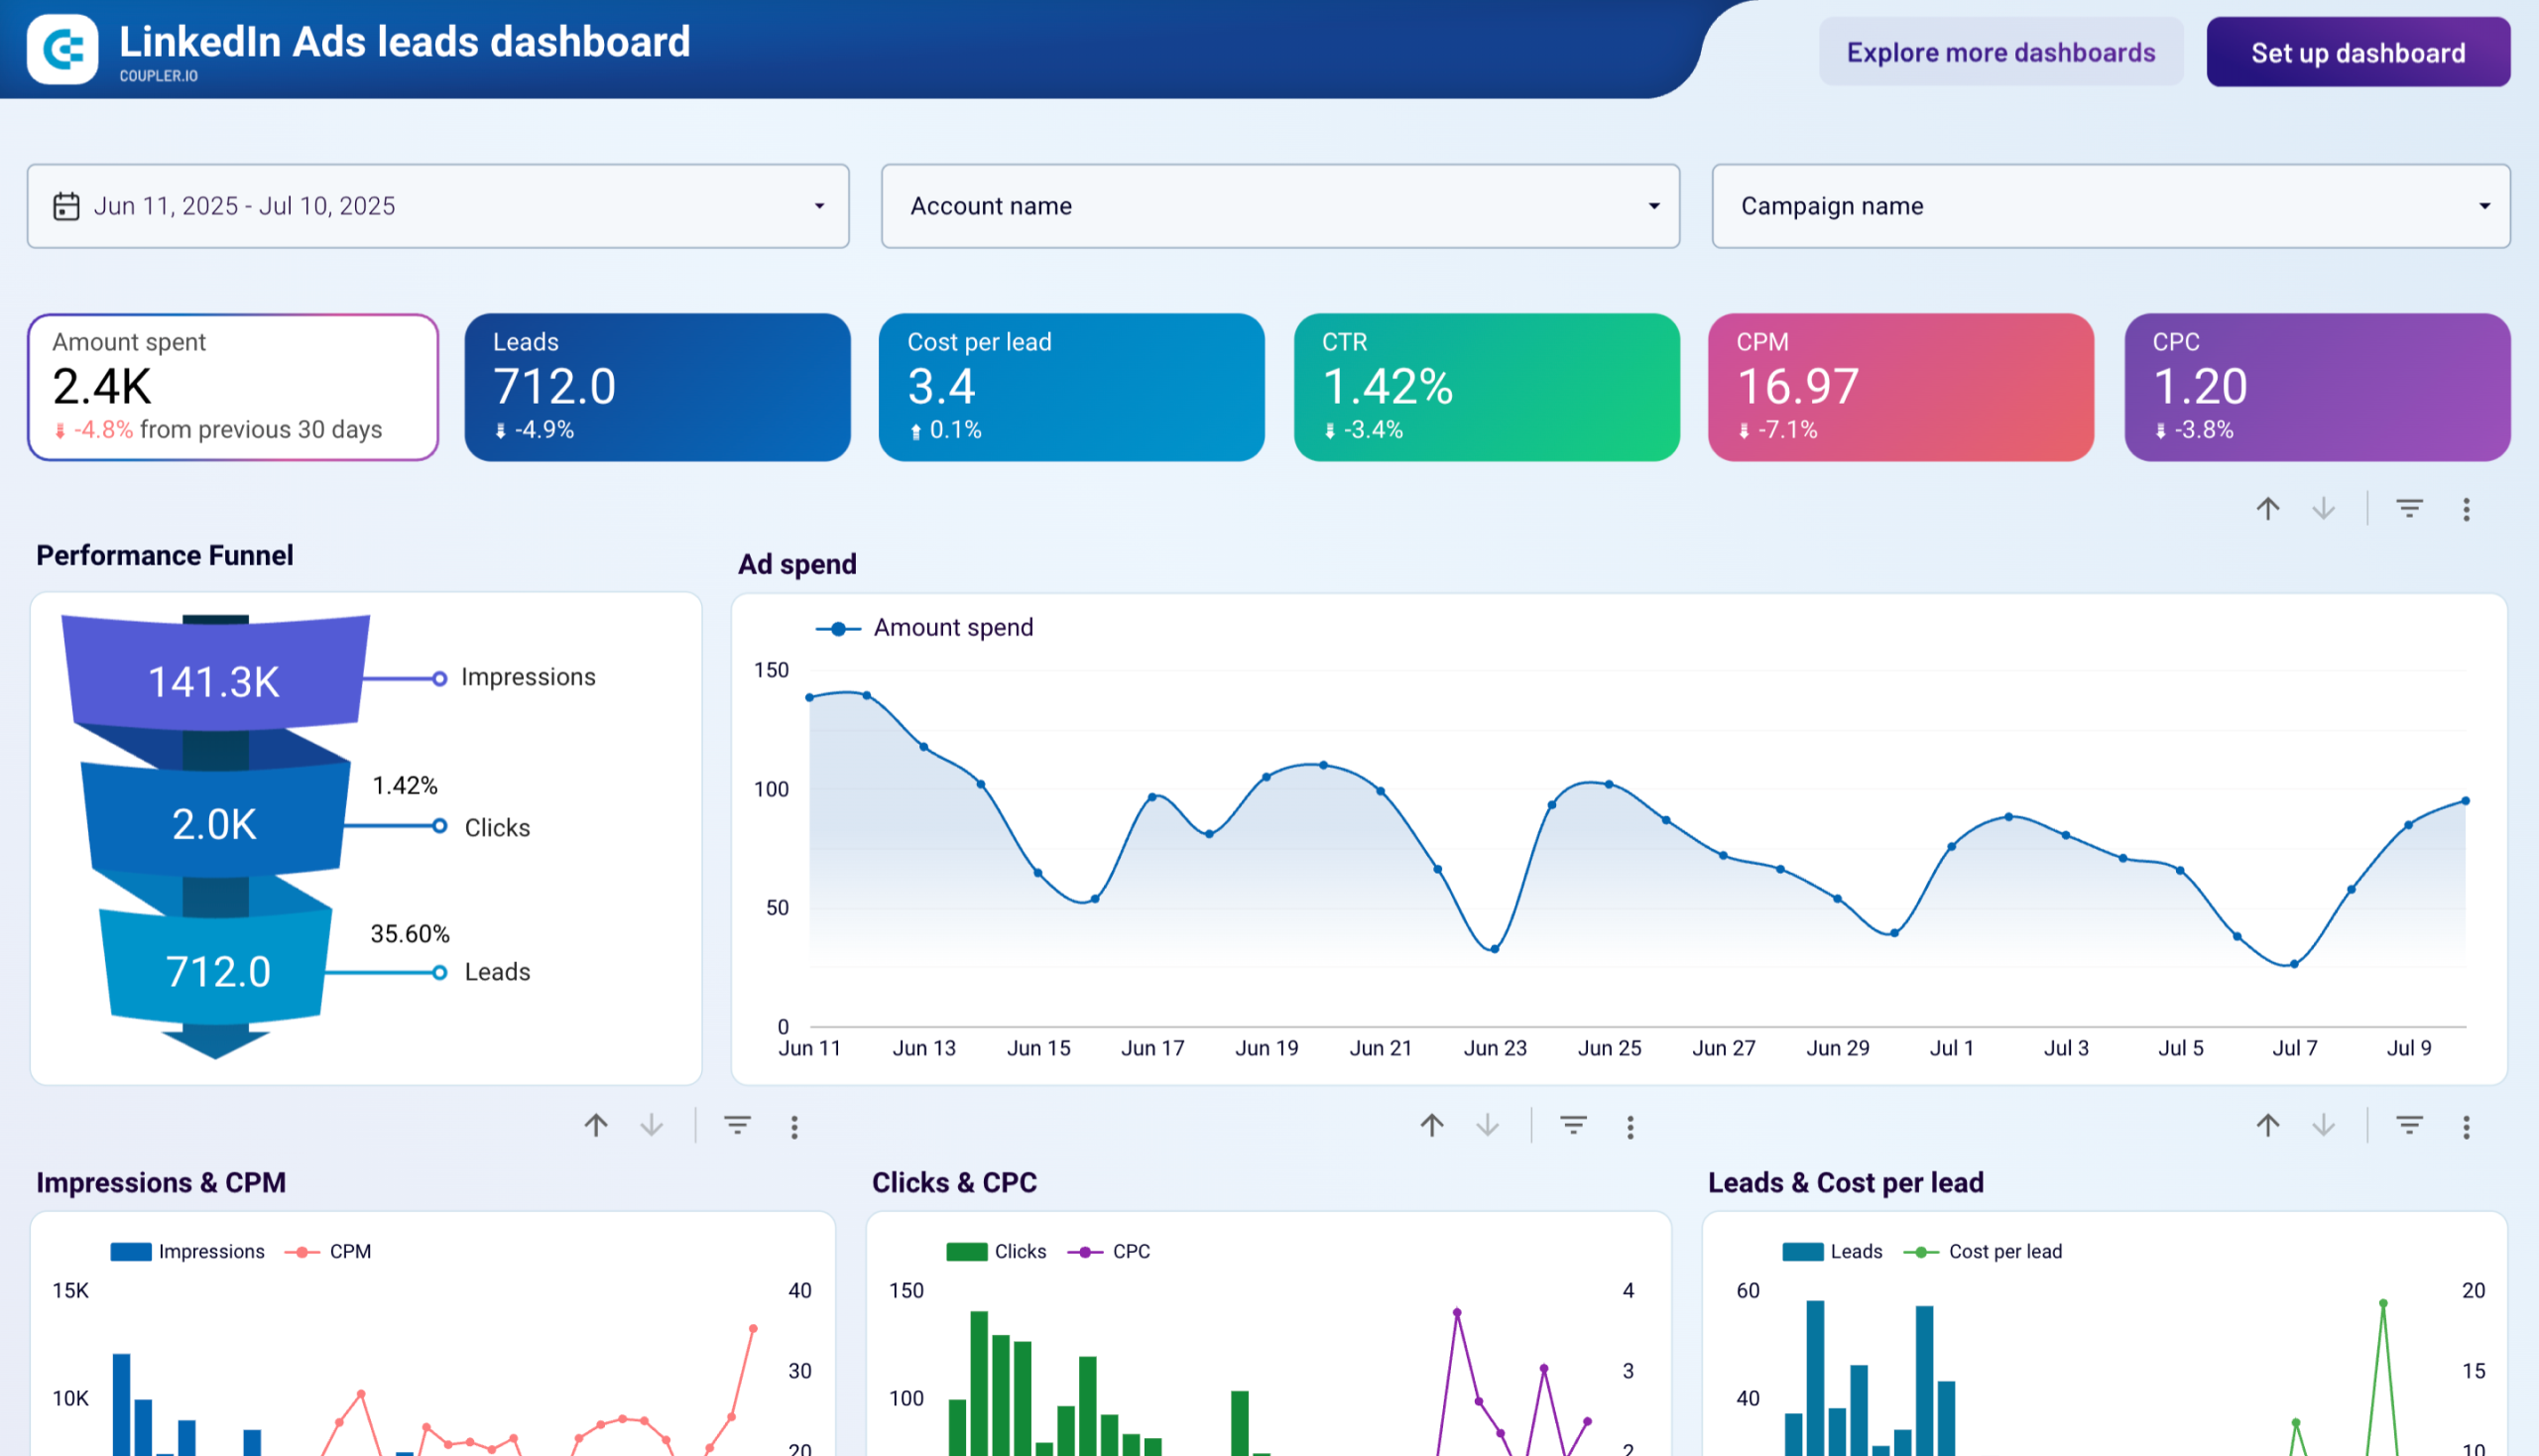
The keyword performance report tracks the effectiveness of your search advertising keywords across campaigns and ad groups. It shows impressions, clicks, CTR, CPC, conversions, and search impression share over time. This report helps you identify top-performing keywords worth additional investment, underperforming terms that need optimization, and seasonal trends affecting keyword effectiveness. By analyzing search impression share, you can also identify opportunities to increase visibility through bid adjustments.
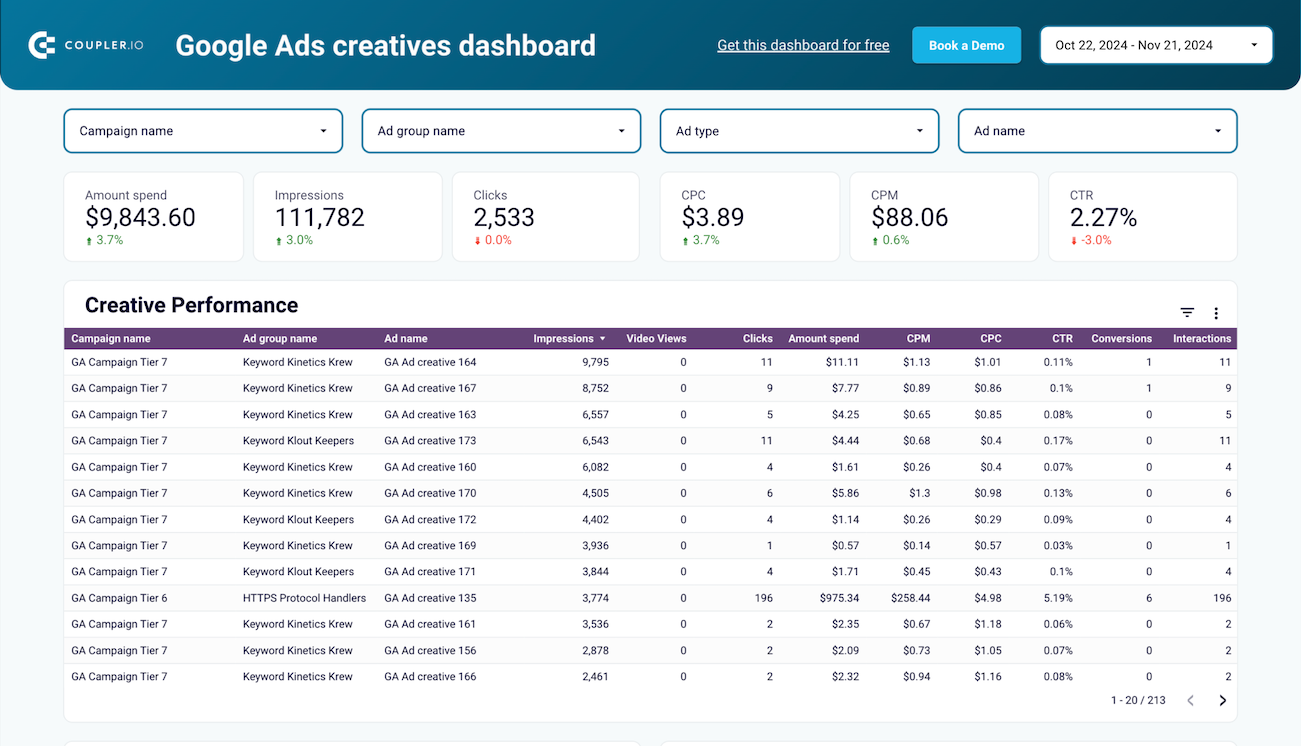
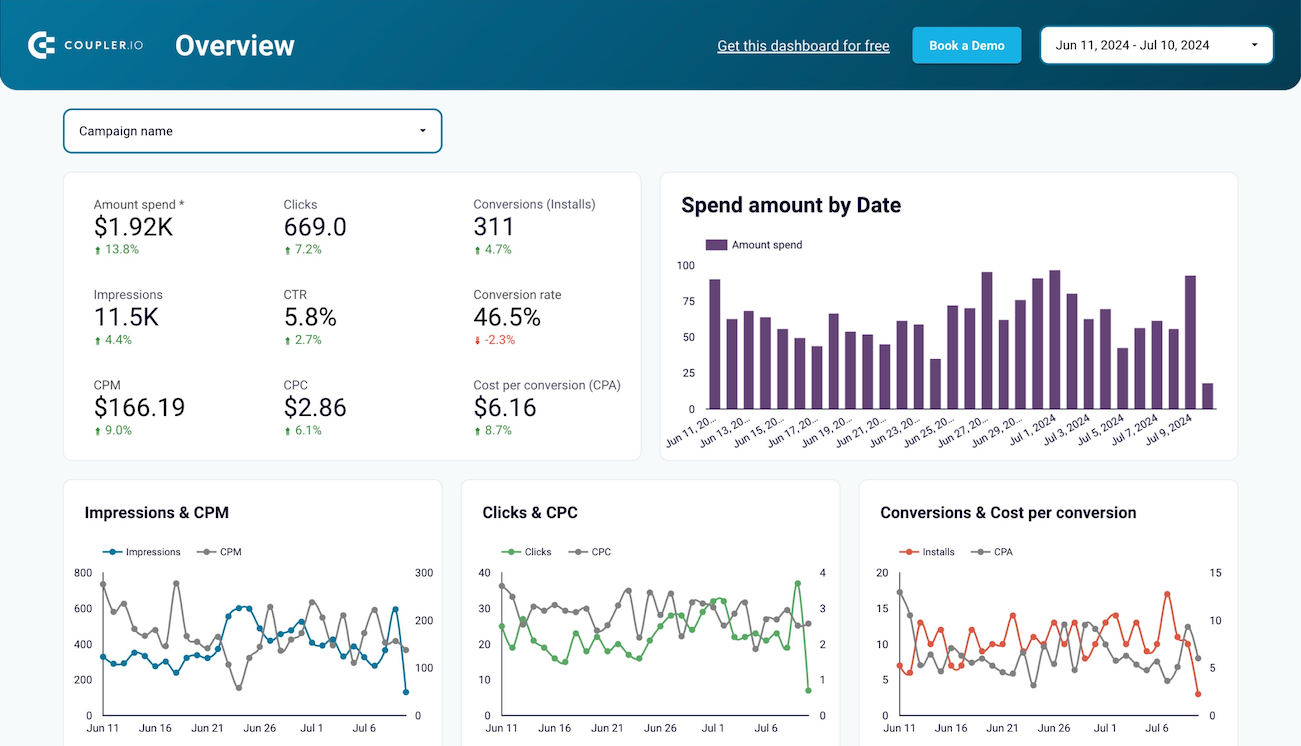
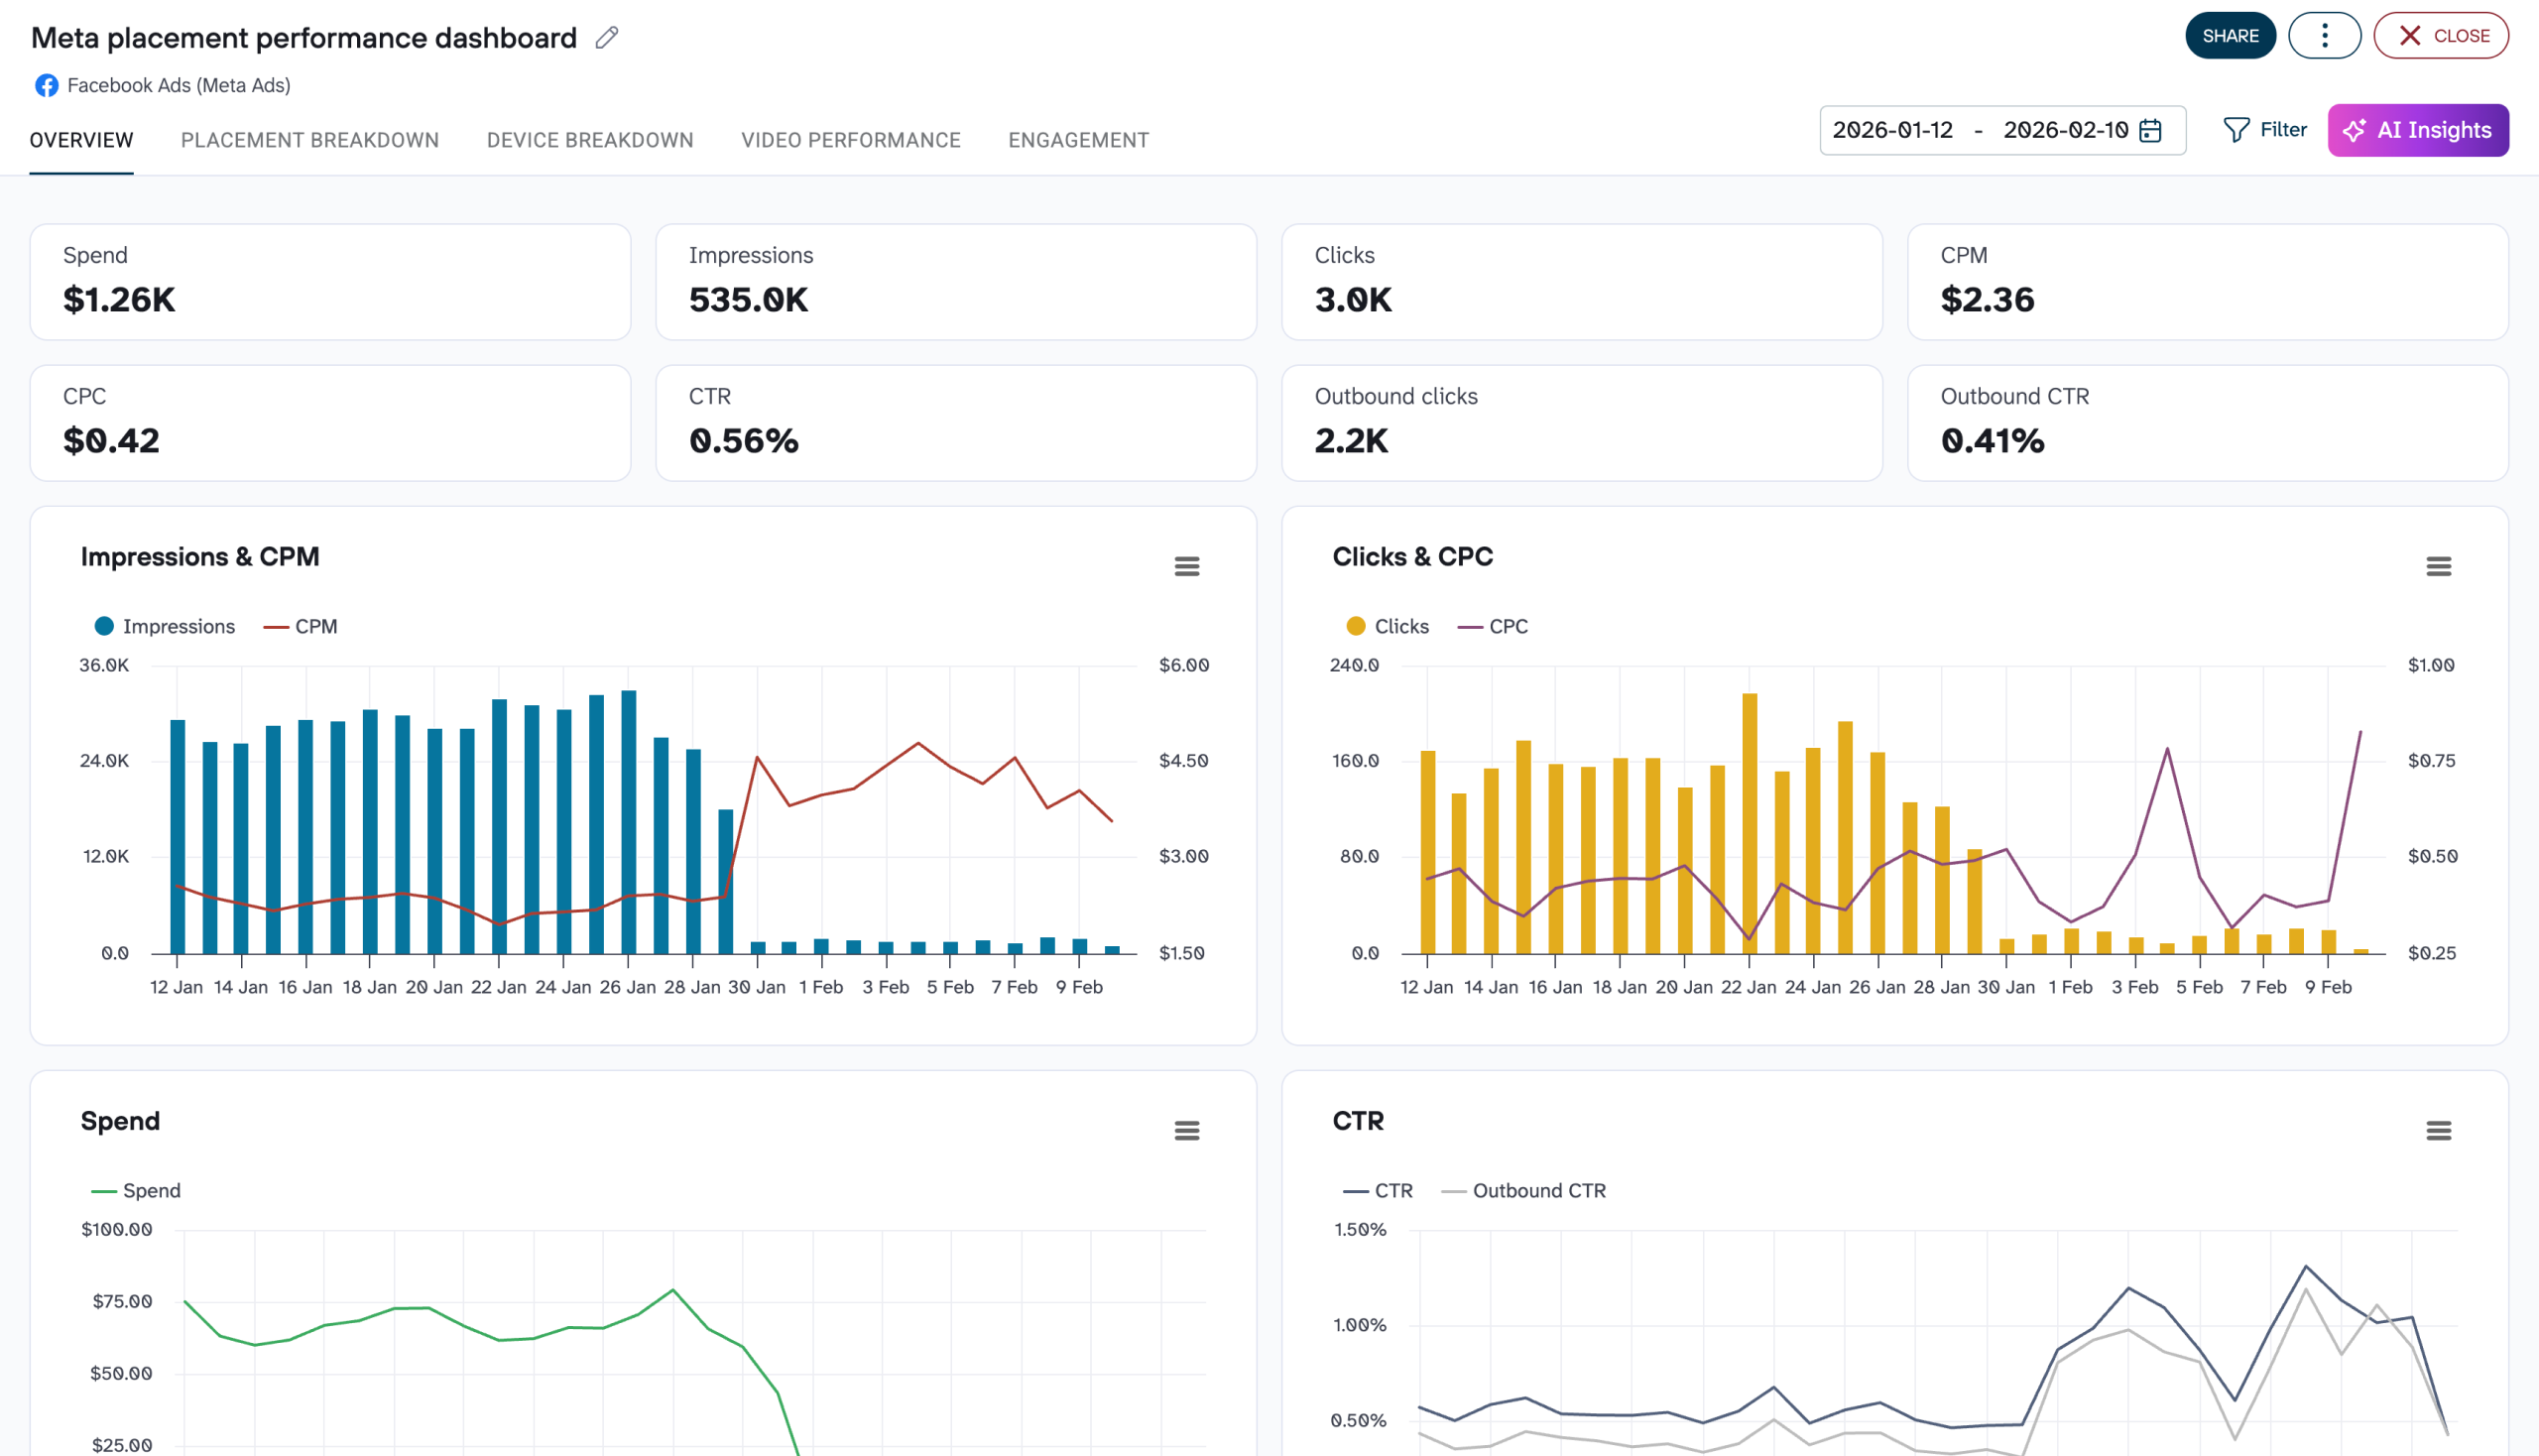
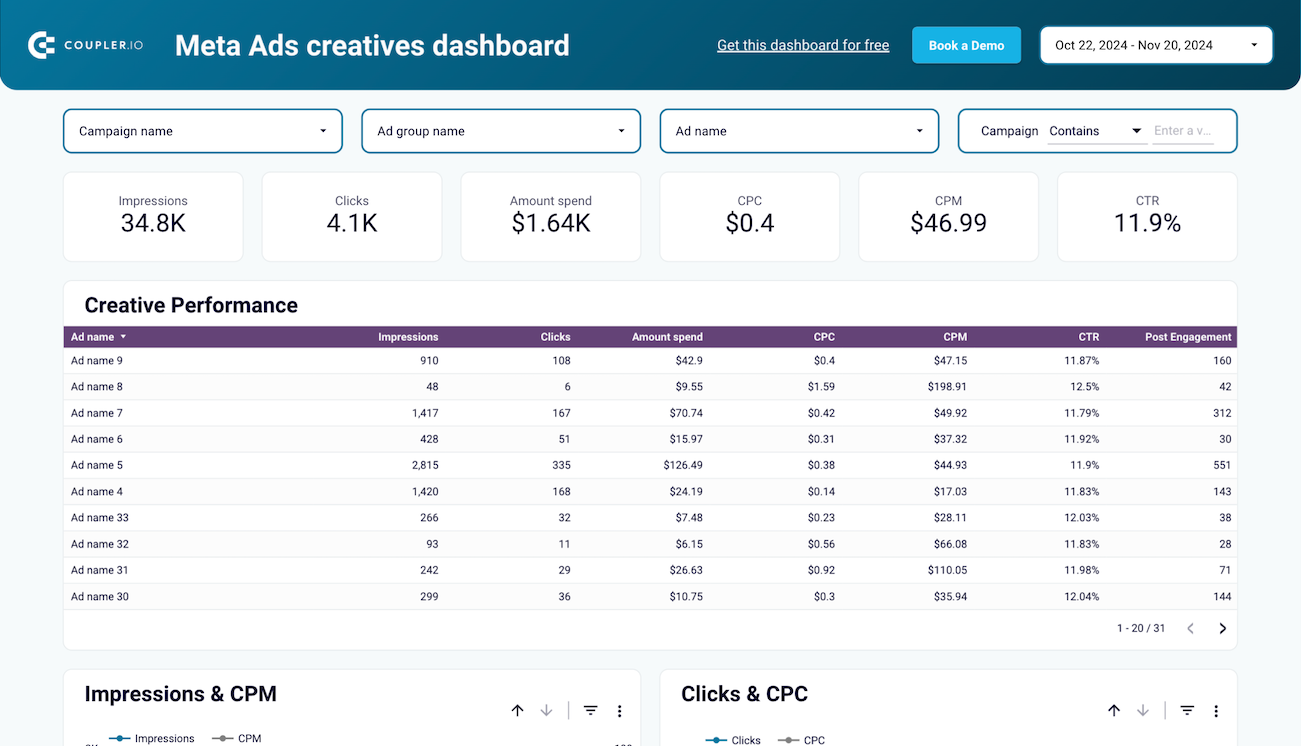
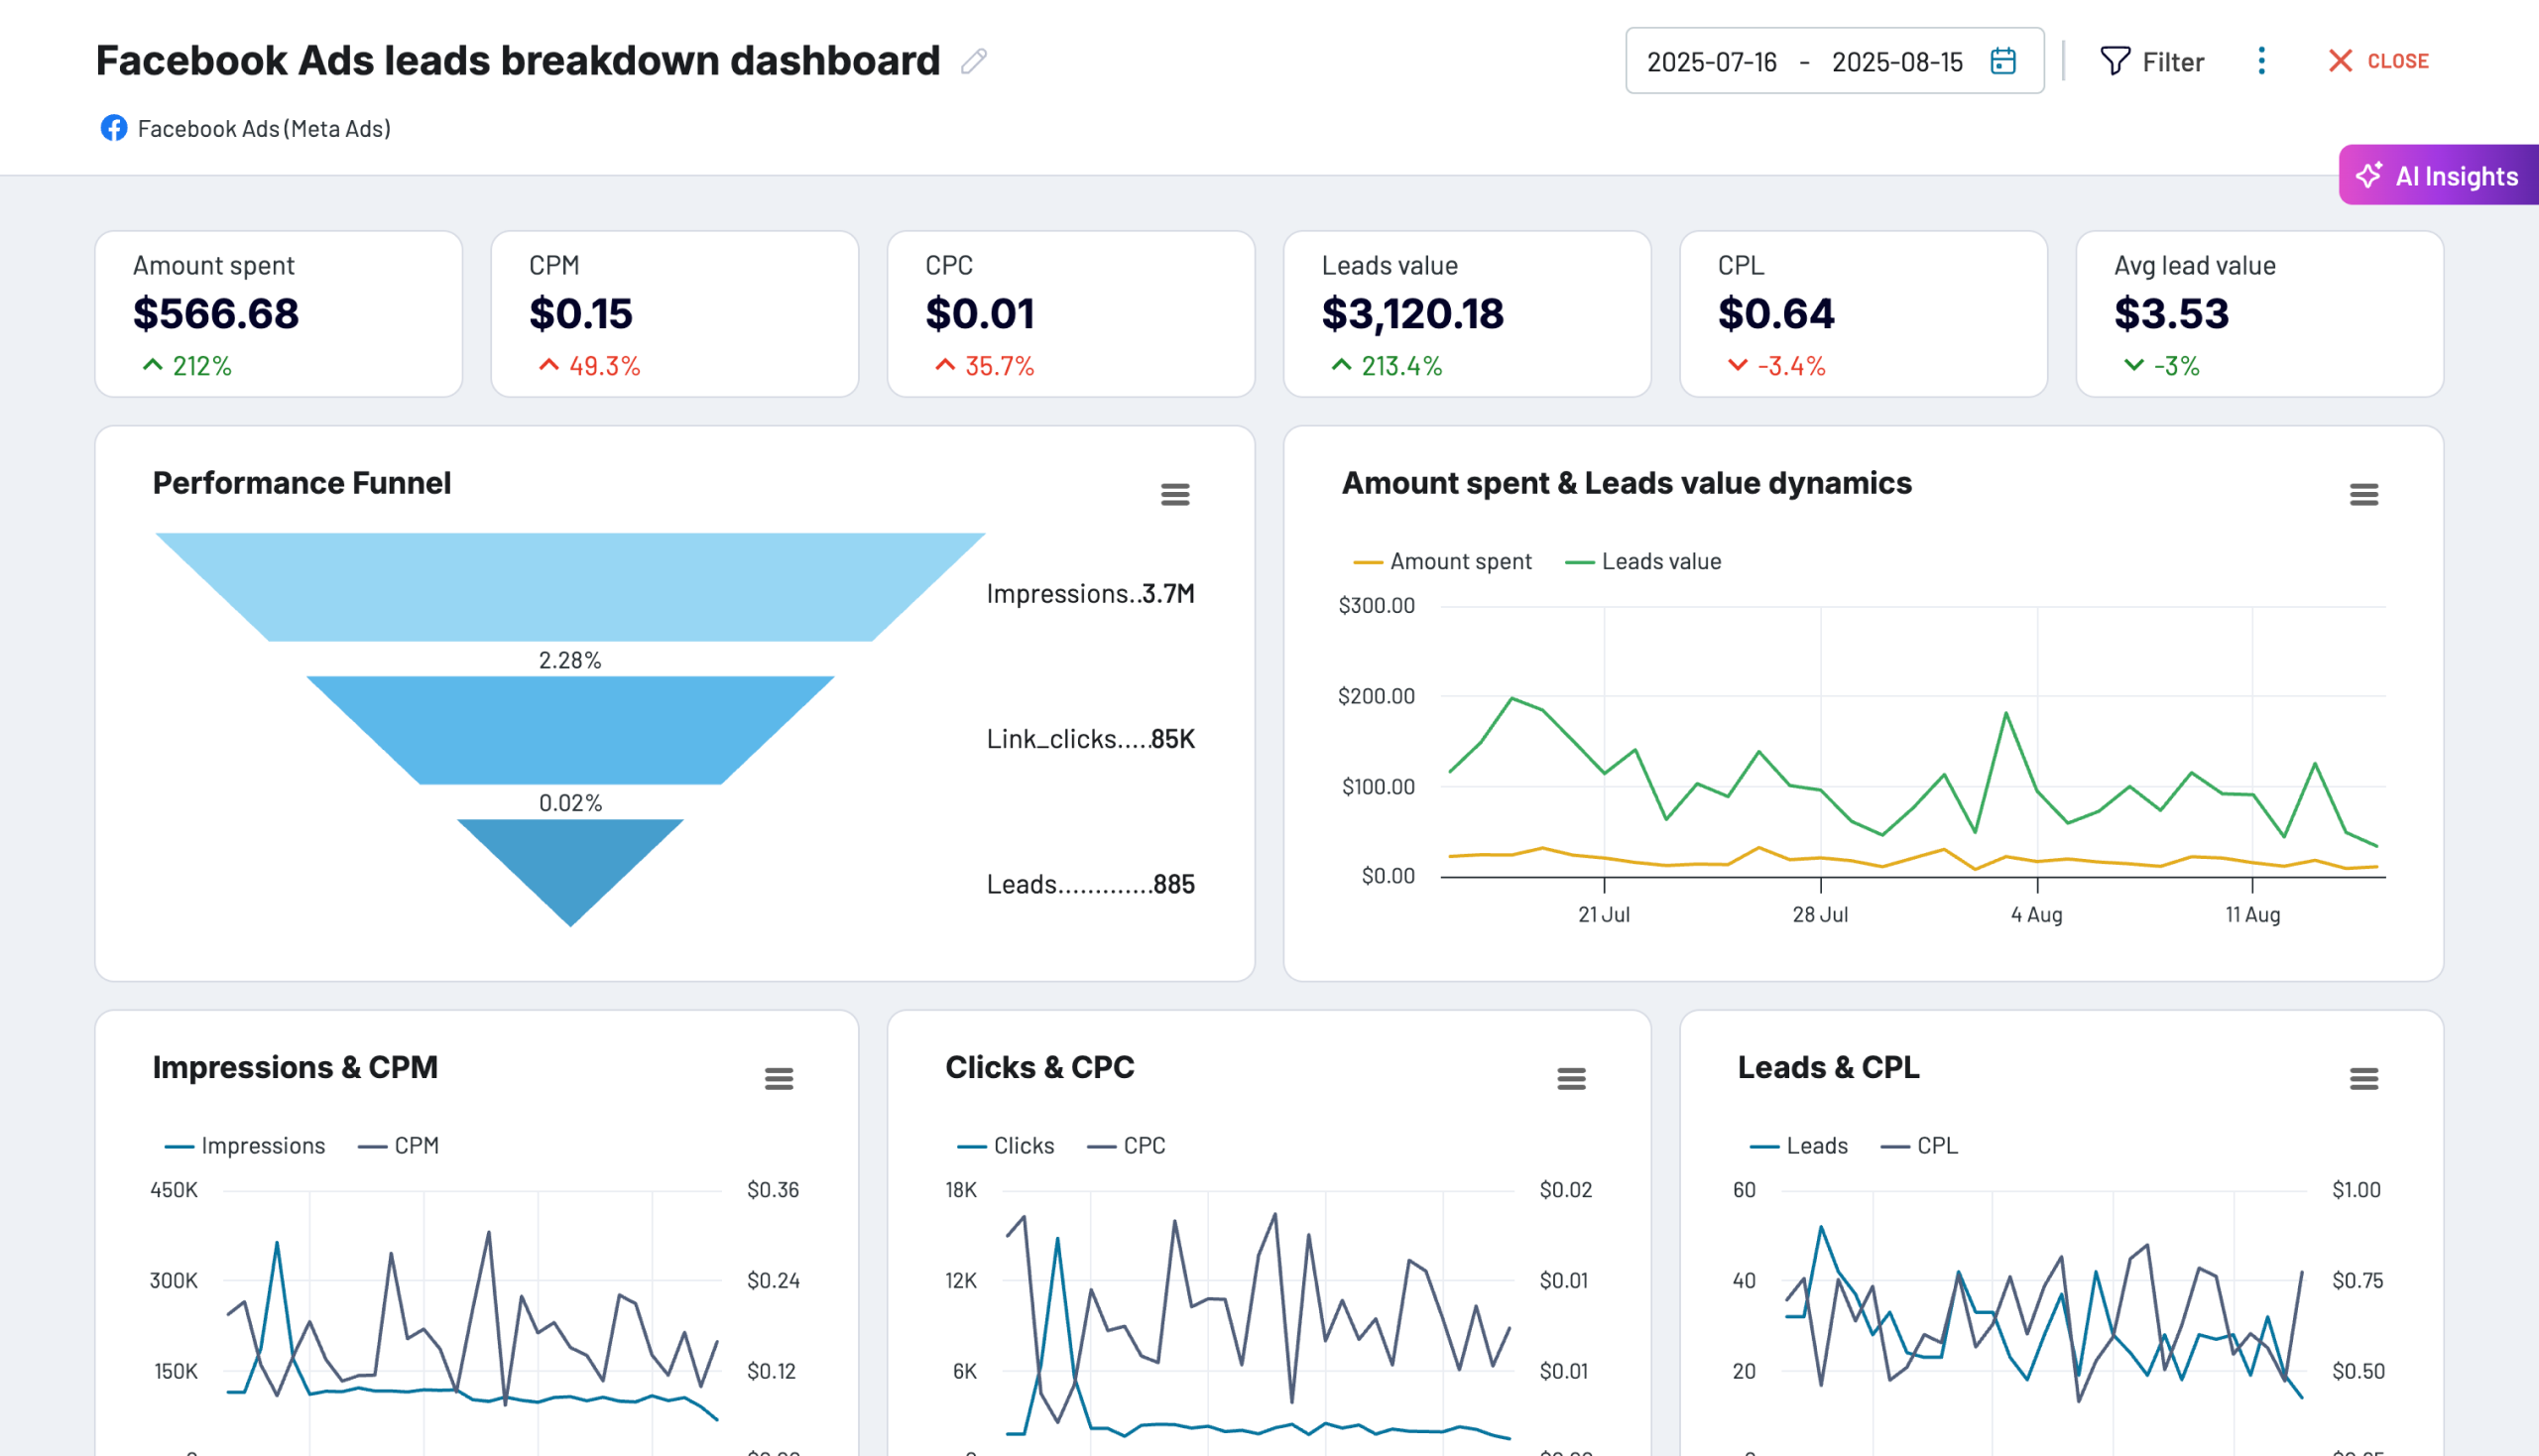
The creative performance report evaluates the effectiveness of your ad creatives across platforms. It tracks impressions, clicks, CTR, and conversion metrics for individual ads to help you understand which messages, visuals, and formats resonate most with your audience. This PPC analytics dashboard highlights top-performing creatives by engagement metrics and helps you identify patterns in successful ads. These insights inform the development of more effective creative assets for future campaigns.
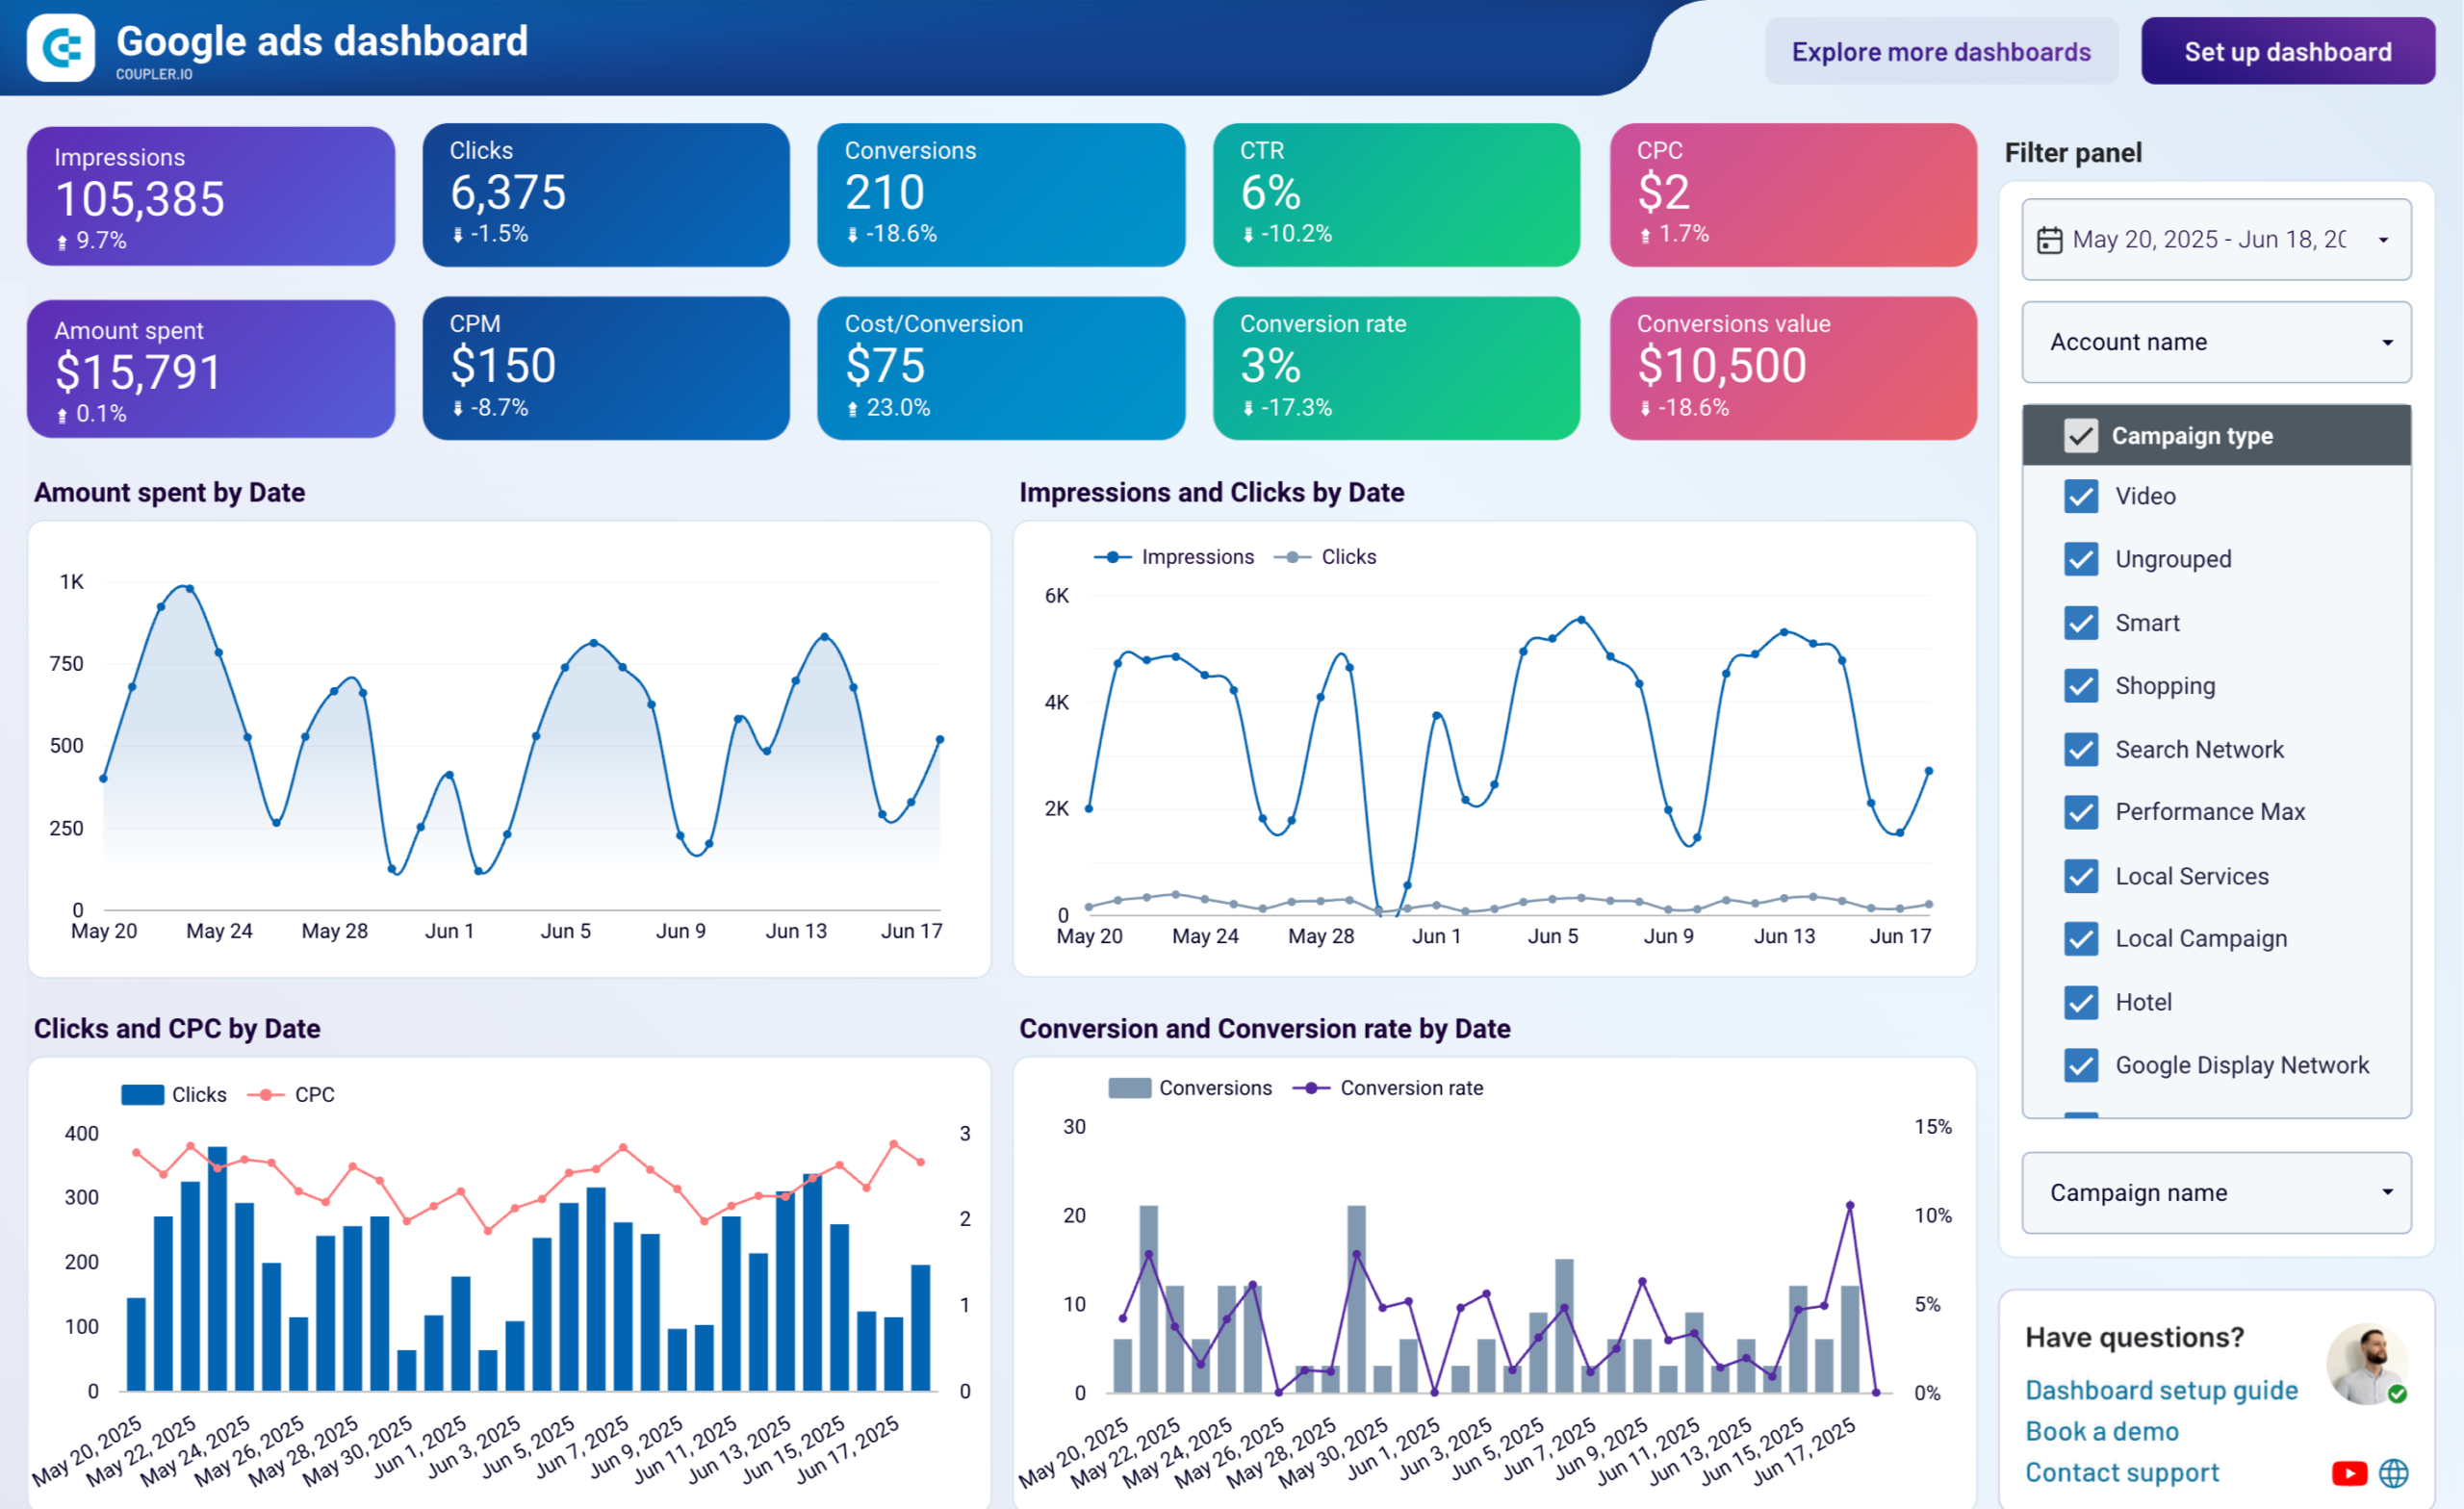
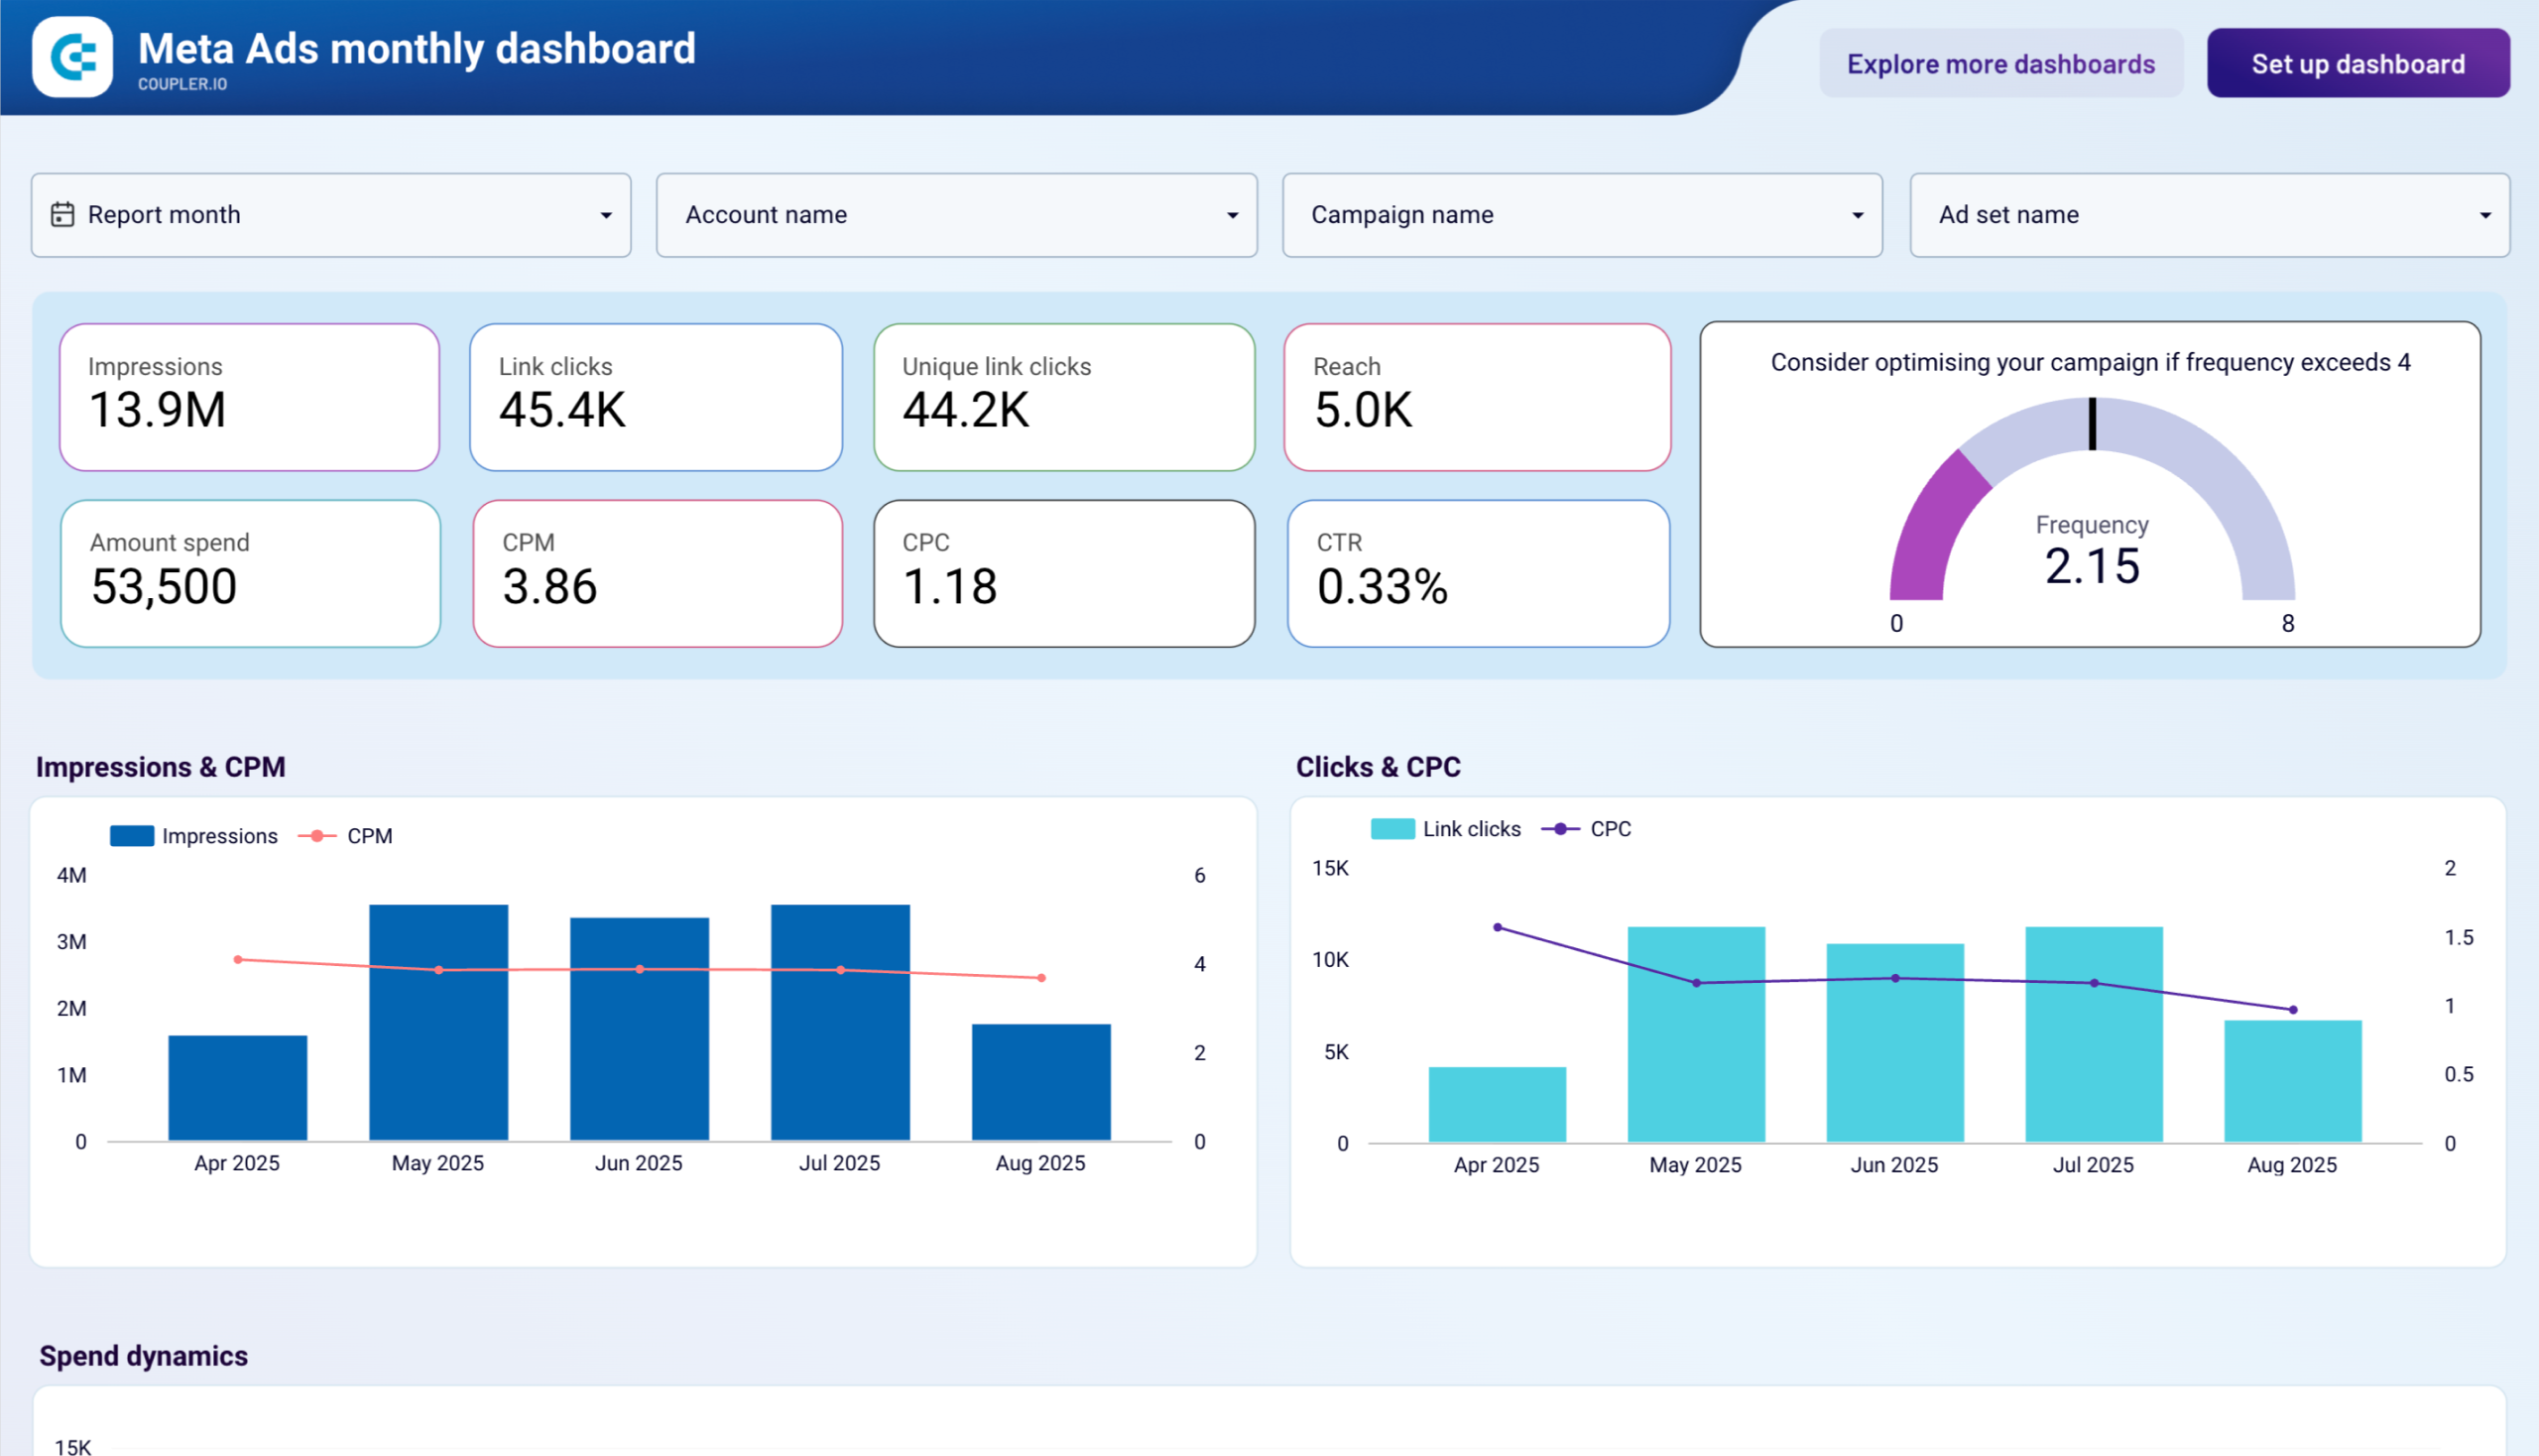
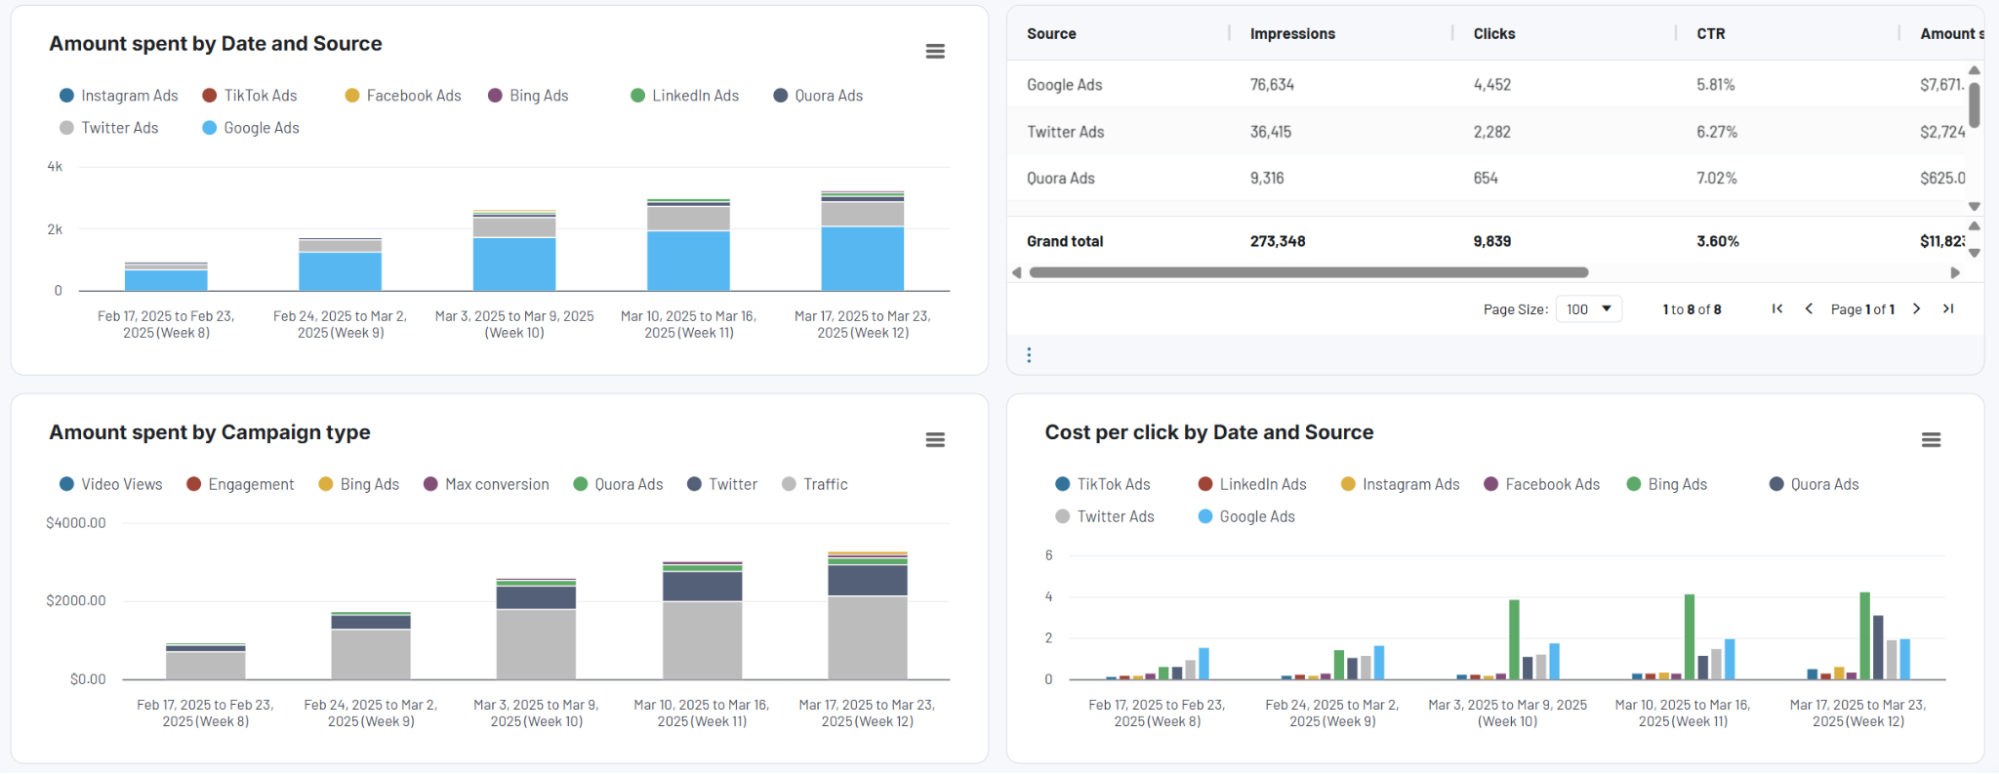
The budget and spend report tracks advertising expenditure across all platforms, comparing actual spend against allocated budgets. It shows spending trends over time, platform-by-platform cost breakdowns, and projection alerts to help you maintain financial control. This report enables you to identify cost efficiency opportunities, optimize budget allocation across channels, and ensure your advertising investments align with strategic priorities and performance outcomes.
What insights you can get with the PPC reporting dashboard
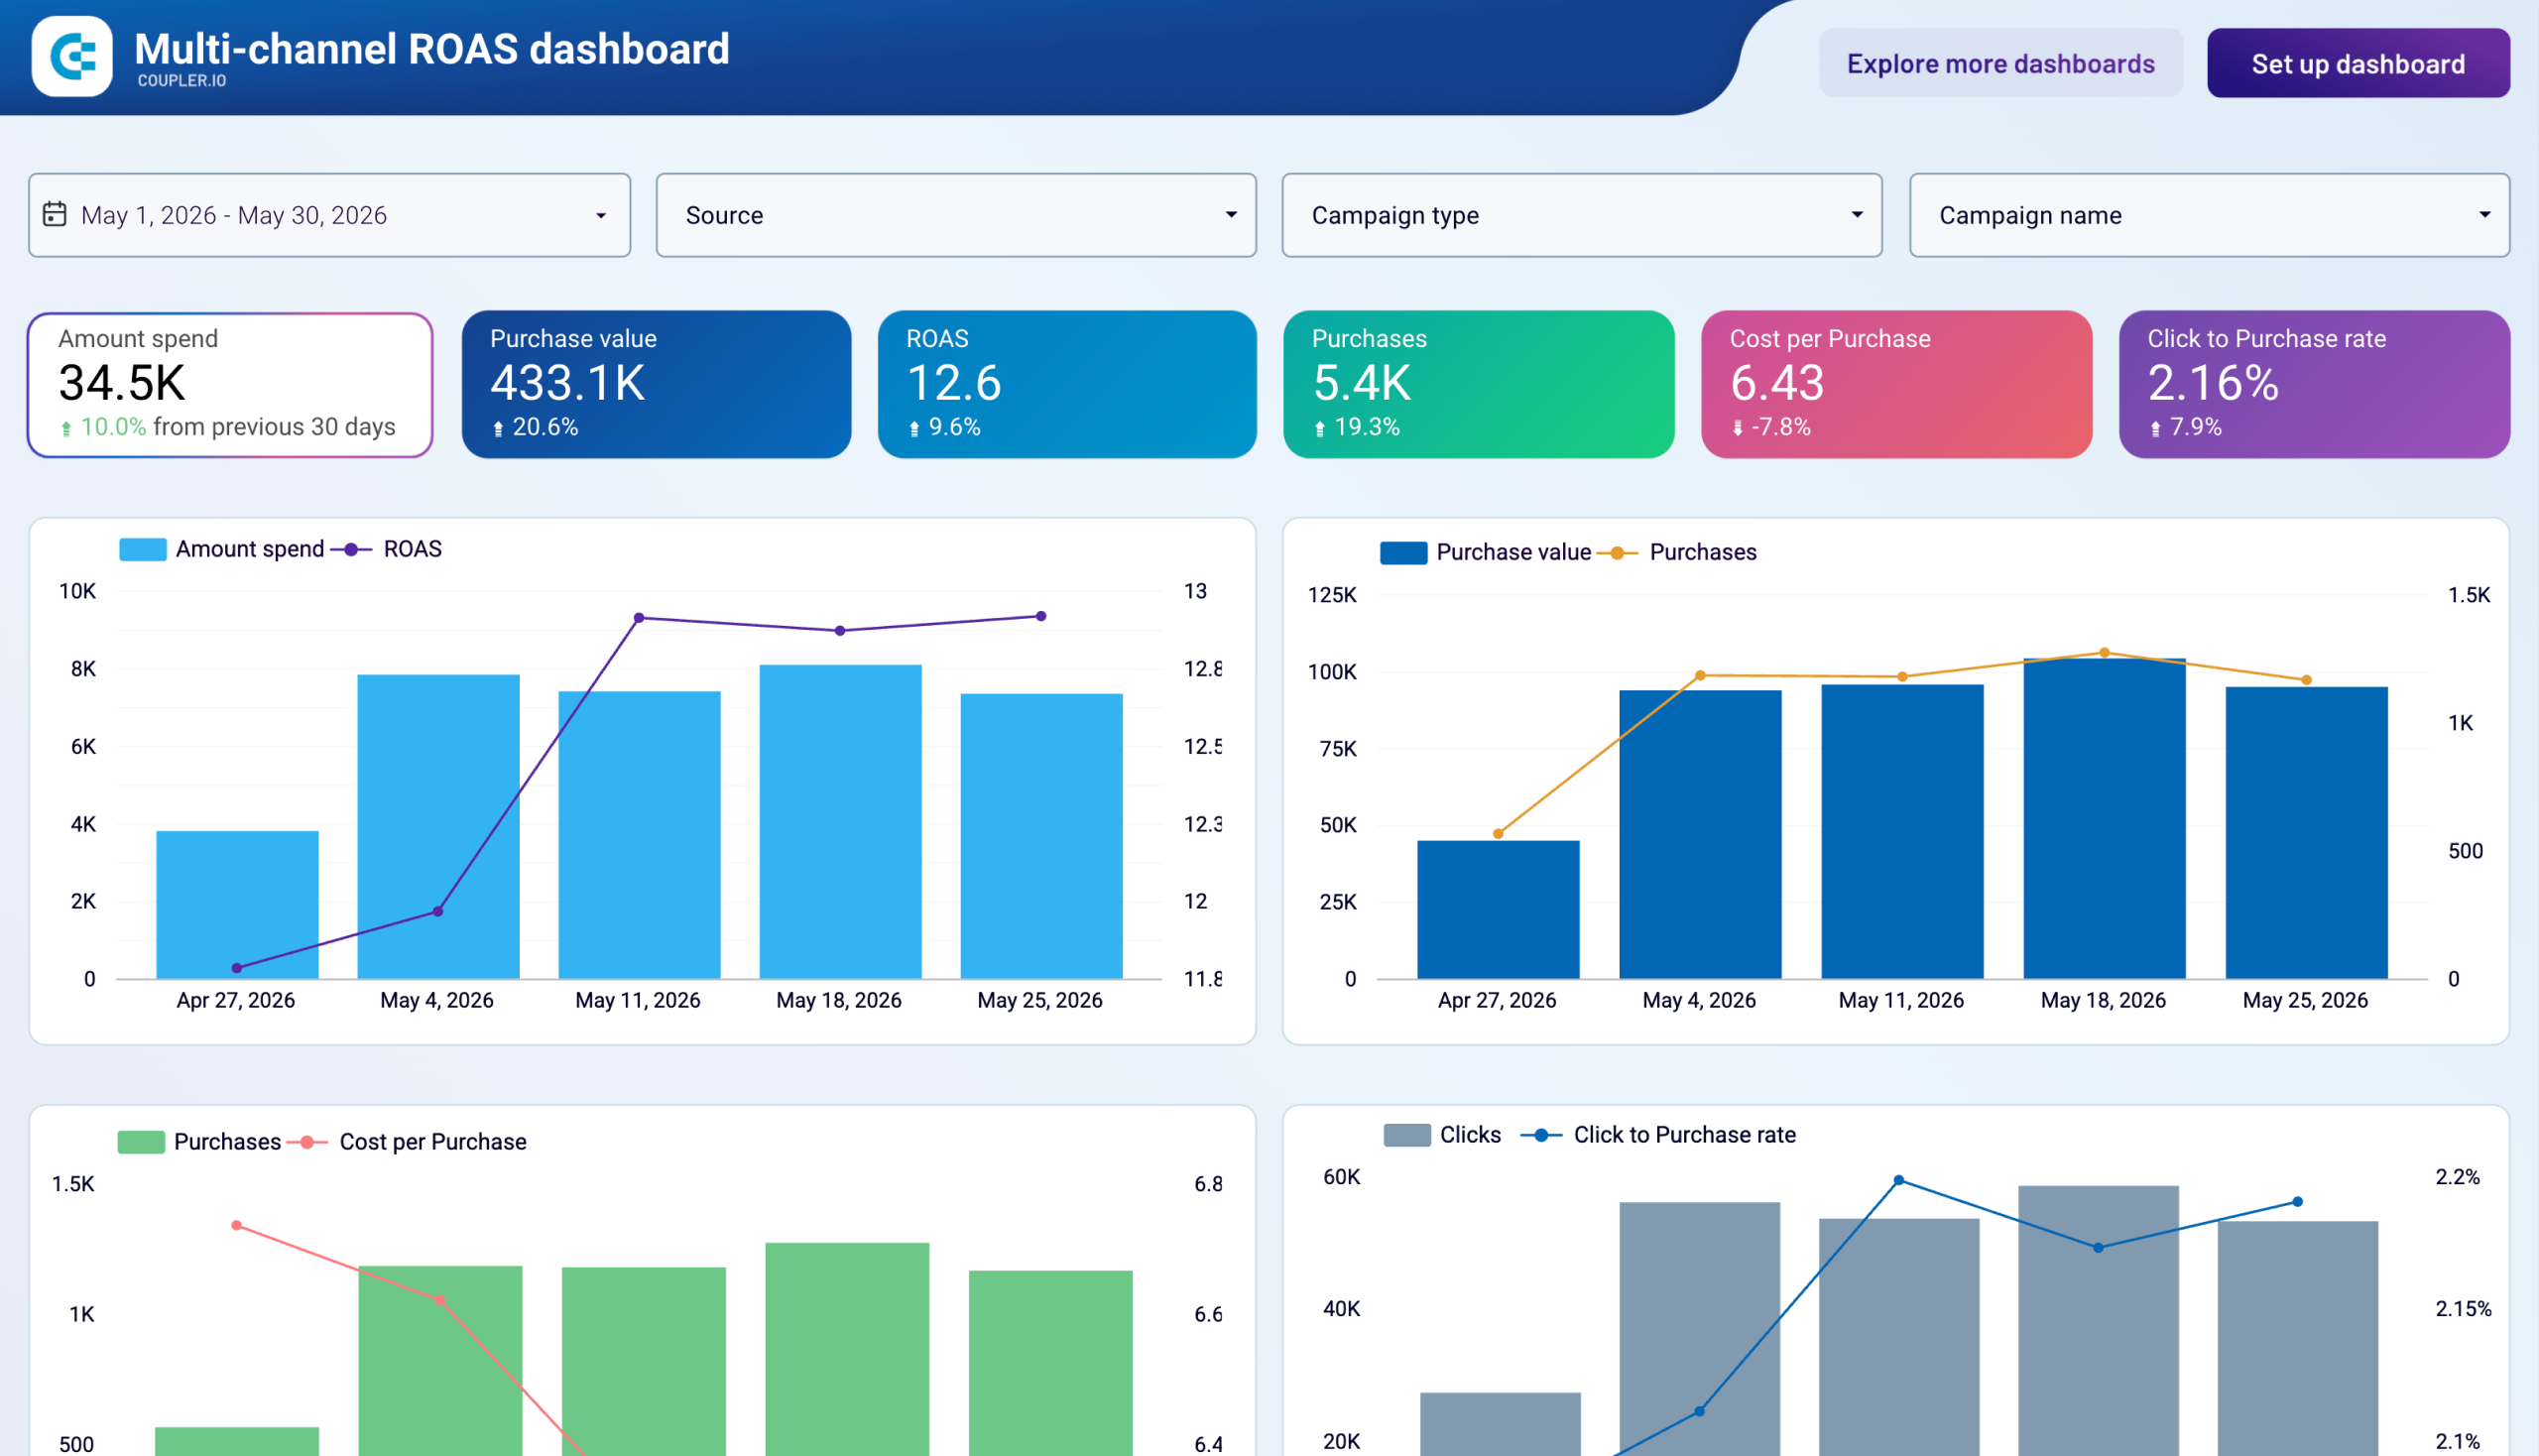
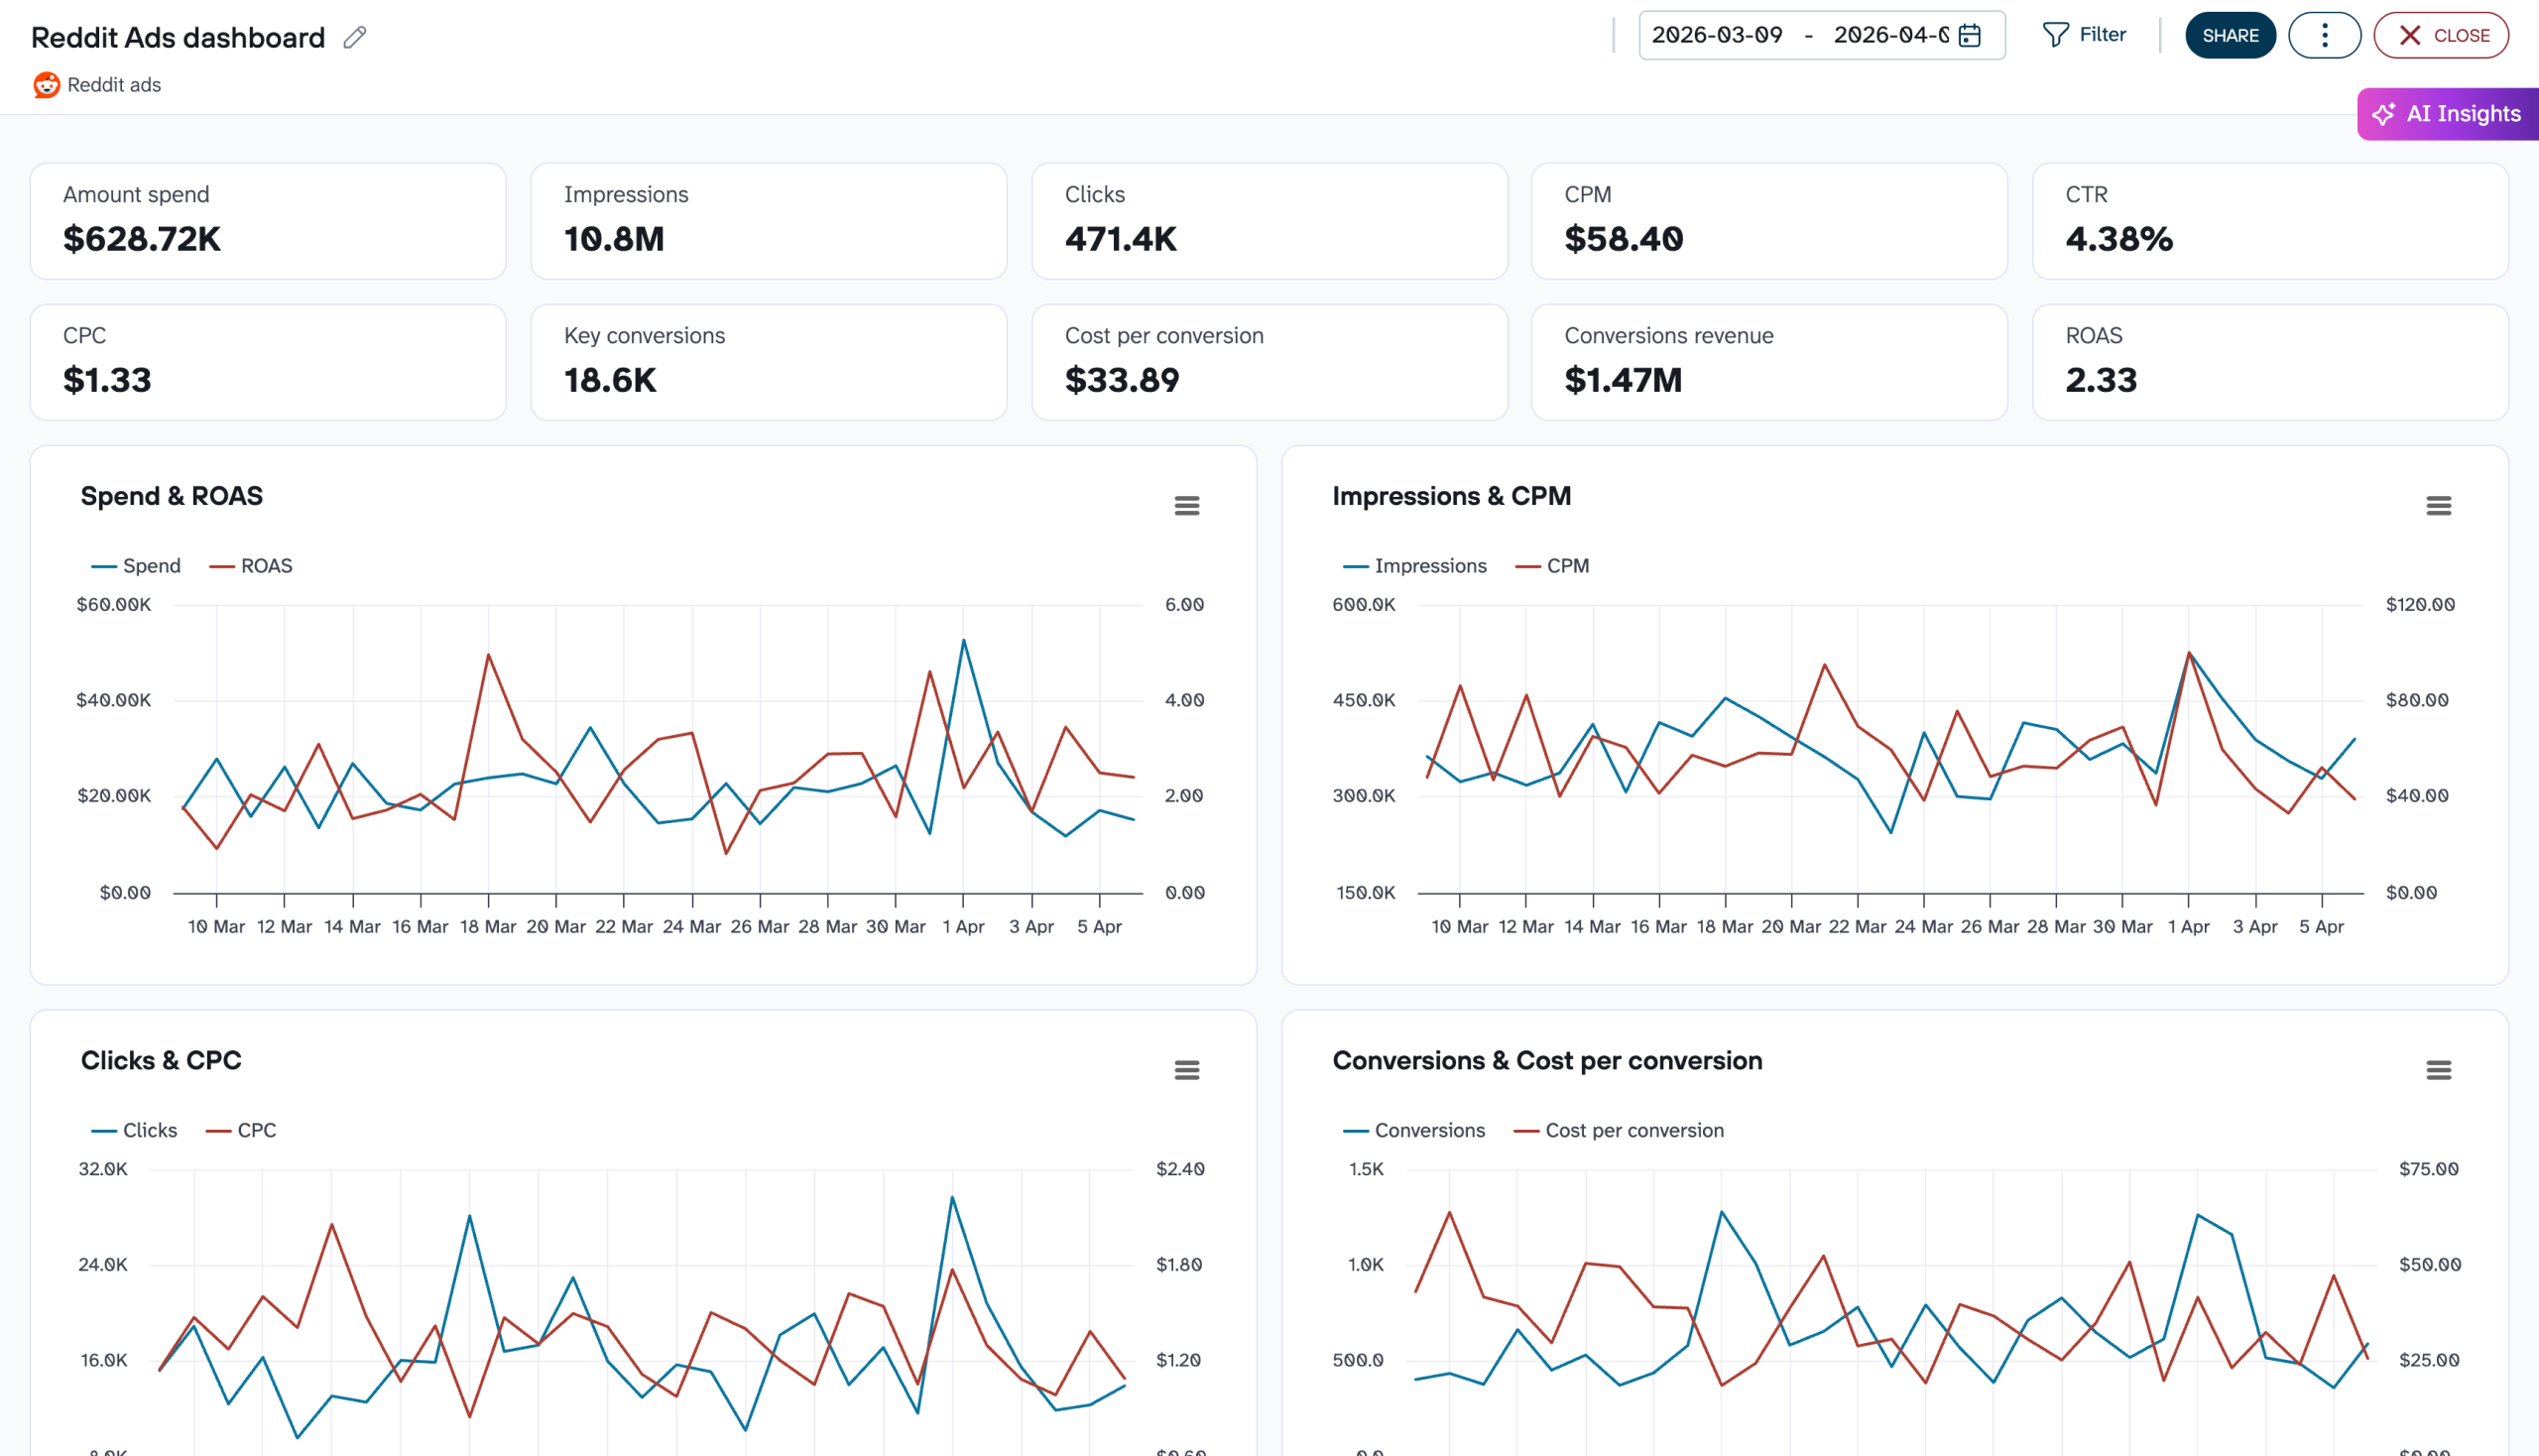
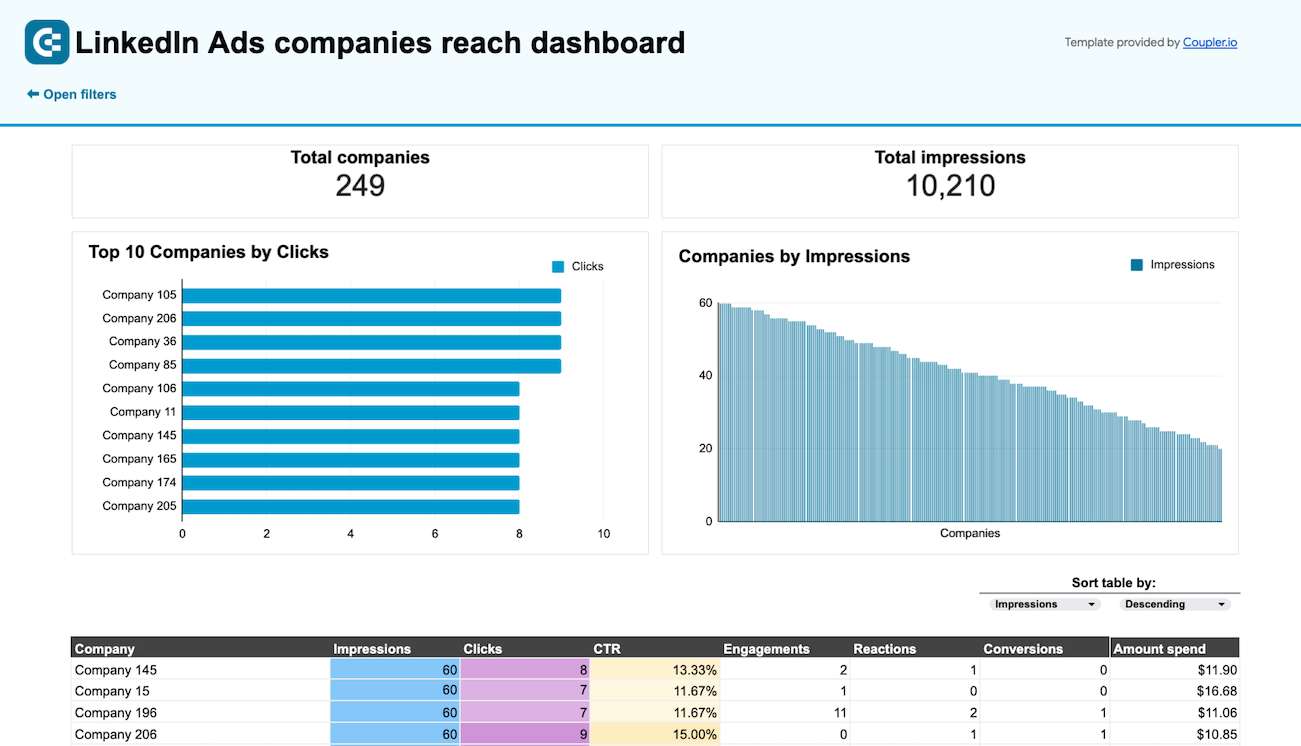
The PPC multichannel campaign dashboard consolidates data from multiple advertising platforms, allowing you to directly compare campaign performance across channels. You can evaluate Google Ads, Meta Ads, LinkedIn Ads, and other platforms side by side through unified metrics like cost per click, CTR, and conversion rates. This cross-platform visibility helps identify which channels deliver the best returns for similar campaign objectives, enabling strategic budget allocation decisions based on actual performance rather than siloed platform data.
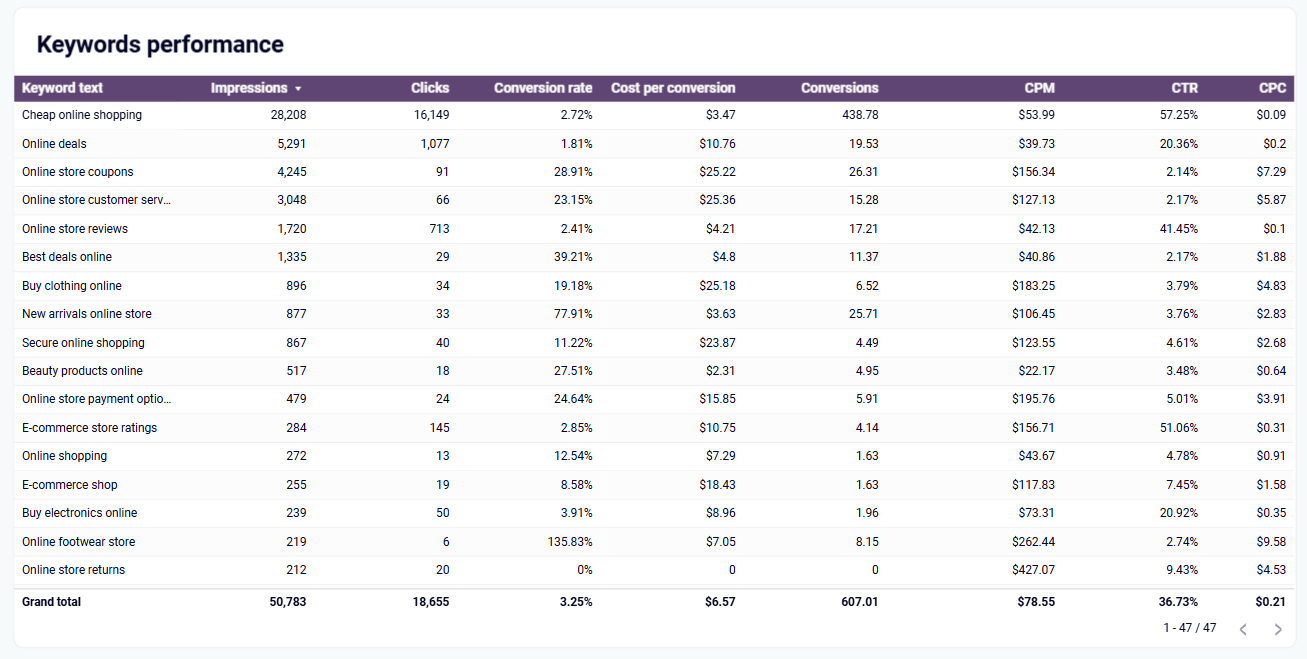
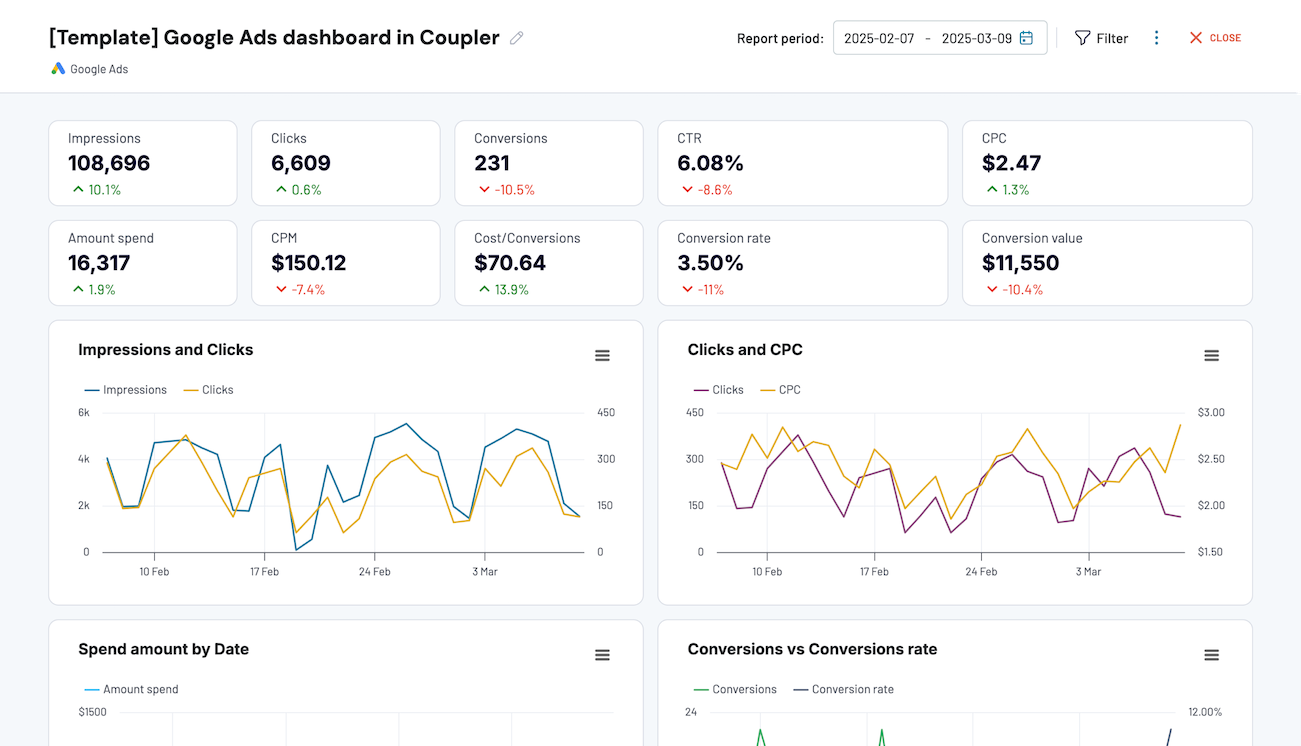
The keyword performance section provides comprehensive analysis of search term effectiveness across your entire Google Ads account. You can identify best and worst-performing keywords based on impressions, clicks, CTR, and conversion metrics. By filtering data by campaign or ad group, you can detect patterns in keyword performance and make targeted optimizations. The dashboard also tracks position changes and search impression share to spotlight growth opportunities where increased visibility could drive better results.

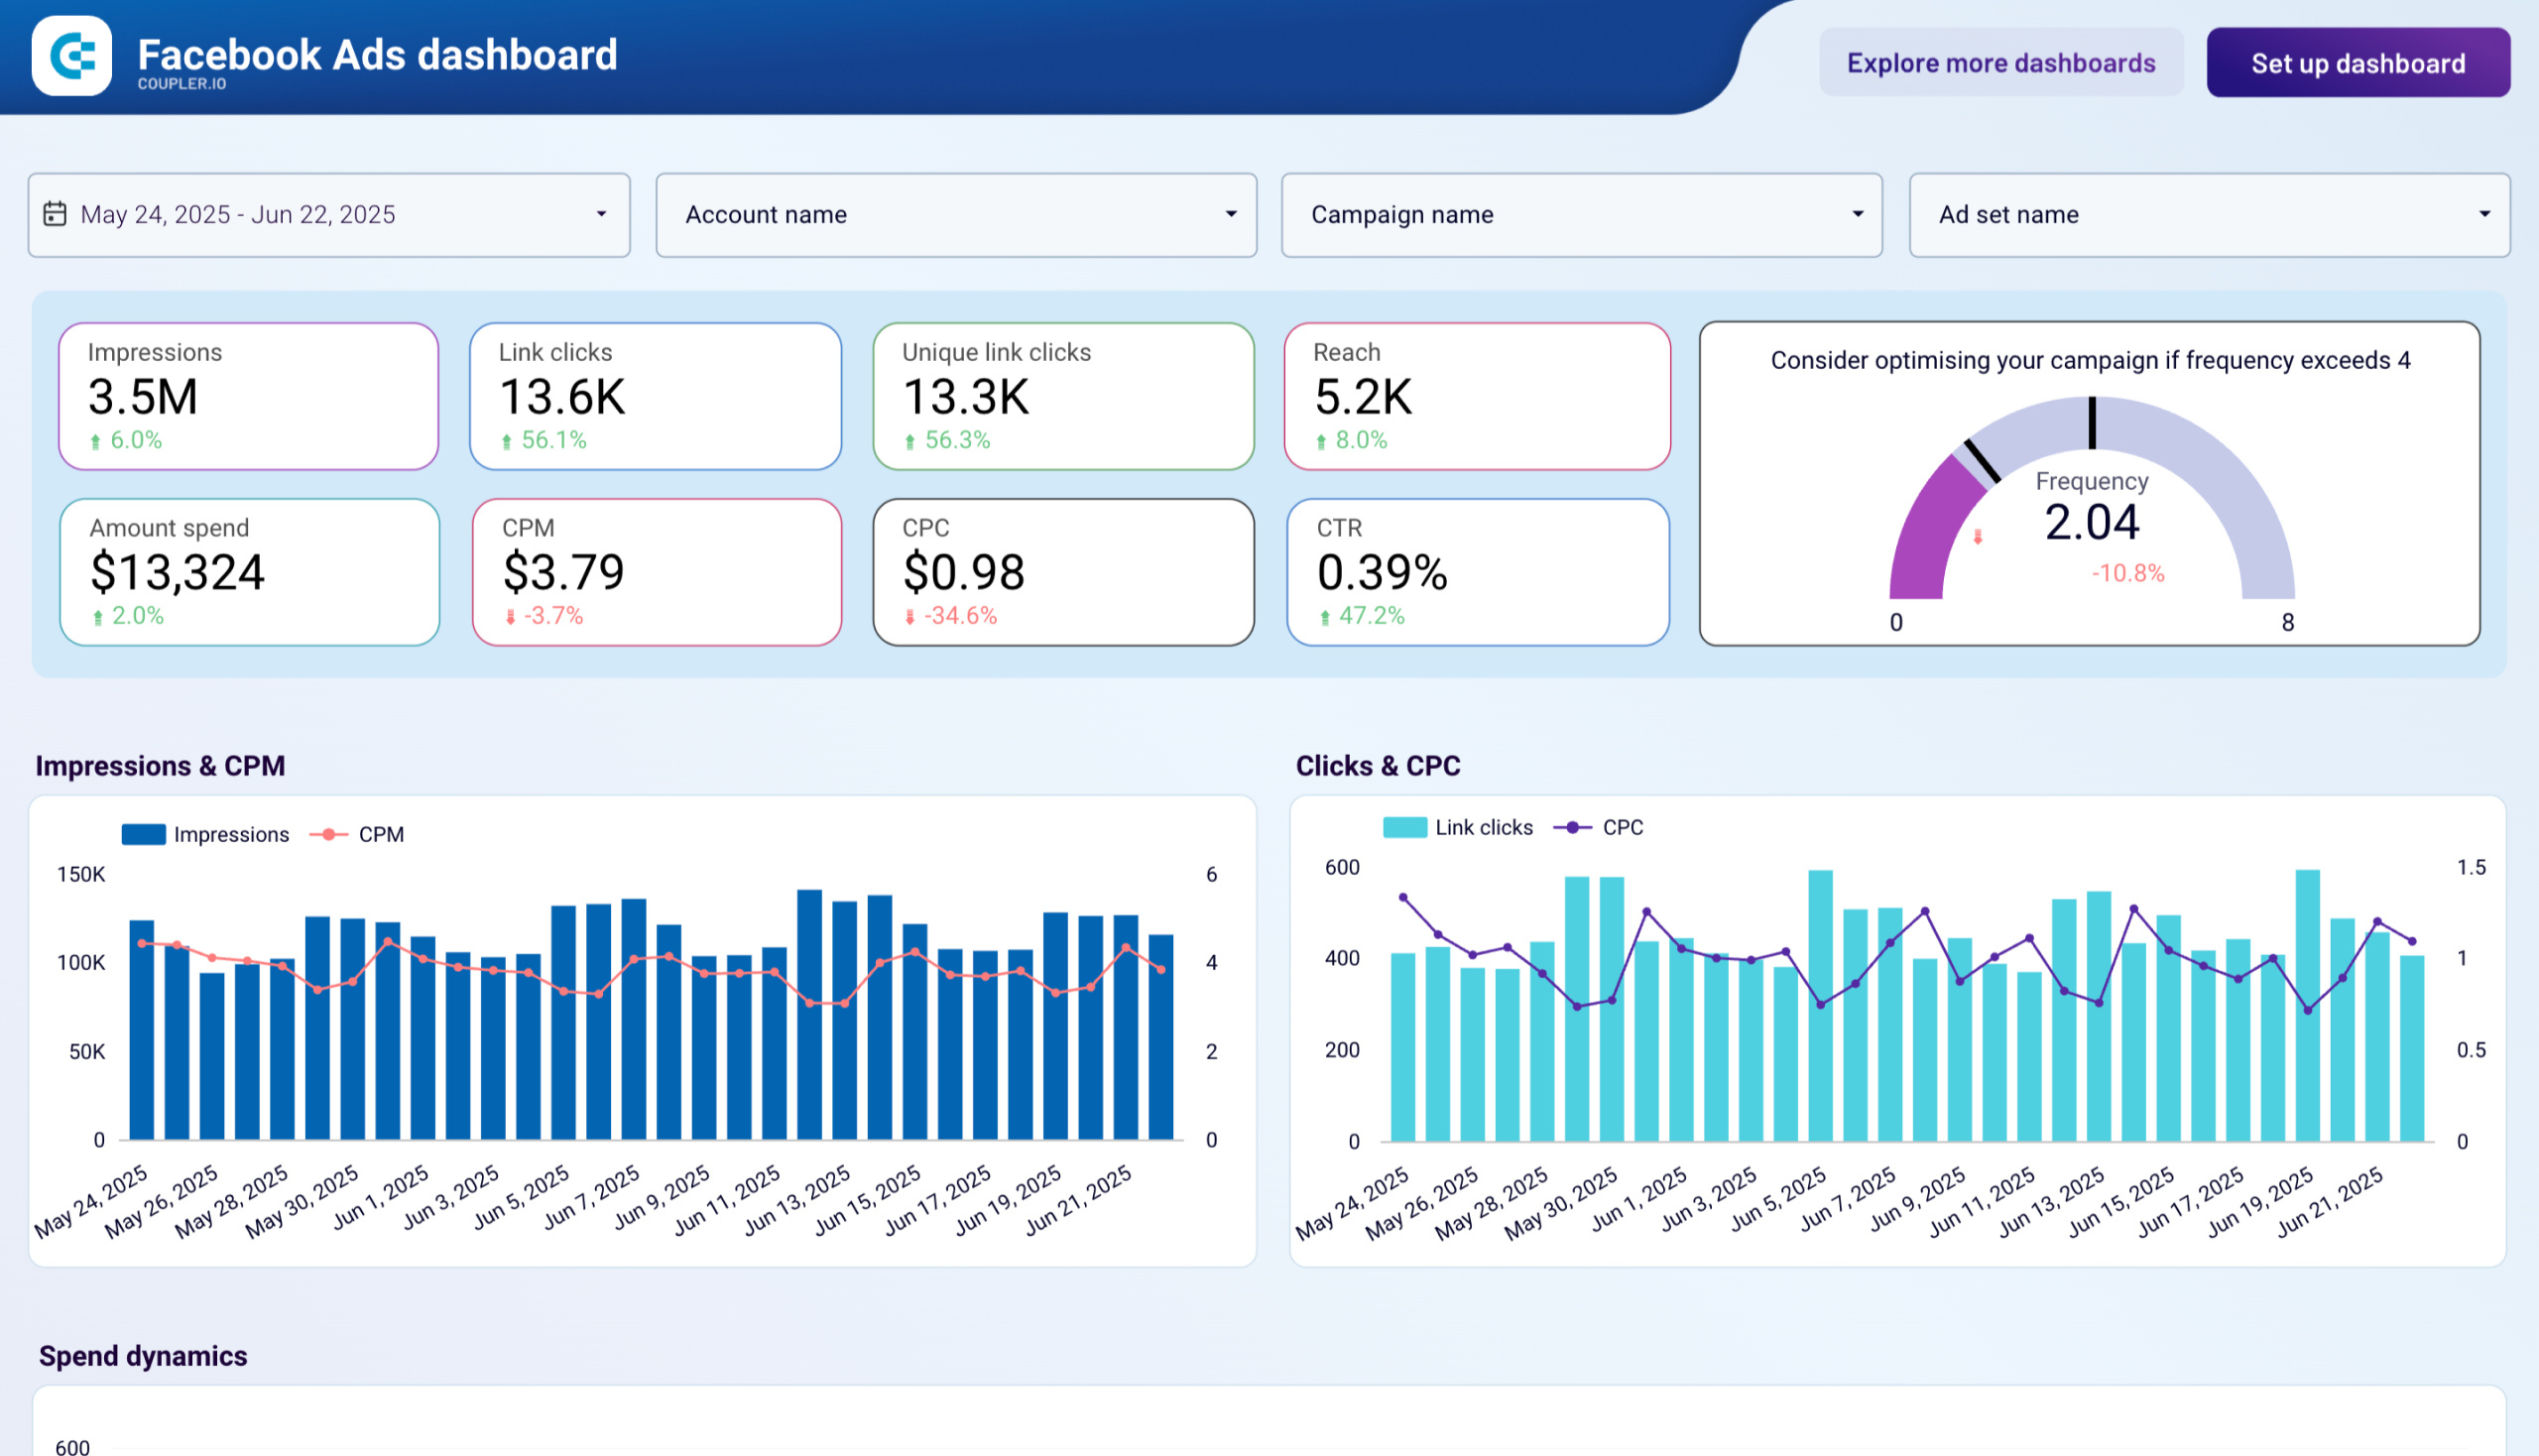
The creative performance visualization enables direct comparison of ad effectiveness across different platforms. The multi-channel creatives dashboard shows how similar messaging and visuals perform on Google, Meta, LinkedIn and other channels. You can identify which creative approaches work better on specific platforms and understand patterns in audience engagement. This insight helps tailor your creative strategy to each platform's unique environment and audience behavior, optimizing both messaging and format for maximum impact.
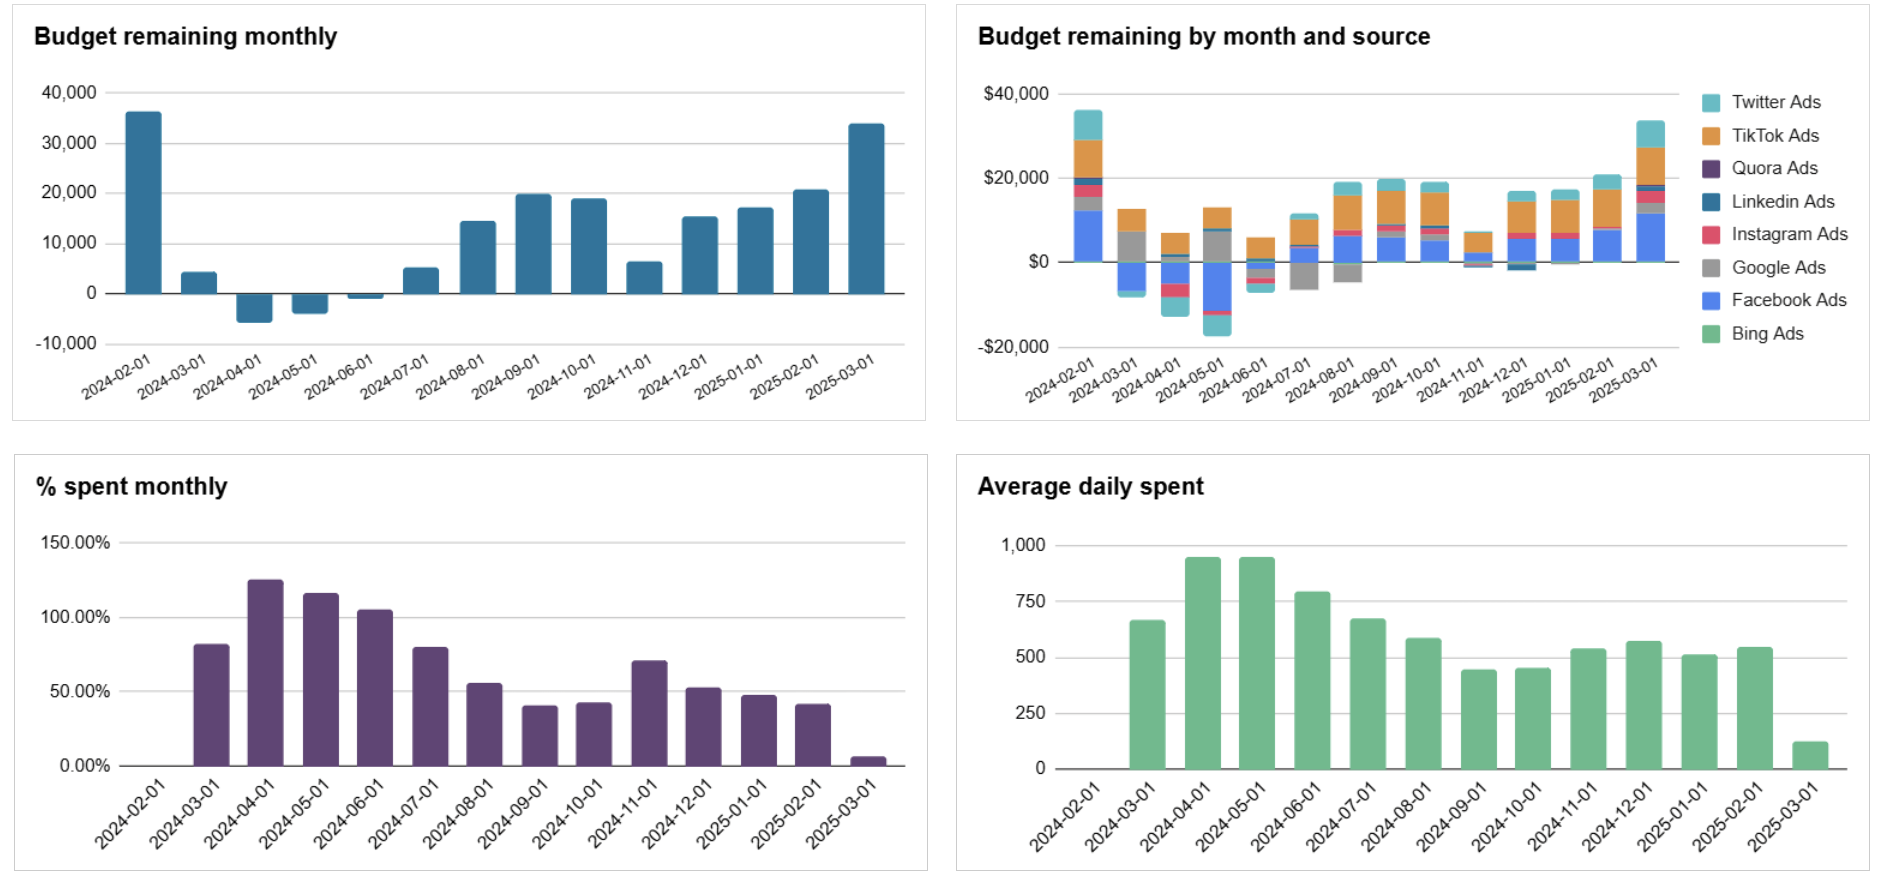
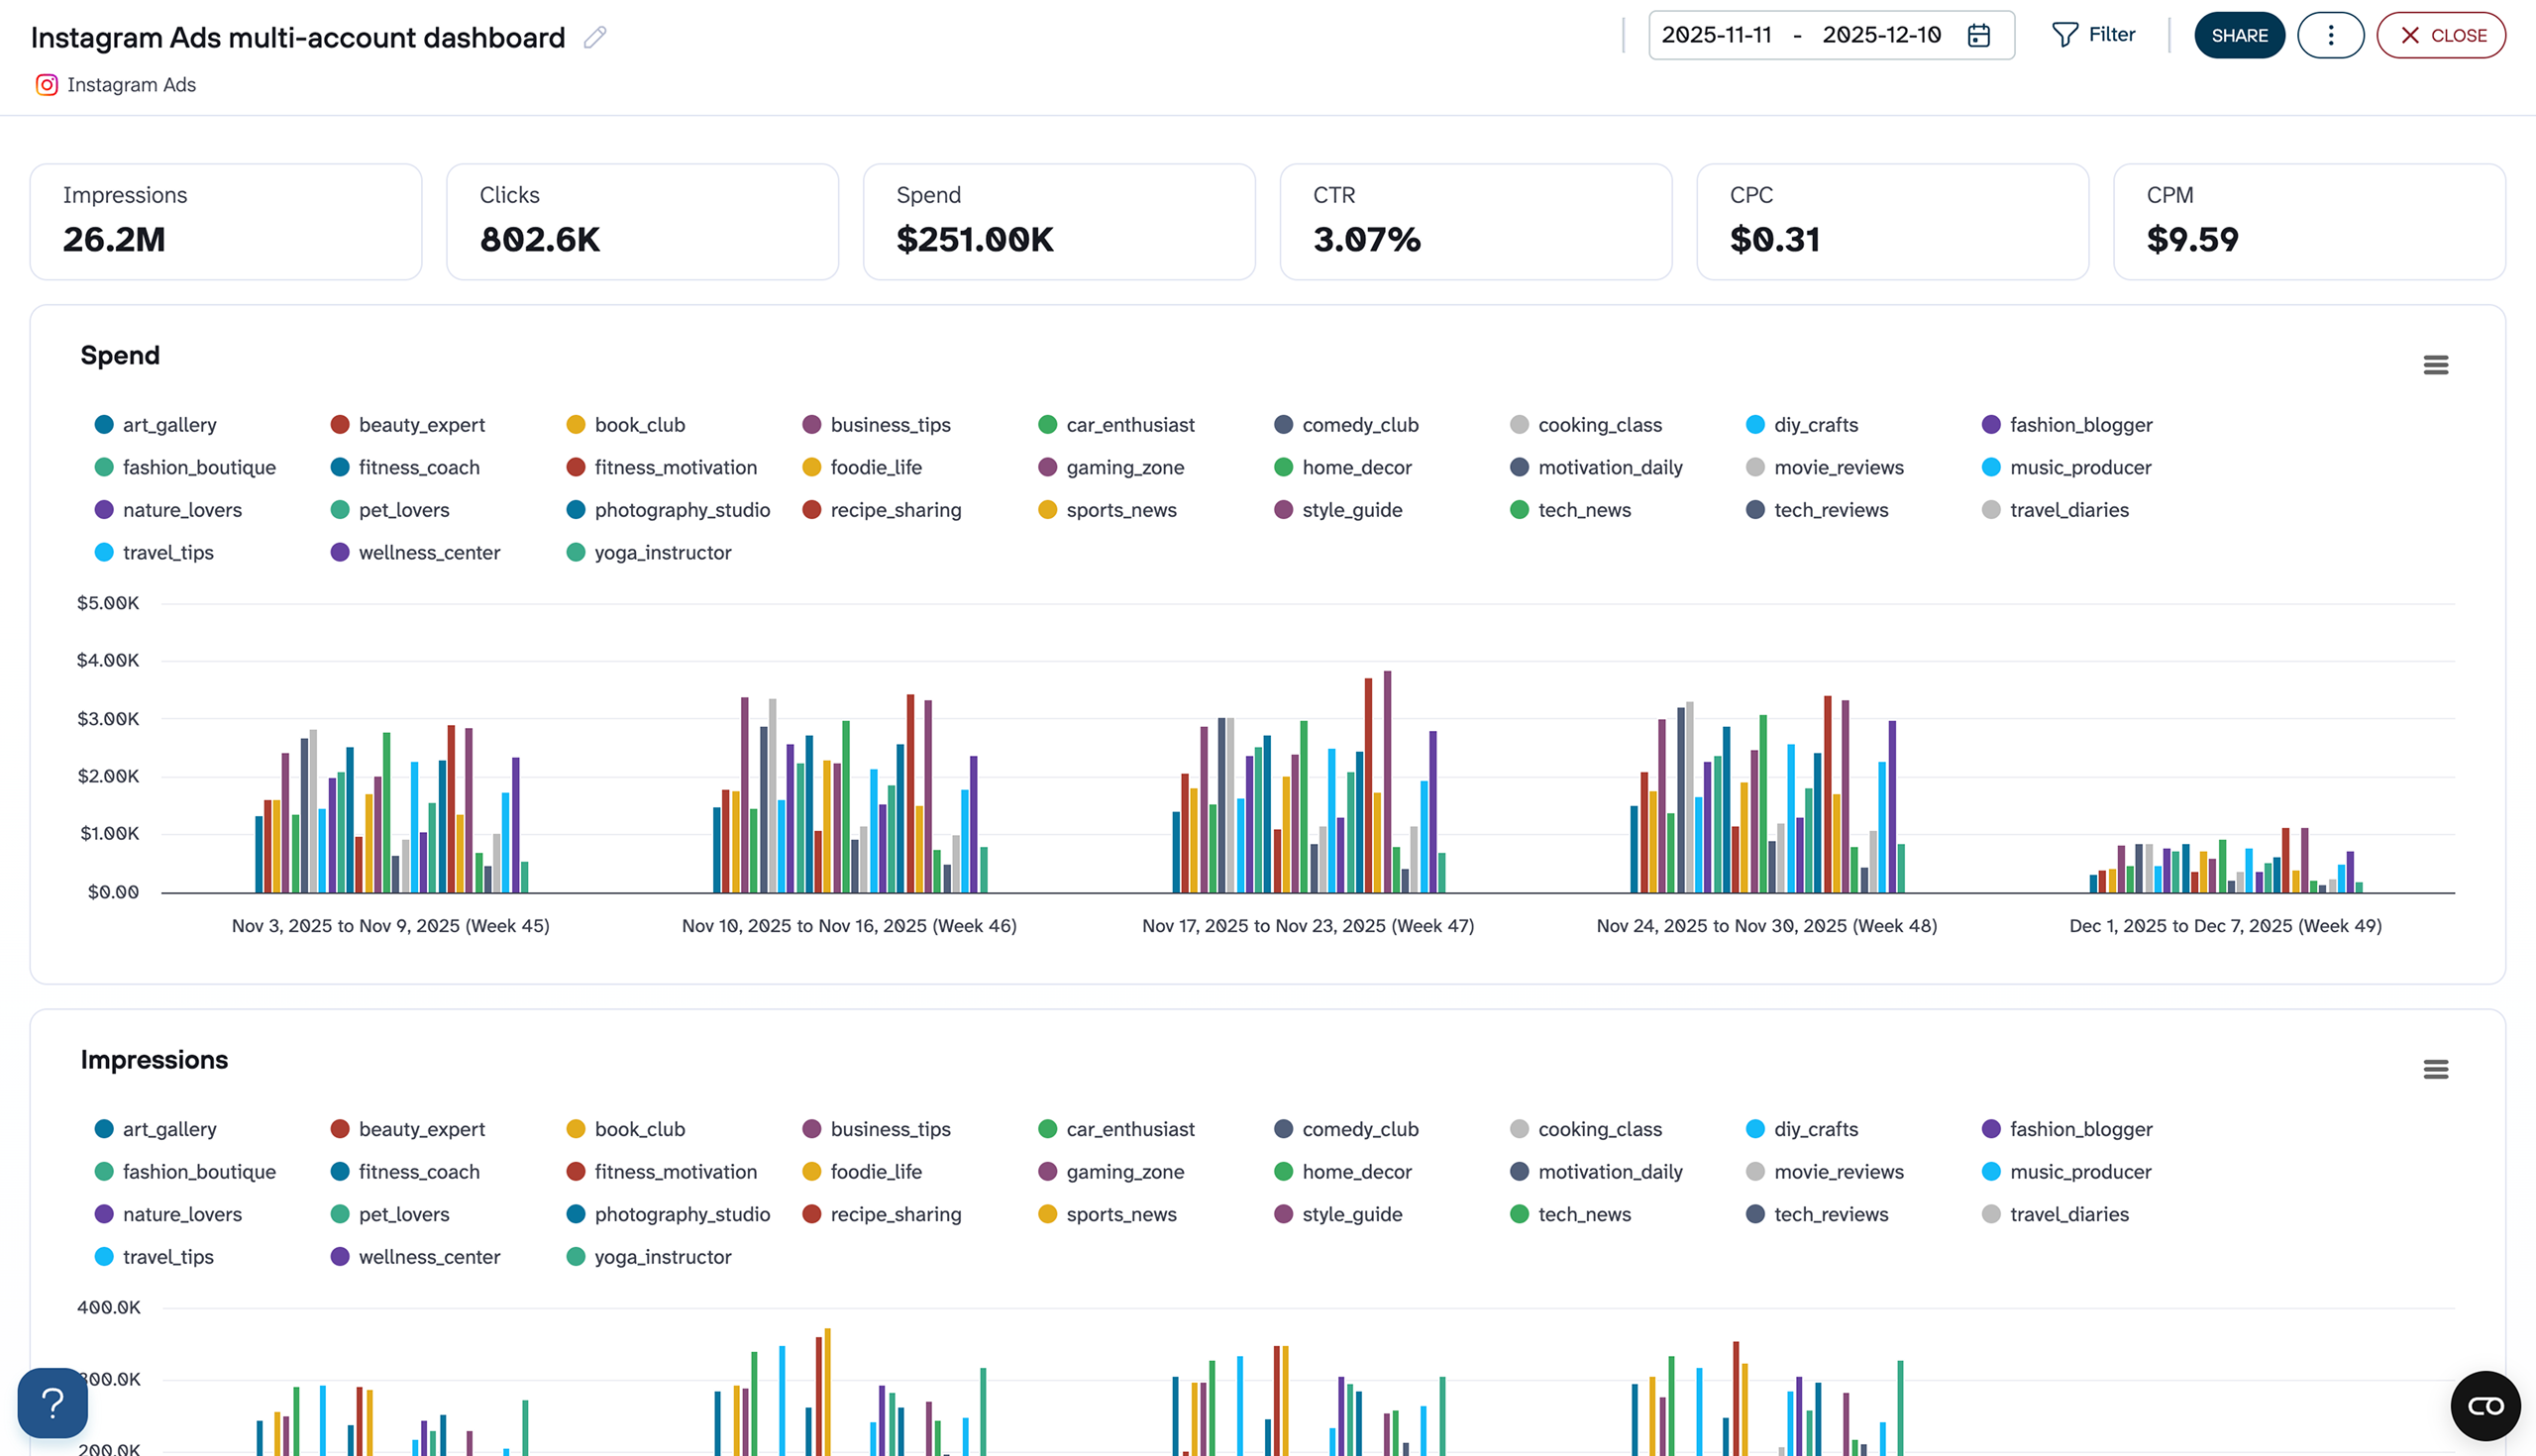
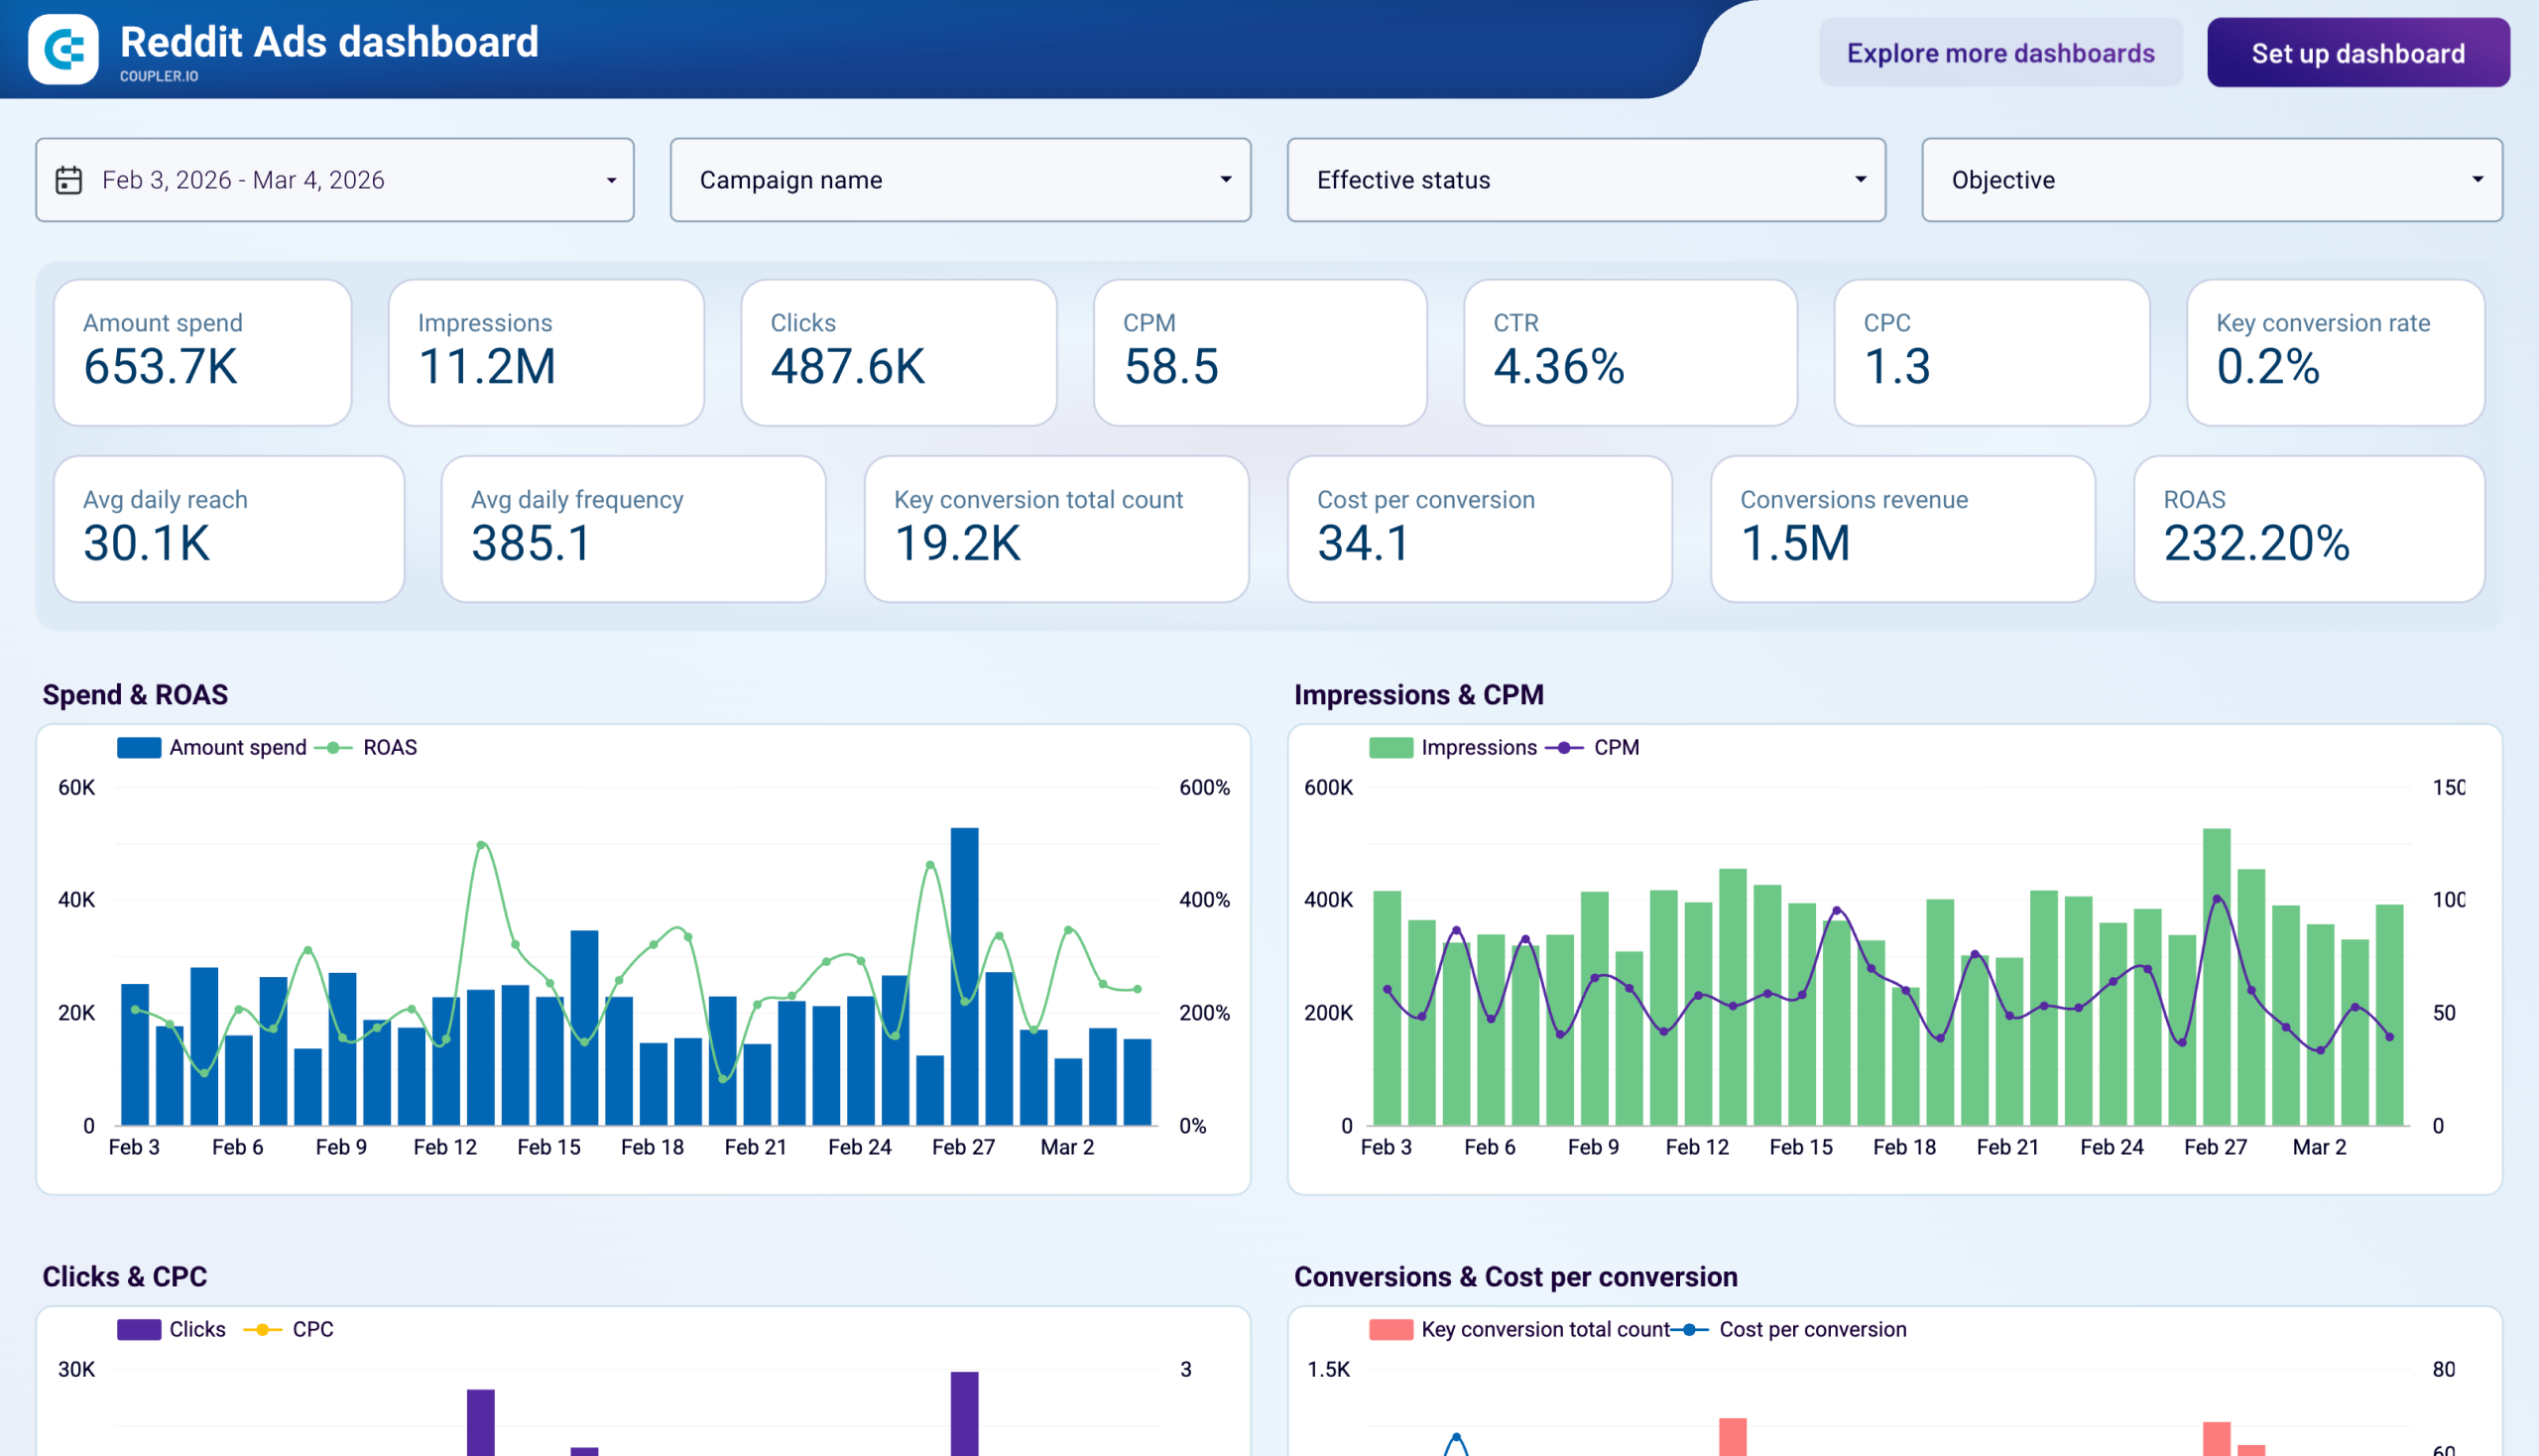
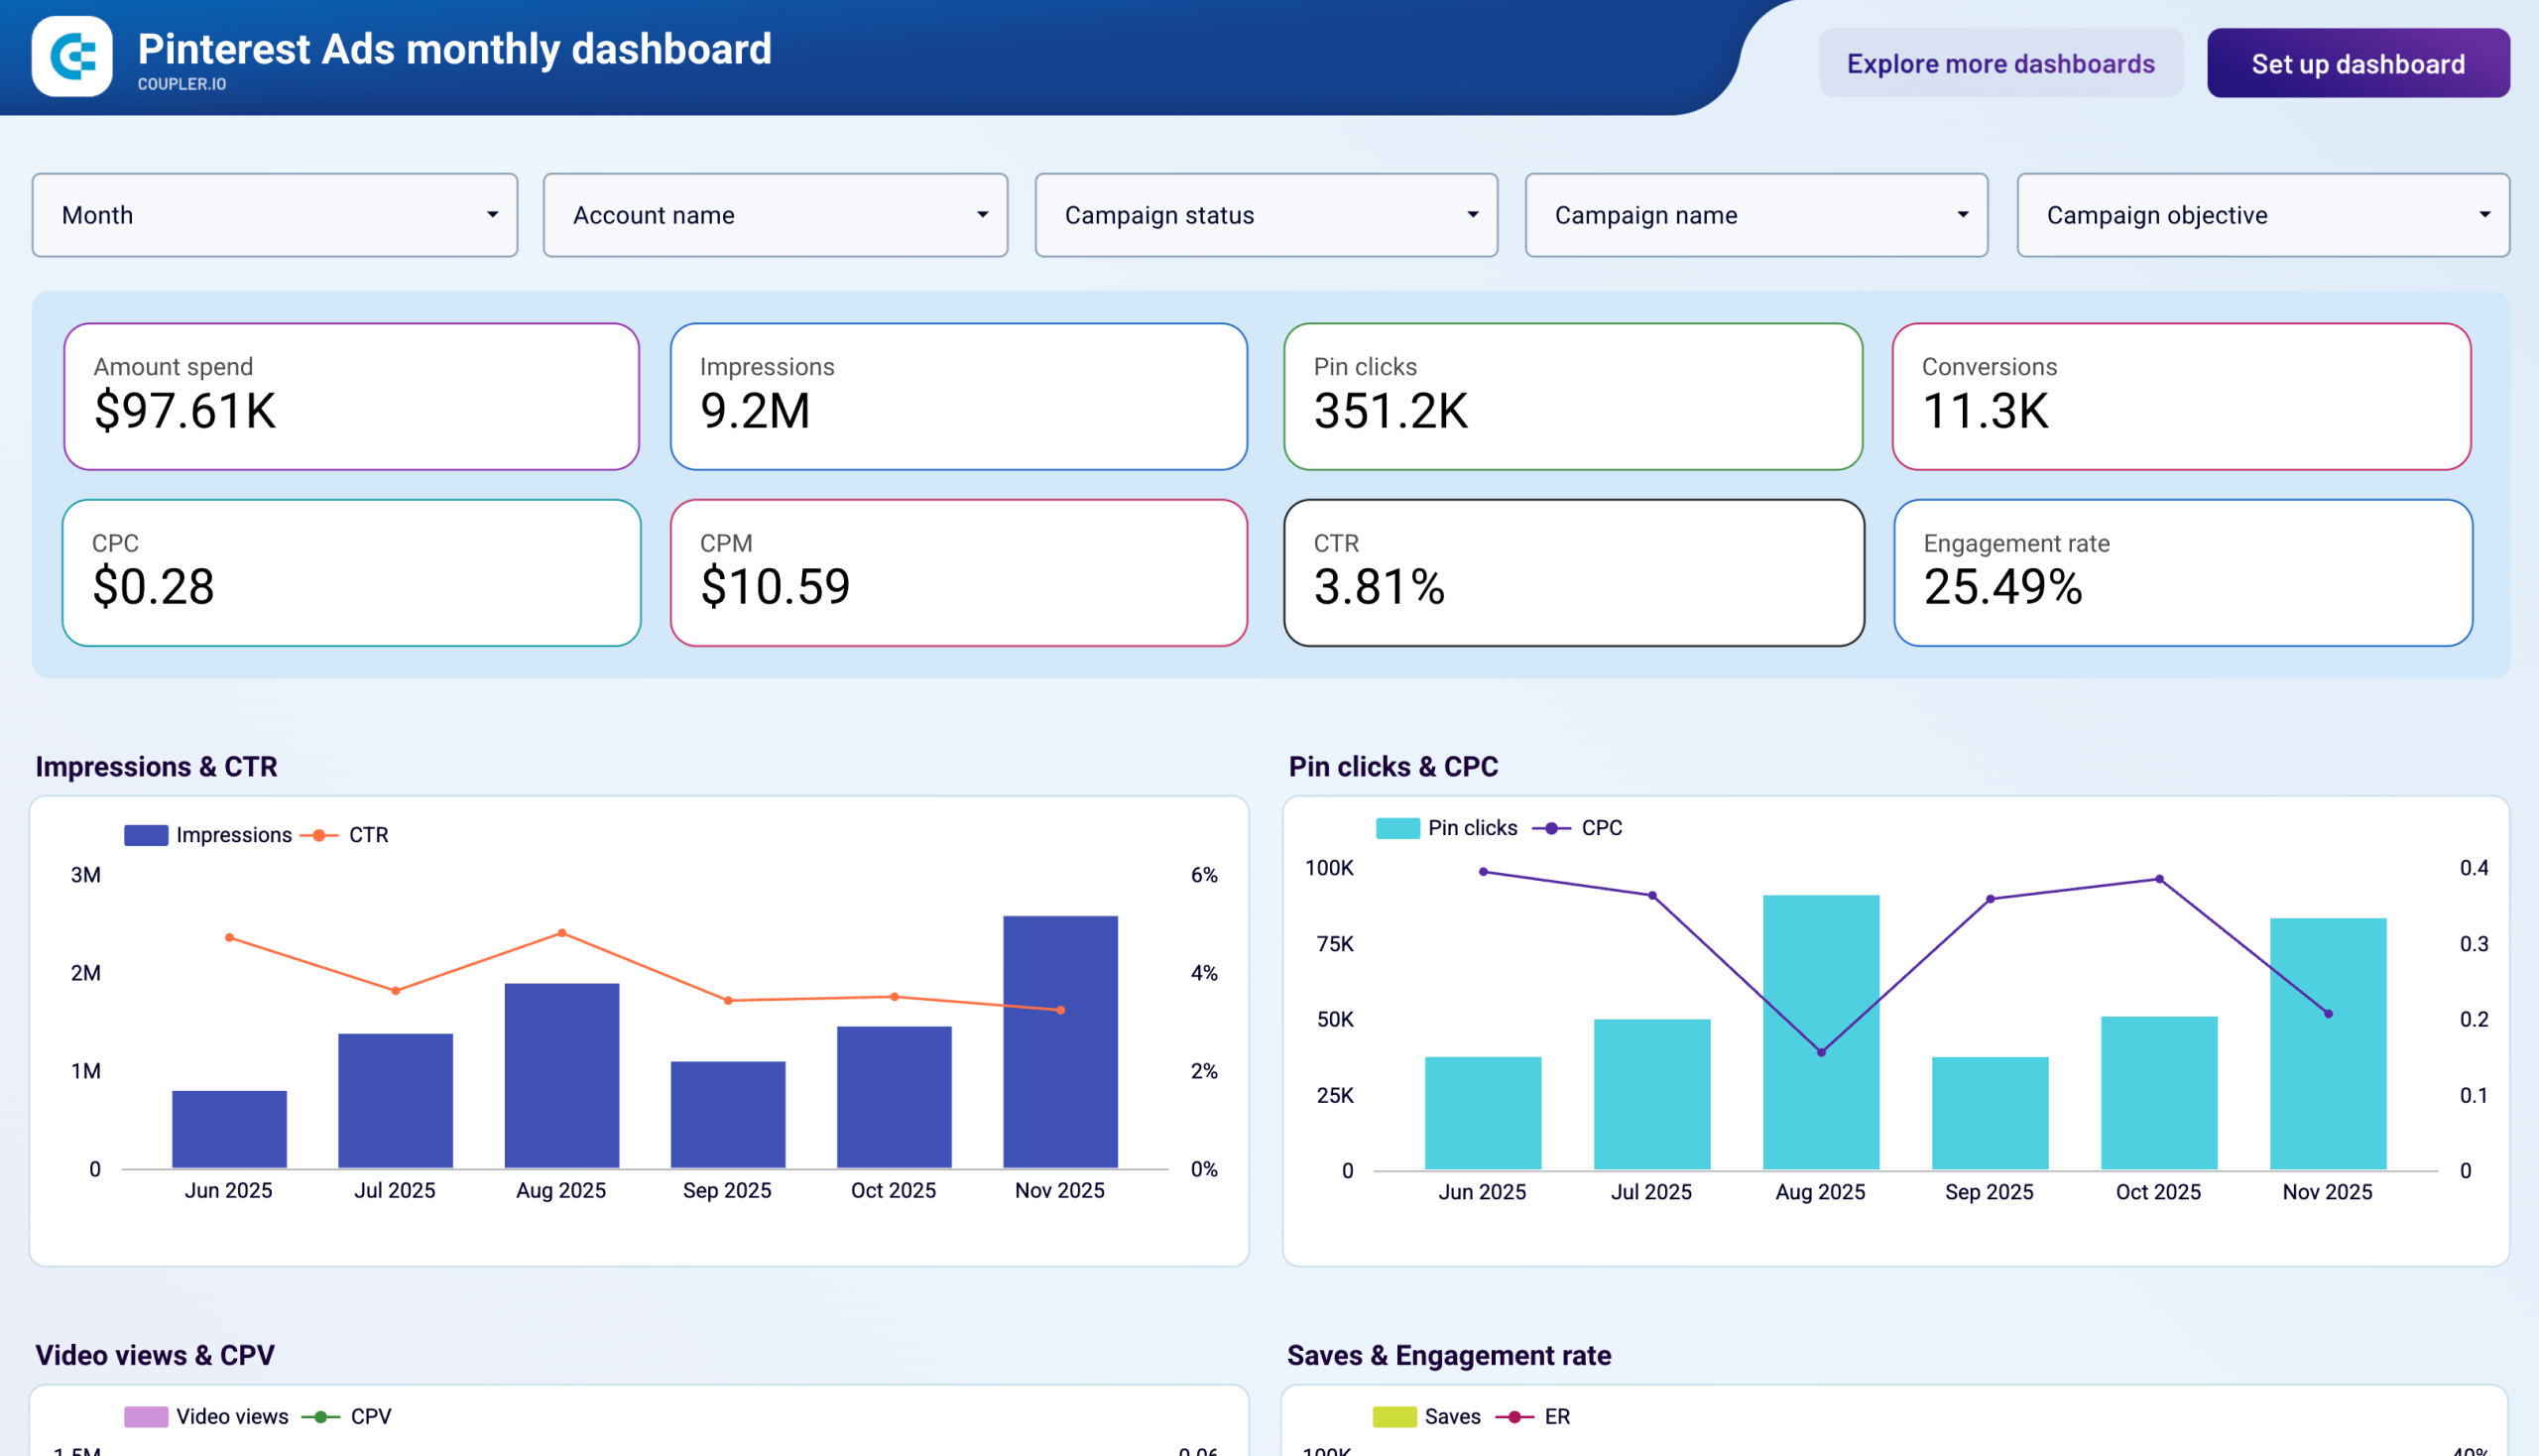
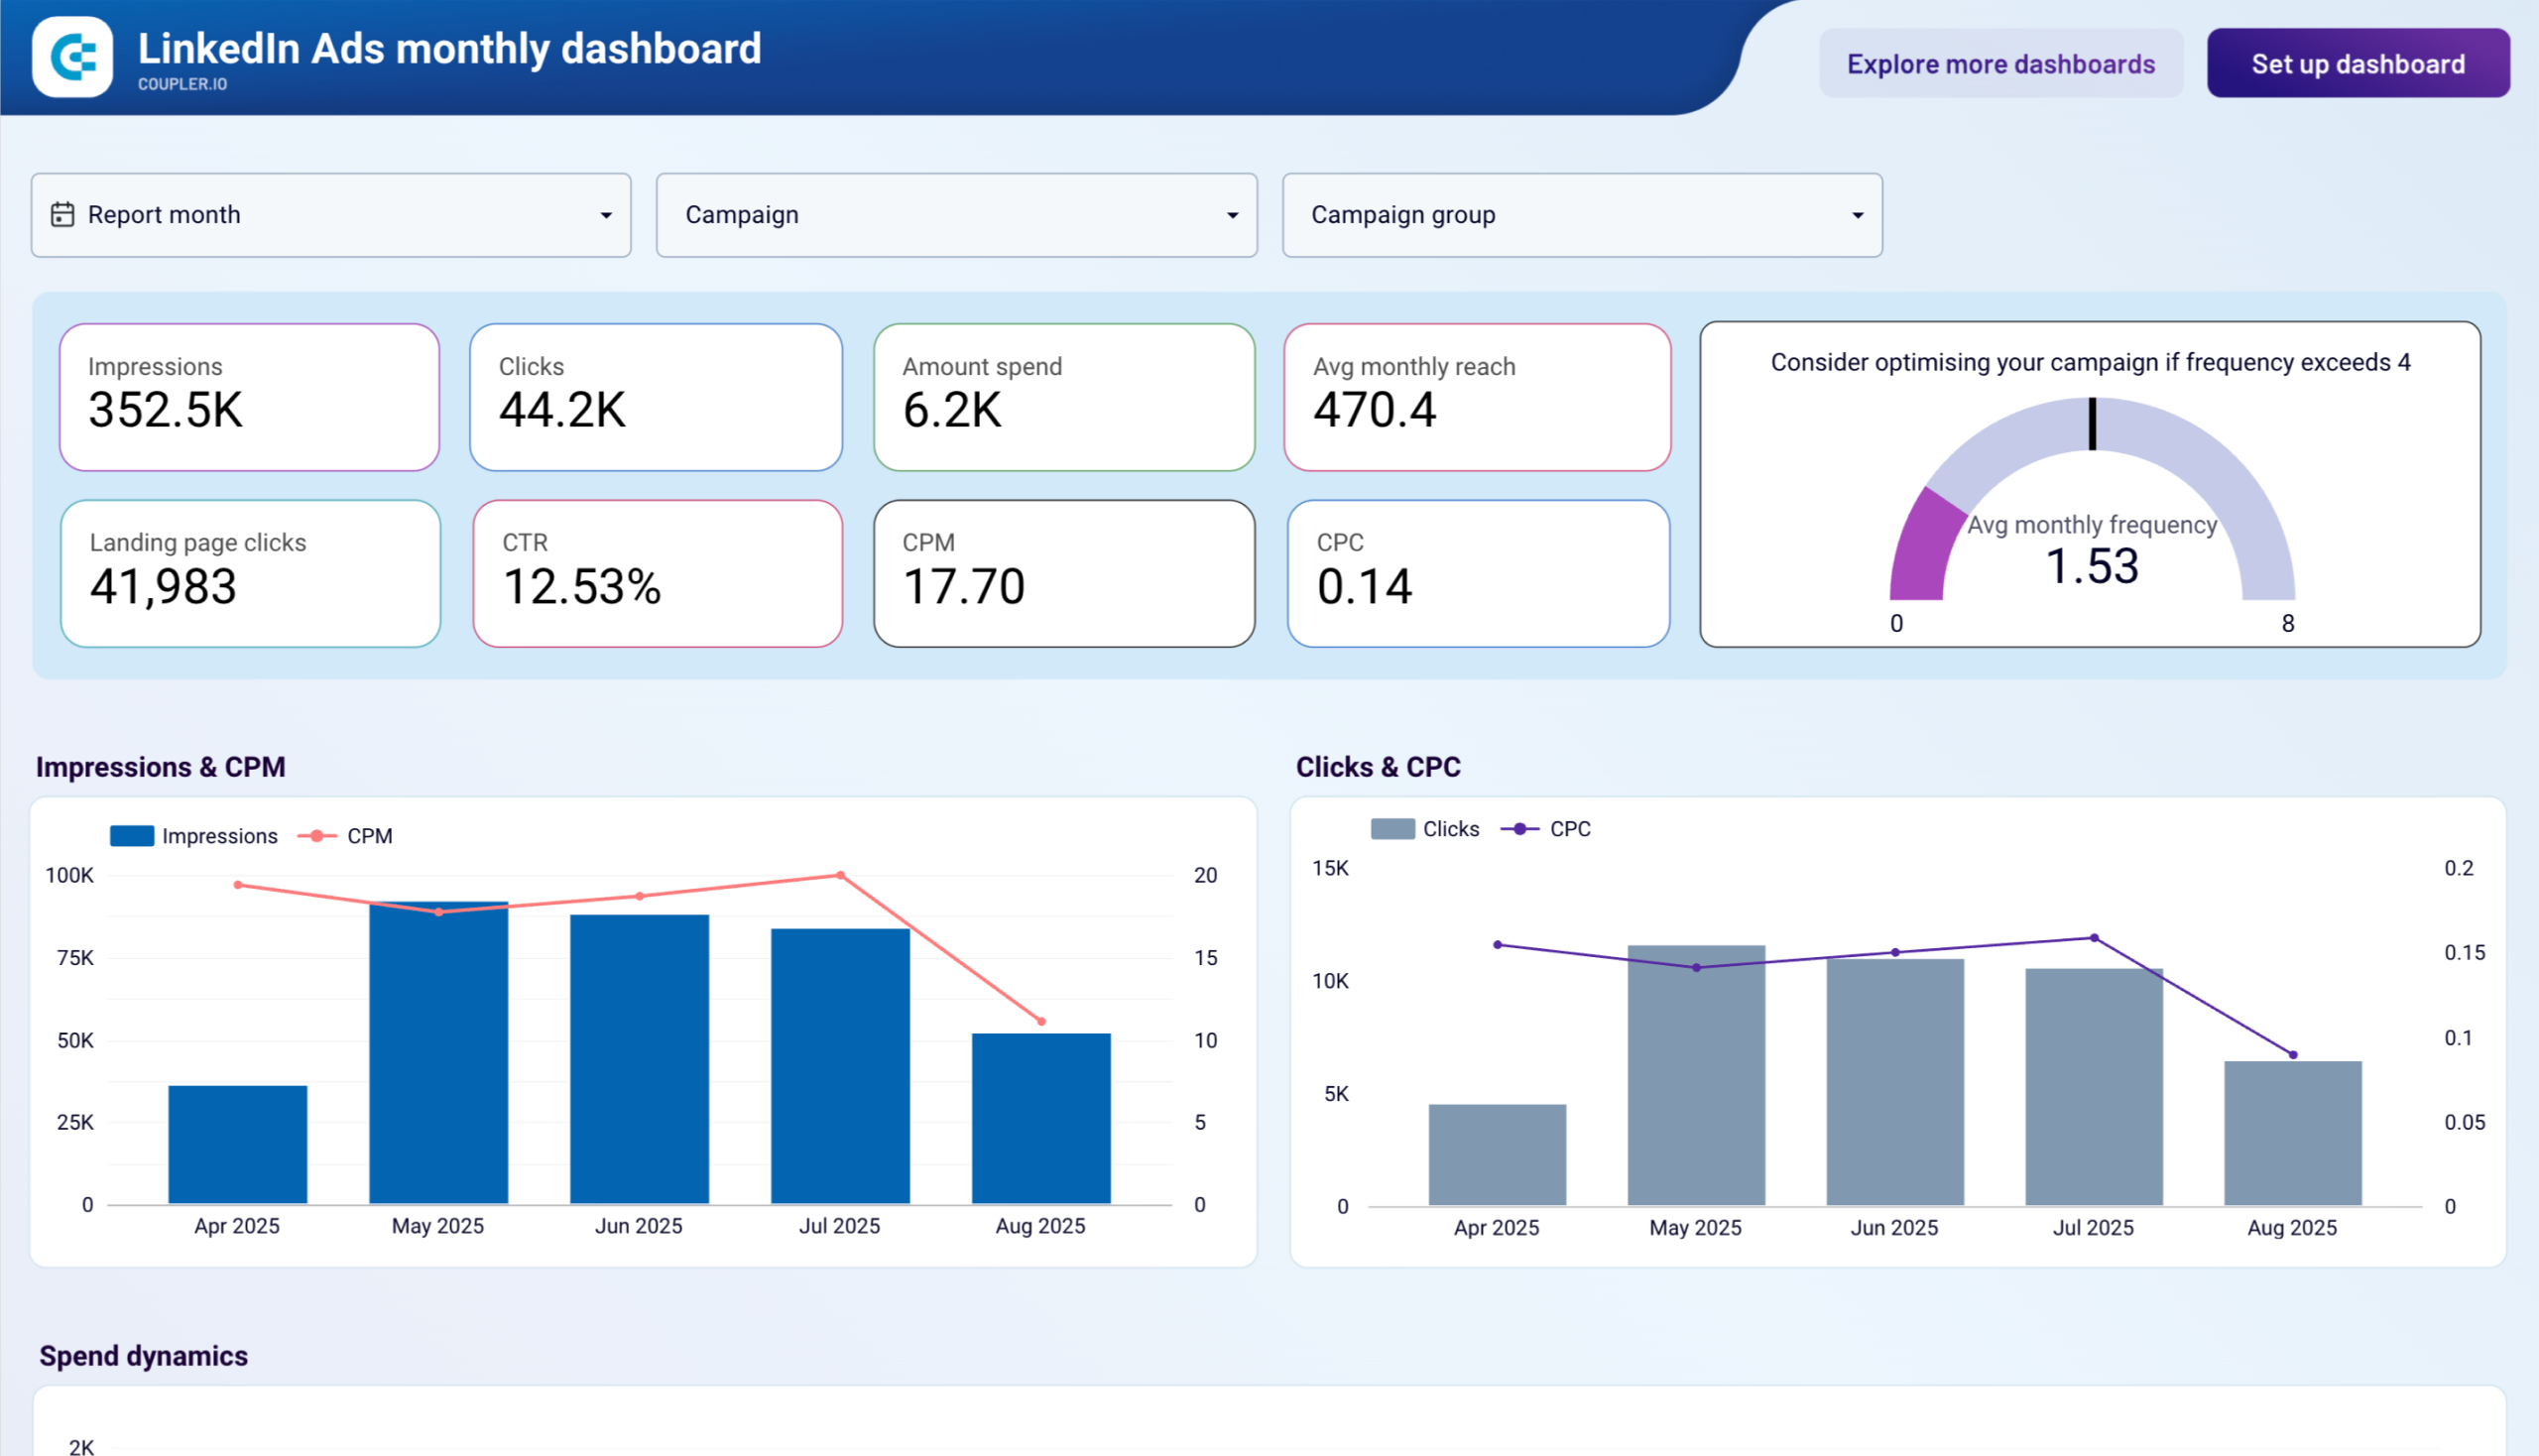
The budget analysis section provides clear visualization of advertising spend distribution across all your marketing platforms. The PPC monthly budget dashboard tracks actual expenditure against allocated budgets for each channel, with trend analysis showing spending patterns over time. The dashboard highlights platforms consuming disproportionate budget relative to performance and identifies channels delivering better cost efficiency. This transparency helps optimize resource allocation, prevent overspending, and ensure investment aligns with performance outcomes across your advertising ecosystem.
How to create PPC dashboards?

Metrics you can track with the PPC dashboard template
Request custom dashboard
From building custom dashboards to setting up data analytics from scratch, we're here to help you succeed. Contact us to discuss your case and possible solutions
Contact us