P&L dashboard examples and reporting templates
Master your company's profitability story with automated P&L reporting dashboards that go beyond basic income statements. Uncover revenue opportunities, spot cost inefficiencies, and track profit margins with dynamic visualizations that update automatically based on the data from your QuickBooks or Xero account.
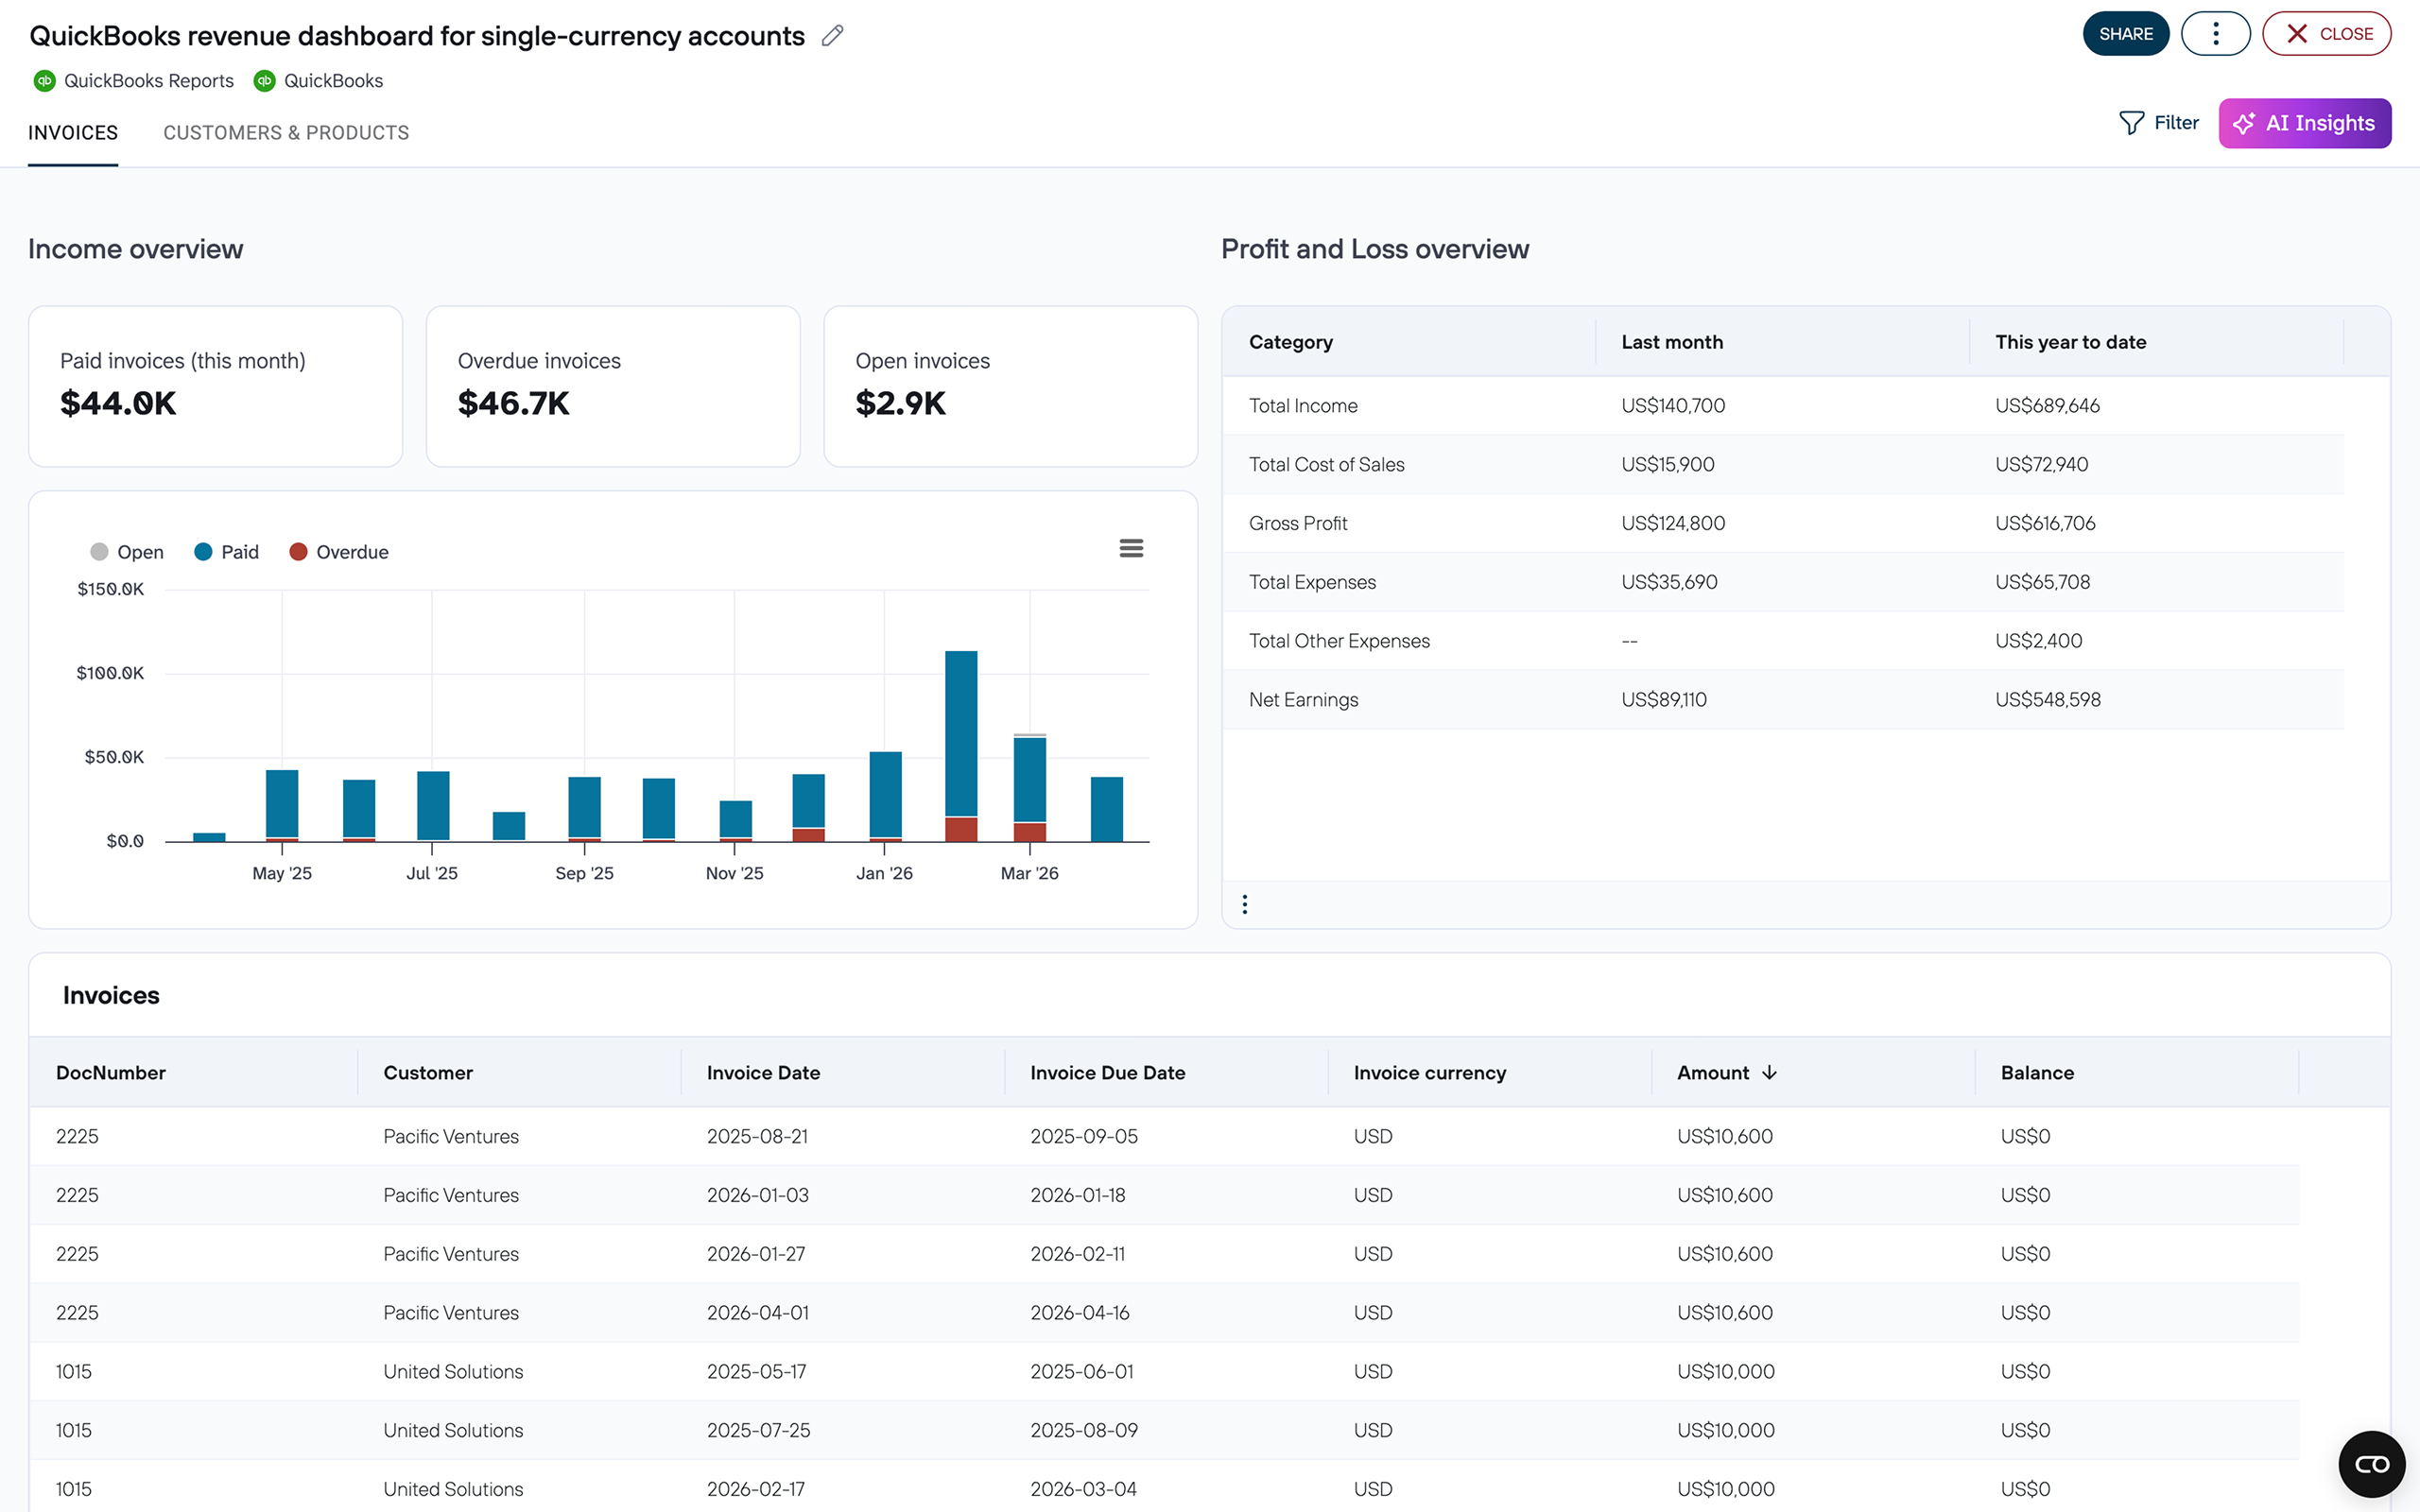
P&L dashboard examples for every need


about your case. It doesn't cost you a penny 😉
What is a profit and loss dashboard?

Choose your P&L dashboard template to kick off
What should be included on P&L dashboards?
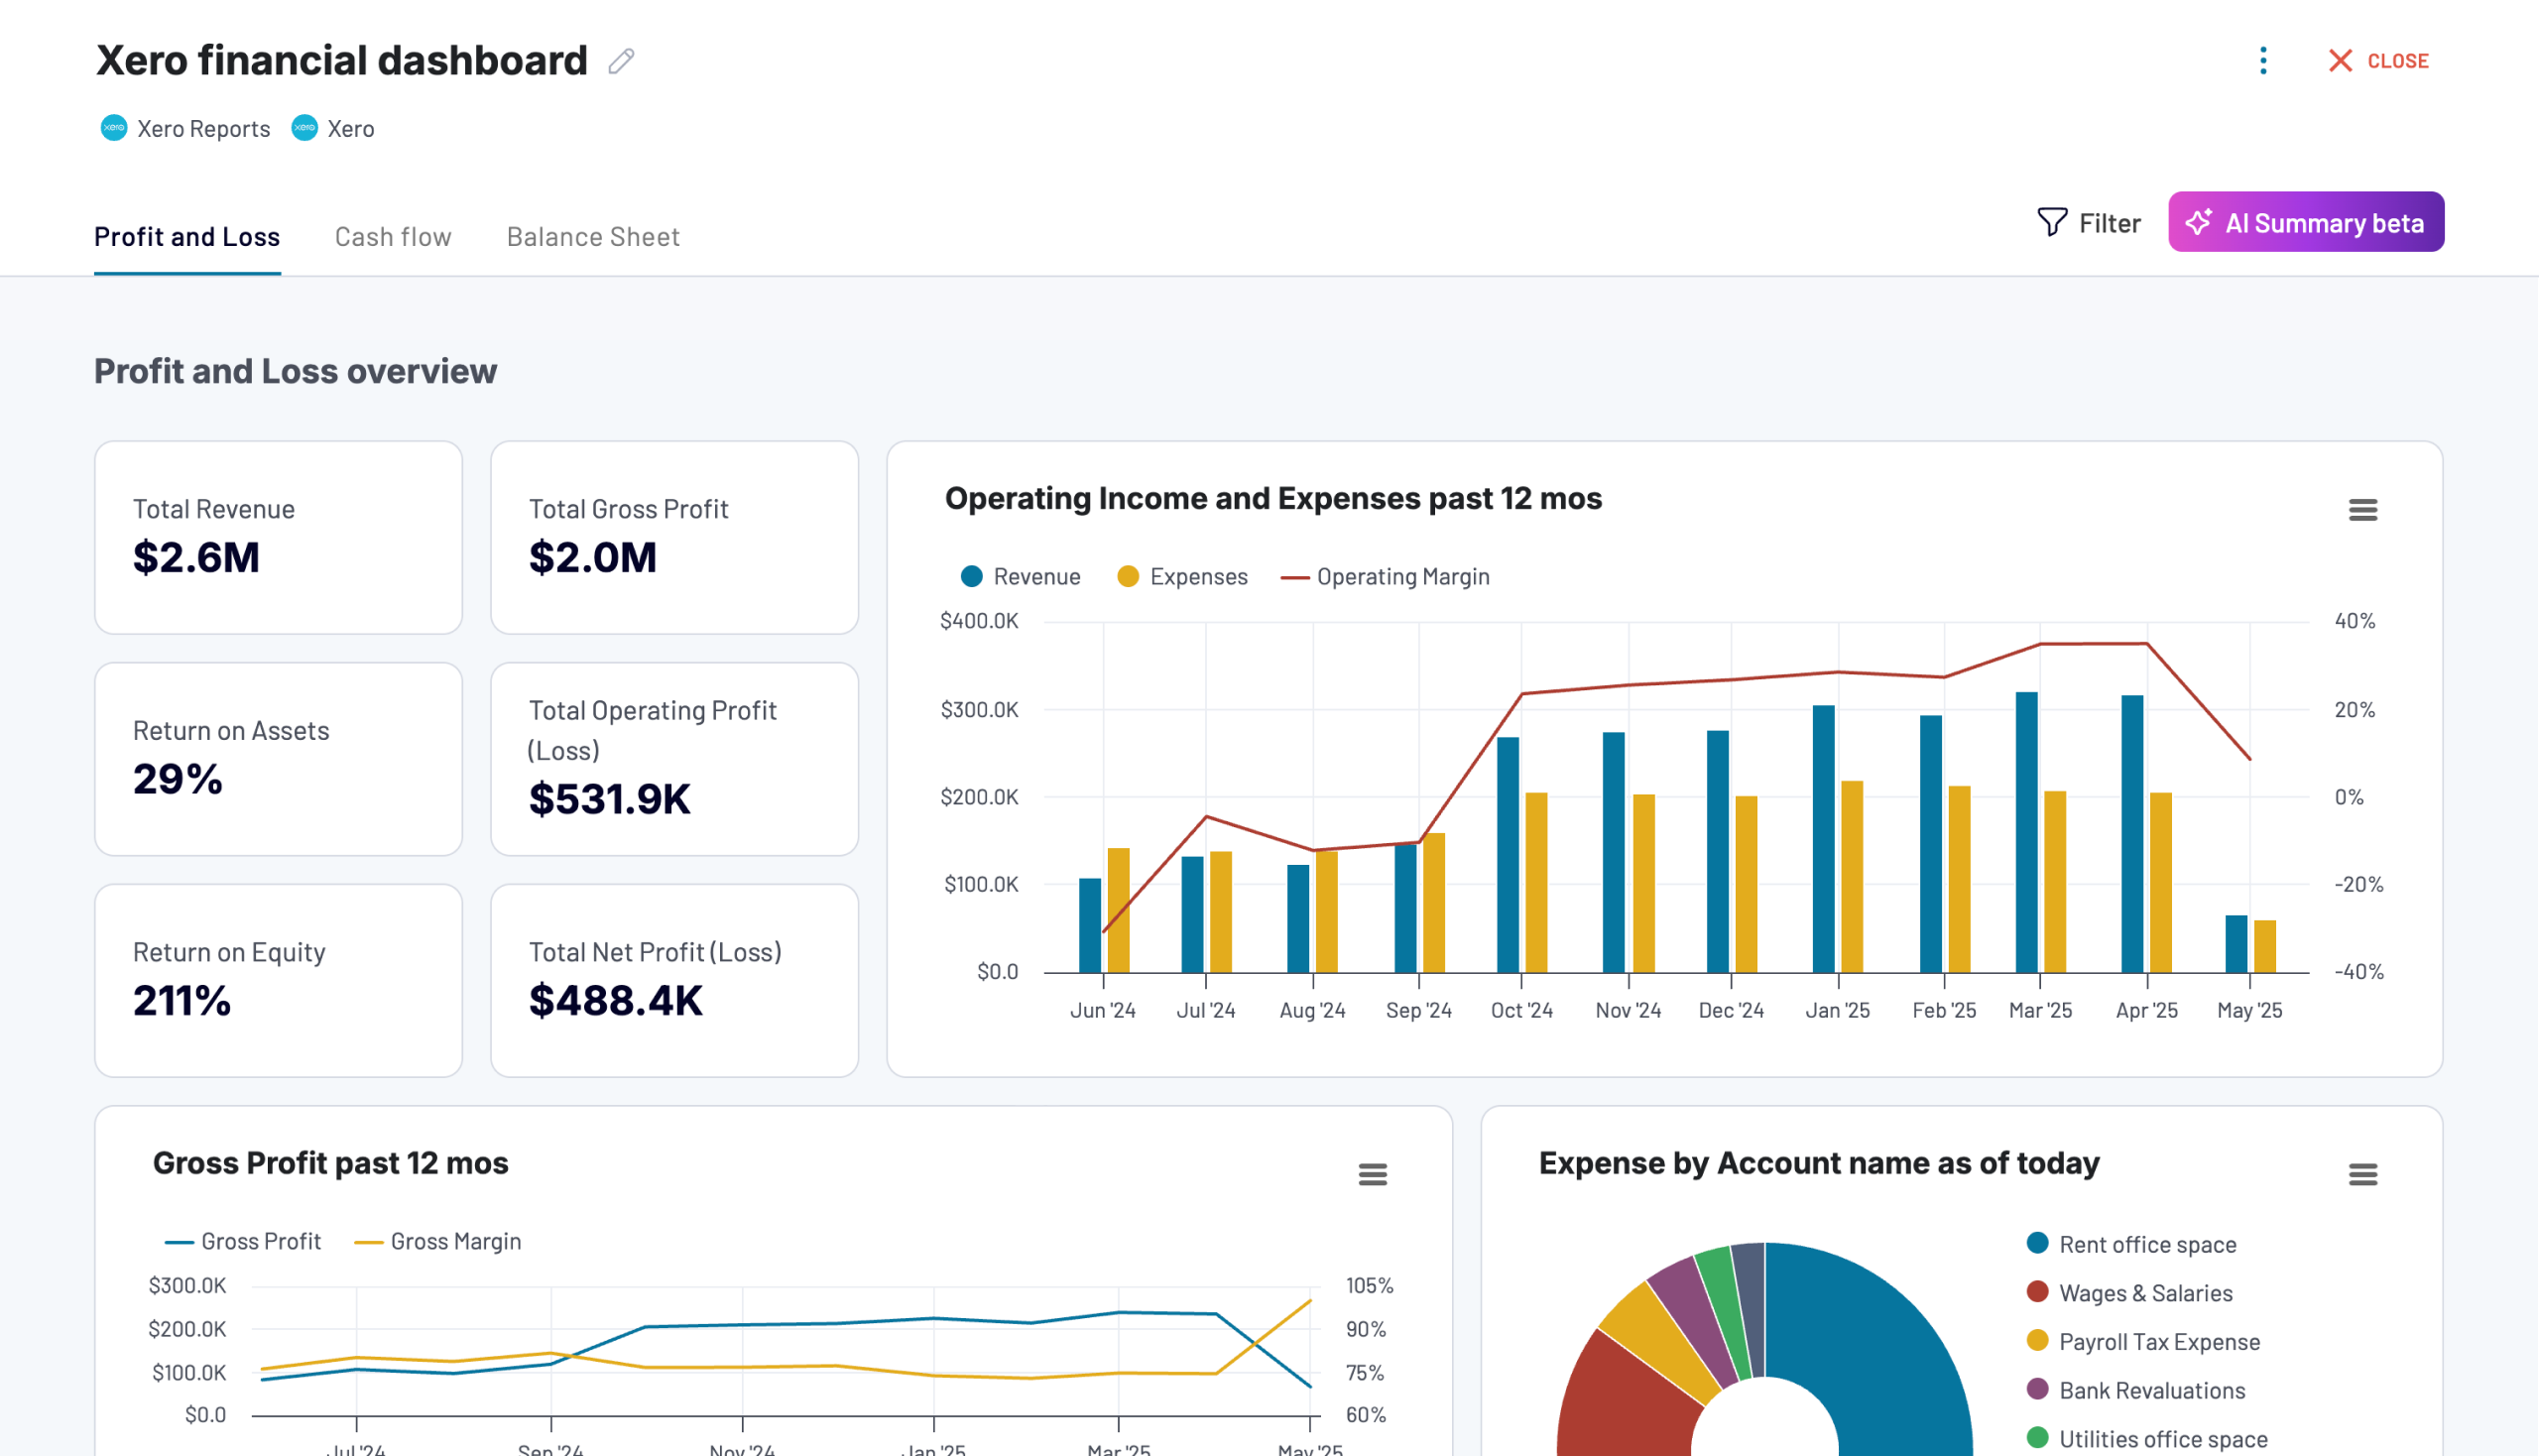
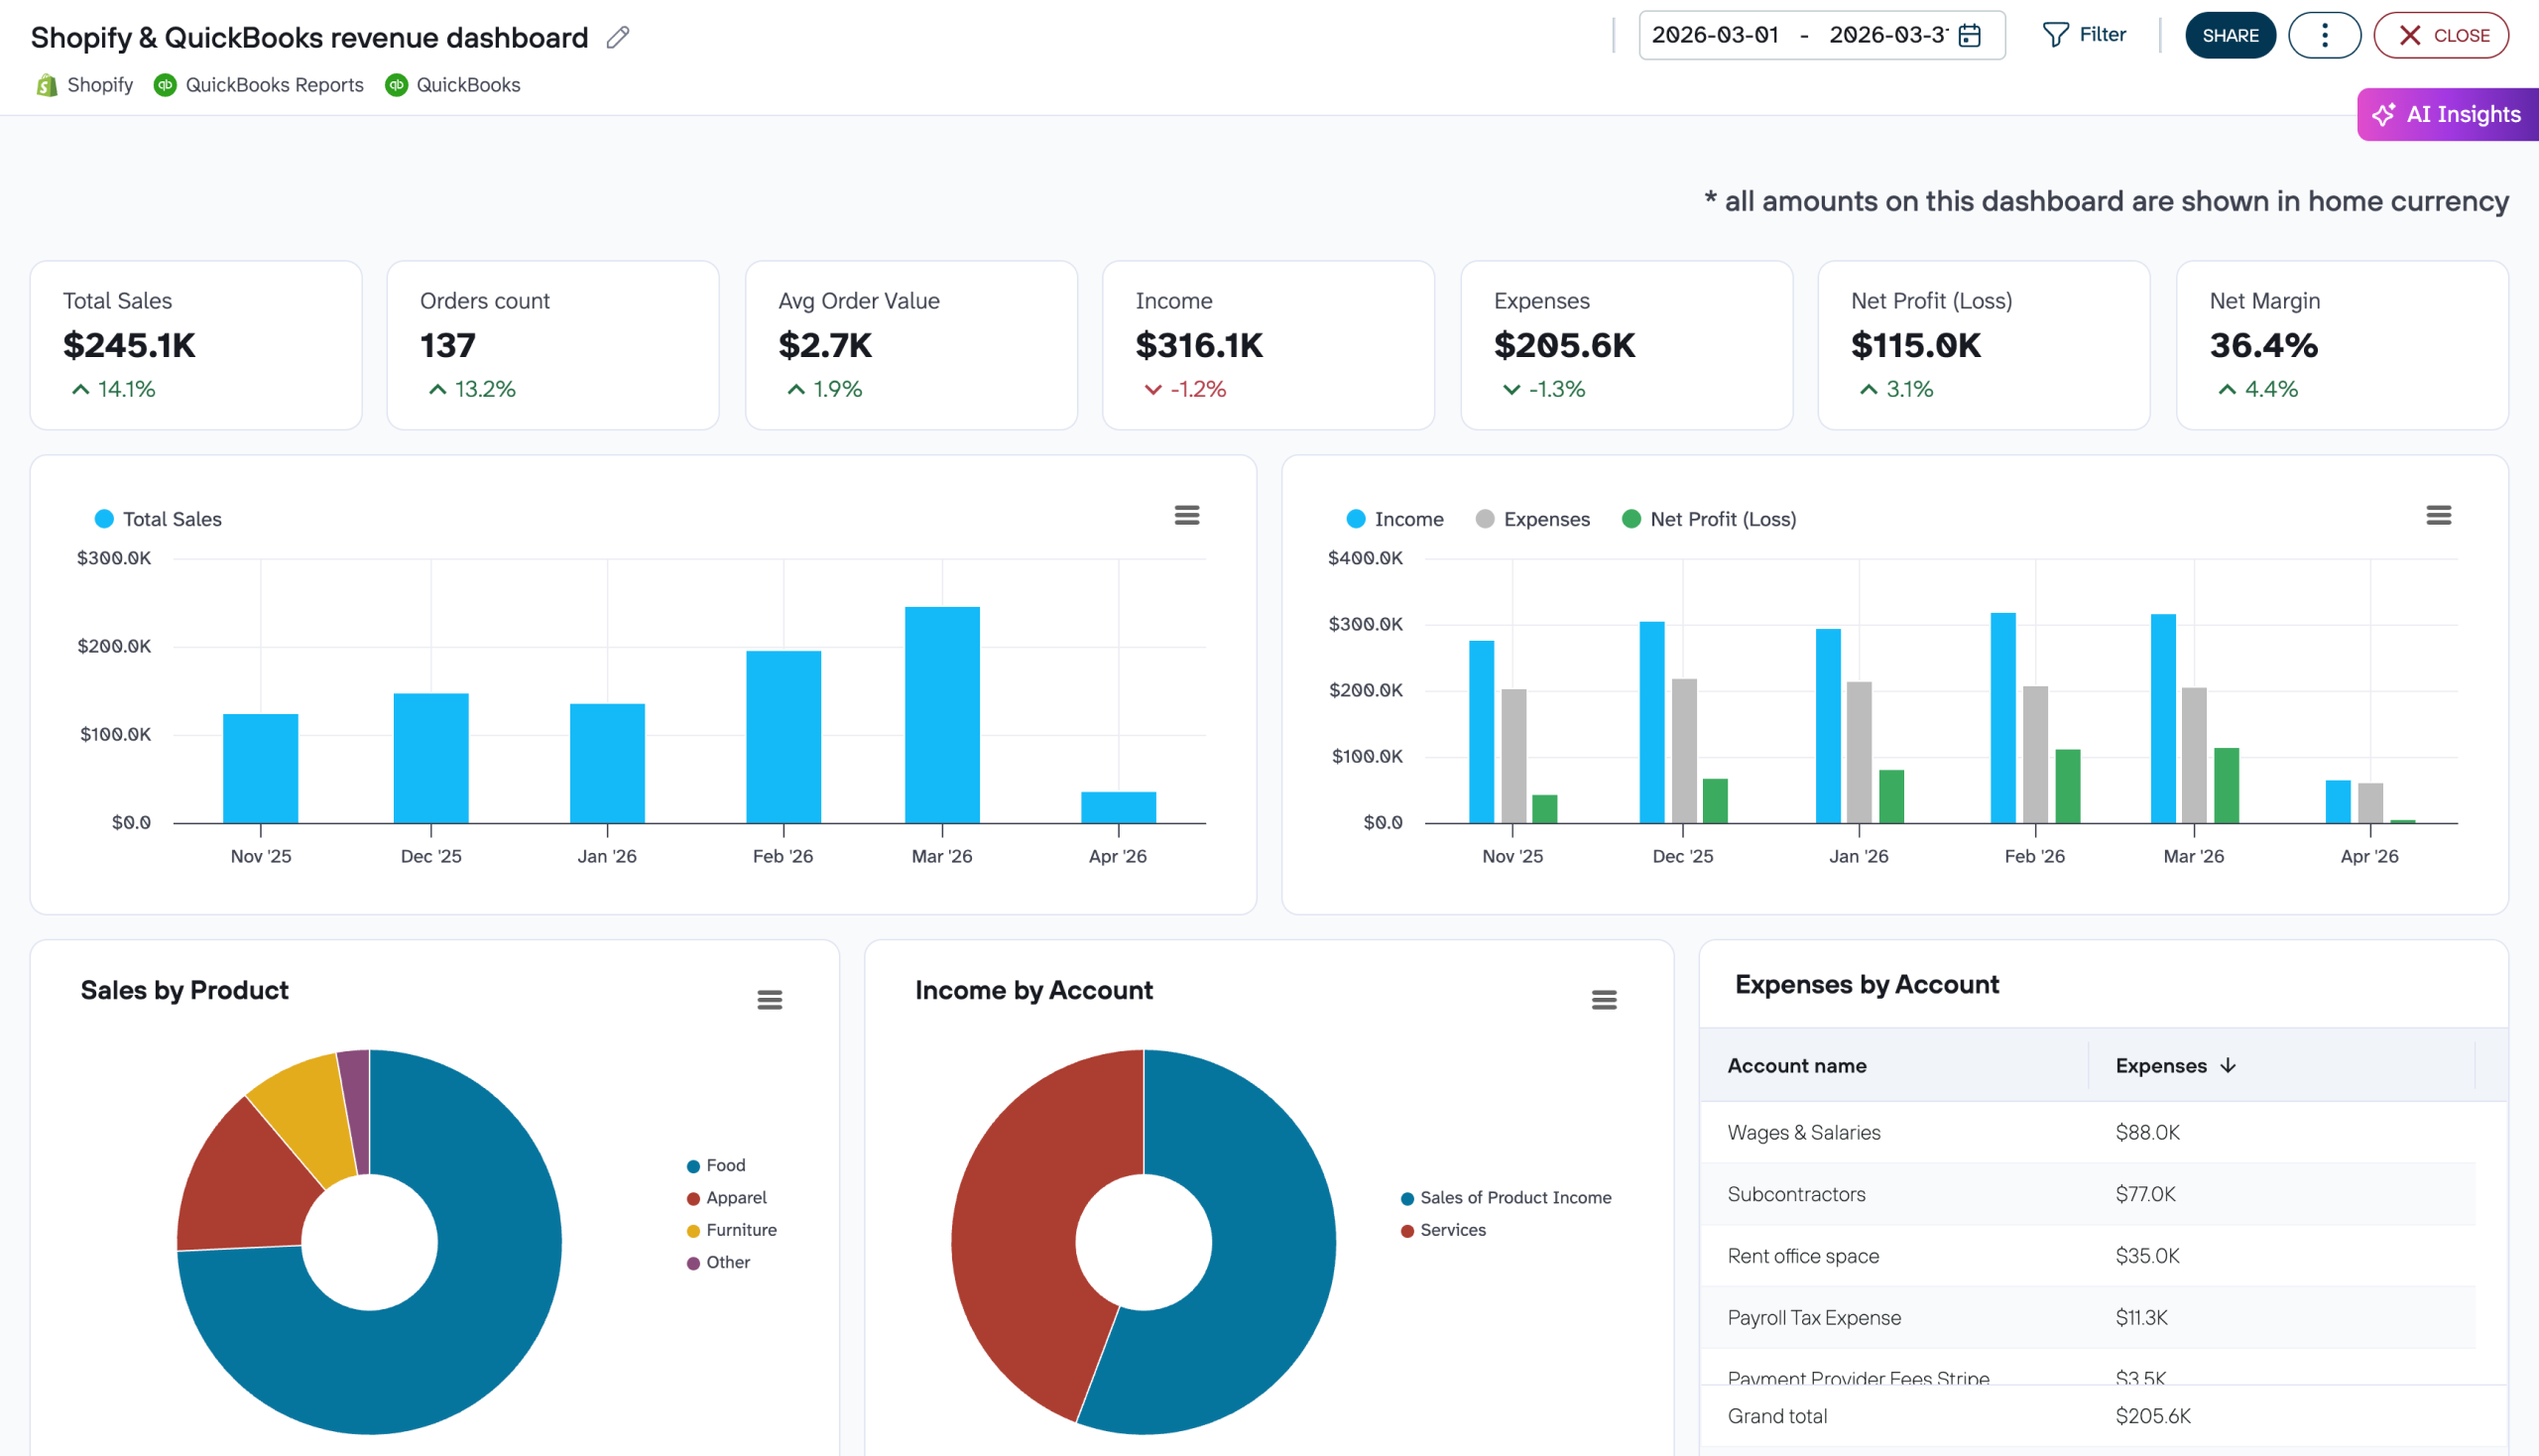
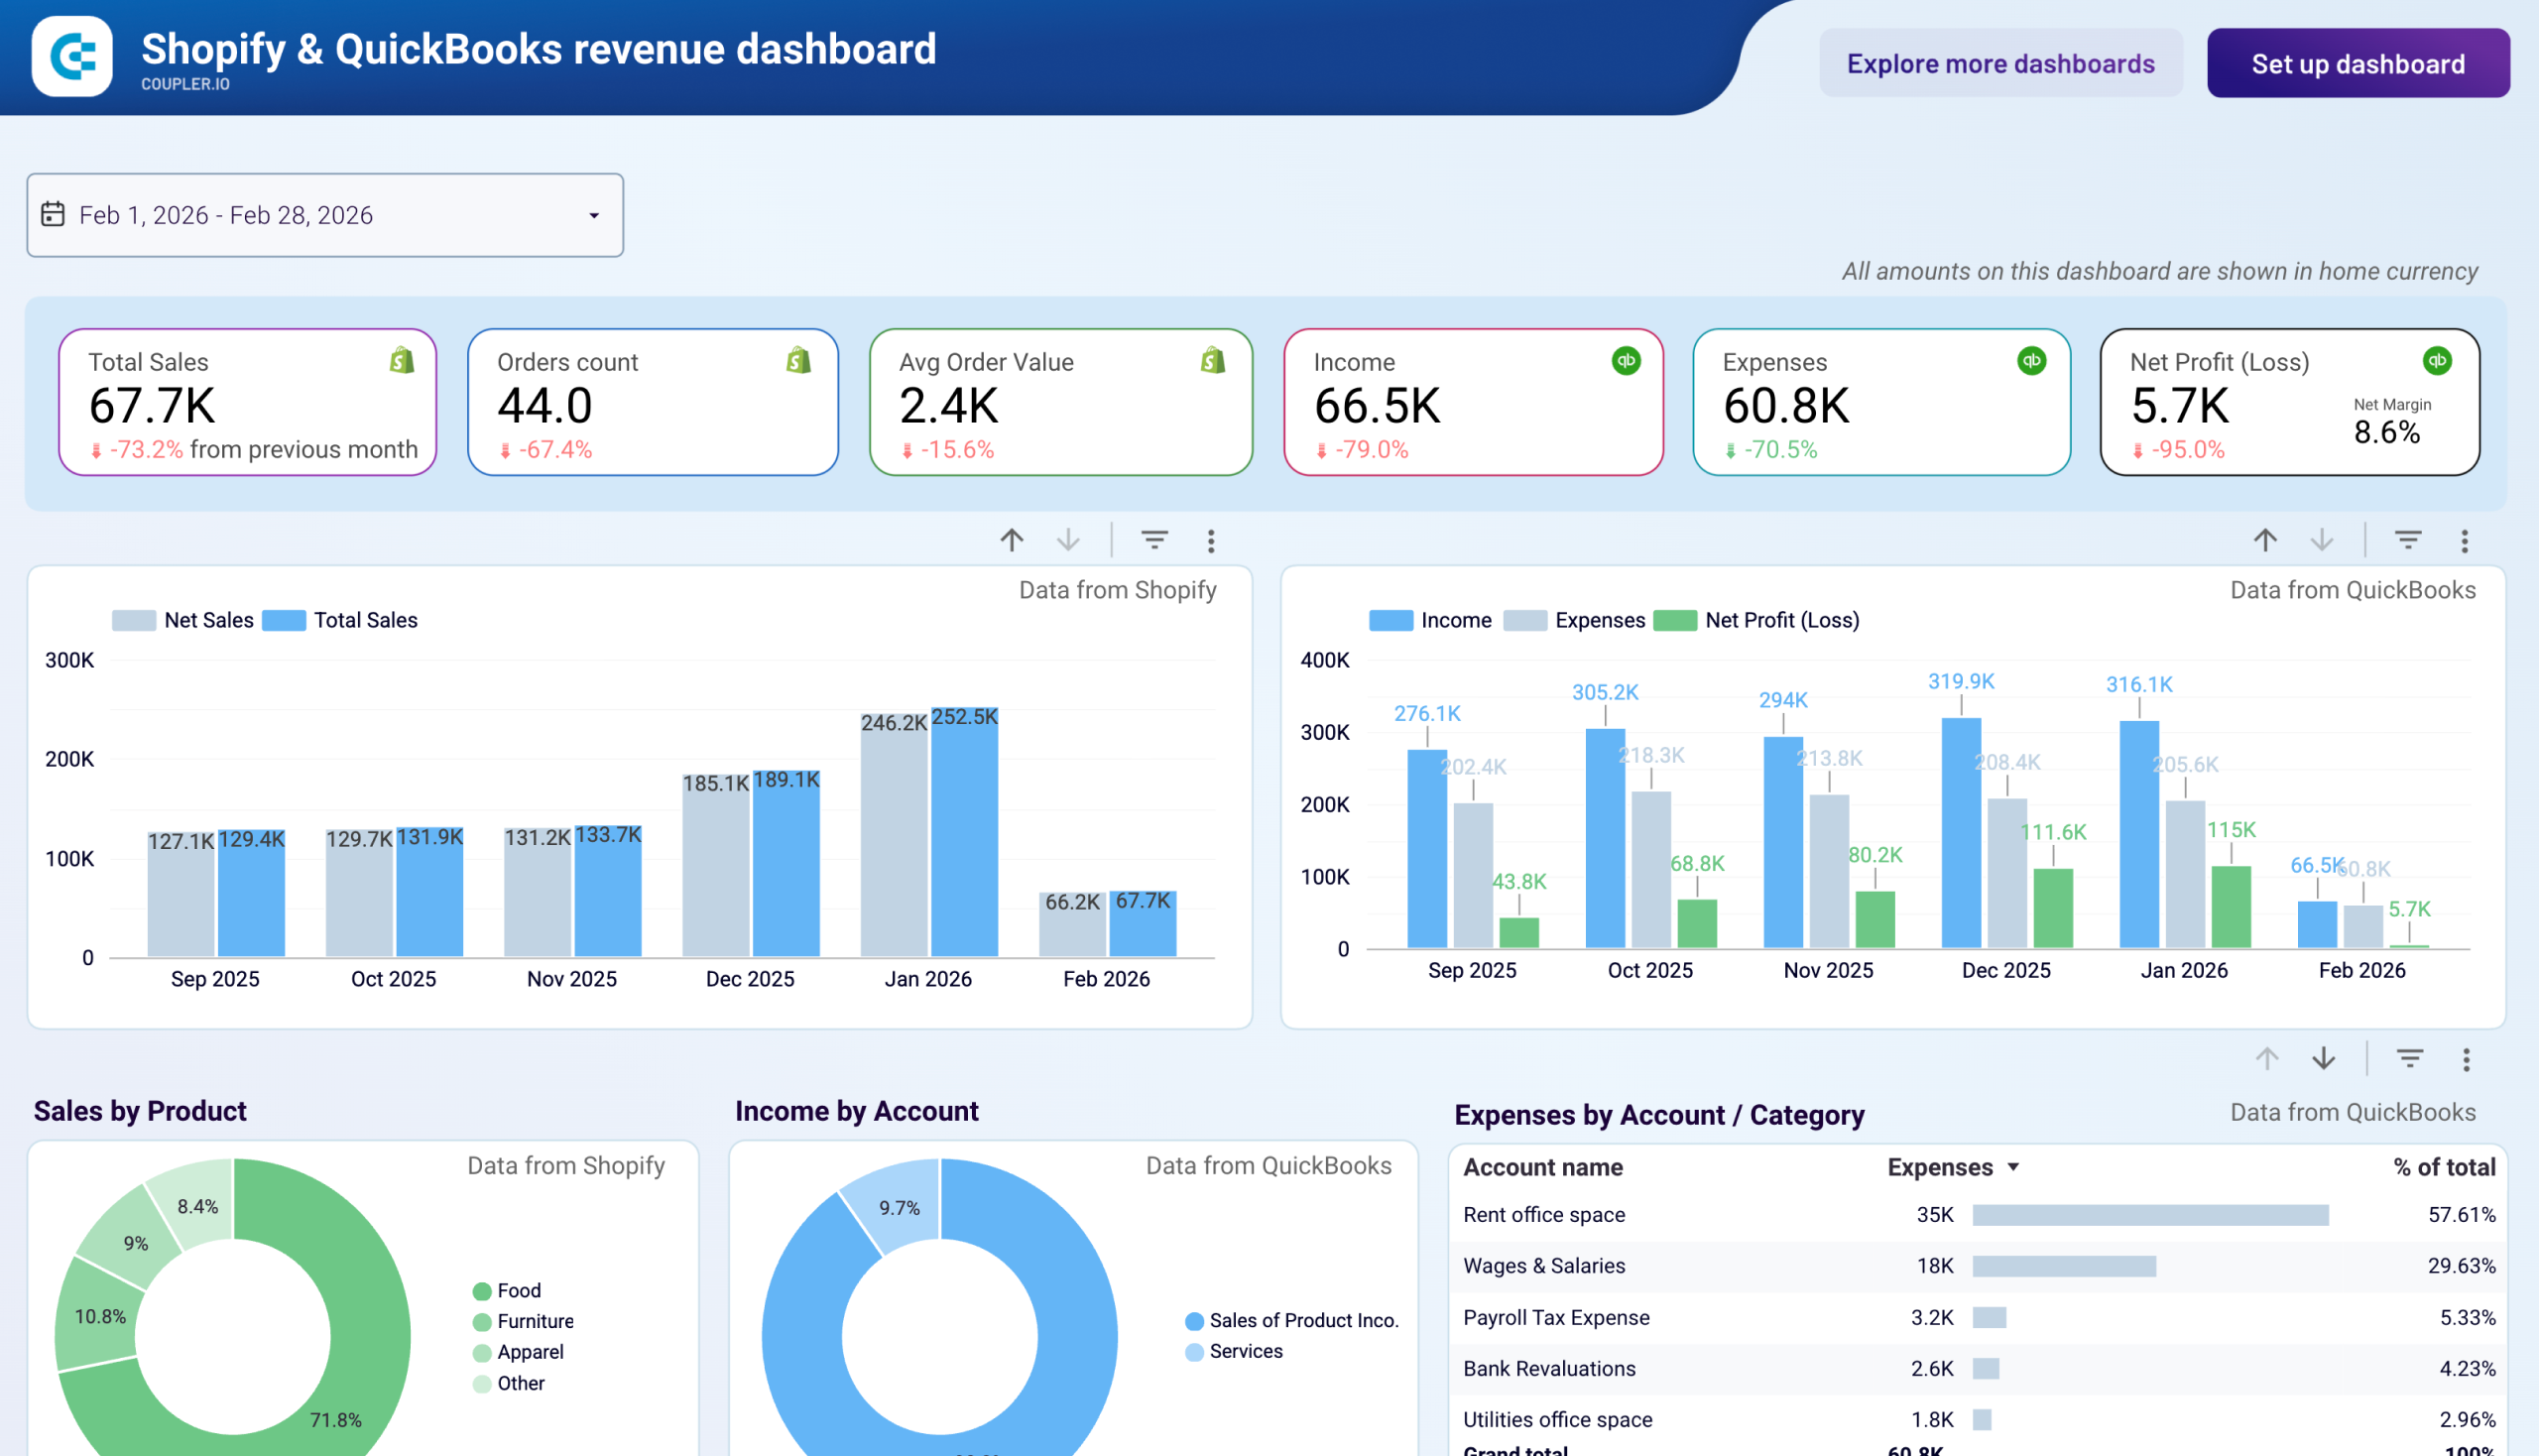
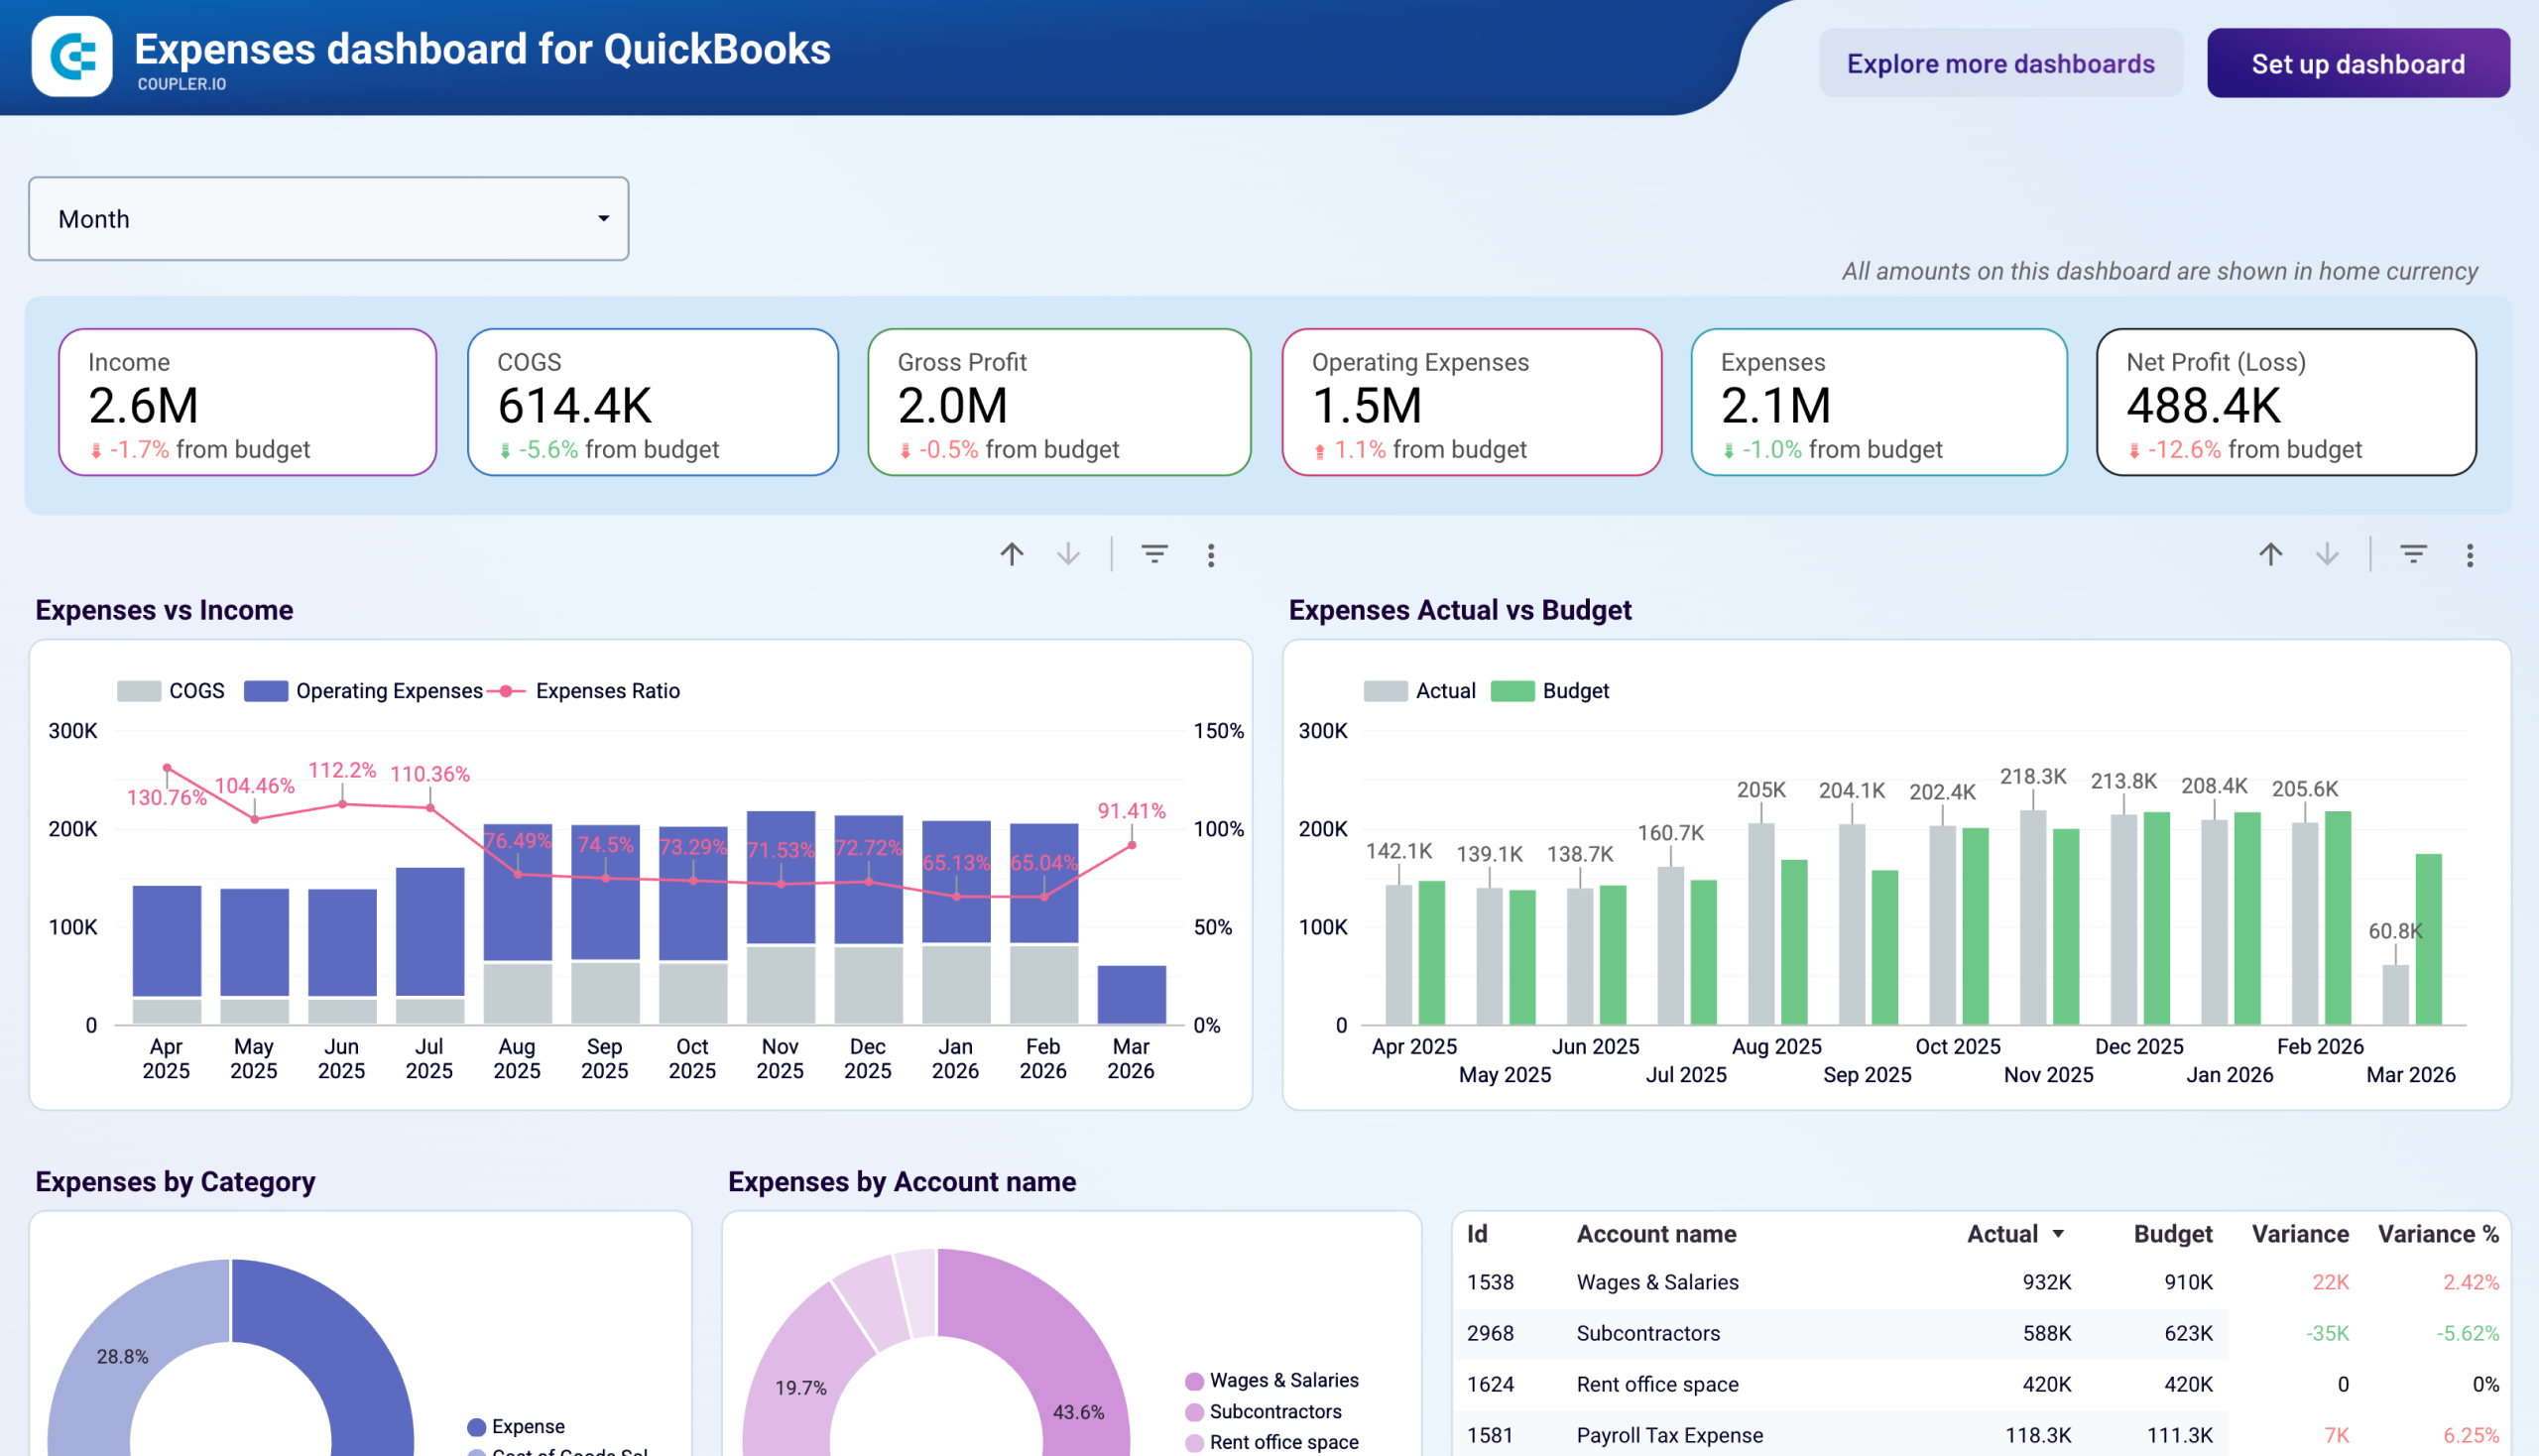
Every P&L dashboard template should provide comprehensive revenue tracking capabilities. This includes monitoring gross revenue trends, breaking down income by product lines or service categories, and analyzing sales performance across different time periods. The dashboard should visualize revenue patterns to facilitate the identification of seasonal trends and growth opportunities. Key metrics like month-over-month and year-over-year revenue growth should be prominently displayed. They enable quick assessment of business performance and market dynamics.
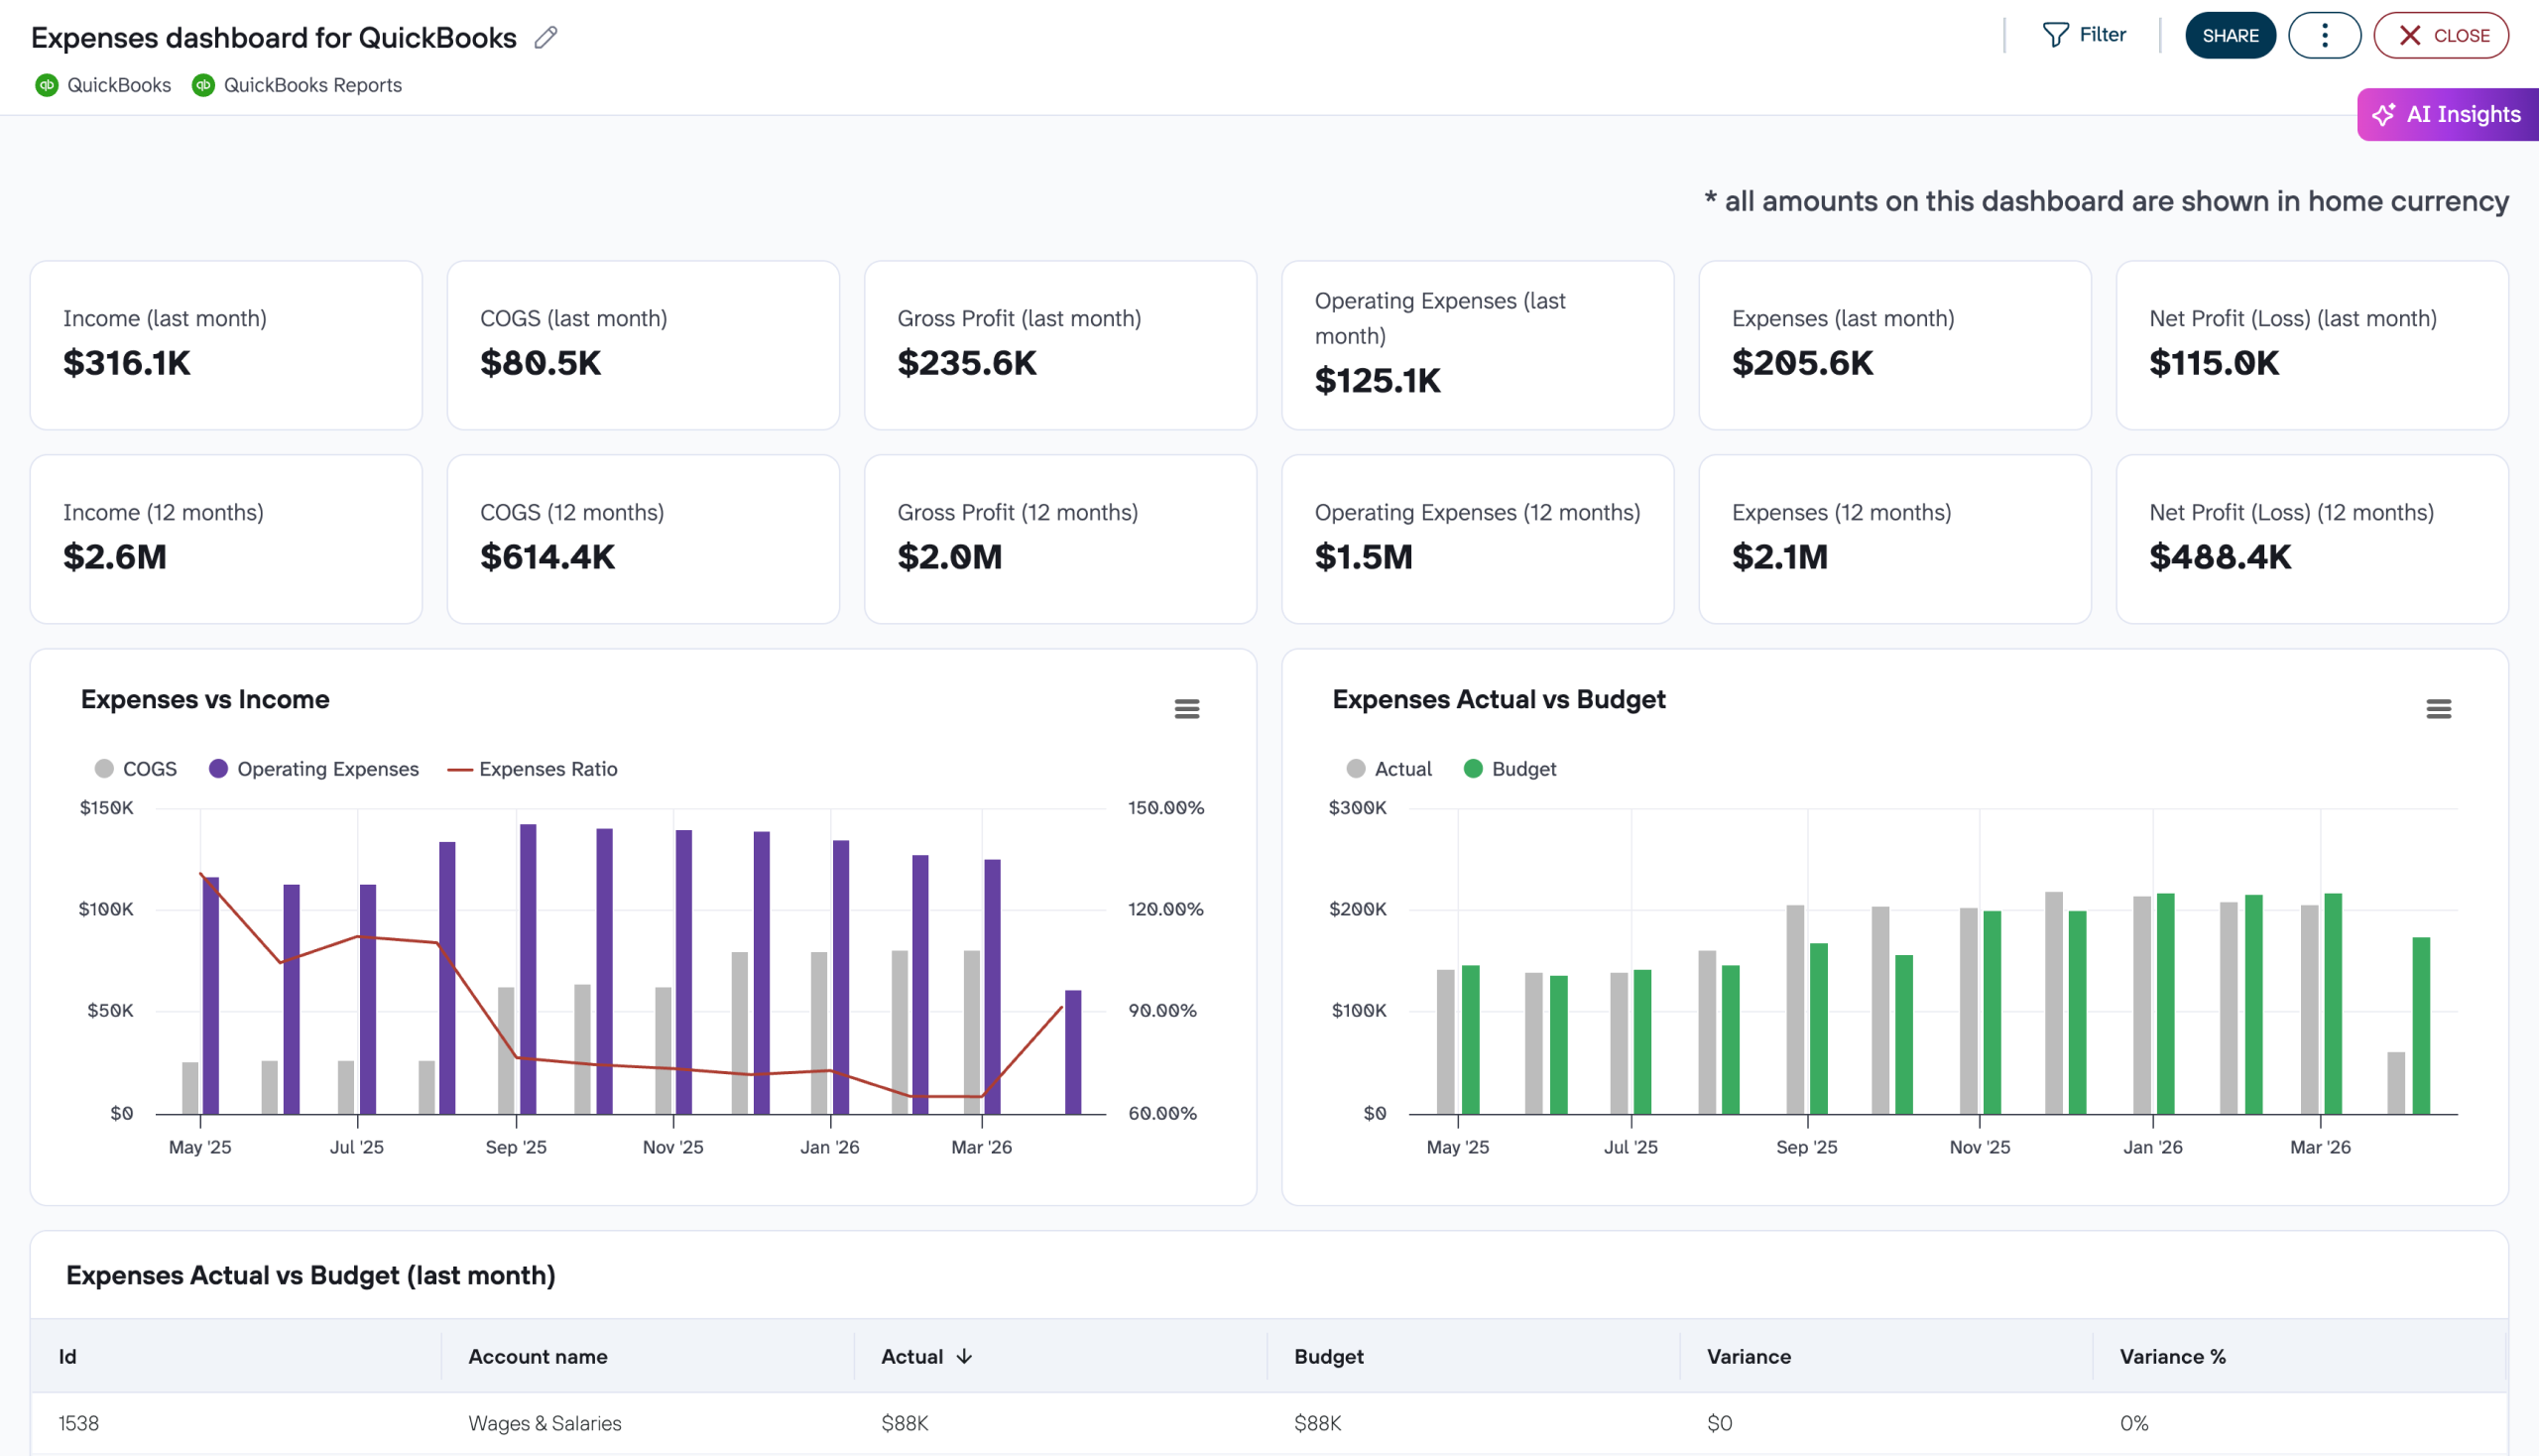
Your P&L reporting dashboard must offer detailed expense monitoring and categorization. This encompasses tracking both fixed and variable costs, operating expenses, and cost of goods sold. The dashboard should break down expenses by category which is helpful for understanding where your money goes and identifying areas for cost optimization. By monitoring expense ratios and trends, you can maintain better control over your cost structure and improve operational efficiency.
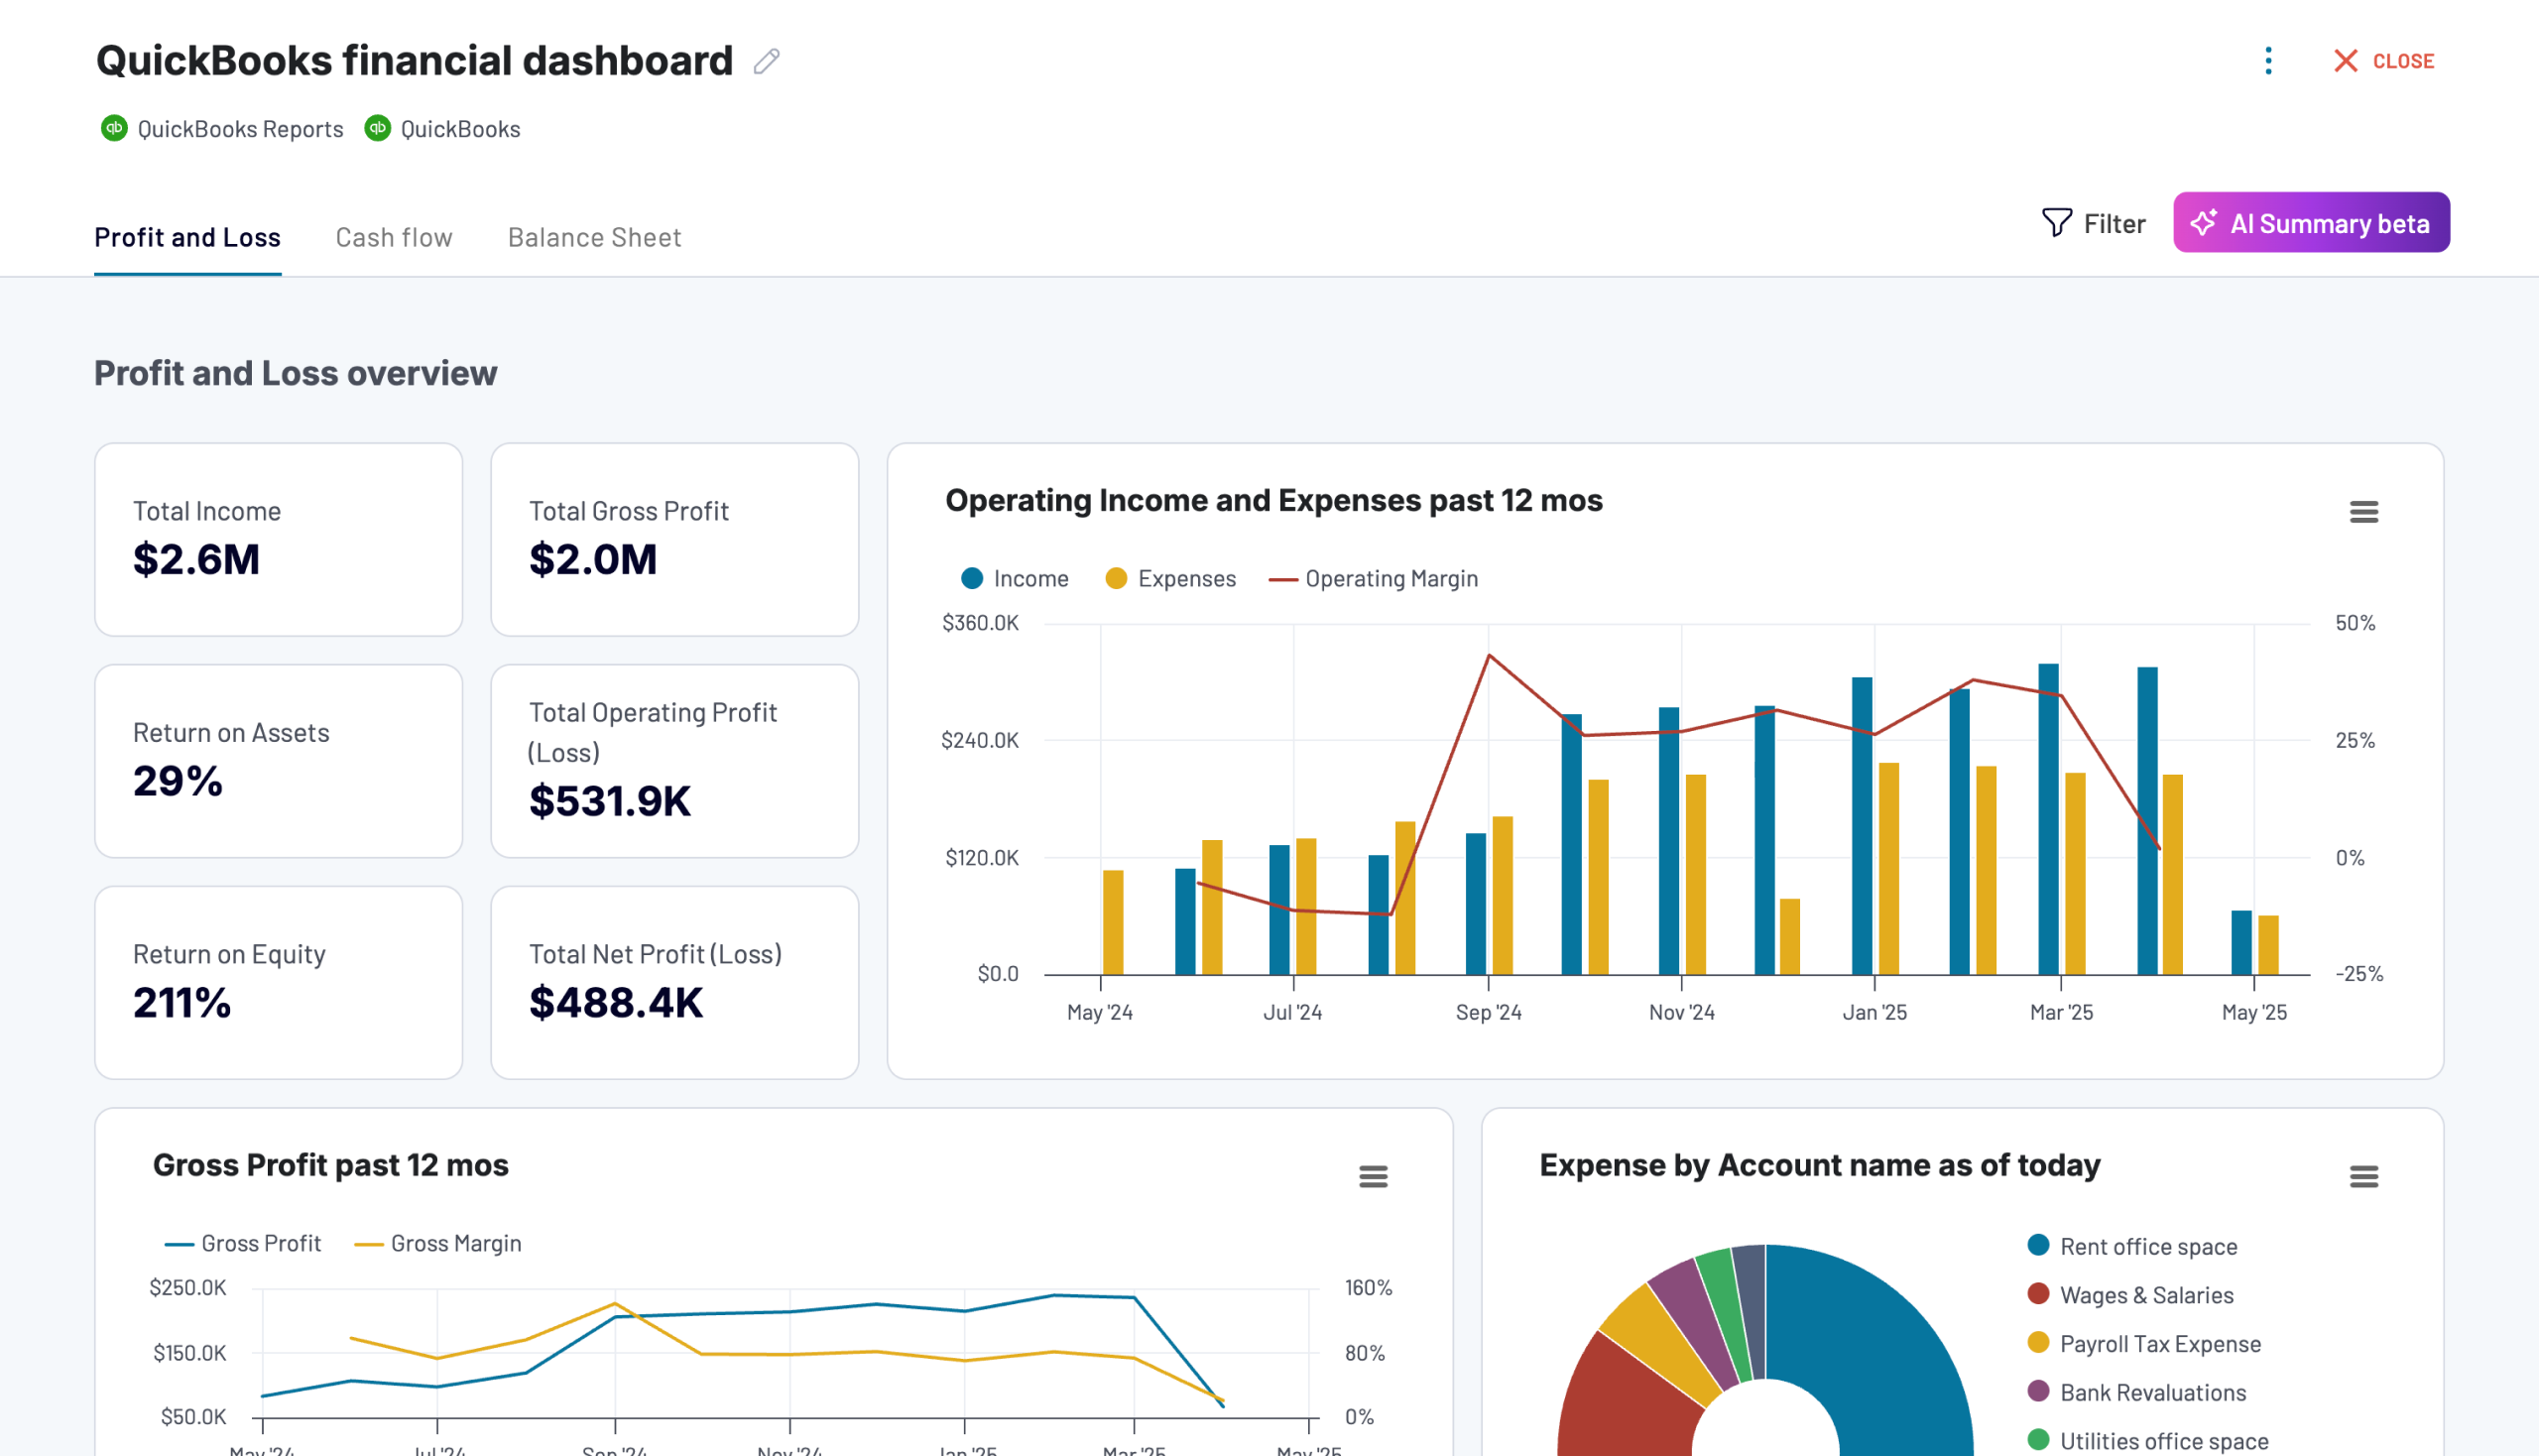
Advanced P&L dashboards should feature comprehensive profitability analysis tools. This includes tracking gross profit margins, operating margins, and net profit margins across different business segments and time periods. The dashboard should enable you to identify your most profitable products, services, or customer segments. These insights are crucial for strategic planning and resource allocation decisions.
Why do you need a P&L reporting dashboard?
Effective profit monitoring is fundamental for business success, yet many organizations struggle with timely access to profitability insights. A P&L reporting dashboard solves this challenge by automating the collection and visualization of income and expense data from your accounting software. This automated approach eliminates manual report preparation, reduces data entry errors, and provides continuous visibility into your business performance.
With Coupler.io's automated data refresh capabilities, your P&L dashboard stays dynamic, which ensures access to the latest information for making critical business decisions. This real-time insight enables you to identify and address performance issues promptly. It’s also helpful for optimizing resource allocation and profit margins.
How to choose a perfect P&L dashboard template for your needs?
More P&L Dashboards
Request custom dashboard
From building custom dashboards to setting up data analytics from scratch, we're here to help you succeed. Contact us to discuss your case and possible solutions
Contact us