Sales activity dashboard examples and reporting templates
Accelerate sales performance with intelligent sales activity reporting dashboards that seamlessly integrate with Salesforce, HubSpot, and Pipedrive. Visualize deal progression through customizable pipeline stages, uncover team performance patterns, and decode revenue dynamics that drive sustainable growth while streamlining your entire sales reporting process.
Sales activity dashboard examples for every need


about your case. It doesn't cost you a penny 😉
Choose your white label sales activity dashboard to kick off
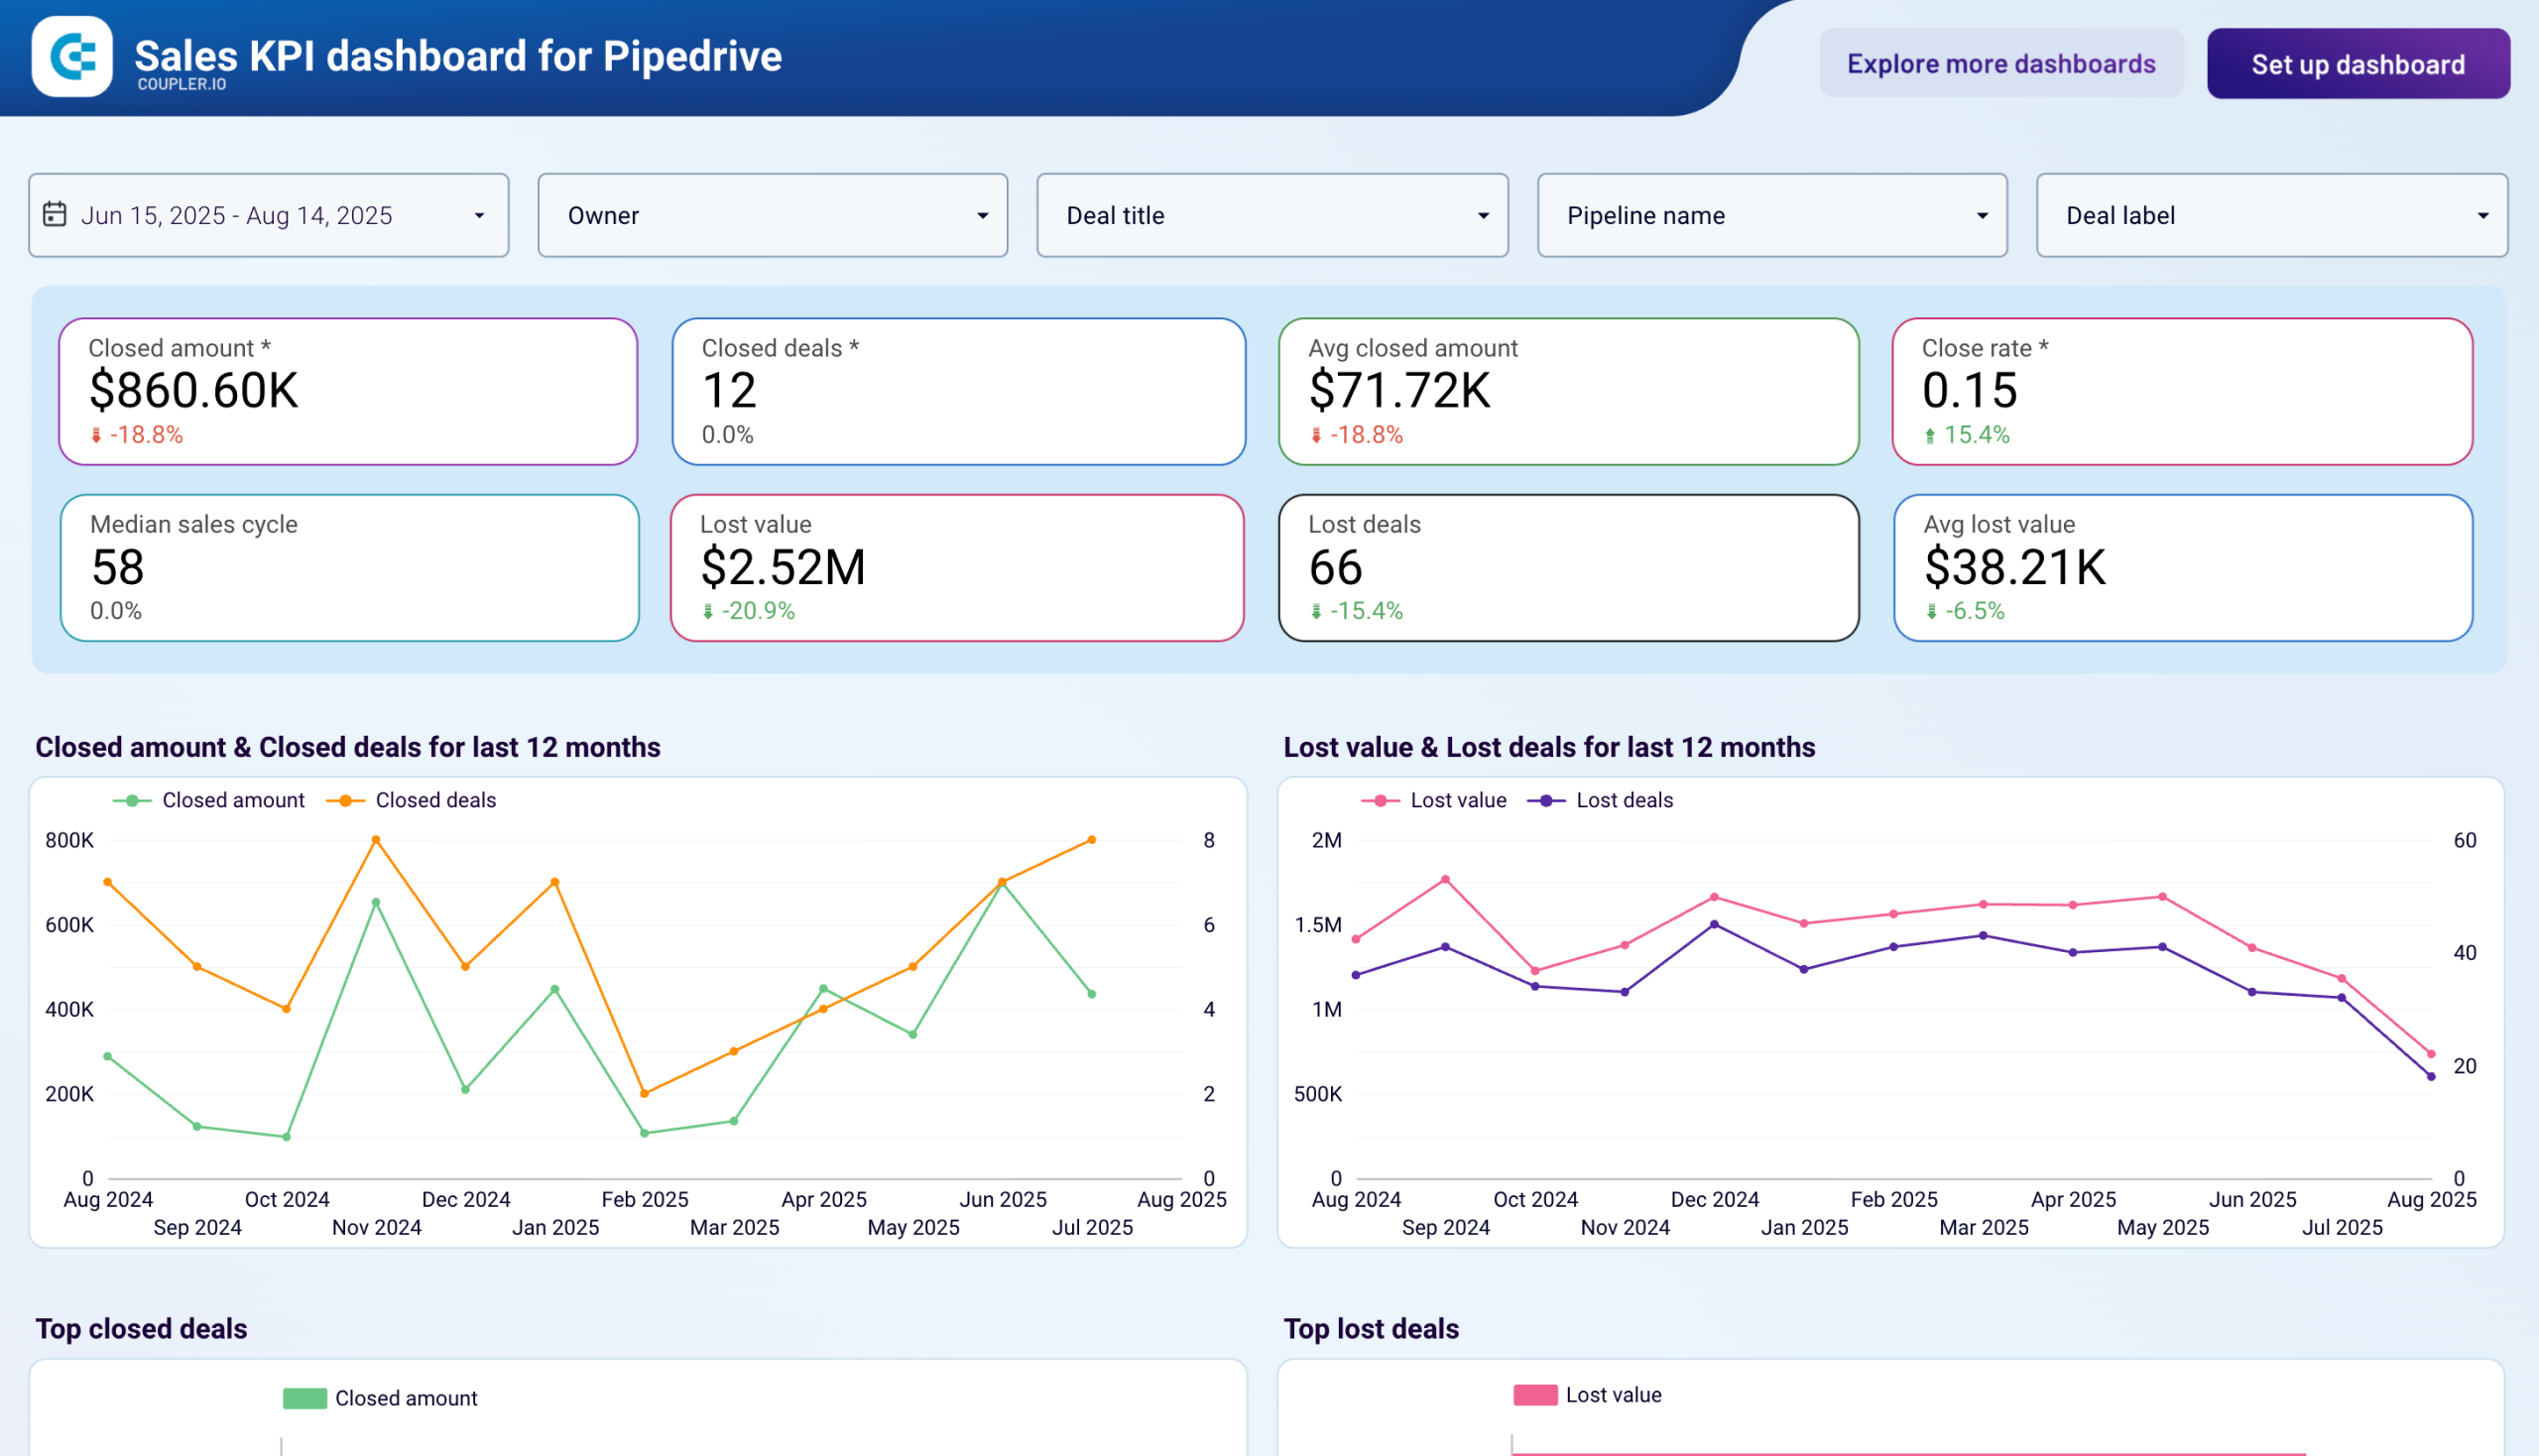
What is a sales activity dashboard?
Rather than forcing sales managers to piece together insights from scattered CRM reports, sales activity dashboard templates present cohesive narratives about what's driving results and what's holding back progress. Through automated data synchronization via Coupler.io, these dashboards maintain real-time accuracy while freeing up valuable time that sales leaders can redirect toward coaching conversations and strategic planning initiatives.

What reports should be included in sales activity dashboards?
Building effective sales activity reporting dashboards requires careful selection of reports that address the most critical aspects of sales performance management. Through analysis of successful implementations across Salesforce, HubSpot, and Pipedrive platforms, four essential report categories emerge as fundamental components for comprehensive sales activity monitoring and optimization.
Funnel progression reporting reveals how effectively prospects move through your defined sales stages, highlighting conversion bottlenecks that impede deal flow. This report allows customization of up to five distinct pipeline stages that mirror your organization's actual sales methodology. By tracking conversion percentages at each transition point, you identify specific areas where deals consistently stagnate or disappear entirely. The visualization exposes patterns in deal progression that might otherwise remain hidden, such as lengthy qualification periods or competitive losses at specific stages, enabling targeted process improvements that accelerate overall sales velocity.
Performance benchmarking creates comparative frameworks for evaluating individual and team achievements across multiple success dimensions. This report segments data by sales representative, territory, deal type, and time period to establish clear performance baselines and identify outliers. The analysis reveals which team members consistently exceed expectations and what methods drive their success, while simultaneously highlighting representatives who need additional support or training. These insights enable sales managers to make informed decisions about coaching priorities, territory realignments, and best practice sharing across the organization.
Deal intelligence reporting examines the DNA of successful transactions to establish replicable success patterns for future opportunities. This analysis breaks down high-value deals by customer characteristics, decision-maker profiles, industry verticals, and deal complexity factors that correlate with positive outcomes. The report identifies commonalities among your most profitable customers, revealing ideal prospect profiles that sales teams should prioritize. Understanding these patterns enables more strategic prospecting, improved qualification criteria, and enhanced deal strategies that increase win rates while reducing time spent on low-probability opportunities.
Activity correlation reporting connects specific sales behaviors to measurable outcomes, establishing cause-and-effect relationships between actions and results. This report tracks various sales activities including calls, emails, meetings, and proposal submissions, correlating them with deal progression rates and closure success. The analysis reveals which activities generate the highest return on time investment and optimal activity frequencies for different deal types. Sales teams use these insights to optimize their daily workflows, prioritize high-impact activities, and establish best practices that consistently drive positive results.
What insights you can get with the sales activity dashboard
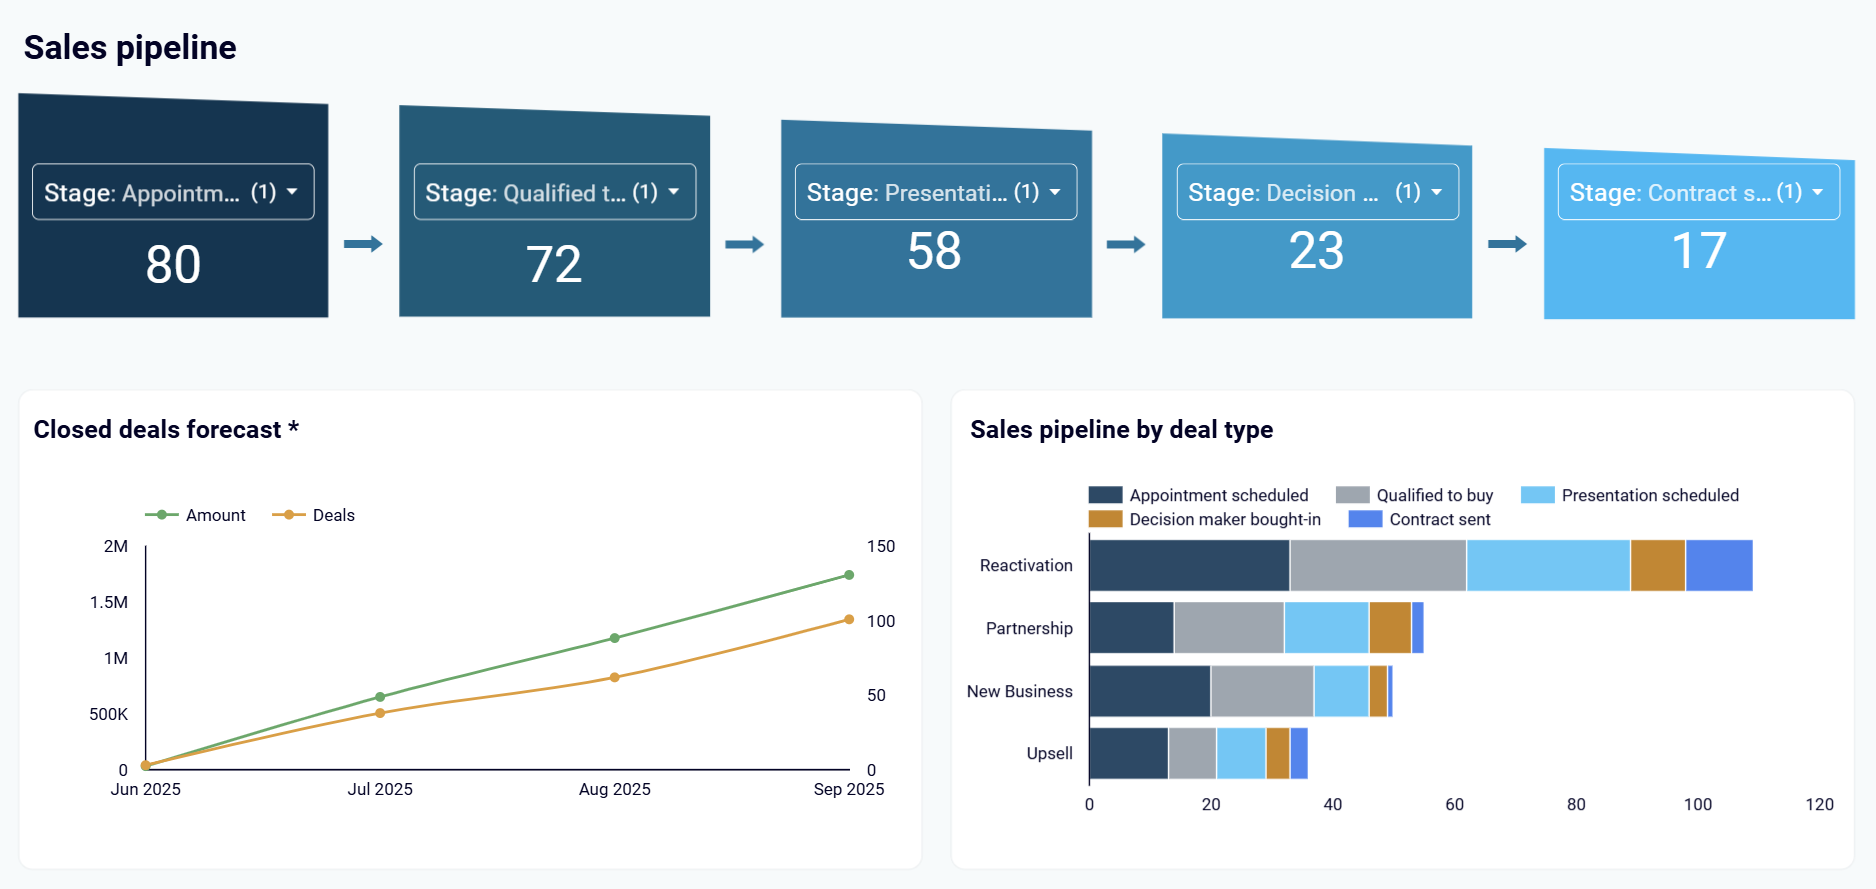
Define up to 5 sales stages that match your unique process to spot exactly where deals stagnate and conversion rates decline. This granular visibility enables precise interventions that remove bottlenecks and accelerate deal flow through systematic process improvements.
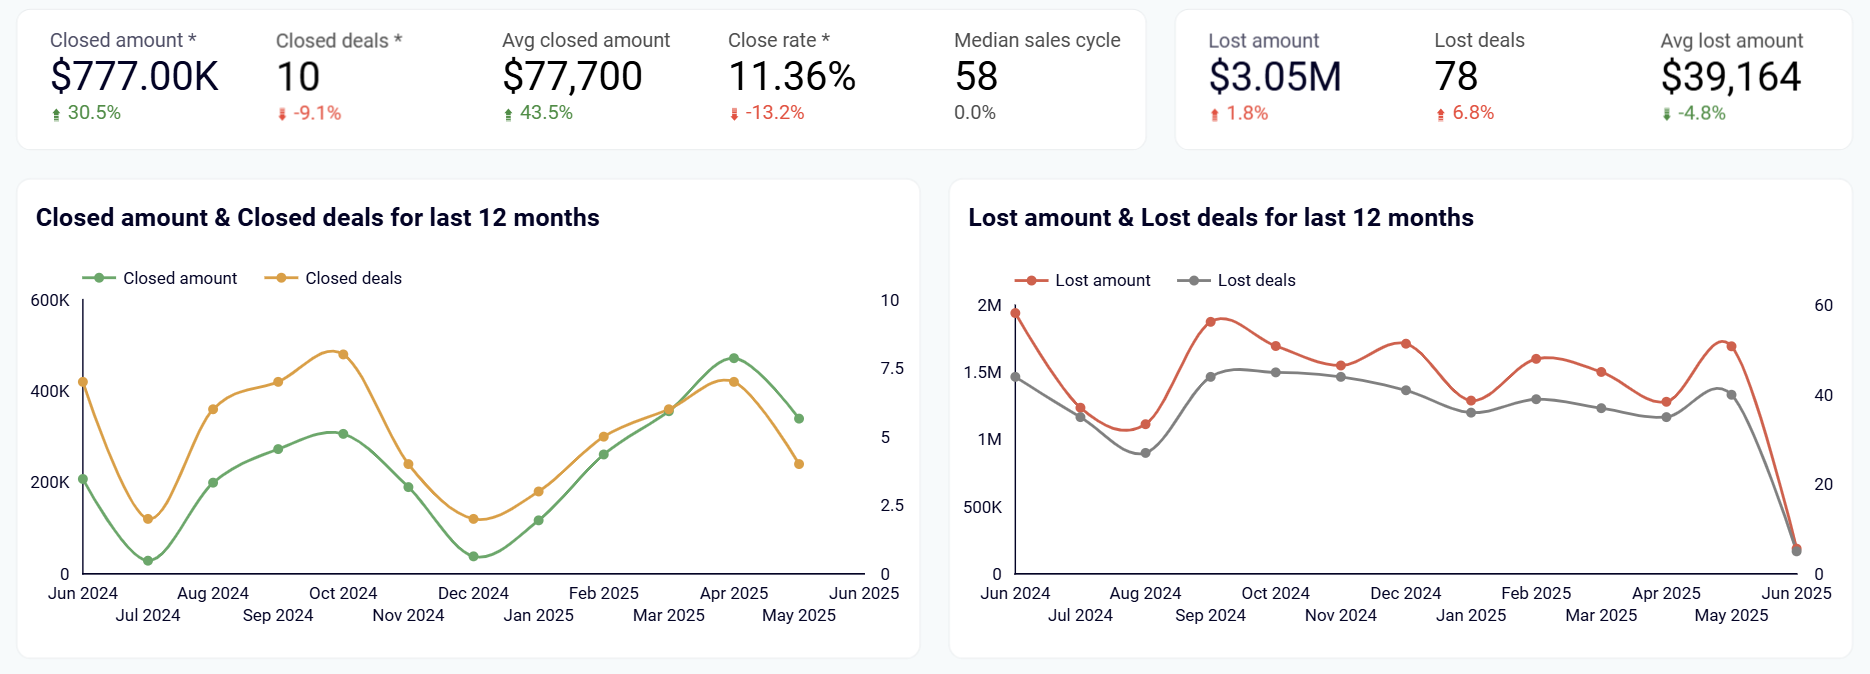
Track trends to uncover seasonal patterns and campaign dependencies that influence your sales performance. This analysis connects marketing activities to revenue outcomes and helps predict future sales based on historical patterns.
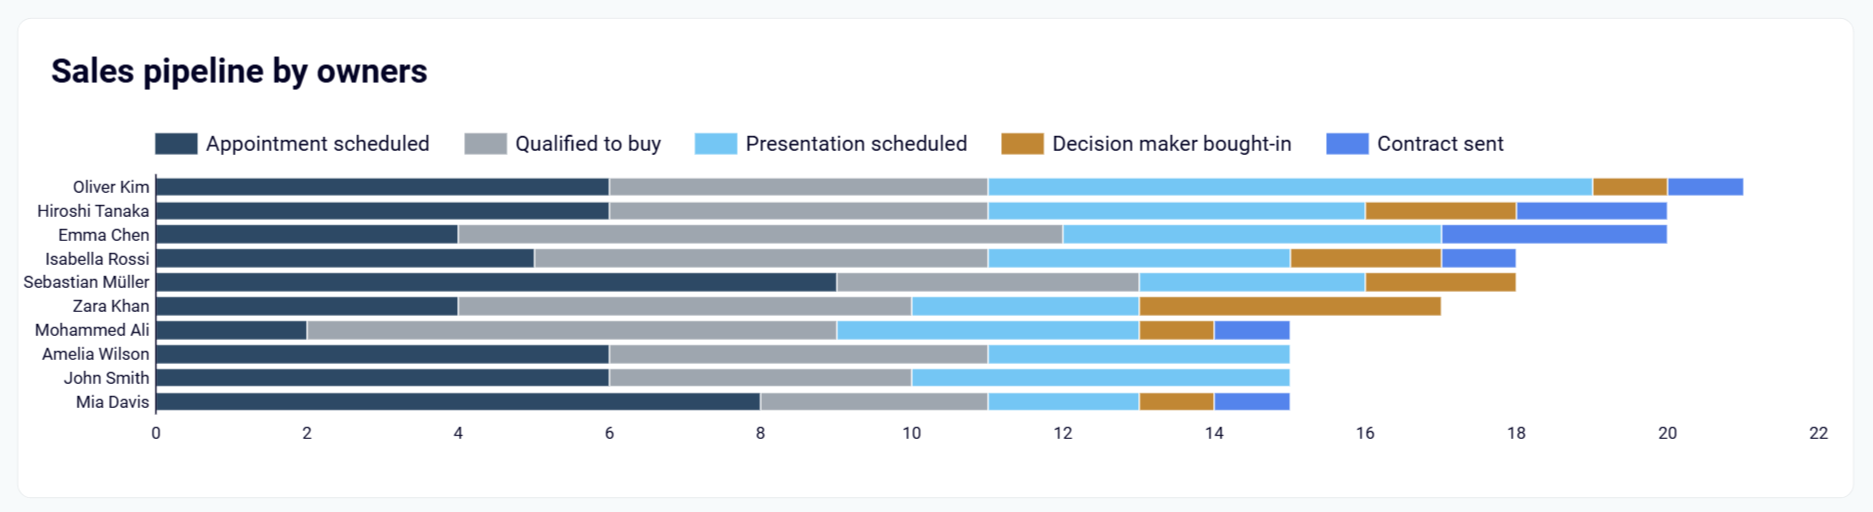
Analyze patterns that contribute to higher success rates across your sales team. Compare individual performance metrics to identify best practices and coaching opportunities that drive consistent results.
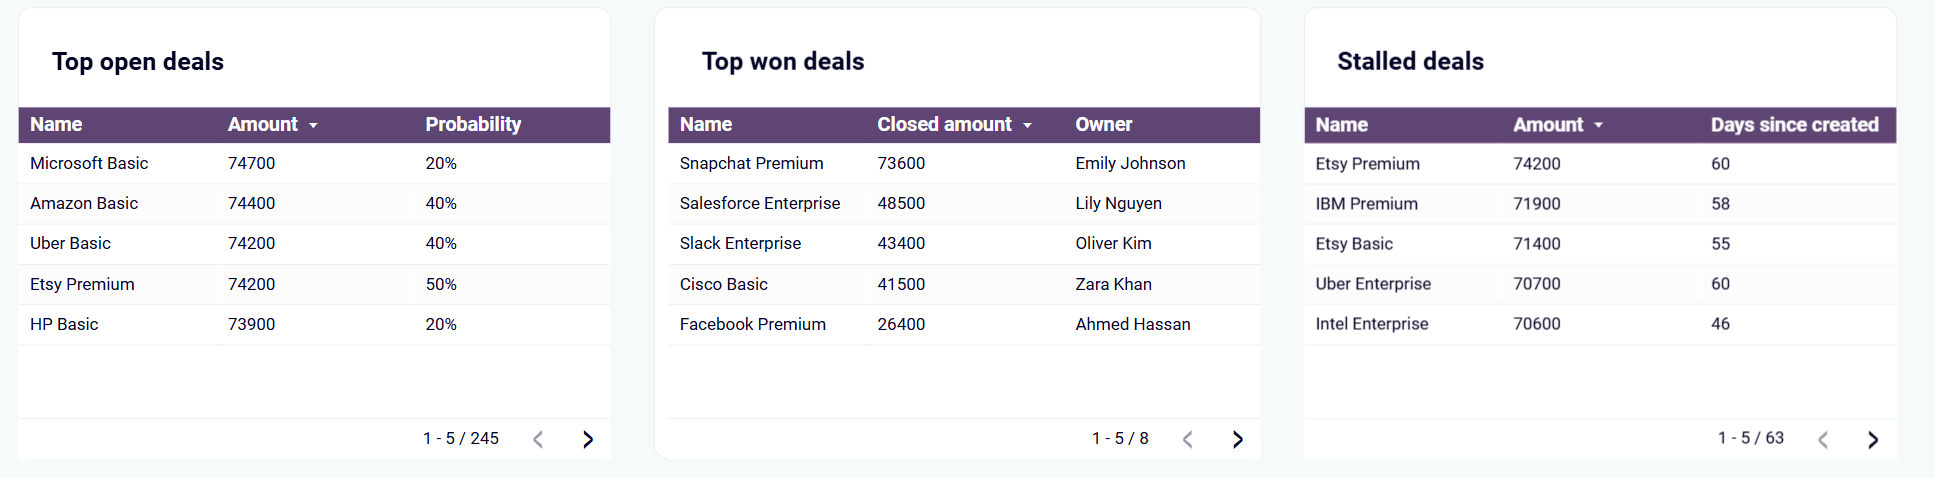
Monitor your active opportunities across three critical categories: top open deals by value and probability, recently won deals with owner attribution, and stalled deals tracked by days since creation. This comprehensive view helps prioritize follow-up actions and identify deals requiring immediate attention.
How to create a sales activity dashboard?

Metrics you can track with a sales activity dashboard template
Track the total number of successfully closed deals across your sales pipeline with breakdowns by team member and time period. This metric provides visibility into conversion rates and individual performance achievements.
Monitor the total monetary value of closed deals to measure actual revenue generation by sales representative and deal type. This metric helps assess team contributions to company revenue goals and identify top performers.
Evaluate the value of active opportunities in your pipeline, helping prioritize high-value deals and forecast potential revenue. This metric enables better resource allocation based on deal size and strategic importance.
Assess the likelihood of closing active opportunities based on sales stage and deal characteristics. This percentage-based metric helps forecast revenue and focus efforts on deals with highest closure potential.
Measure the time required to move deals from initial contact to final closure, identifying process efficiency opportunities. This metric helps optimize sales cycle length and identify bottlenecks in your sales process.
Categorize why opportunities fail to close successfully, providing insights into common obstacles and competitive challenges. This metric helps teams address recurring issues and improve overall win rates.
Track how opportunities are distributed across different pipeline stages to identify bottlenecks and conversion issues. This metric reveals where deals commonly stagnate and require management intervention.
Calculate the percentage of deals successfully closed compared to total opportunities, measuring overall sales effectiveness. This metric helps benchmark team performance and identify areas for process optimization.