CRM dashboard examples and reporting templates
Monitor your sales pipeline health with an automated CRM reporting dashboard that consolidates data from Pipedrive, HubSpot, or Salesforce. Track deal progression, analyze team performance, identify bottlenecks in your sales process, and make faster decisions based on up-to-date opportunity insights from your CRM platform.
CRM dashboard examples for every need


about your case. It doesn't cost you a penny 😉
Choose your white label CRM dashboard template to kick off
What is a CRM dashboard?
The dashboard consolidates opportunity data, contact information, and activity tracking into unified reports that enable sales leaders to monitor pipeline movement, identify at-risk deals, and optimize conversion rates. With automated data refreshing on a schedule through Coupler.io, our CRM dashboard templates ensure you're always working with current information without manual data entry. It creates a single source of truth for your sales operations across your entire team.

What reports should be included in CRM dashboards?
An efficient CRM analytics dashboard should integrate several key report types that provide complete visibility into your sales pipeline performance. Based on our analysis of Pipedrive, HubSpot, and Salesforce dashboards, we recommend incorporating these four critical report categories:
The pipeline health report provides visibility into how opportunities move through your sales stages, tracking deal counts and values at each phase from initial contact to closed won or lost. This report includes stage-specific conversion rates, average time spent in each stage, and bottleneck identification showing where deals typically stall. It helps sales managers understand pipeline velocity, forecast revenue accurately, and intervene when deals aren't progressing as expected.
The team performance report delivers insights into individual sales rep effectiveness by comparing closed amounts, win rates, close rates, and average days to close across your team. It includes pipeline distribution by agent showing how deals are allocated across different sales stages, helping managers balance workload and identify coaching opportunities. This report highlights top performers whose strategies can be replicated and reveals underperformers who may need additional support or training.
The opportunity analysis report focuses on specific deals requiring attention, including top open opportunities ranked by value and probability, recently won deals showing successful patterns, and stalled opportunities that haven't progressed within expected timeframes. This report helps prioritize follow-up activities, allocate resources to high-value deals, and prevent revenue leakage from neglected opportunities.
The win/loss report analyzes the specific reasons behind successful and failed deals, categorizing outcomes into factors like product quality, pricing competitiveness, feature limitations, or timing issues. This report provides crucial feedback for product development, pricing strategy, and sales messaging by revealing patterns in what drives conversions and what causes prospects to choose competitors.
What insights you can get with a CRM reporting dashboard
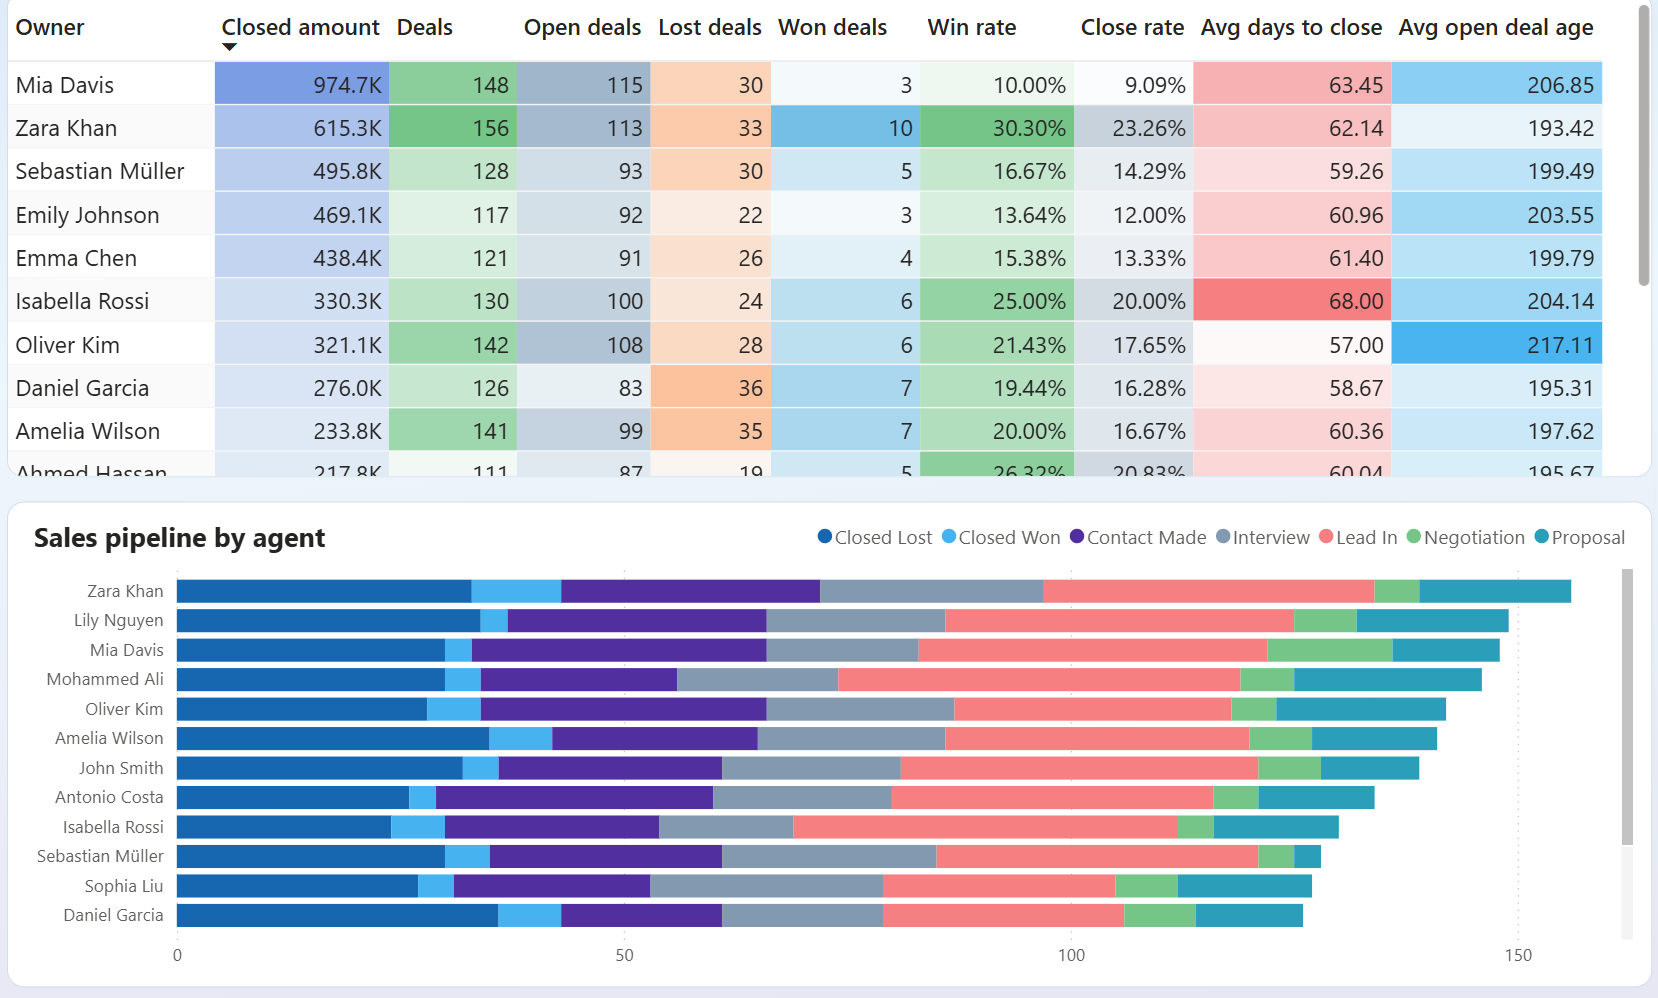
Compare individual sales rep performance across key metrics including closed amount, win rates, close rates, and average days to close. The visual pipeline breakdown by agent shows deal distribution across stages from lead-in to closed won/lost. This insight helps identify top performers, optimize deal assignments, and provide targeted coaching based on specific weaknesses in conversion rates or deal velocity.
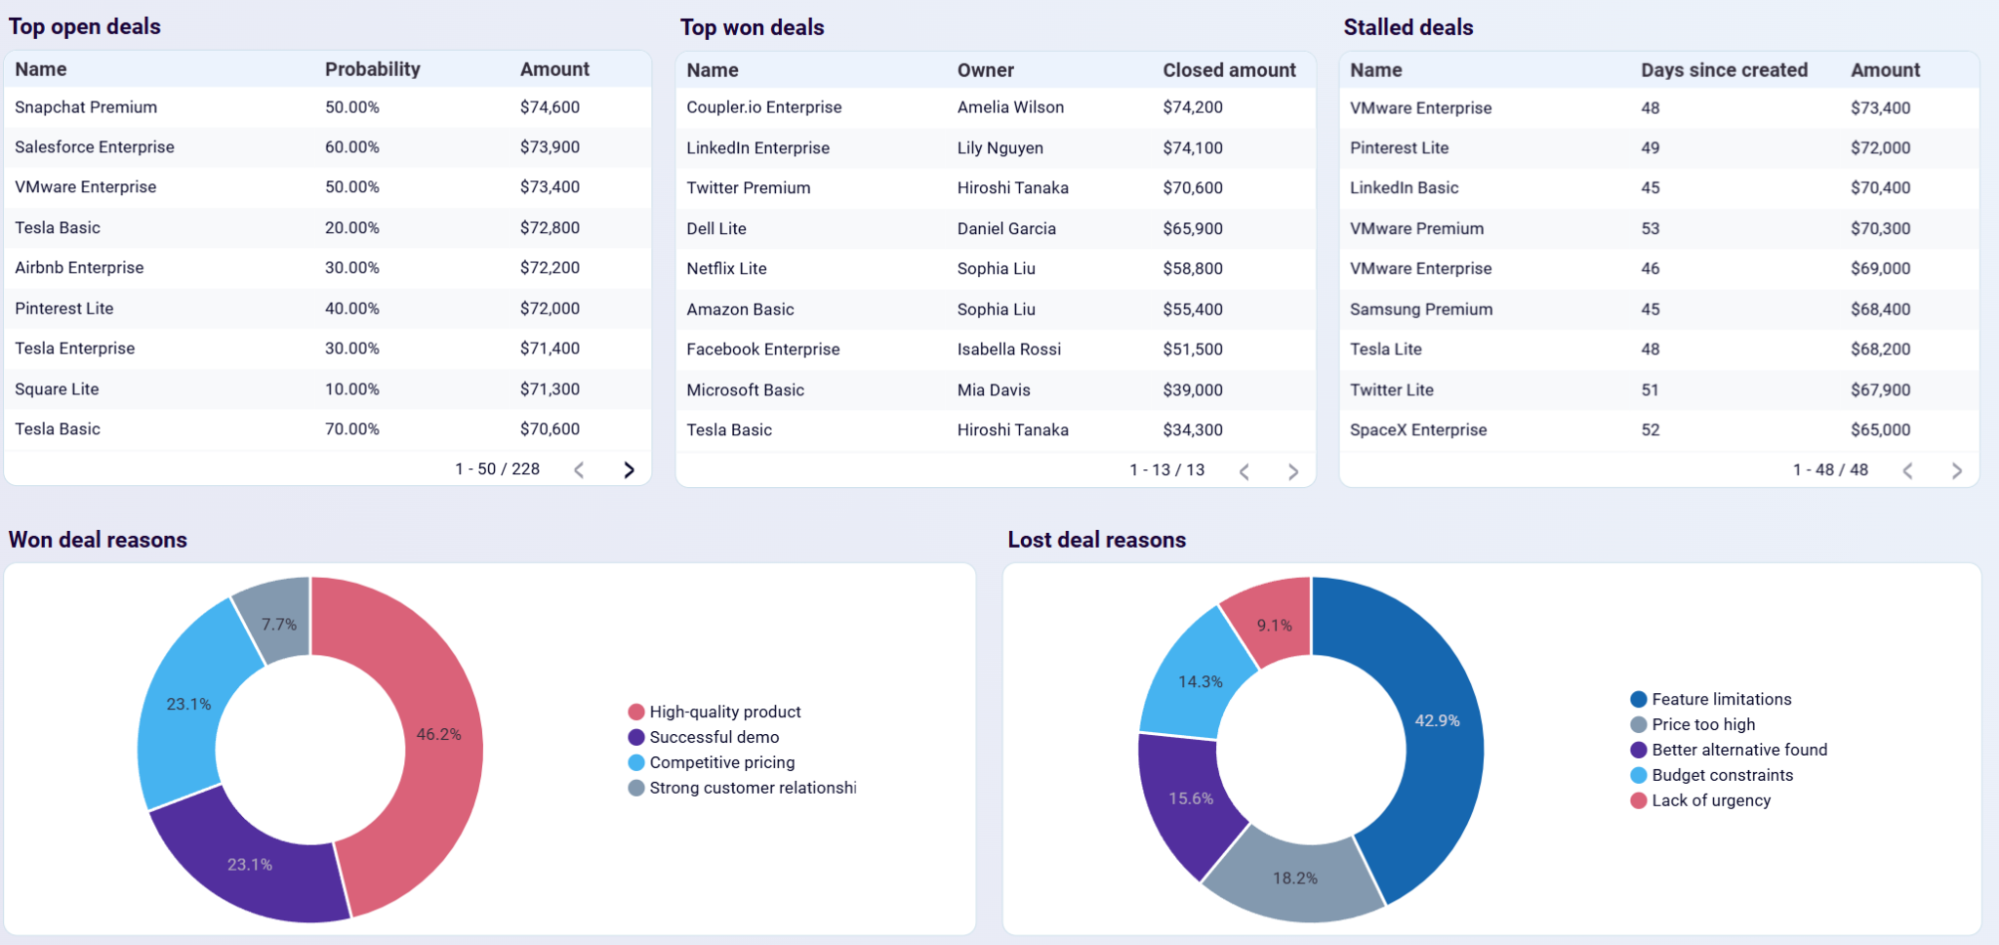
Monitor open opportunities with probability scores, won deals by closed amount, and stalled deals by days inactive. Analyze specific reasons behind won and lost deals to understand what drives success and failure. Sales teams can prioritize high-probability deals, re-engage stalled opportunities before they're lost, and refine strategies based on win/loss patterns that reveal competitive strengths and weaknesses.
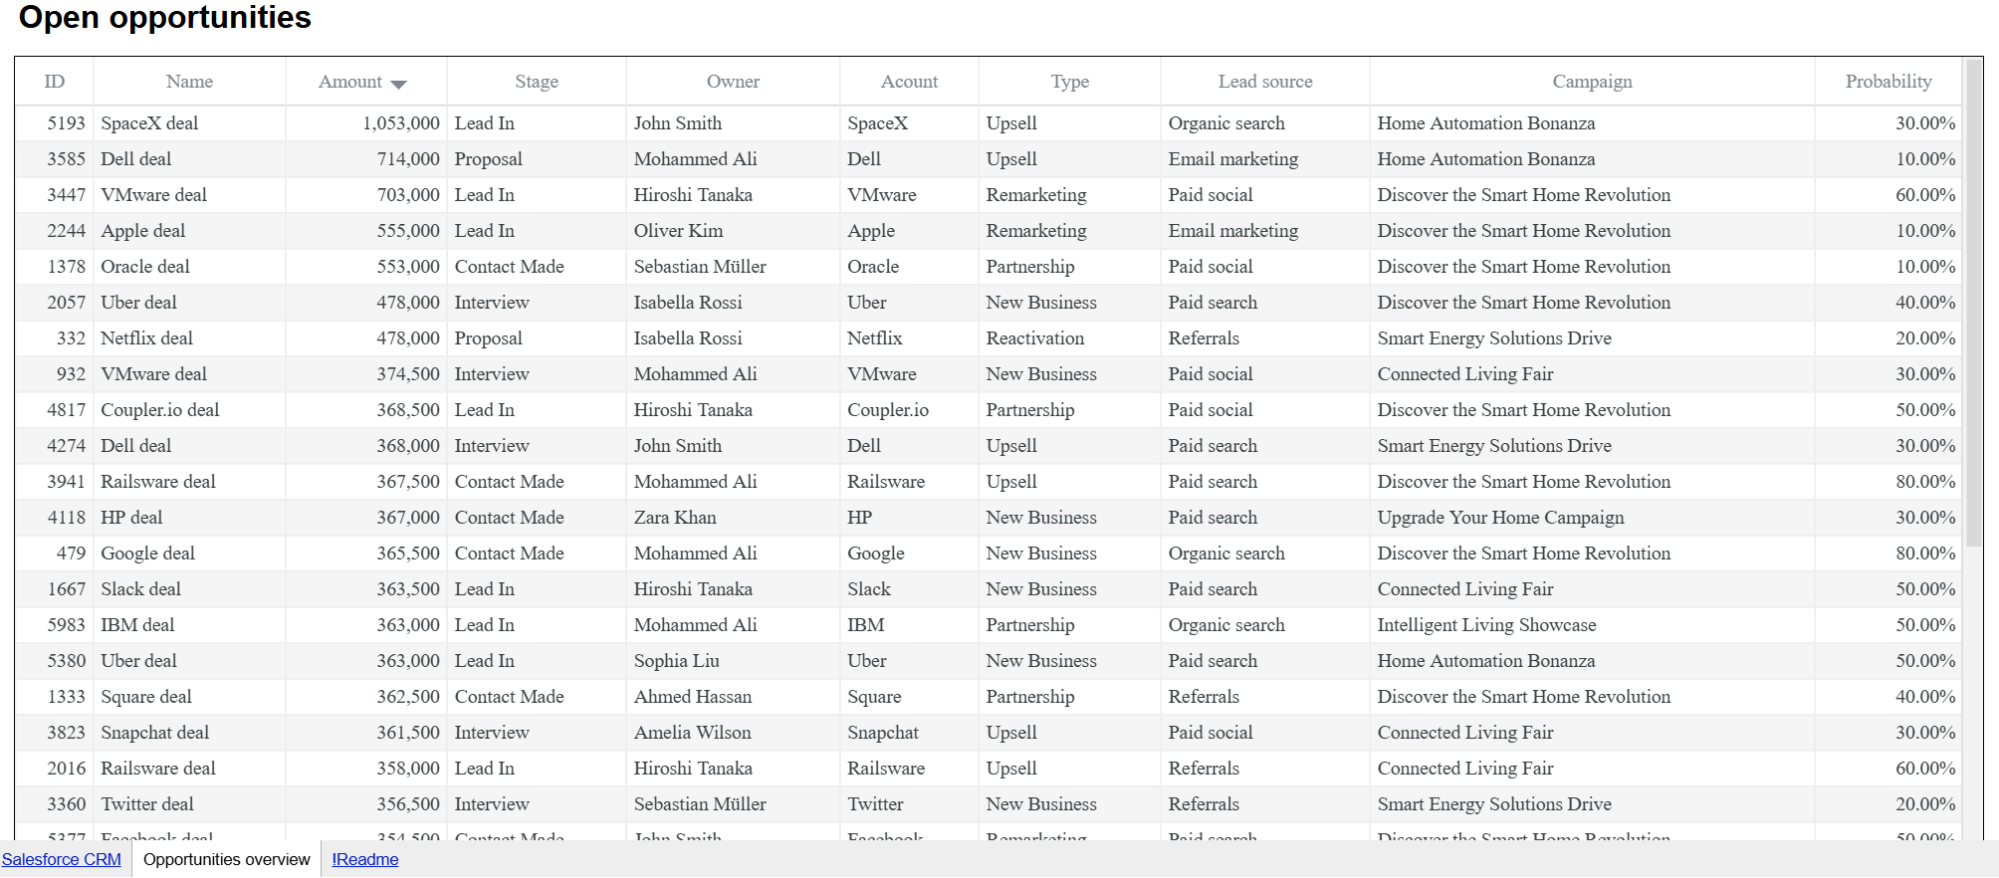
Track all open opportunities with complete details, including deal amount, pipeline stage, owner assignment, account name, deal type, lead source, and originating campaign. Filter and sort opportunities by any dimension to understand which marketing campaigns and lead sources generate the highest-value deals. This granular view helps sales teams prioritize follow-ups and marketing teams optimize budget allocation toward the most profitable acquisition channels.
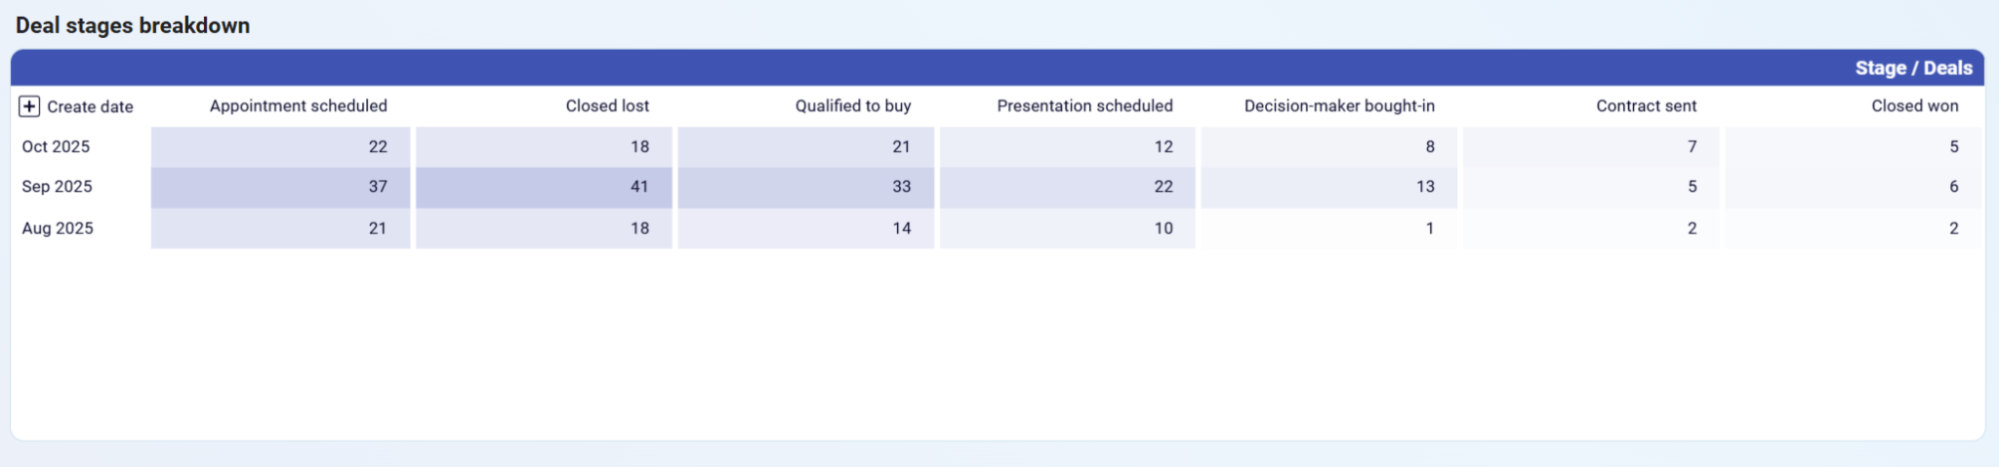
Track deal movement across pipeline stages by month to identify where opportunities stall or drop off. The breakdown shows deal counts at each stage from appointment scheduled through closed won, revealing conversion patterns and bottlenecks. Teams can pinpoint which stages consistently lose the most deals, optimize stage-specific processes, and forecast future revenue based on current pipeline distribution.
How to create a CRM dashboard?

Metrics you can track with a CRM dashboard template
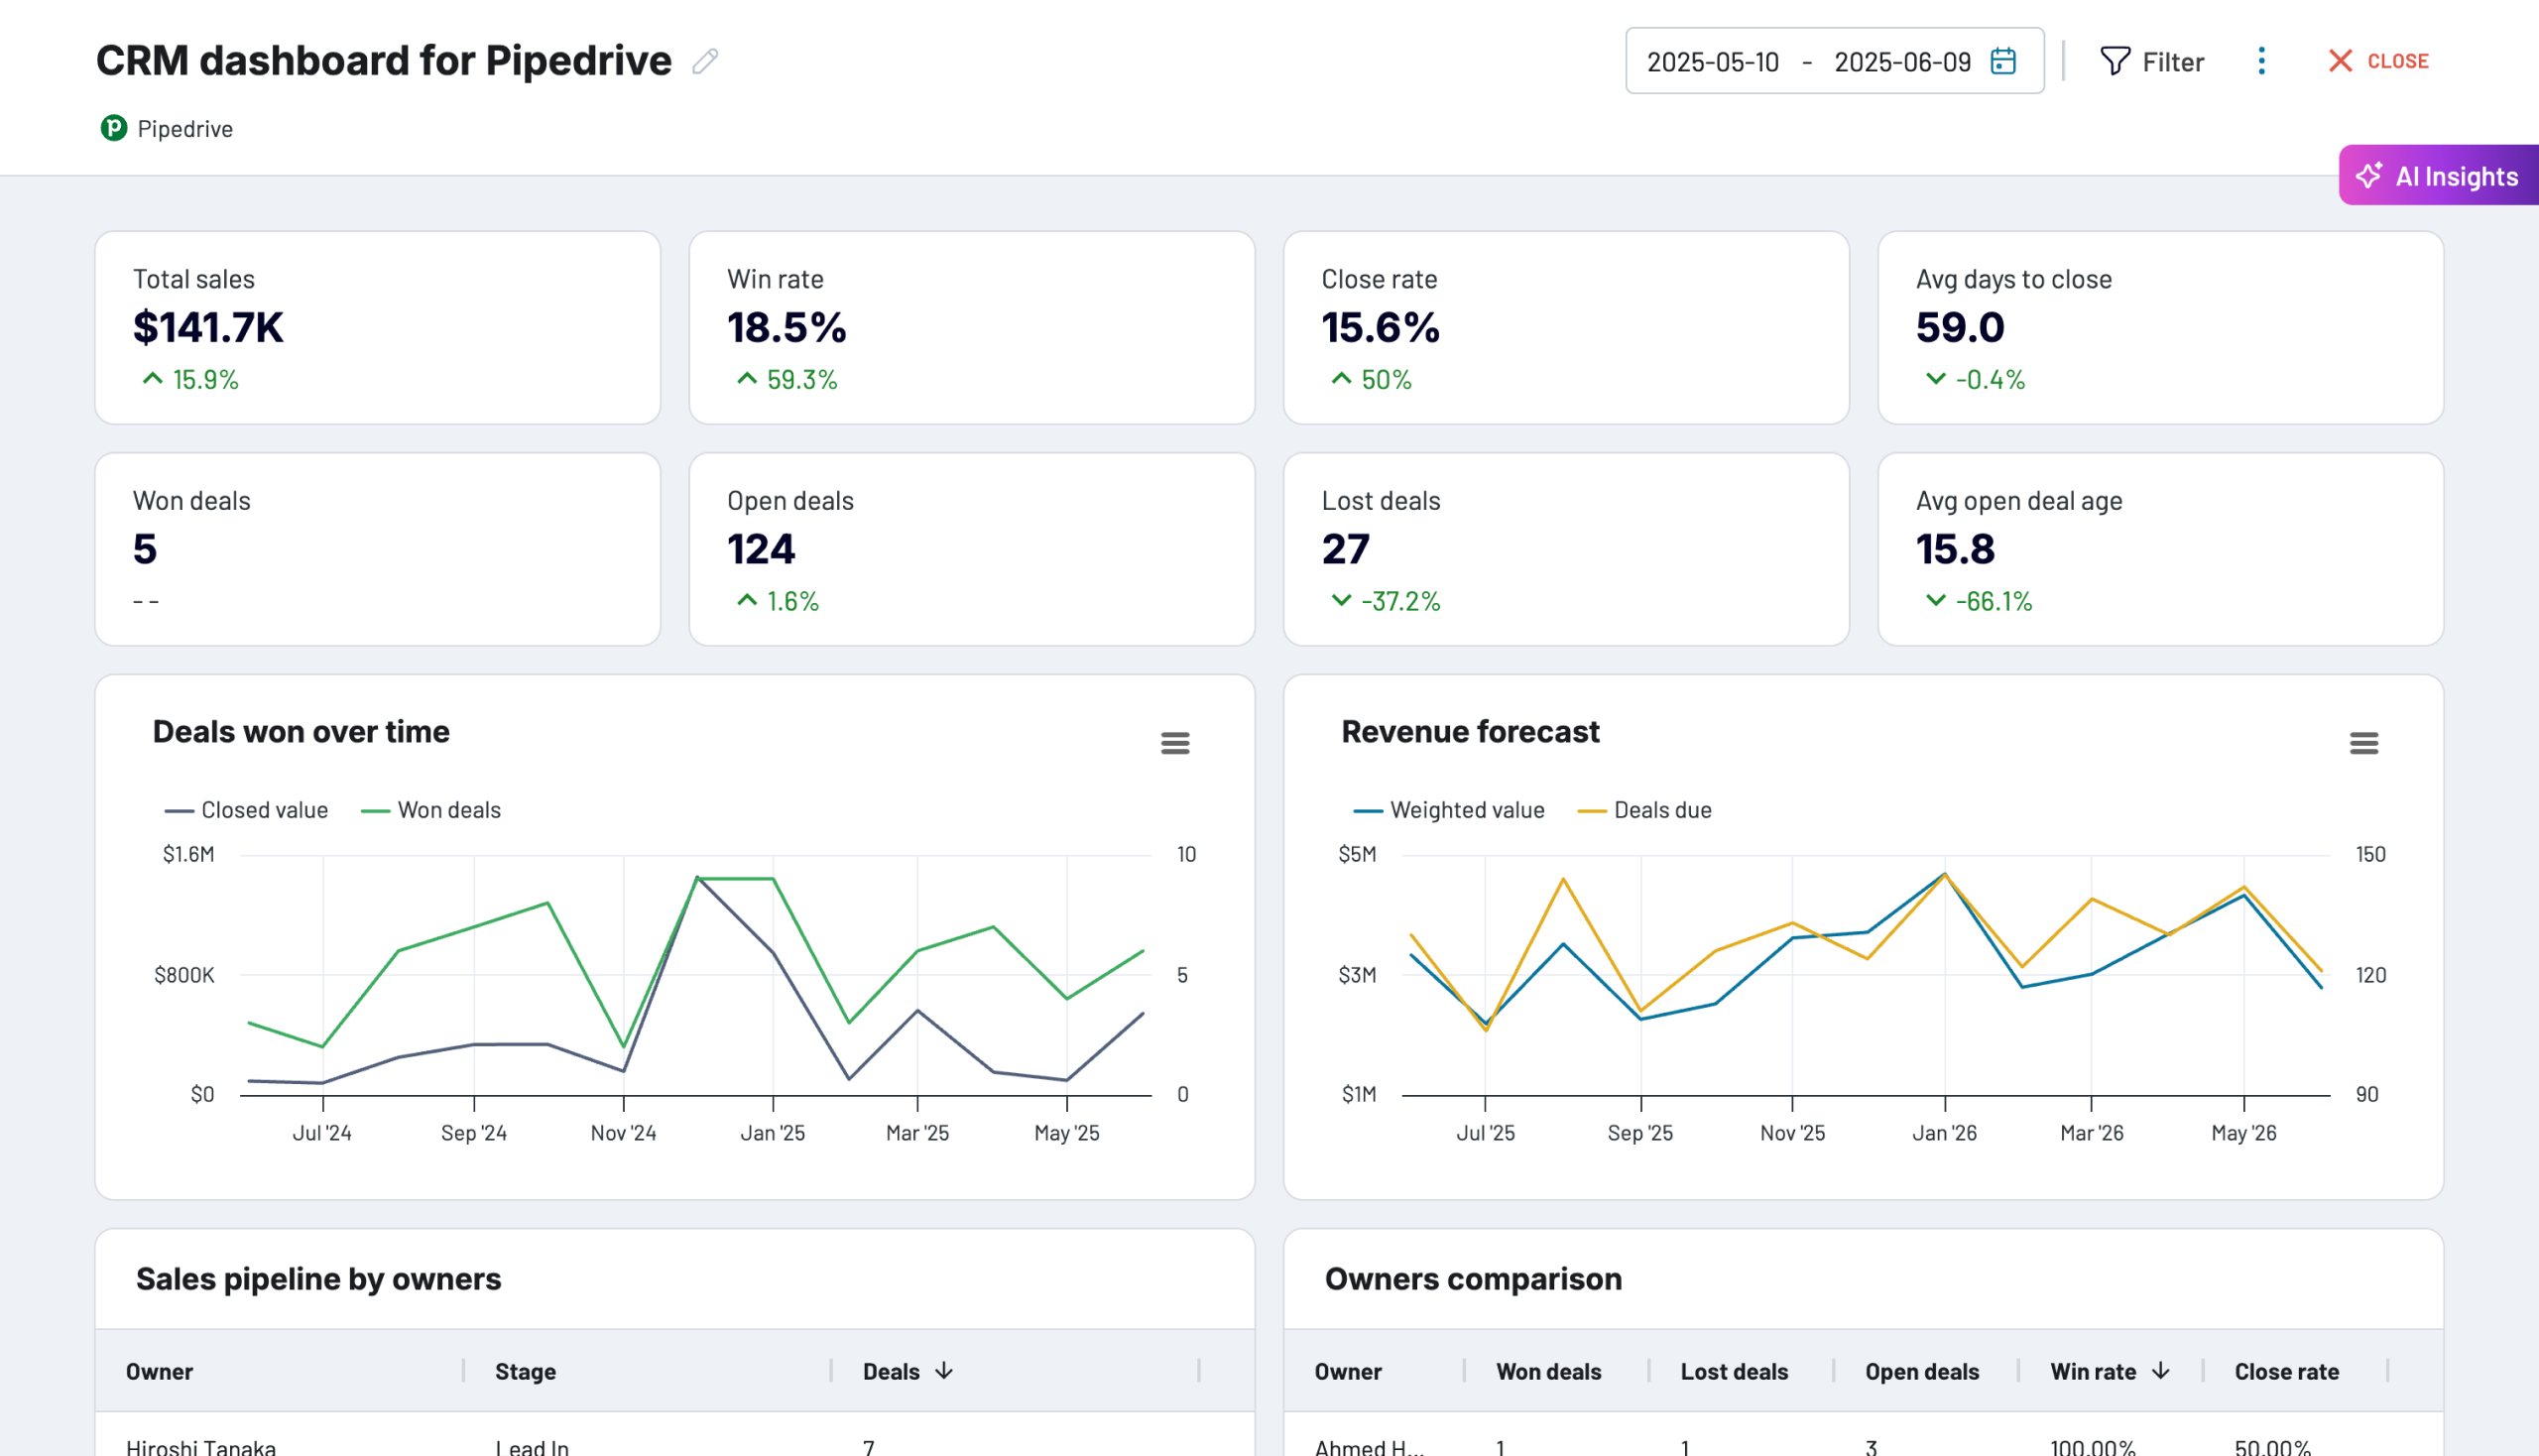
Monitor the total revenue generated from closed won deals across your entire sales team or filtered by individual owner, time period, or deal type. The dashboard for CRM visually highlights which sales reps or product lines contribute the most to your revenue, enabling focused resource allocation and performance-based compensation decisions. This metric is fundamental for understanding revenue achievement against targets and identifying your most valuable revenue drivers.
Track the percentage of deals that result in closed won outcomes compared to total closed deals (won plus lost). This metric reveals how effectively your sales team converts qualified opportunities into customers and helps identify which reps, deal types, or sales strategies produce the highest success rates. Low win rates may indicate poor lead qualification, ineffective sales processes, or competitive disadvantages that need addressing.
Measure the percentage of all deals (including open opportunities) that reach a closed status, whether won or lost. Unlike win rate which only considers closed deals, close rate shows how efficiently your team moves opportunities through the pipeline to resolution. This metric helps identify deals that remain in limbo and reveals whether your team needs better qualification criteria or more aggressive pipeline management to prevent deal stagnation.
Calculate the mean number of days between deal creation and closing, providing insight into your sales cycle length. This metric helps forecast revenue timing, identify deals taking longer than expected, and benchmark sales efficiency across different deal types or team members. Shorter sales cycles typically indicate better qualification, more effective sales processes, or stronger product-market fit.
Track the mean number of days that currently open opportunities have been in your pipeline since creation. These CRM dashboard examples show how long deals have been active without reaching a closed status, helping identify opportunities that may require immediate attention or re-engagement. This metric is particularly valuable for maintaining pipeline momentum and preventing deals from going stale.
Monitor the total number of opportunities currently in your pipeline that haven't reached a closed status. This metric helps sales managers assess whether the pipeline volume is sufficient to meet upcoming revenue targets. Combined with deal values and win probability data, open deals count provides the foundation for accurate sales forecasting and resource planning.
Track the aggregate potential revenue from all opportunities currently in your pipeline. Our CRM dashboard templates display the sum of all open deal amounts, providing a high-level view of potential revenue at risk or in progress. This metric helps leadership understand the total value of active opportunities and assess whether current pipeline coverage is adequate for meeting quarterly or annual targets.
Monitor the total number of opportunities that closed without resulting in a sale. This metric provides insight into how many potential customers your team failed to convert and serves as a key indicator of competitive pressure, pricing challenges, or sales process effectiveness. Tracking lost deals over time reveals trends in pipeline quality and conversion efficiency.
Track the total number of opportunities that successfully closed with a sale. This metric measures sales team productivity and success in converting pipeline opportunities into customers. Combined with win rate and average deal value, won deals count helps assess whether your team is meeting activity-based goals and maintaining healthy conversion levels throughout the sales process.
Identify the number of opportunities that haven't progressed or shown activity within a defined timeframe. This metric highlights deals at risk of being lost due to inactivity and enables proactive re-engagement before opportunities go cold. Sales managers use stalled deals count to prioritize coaching interventions and ensure team members maintain consistent follow-up cadences.