Sales pipeline dashboard examples and reporting templates
Accelerate deal closure and revenue growth with automated sales pipeline dashboards that transform raw CRM data into actionable insights. Track deal progression through every stage, identify conversion bottlenecks, and monitor team performance with real-time visualizations from Salesforce, HubSpot, and Pipedrive platforms.
Sales pipeline dashboard examples for every need


 +1
+1


 +3
+3


 +1
+1


 +3
+3

about your case. It doesn't cost you a penny 😉
Choose your white label sales pipeline dashboard to kick off
What is a sales pipeline reporting dashboard?
Sales pipeline dashboards transform complex sales data into clear visualizations that enable faster decision-making, proactive deal management, and strategic resource allocation. Through automated data refreshing via Coupler.io, our sales pipeline dashboard templates ensure sales teams always work with current pipeline information without manual data compilation or spreadsheet maintenance.

What reports should be included in sales pipeline dashboards?
A comprehensive sales pipeline reporting dashboard should integrate several key report types that provide complete visibility into your sales operations and deal progression. Based on an analysis of leading CRM-based dashboards, we recommend incorporating these essential report categories:
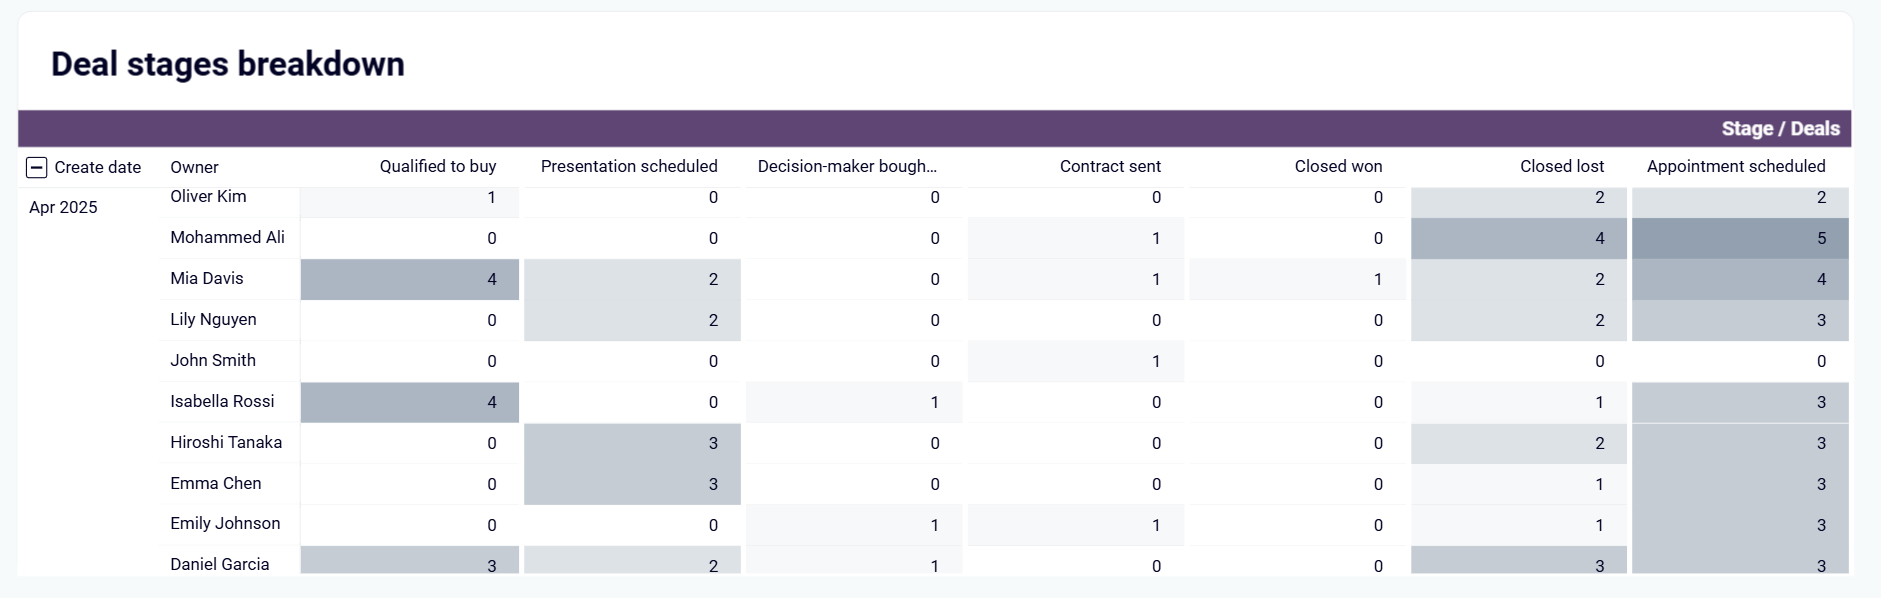
The deal progression report forms the foundation of pipeline analysis, tracking opportunities as they move through defined sales stages from initial contact to closure. This report includes stage-specific conversion rates, average time spent in each phase, and deal velocity metrics that reveal bottlenecks and optimization opportunities. It provides visual funnel representations showing exactly where prospects drop off and which stages require additional sales support or process refinement.
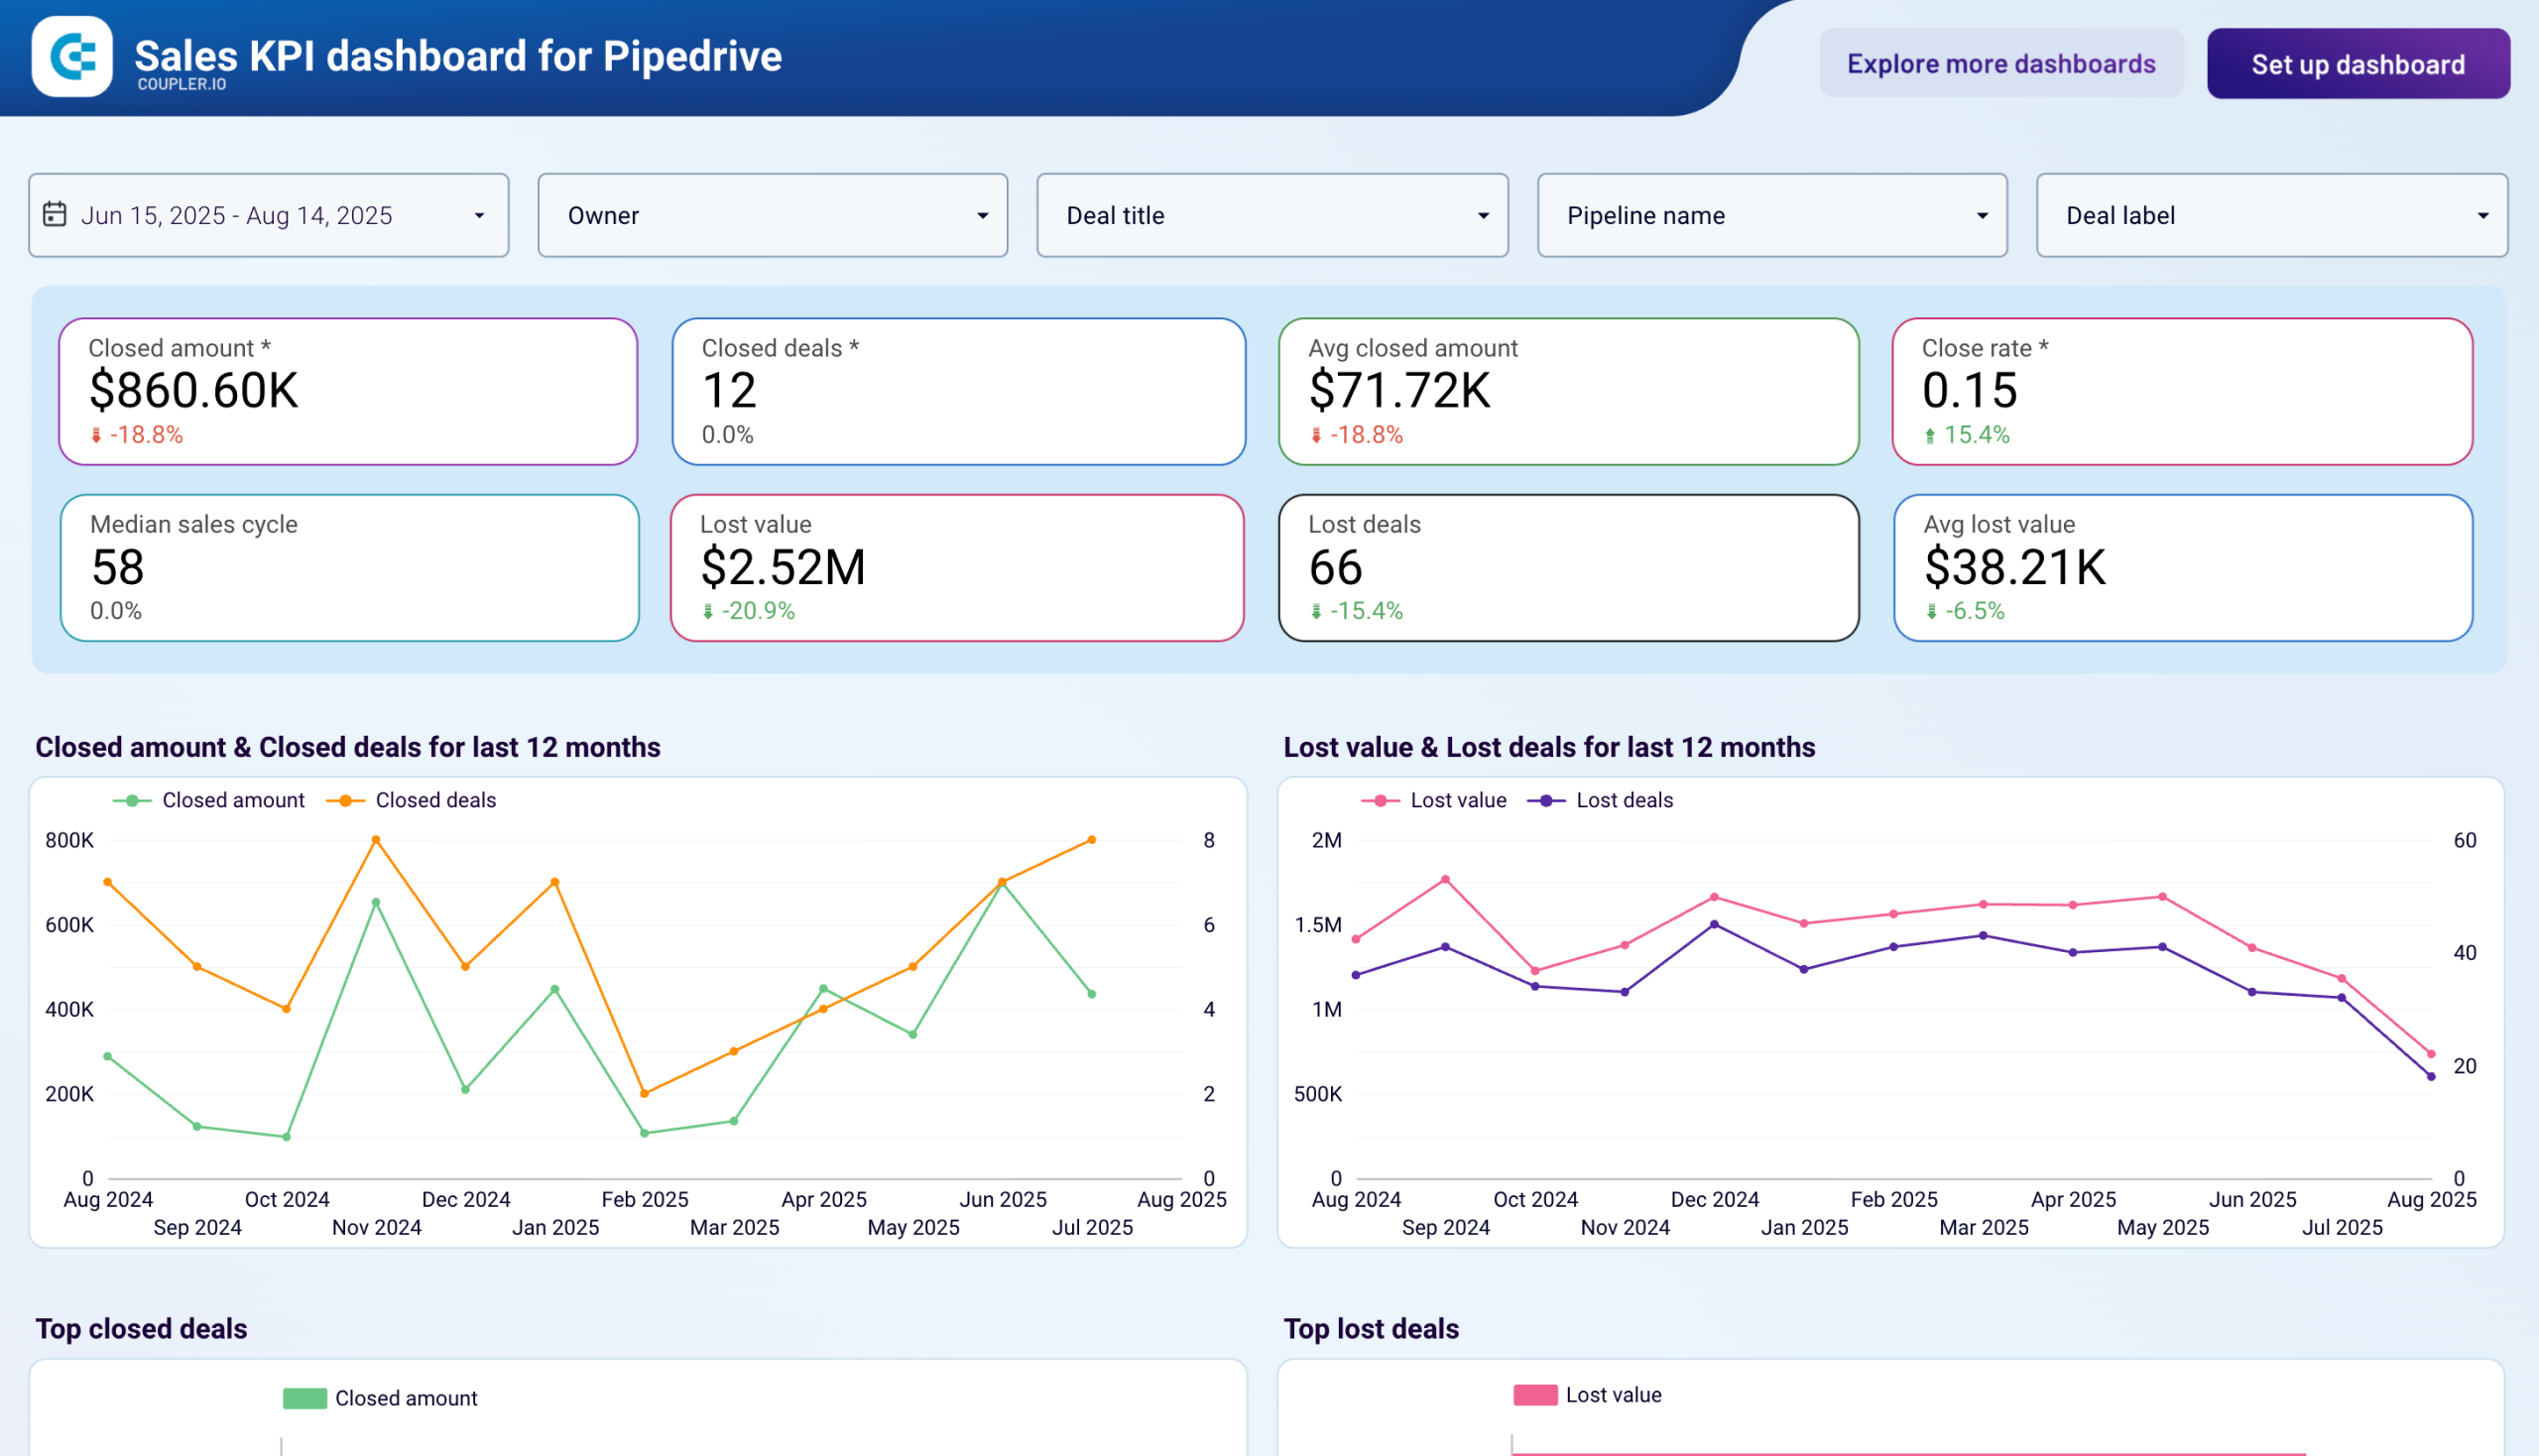
The pipeline health report delivers critical performance monitoring through comprehensive deal distribution analysis across all active stages. It includes won/lost ratio tracking, revenue forecasting based on stage probabilities, and stalled deal identification to prevent opportunity leakage. These insights help sales managers assess overall pipeline quality, predict future revenue streams, and implement proactive measures to maintain healthy deal flow throughout the sales process.
The team performance report enables detailed analysis of individual and collective sales effectiveness through comparative metrics showing win rates, deal closure timelines, and revenue contribution by team member. It includes territory-based performance breakdowns, quota attainment tracking, and best practice identification from top-performing representatives. This report helps optimize resource allocation, identify coaching opportunities, and recognize high-achieving sales strategies for replication across the team.
The revenue forecasting report provides strategic planning capabilities through historical trend analysis and predictive modeling based on current pipeline data. It includes seasonal pattern recognition, marketing campaign attribution to closed deals, and scenario planning tools that help leadership make informed budget and staffing decisions. These insights enable accurate revenue projections, resource planning alignment, and strategic initiative prioritization based on expected sales outcomes.
What insights you can get with the sales pipeline dashboard
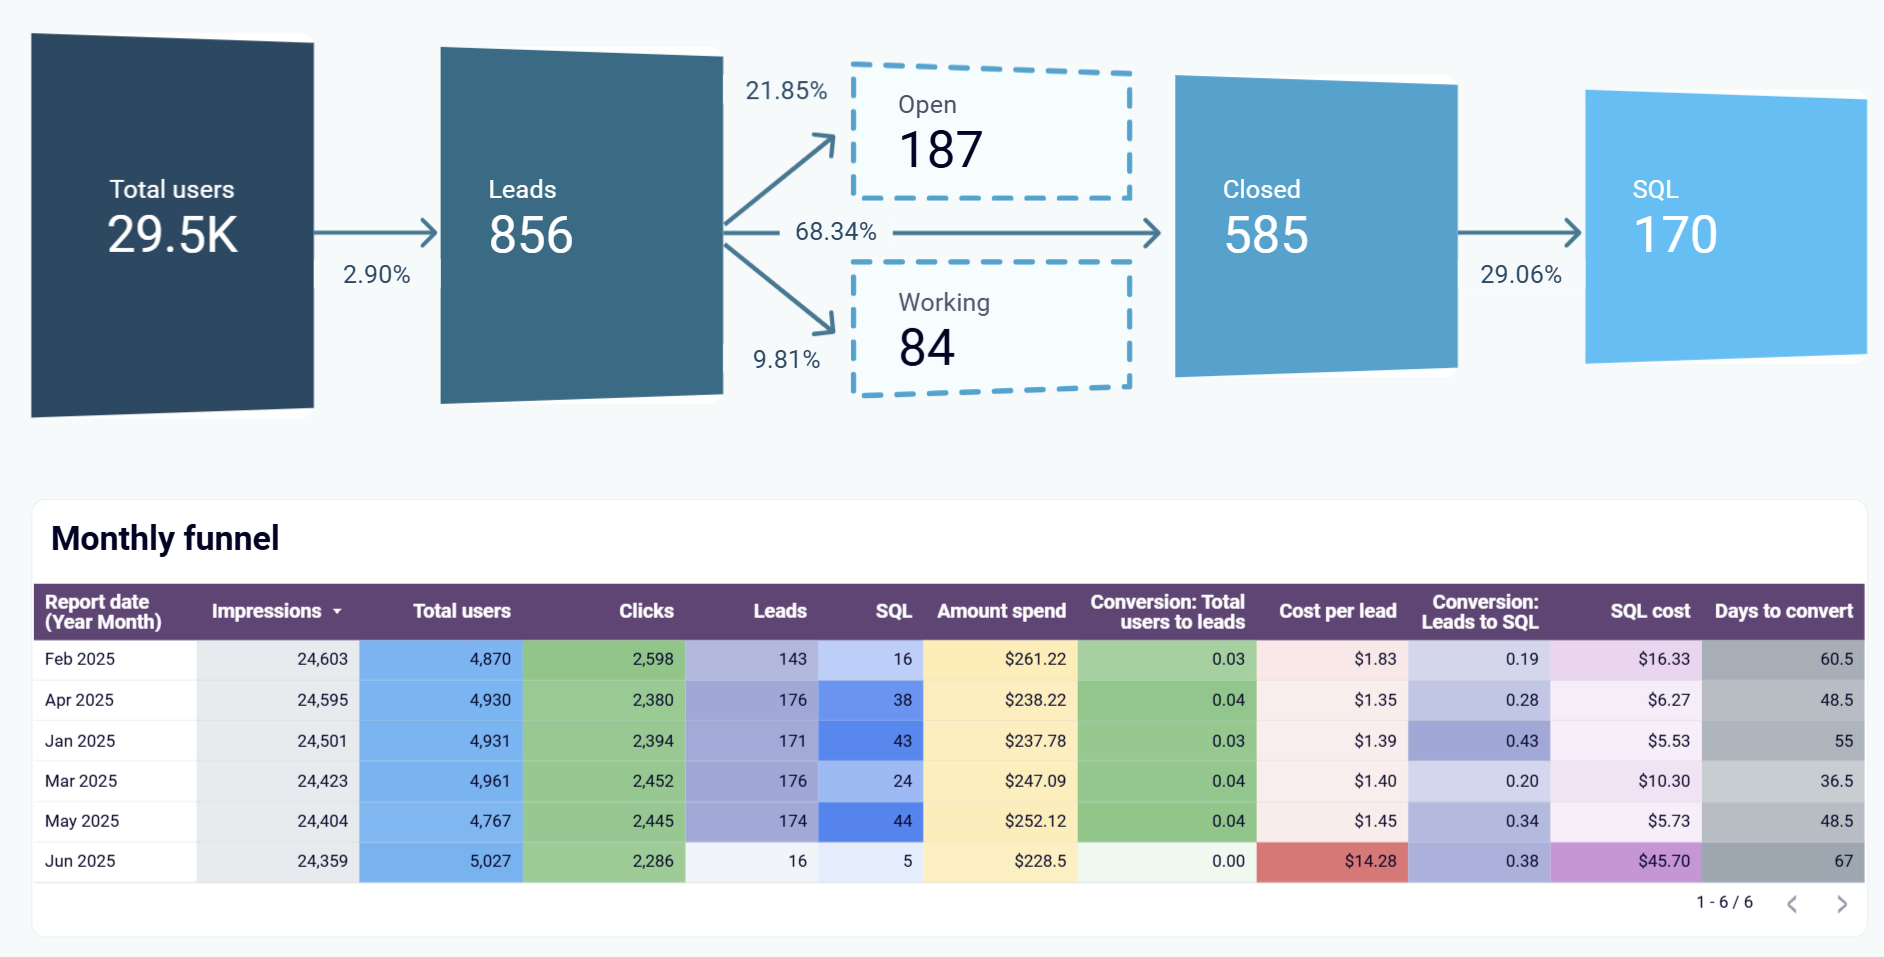
Comprehensive pipeline health assessment showing opportunity distribution across all sales stages from initial contact to closure. This visualization reveals exactly where deals accumulate, which stages experience the highest drop-off rates, and how deal flow impacts overall revenue projections and sales team productivity.
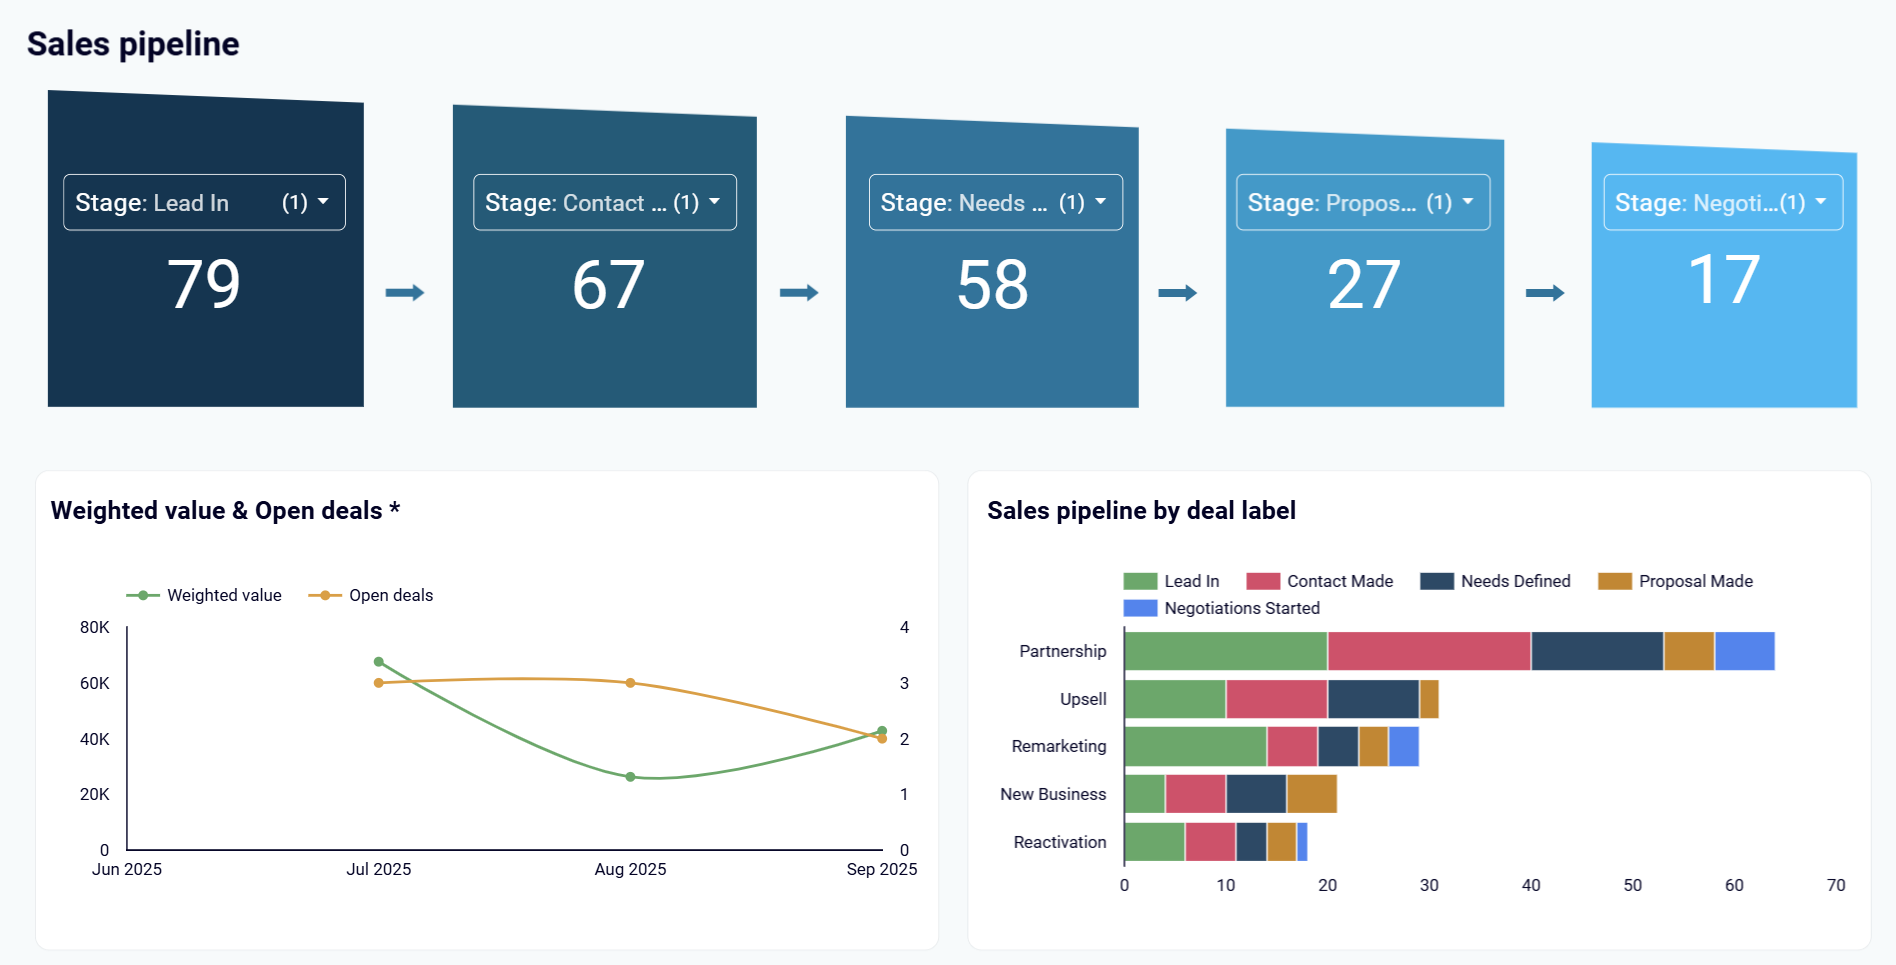
Advanced funnel performance analysis with customizable stage definitions that pinpoint exactly where prospects exit the sales process. This insight enables sales teams to identify process inefficiencies, implement targeted interventions, and optimize conversion rates at each critical decision point throughout the customer journey.
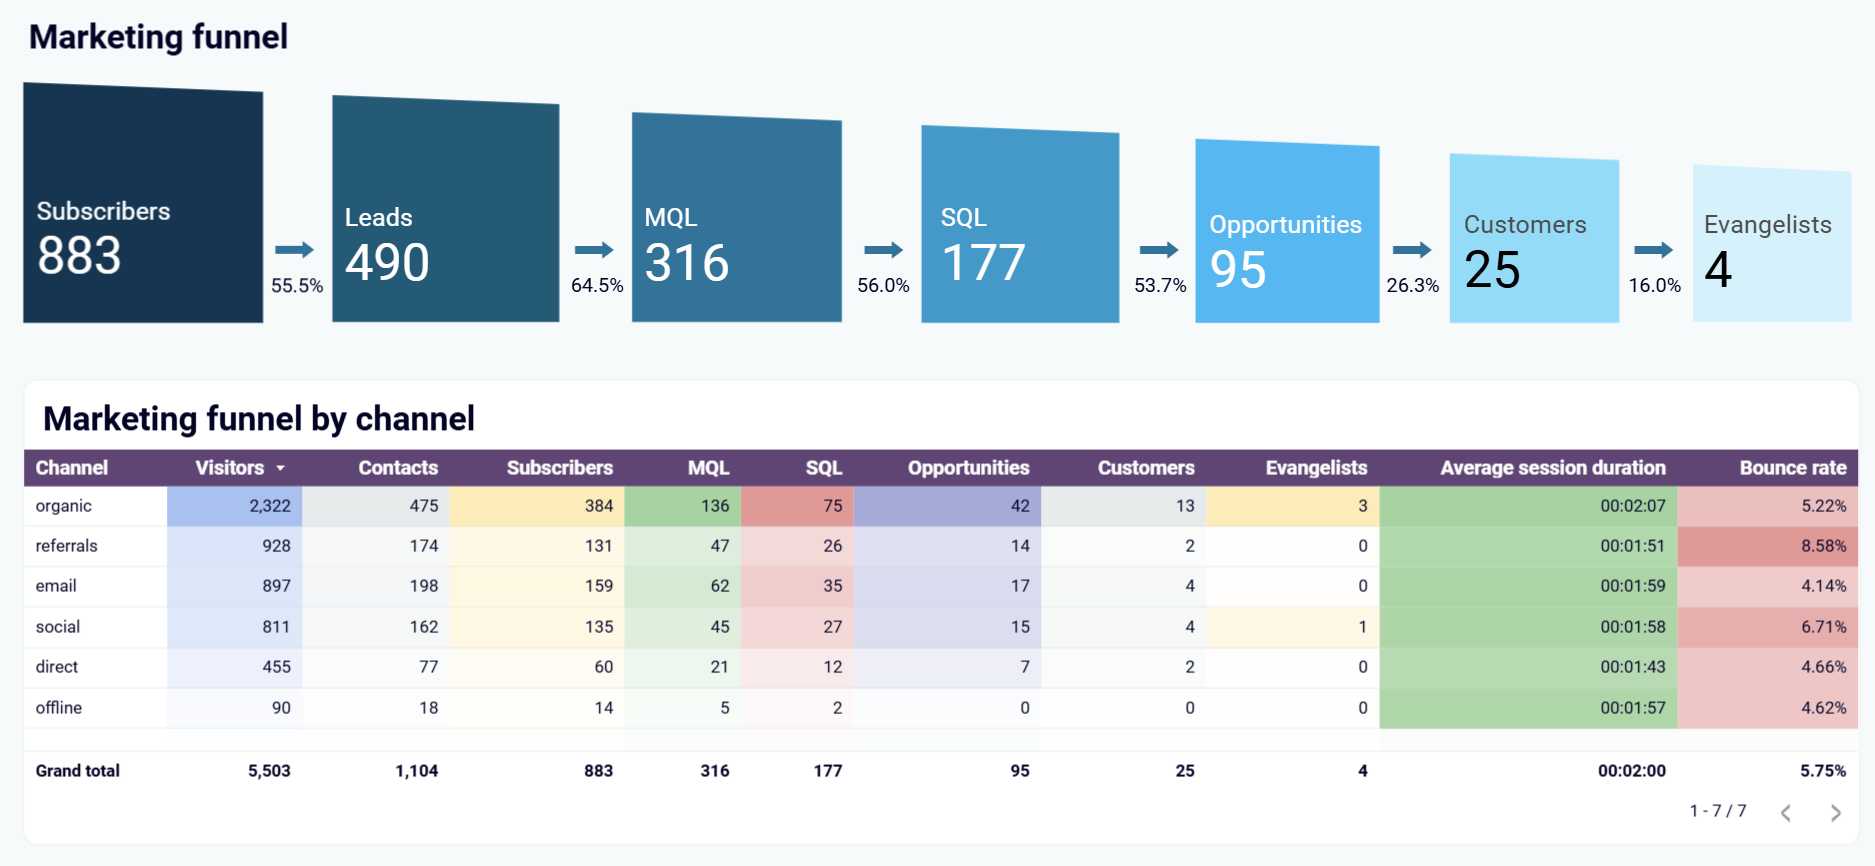
Complete customer journey visualization from subscribers to evangelists with conversion percentages at each stage. This analysis identifies marketing-to-sales handoff bottlenecks, optimizes pipeline flow, and provides clear visibility into how leads progress through multiple touchpoints before becoming customers.
Advanced funnel analysis combining GA4 traffic data with Salesforce conversions to show the complete journey from website visitors to closed deals. This insight enables assessment of traffic-to-lead conversion effectiveness, regional performance comparison, and identification of high-converting traffic sources for strategic marketing optimization.
How to create a sales pipeline dashboard?

Metrics you can track with a sales pipeline dashboard template
Monitor the percentage of opportunities that successfully progress from one pipeline stage to the next, enabling identification of conversion bottlenecks and optimization of sales processes. This metric reveals which stages require additional sales support, process refinement, or team coaching to improve overall pipeline efficiency and deal closure rates.
Track the time required for opportunities to progress from initial contact through deal closure, segmented by deal type, value, and sales representative. This metric helps forecast revenue timing, identify deals at risk of stalling, and optimize sales processes to accelerate deal velocity while maintaining closure quality.
Compare characteristics of successfully closed deals against lost opportunities, including deal size, source attribution, sales cycle length, and competitive factors. This analysis reveals winning deal patterns, identifies common loss reasons, and enables sales teams to refine qualification criteria and competitive positioning strategies for improved success rates.
Track individual and collective sales team performance through metrics including deals closed, revenue generated, quota achievement percentages, and activity-to-outcome ratios. This comprehensive performance analysis enables identification of top performers, coaching opportunity recognition, and resource allocation optimization to maximize team productivity and revenue generation.
Monitor how long opportunities remain in each pipeline stage and identify deals that exceed optimal timeframes for their current position. This metric enables proactive deal management, prevents opportunity loss through neglect, and helps sales teams maintain momentum throughout the sales process with timely follow-up actions.
Track the percentage of deals successfully closed by each team member, enabling performance comparison and identification of top performers. This metric reveals individual strengths, coaching opportunities, and successful sales strategies that can be replicated across the team to improve overall pipeline conversion rates.
Monitor opportunities that remain inactive for extended periods, categorized by deal type, value, and time in the current stage. This metric enables proactive intervention strategies, prevents deal loss through neglect, and helps maintain pipeline momentum with systematic follow-up processes and recovery tactics.
Analyze the size and composition of opportunities across different pipeline stages, segmented by deal type, industry, and revenue potential. This metric helps optimize resource allocation, identify high-value opportunity patterns, and ensure appropriate attention is given to deals with the greatest revenue impact on overall sales performance.