YouTube dashboard examples and reporting templates
Optimize your video content strategy with automated YouTube dashboard templates that consolidate performance data from YouTube Analytics. Track video views, monitor subscriber growth, analyze traffic sources, and measure engagement metrics to make informed decisions about your content strategy and channel optimization.
YouTube dashboard examples for every need


 +6
+6


 +5
+5
 +6
+6


about your case. It doesn't cost you a penny 😉
Choose your white label YouTube dashboard to kick off
What is a YouTube dashboard?
YouTube dashboards integrate seamlessly with Coupler.io to automate data collection and refresh, eliminating manual reporting tasks. They enable creators to track content performance trends, identify successful video formats, understand audience behavior patterns, and optimize publishing strategies based on real viewer engagement data rather than assumptions.

What reports should be included in YouTube dashboards?
A comprehensive YouTube channel dashboard should incorporate four essential report types that provide complete visibility into your channel's performance and growth potential. Based on our analysis of YouTube Analytics data, these reports deliver the insights needed for strategic content decisions.
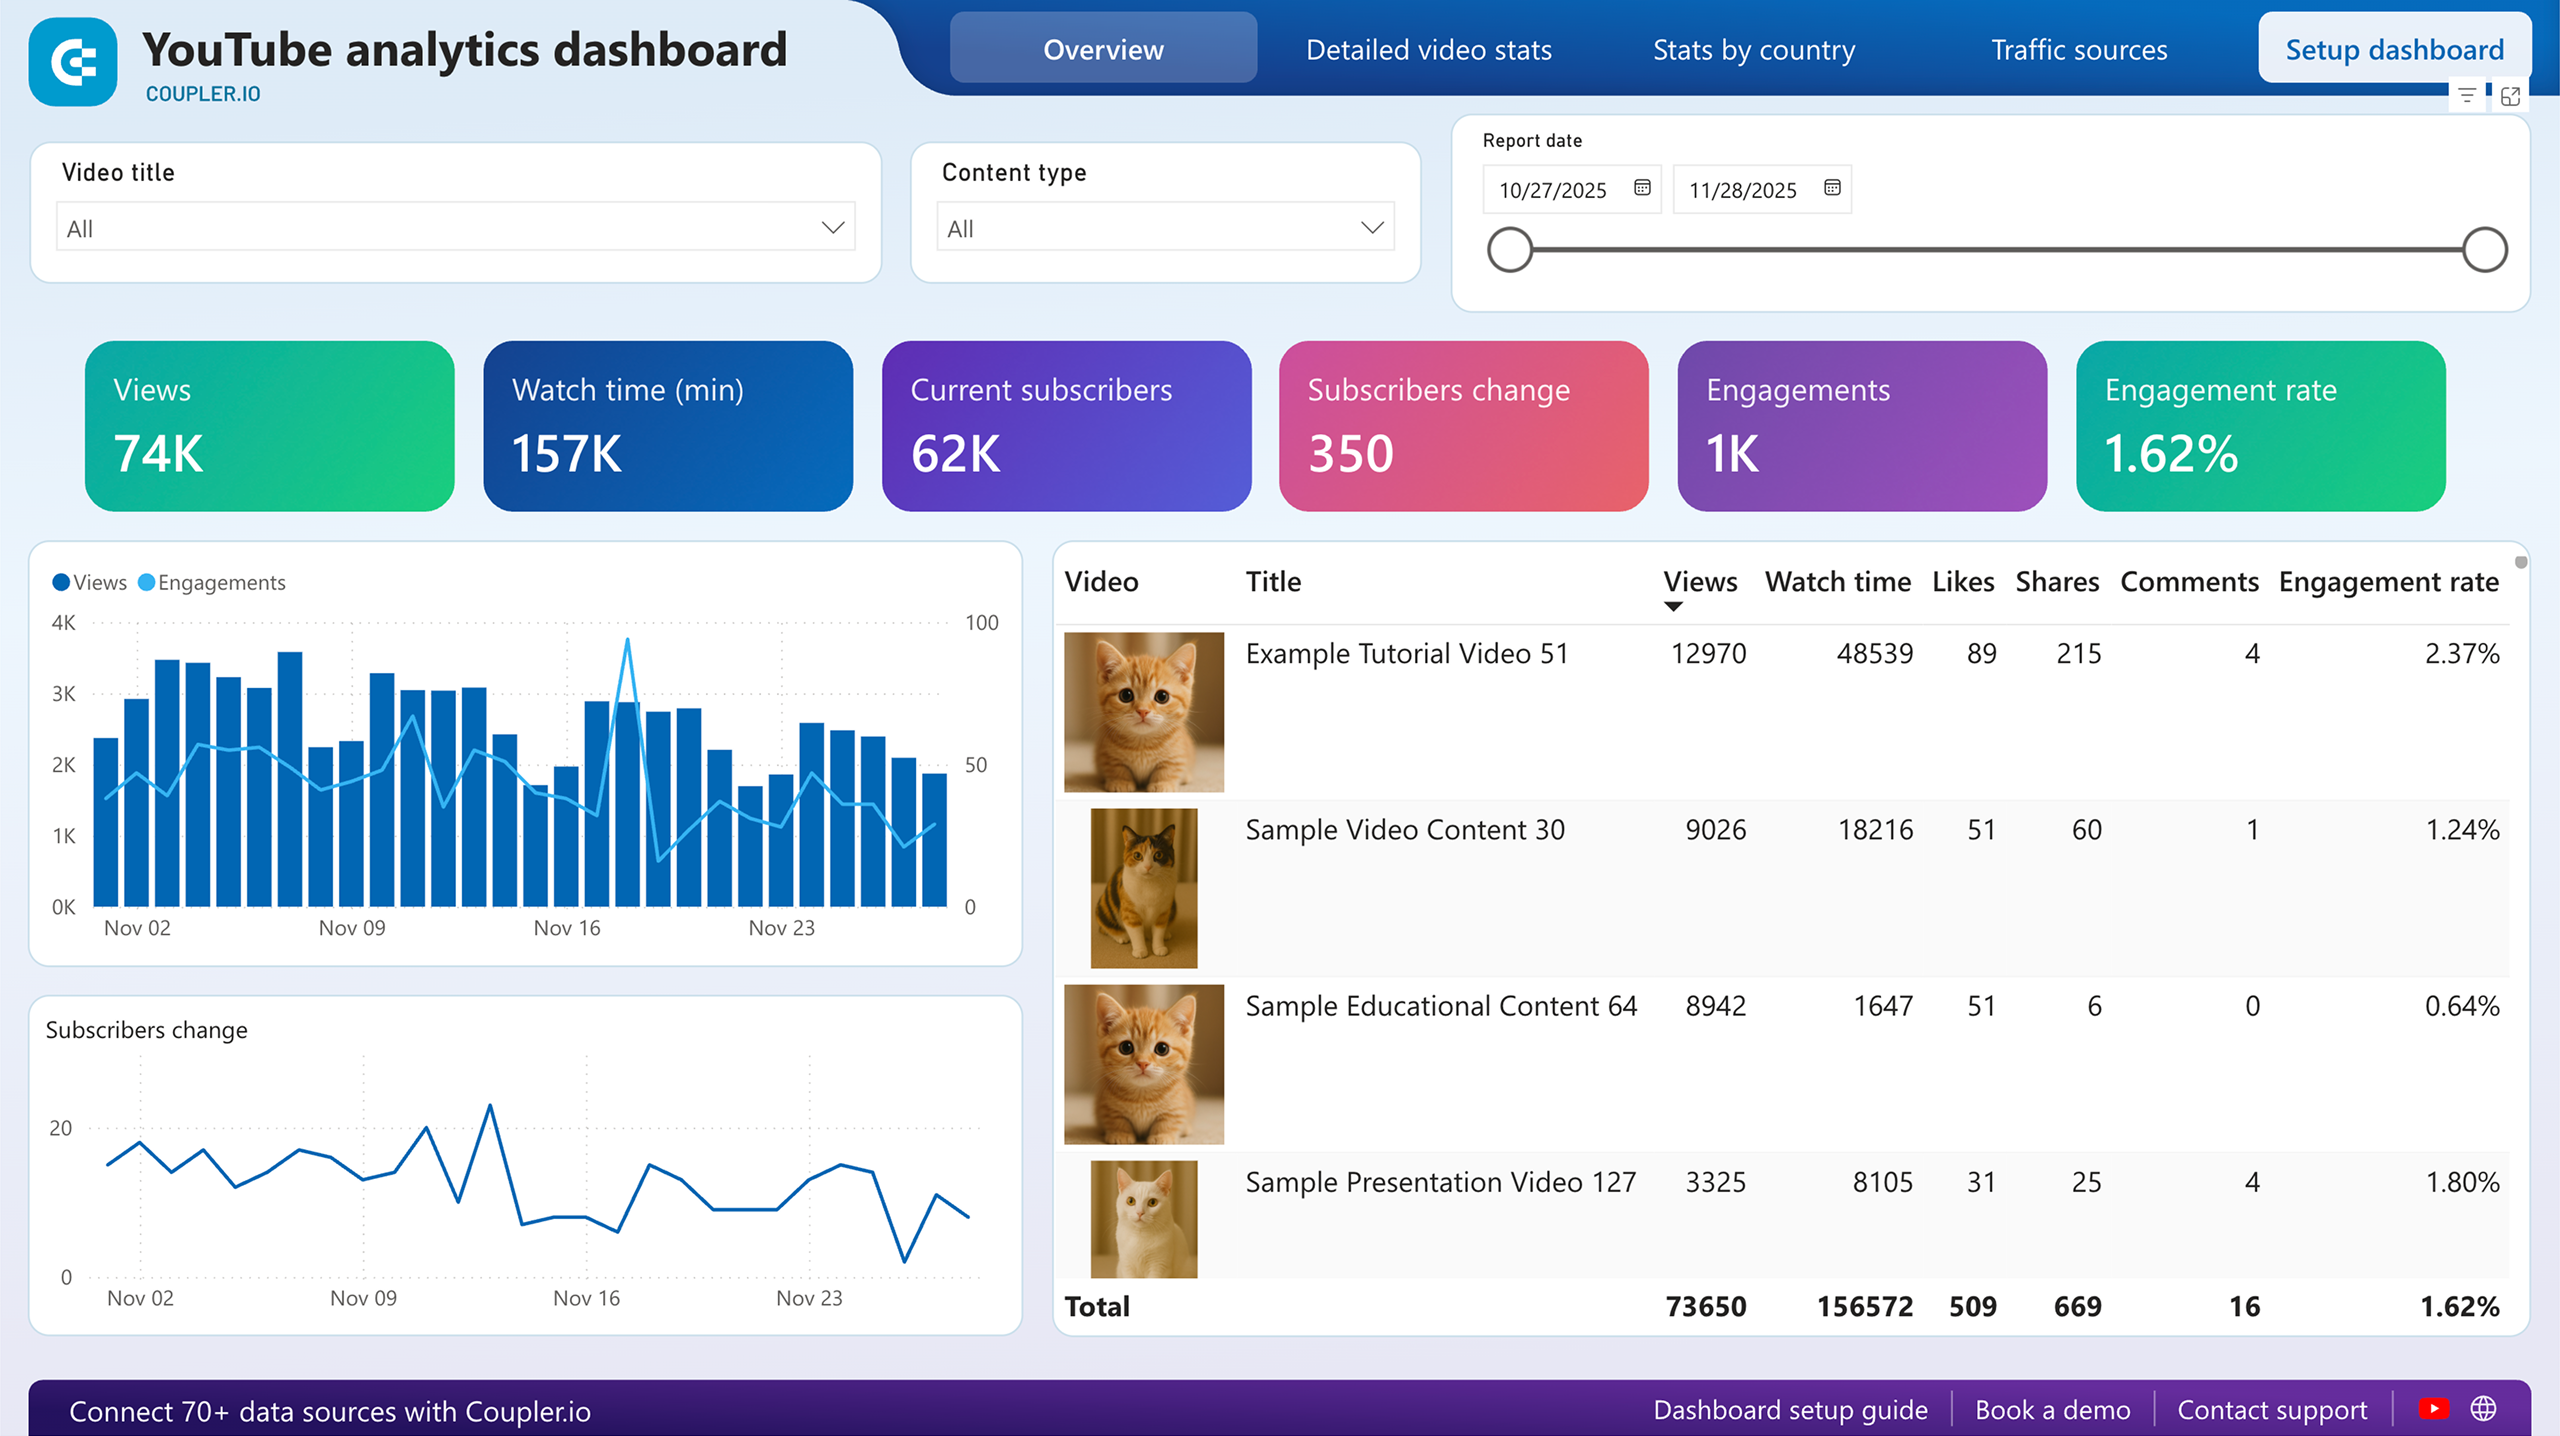
The top content analysis report identifies your highest-performing videos by views, engagement rates, and subscriber impact. This report highlights which video formats, topics, and styles resonate most with your audience through comparative performance metrics. It displays top-performing videos alongside engagement breakdowns, including likes, comments, shares, and watch time duration.
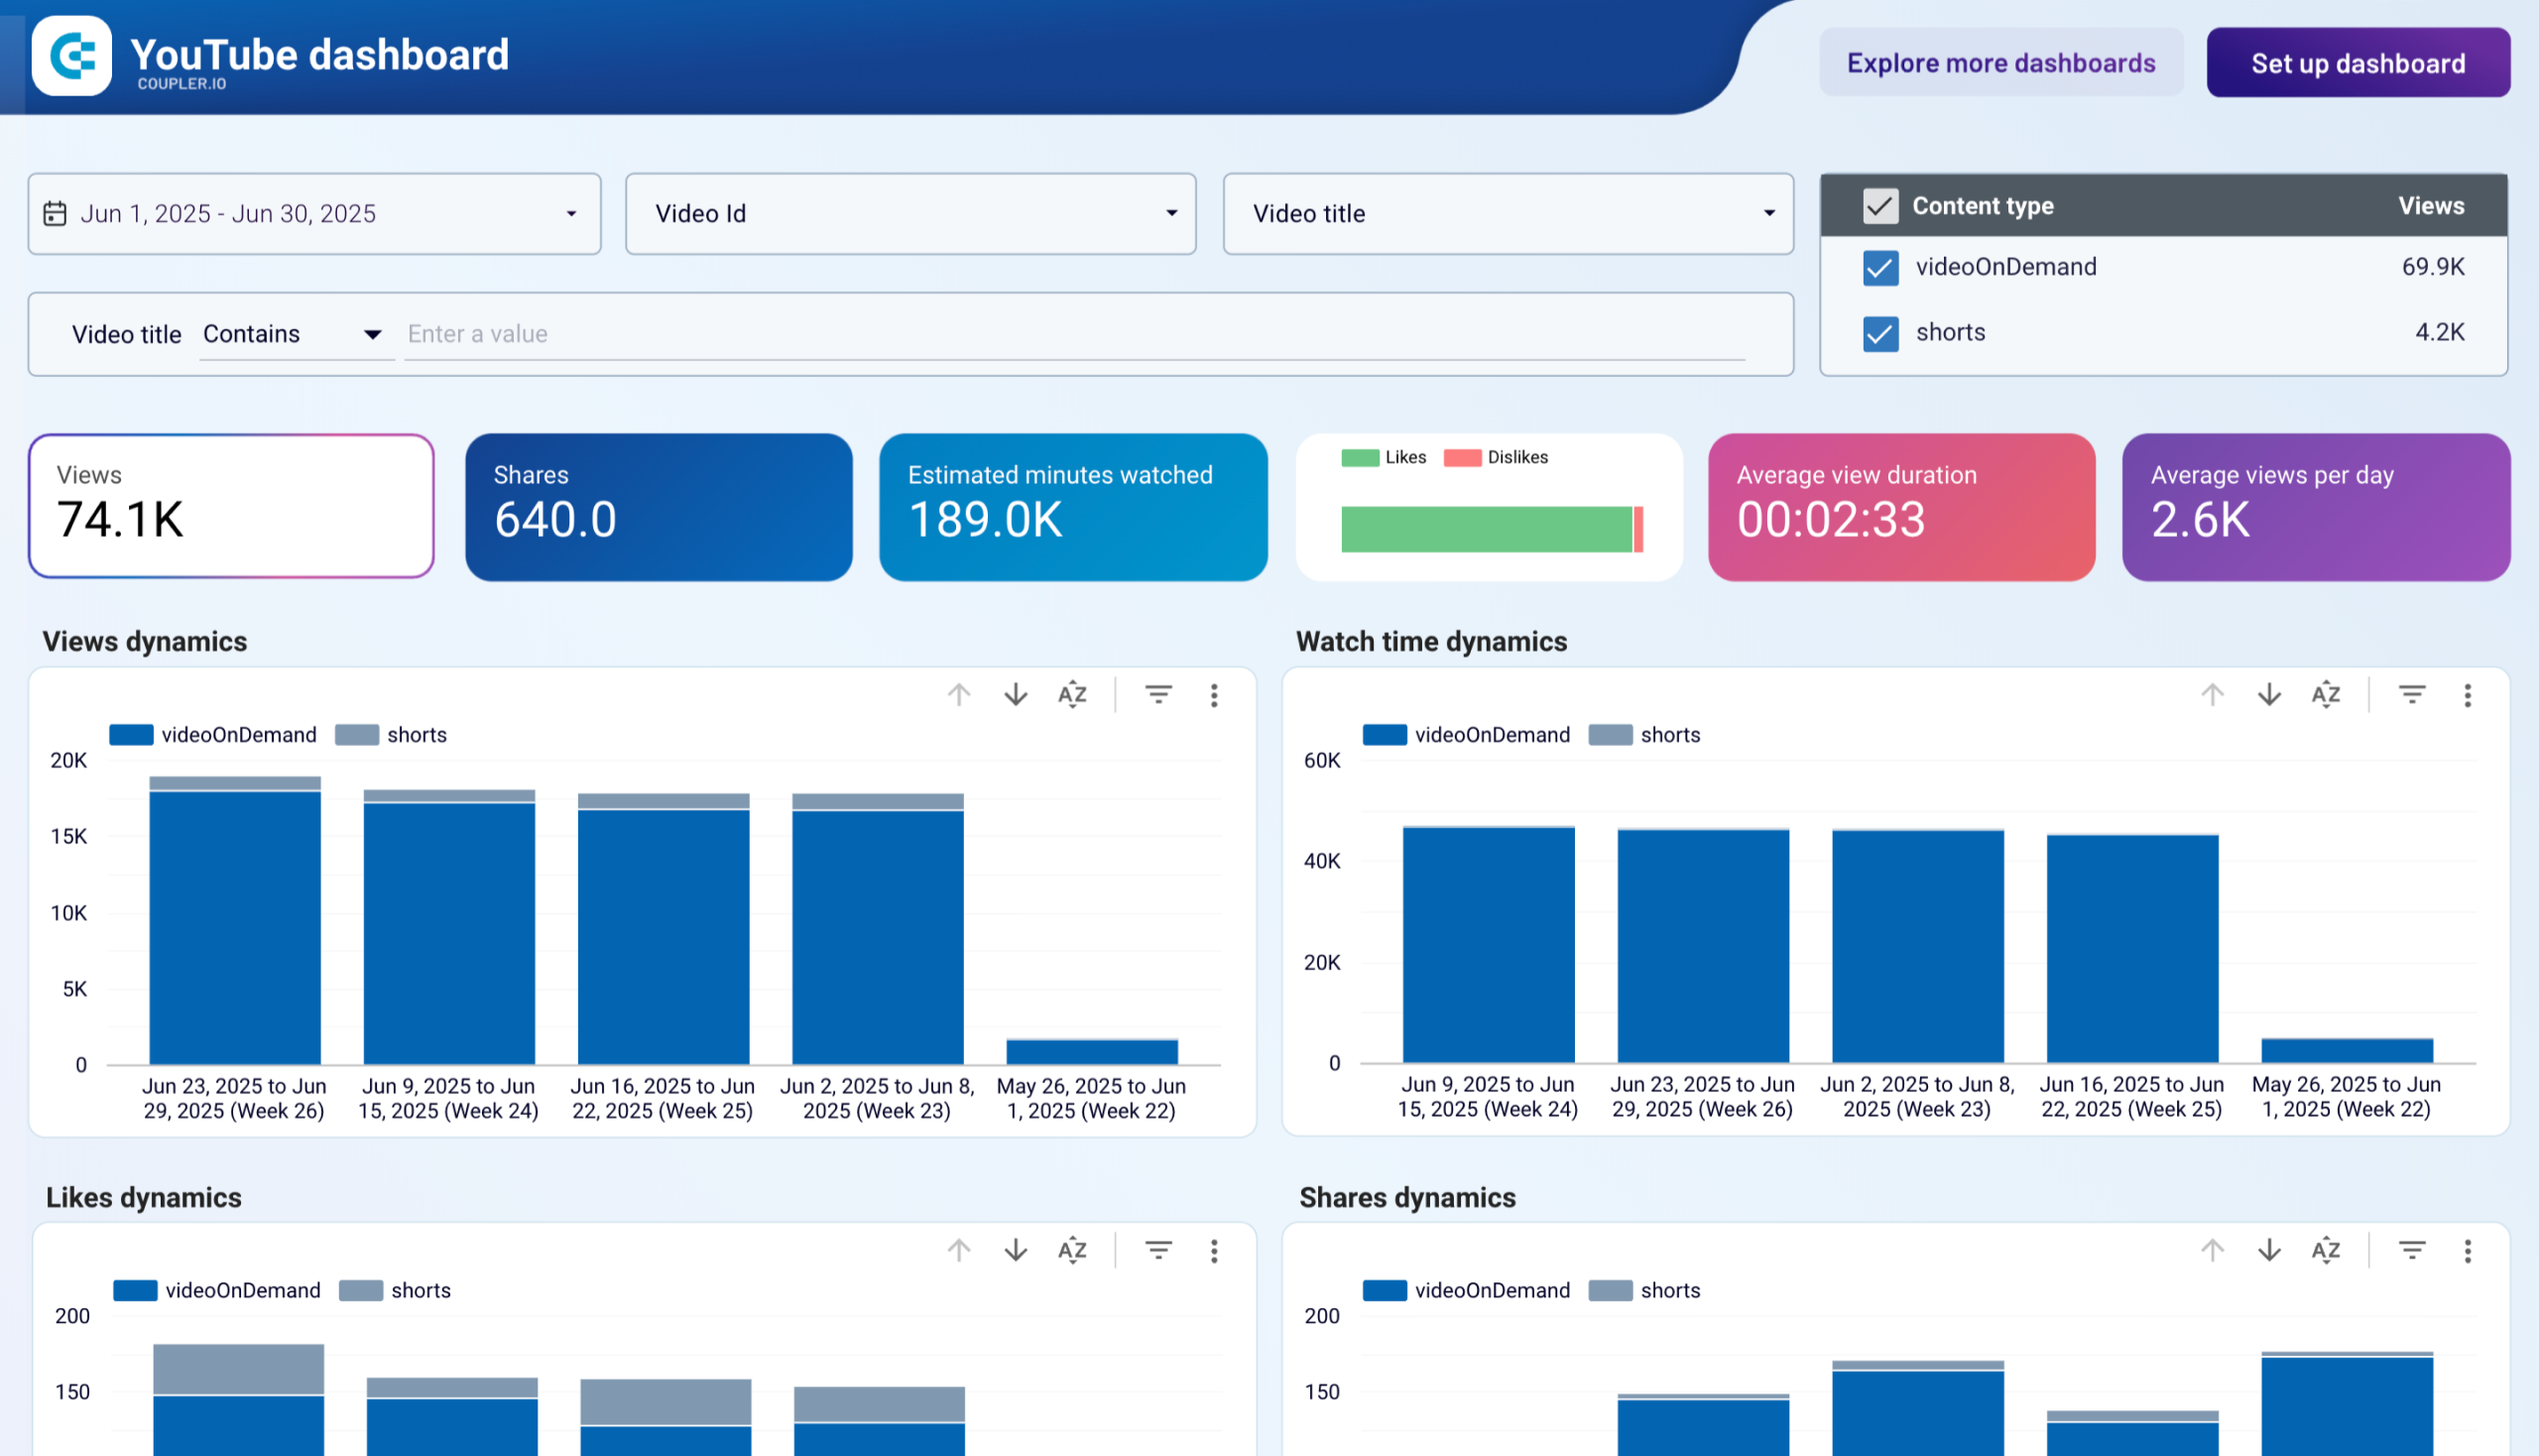
The video view performance tracking report provides detailed analytics for individual video metrics across your entire content library. This report monitors minutes watched, average view duration, views per day, and retention rates with flexible filtering capabilities by video ID, title, or content type. It enables creators to compare YouTube Shorts analytics performance against traditional long-form videos and identify which content formats drive sustained engagement.
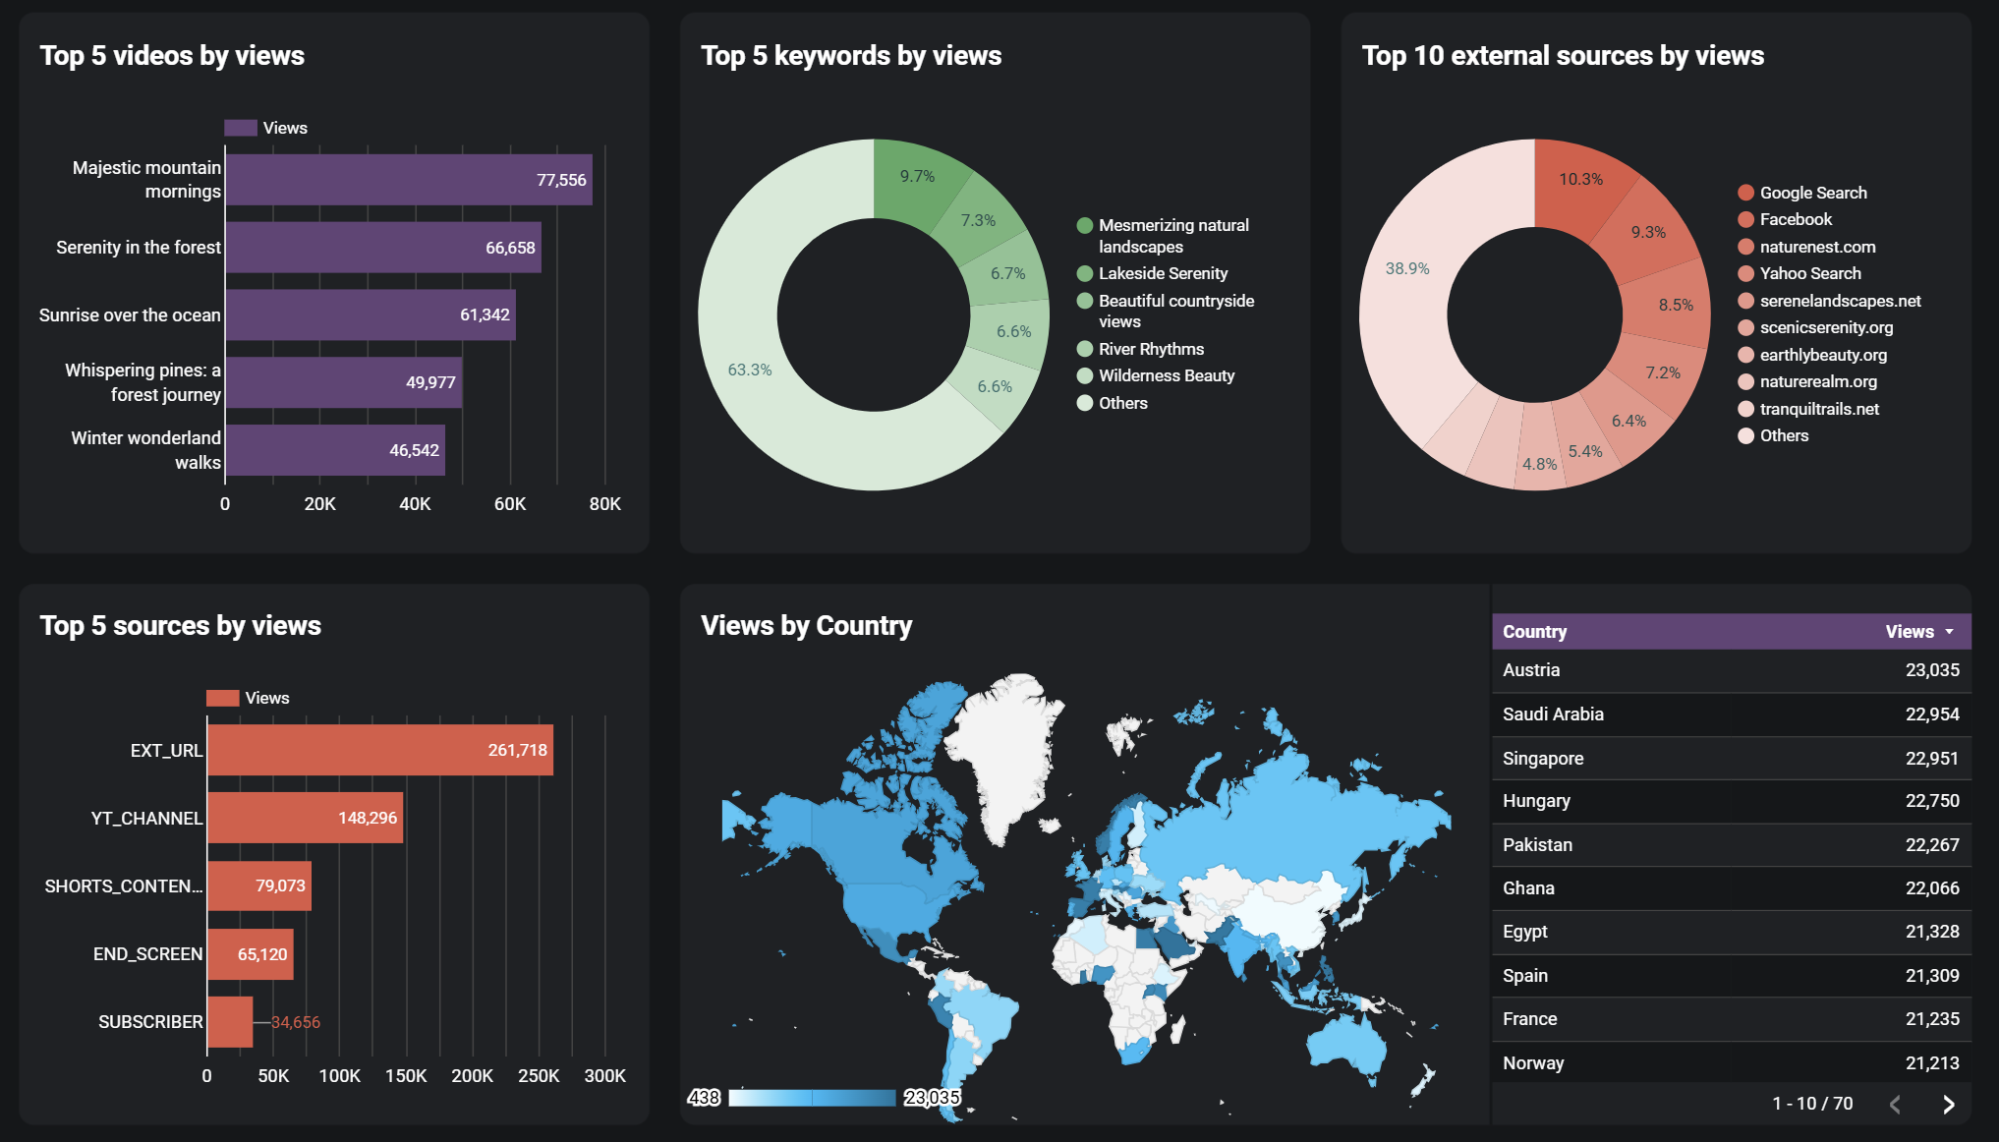
The traffic source analysis report reveals how viewers discover your content across different platforms and search methods. This report breaks down traffic from YouTube Search, suggested videos, external websites, social media platforms, and direct channel visits. It includes keyword analysis showing which search terms bring viewers to your content, enabling SEO optimization for better discoverability.
The subscriber impact analysis report tracks how individual videos influence your channel's subscriber growth or decline. This report displays subscriber gains and losses attributed to specific videos, allowing creators to identify content that attracts long-term followers versus one-time viewers. It provides insights into which video topics, thumbnails, or calls-to-action most effectively convert viewers into subscribers.
What insights you can get with the YouTube dashboard template
Identify your most successful content through comprehensive video performance rankings that compare views, engagement rates, and subscriber conversion across your entire content library. The YouTube KPI dashboard highlights which video topics, formats, and production styles consistently outperform others, enabling you to focus resources on content types that deliver measurable results. This analysis helps you understand audience preferences and replicate successful elements in future videos for sustained channel growth.
Access granular performance data for every video, including minutes watched, average view duration, views per day, and retention patterns through flexible filtering options. The dashboard enables comparison between YouTube Shorts and traditional videos, helping you optimize content strategy based on format performance. This detailed tracking reveals which videos maintain audience attention and drive repeat viewership, informing content length and pacing decisions.
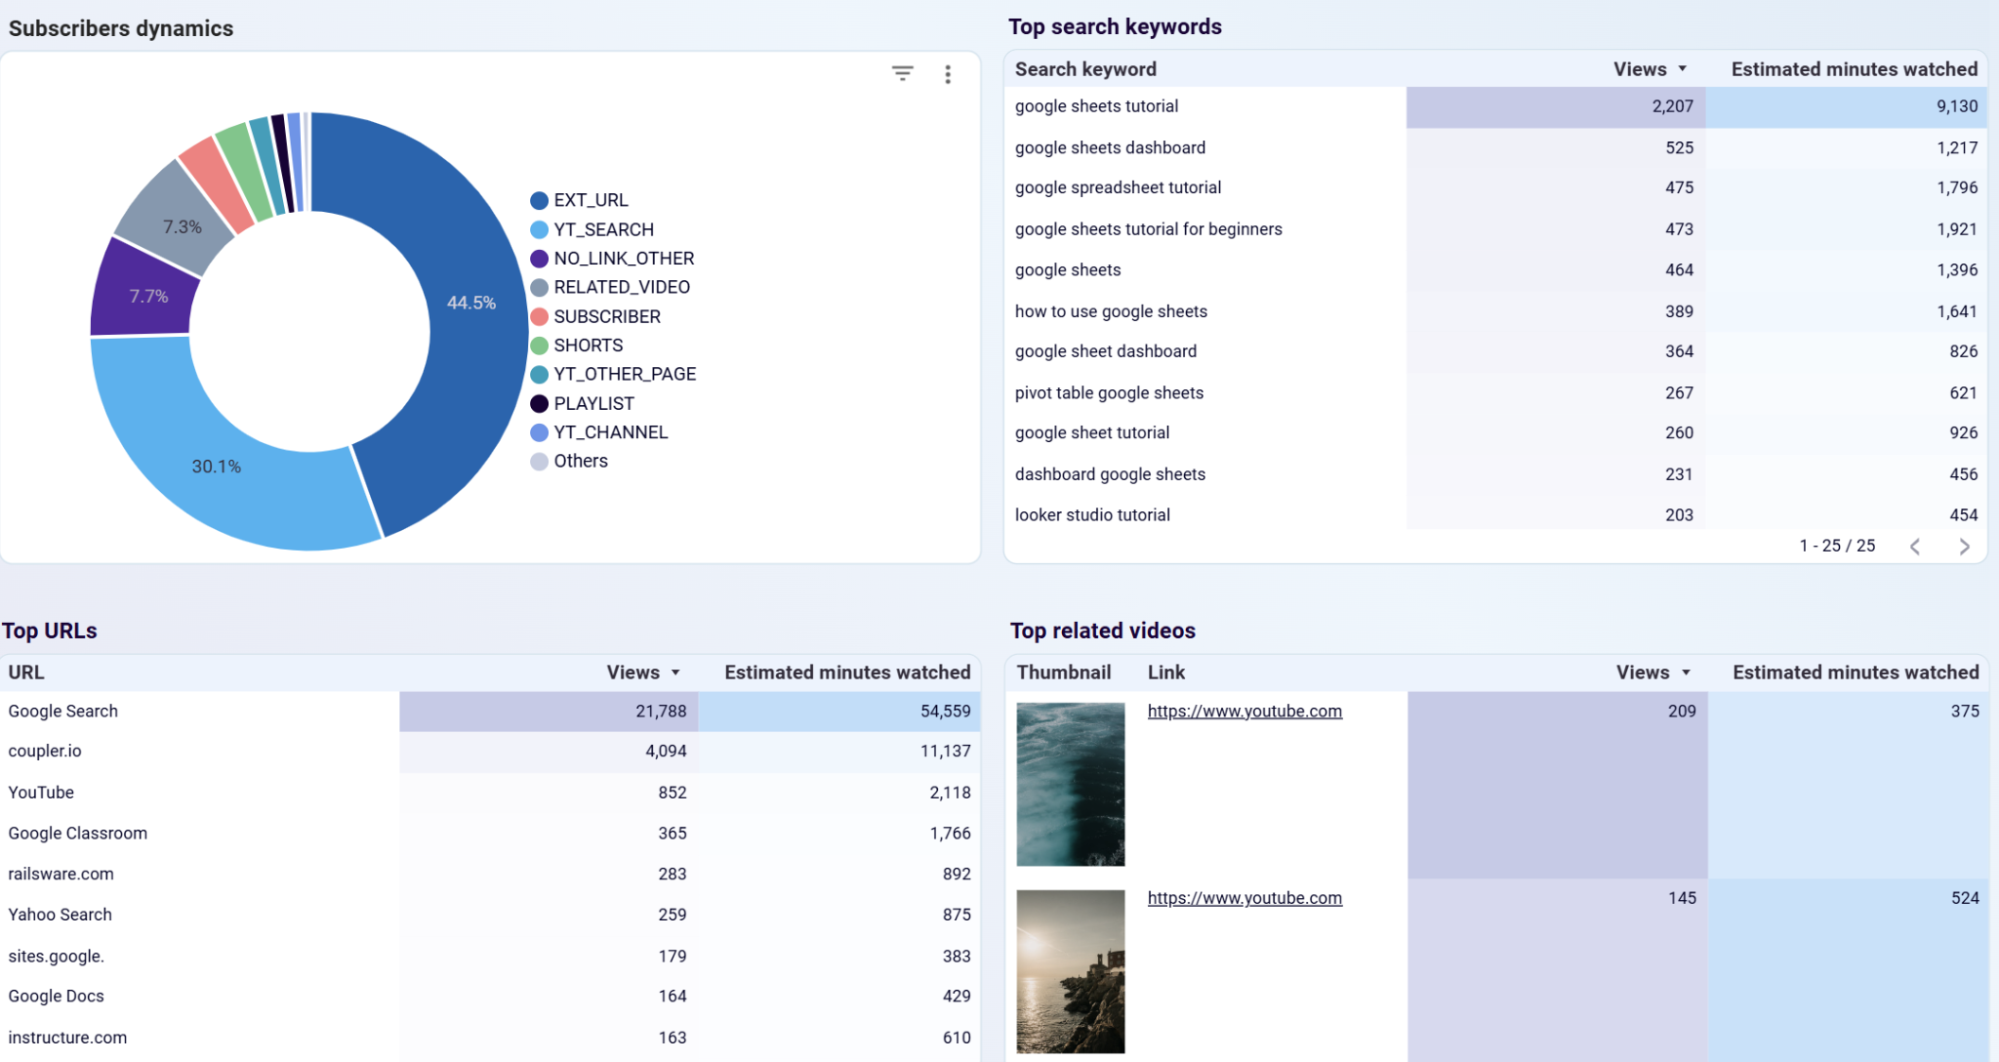
Understand exactly how viewers find your content through detailed breakdowns of YouTube Search, suggested videos, external websites, and social media referrals. This YouTube dashboard template includes keyword analysis showing which search terms drive traffic to your videos, enabling targeted SEO optimization. This intelligence helps you focus promotional efforts on the most effective discovery channels and identify opportunities for expanding your reach through strategic platform partnerships.
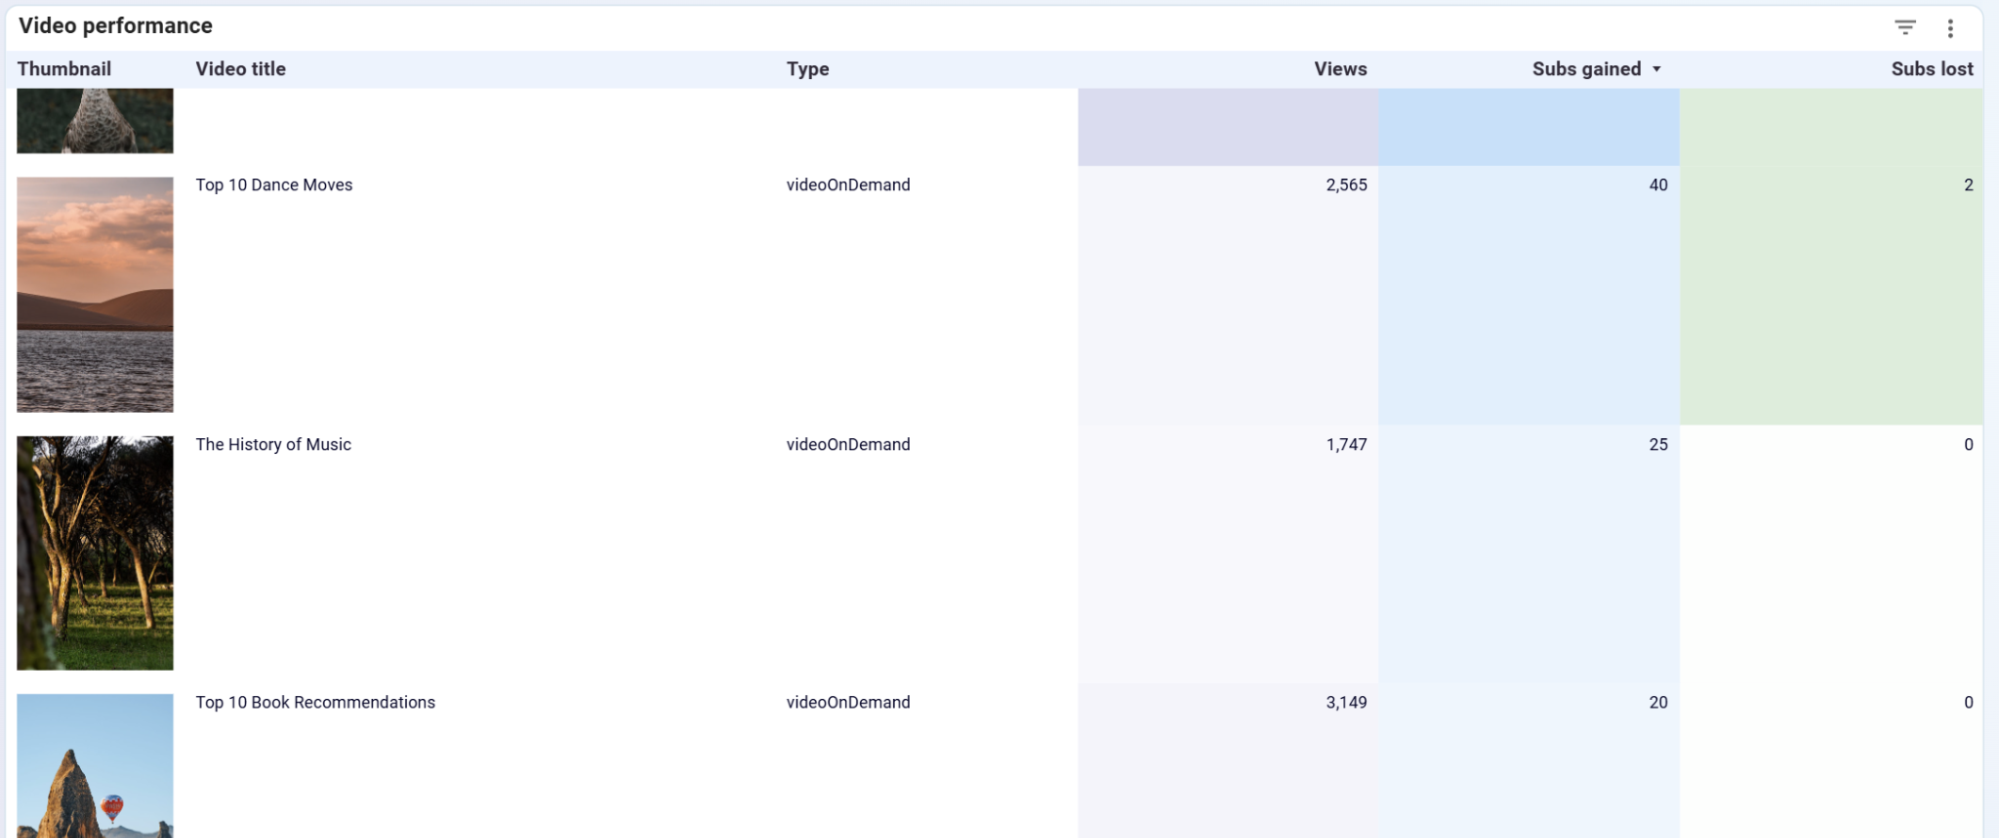
Monitor how individual videos impact your subscriber growth with detailed tracking of subscribers gained and lost per video. The dashboard reveals which content types, topics, and calls-to-action most effectively convert casual viewers into long-term subscribers. This analysis enables you to develop content specifically designed for community building rather than just view maximization, creating sustainable channel growth through engaged audience development.
How to create a YouTube dashboard?

Metrics you can track with YouTube reporting dashboards
Monitor the total number of times your videos have been watched across your channel. This fundamental metric provides insight into content reach and popularity, helping you identify which videos resonate most with your audience and track overall channel growth patterns over time.
Track how often viewers share your content across social media platforms and other channels. This metric indicates content virality potential and audience advocacy, revealing which videos inspire viewers to actively promote your content to their own networks and expand your reach organically.
Measure the total time viewers spend watching your content, which directly influences YouTube's algorithm recommendations and monetization potential. This metric reveals audience engagement depth and helps identify videos that successfully maintain viewer attention throughout their duration for better performance optimization.
Calculate the typical length of time viewers watch your videos before clicking away or completing the content. This metric indicates content quality and audience retention effectiveness, helping you optimize video pacing, structure, and length for improved viewer engagement and satisfaction.
Analyze daily viewership patterns to understand content consumption trends and optimal posting schedules. This metric helps identify peak engagement periods and seasonal viewing patterns, enabling you to time content releases for maximum visibility and audience reach.
Monitor positive and negative audience reactions to gauge content reception and viewer sentiment. These engagement metrics provide immediate feedback on content quality and audience preferences, helping you understand what resonates with viewers and adjust your content strategy accordingly.
Track viewer comments to measure community engagement and conversation generation around your content. This metric indicates how well your videos spark discussion and build community interaction, providing valuable audience insights and opportunities for creator-viewer relationship building.
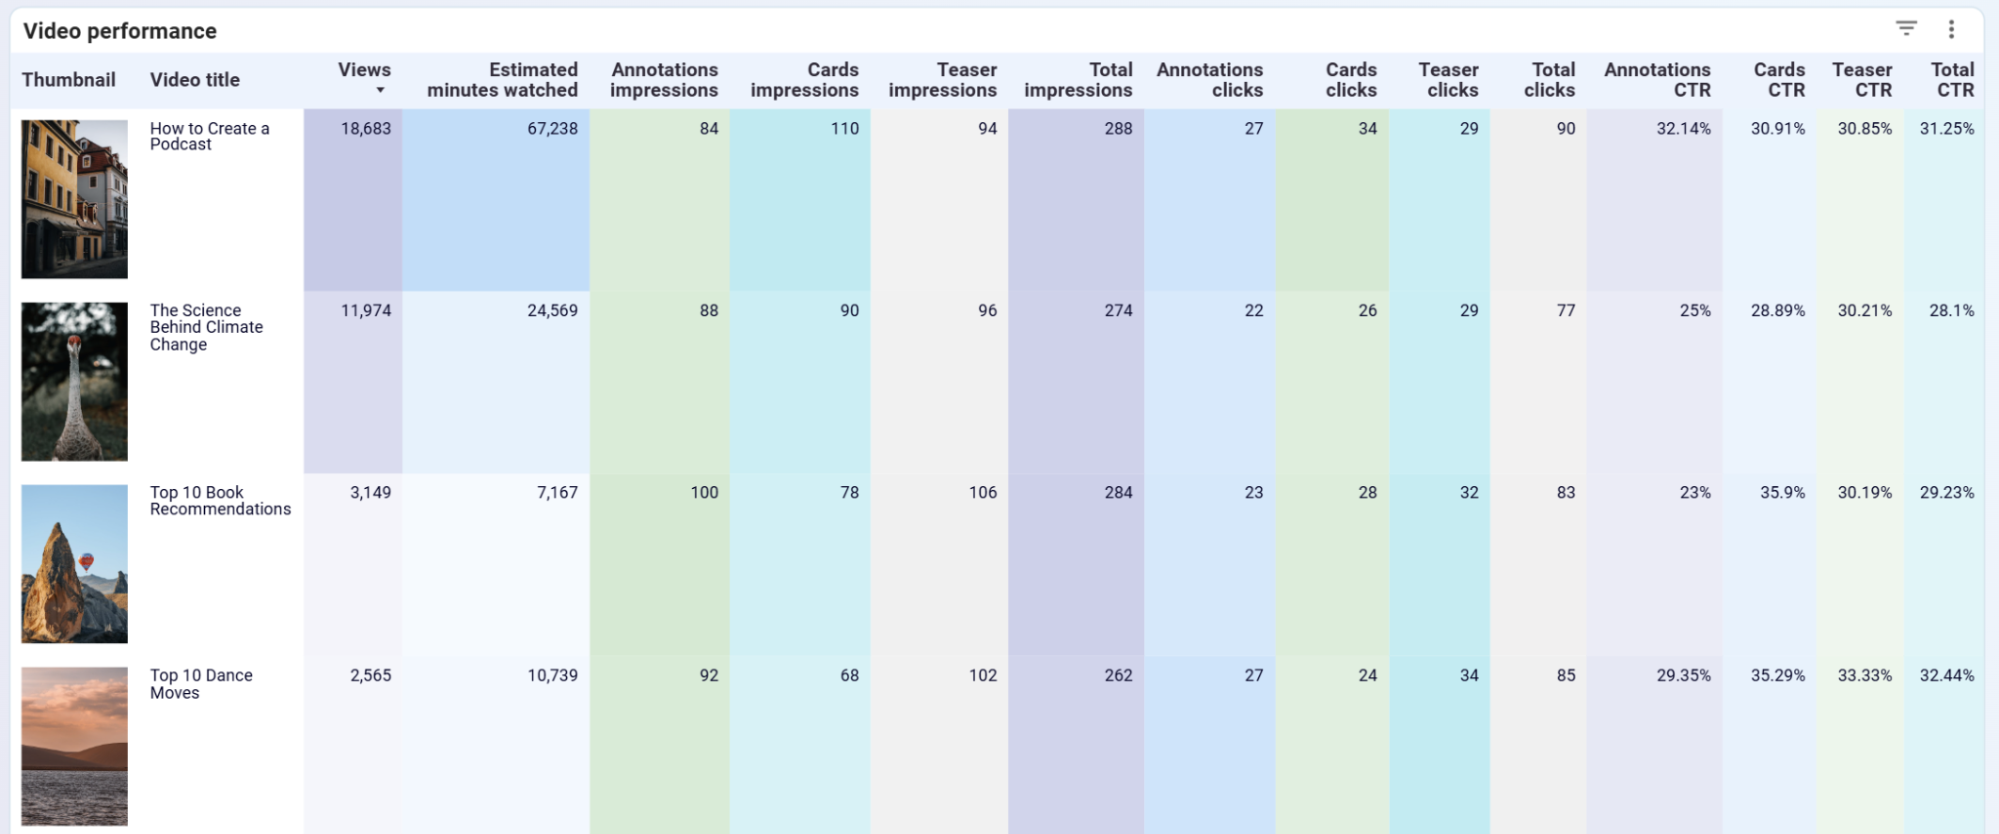
Monitor how often your interactive elements appear to viewers during video playback. This metric tracks the visibility of your calls-to-action and promotional elements, helping you understand audience exposure to your conversion opportunities and optimize placement strategies.
Measure how frequently viewers interact with your embedded promotional elements and calls-to-action. This metric reveals which interactive features effectively drive traffic to your other content, external websites, or conversion goals, enabling optimization of your monetization and growth strategies.
Calculate the percentage of viewers who click on your interactive elements after seeing them. This metric evaluates the effectiveness of your calls-to-action design, placement, and messaging, helping you improve conversion rates and maximize the impact of your promotional efforts.