Power BI templates for business reporting
Accelerate your business intelligence with ready-to-use Power BI templates that transform raw data into actionable insights. Our professionally designed Microsoft Power BI templates automate data consolidation from multiple sources, enabling smarter decisions without complex setup or technical expertise.
Power BI templates examples for every need


 +5
+5


 +4
+4


 +5
+5
 +3
+3


 +2
+2


about your case. It doesn't cost you a penny 😉
Choose your white label Power BI template to kick off
What is a Power BI template?
When paired with Coupler.io's data automation, Power BI report templates become even more powerful. Your data refreshes automatically on schedule, pulling the latest information from sources like Google Analytics, Google Ads, Facebook Ads, QuickBooks, and Harvest. This eliminates manual updates and data consolidation tasks that typically consume hours each week. With templates for Power BI already configured for your specific business needs, you can skip the complex setup process and immediately focus on interpreting insights that drive growth and efficiency across your organization.

What Power BI report templates can you use?
The marketing performance report delivers comprehensive visibility into your digital marketing efforts across all channels. Built on Microsoft Power BI templates specifically designed for marketing analytics, it consolidates data from Google Analytics, social media platforms, and PPC campaigns to track user acquisition trends, engagement metrics, and conversion rates. The report includes a pivotal chart showing monthly traffic by channel group, making it easy to identify which sources drive the most visitors and how these patterns change over time. Complementing this visualization, a detailed table breaks down key metrics by channel group, including users, sessions, conversion rate, and revenue, enabling precise performance comparisons. This structure helps marketing teams identify underperforming channels, recognize seasonal patterns, and optimize budget allocation based on actual results rather than assumptions.
The advertising effectiveness report transforms complex multi-platform advertising data into clear, actionable insights using specialized Power BI report templates. It brings together performance metrics from Google Ads, Facebook Ads, LinkedIn Ads, and other platforms into a unified view that eliminates the need to switch between multiple dashboards. At the heart of this report are two critical visualizations: a line chart showing spend amounts by date and source, and a companion chart displaying cost-per-click (CPC) trends across platforms. These side-by-side comparisons reveal which advertising channels deliver the best value and how efficiency changes over time. Marketing teams can quickly identify cost spikes, performance anomalies, and optimization opportunities across their entire advertising ecosystem. By highlighting both immediate and long-term trends in ad performance, this report enables data-driven budget allocation decisions that maximize ROI while controlling costs.
The financial performance report leverages Power BI templates designed specifically for financial analysis to transform accounting data into strategic insights. Based on QuickBooks integration, it visualizes revenue trends over 12 months, making it easy to identify seasonal patterns, growth trajectories, and potential cash flow challenges before they impact operations. The report includes comprehensive profit and loss comparisons across multiple time periods—month-to-date, previous month, and year-to-date—enabling quick assessment of financial performance changes. Visual breakdowns of income by customer and product categories reveal your most valuable clients and offerings, helping prioritize sales and relationship management efforts. Finance teams can drill down from high-level summaries to detailed transaction records with just a few clicks, creating a flexible analysis tool that supports both strategic planning and day-to-day financial management. This template for Power BI bridges the gap between raw financial data and actionable business intelligence.
The SEO performance report transforms Google Search Console data into actionable intelligence using specialized Power BI templates for search analytics. At its core are two complementary tables that drive optimization priorities: the best-performing pages showing which content gained traffic, and the worst-performing pages highlighting content that lost visibility or engagement. This dual perspective enables SEO teams to quickly identify content worth promoting further versus pages requiring immediate attention or updates. The report visualizes critical metrics like organic click trends, average position changes, and impression growth over customizable time periods. By connecting search performance data with actual business outcomes like leads or revenue, this Microsoft Power BI template helps prioritize SEO efforts based on potential impact rather than just traffic volume. Teams can filter data by country, device, or query type to uncover specific optimization opportunities that might otherwise remain hidden in aggregated data.
The time allocation report transforms time-tracking data from Harvest into comprehensive productivity insights using specialized Power BI sample templates. The centerpiece is an intuitive calendar view that displays detailed time allocation by day and week, making it easy to identify patterns in team productivity, potential resource constraints, or capacity issues. Project managers can analyze billable hours by client, project, or team member to optimize resource allocation and improve project profitability. The report highlights potential inefficiencies like team members logging excessive hours on individual days or consistently underreporting time. By connecting time data with client billing information, it reveals which projects deliver the highest returns relative to effort invested. This Power BI template helps teams balance workloads, prevent burnout, and ensure that time investments align with business priorities and profitability goals, ultimately improving operational efficiency while maintaining team wellbeing.
What insights you can get with Microsoft Power BI templates
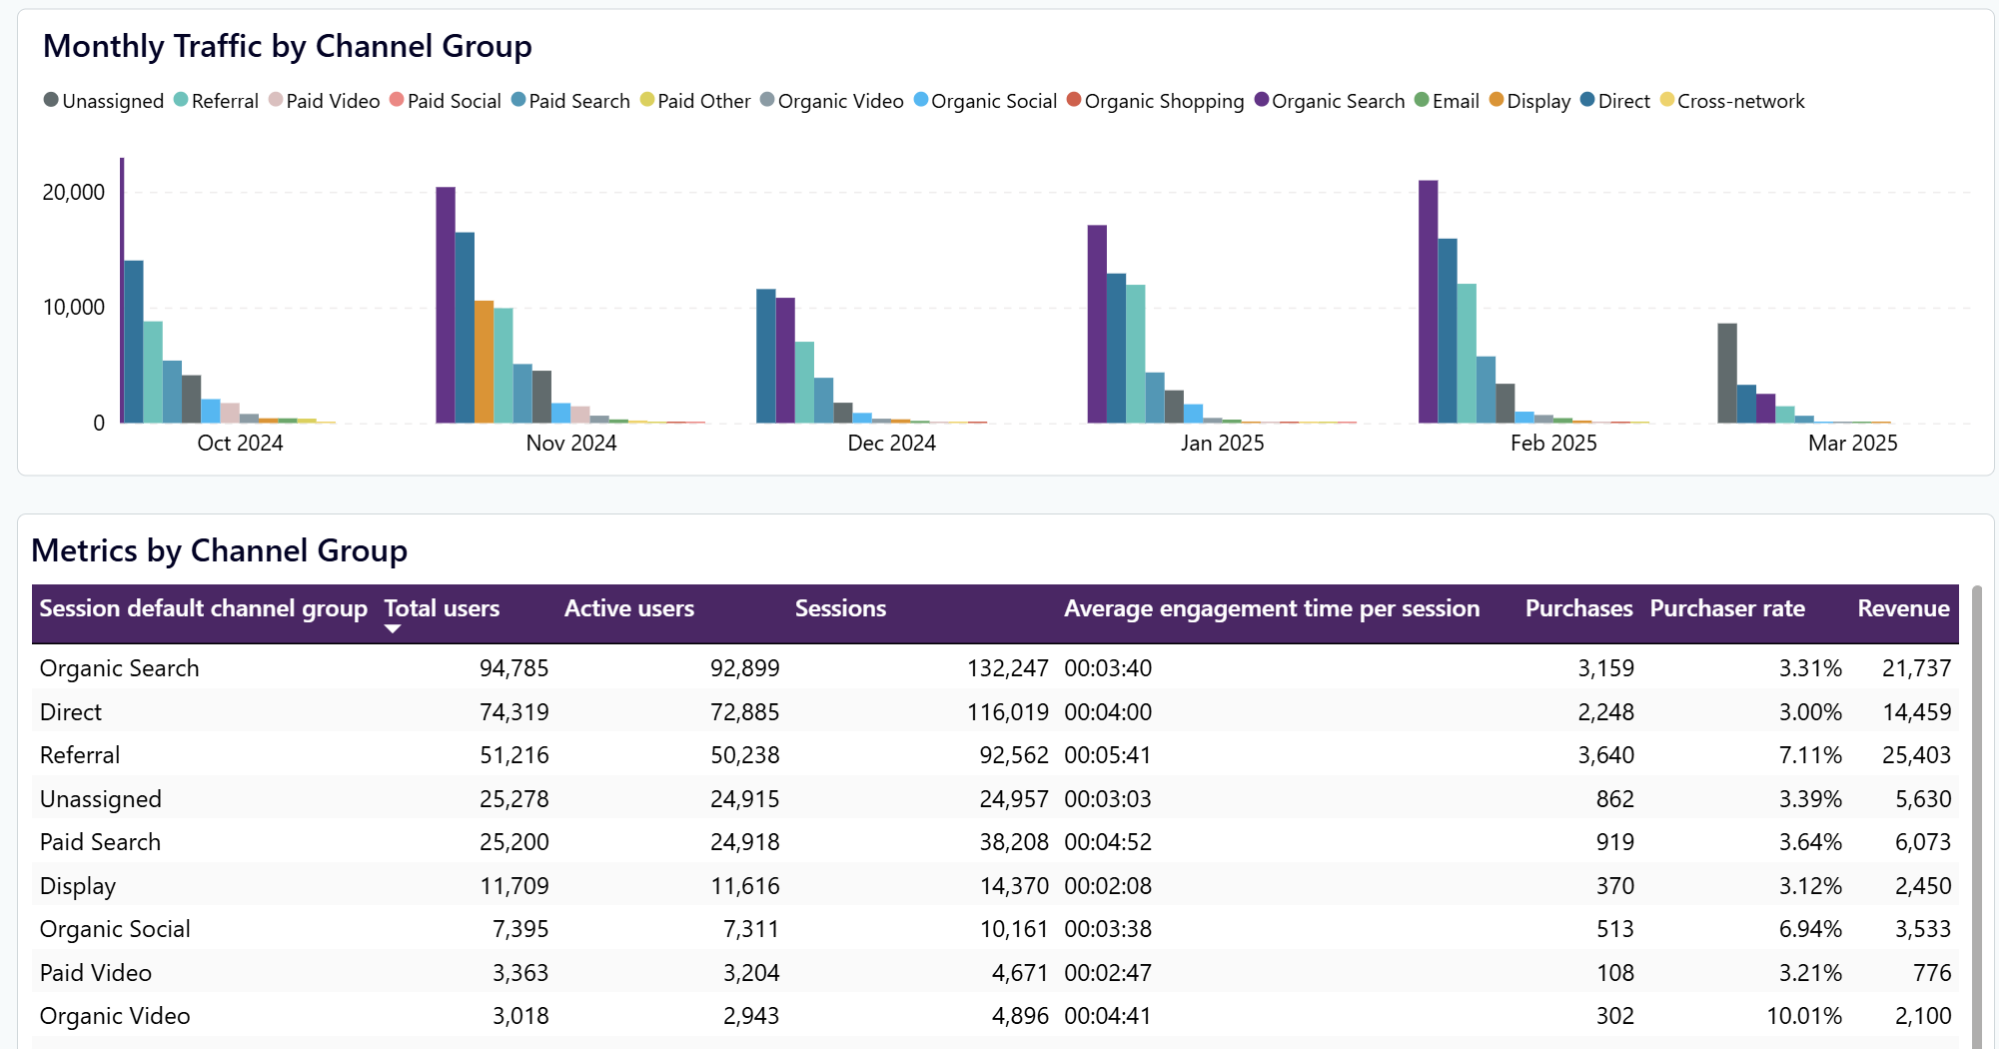
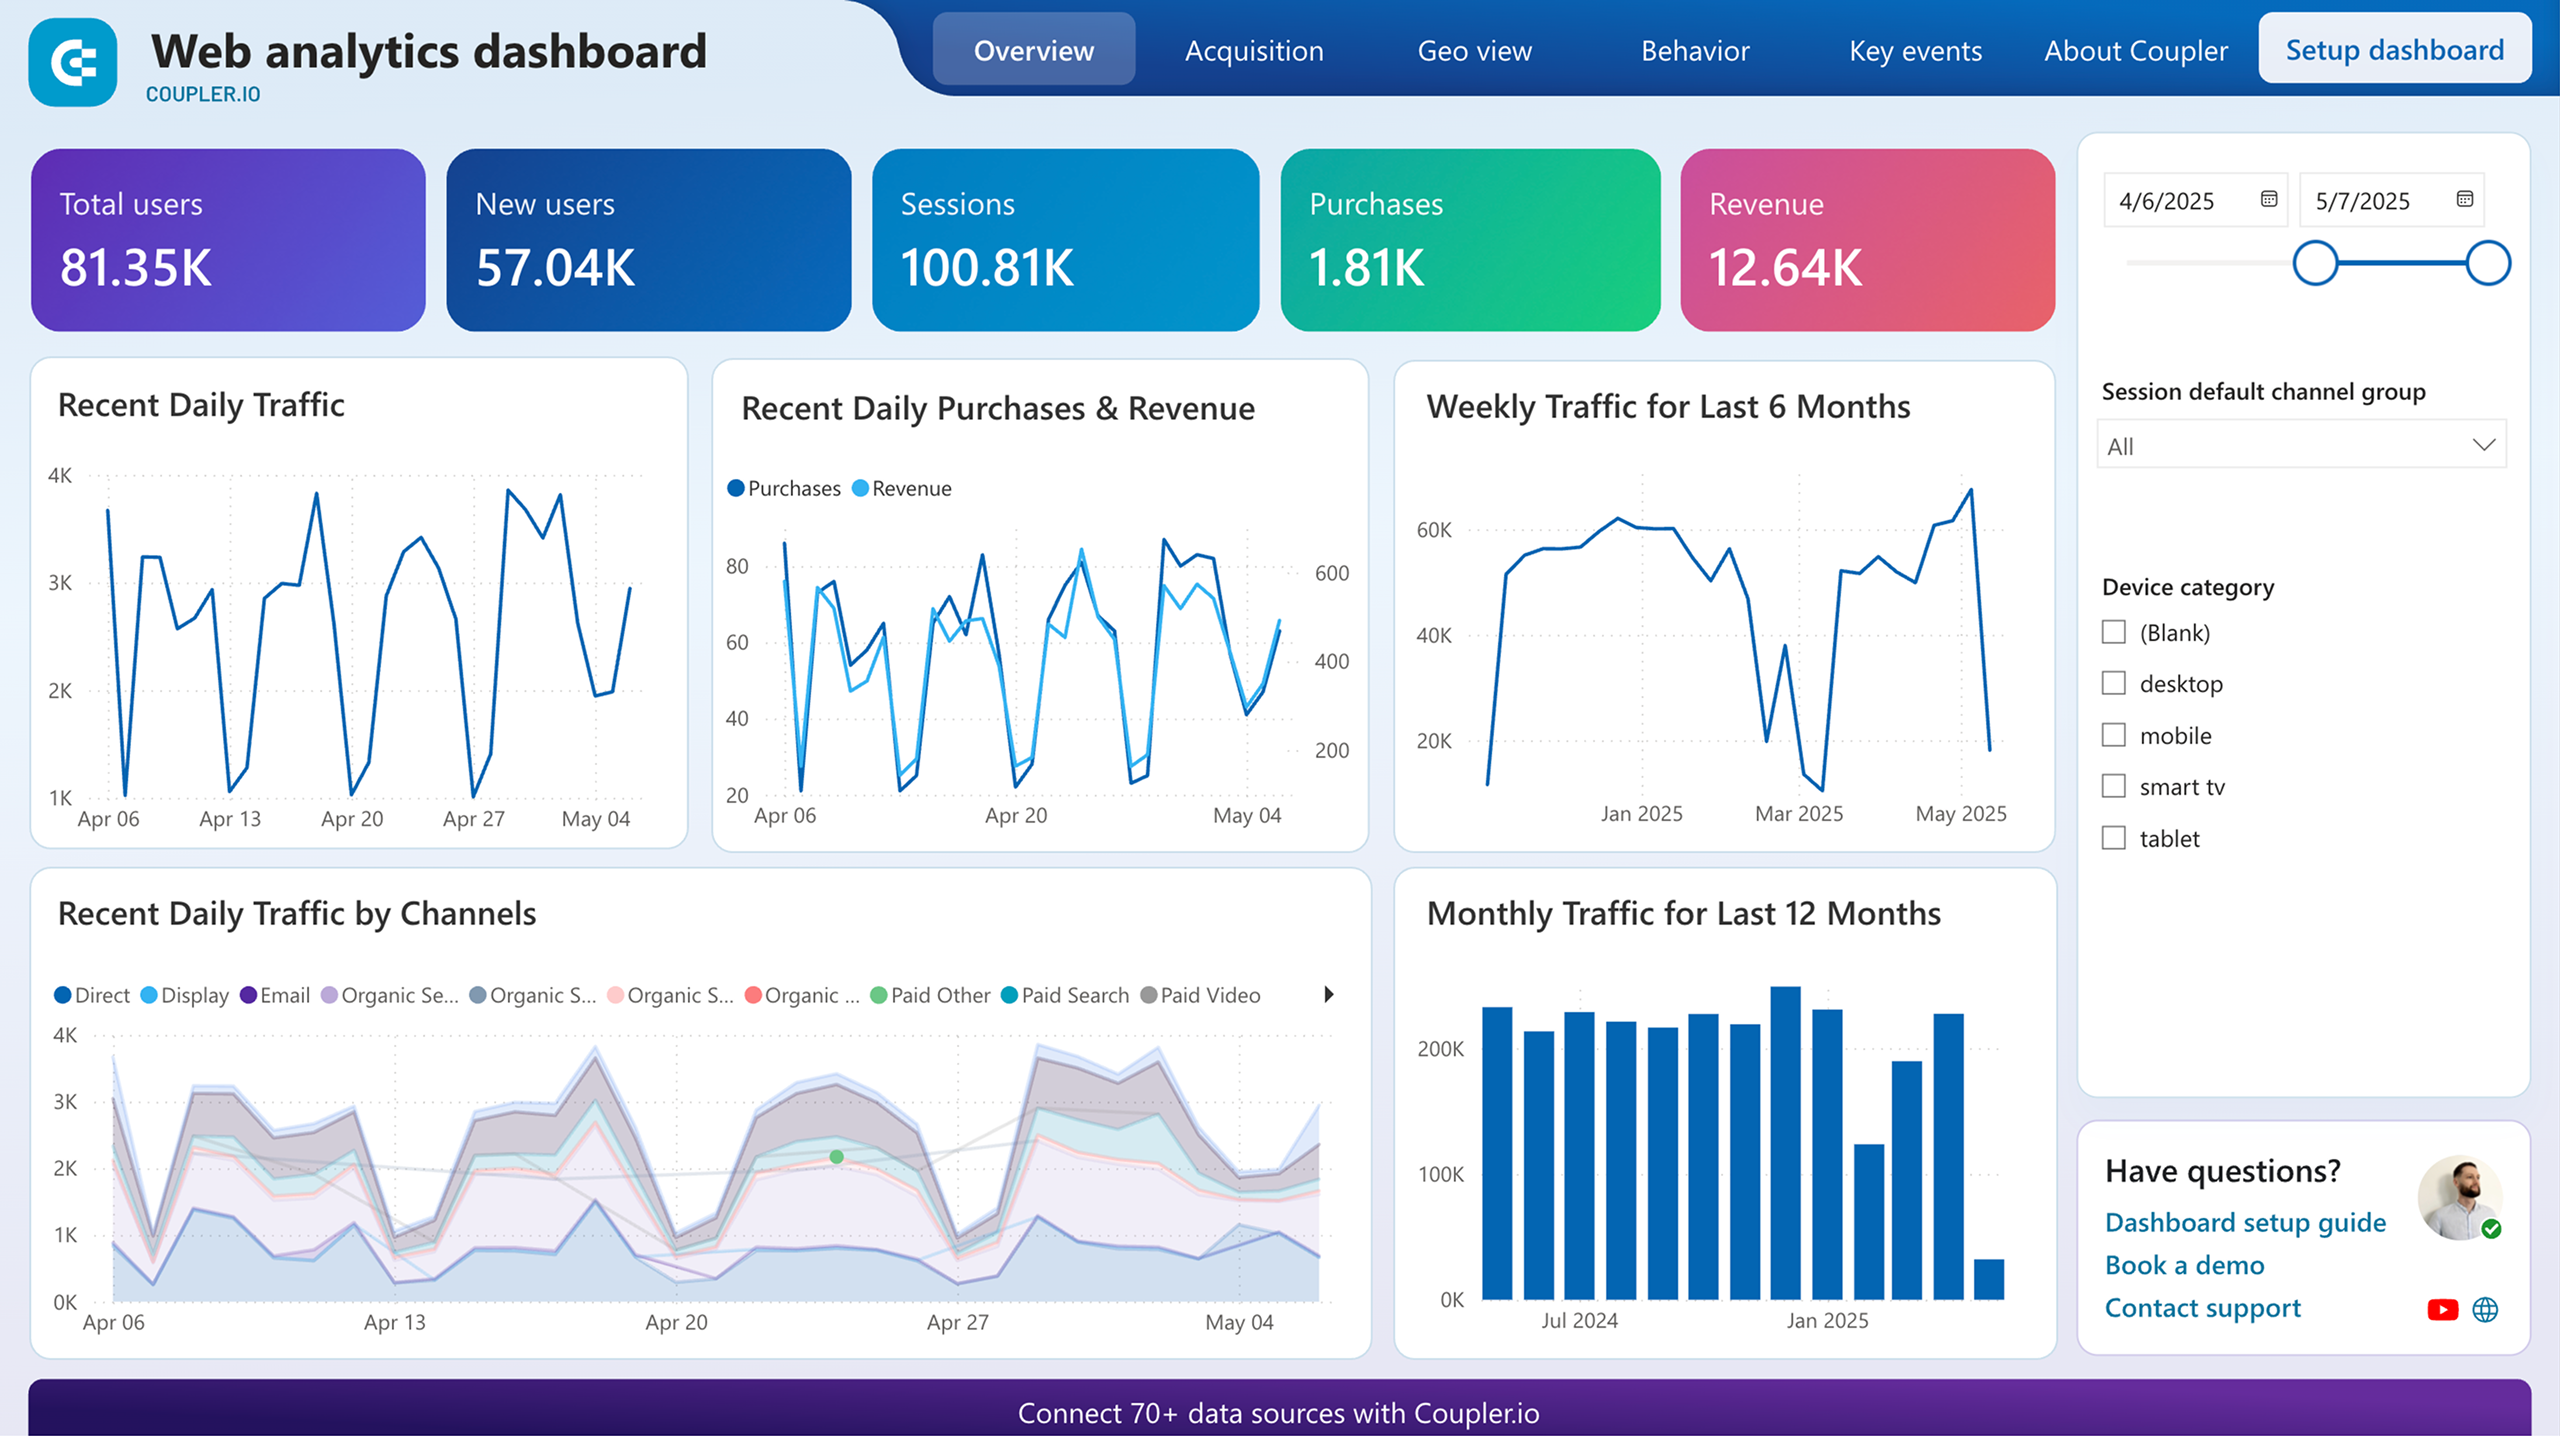
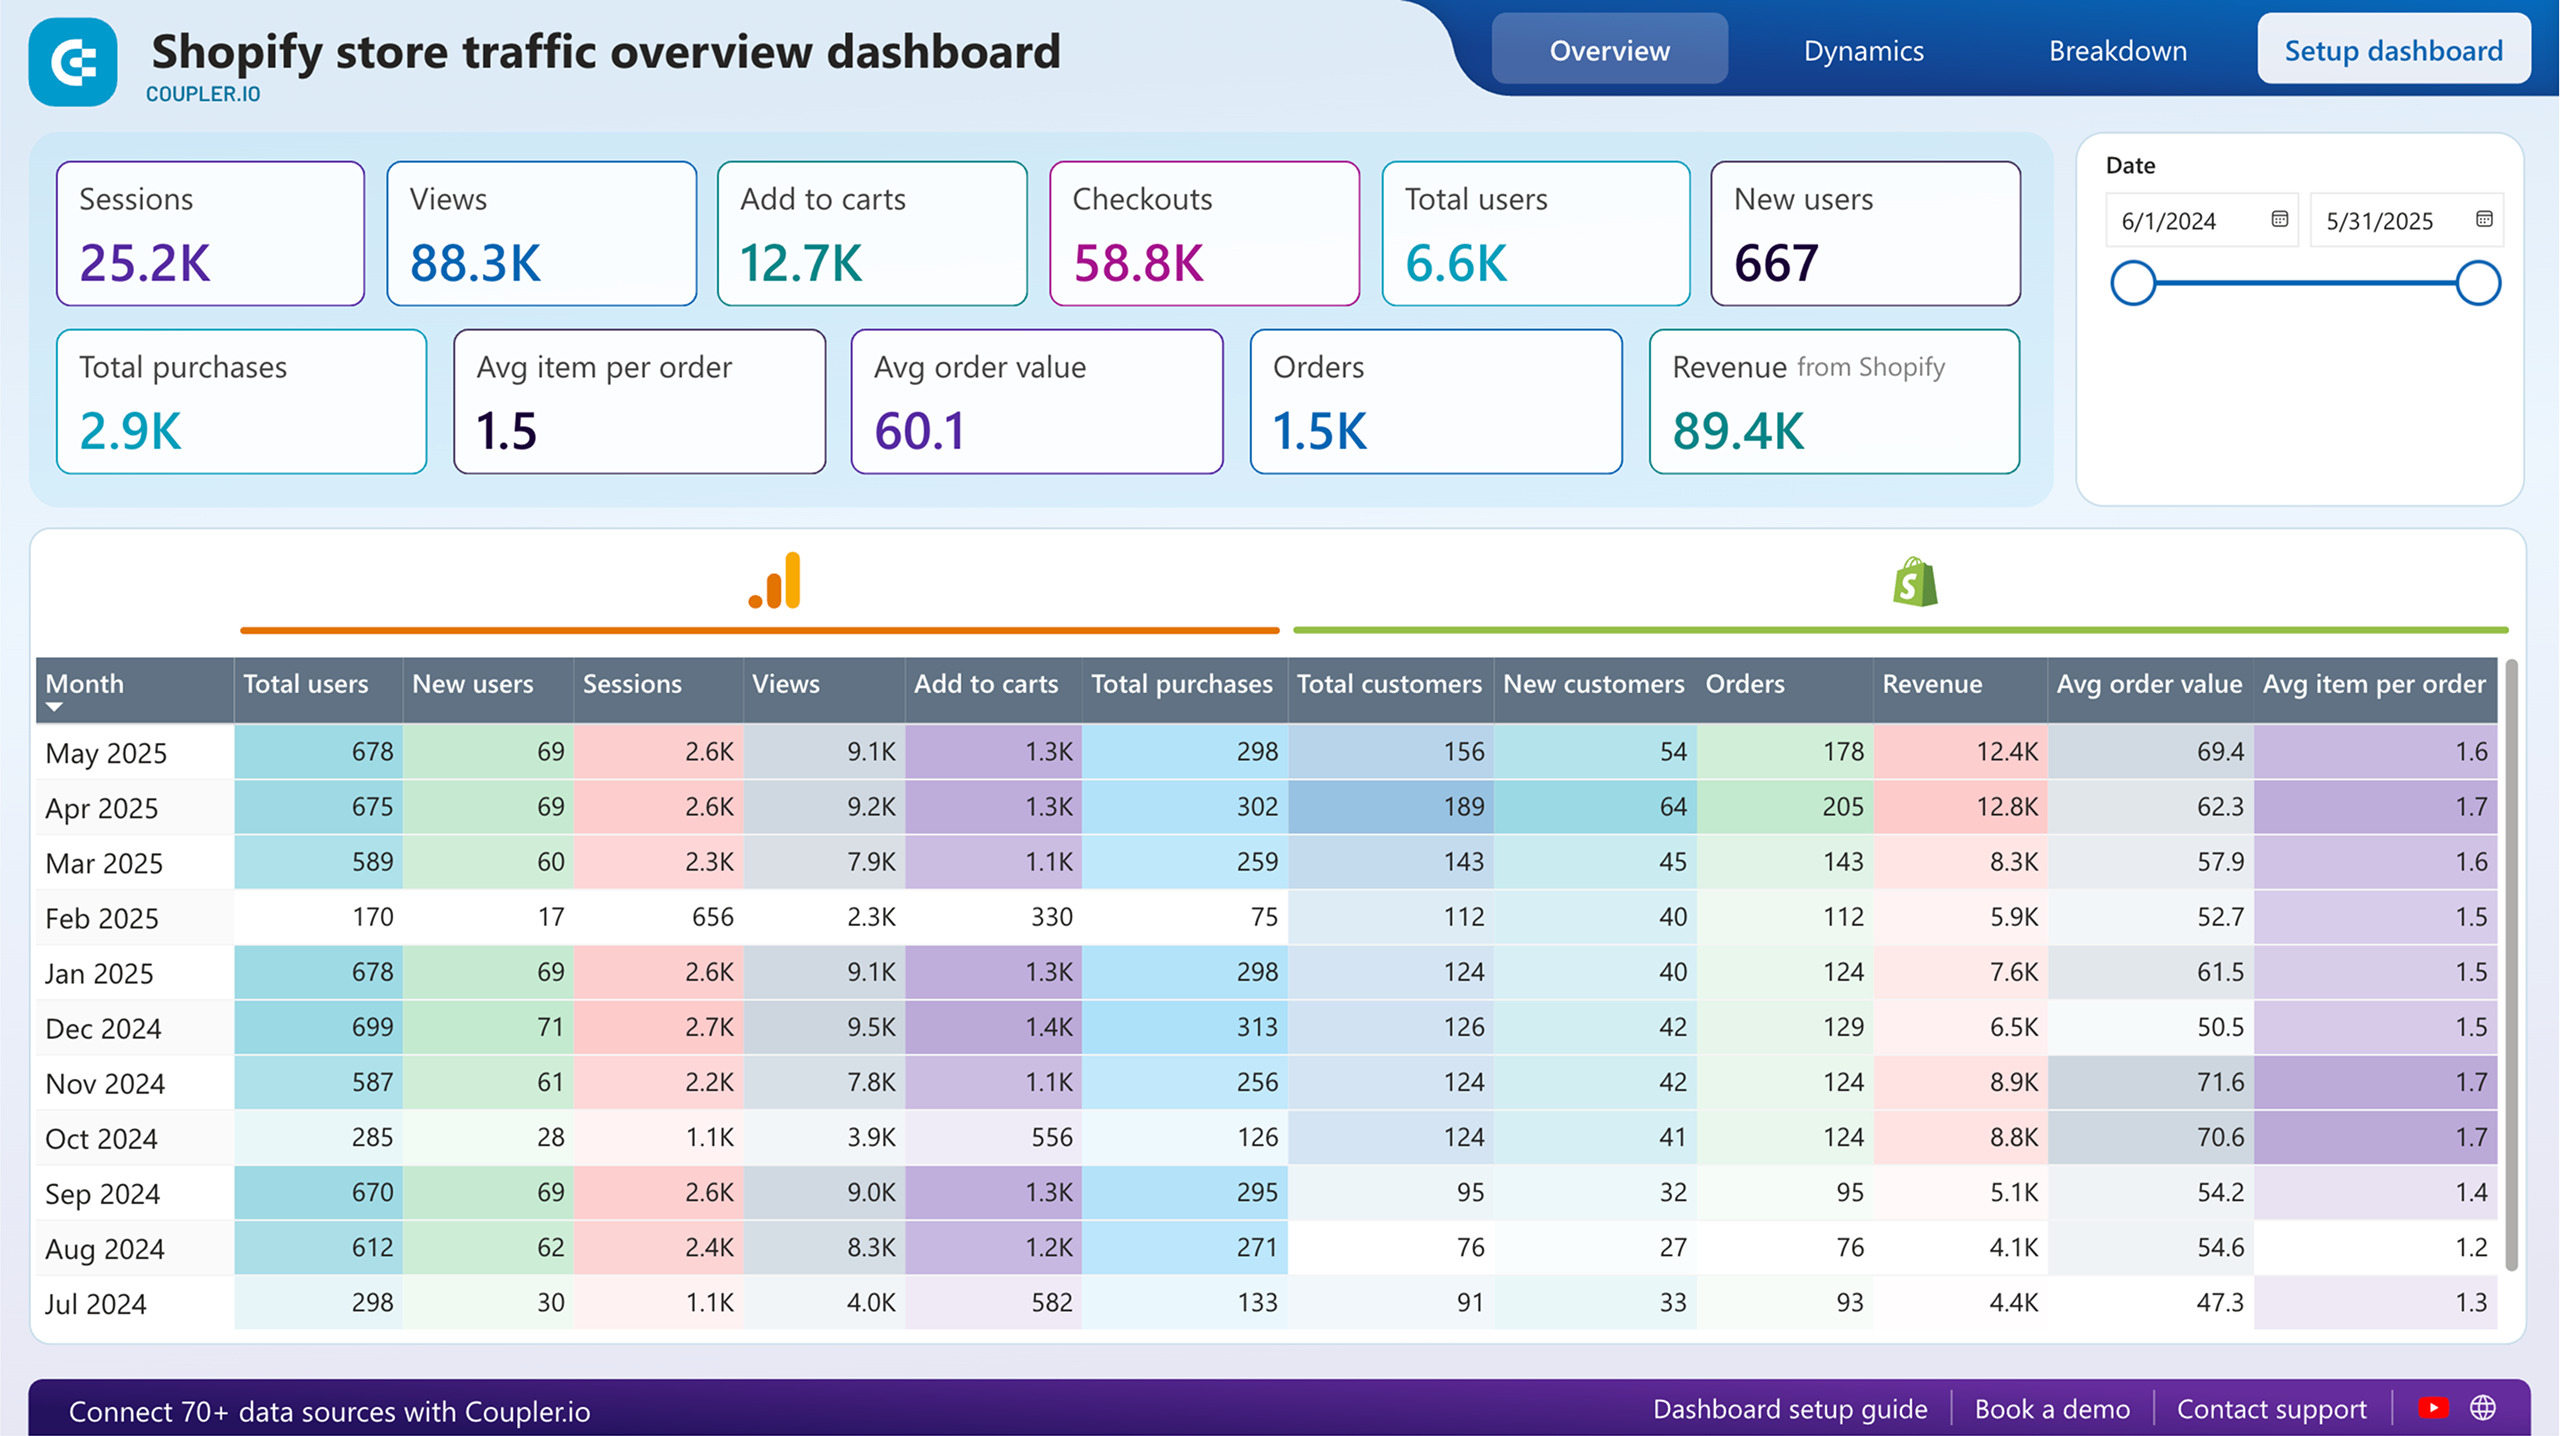
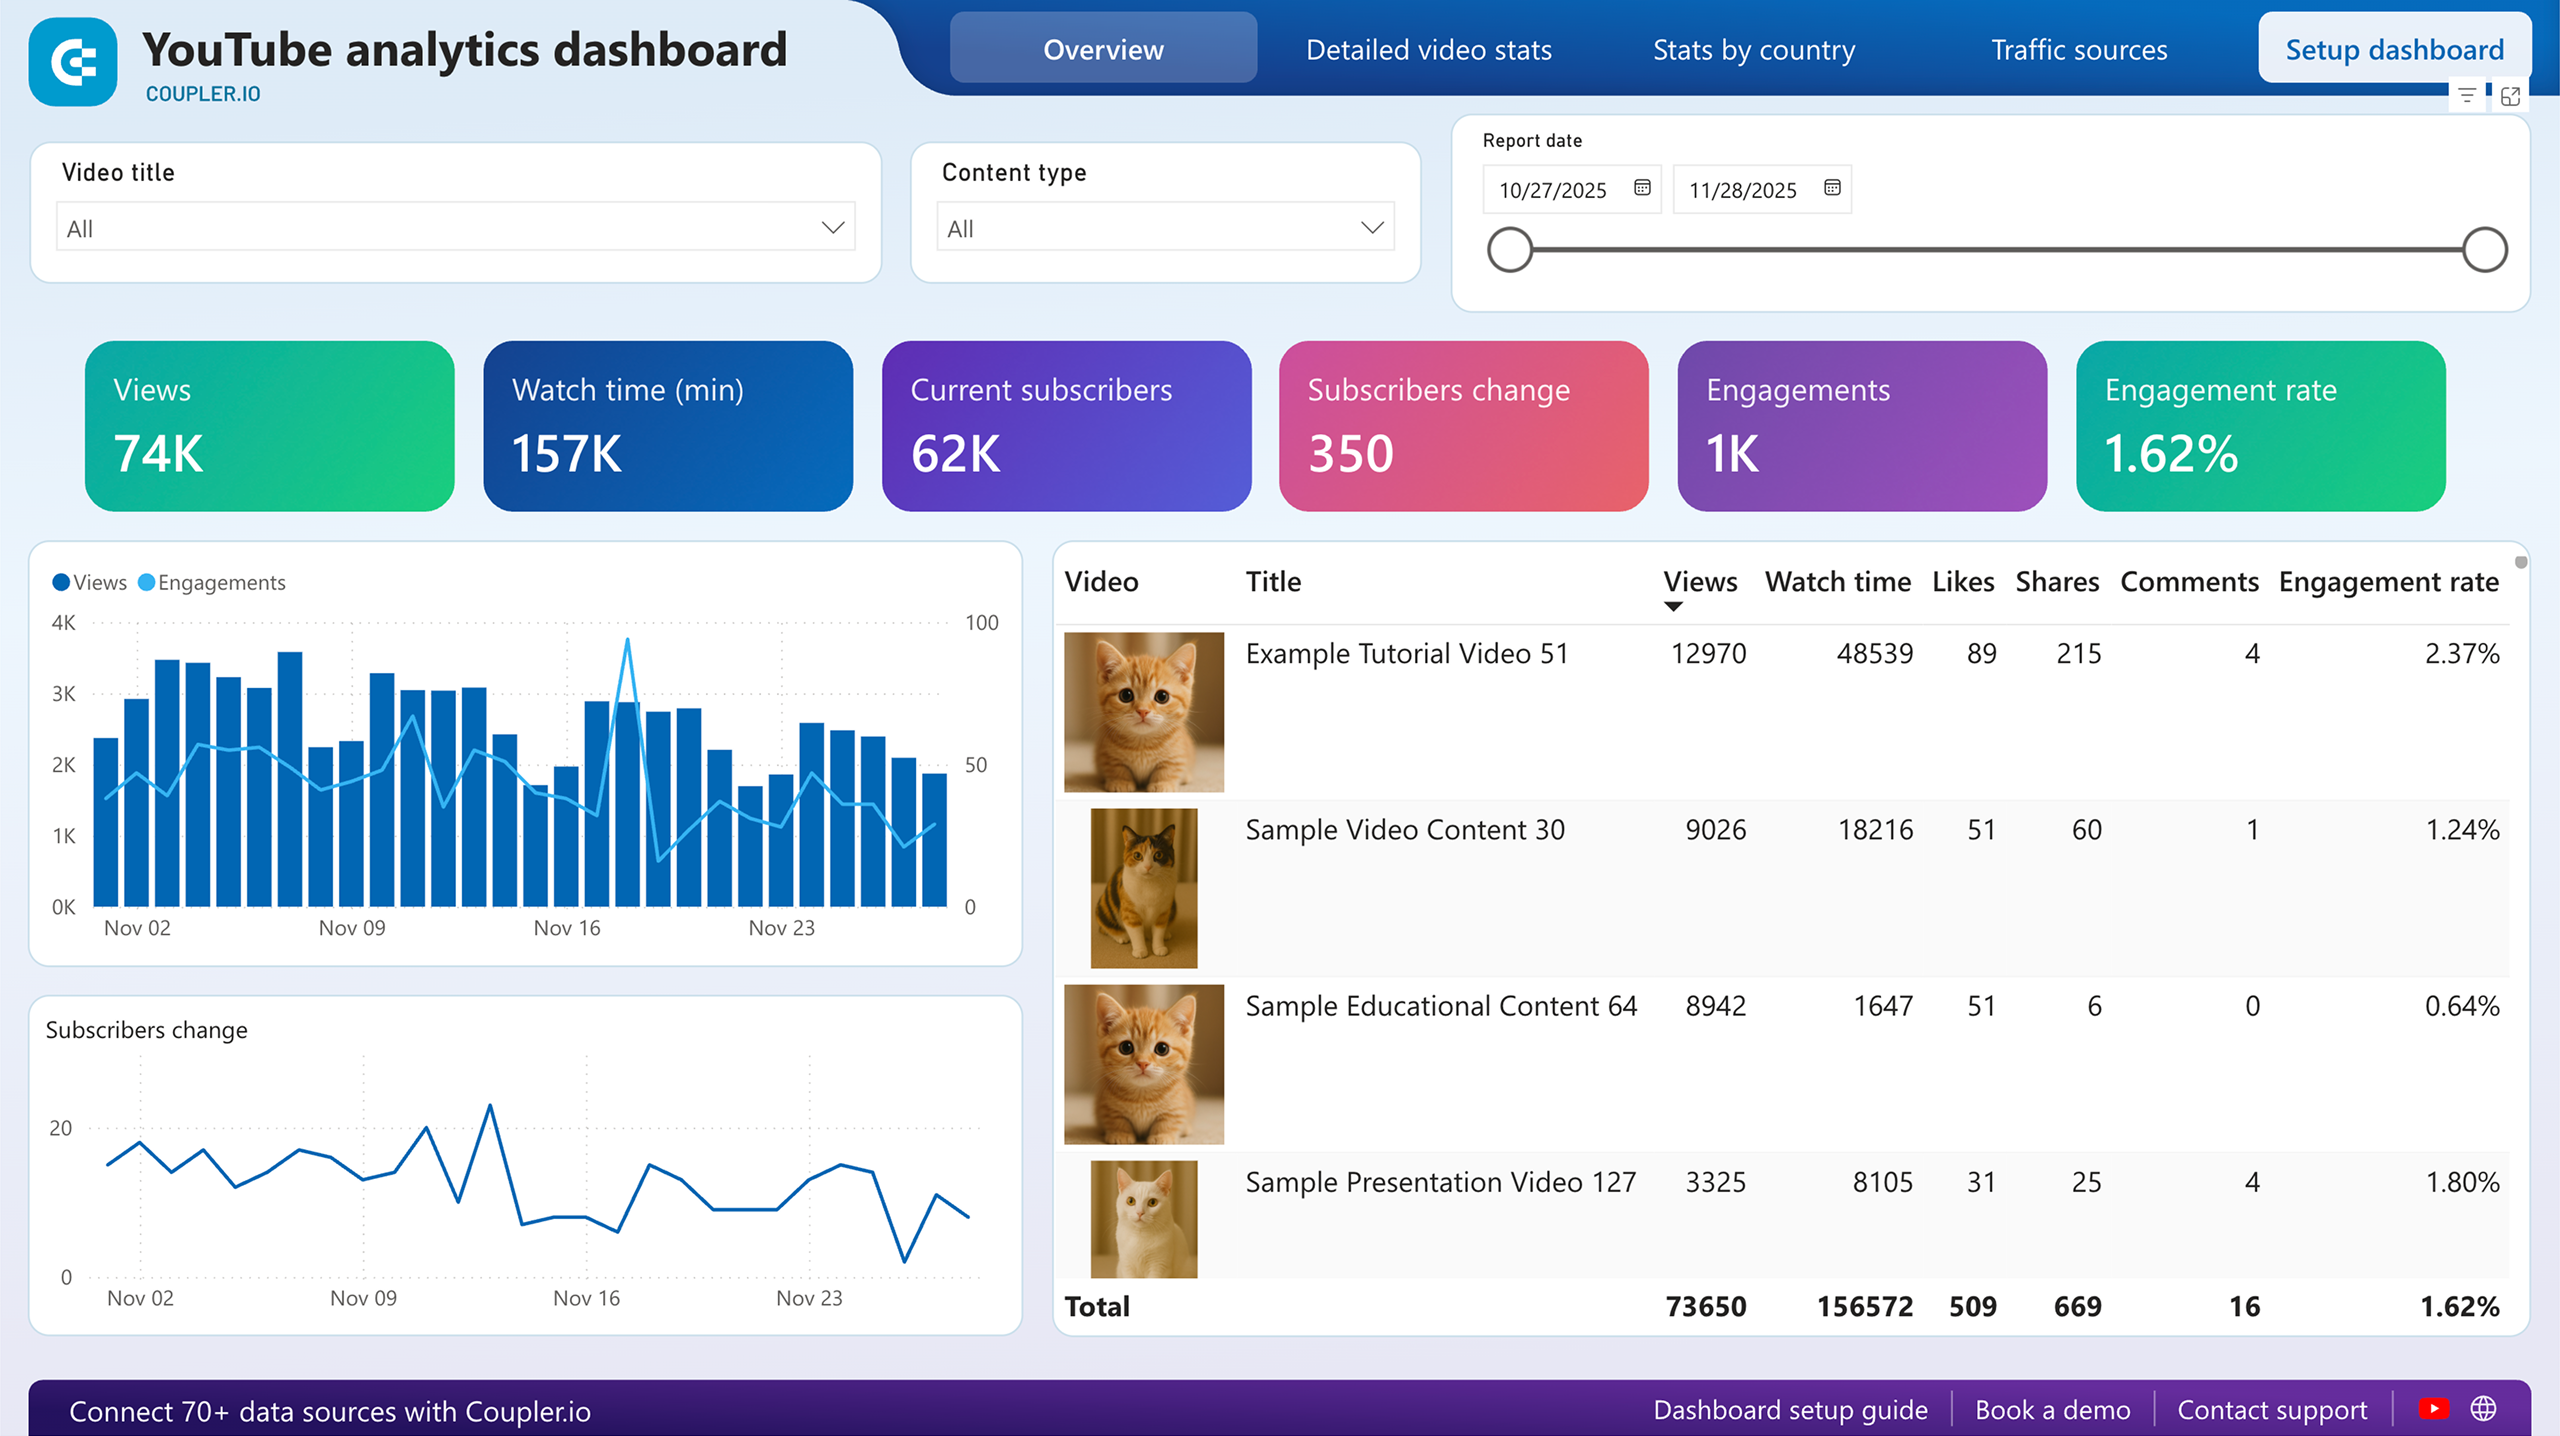
The Web analytics dashboard provides a comprehensive breakdown of your website traffic by acquisition source. The monthly traffic visualization by channel group reveals long-term trends in user acquisition. This helps you identify seasonal patterns and the impact of marketing initiatives. The accompanying table shows detailed metrics for each channel, including users, sessions, average engagement time per session, and purchases. This insight allows marketing teams to determine which channels deliver not just the highest traffic volume but the most valuable visitors. With this Power BI template, you can immediately recognize shifts in channel effectiveness and reallocate resources to capitalize on emerging opportunities or address concerning drops in performance.
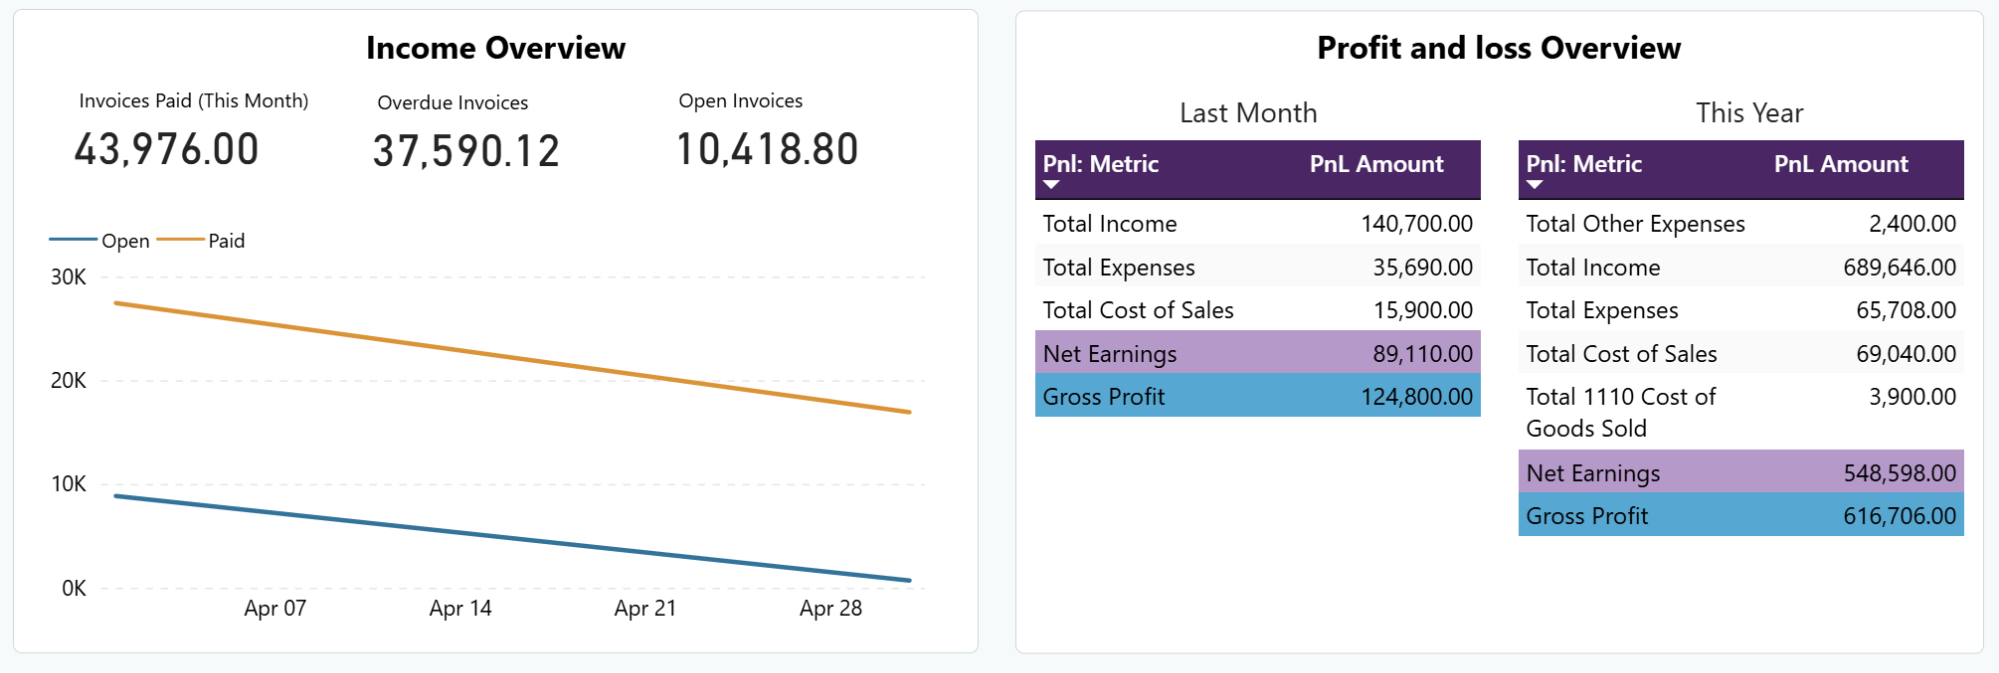
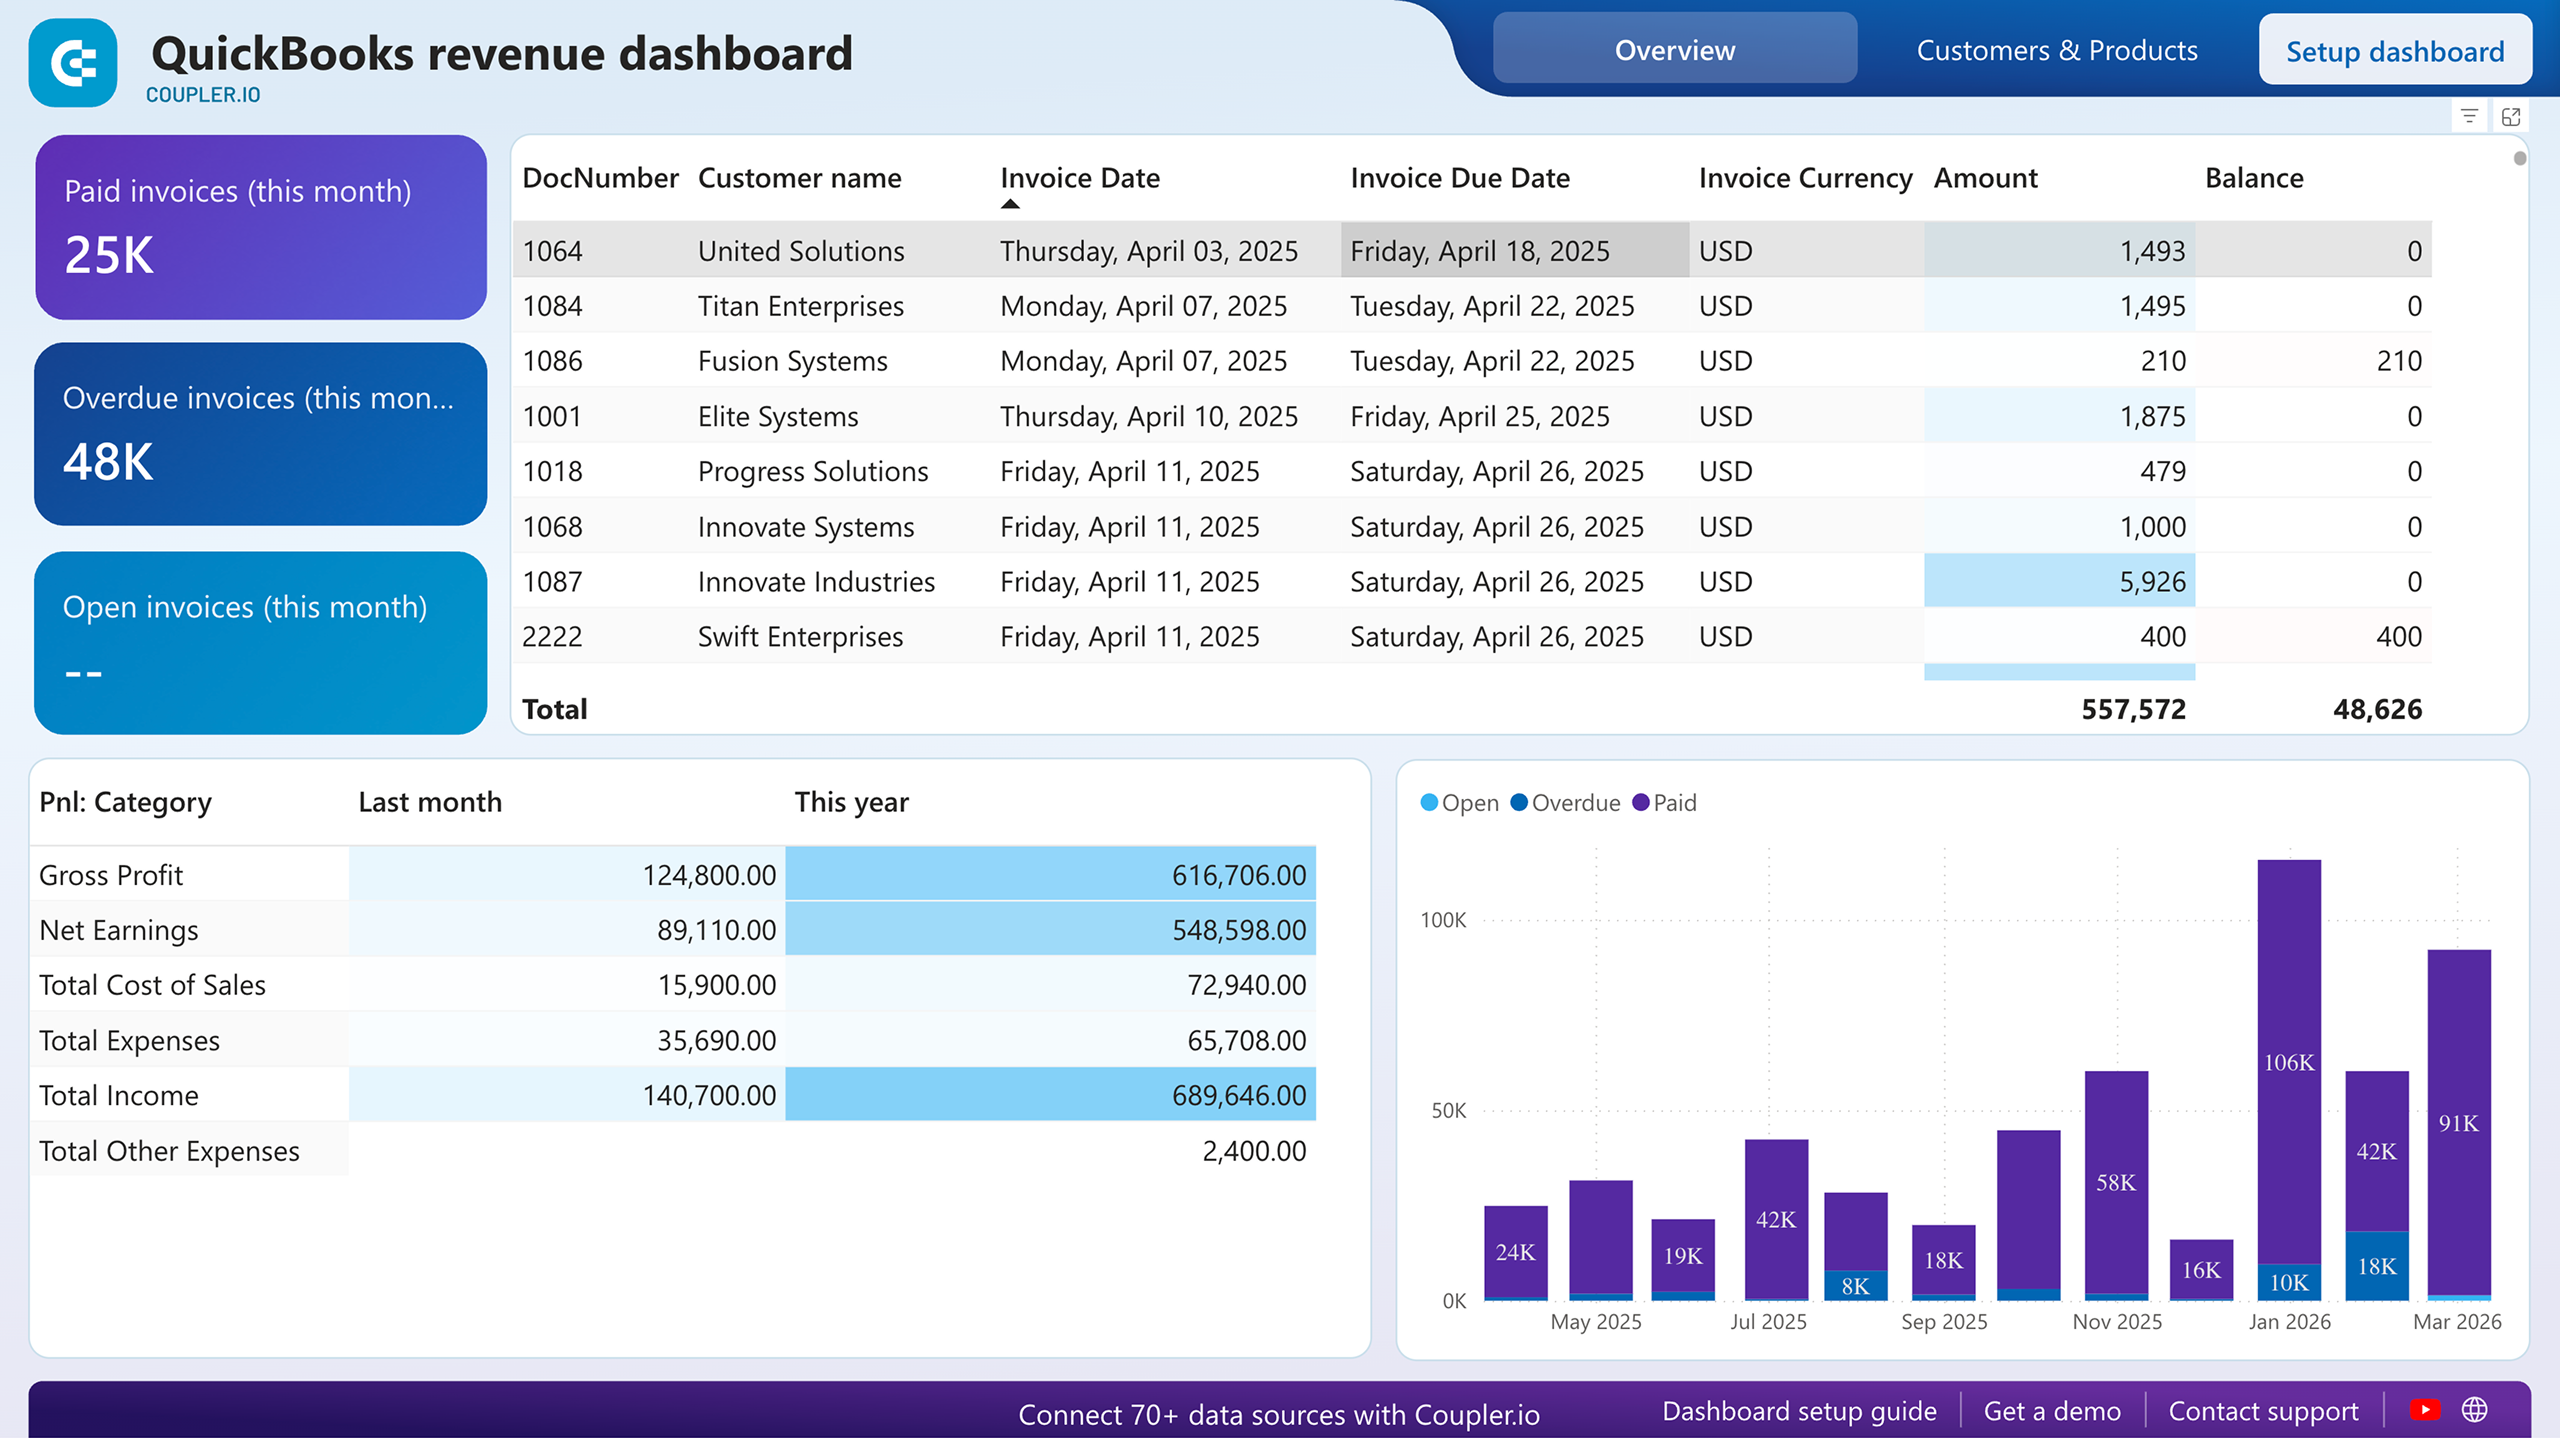
The QuickBooks Revenue dashboard transforms accounting data into clear financial insights. The income overview chart reveals seasonal fluctuations, growth patterns, and potential areas of concern in your revenue stream. Complementing this, the profit and loss comparisons across different time periods provide immediate visibility into financial performance changes. This Power BI report template helps finance teams identify unexpected dips in profitability, track the impact of new initiatives, and recognize emerging trends before they affect business stability. The ability to filter by time period, customer segment, or product category enables deeper analysis and more targeted financial strategies.
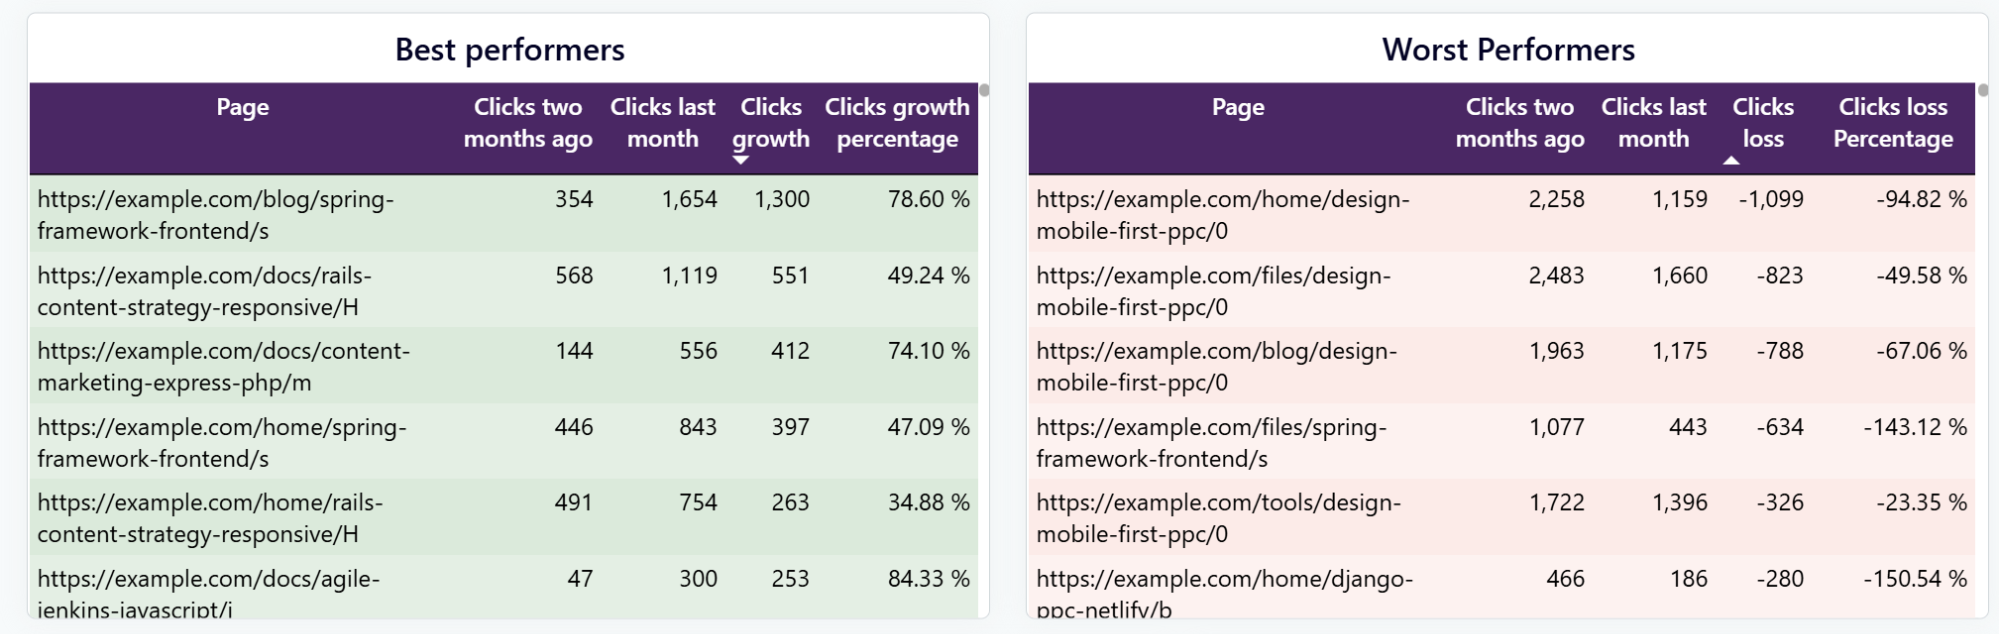
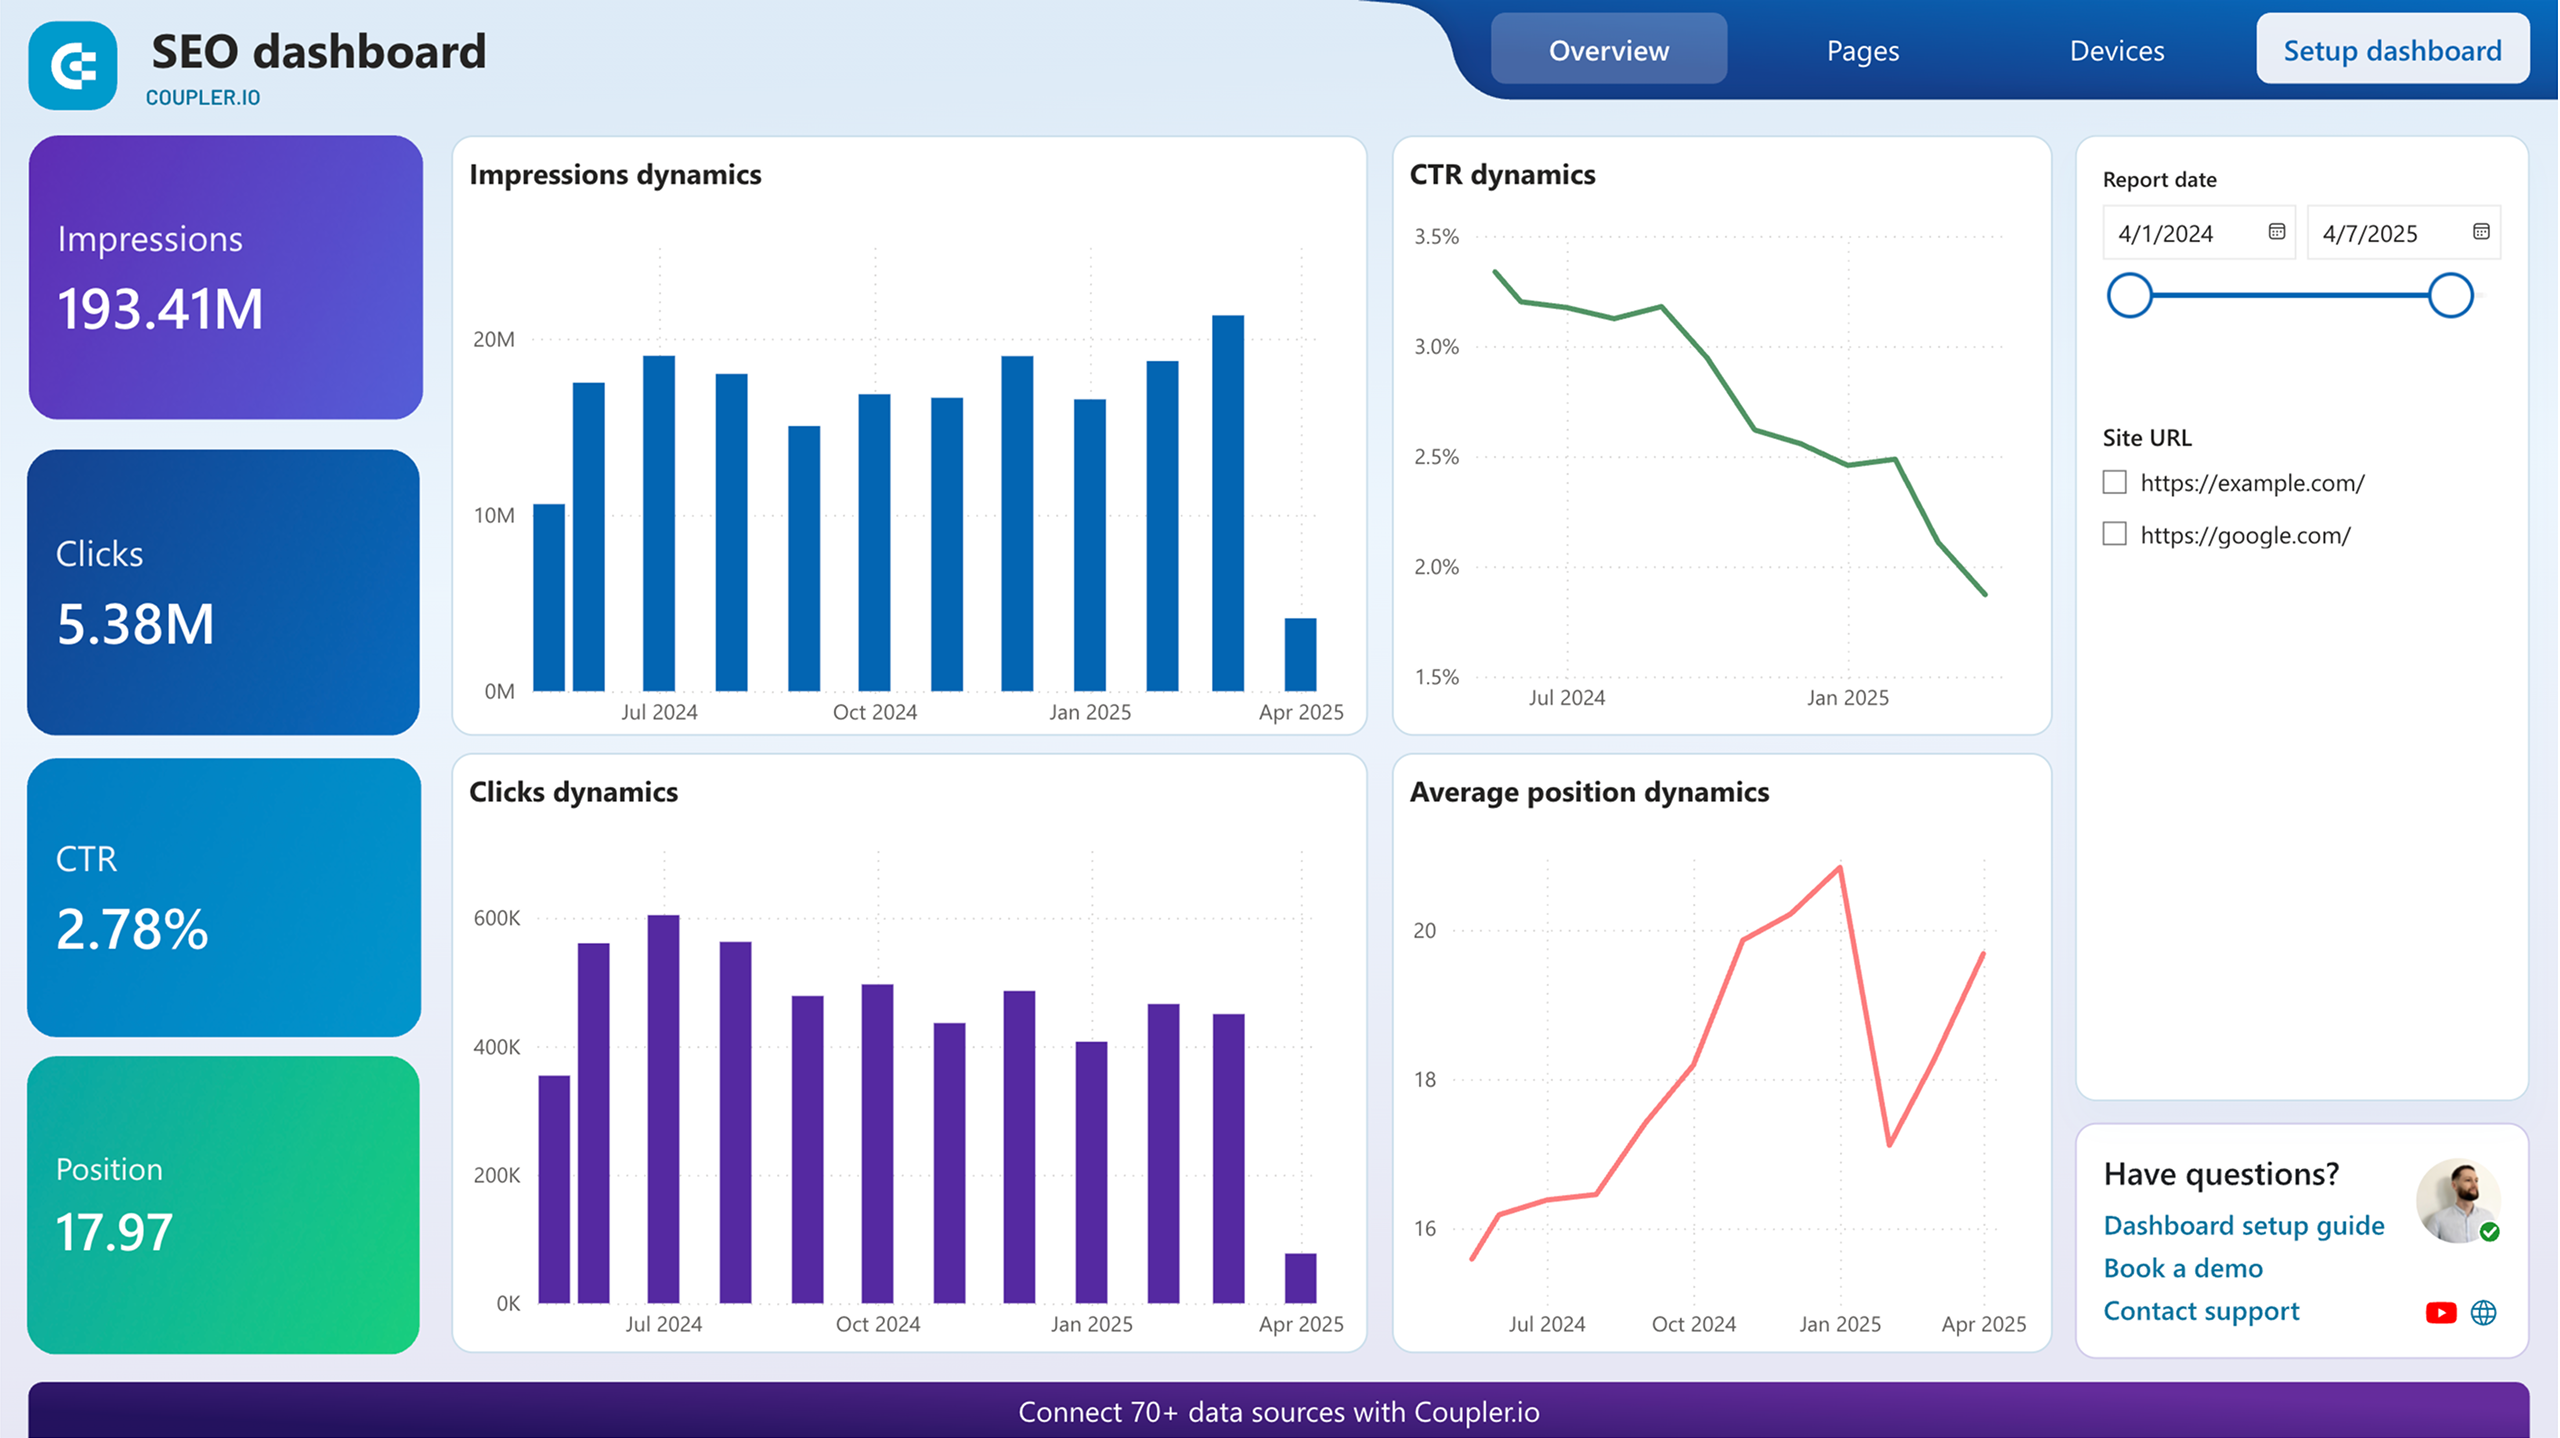
The SEO dashboard delivers actionable search performance insights through its unique dual-perspective approach. It identifies your best-performing pages that gained traffic alongside the worst-performing ones requiring attention. This Microsoft Power BI template automatically calculates performance changes between time periods, eliminating manual comparison work. For underperforming pages, you can drill down to see specific metrics like position drops, click-through rate changes, or impression losses to determine the root causes. Similarly, for top performers, you can analyze what factors contributed to their success. This balanced view enables SEO teams to simultaneously capitalize on winning content while addressing problematic areas, creating a more strategic approach to search optimization that maximizes results with limited resources.
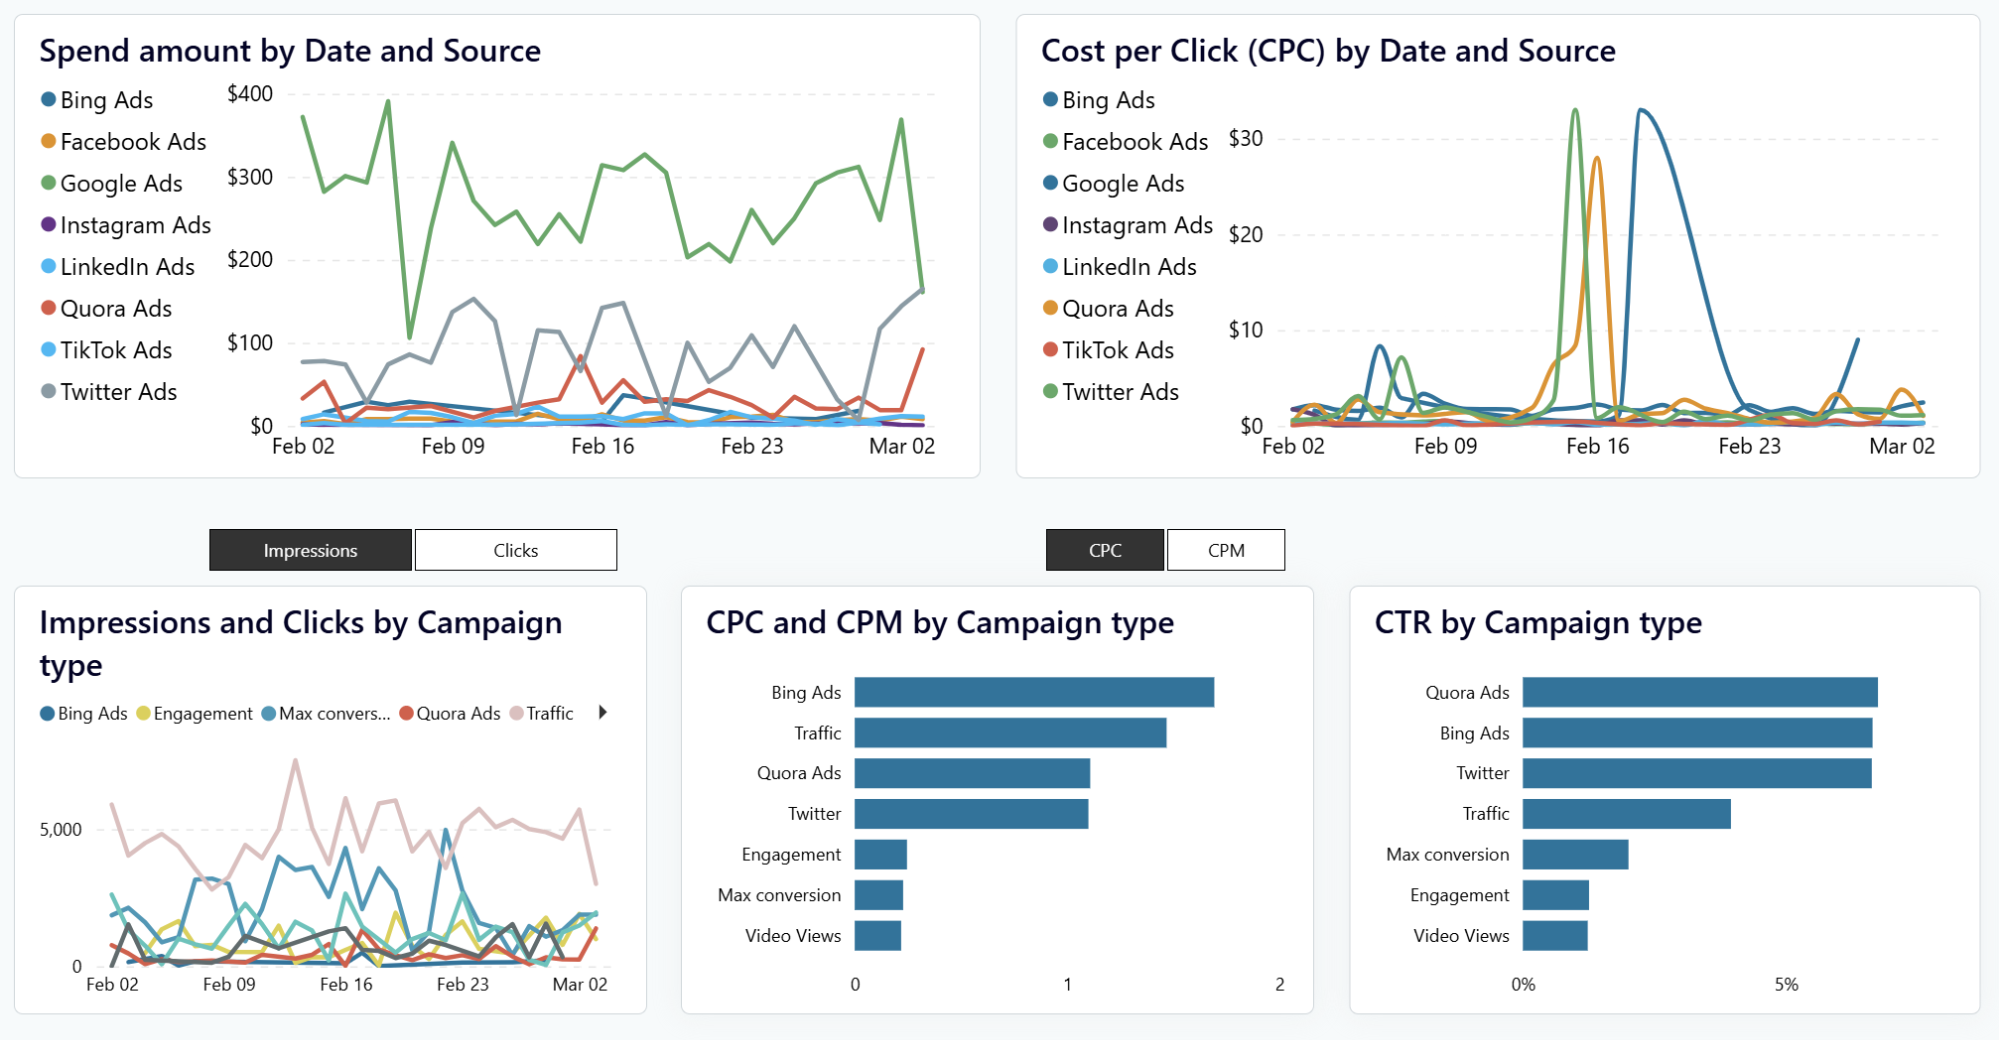
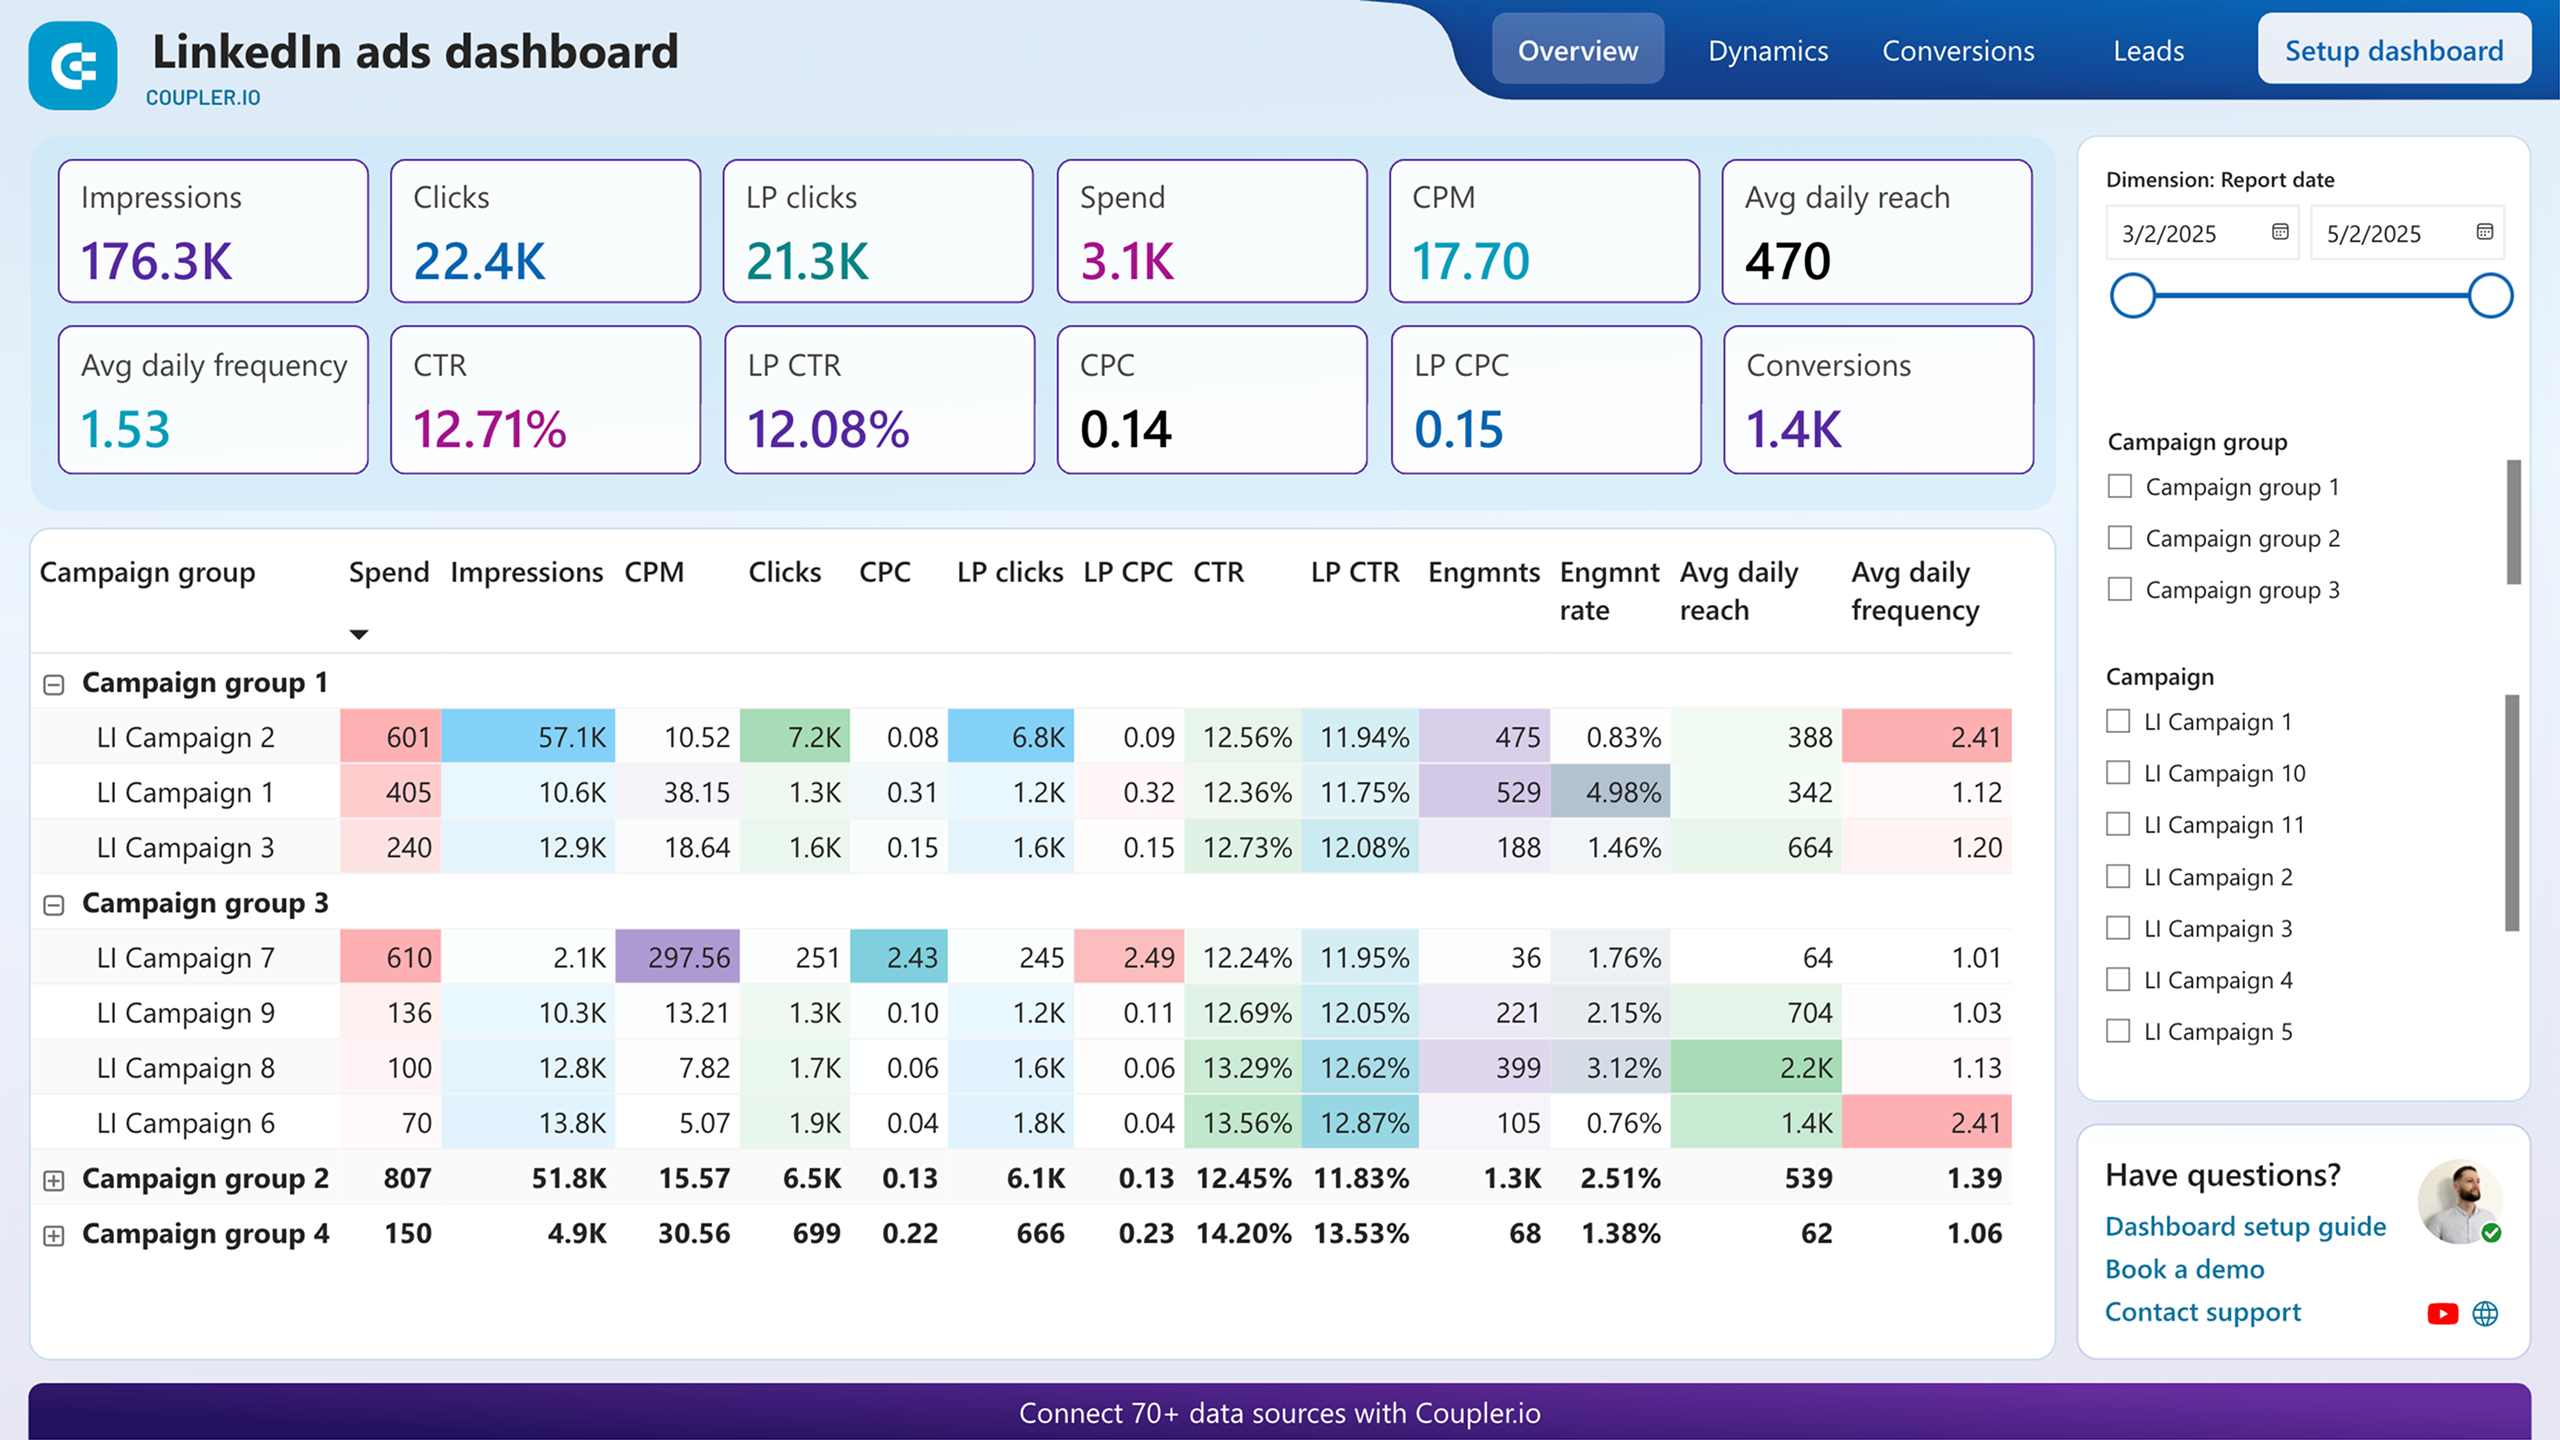
The PPC Multi-channel dashboard provides critical visibility into advertising costs through two key visualizations: spend amount by date and source, and cost-per-click trends across platforms. These complementary charts reveal which platforms deliver the most cost-effective results and how efficiency changes over time. Using this Power BI template, marketing teams can quickly identify concerning cost spikes, diminishing returns, or unexpected performance improvements across their entire advertising ecosystem. The ability to filter by platform, campaign, or time period enables precise analysis of specific initiatives. This insight helps optimize budget allocation across platforms, ensuring marketing investments flow to channels delivering the best results while controlling costs on less efficient platforms.

The Harvest Time Tracking dashboard features an intuitive calendar view that transforms time data into actionable workforce insights. This visualization displays detailed time allocation by user, enabling managers to identify productivity patterns, resource constraints, and potential burnout situations. The Power BI report template highlights instances where team members log excessive hours on single days or consistently underreport time. This helps project managers address both operational and well-being concerns. They can analyze billable versus non-billable time distribution to optimize profitability. By comparing actual time investments against project budgets, teams can identify scope creep before it impacts deadlines or margins. This template for Power BI helps create more accurate time estimates for future projects while ensuring current resources are allocated efficiently.
How to use Power BI templates?
