Social media dashboard examples and reporting templates
Measure and optimize your social media strategy with automated social media reporting dashboards that consolidate data across major platforms. Track engagement metrics, analyze audience demographics, and evaluate content performance with real-time insights from Facebook, Instagram, LinkedIn, TikTok, YouTube, and other platforms.
Social Media dashboard examples for every need


about your case. It doesn't cost you a penny 😉
What is a social media dashboard?
Today's social media reporting dashboards serve as command centers for digital marketing teams, tracking everything from engagement rates and follower growth to content performance and conversion metrics. With Coupler.io's automated data refreshing, your dashboard for social media stays up-to-date without manual updates, freeing teams to focus on strategy rather than data collection. This real-time visibility helps businesses respond quickly to performance shifts and capitalize on emerging opportunities across their social presence.

Choose your Social Media dashboard template to kick off
What reports should be included on a meaningful social media reporting dashboard?
A comprehensive social media reporting dashboard should include several key reports that provide complete visibility into your performance across platforms. Based on our analysis of successful social media dashboards, we recommend incorporating these four essential report types:
The cross-platform performance report provides a unified view of metrics across all your social media channels. This social media KPI dashboard section compares engagement rates, follower growth, and reach across Facebook, Instagram, LinkedIn, and YouTube, allowing you to identify your strongest platforms and areas for improvement. With a Looker Studio social media dashboard, you can visualize these comparative metrics in interactive charts that make platform strengths immediately apparent. By tracking these metrics in one place, you can better allocate resources and optimize your content strategy based on which platforms deliver the best results for your specific goals.
The audience insights report reveals detailed demographic and behavioral information about your followers across each platform. This includes age, gender, location, and professional data, along with engagement patterns and active hours. These insights help you understand who your content resonates with, enabling you to refine targeting, create more relevant content, and optimize posting schedules. This social media metrics dashboard section is essential for developing a data-driven approach to audience development and engagement.
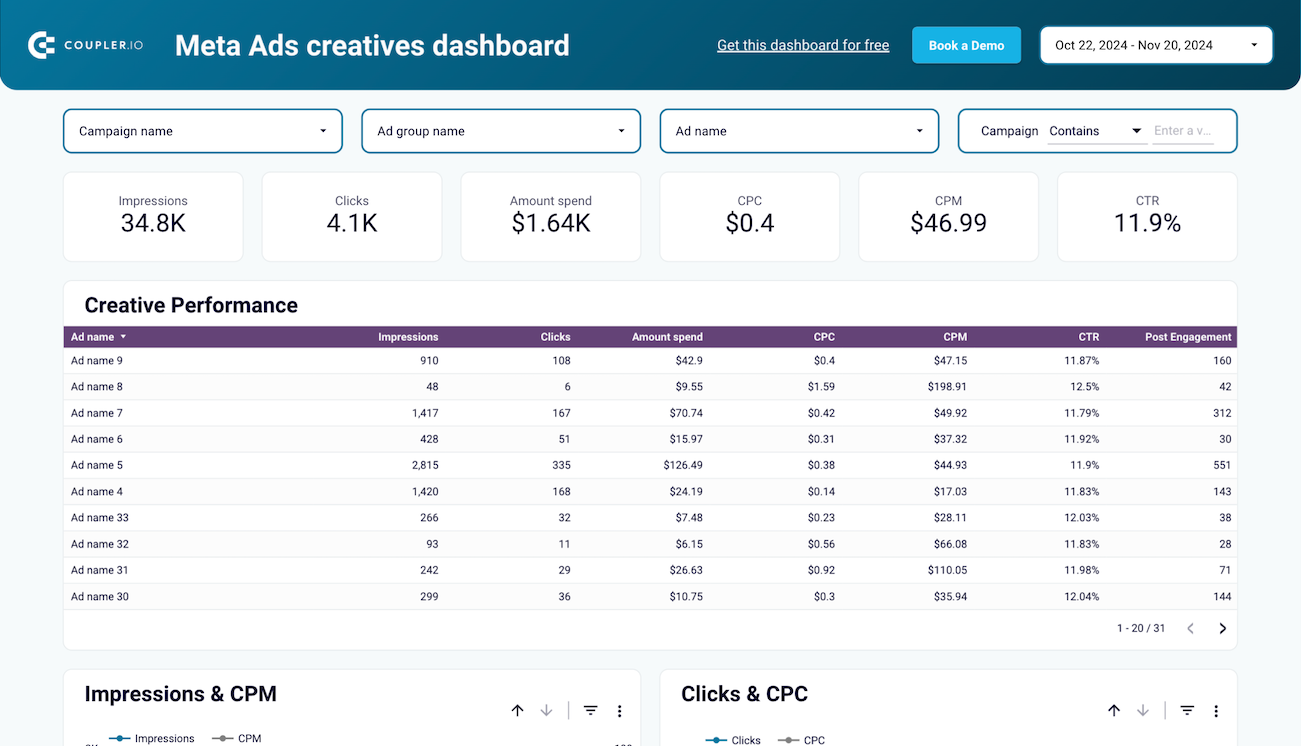
The content performance report analyzes how individual posts, videos, and campaigns perform across metrics like reach, engagement, shares, and conversion rates. By identifying your highest and lowest-performing content, this section of the social media performance dashboard helps you understand what resonates with your audience on each platform. These insights allow you to replicate successful content formats, topics, and styles while adjusting or eliminating underperforming approaches to maximize engagement and ROI.
The growth and conversion report tracks how social media activities translate into business objectives like website traffic, lead generation, and sales. This dashboard for social media connects engagement metrics to conversion actions, helping you understand the revenue impact of your social efforts. By tracking subscriber growth, click-through rates, and conversion metrics over time, this social media campaign dashboard section allows you to demonstrate ROI and make data-driven decisions about which platforms and content types deserve more investment.
What insights you can get with social media dashboards
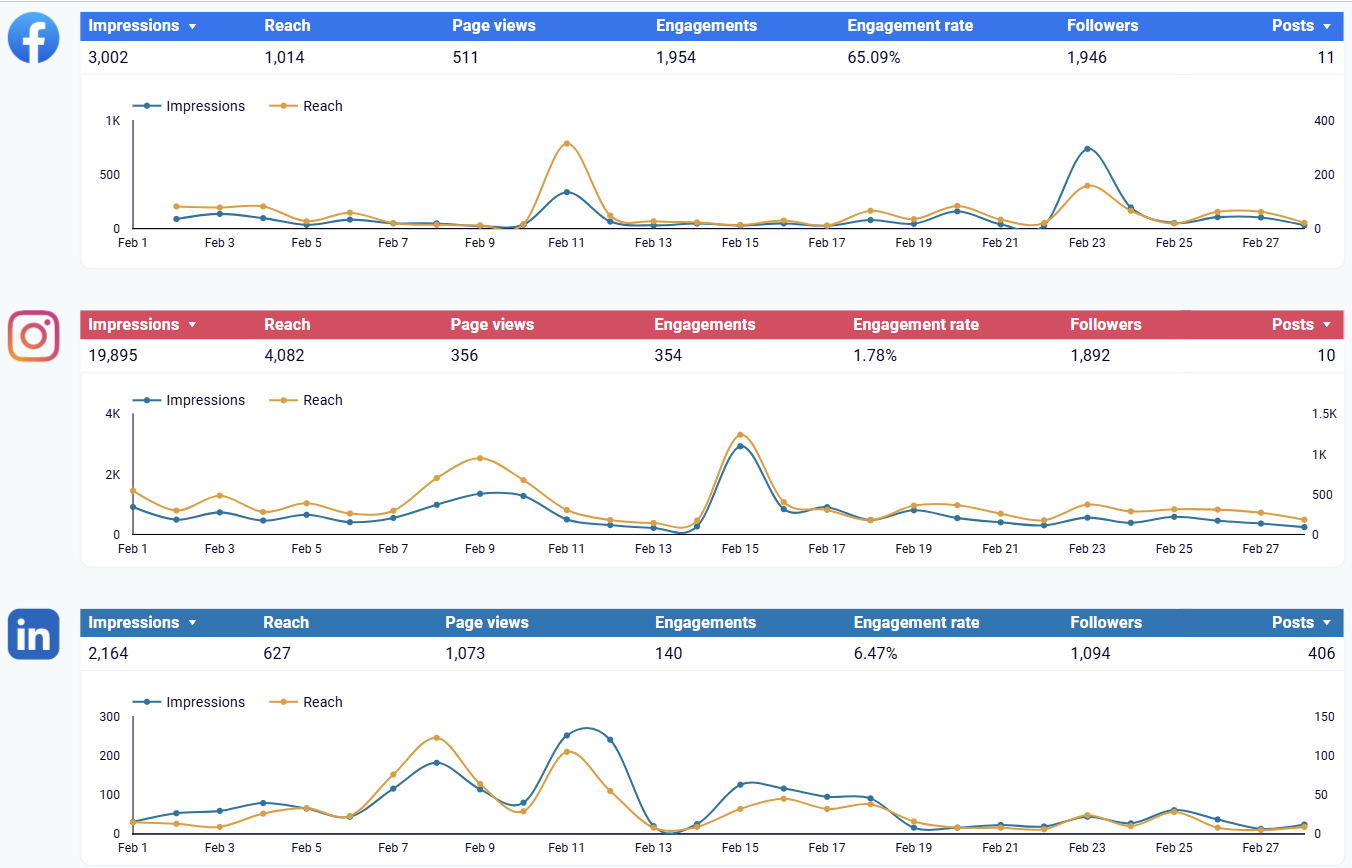
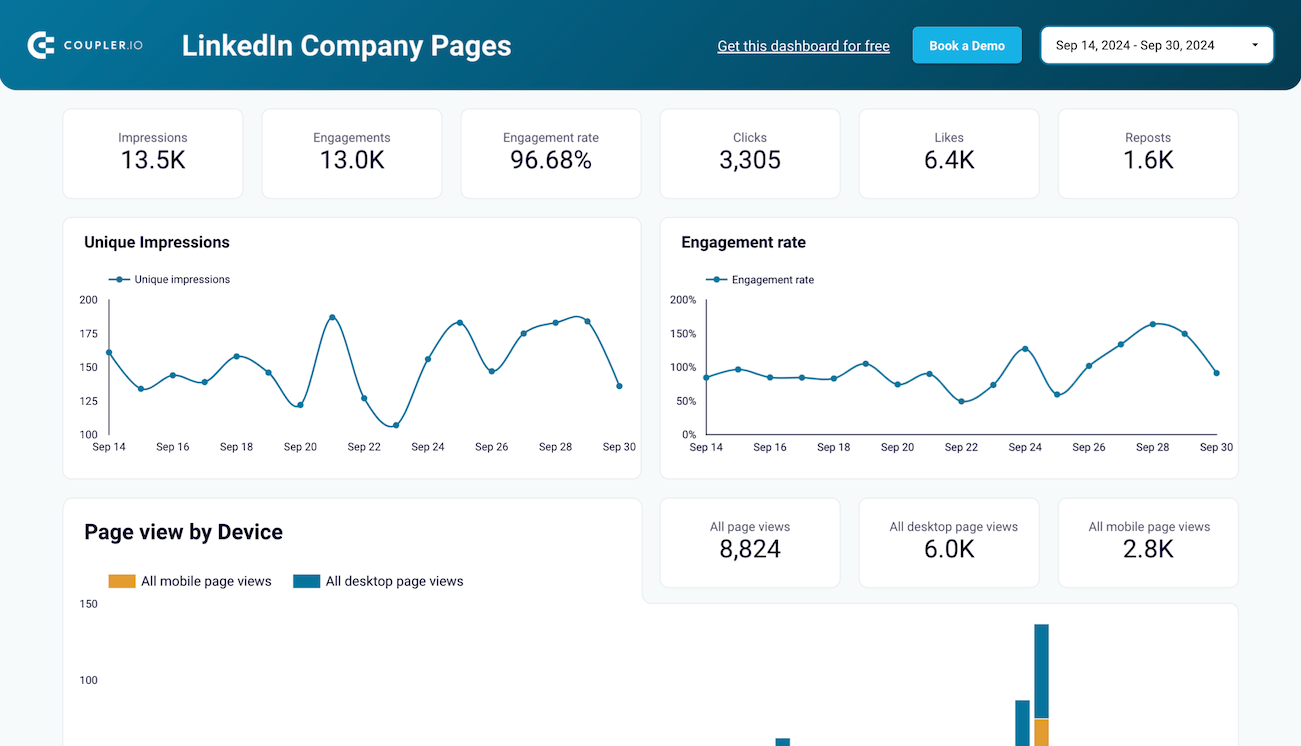
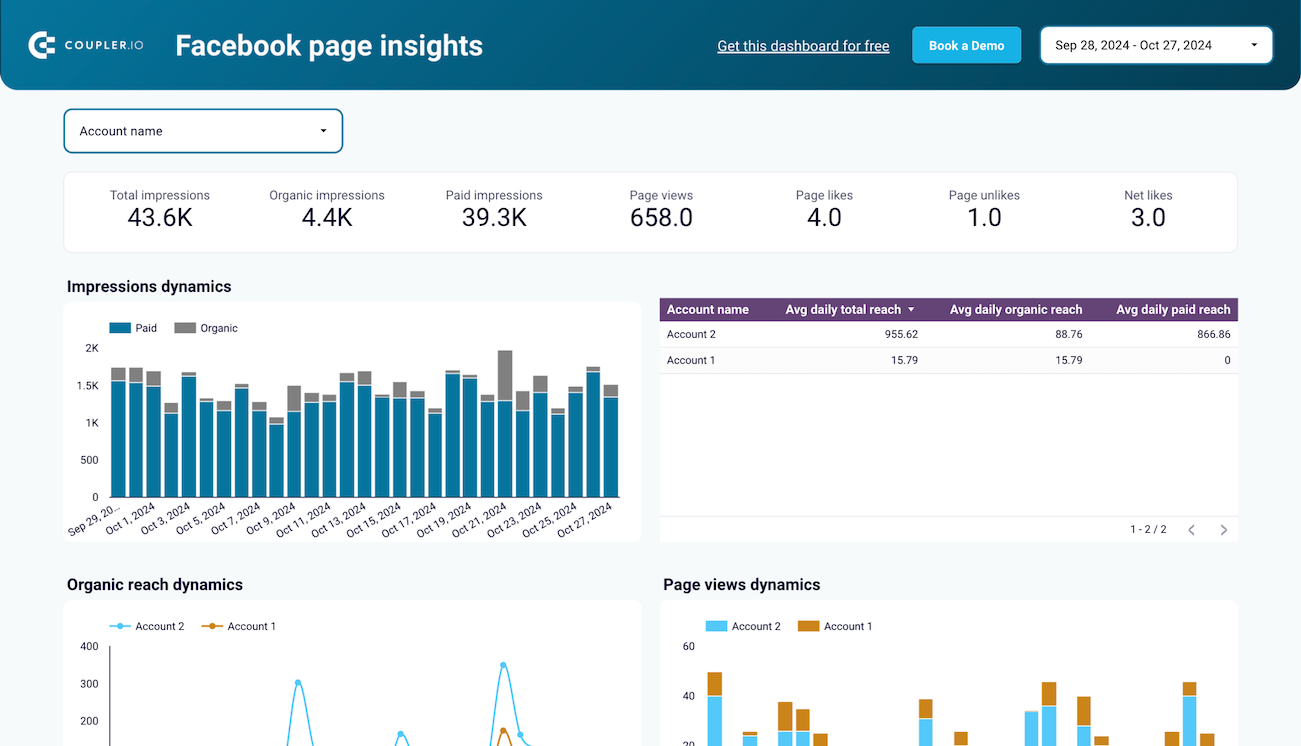
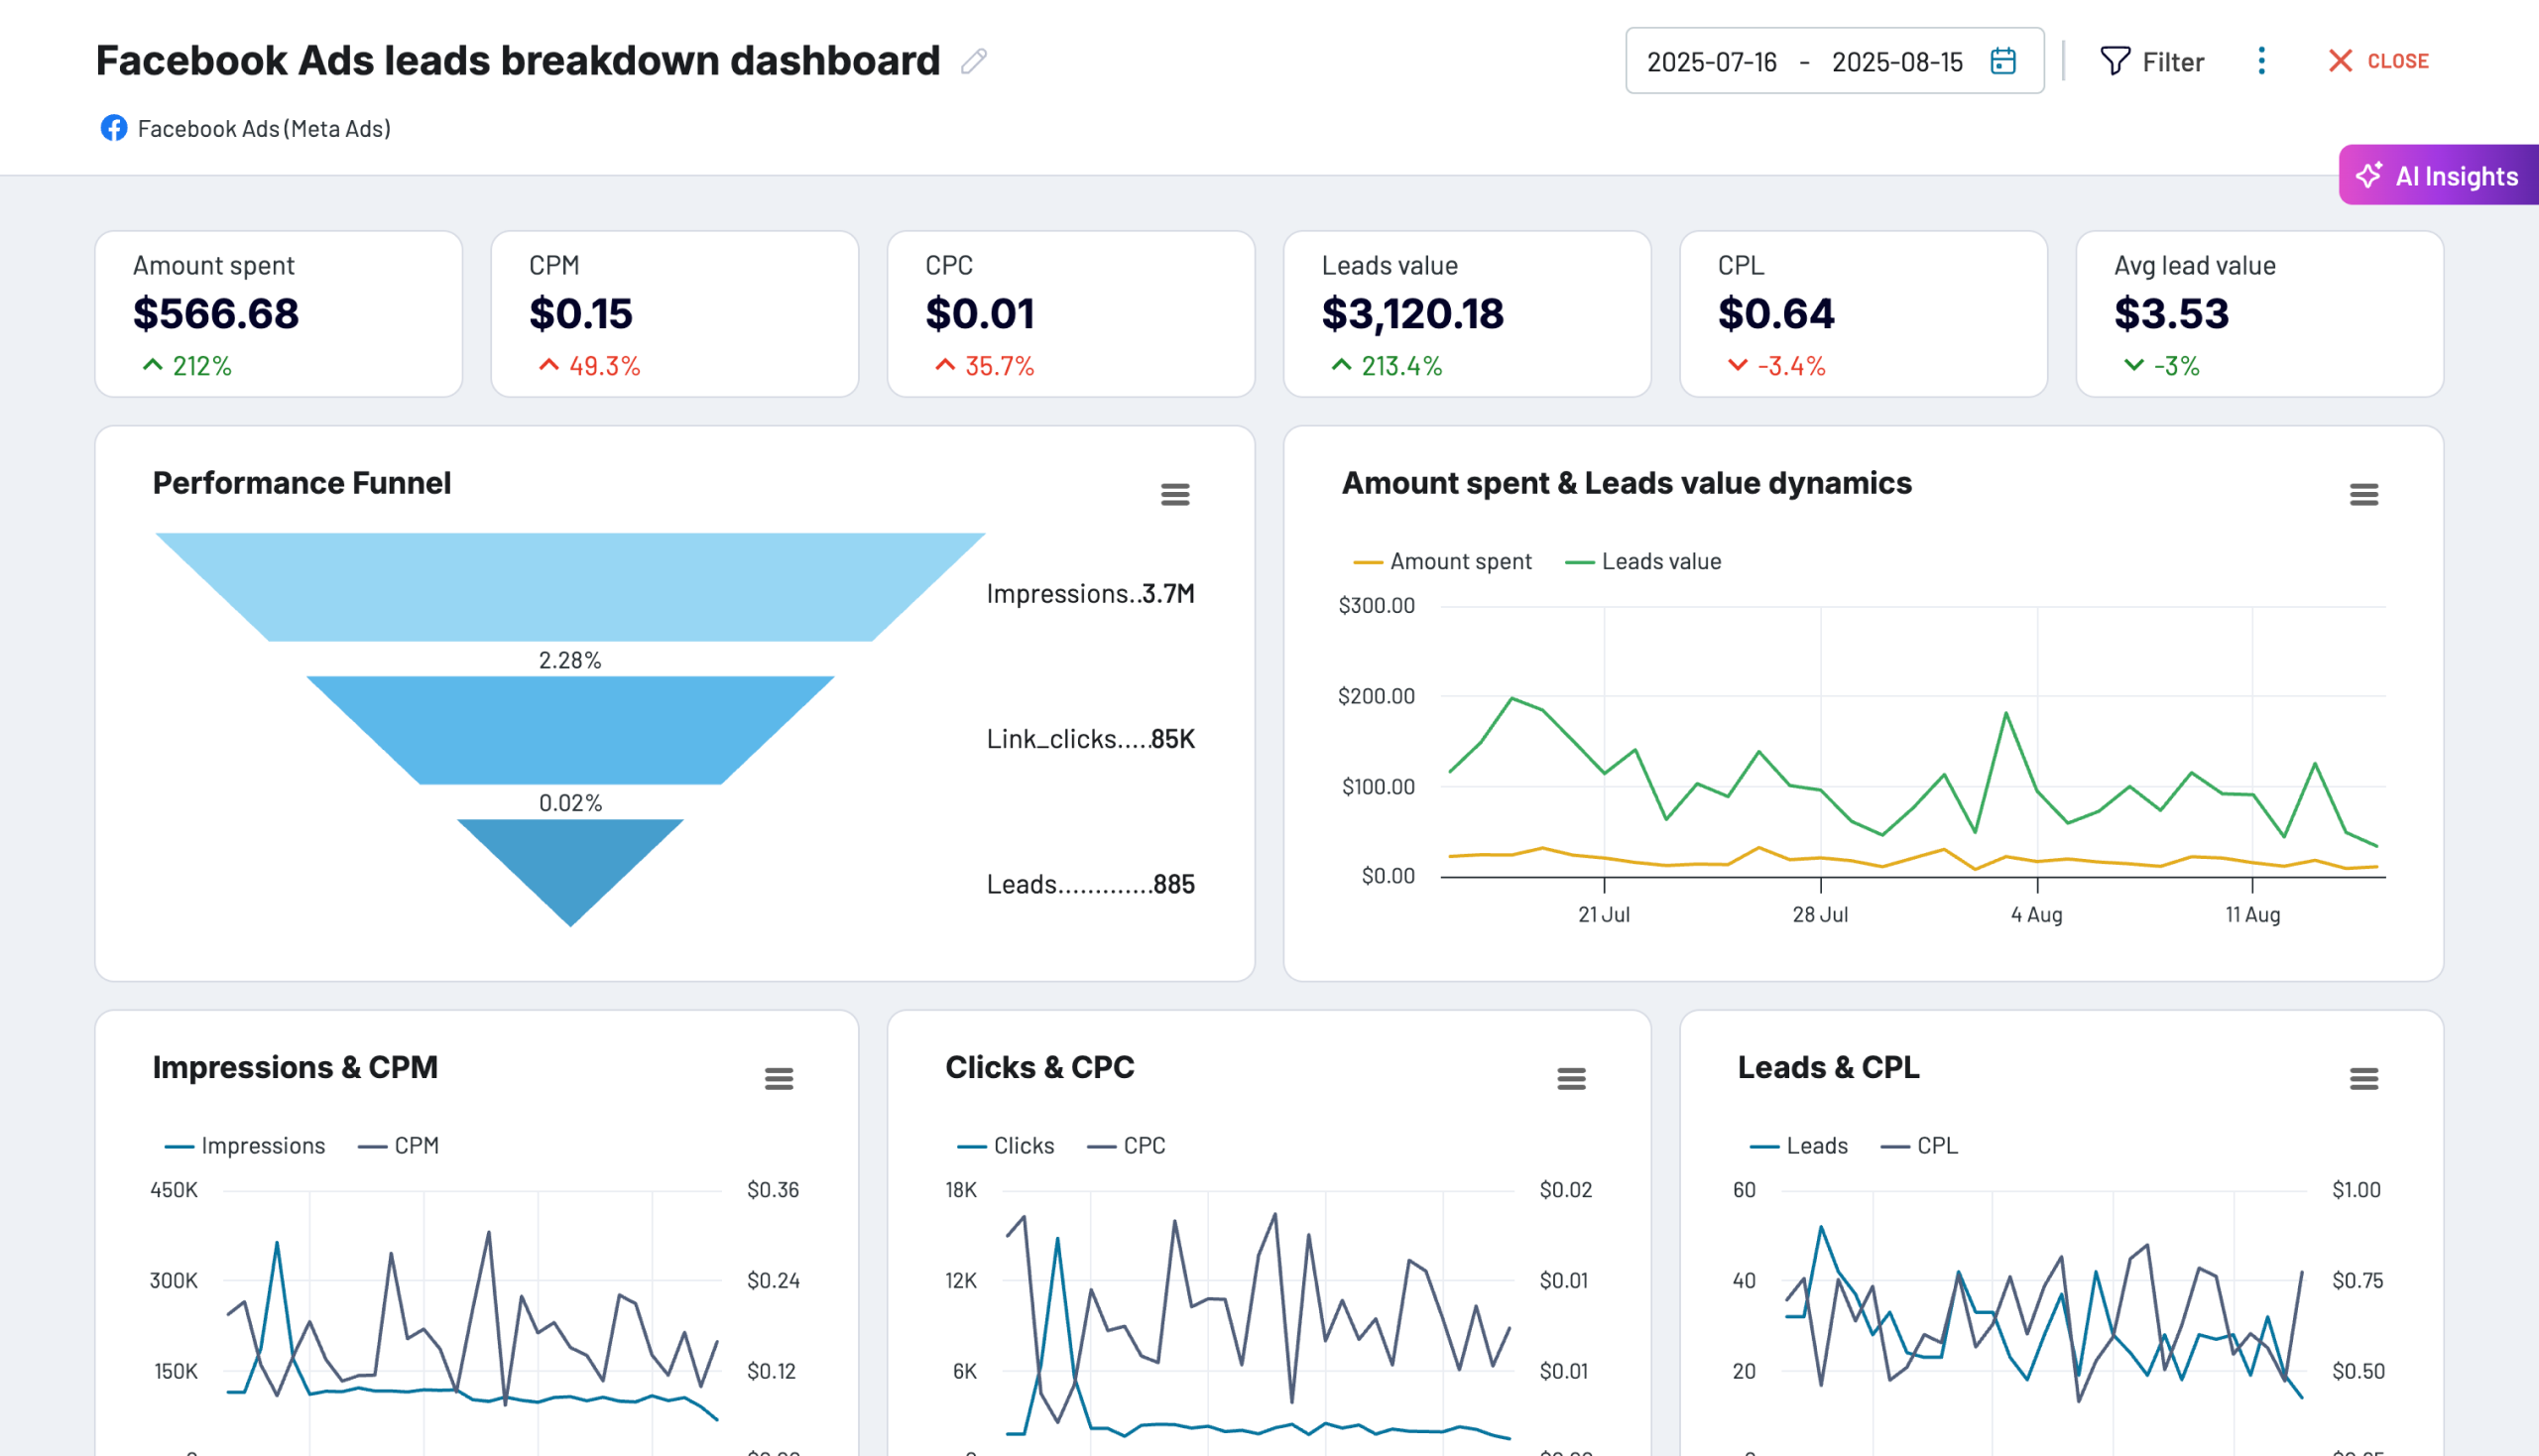
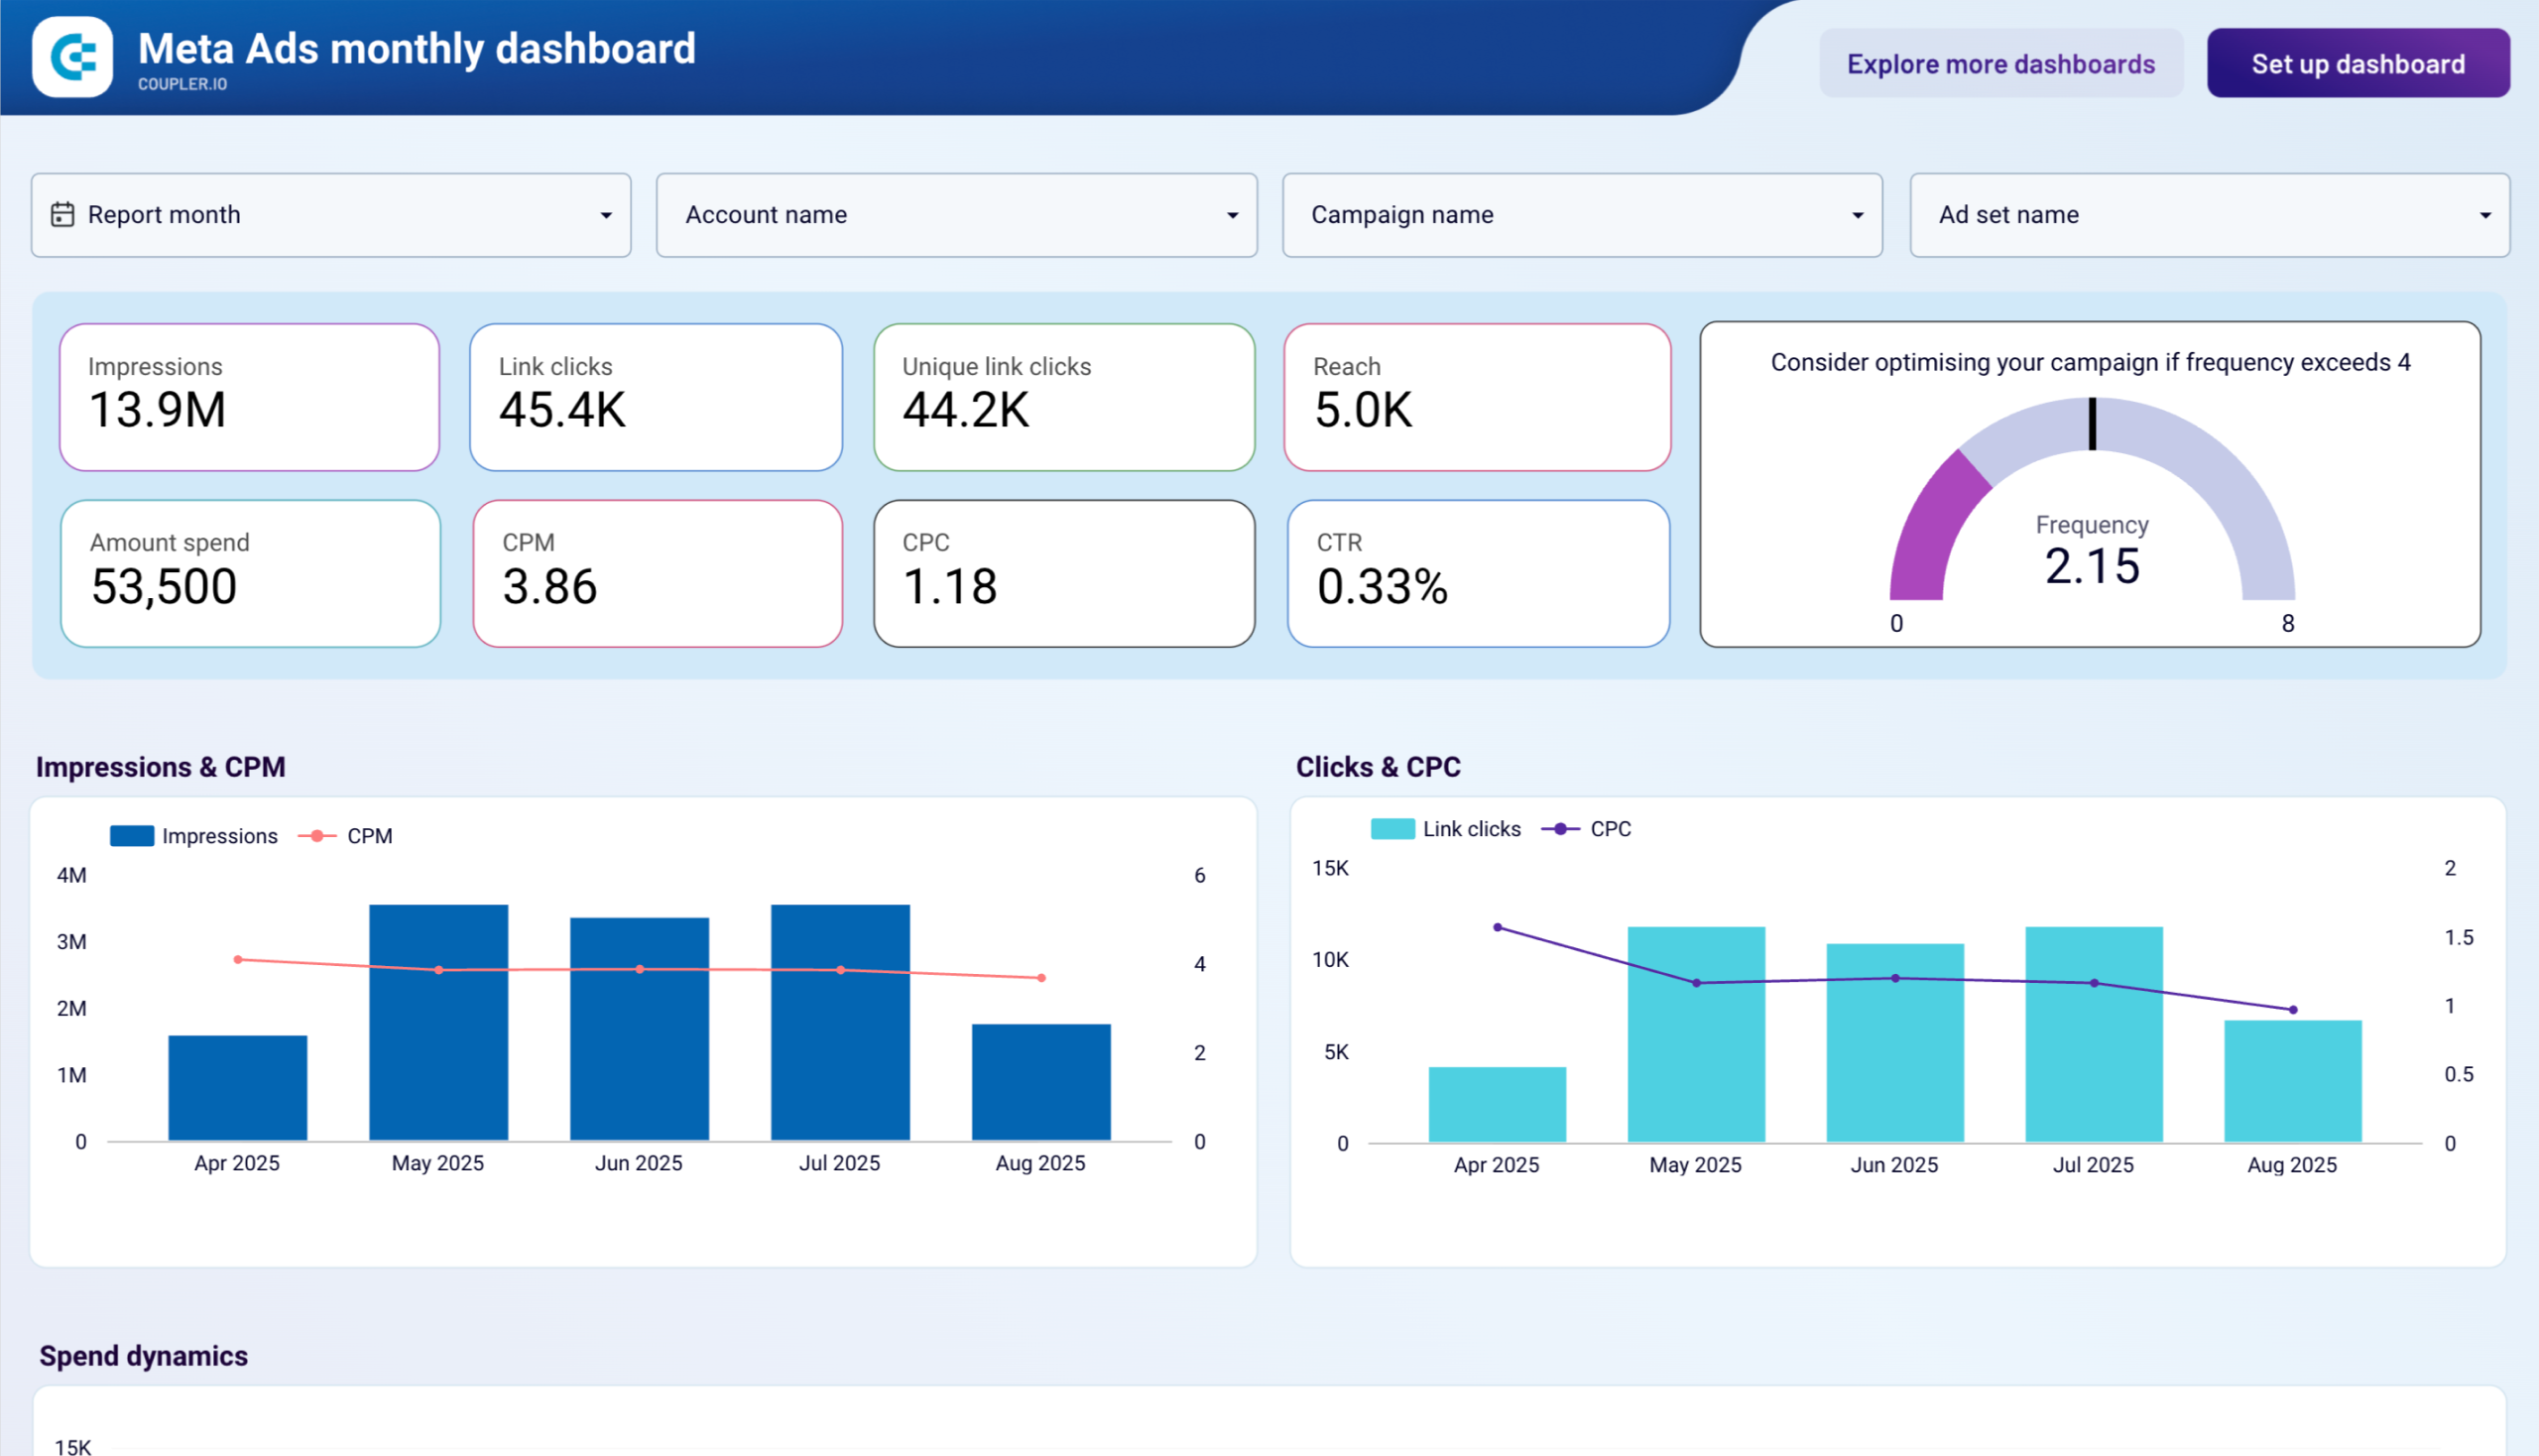
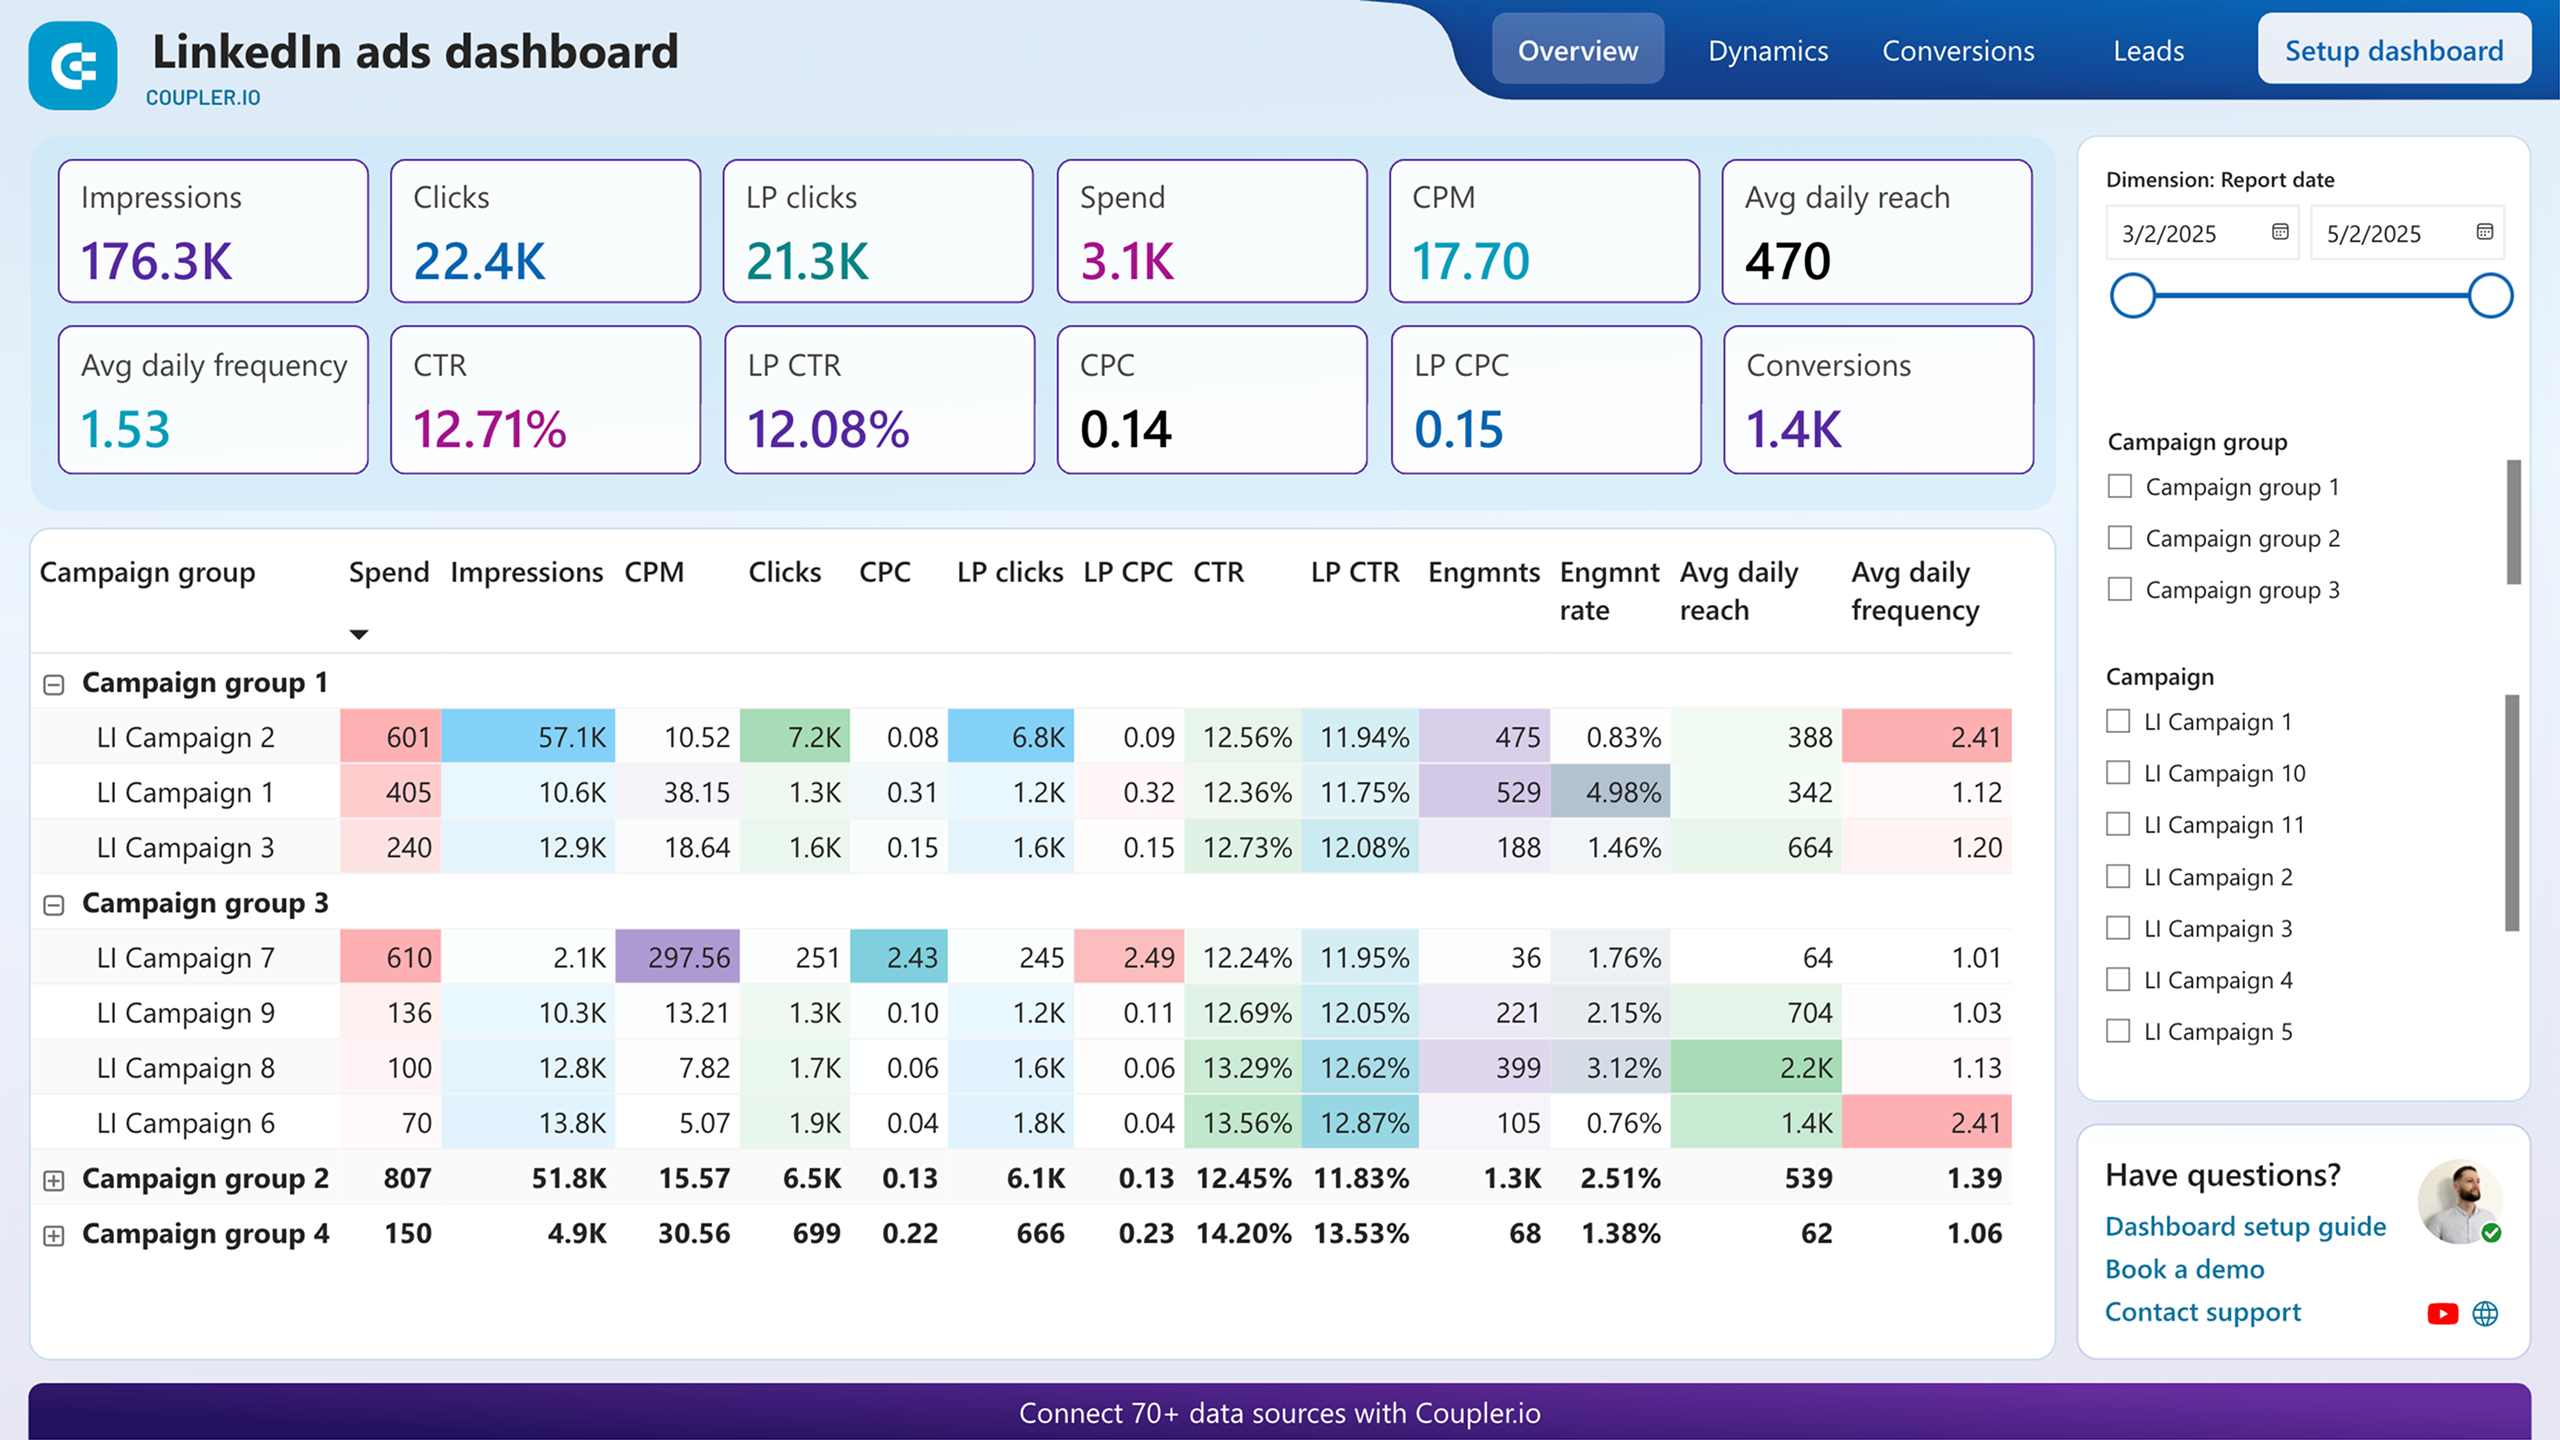
The all-in-one social media dashboard offers a comprehensive overview of performance across multiple platforms, including Facebook, Instagram, LinkedIn, and YouTube. The dashboard visually presents key metrics like impressions, engagement, and conversions side-by-side, making it easy to identify which platforms are driving the most traffic and delivering the strongest results. This comparative view helps marketing teams allocate resources effectively and optimize their cross-platform strategy based on actual performance data.
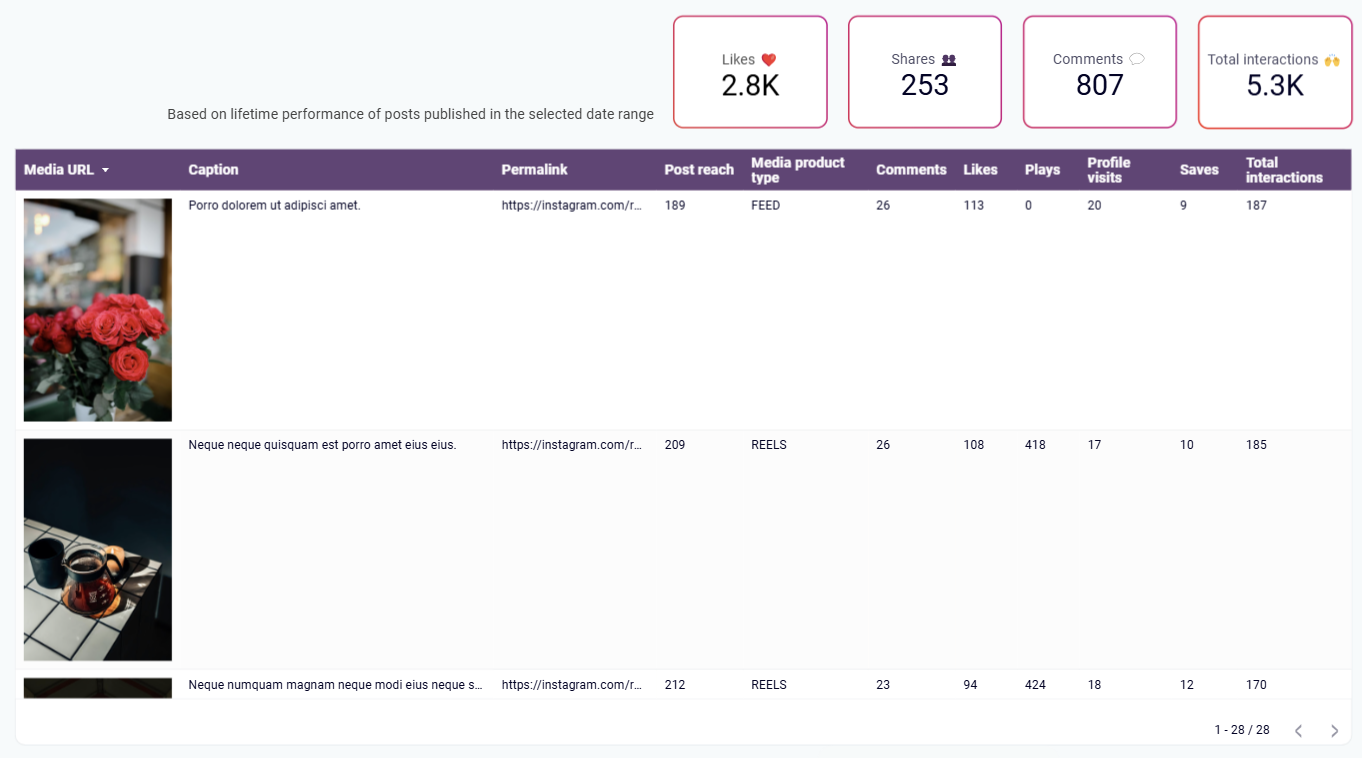
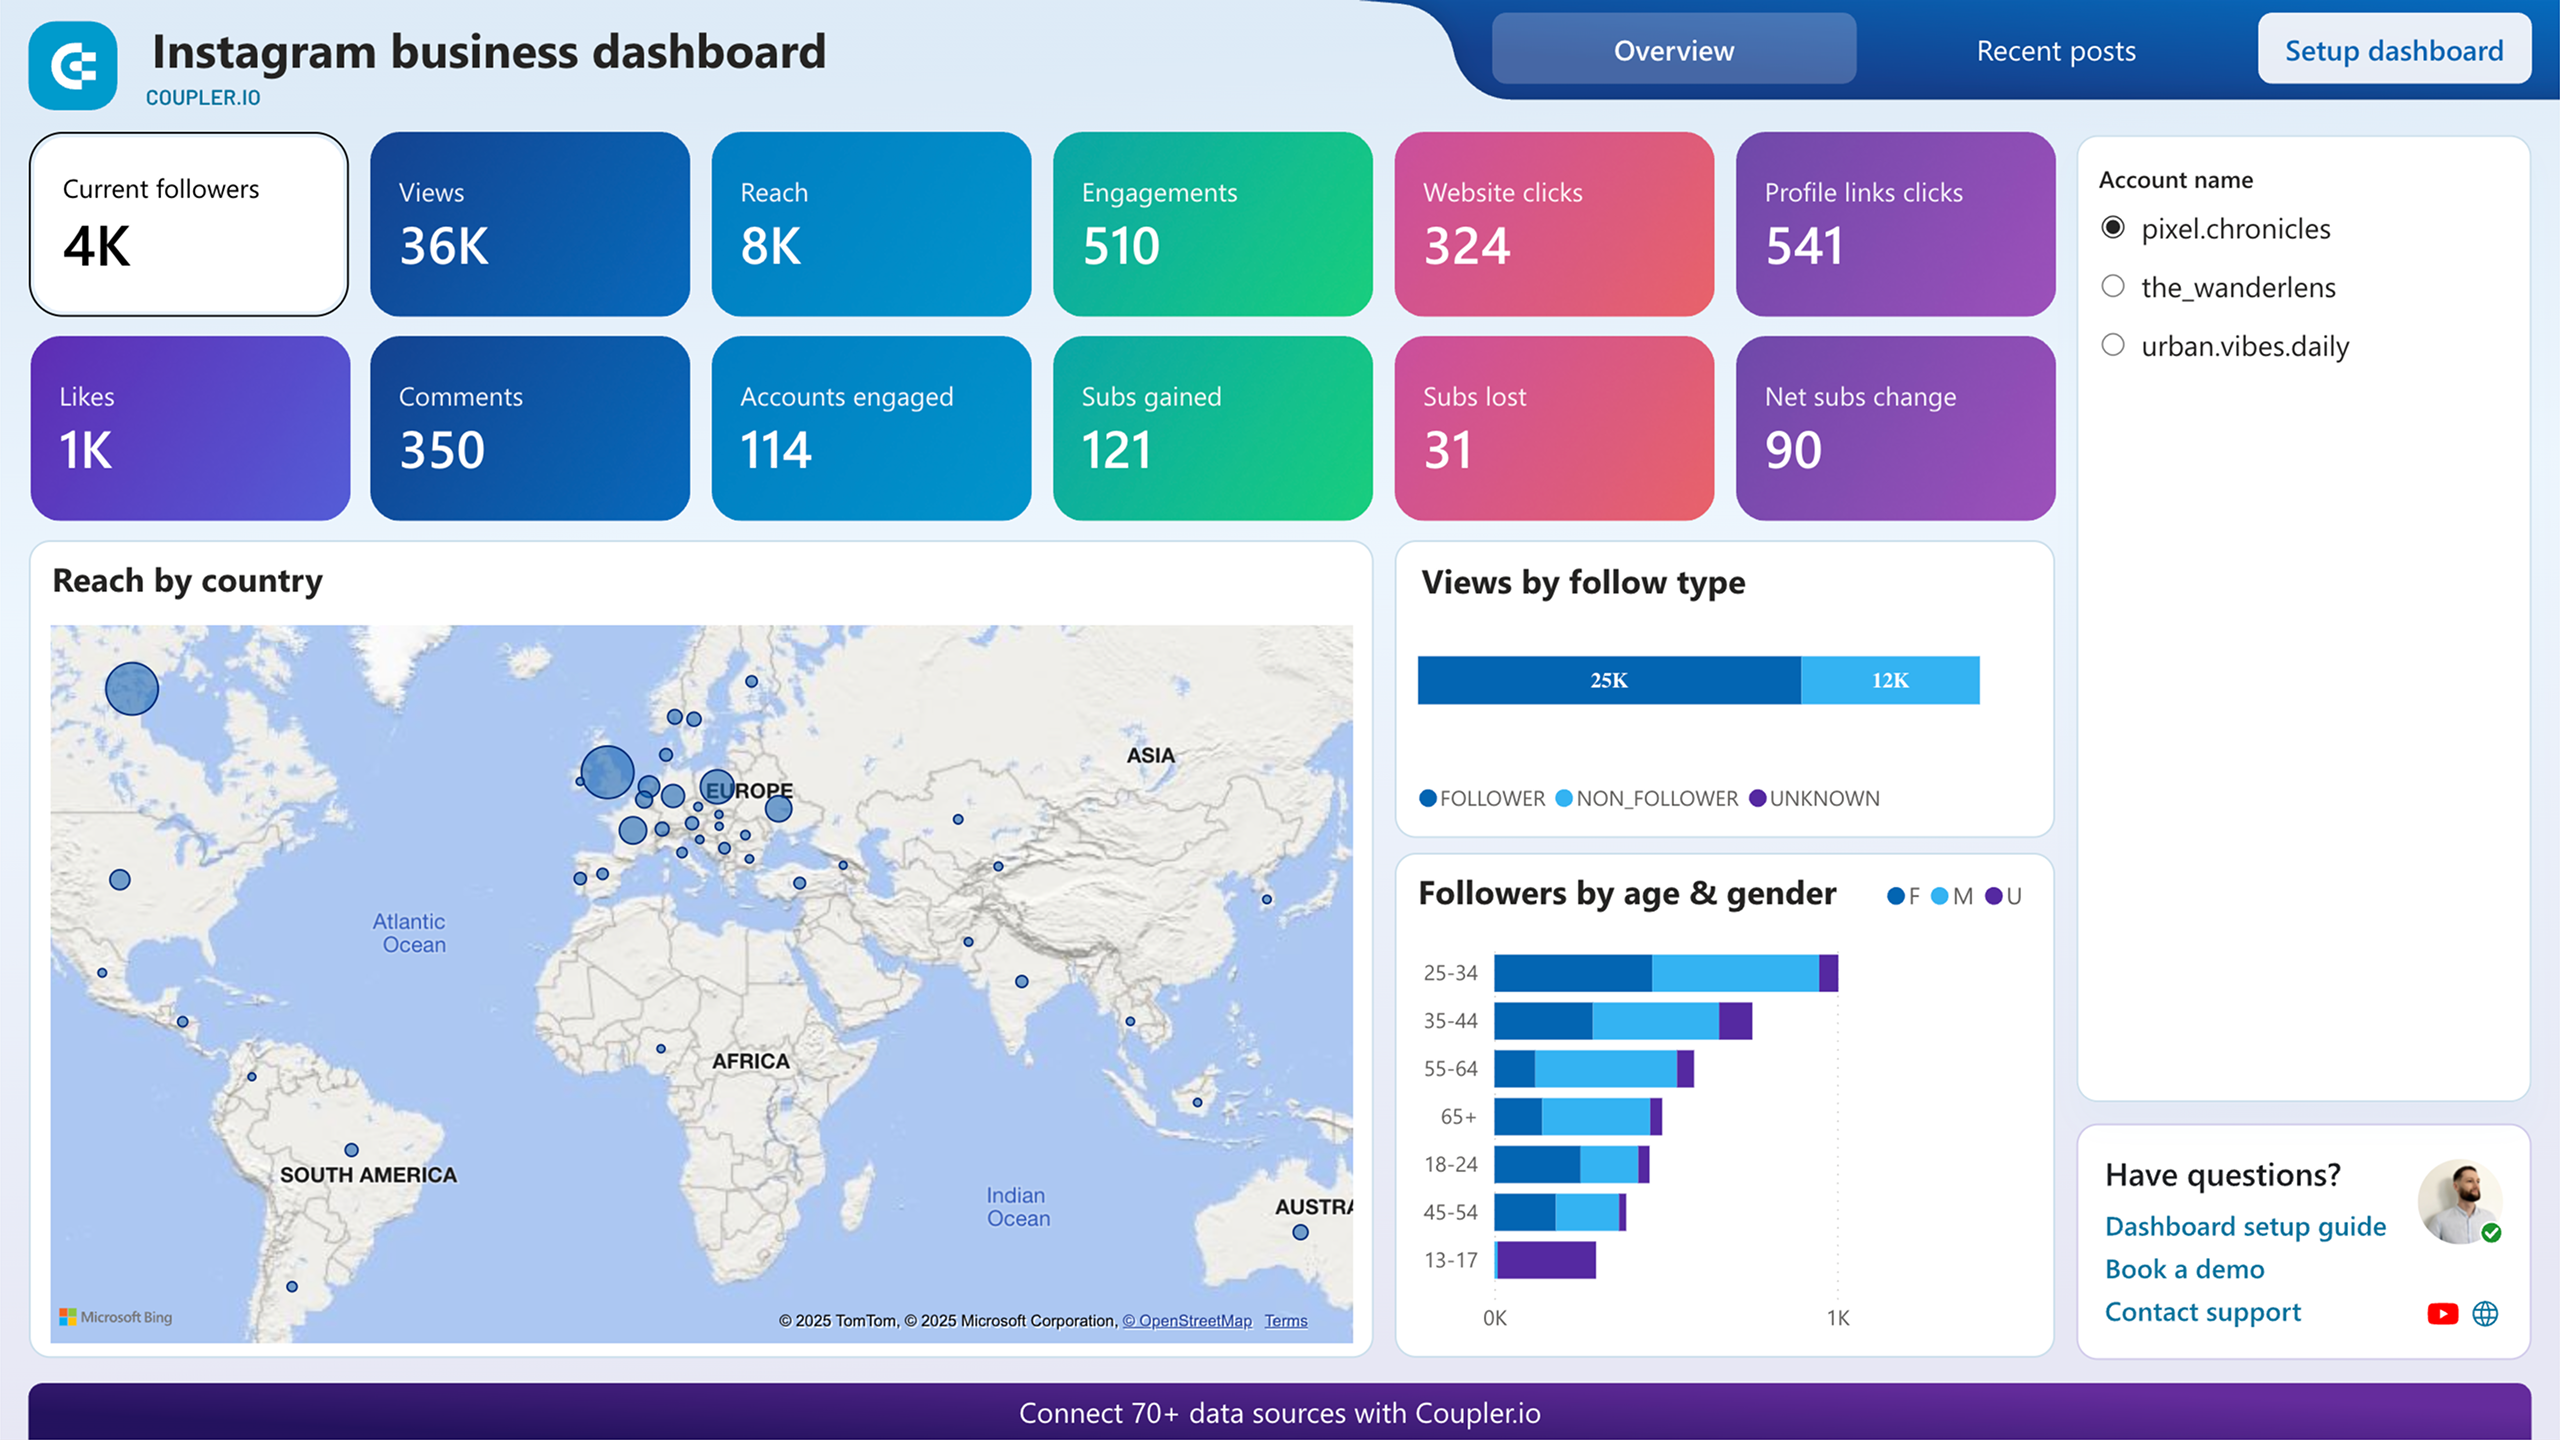
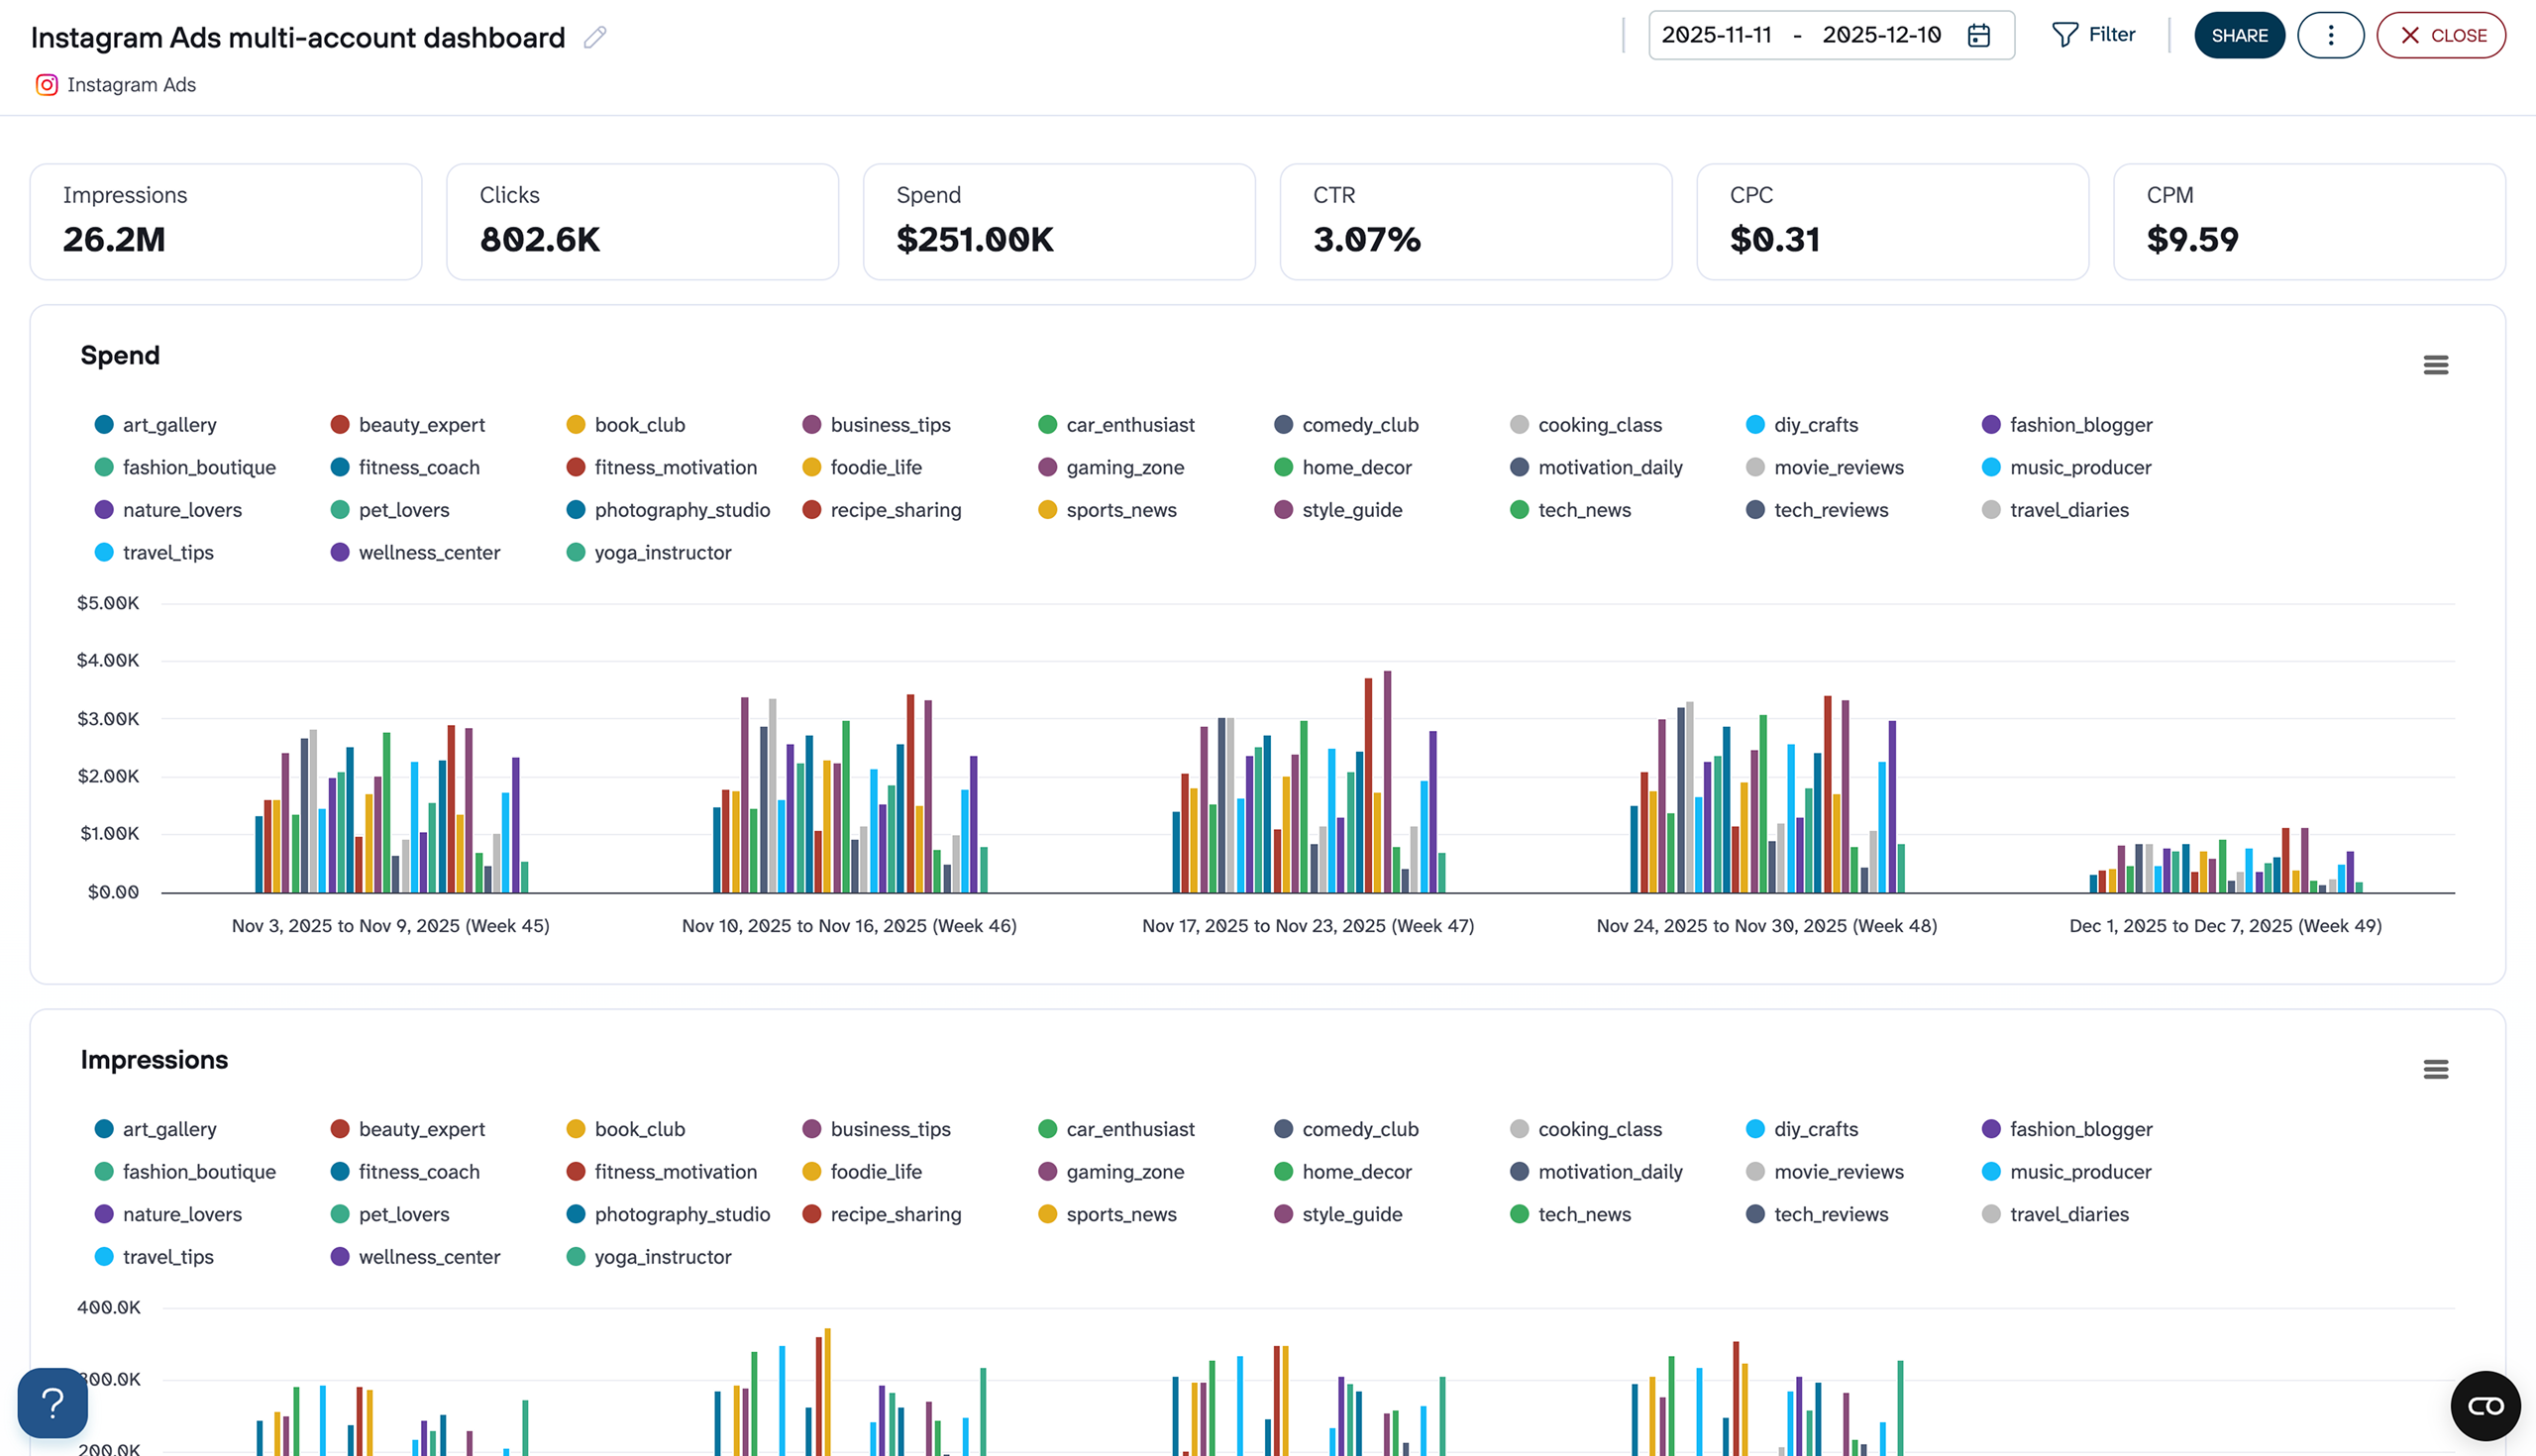
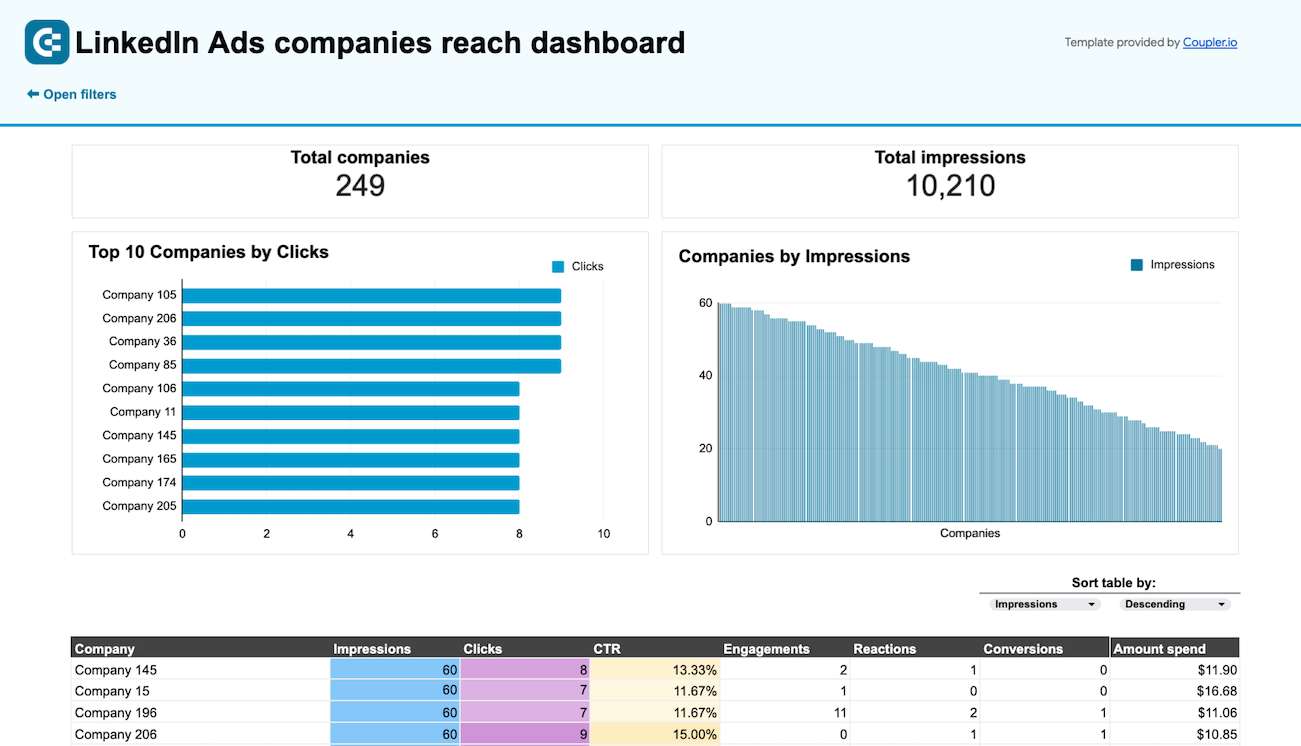
The Instagram Business dashboard provides a detailed breakdown of each post's performance, including reach, comments, likes, and other engagement metrics in one convenient table. This granular view helps social media managers identify content patterns that resonate with audiences, understand which post types drive the most engagement, and recognize optimal posting times. By analyzing performance trends across multiple content pieces, teams can refine their content strategy to maximize audience interaction and growth.
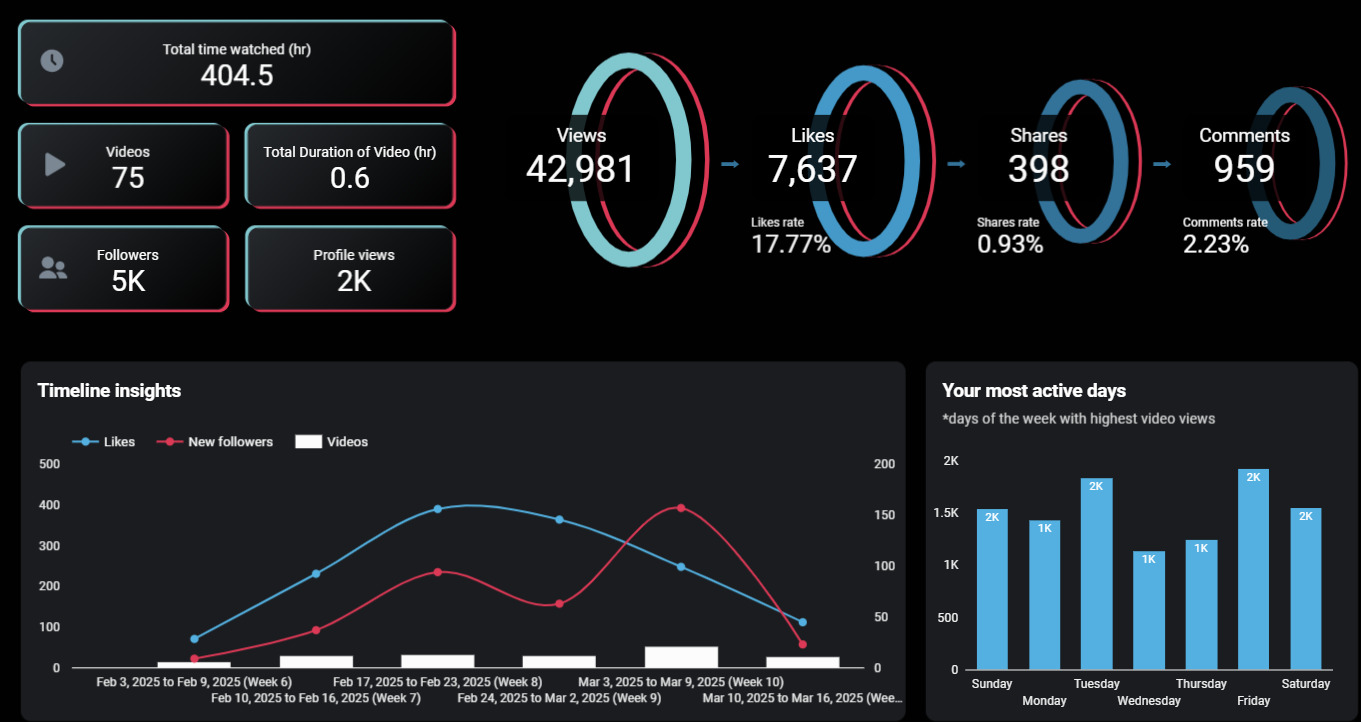
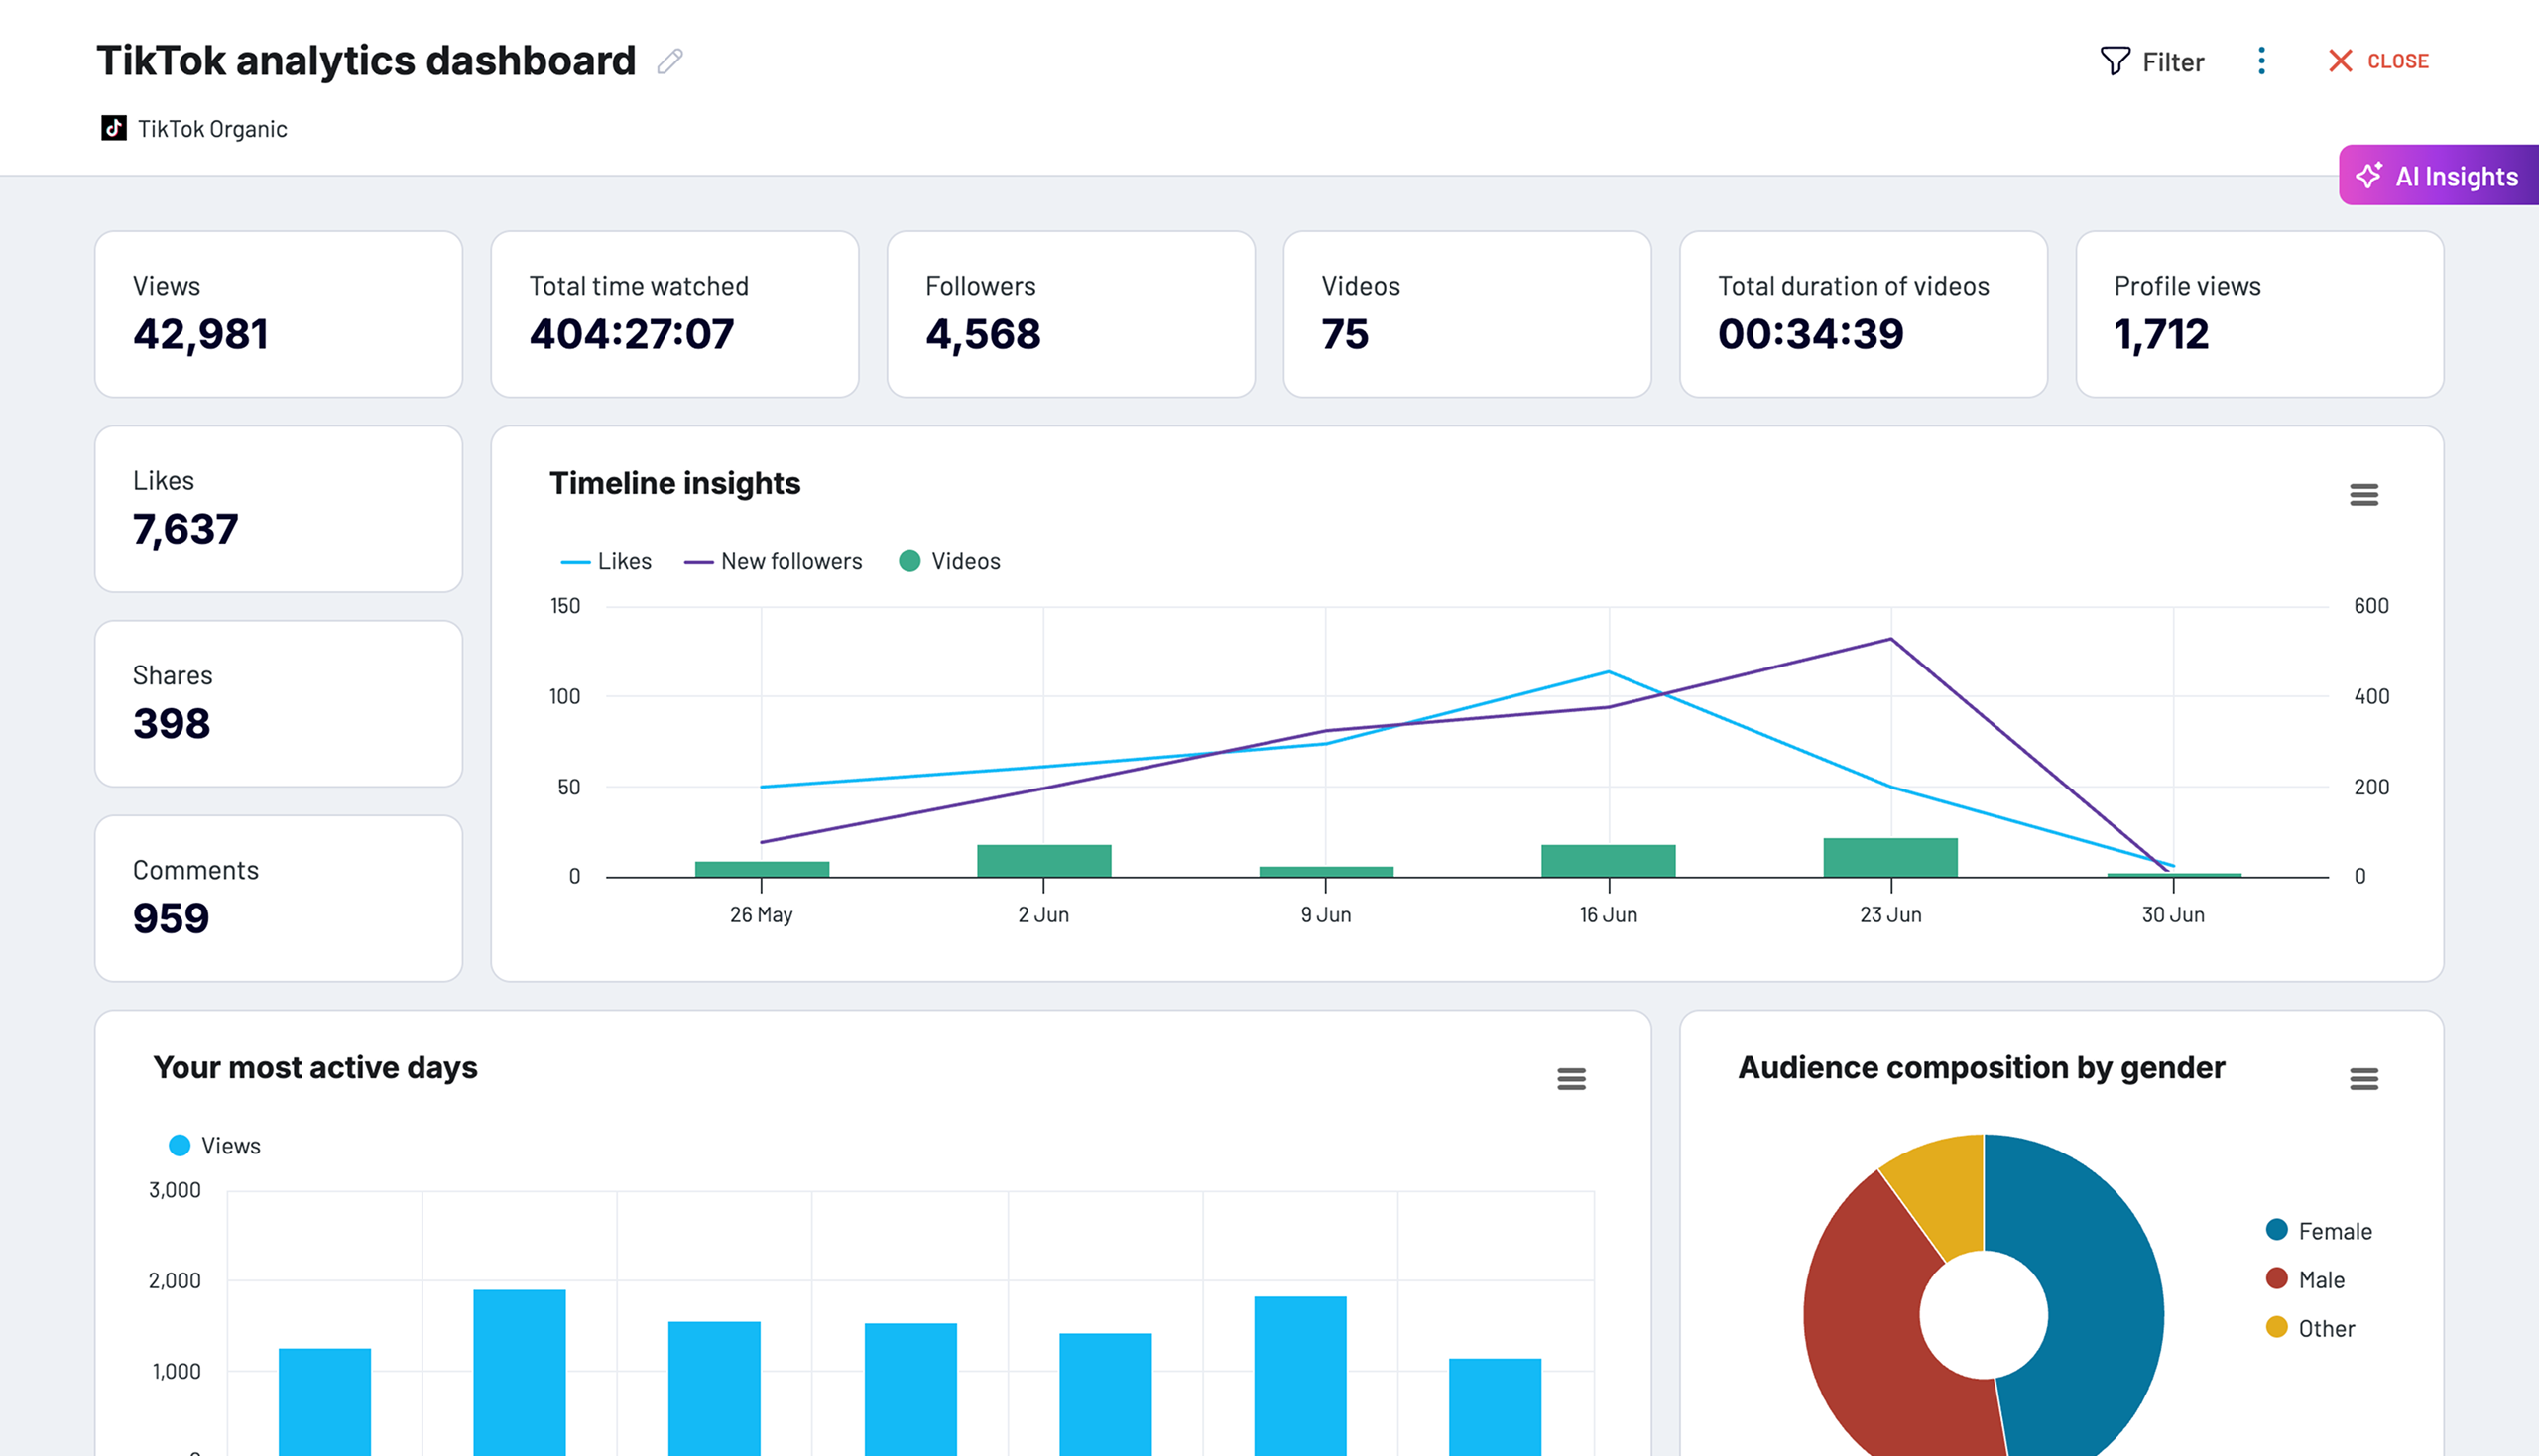
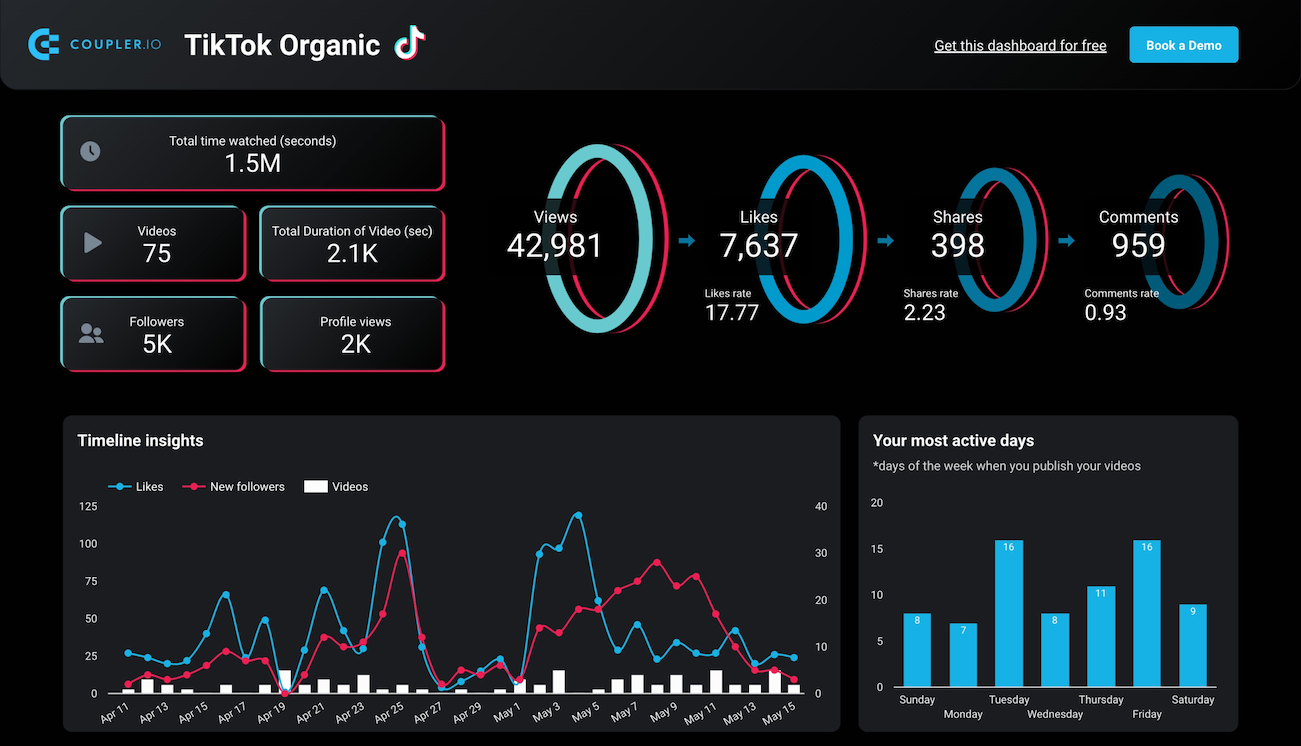
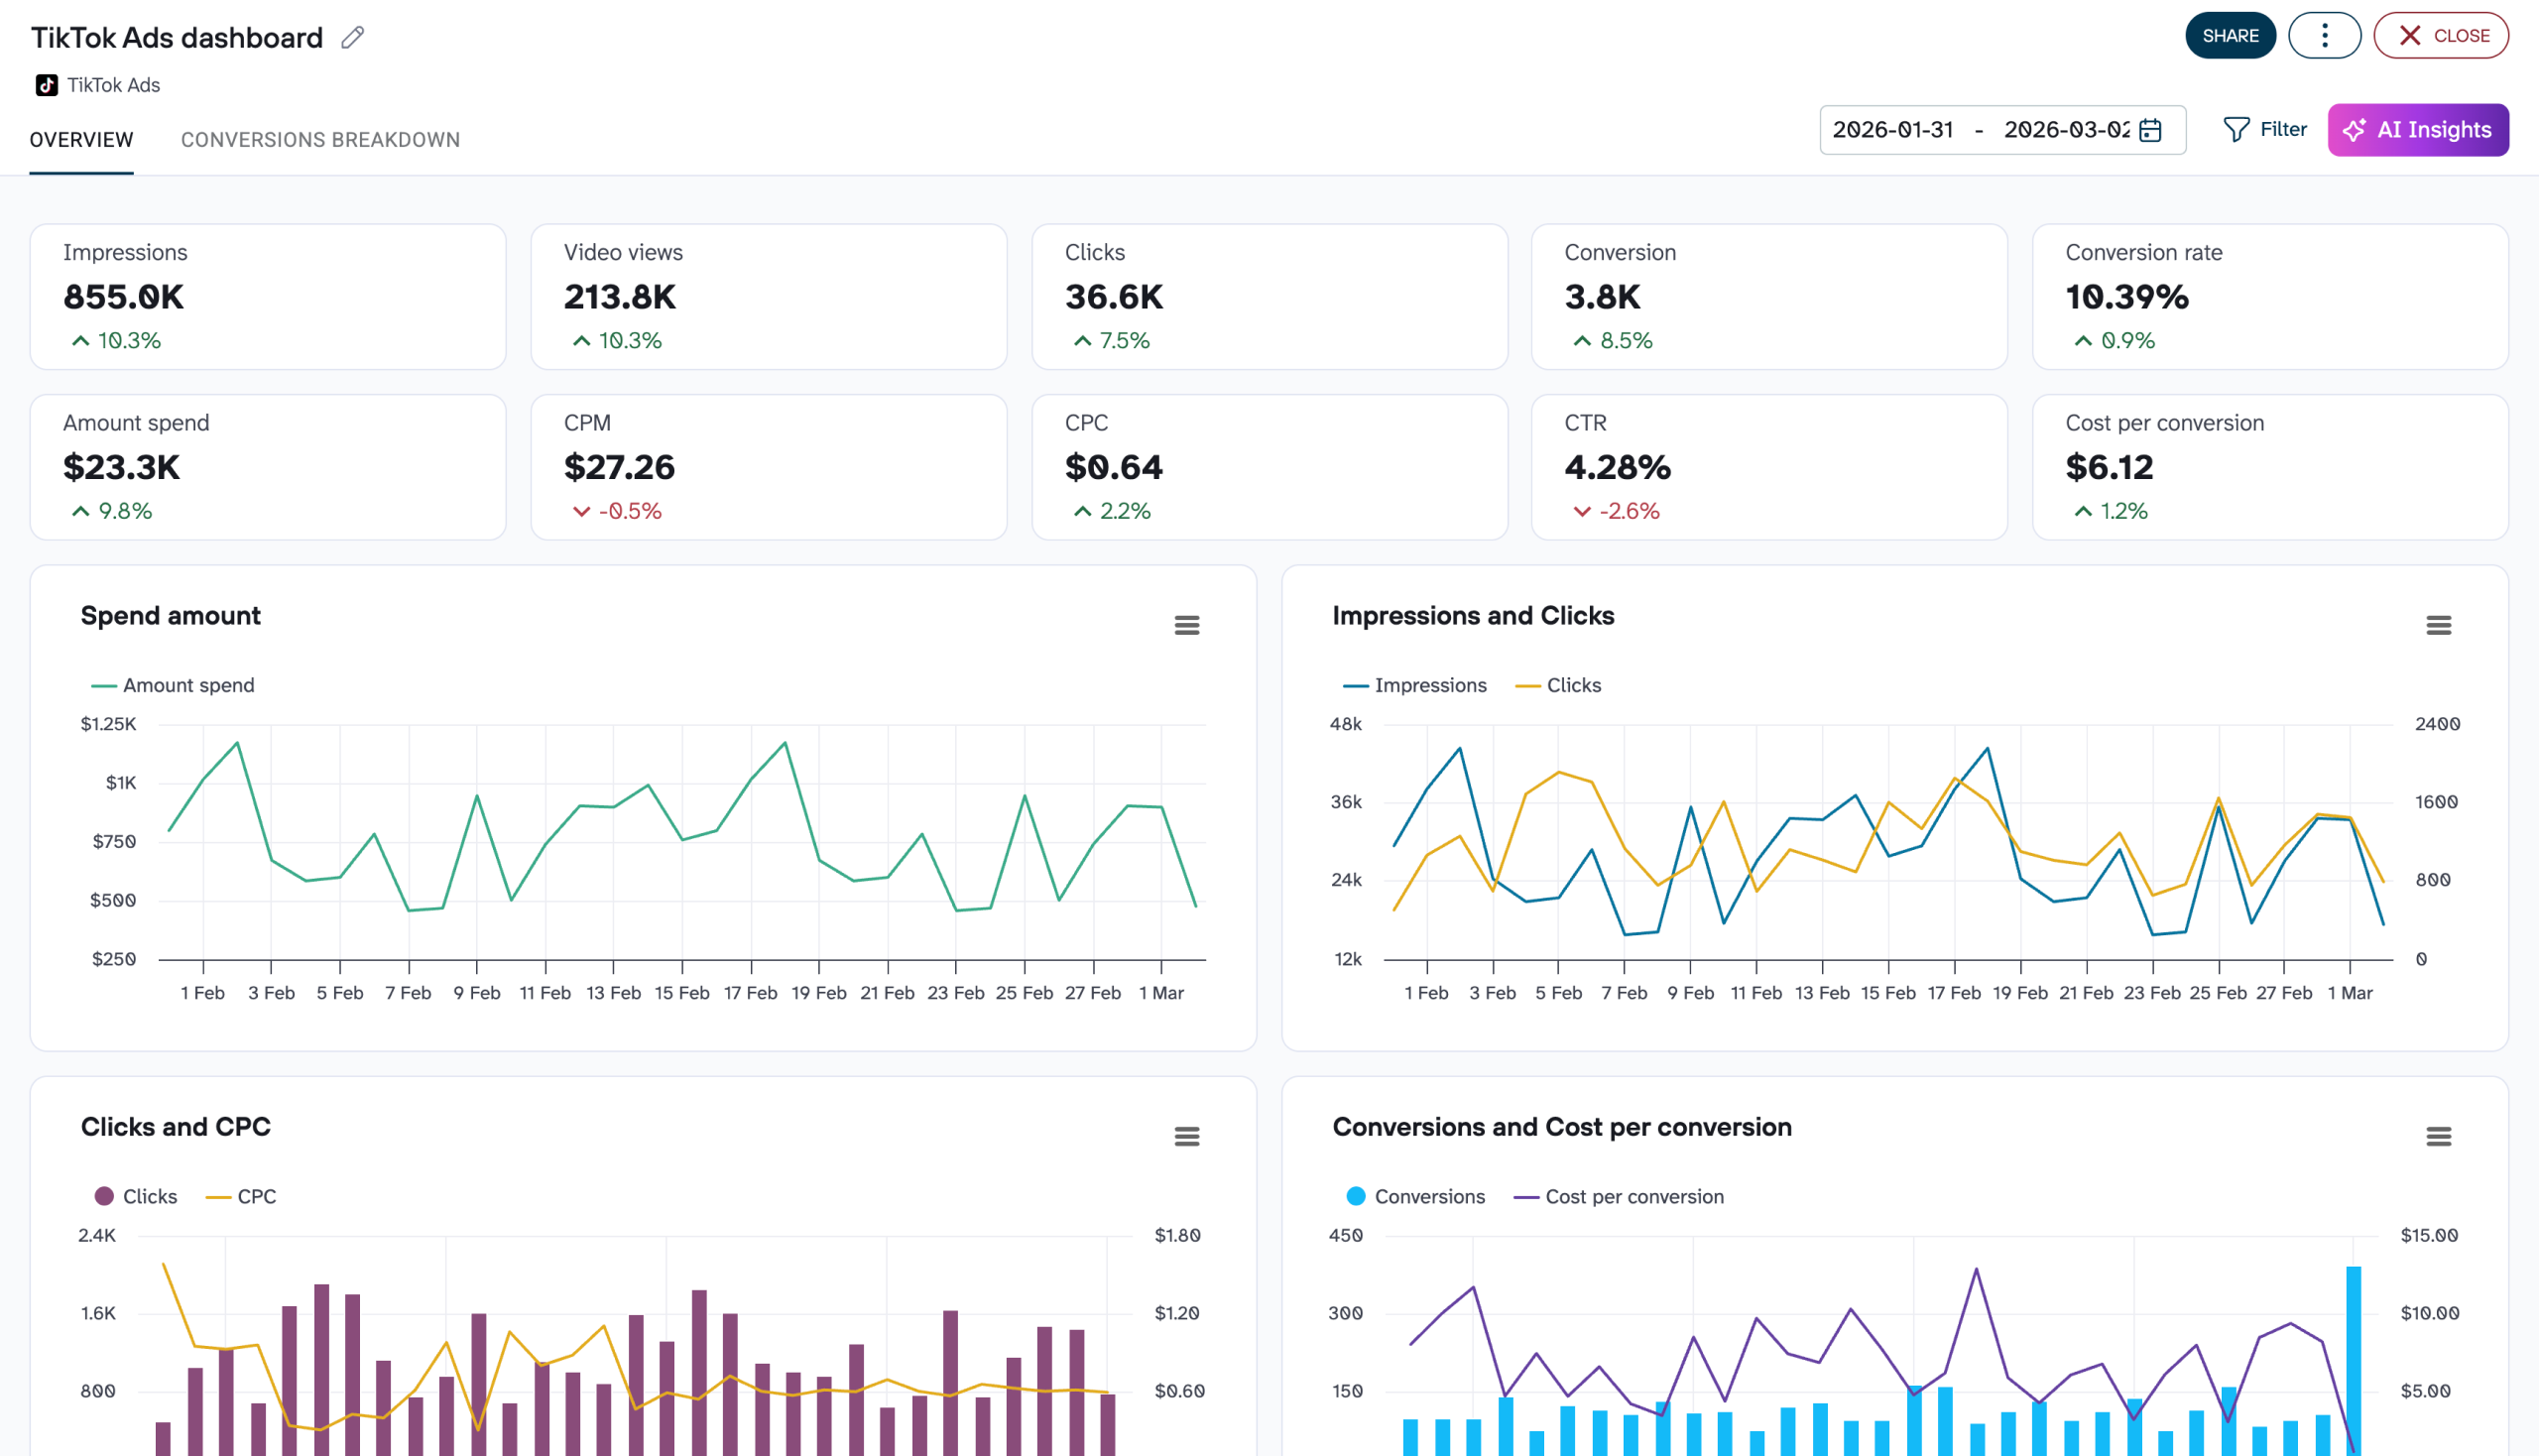
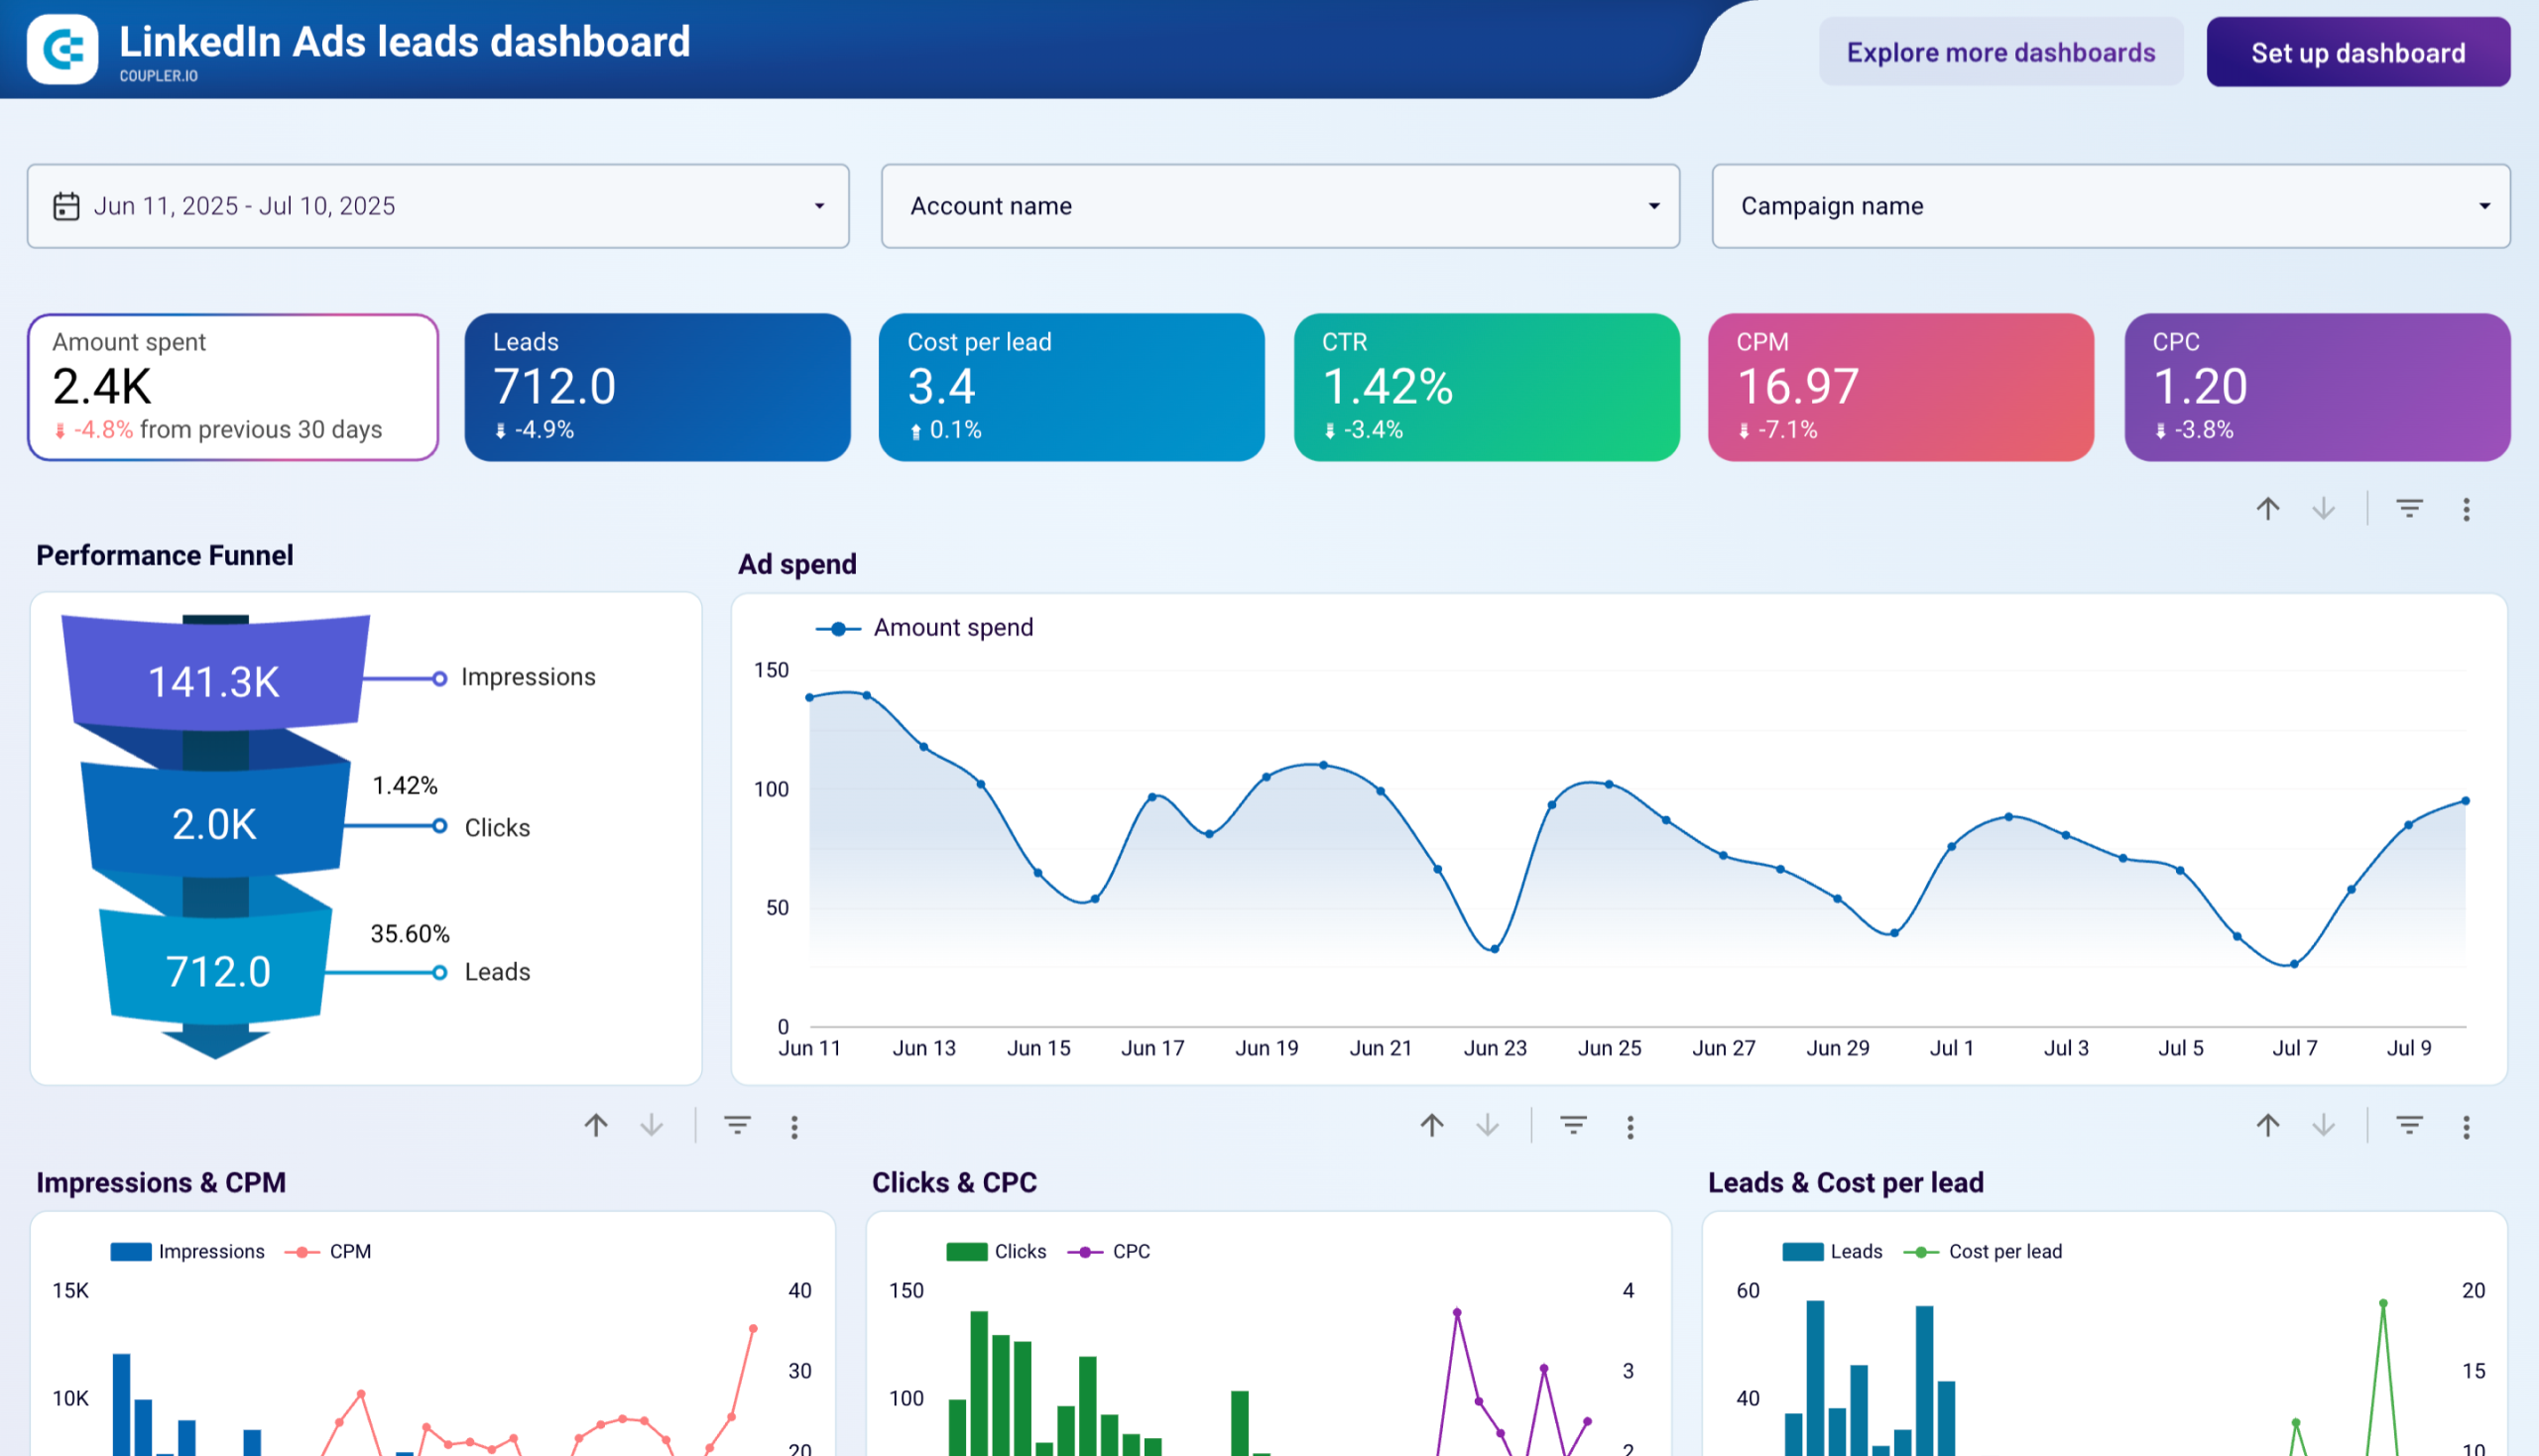
The TikTok analytics dashboard presents a clear visualization of the user journey from initial views through progressive engagement actions. This funnel breaks down how viewers convert from passive consumption to active engagement through likes, shares, and comments. Understanding these conversion rates helps identify where content succeeds in capturing attention and where it fails to motivate deeper engagement. This insight is crucial for optimizing content to encourage higher-value interactions that expand reach through algorithmic promotion.
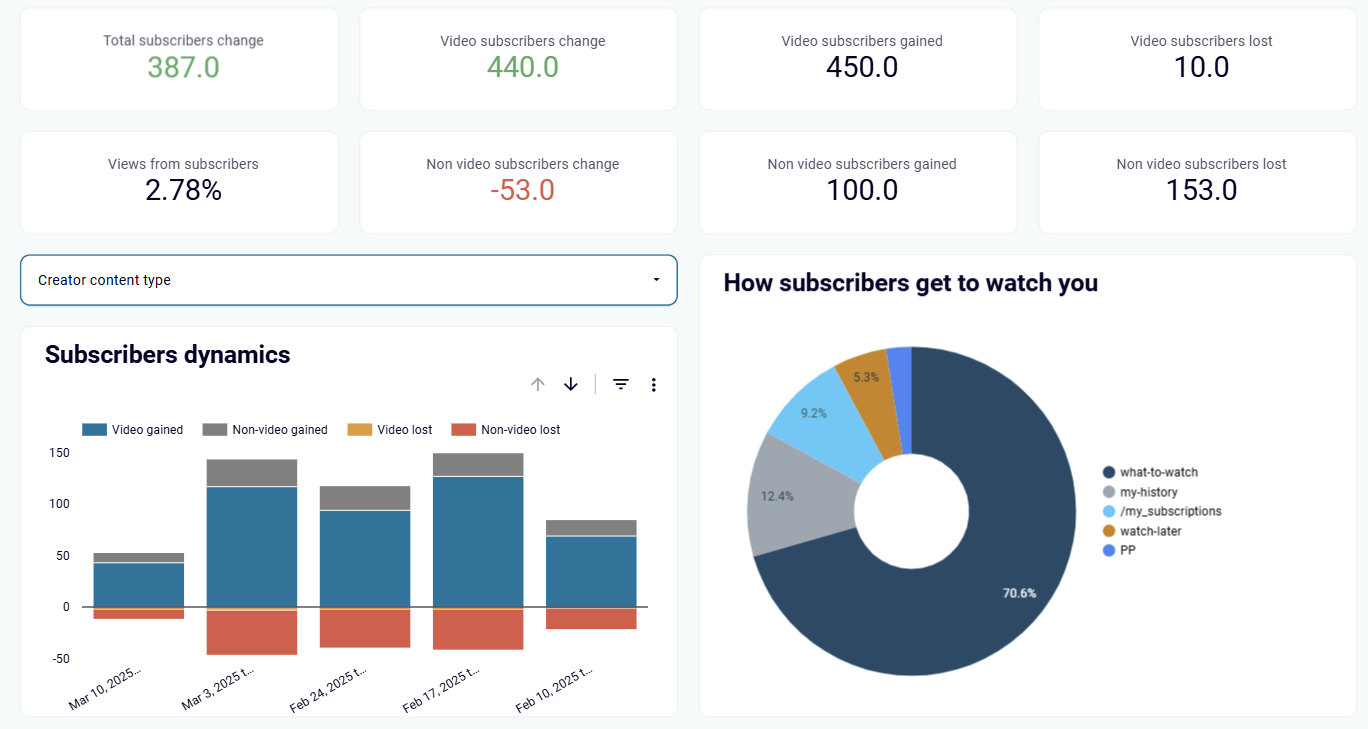
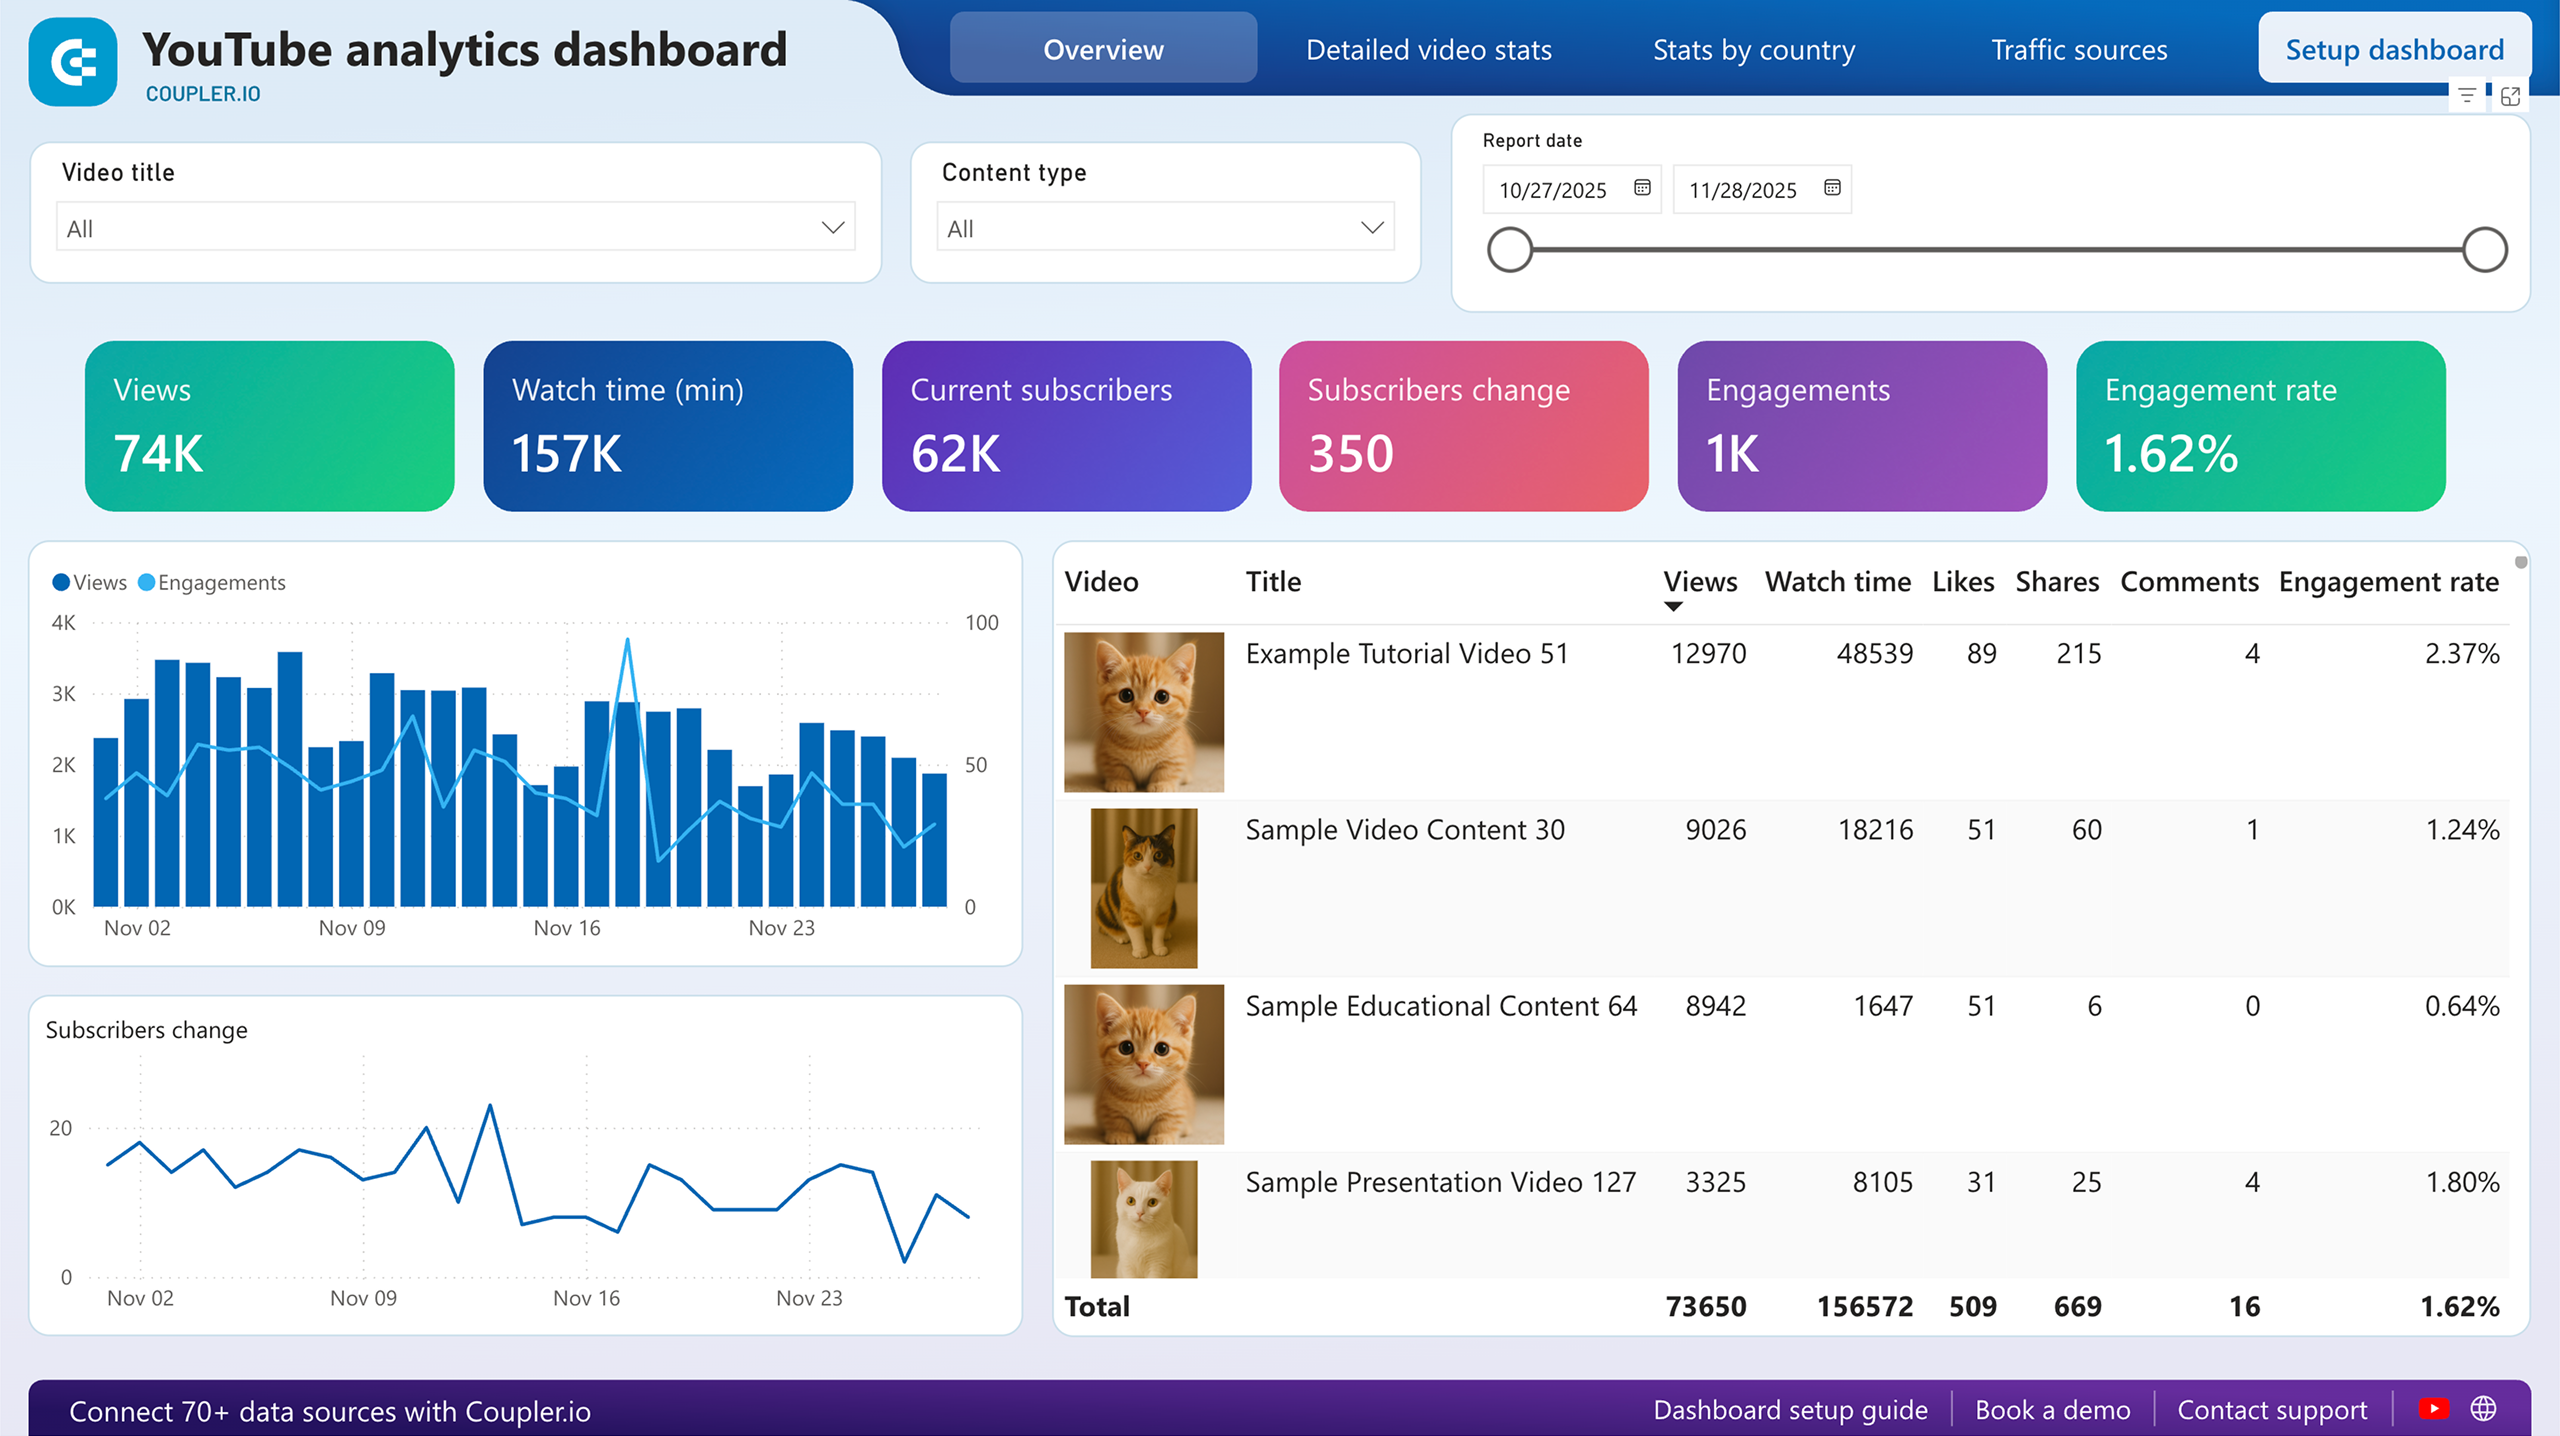
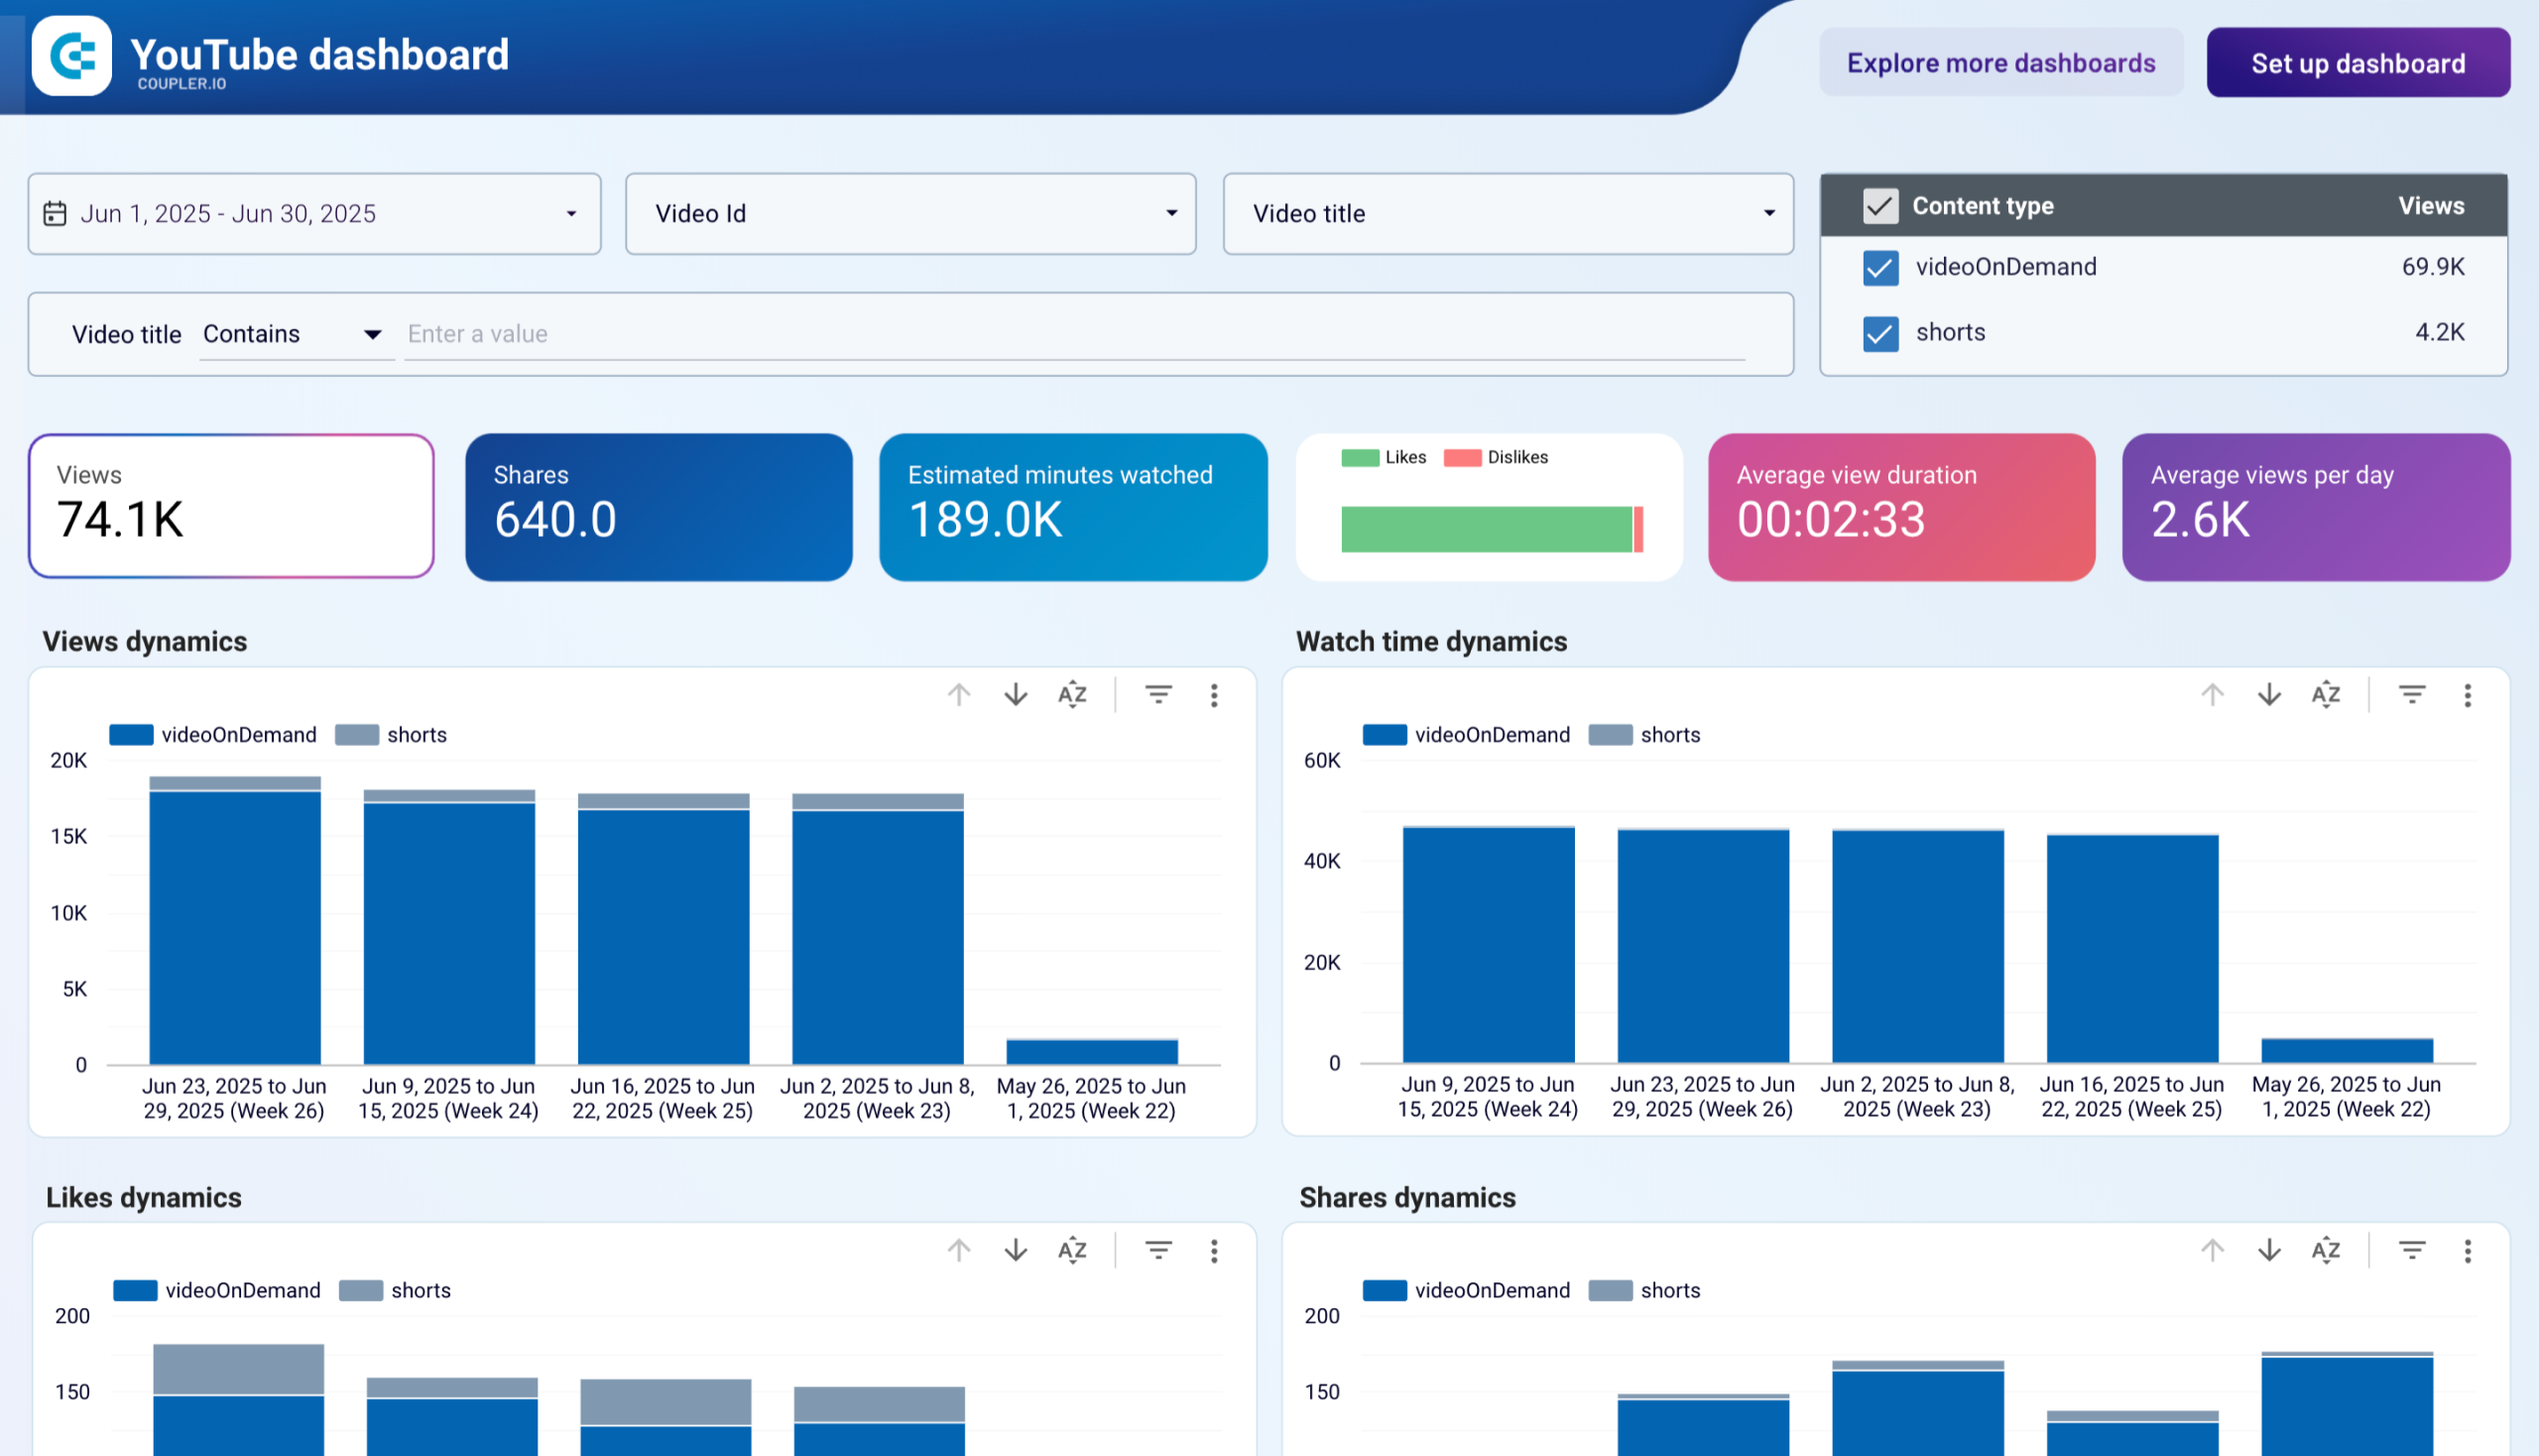
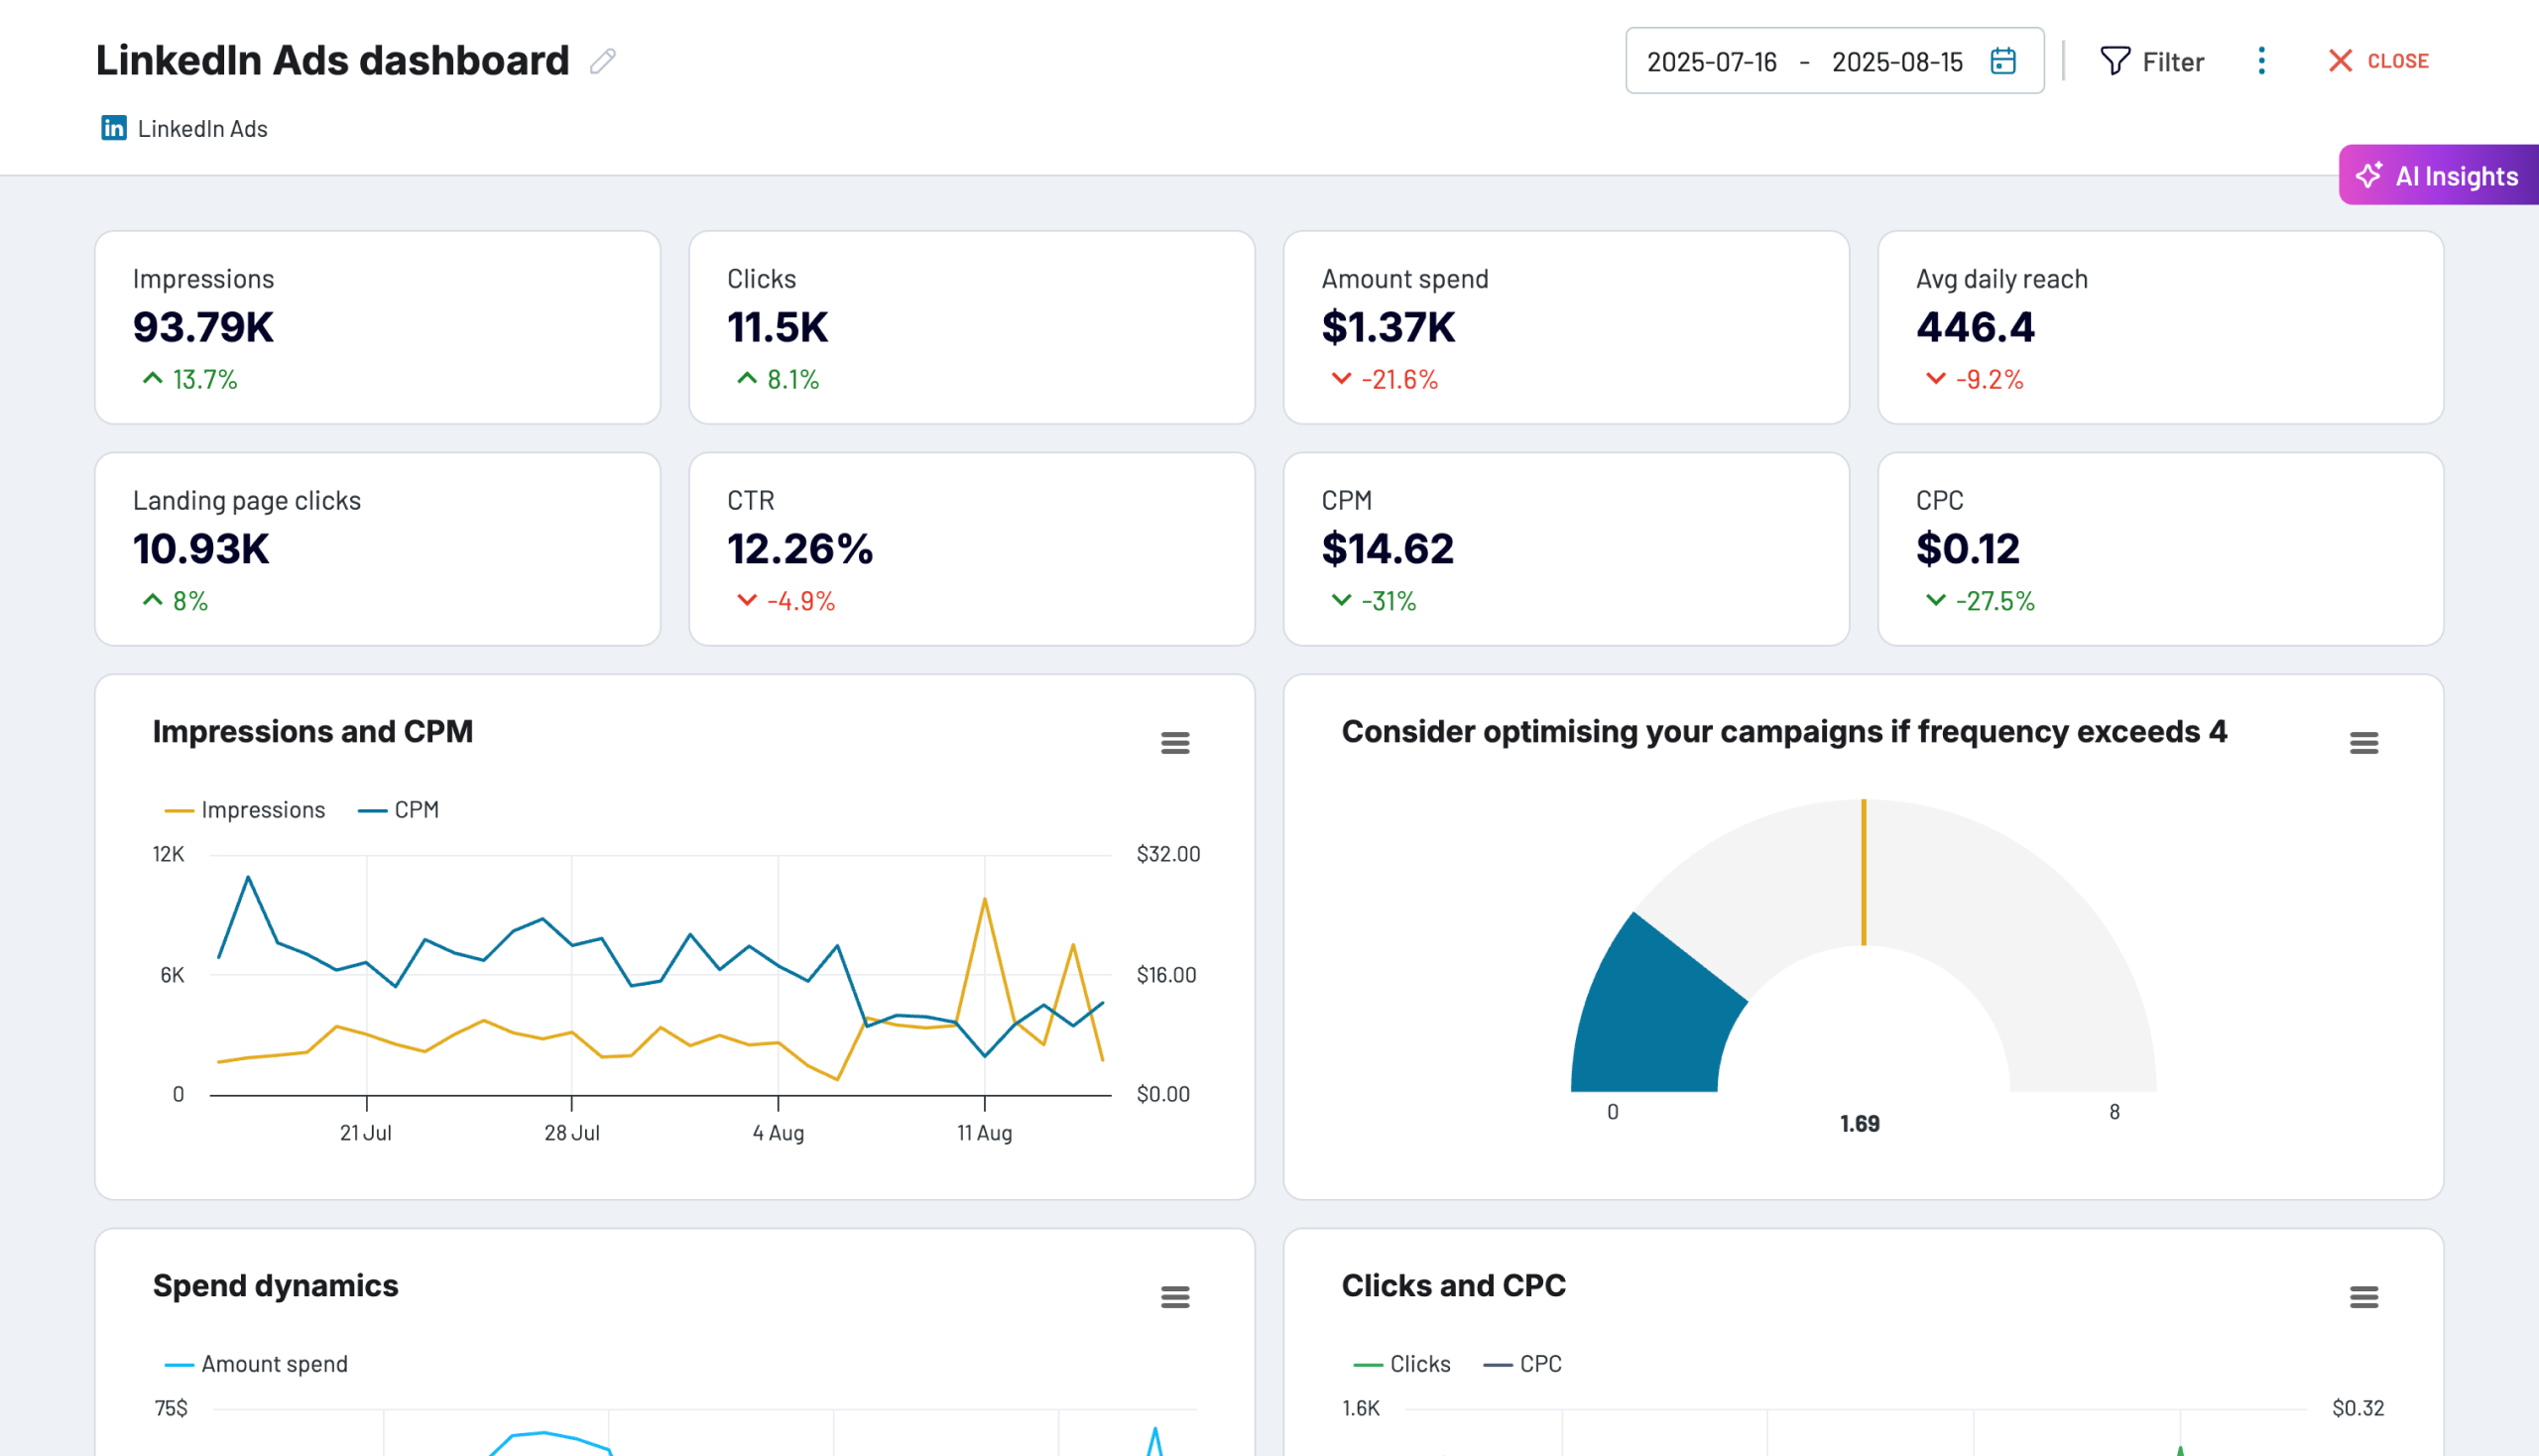
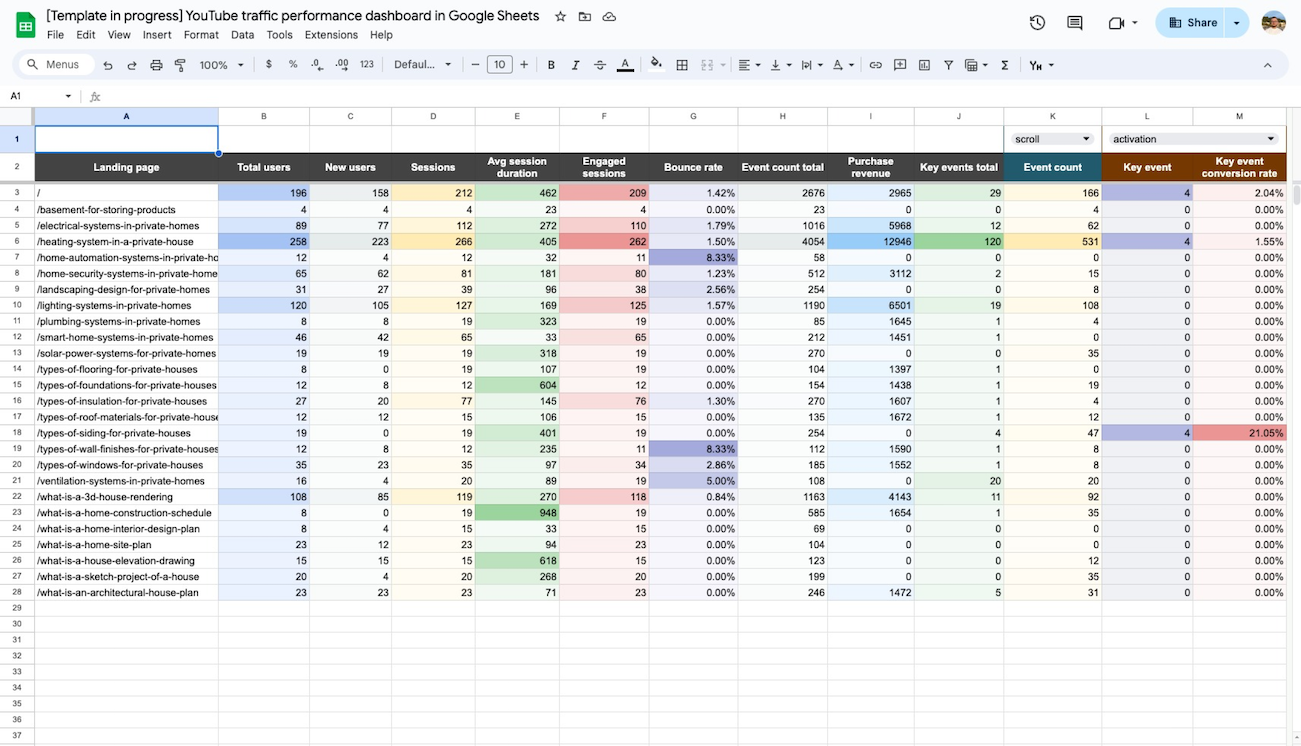
The YouTube dashboard offers a comprehensive breakdown of subscriber changes, including both gains and losses over selected time periods. This visualization shows not just net growth but also which videos drive subscription actions (both positive and negative). By correlating content characteristics with subscriber behavior, creators can identify what content types attract new followers and what might be causing viewers to unsubscribe. This intelligence is essential for sustainable channel growth and audience retention strategies.
How to create social media dashboards?

Metrics you can track with the social media dashboard template
Request custom dashboard
From building custom dashboards to setting up data analytics from scratch, we're here to help you succeed. Contact us to discuss your case and possible solutions
Contact us