Finance reports that just make sense
Solve finance and accounting challenges from a data-analytics perspective. Coupler.io removes manual copy-paste routine from your daily operations.

Grow your business with data-backed decisions
Manage budgets
Build projections
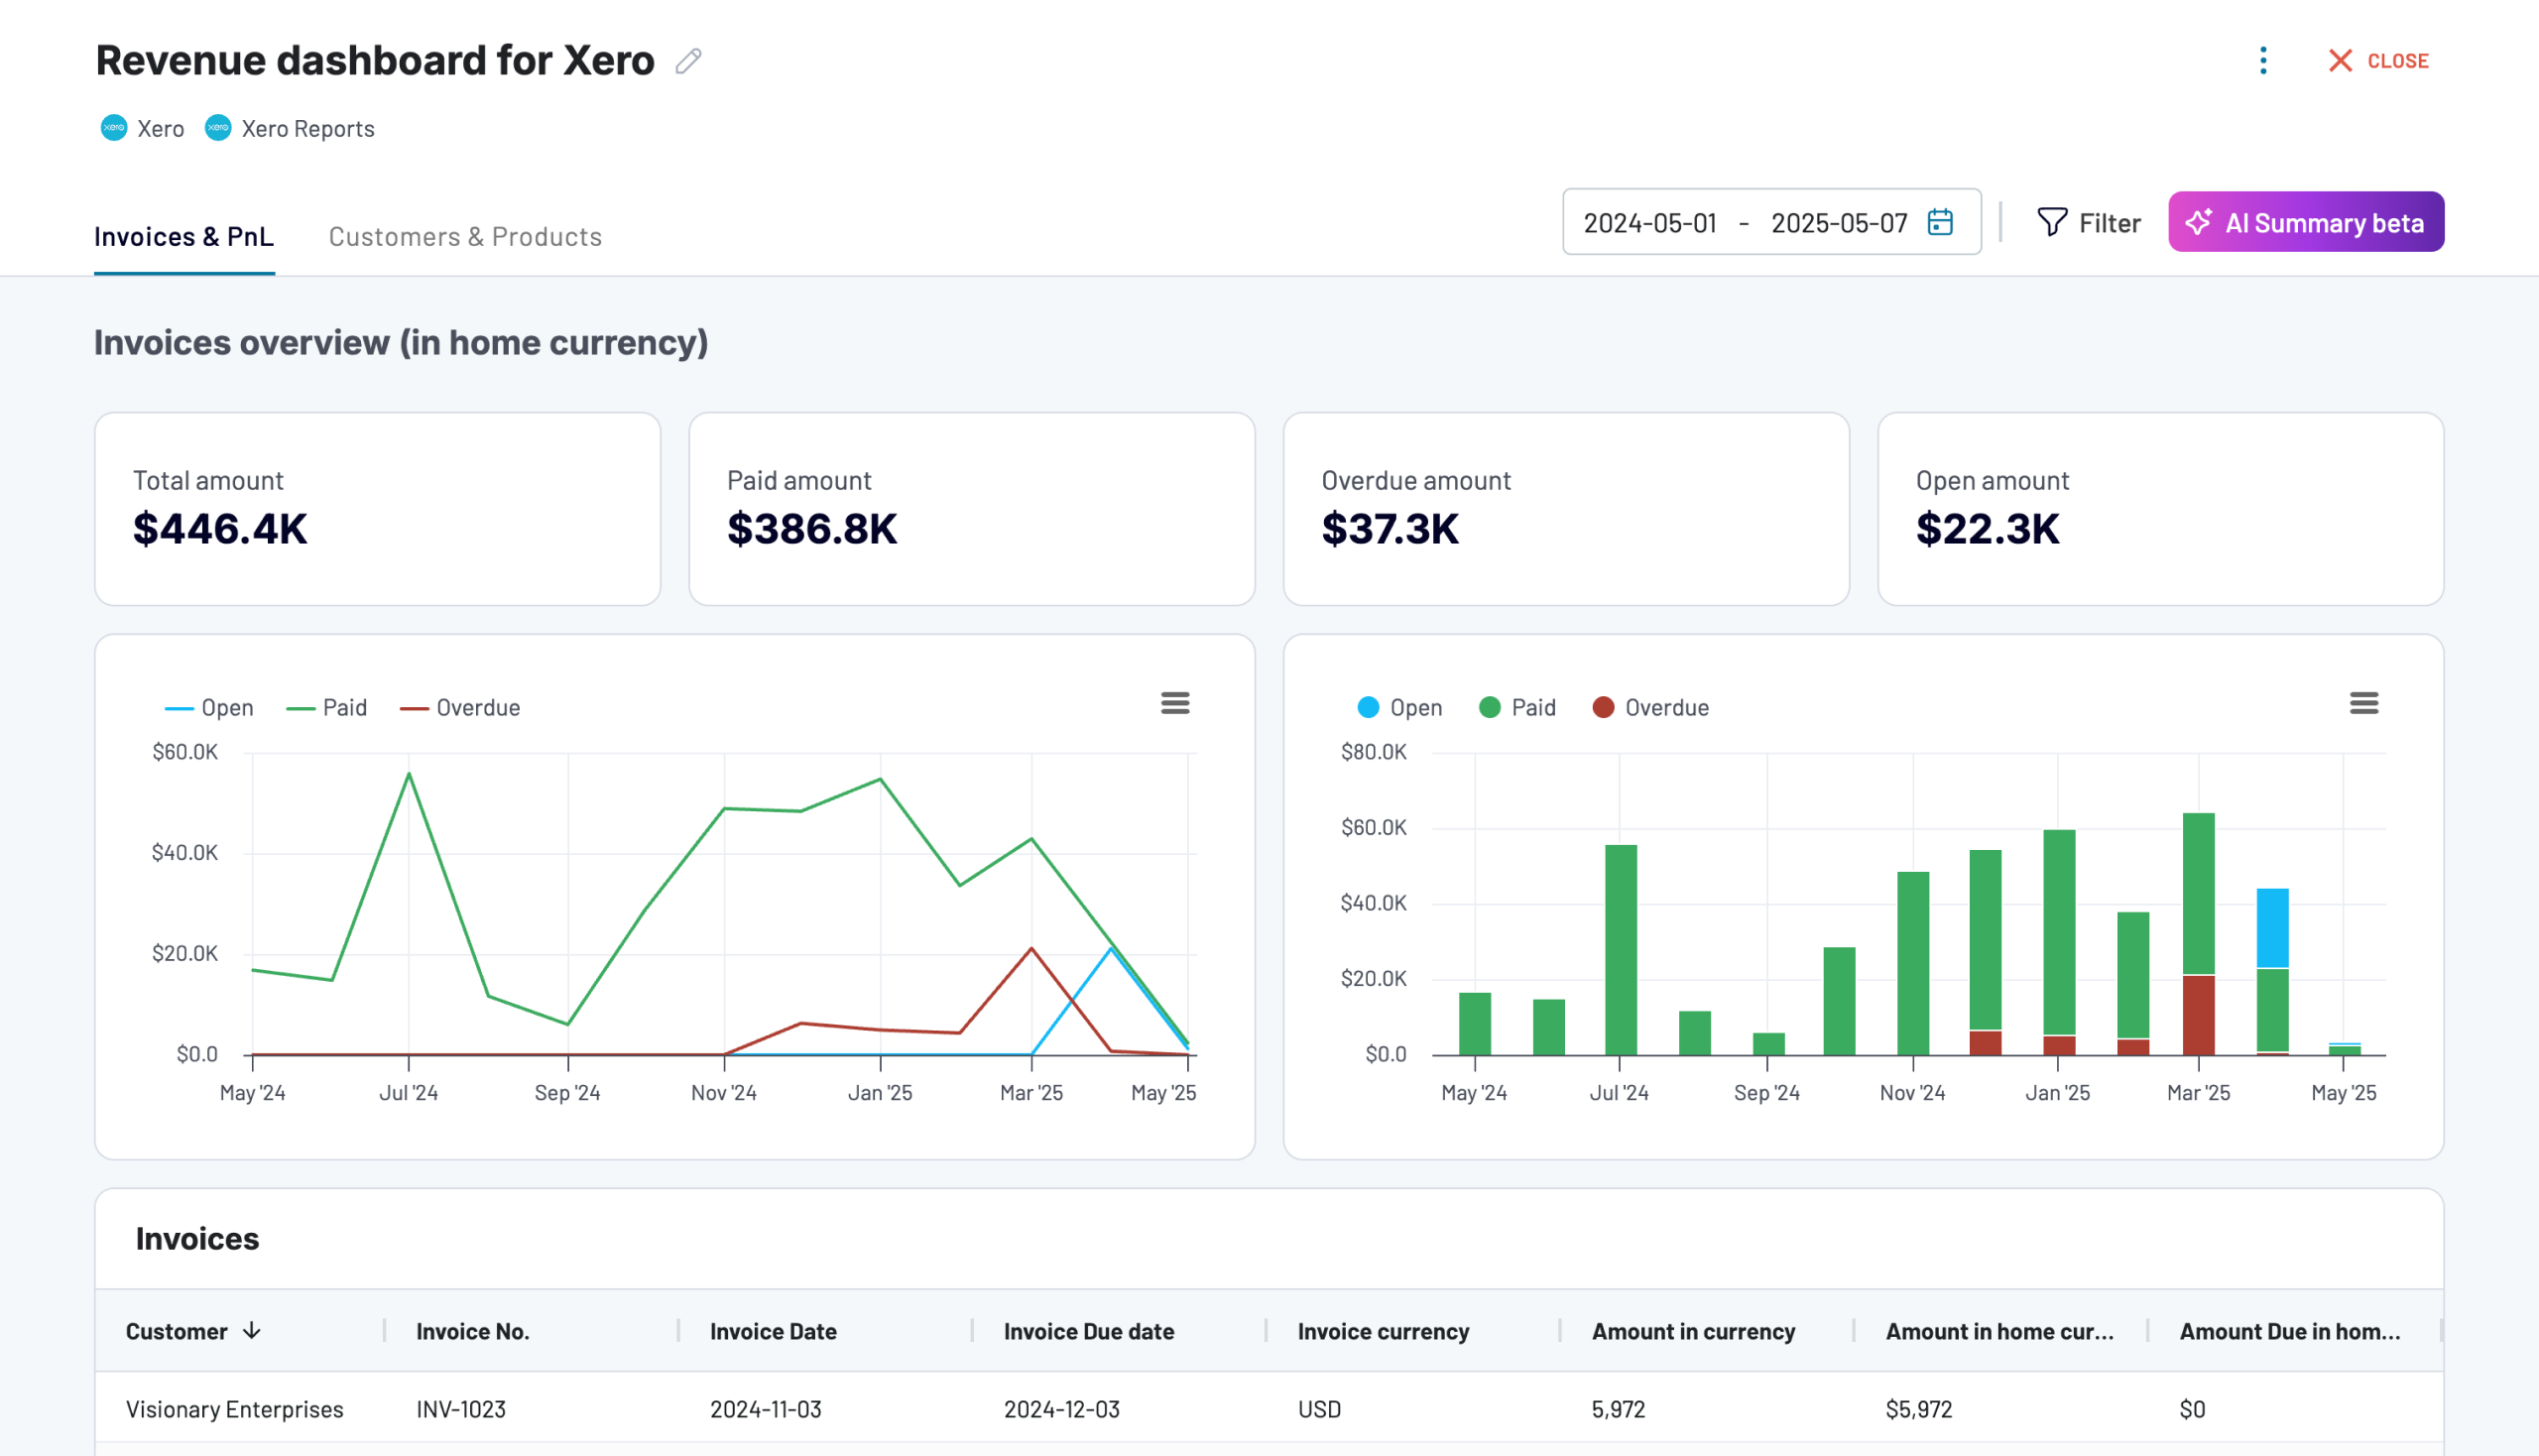
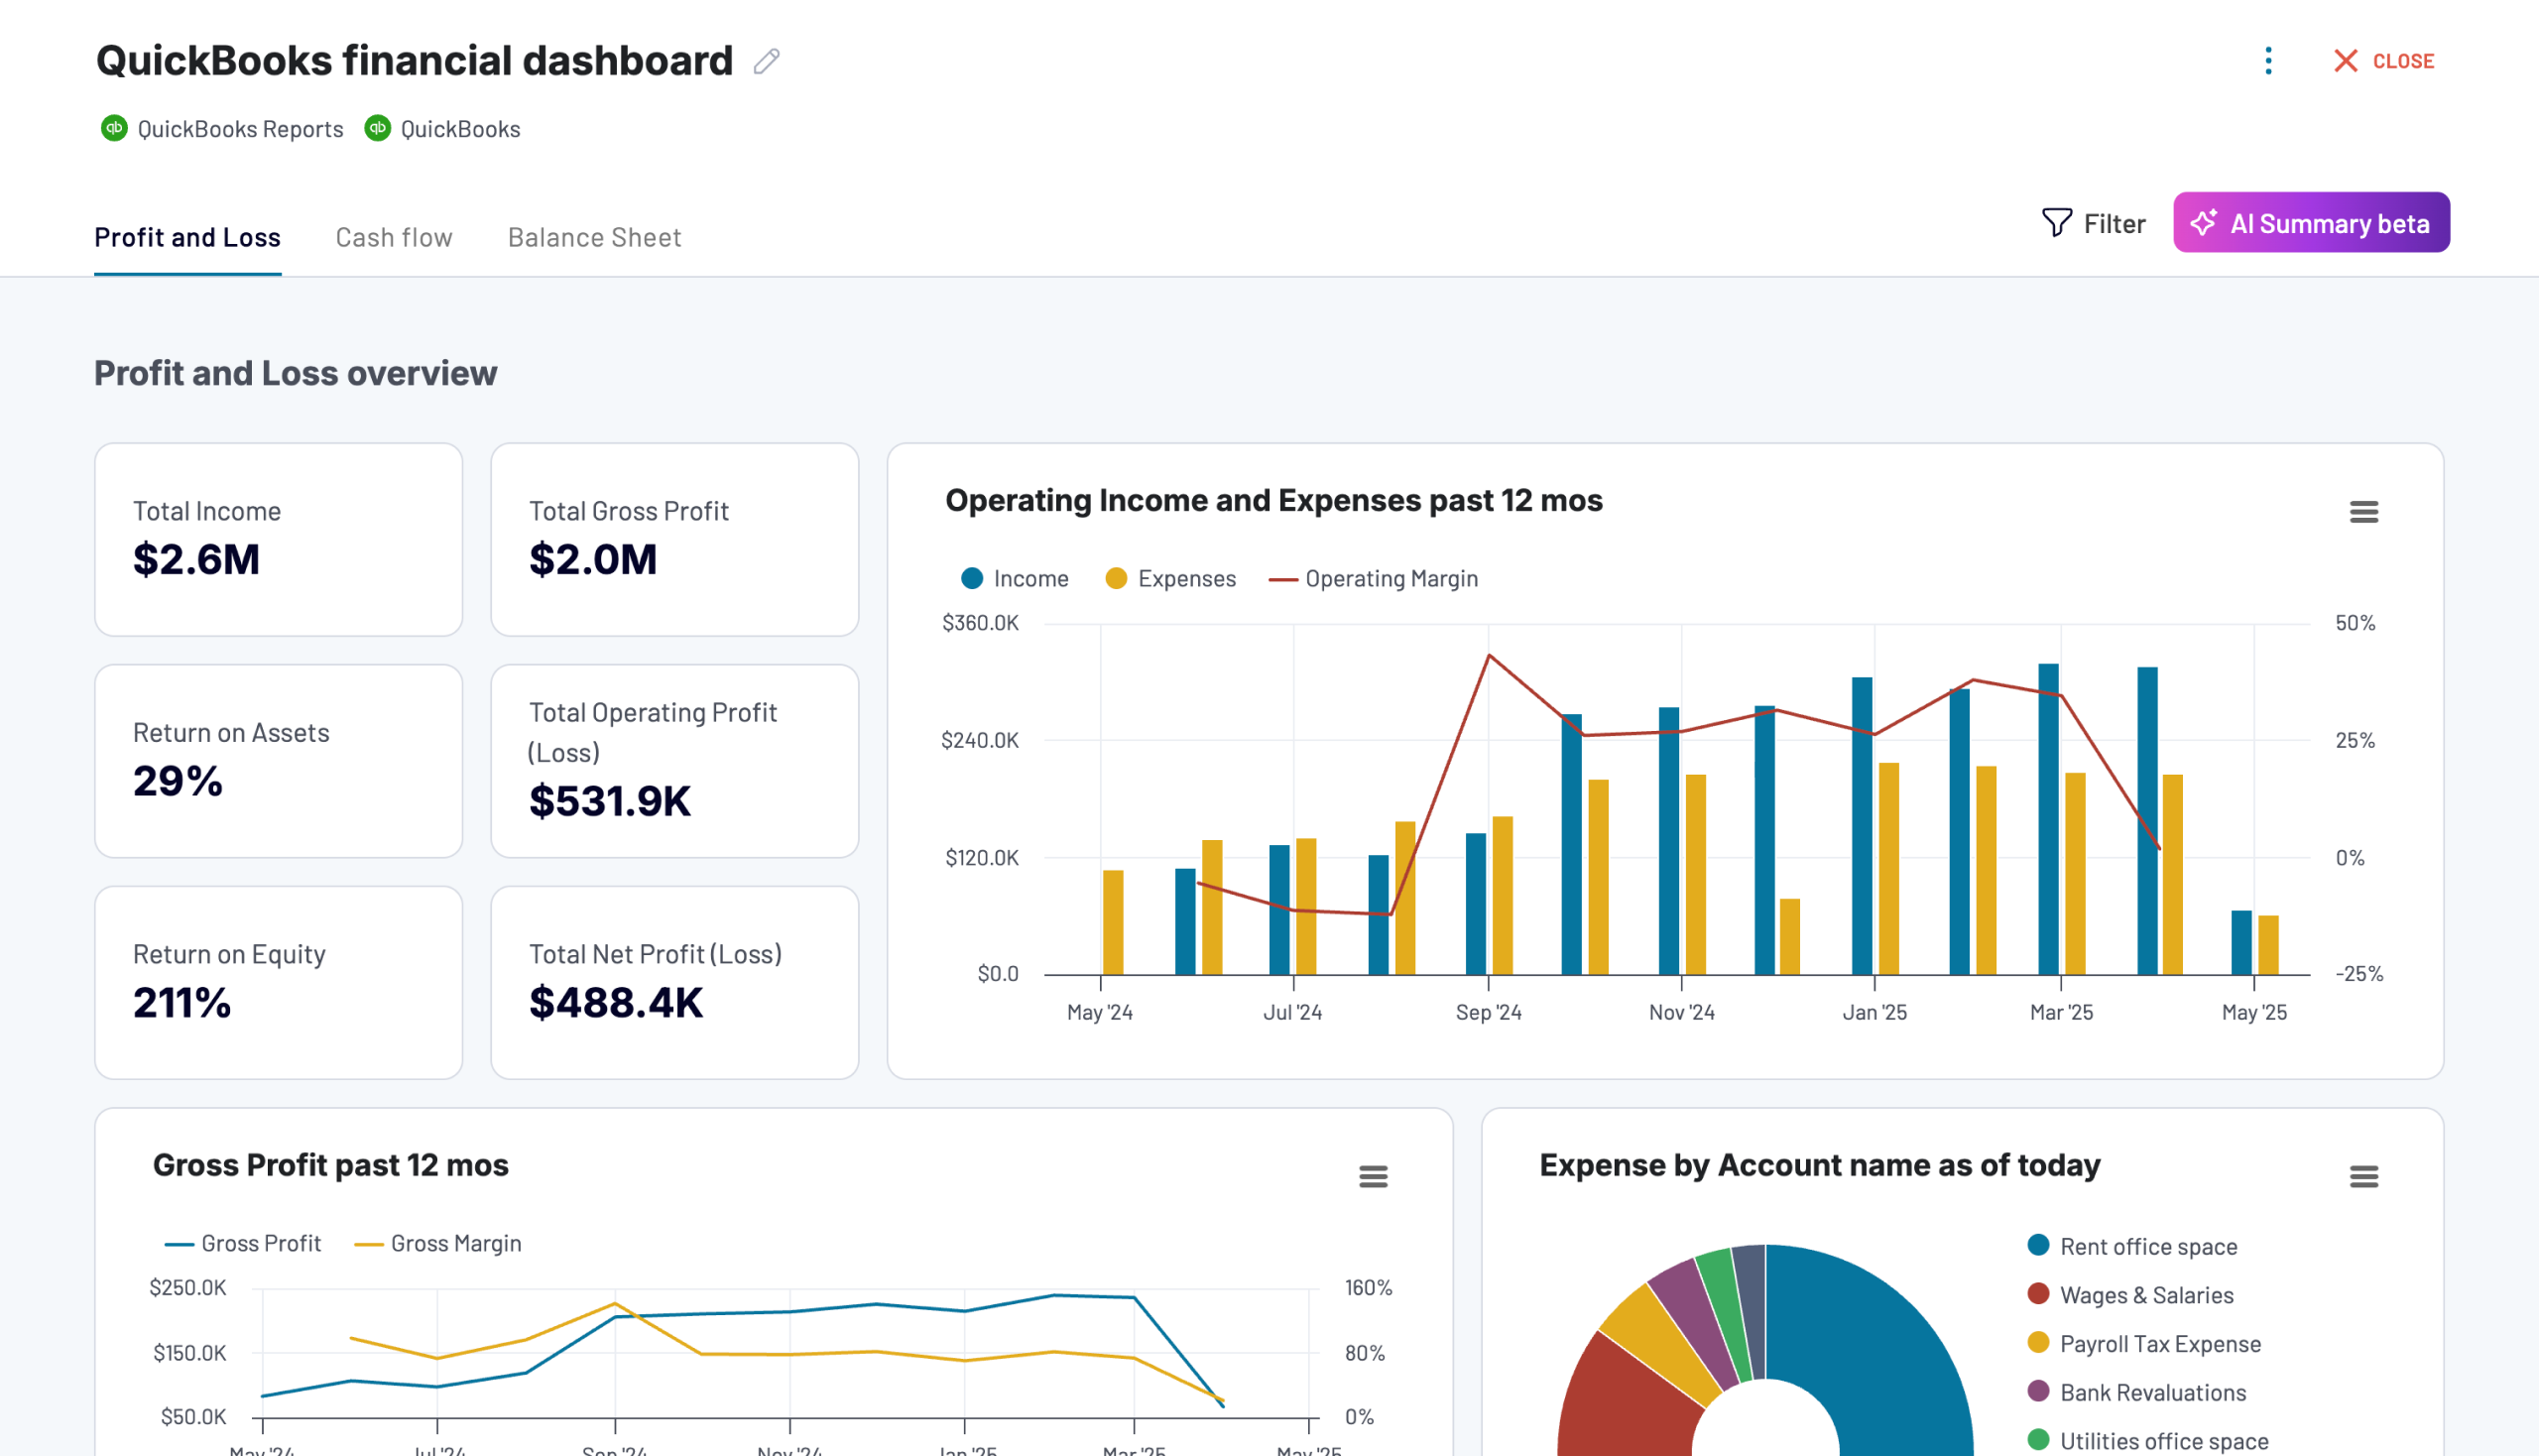
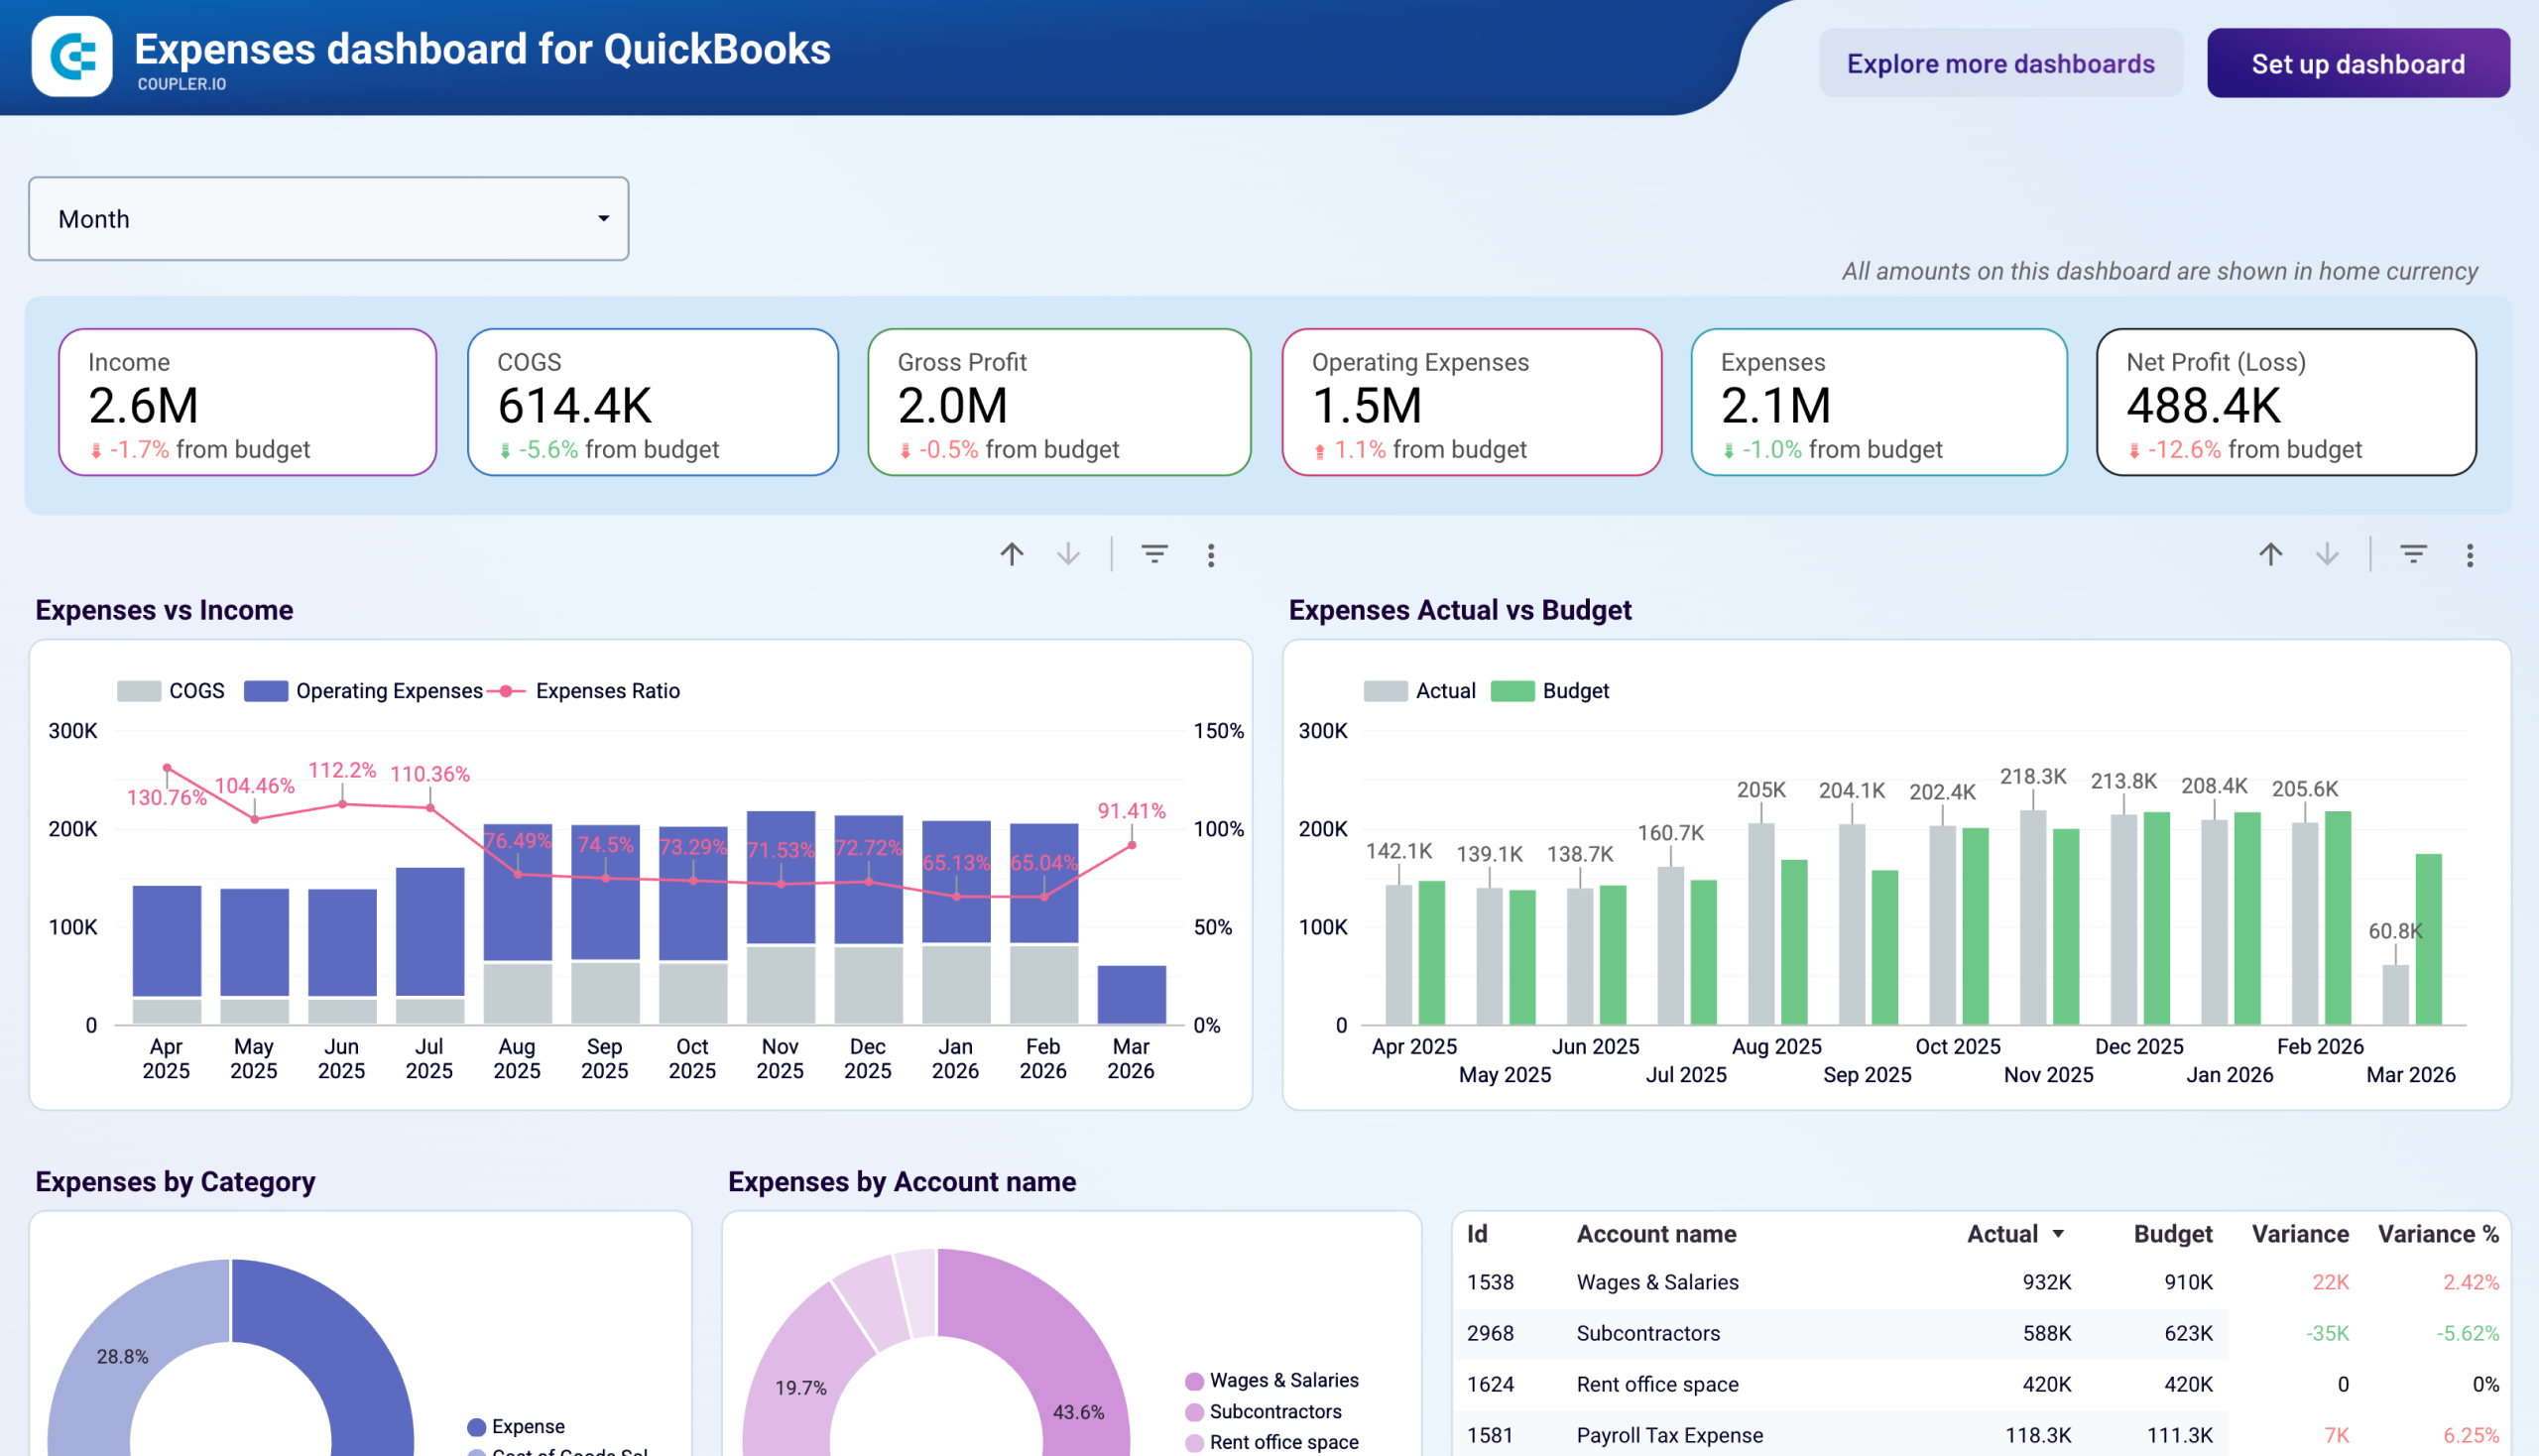
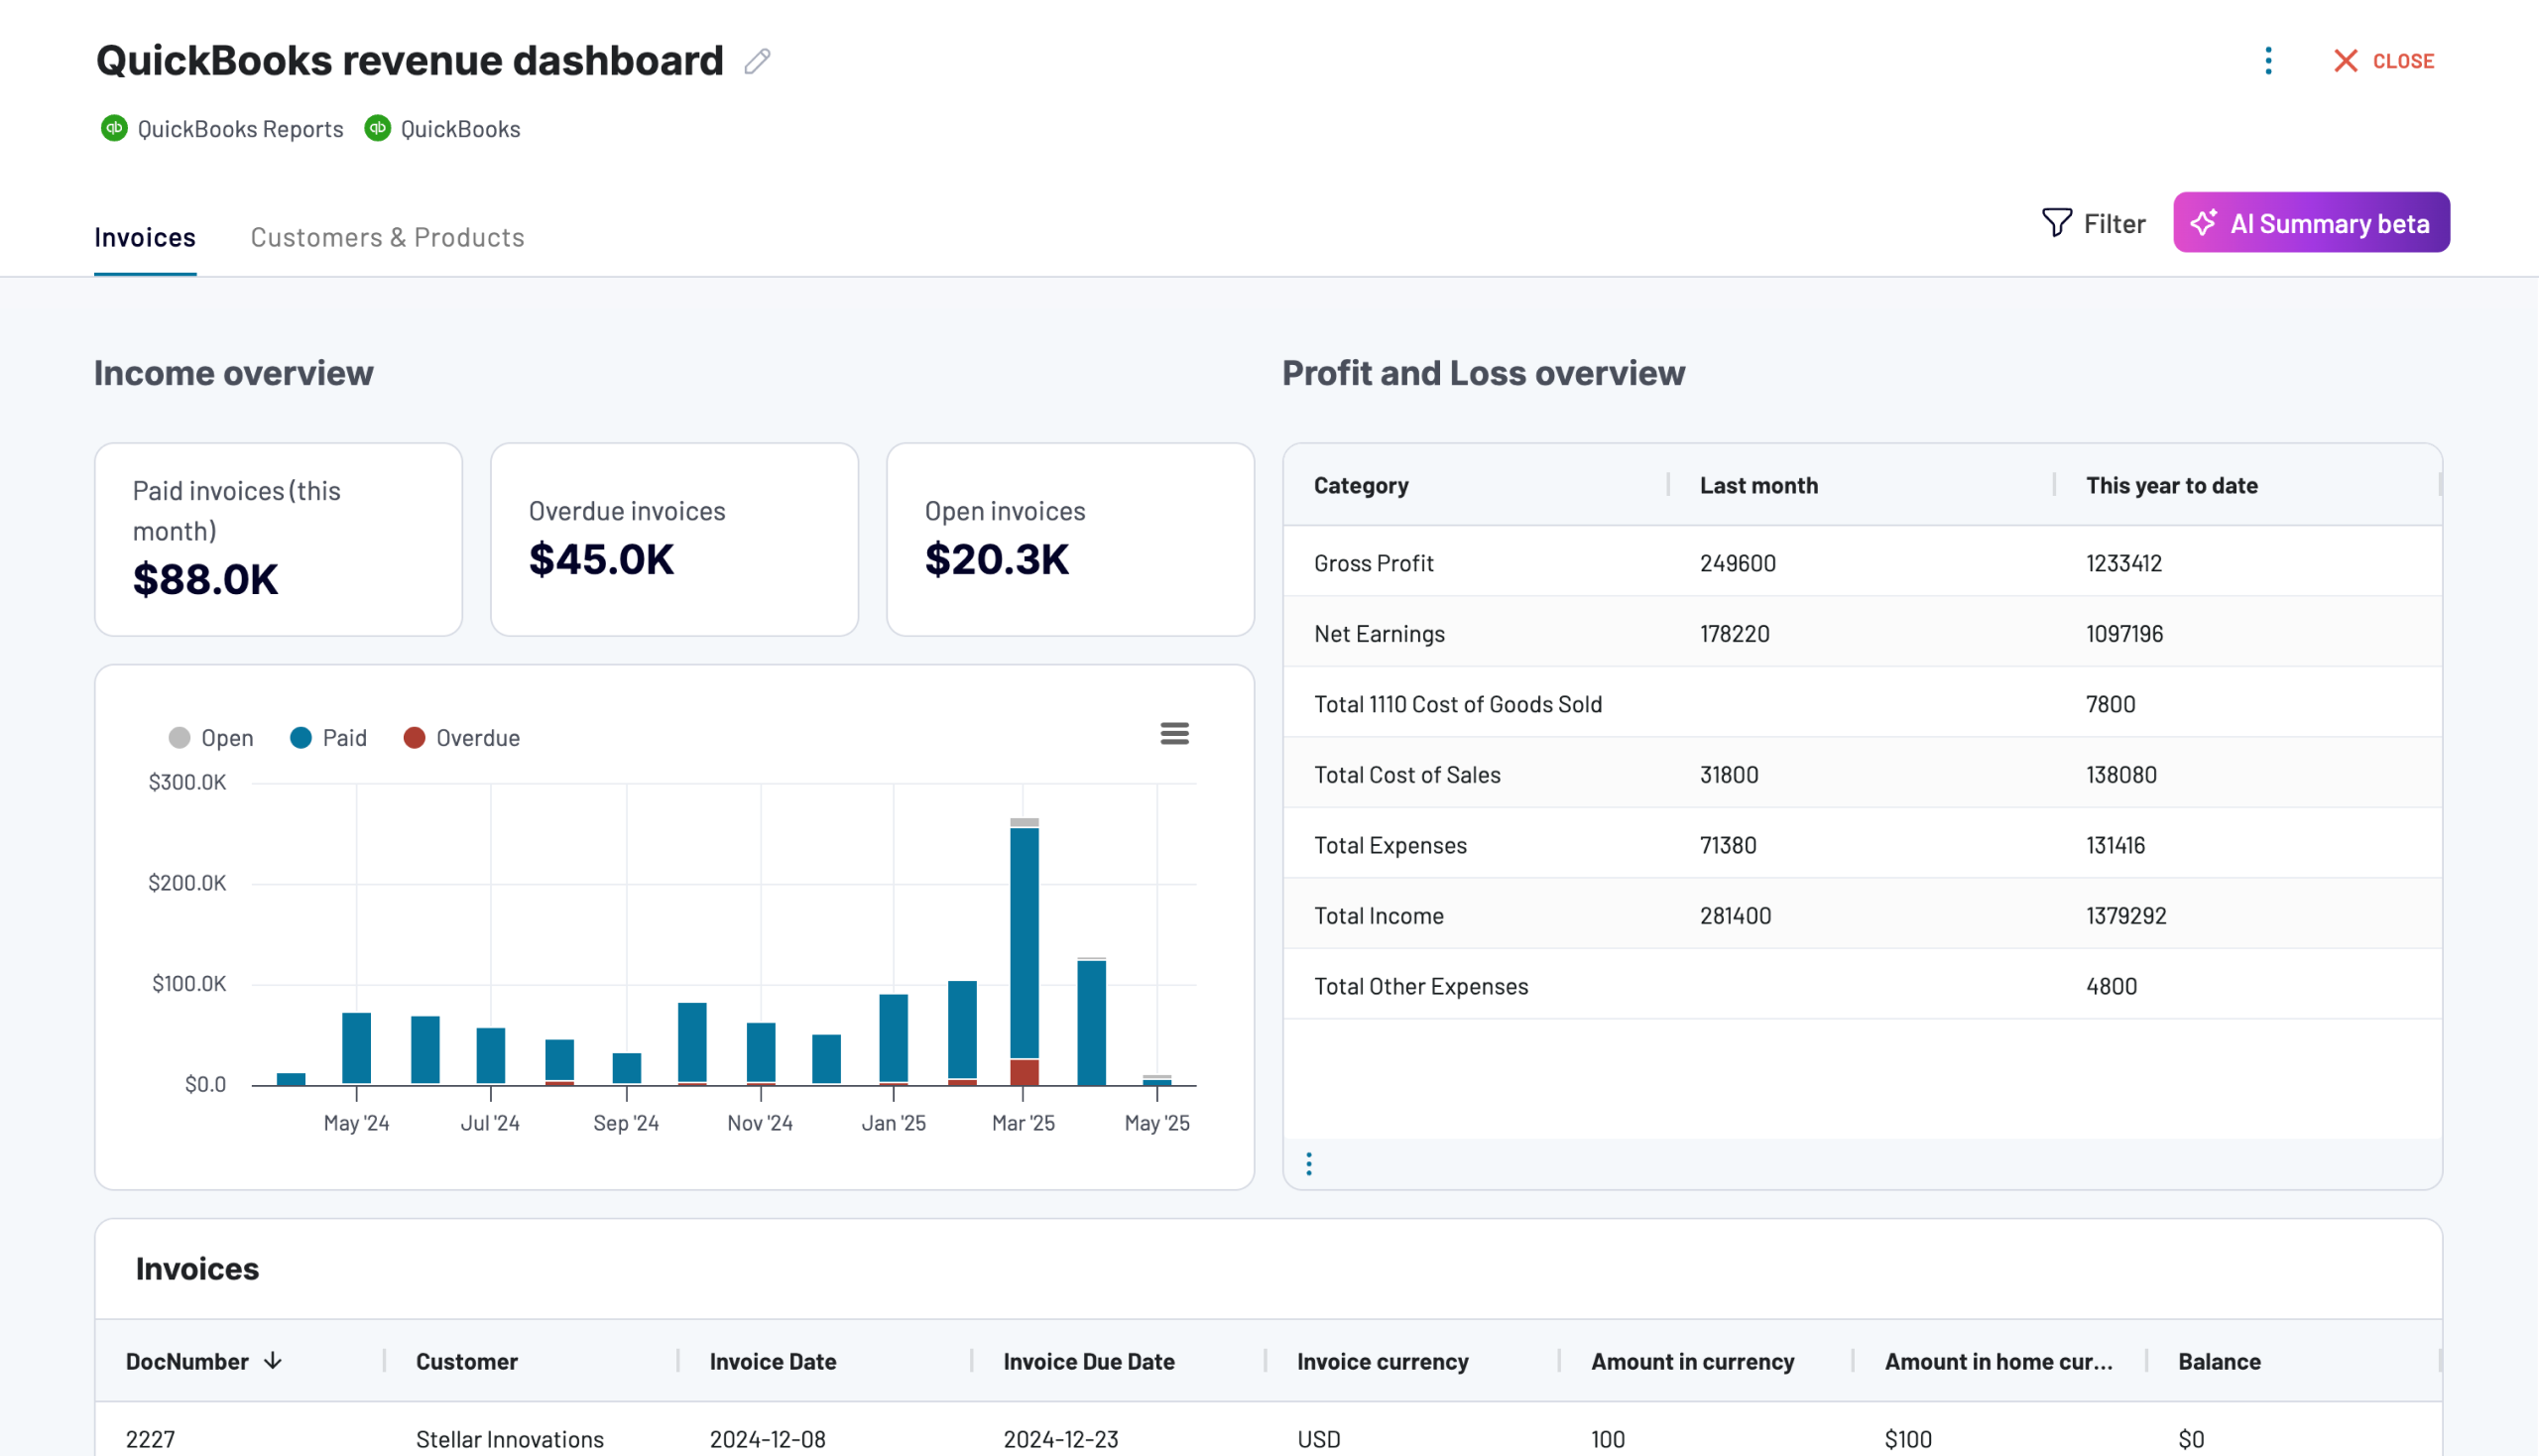
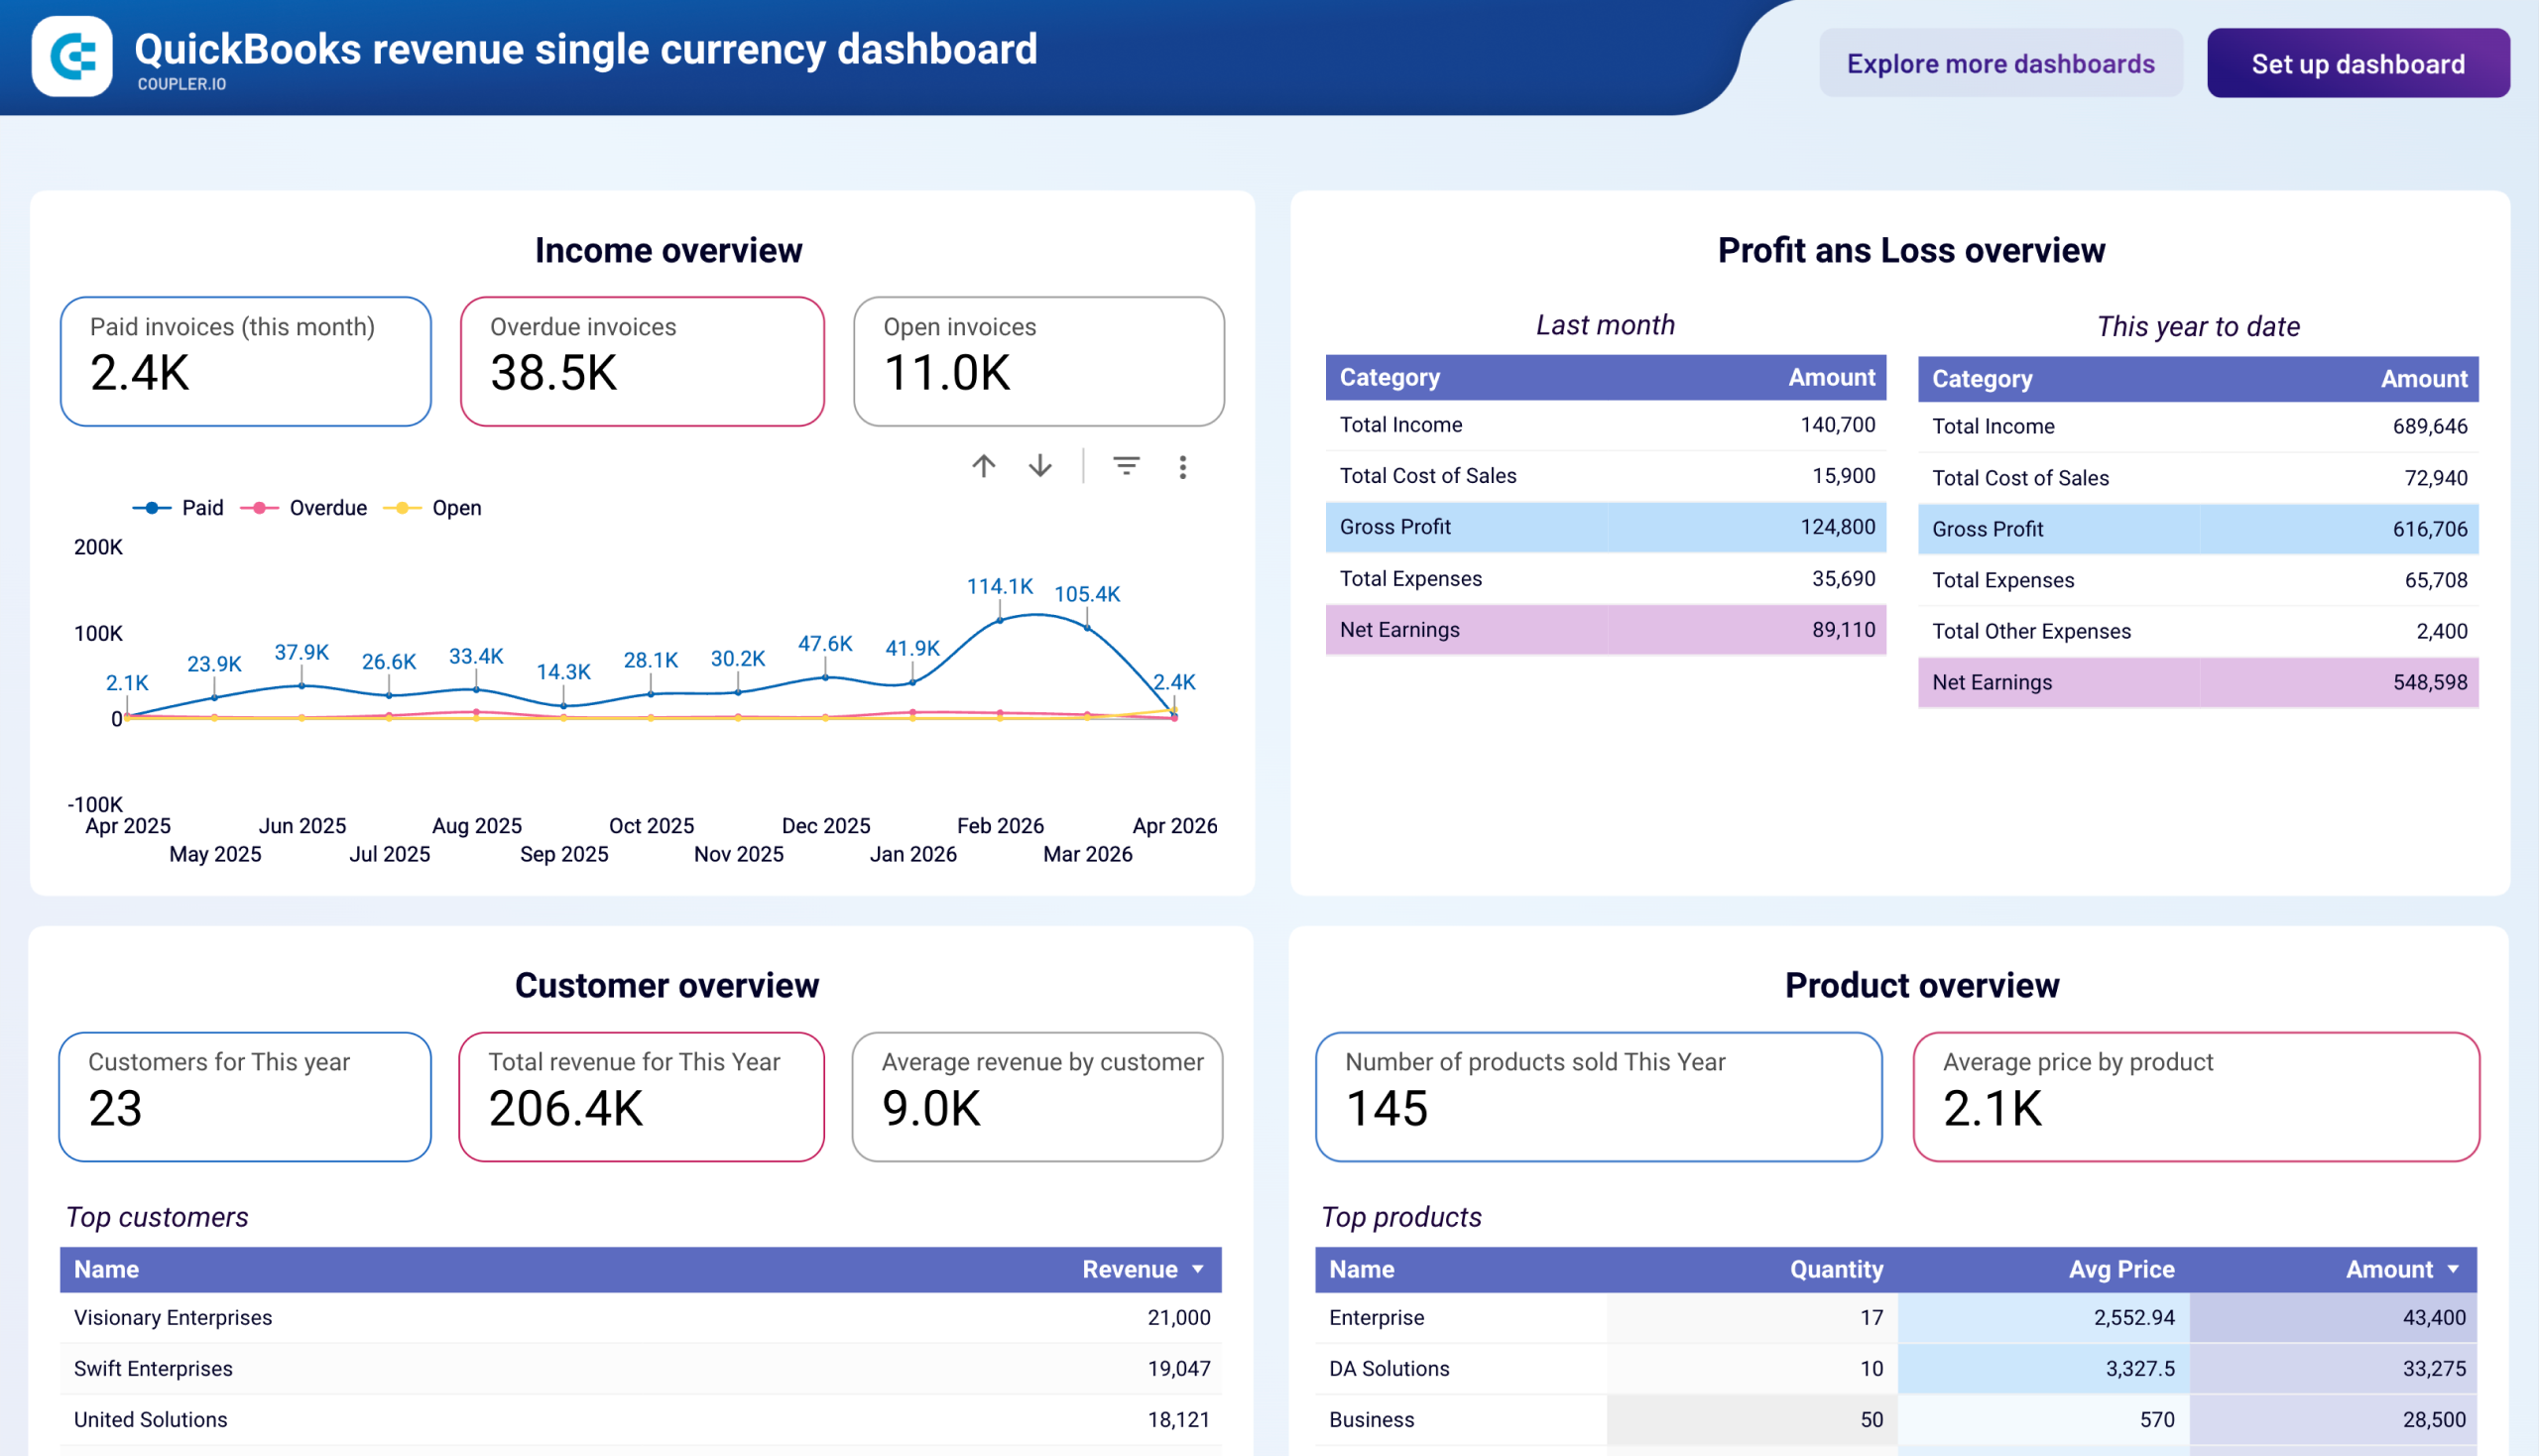
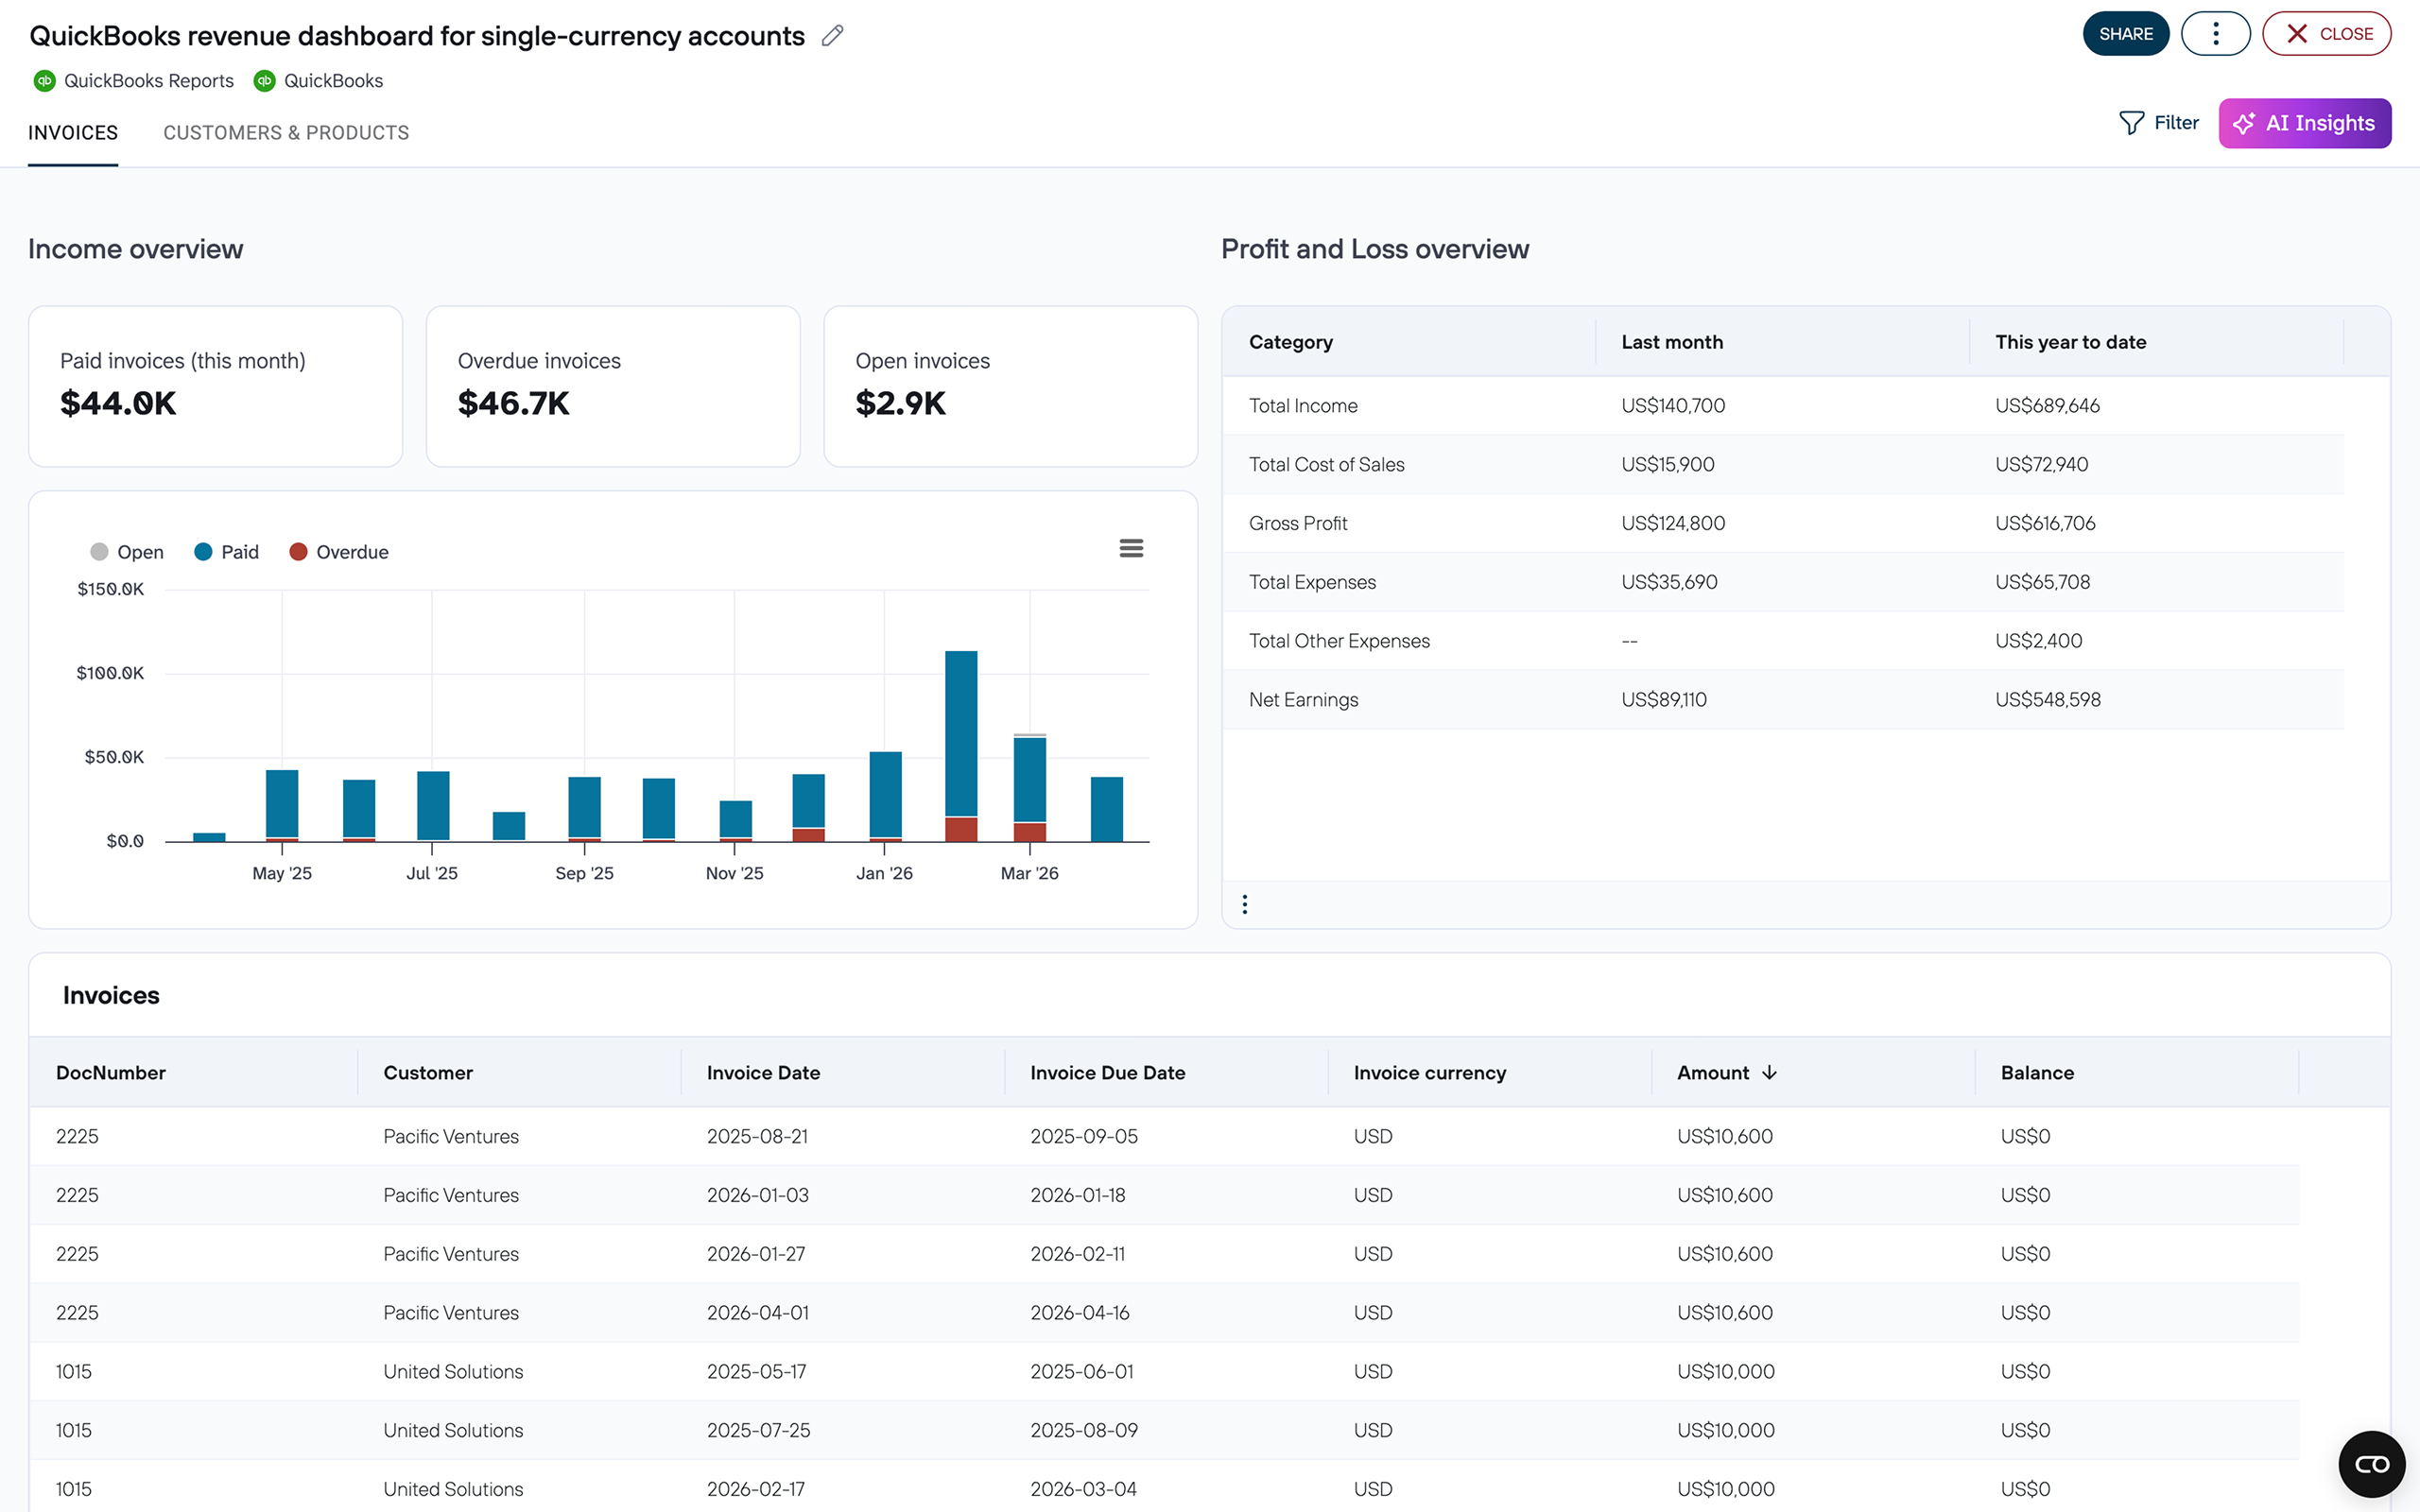
Track P&L
Impress your clients
Standardise procedures
Increase accuracy
Your collegues will think you’re a genius!
It was a win-win for everyone. Our clients were thrilled to have their numbers at their fingertips, any time of day or night, without having to consult QuickBooks or their bookkeeper. Our company freed up plenty of resources, improved the customer lifetime value, and found a way to stand out among other competing services.

Connect your data sources in minutes


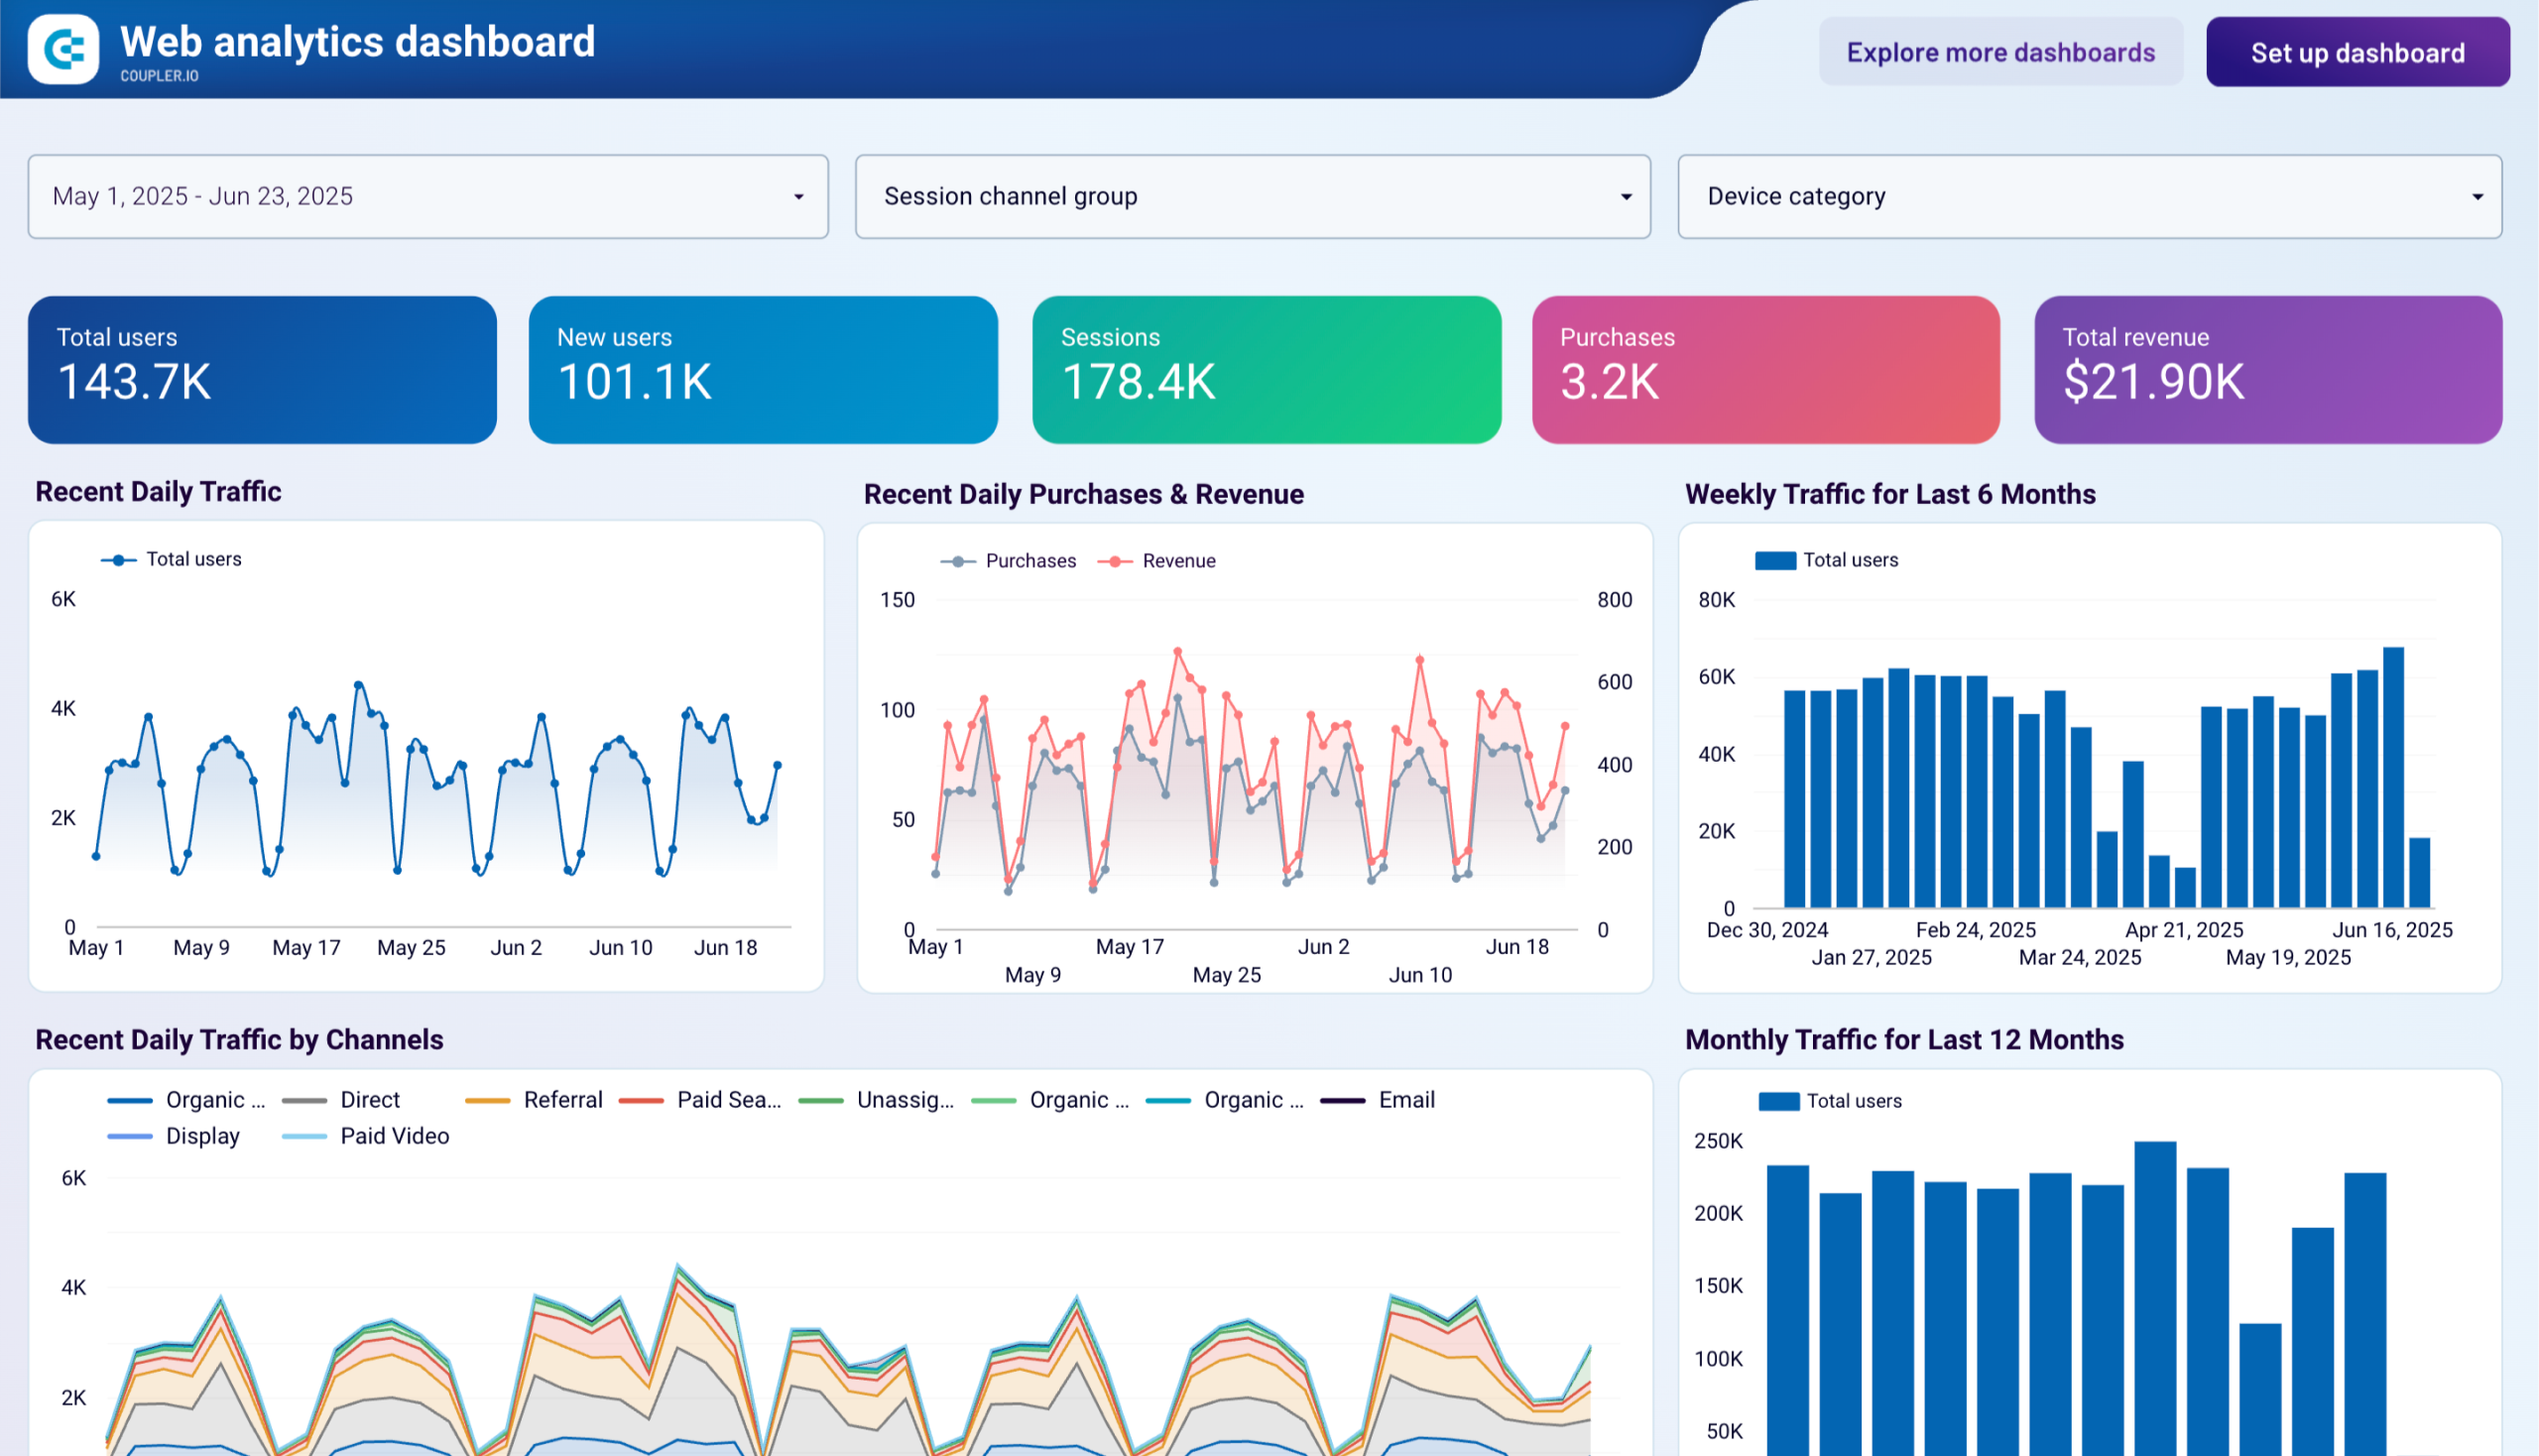
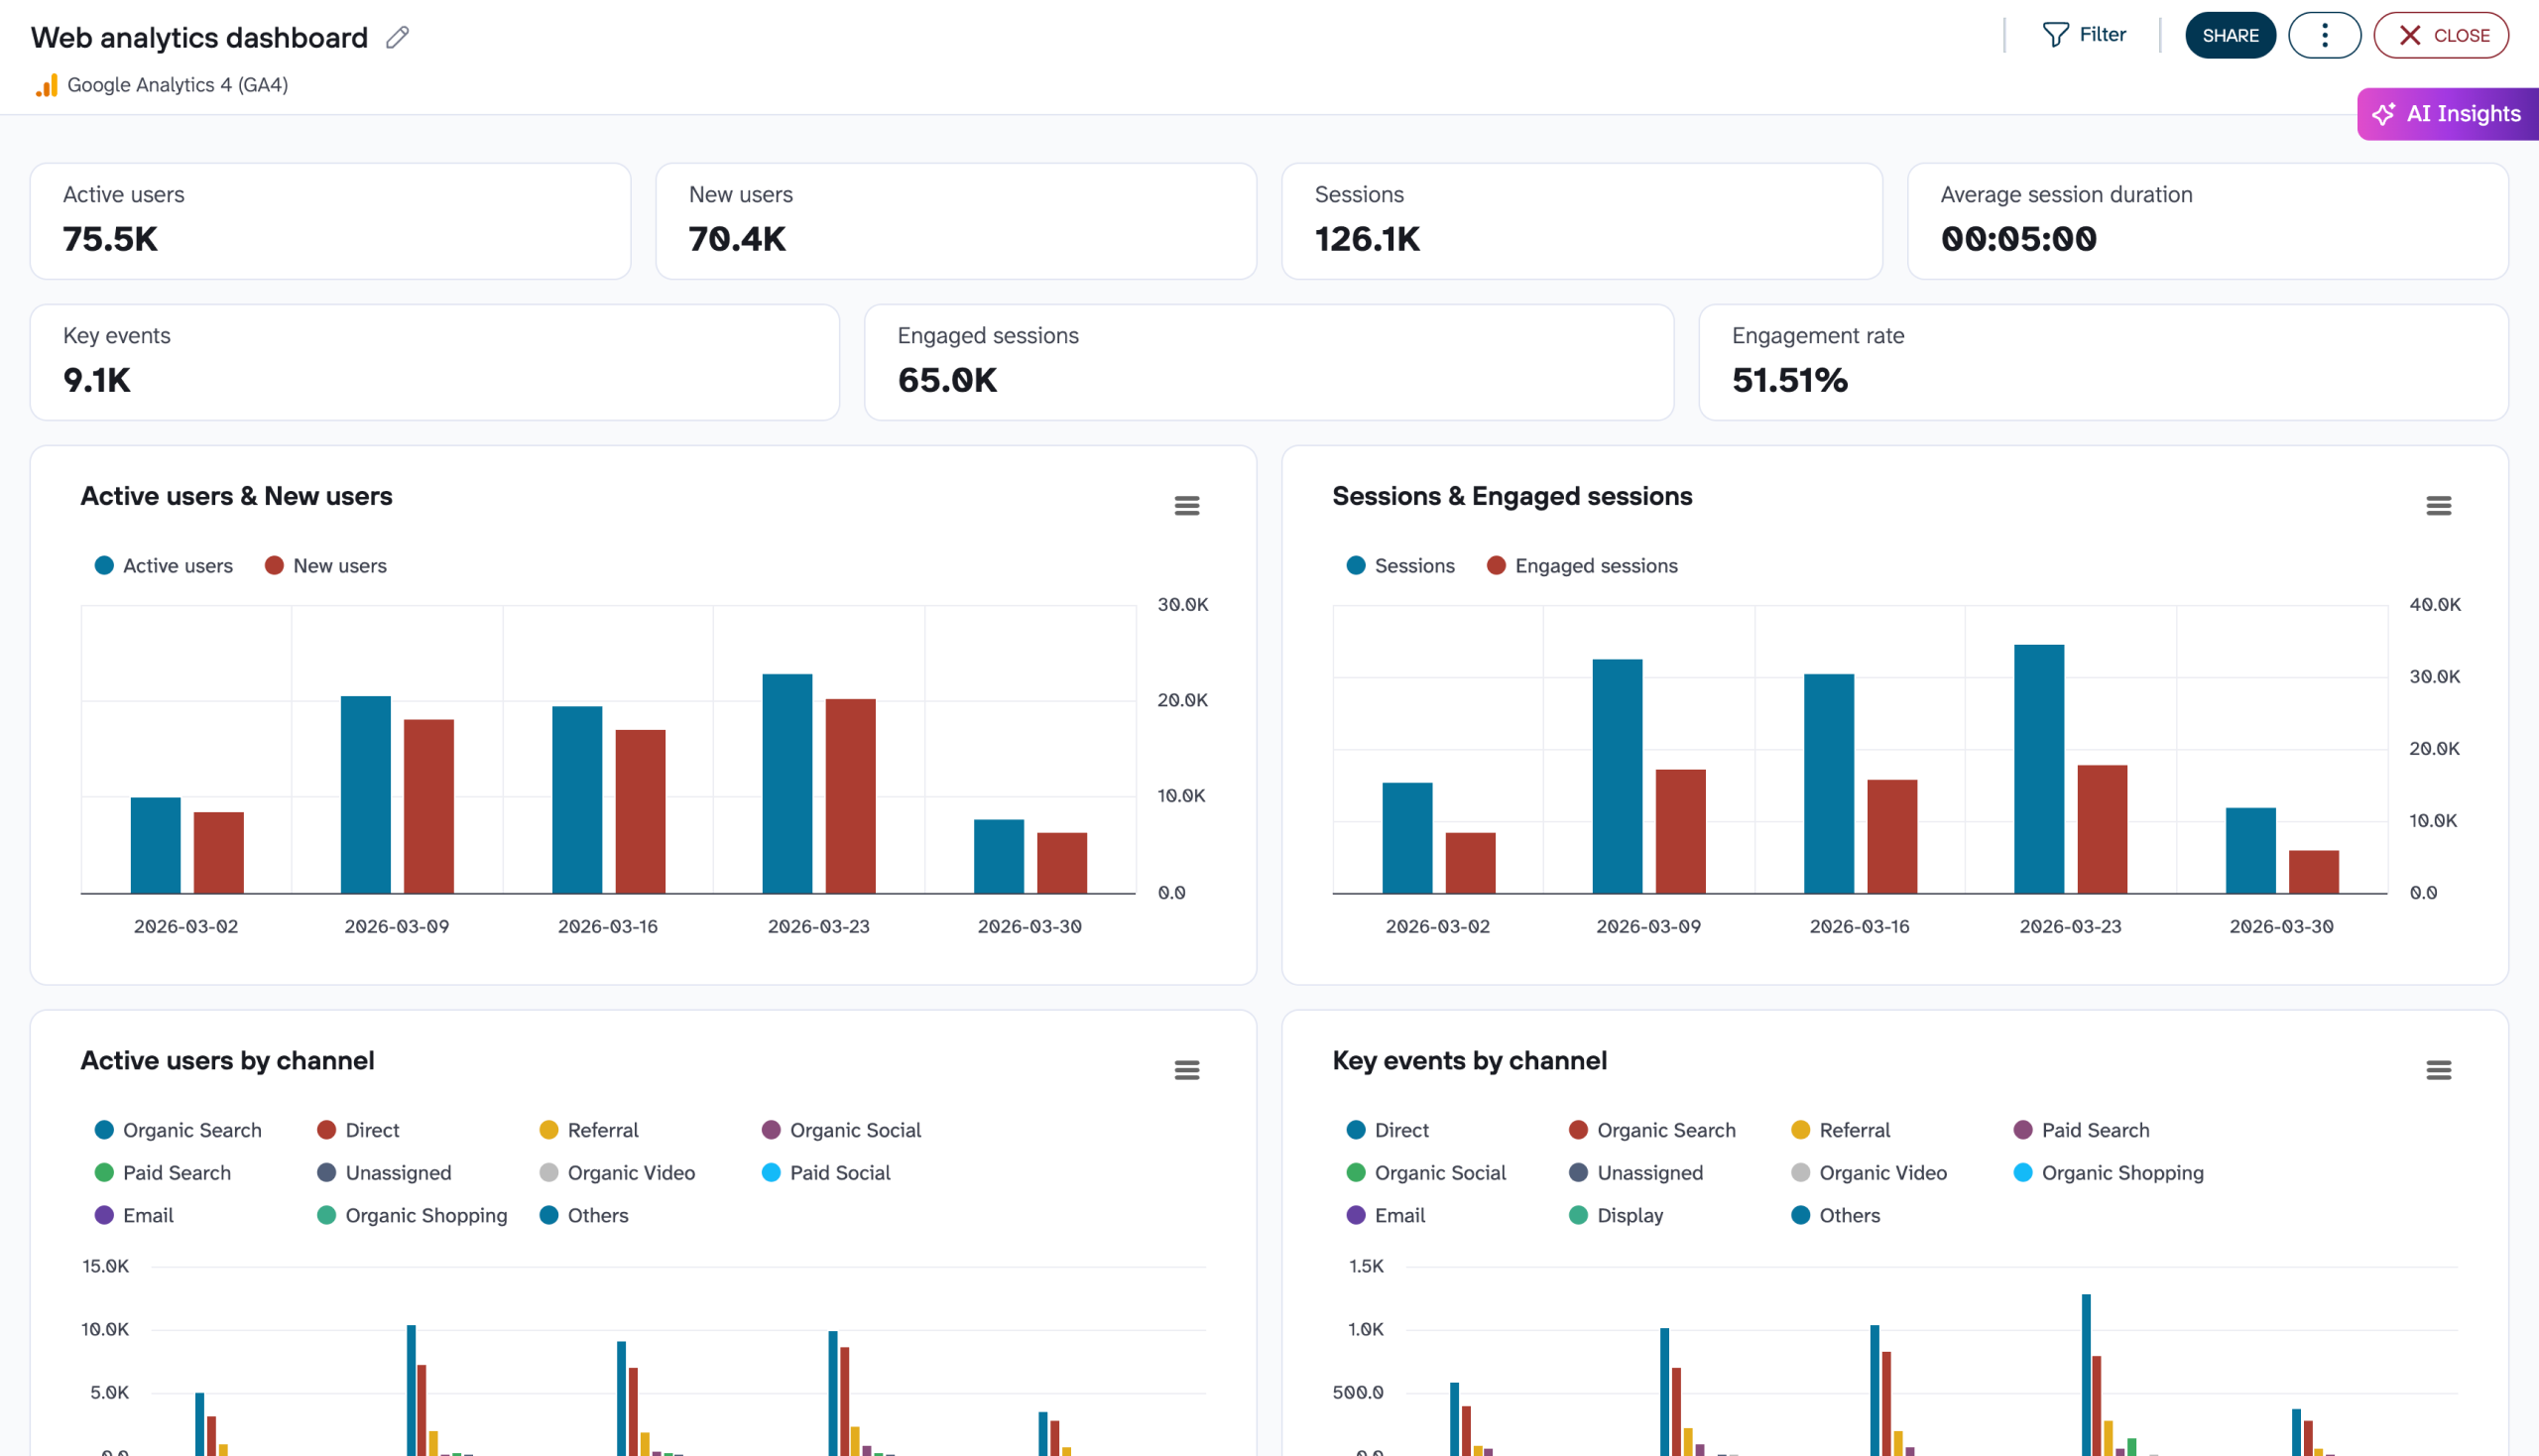
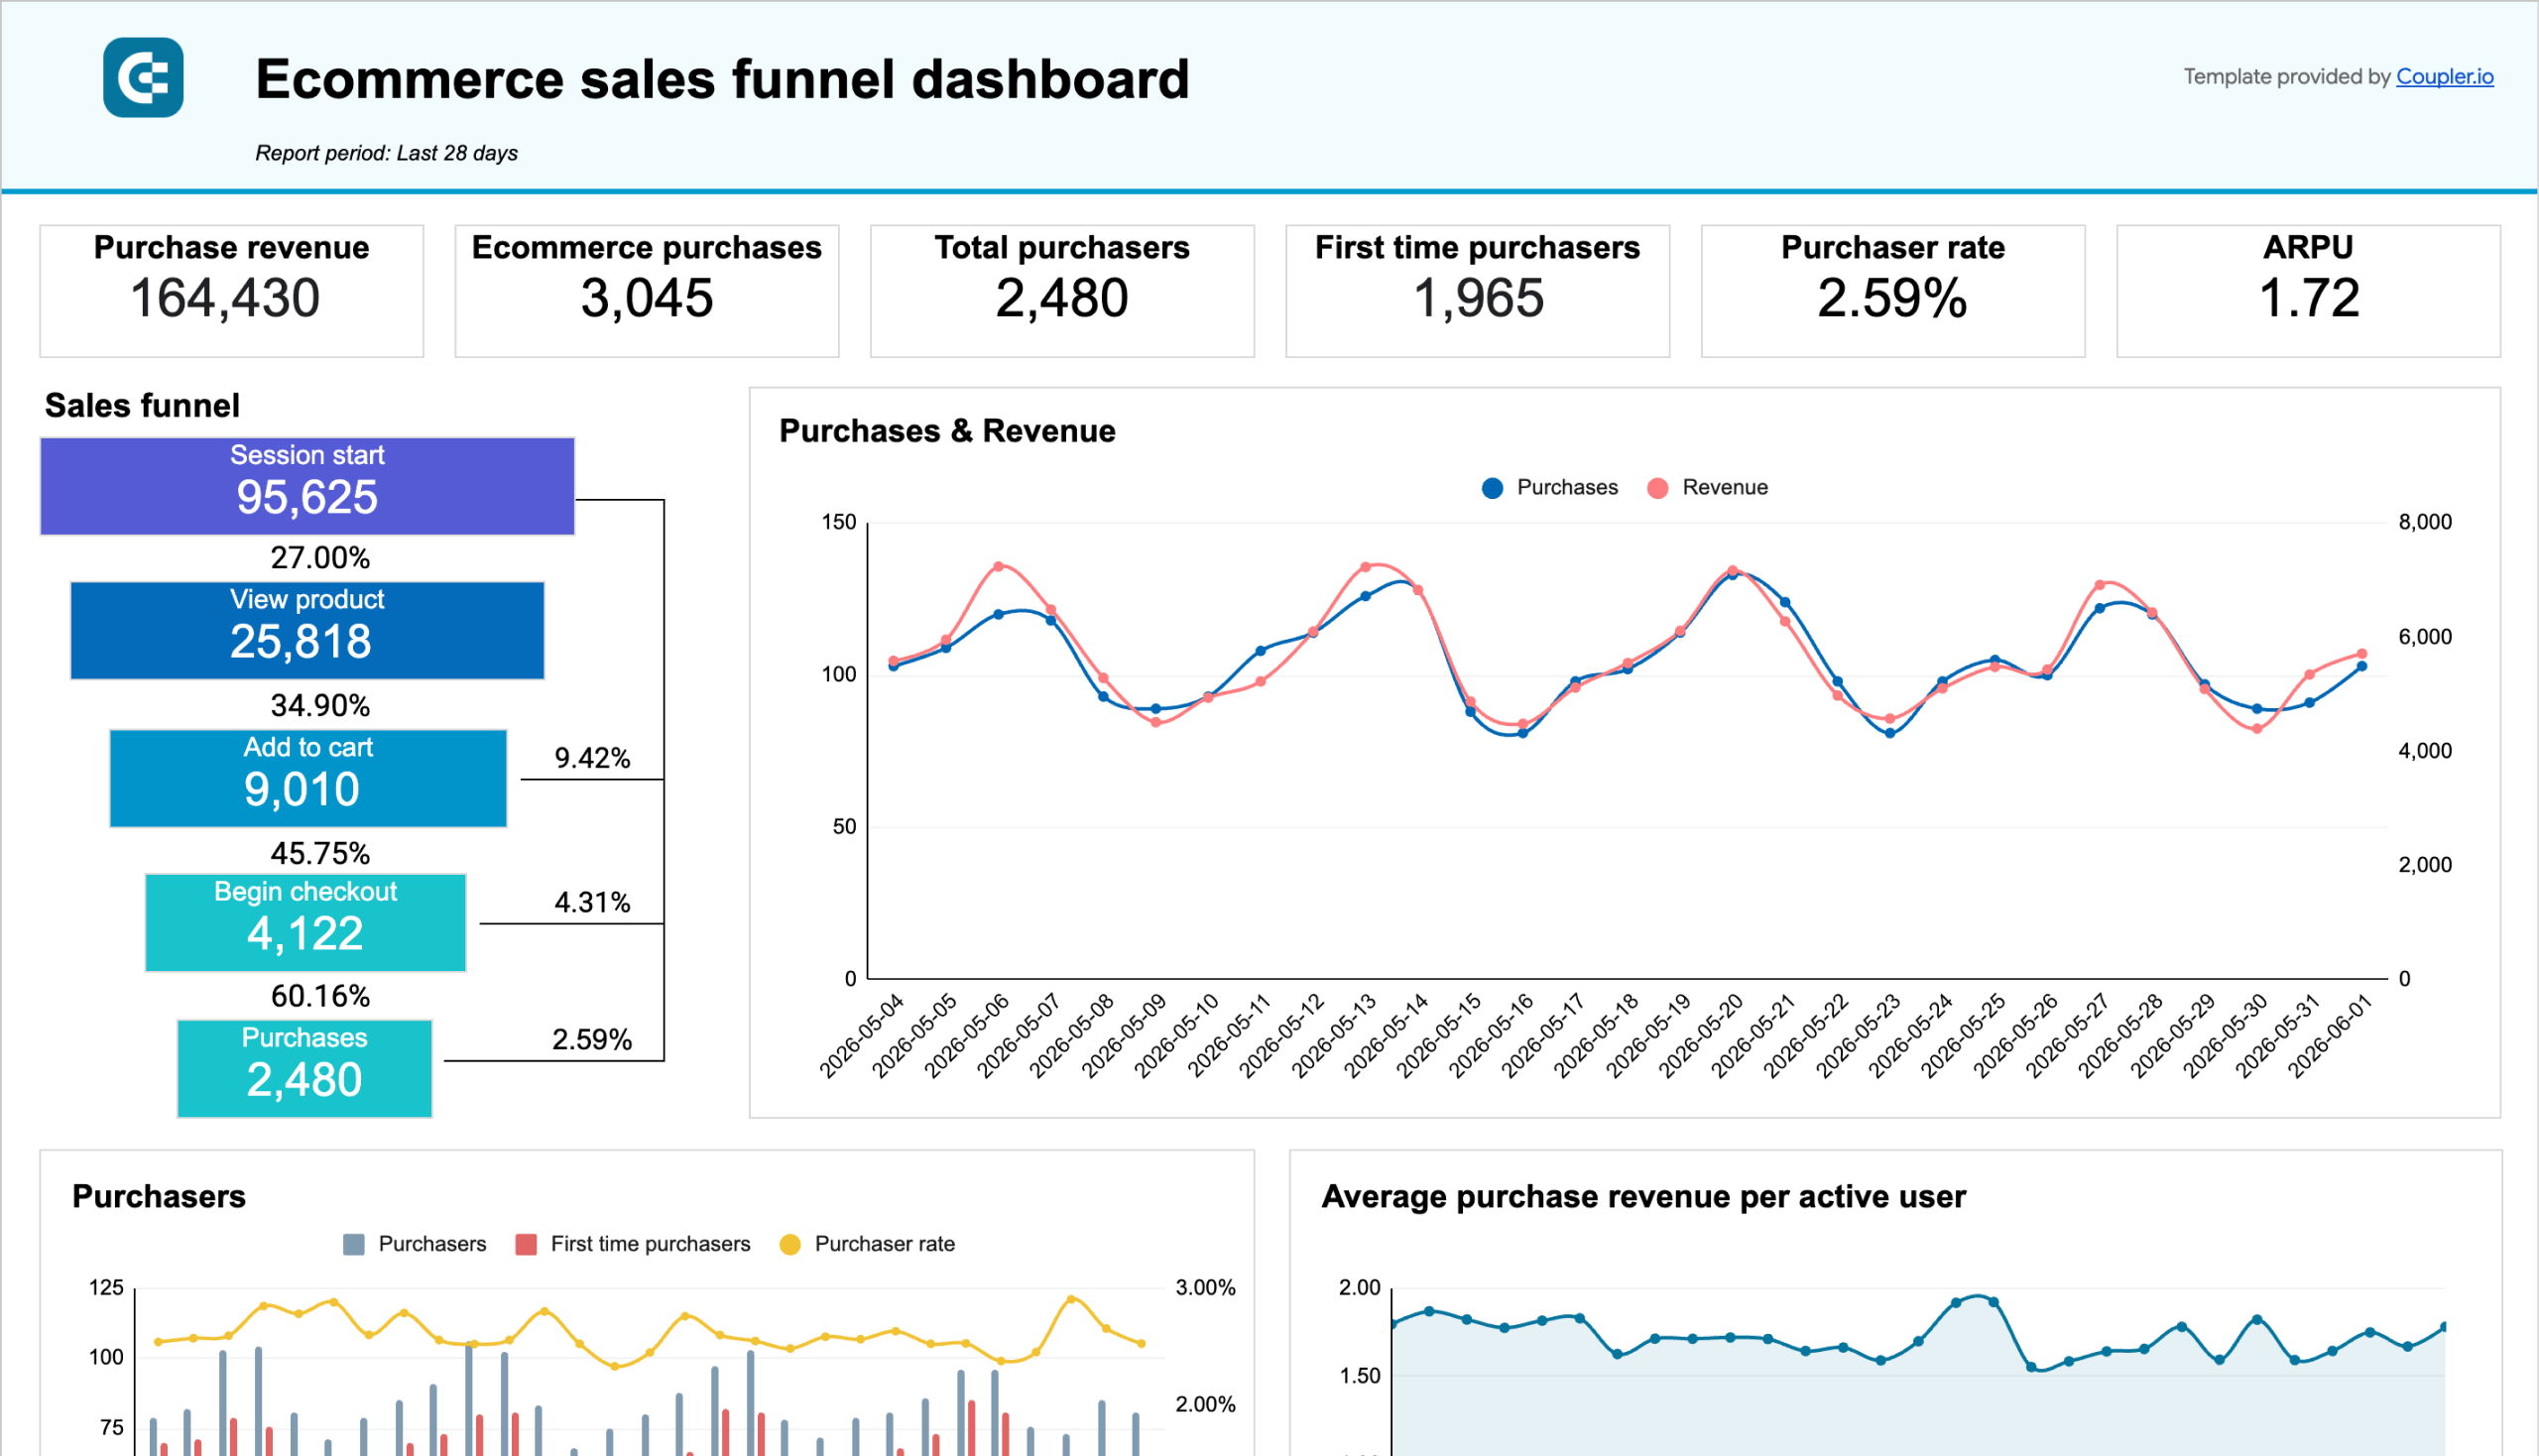
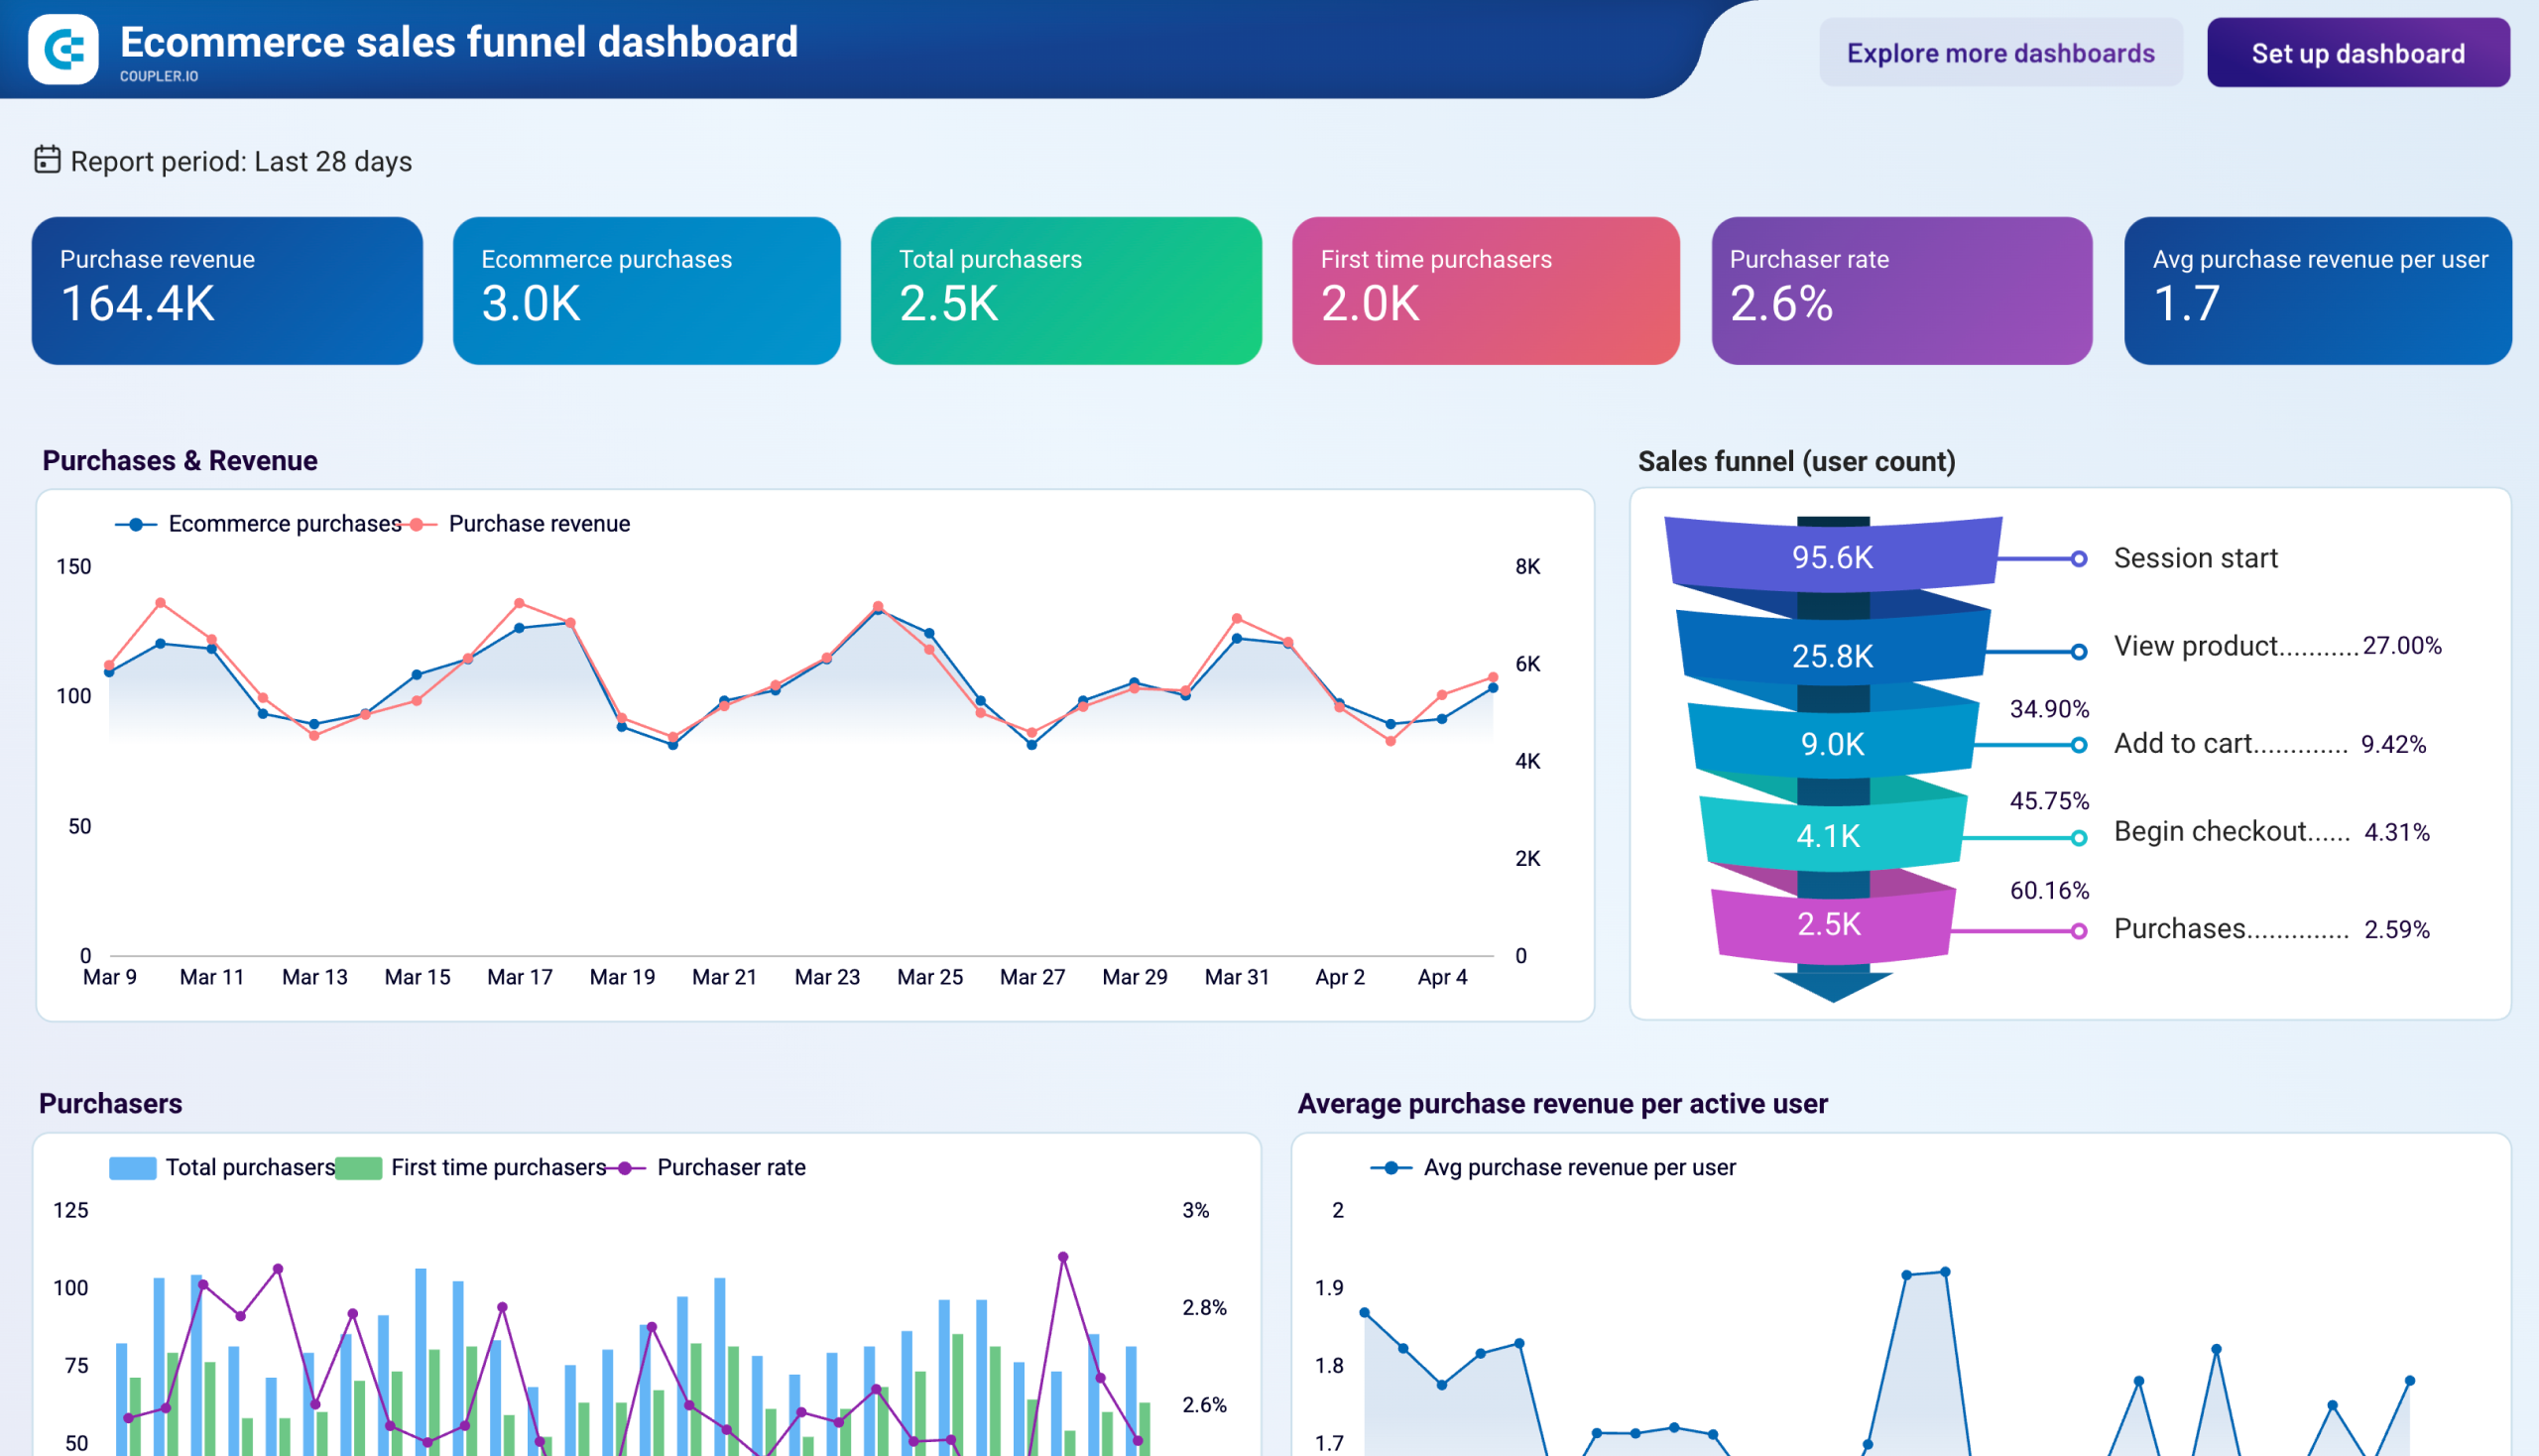
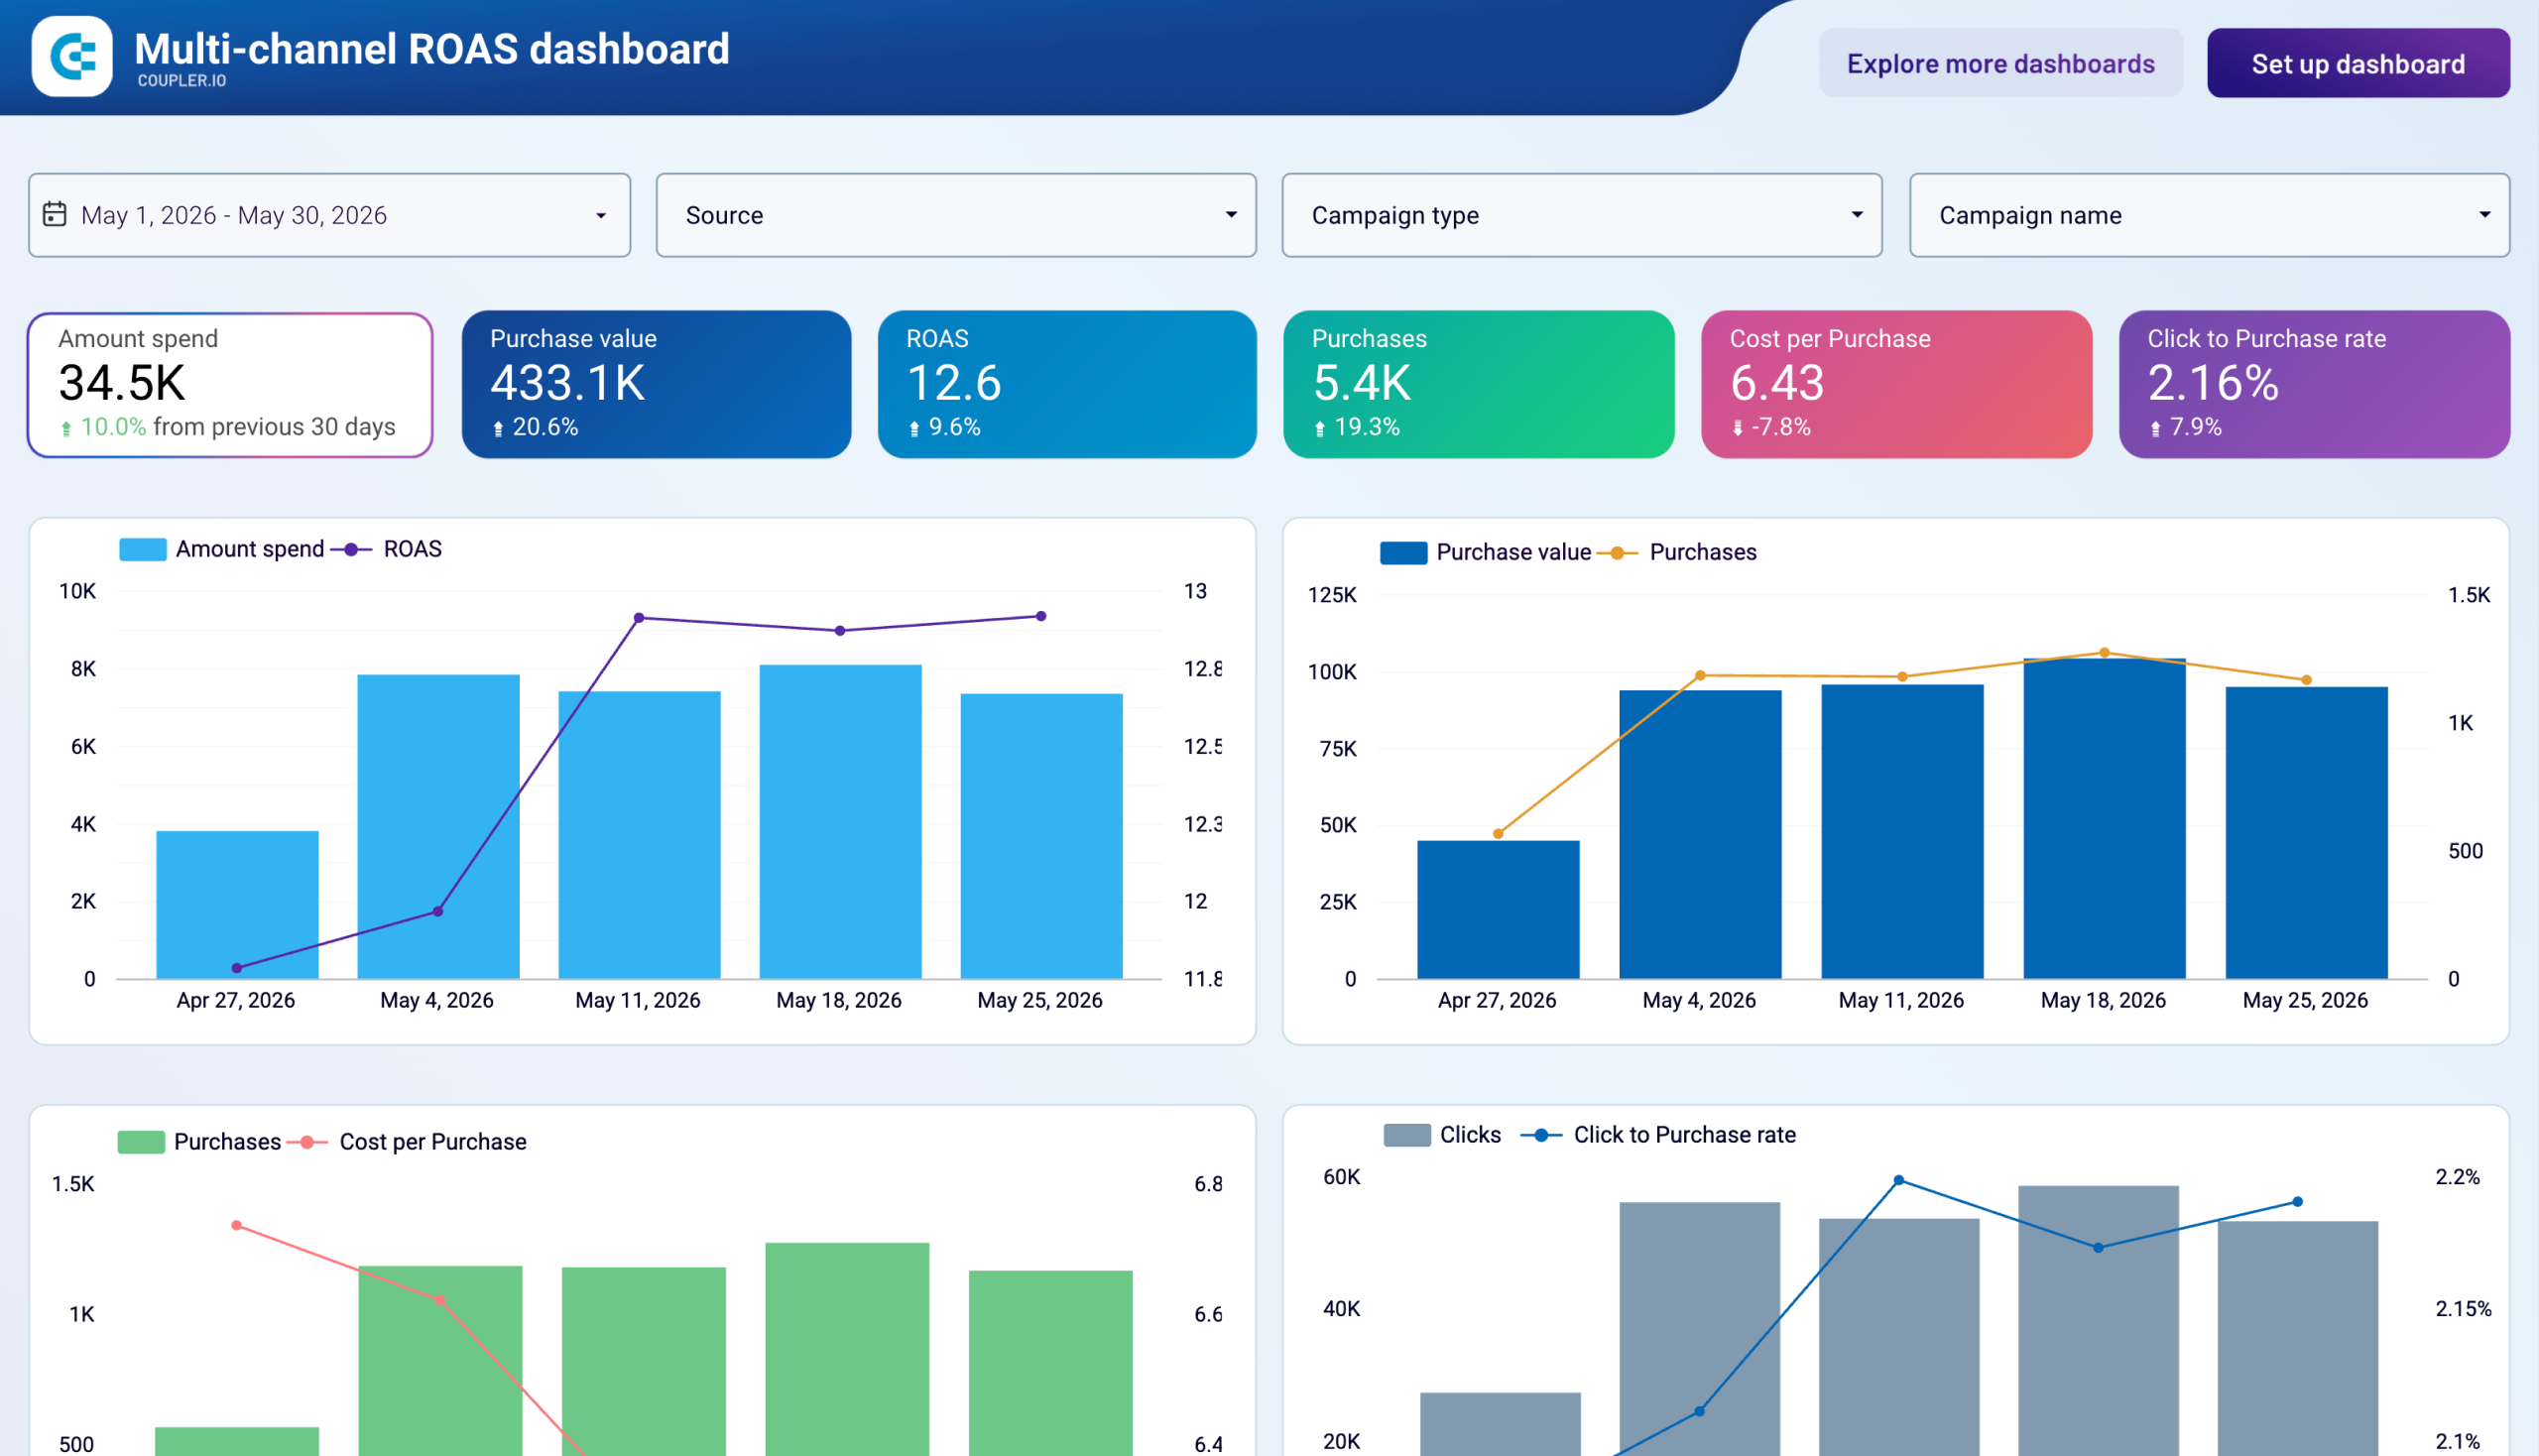
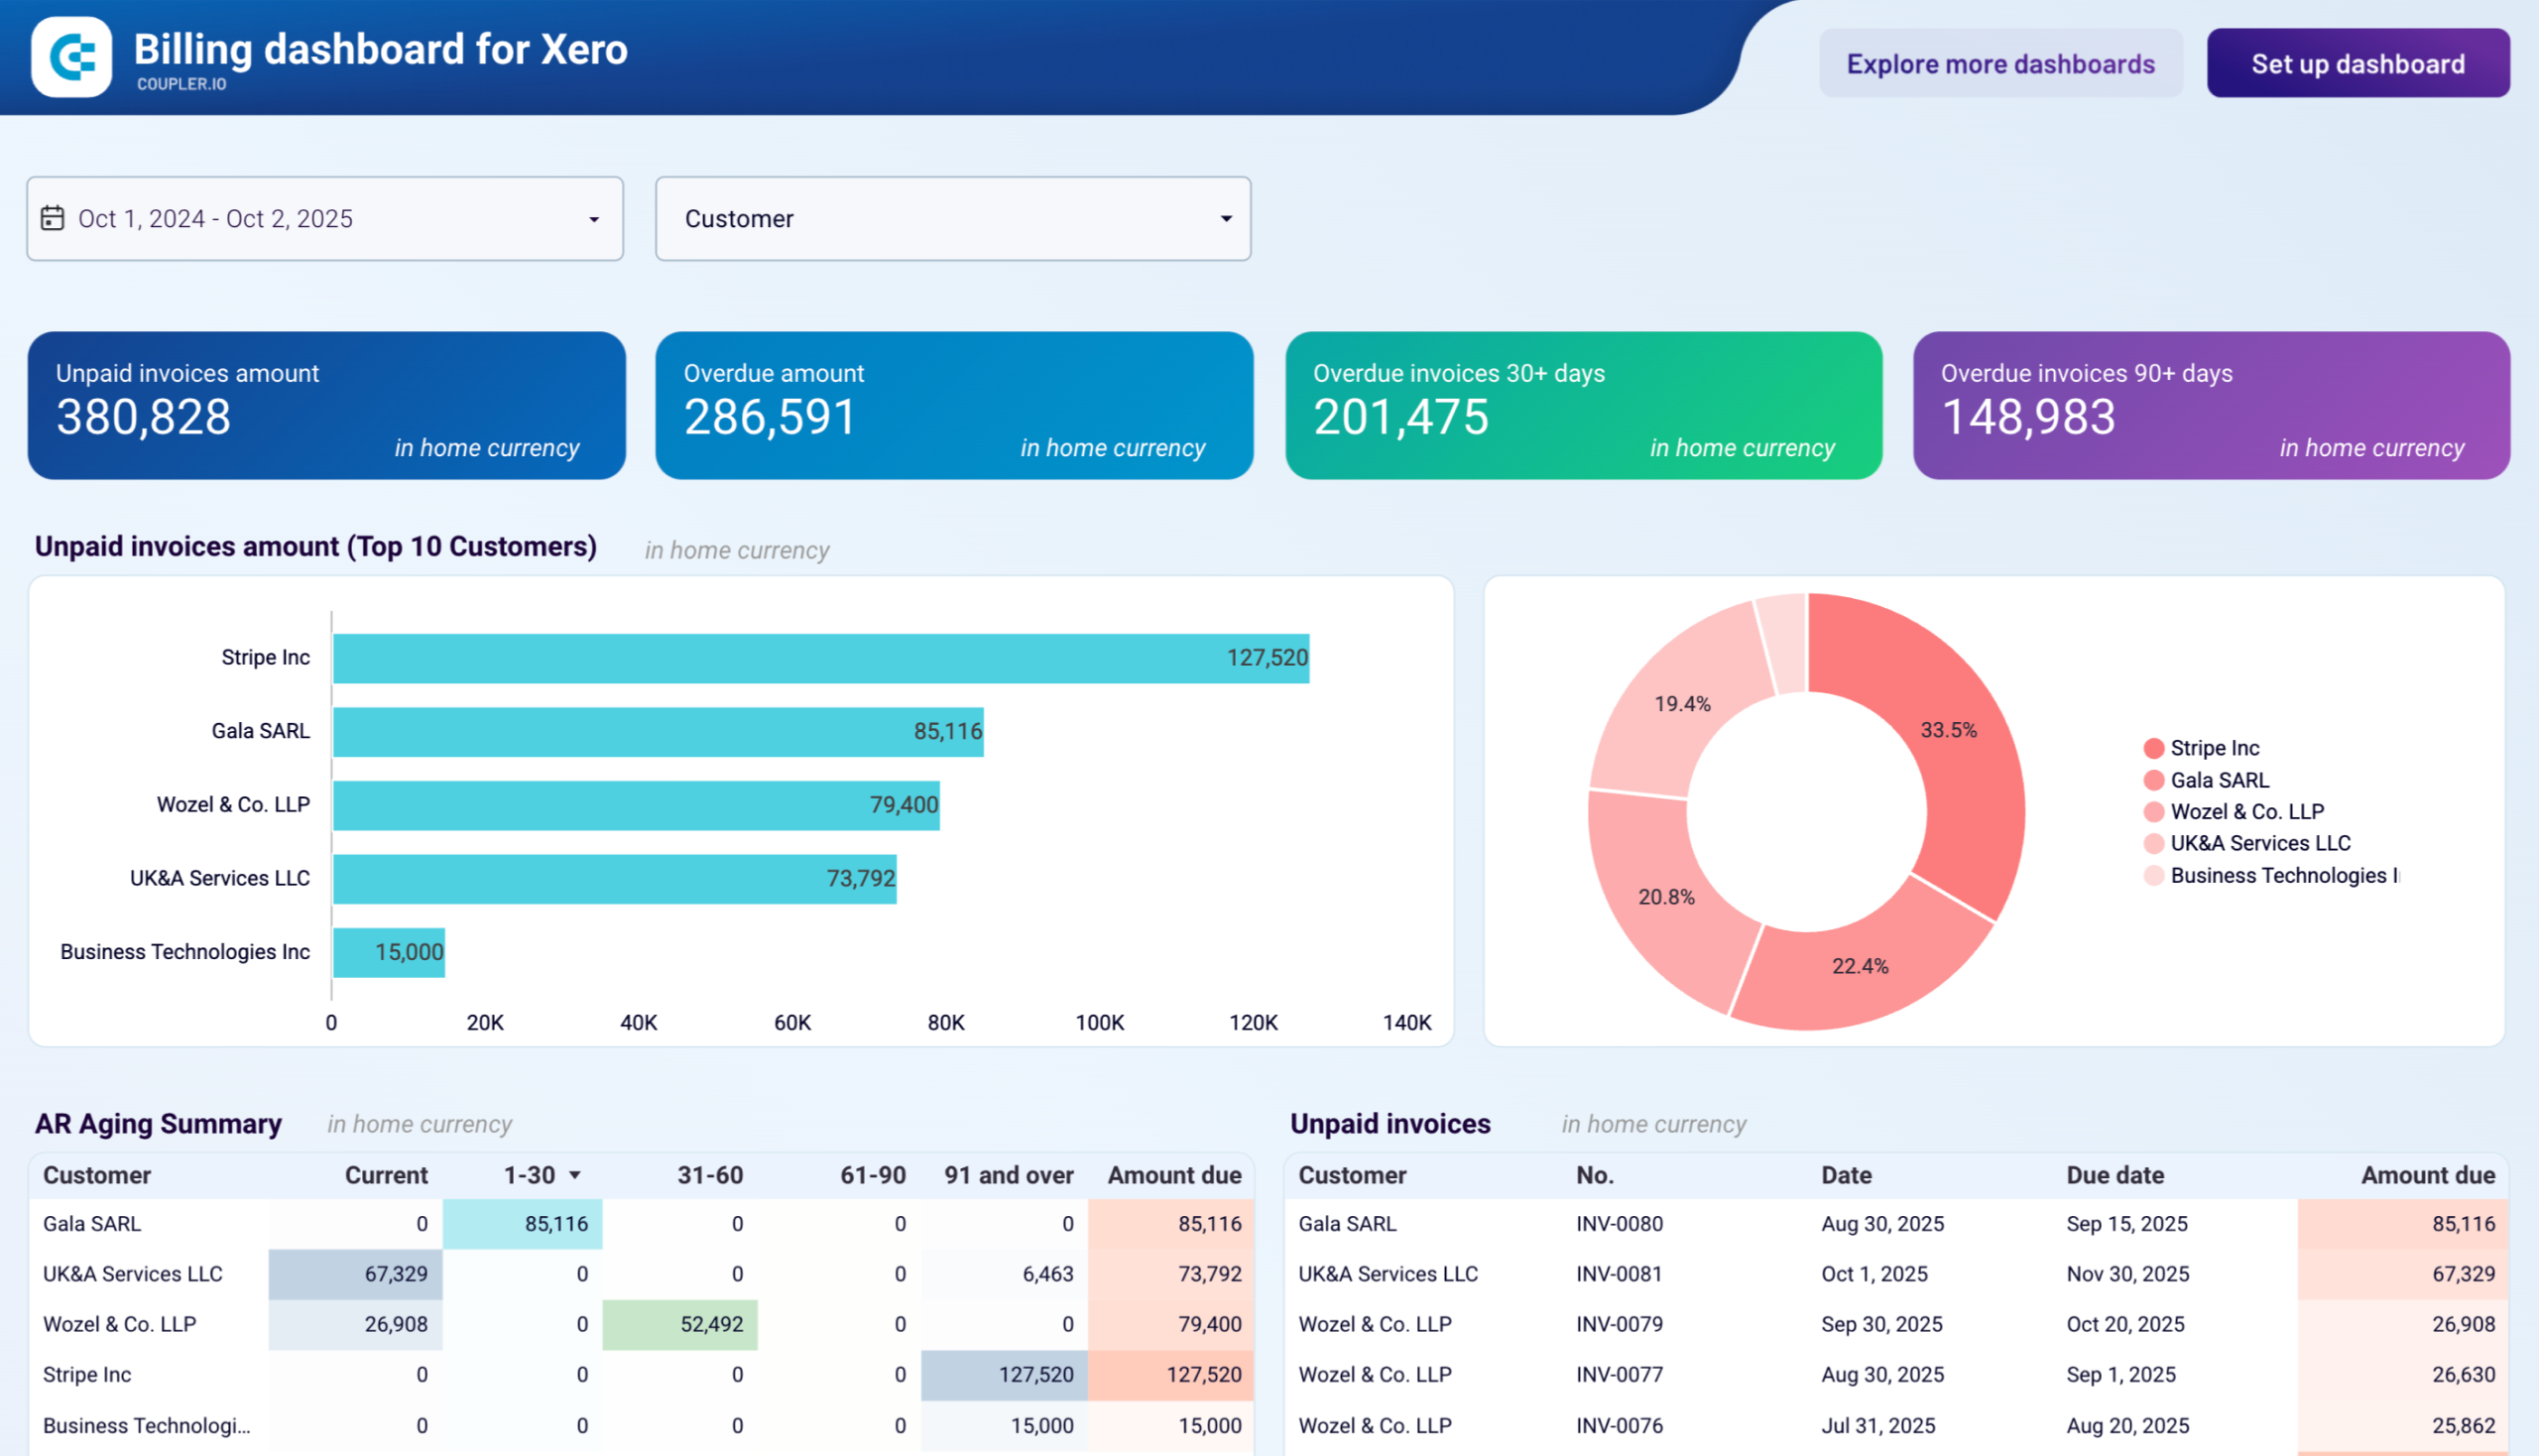
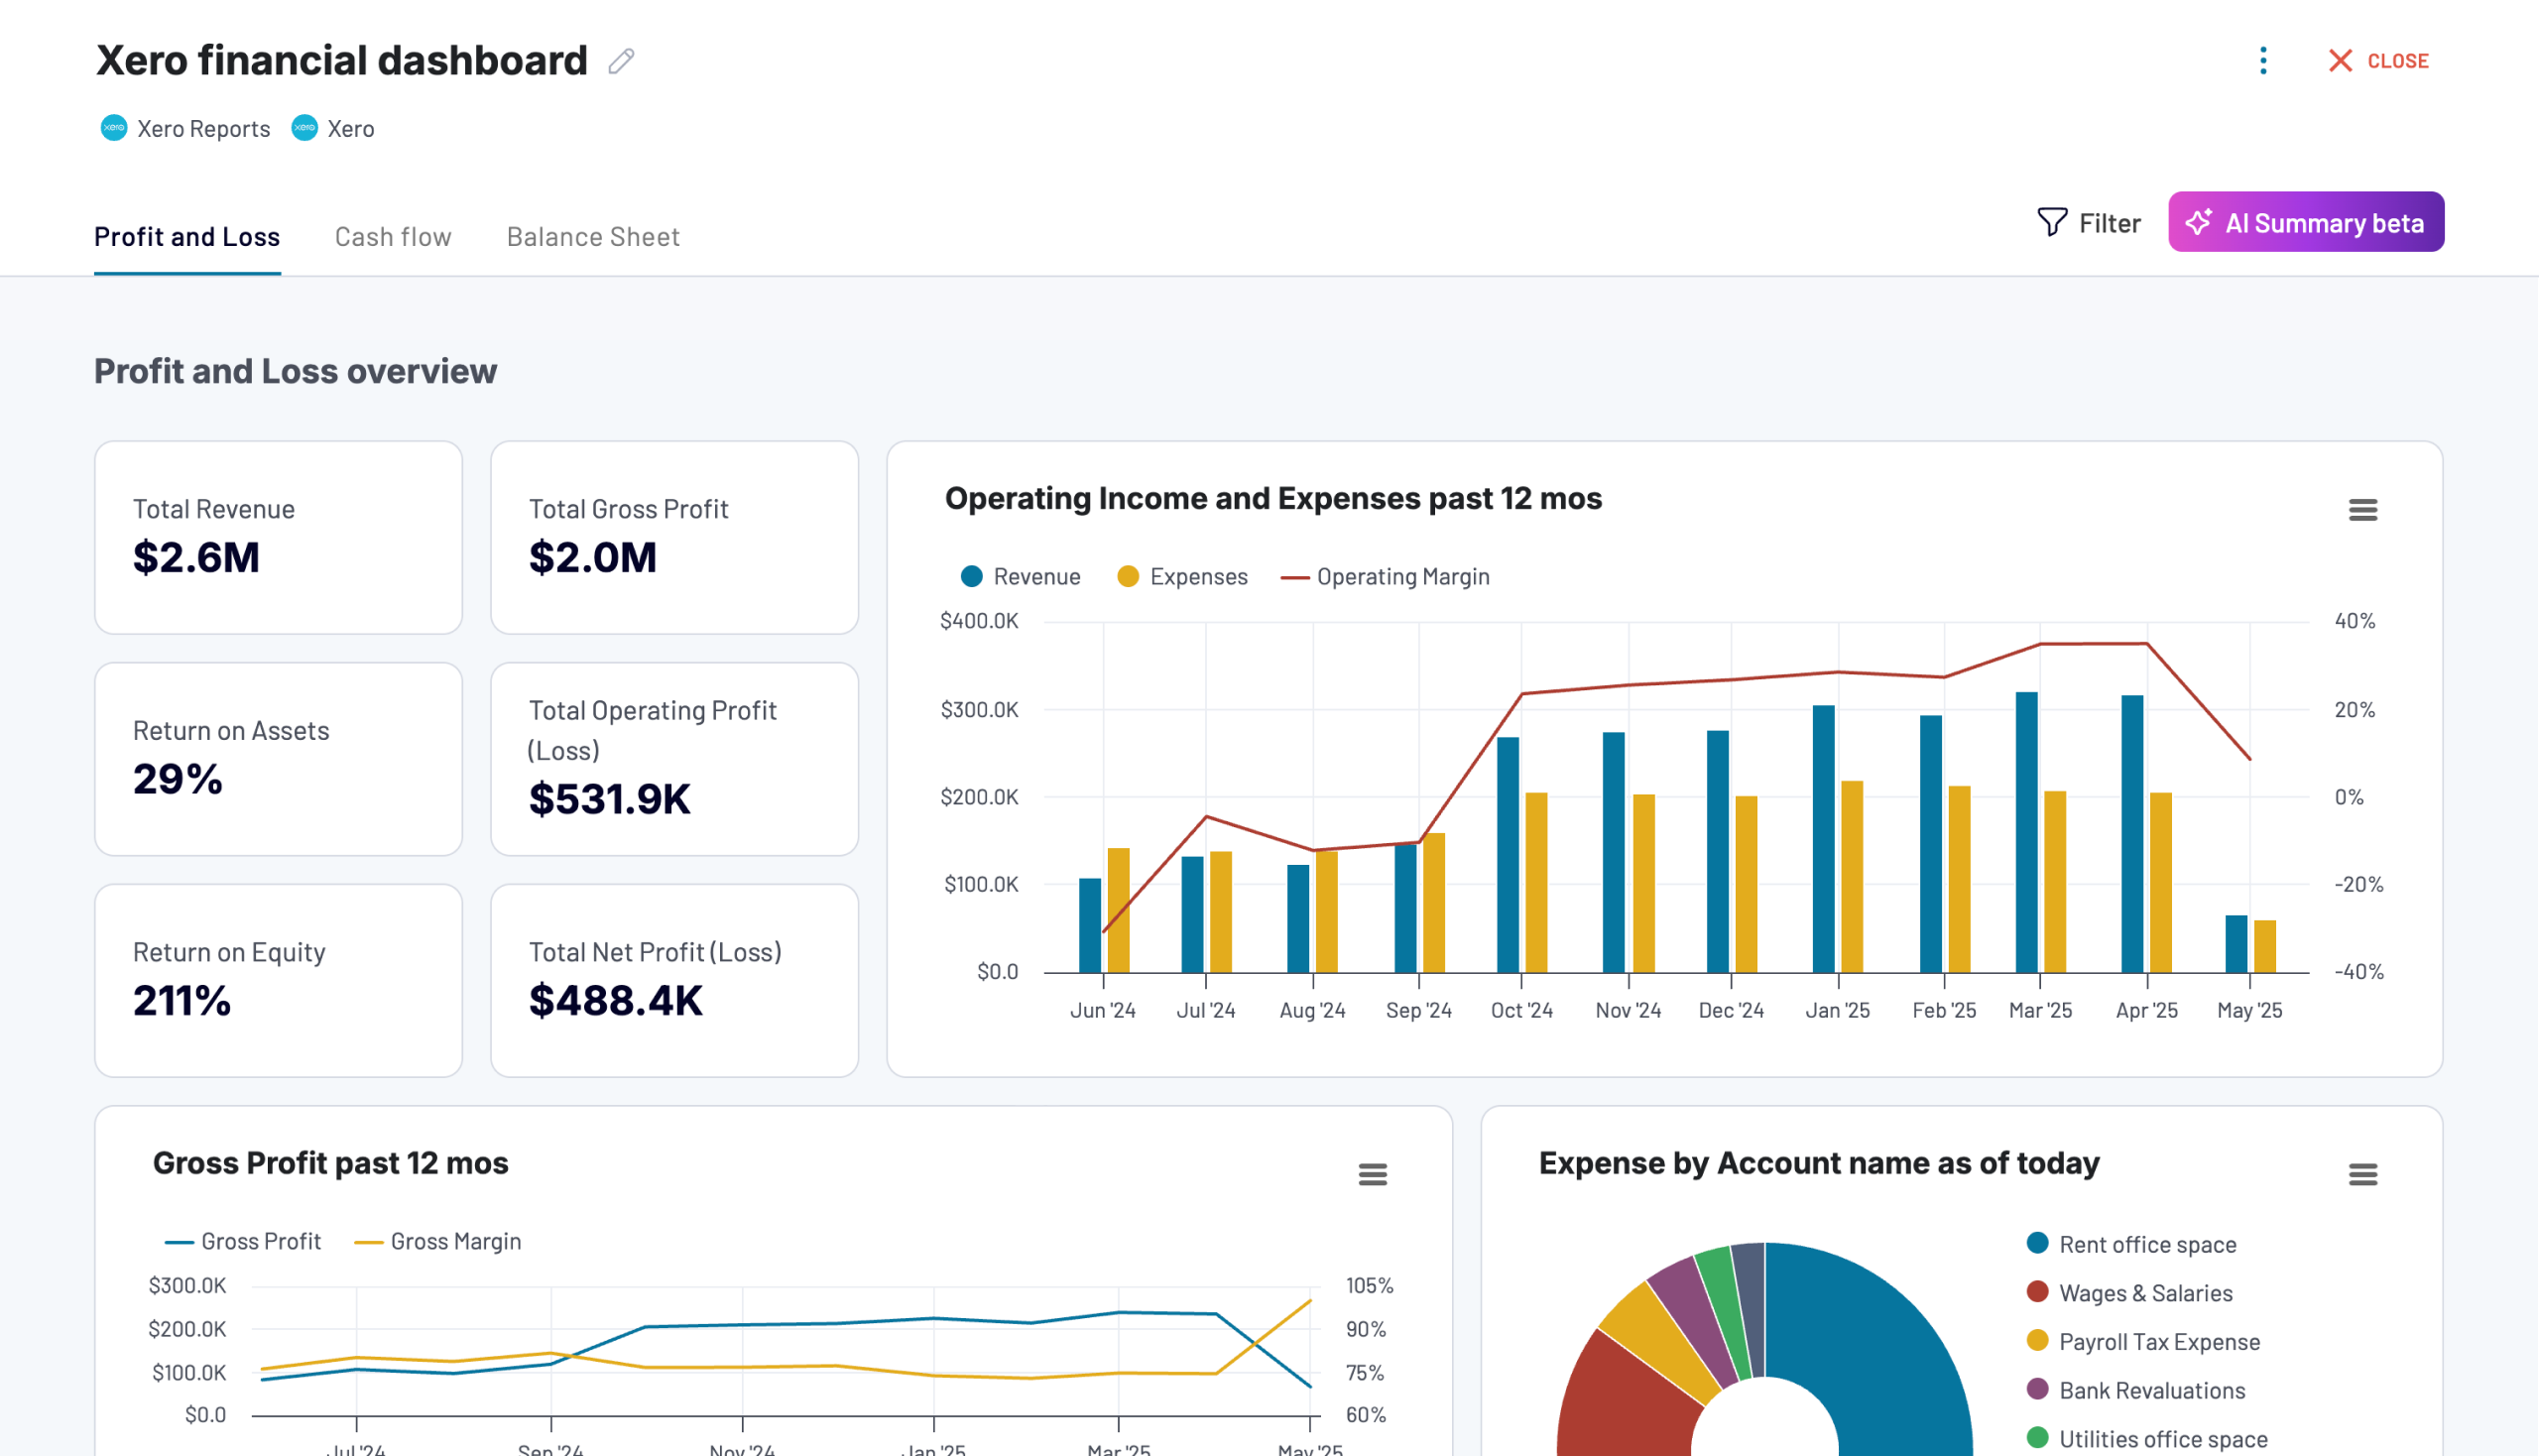
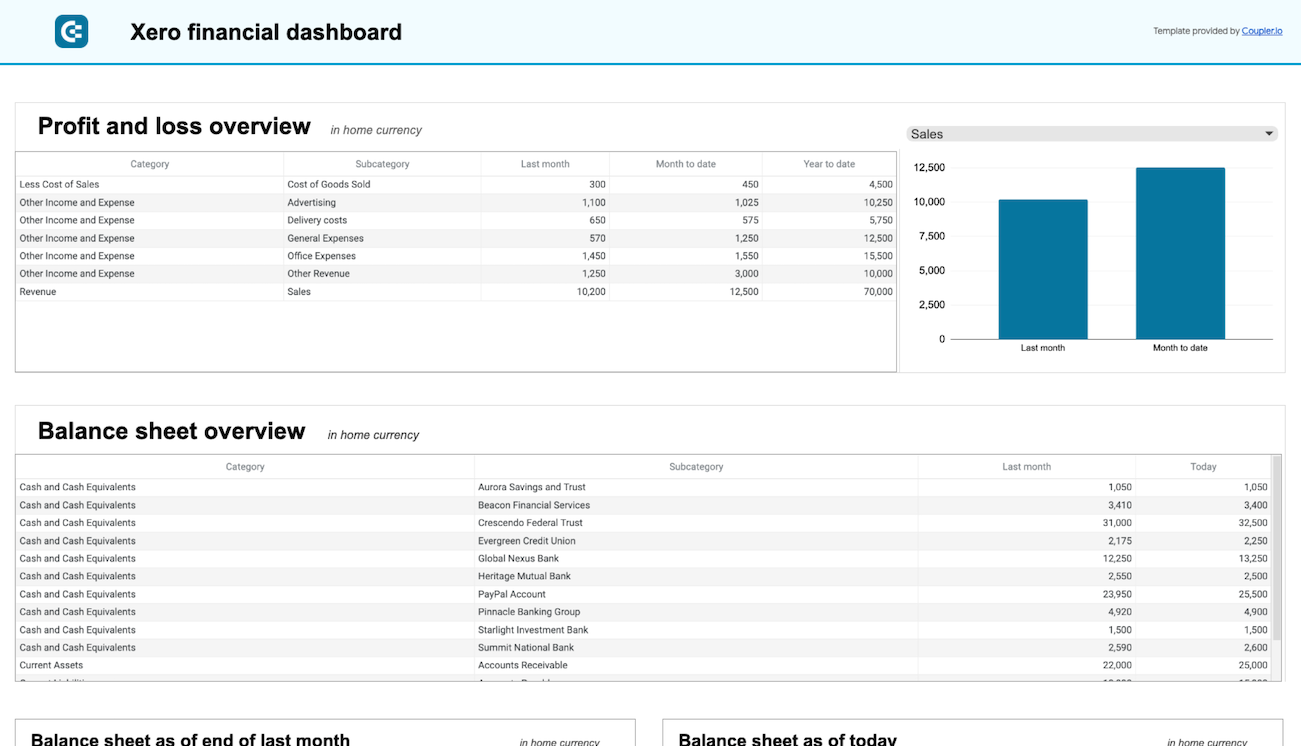
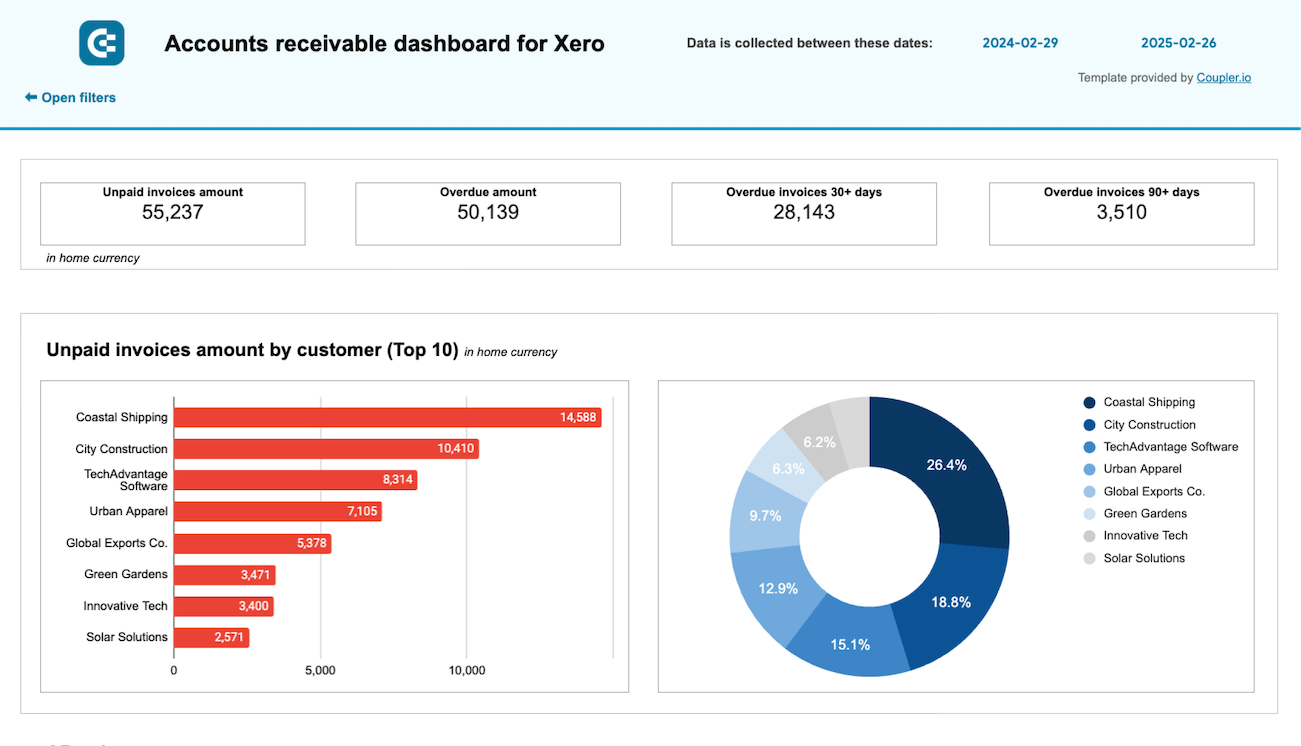
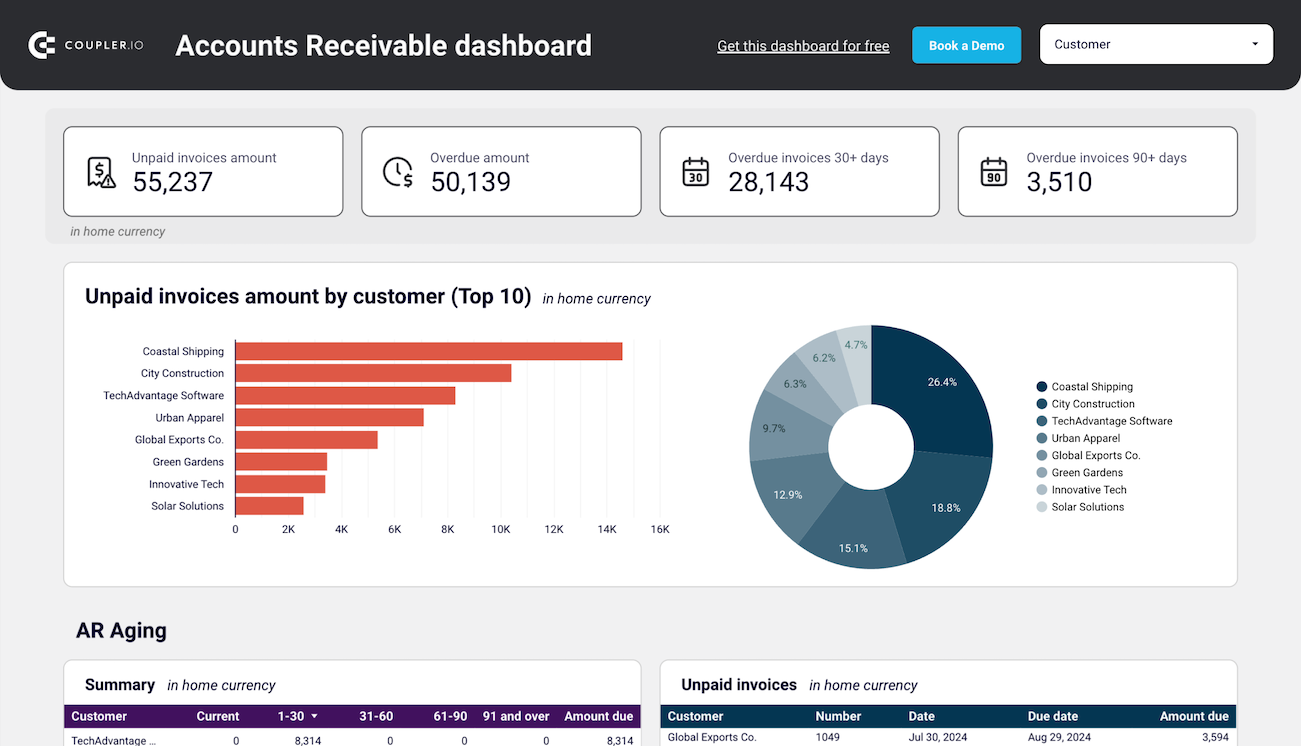
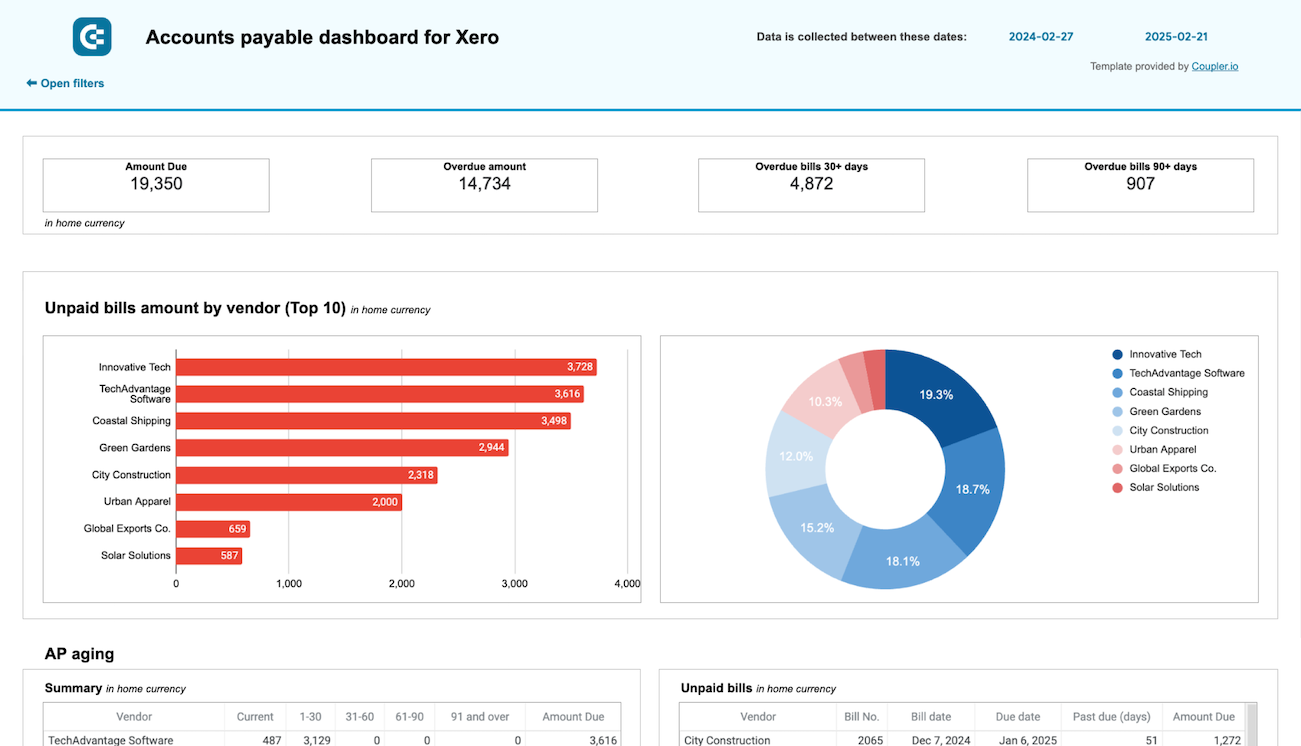
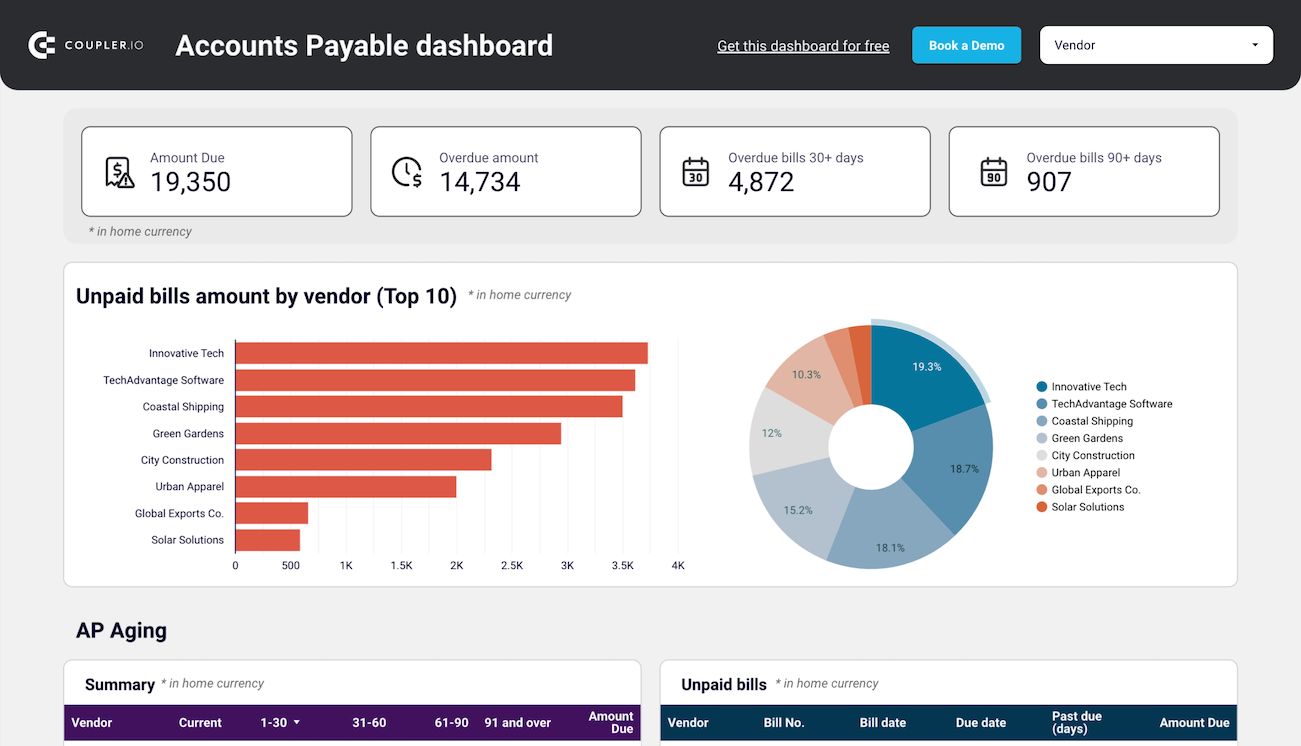
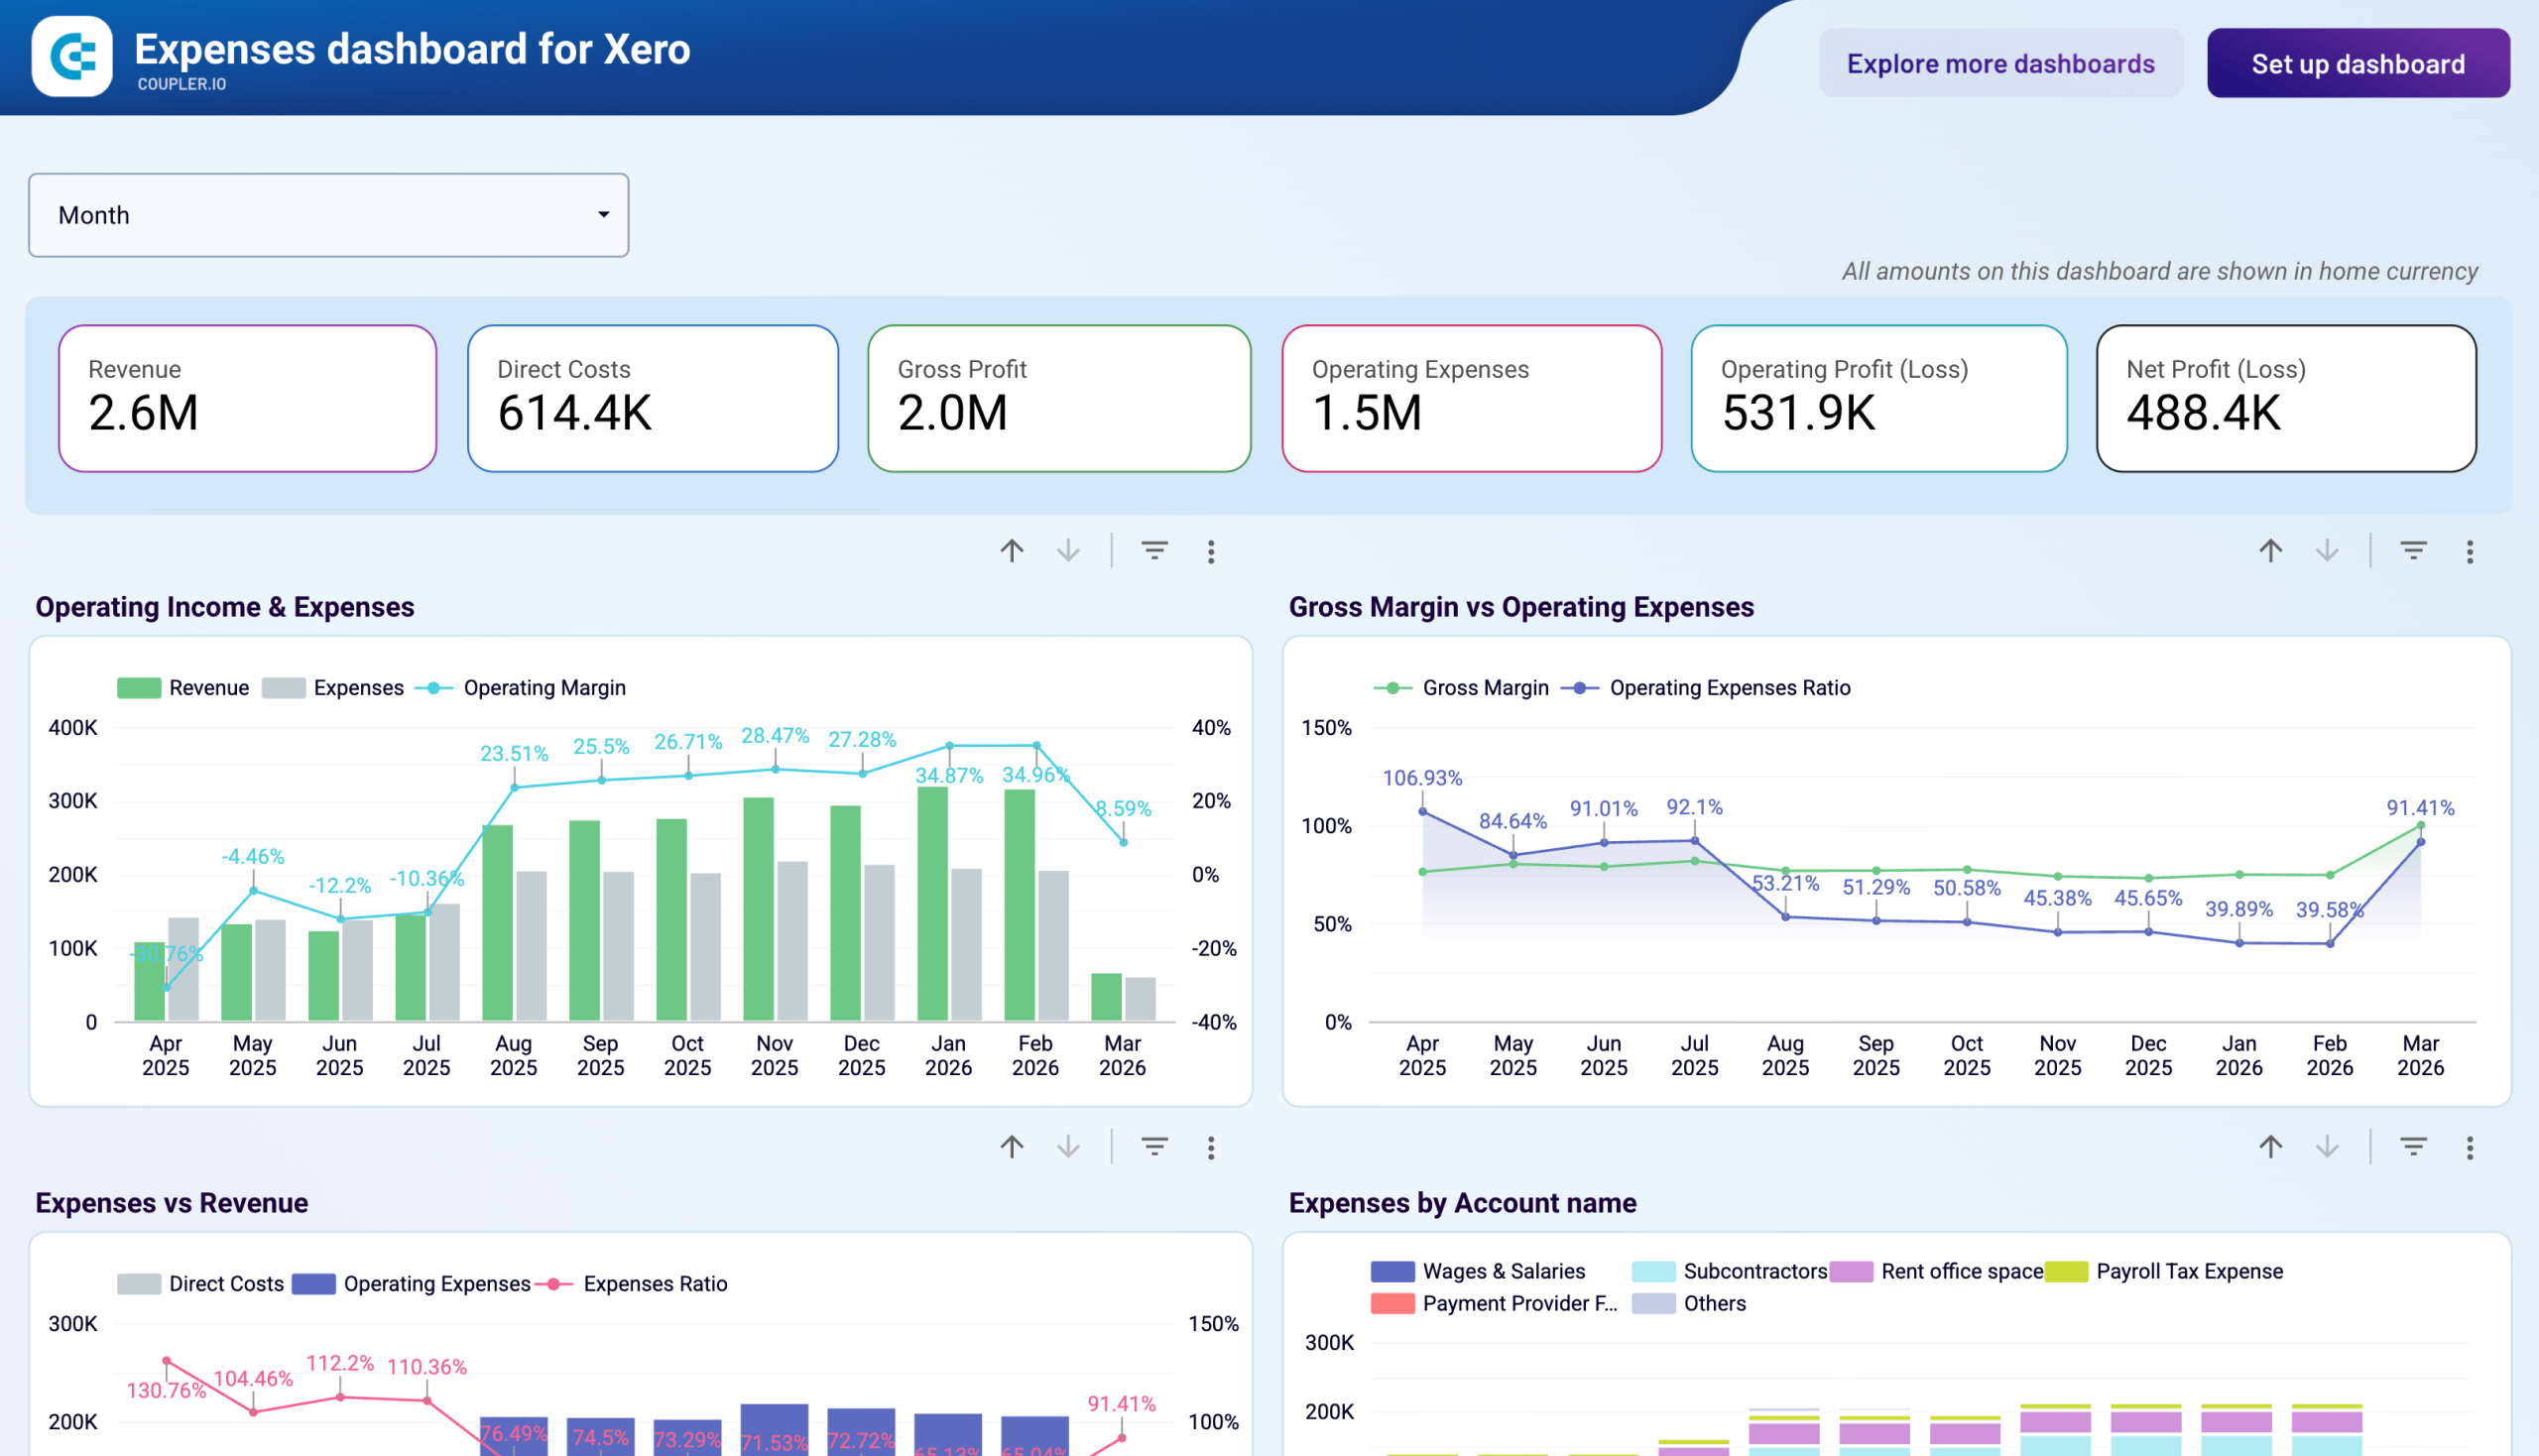
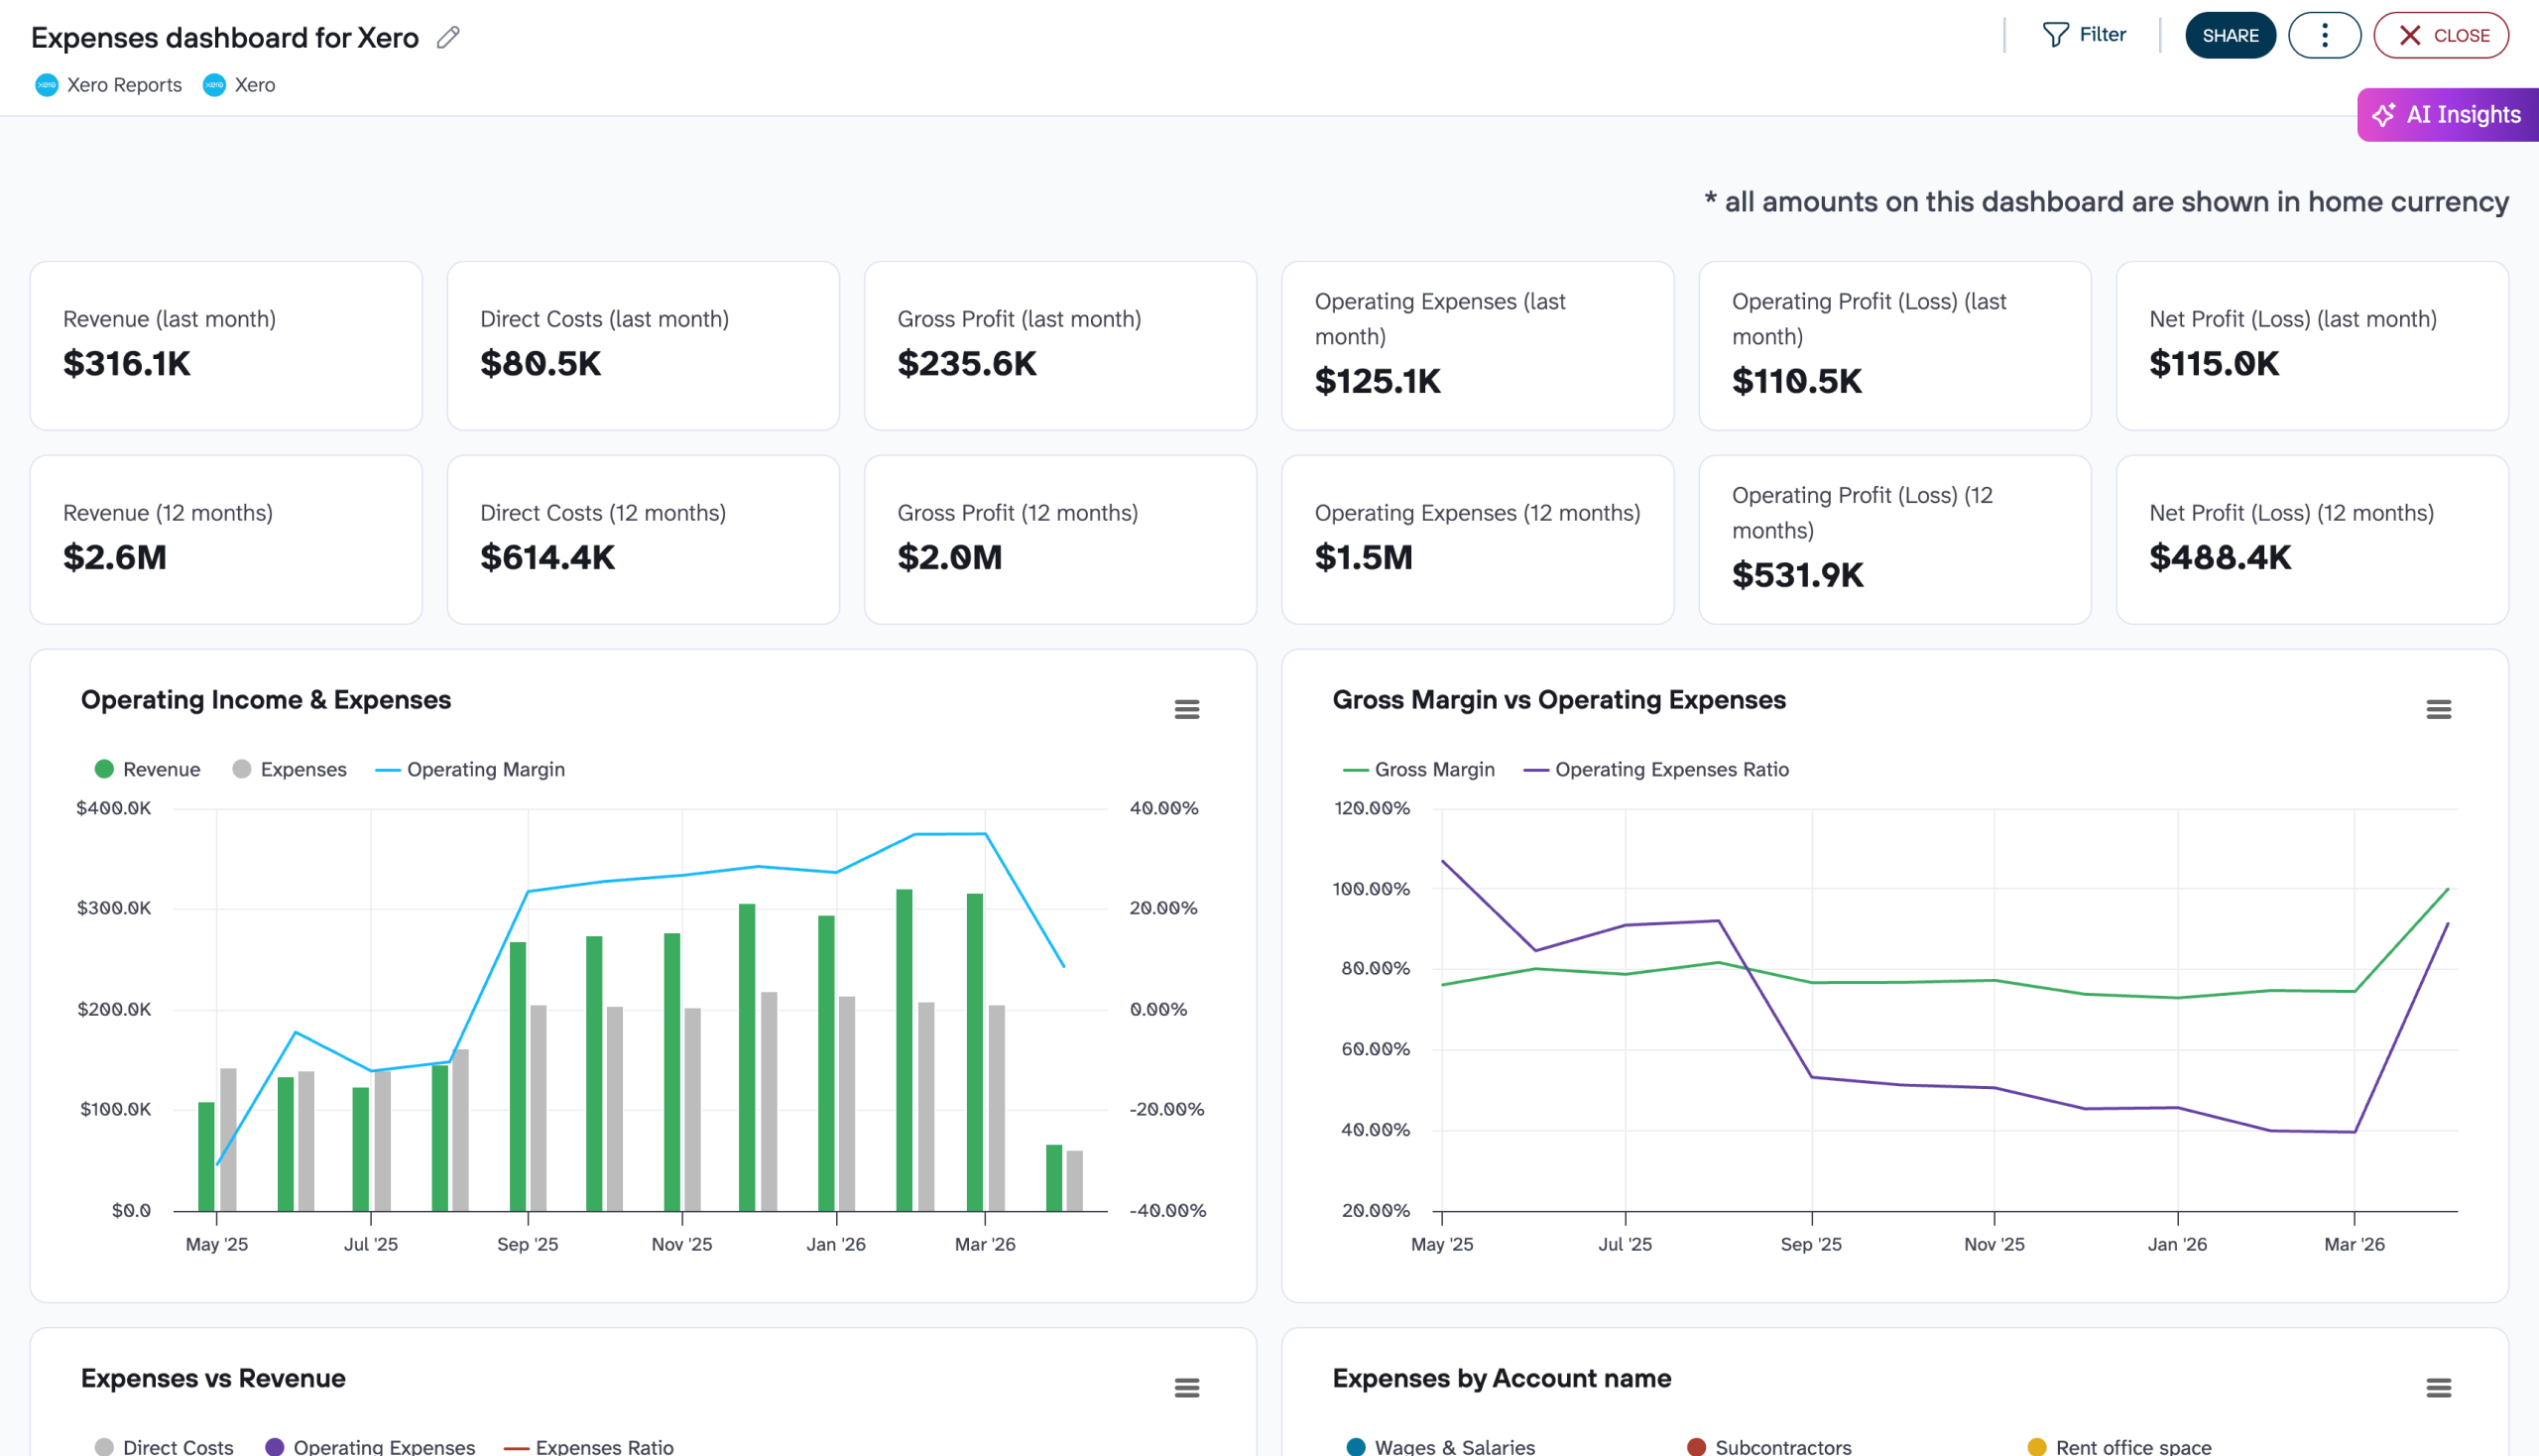
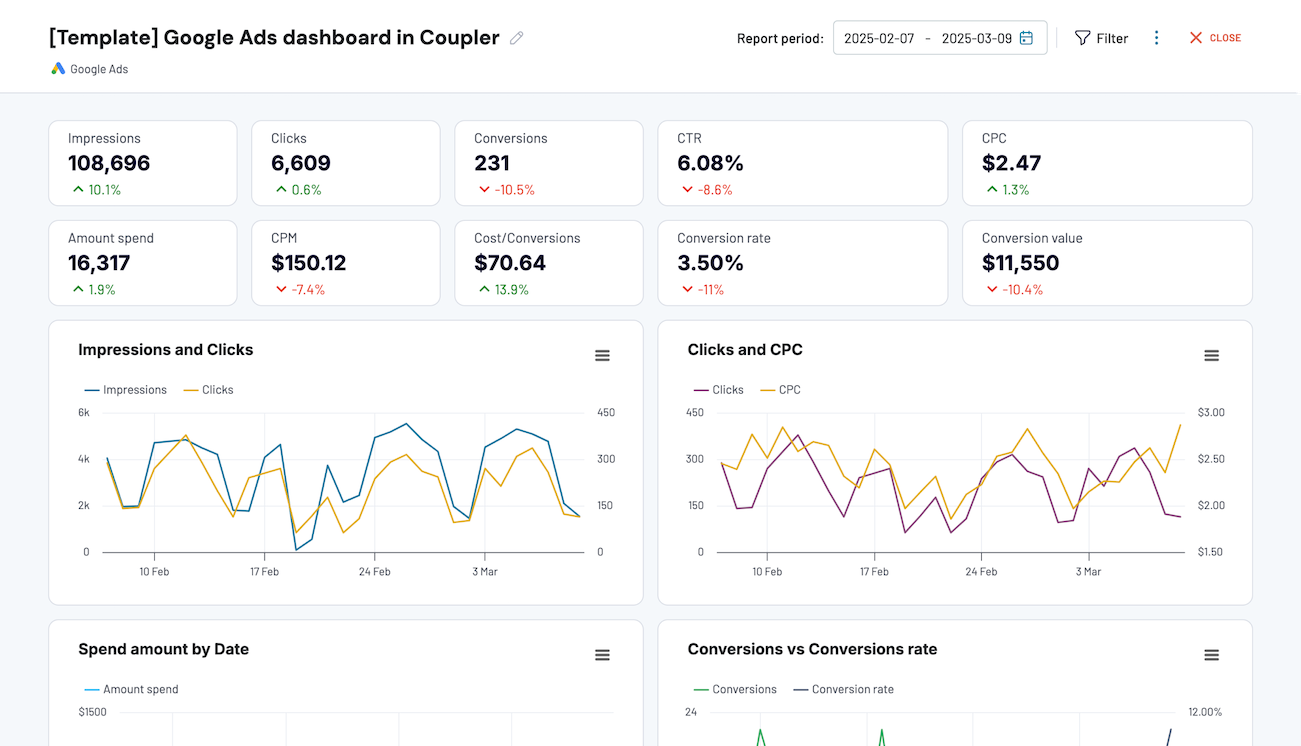
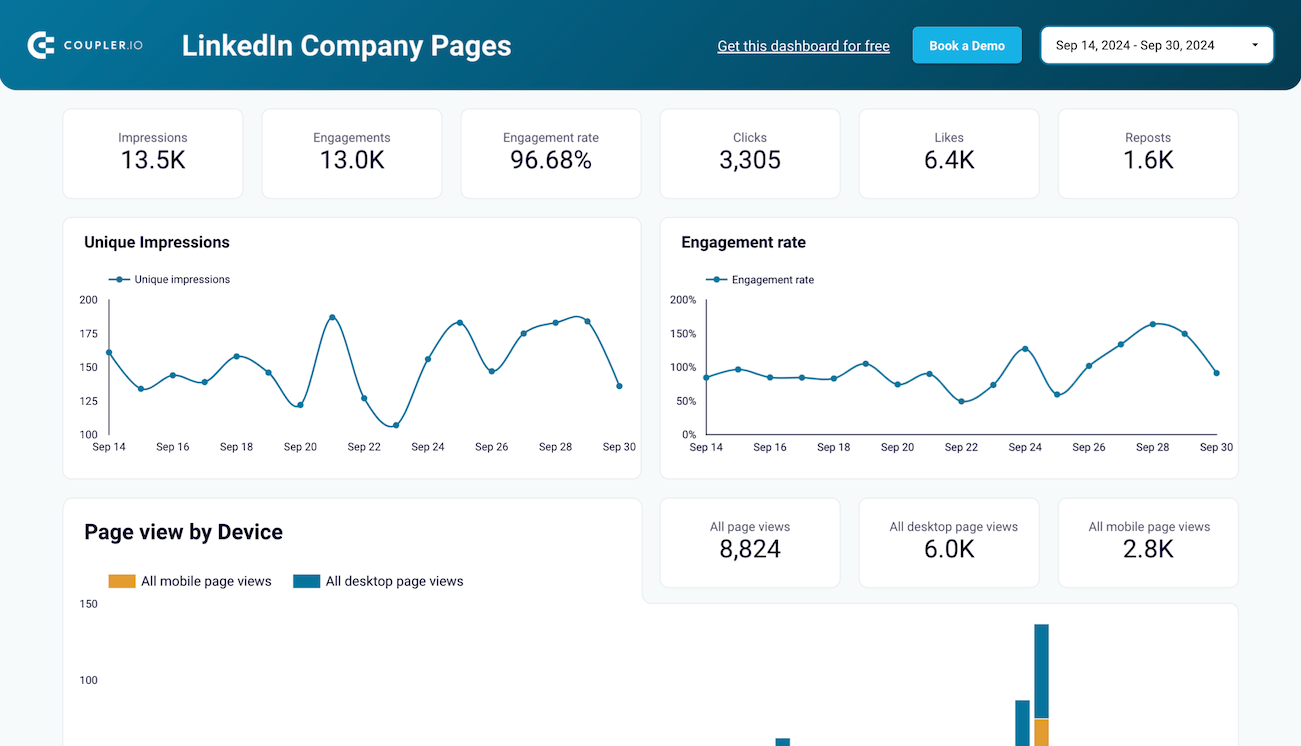
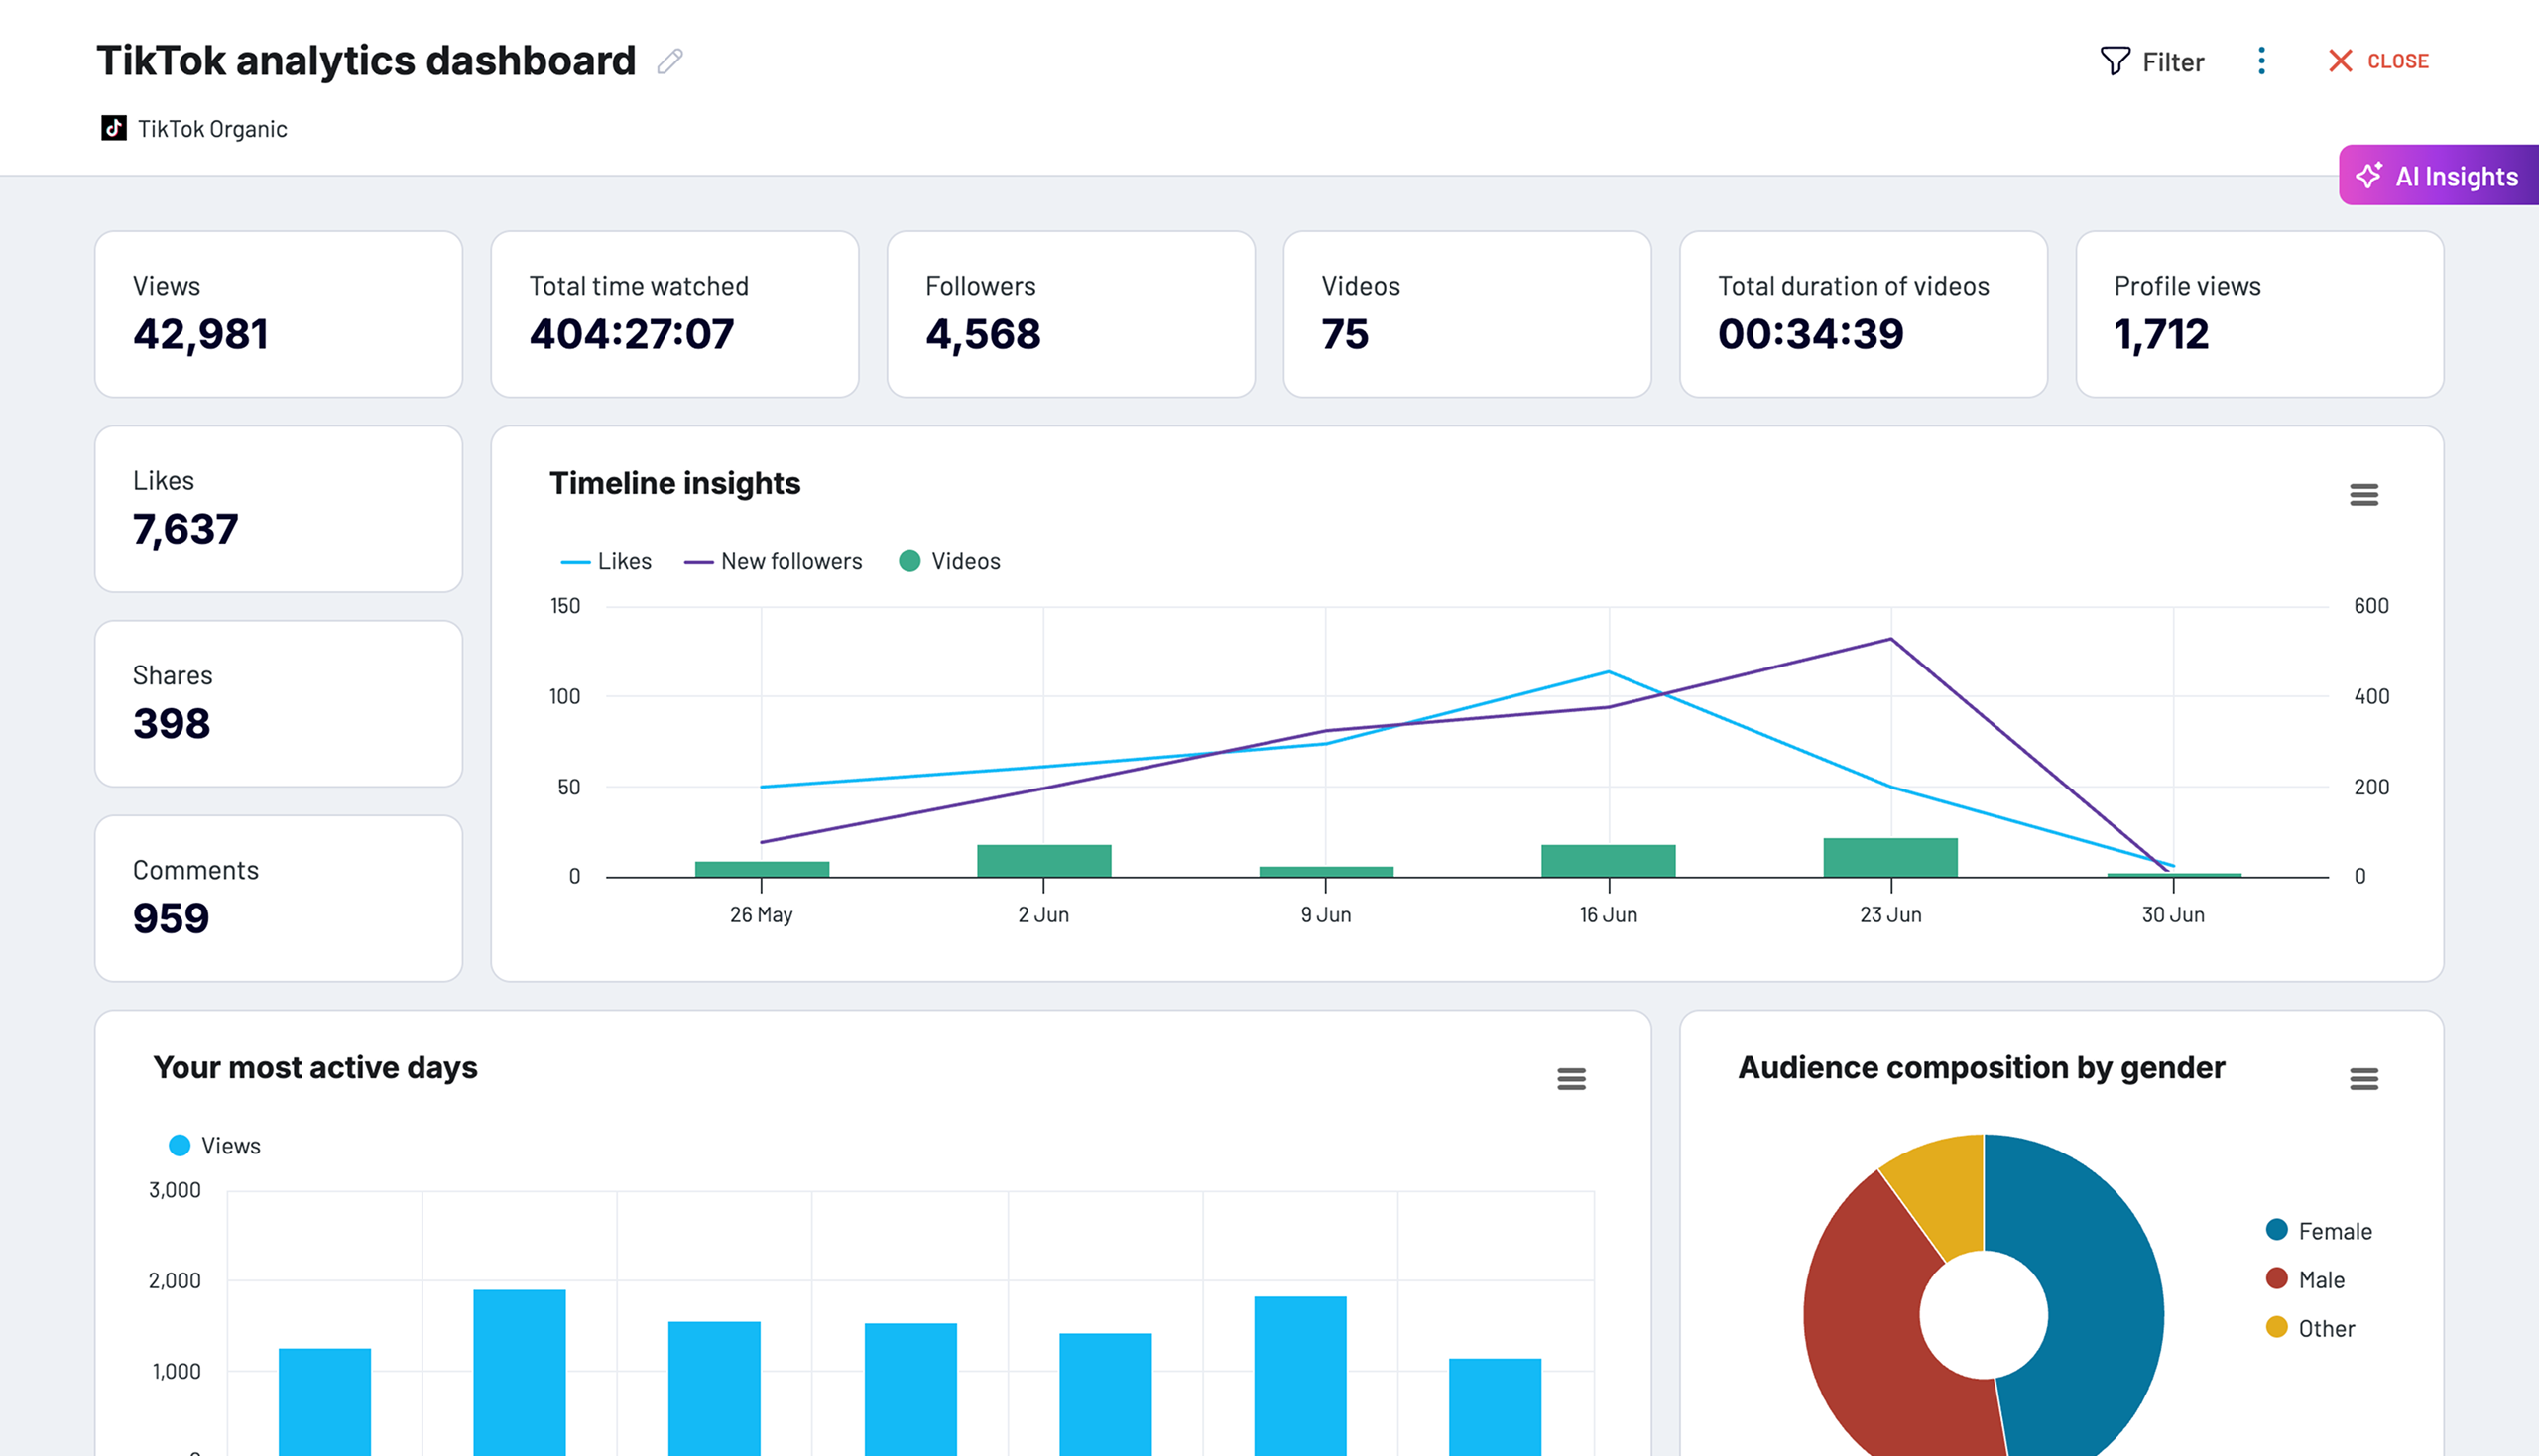
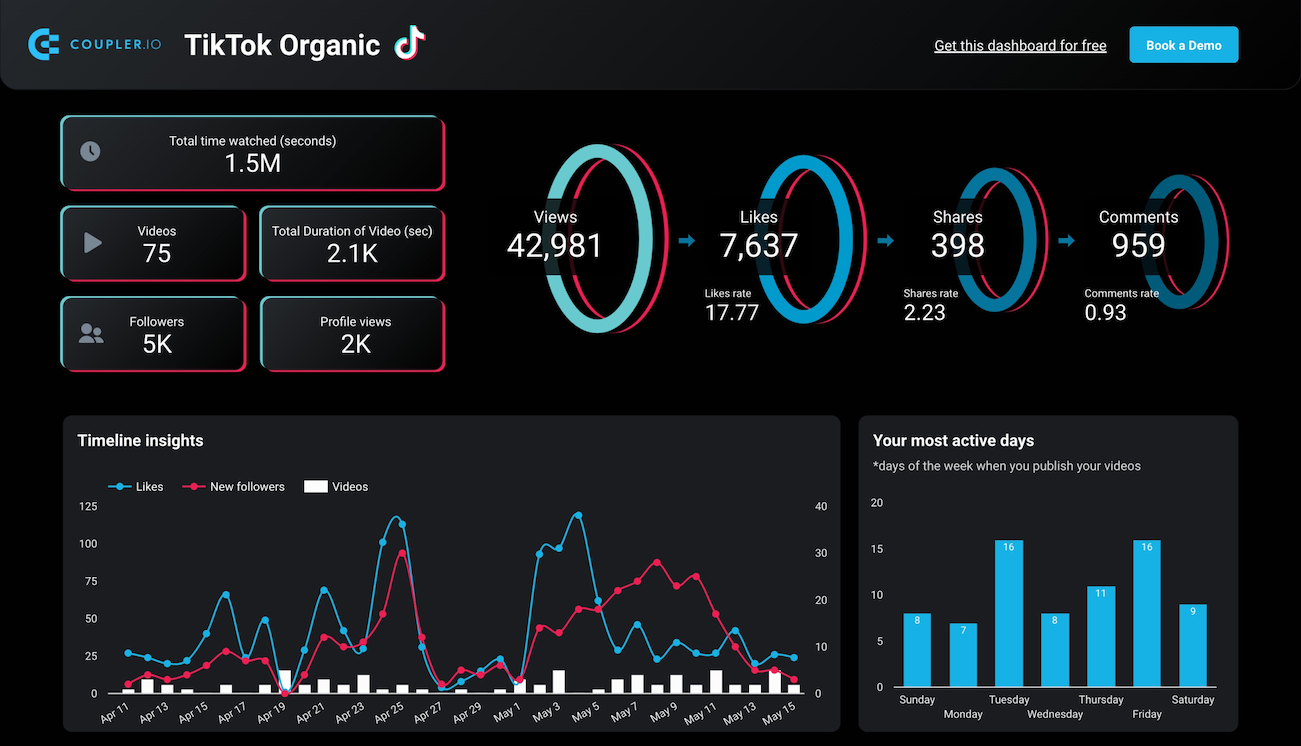
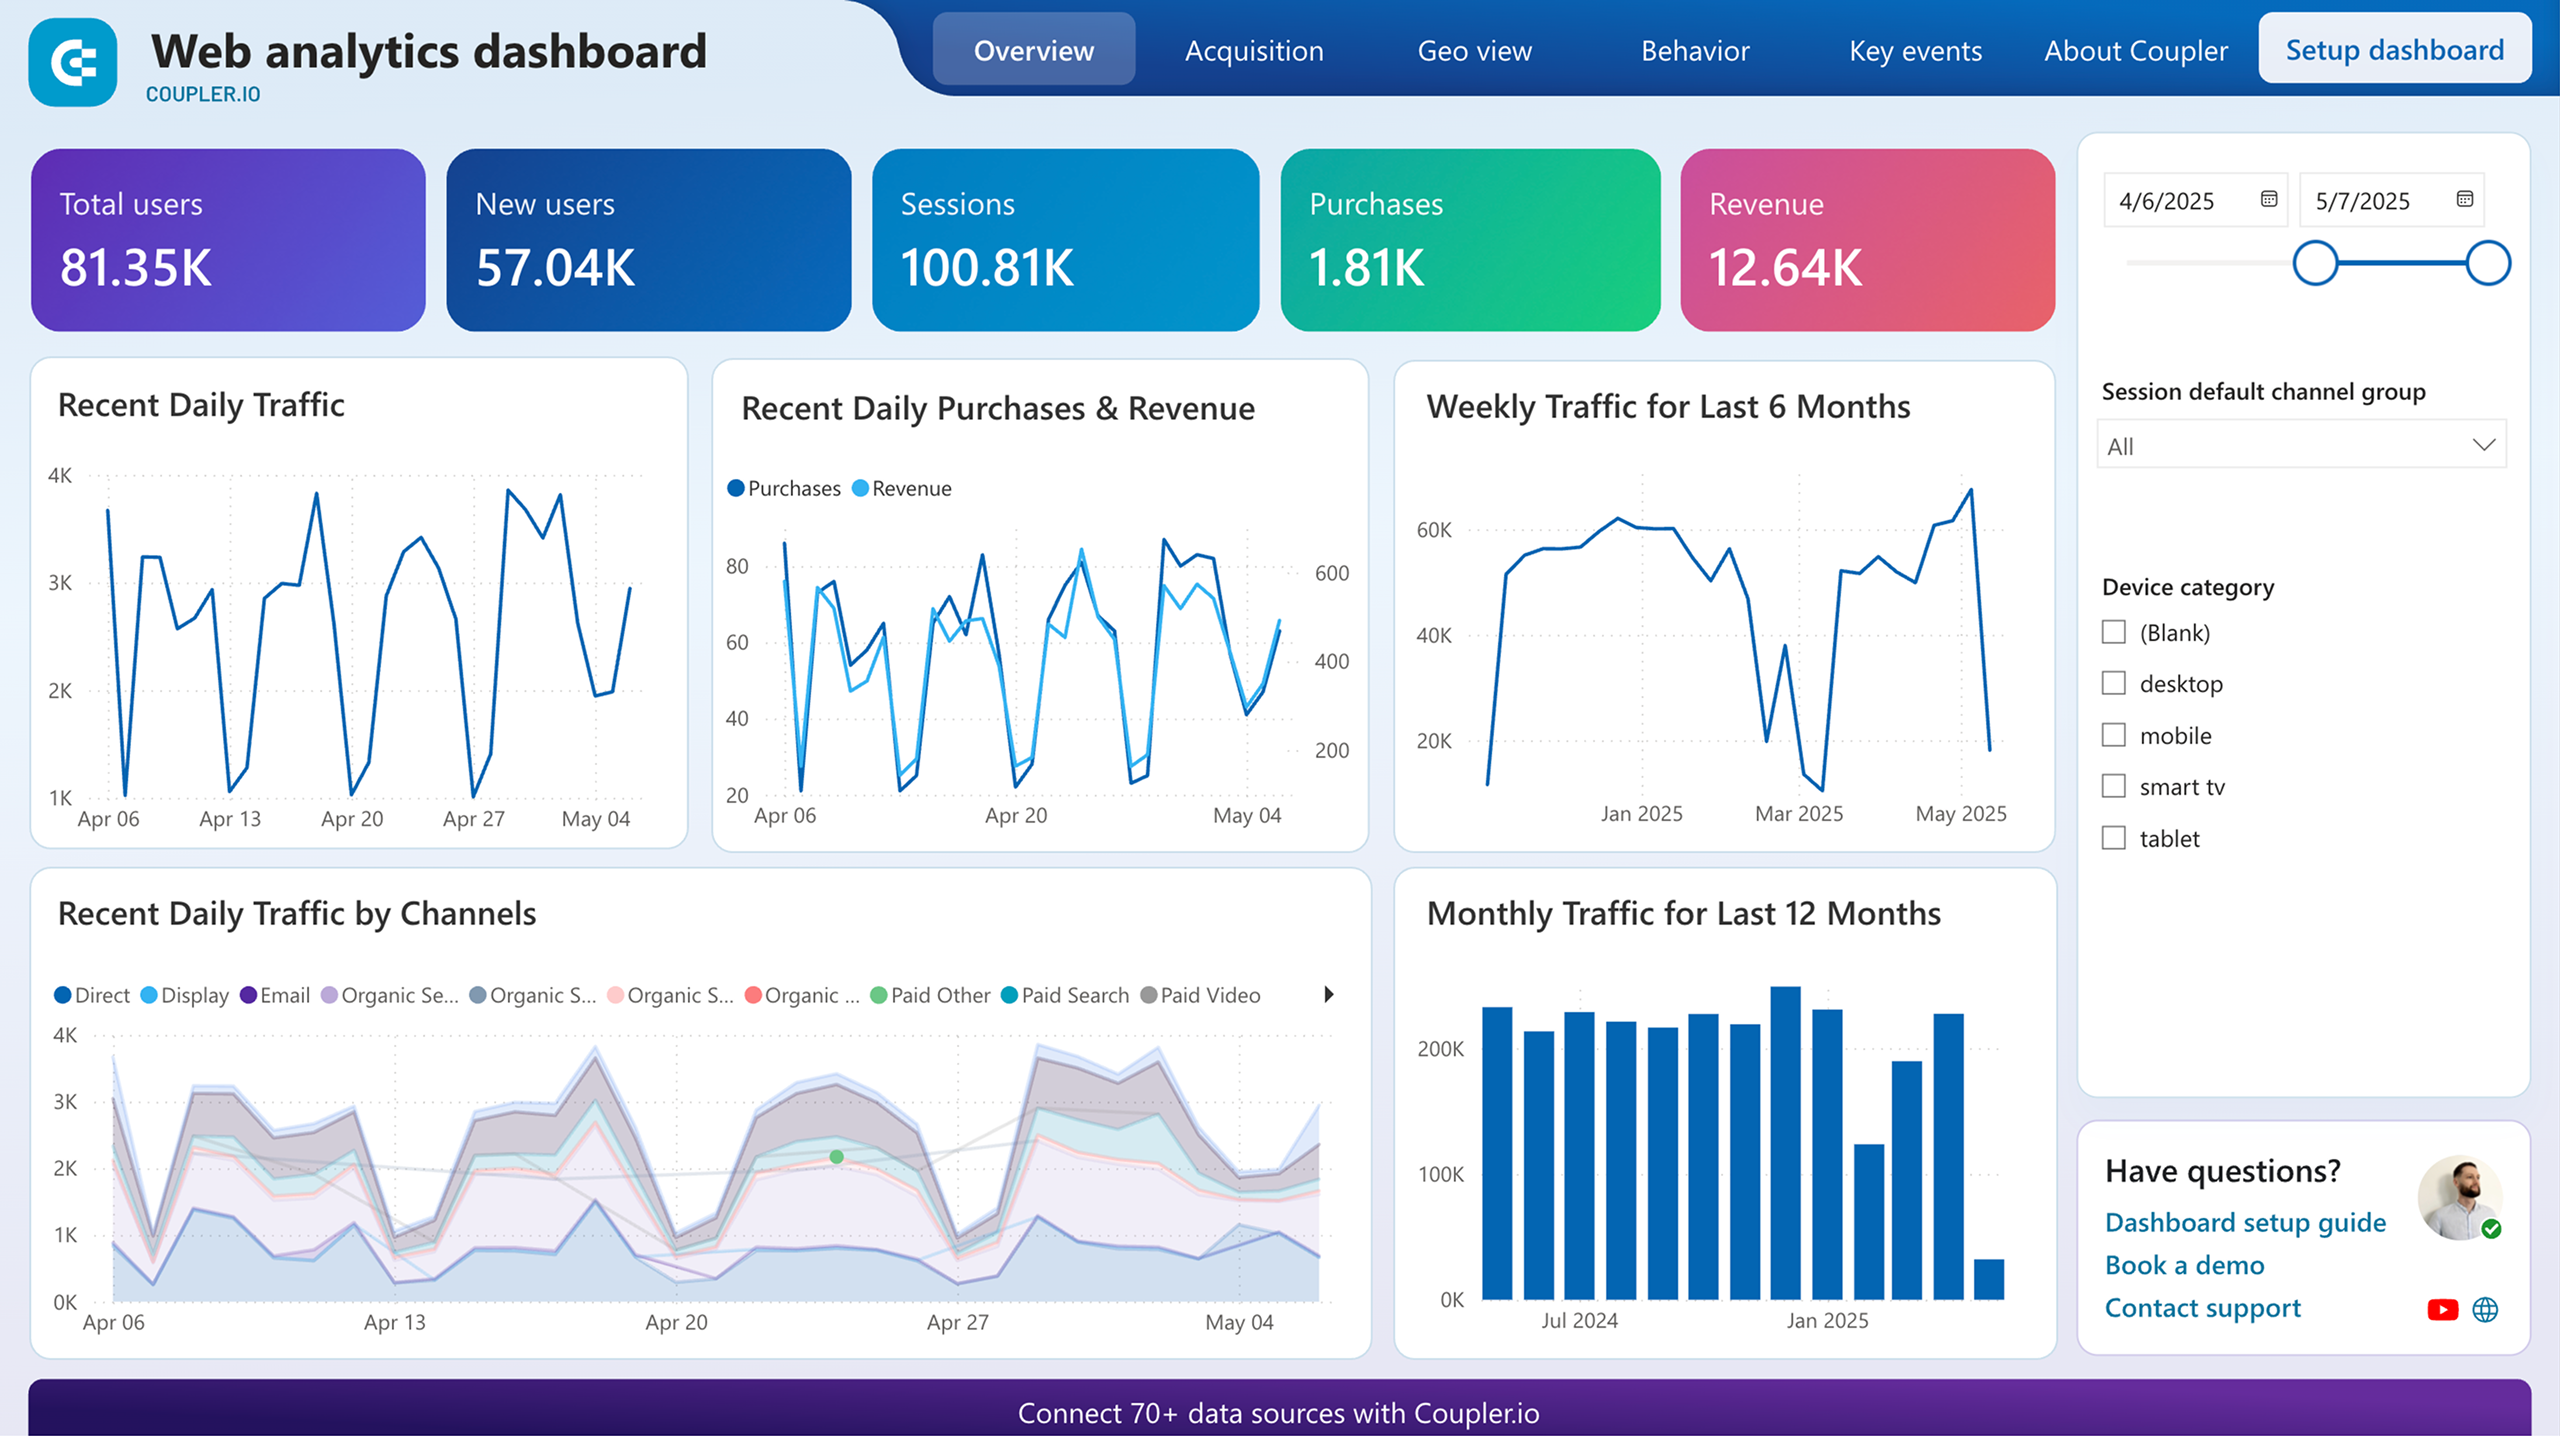
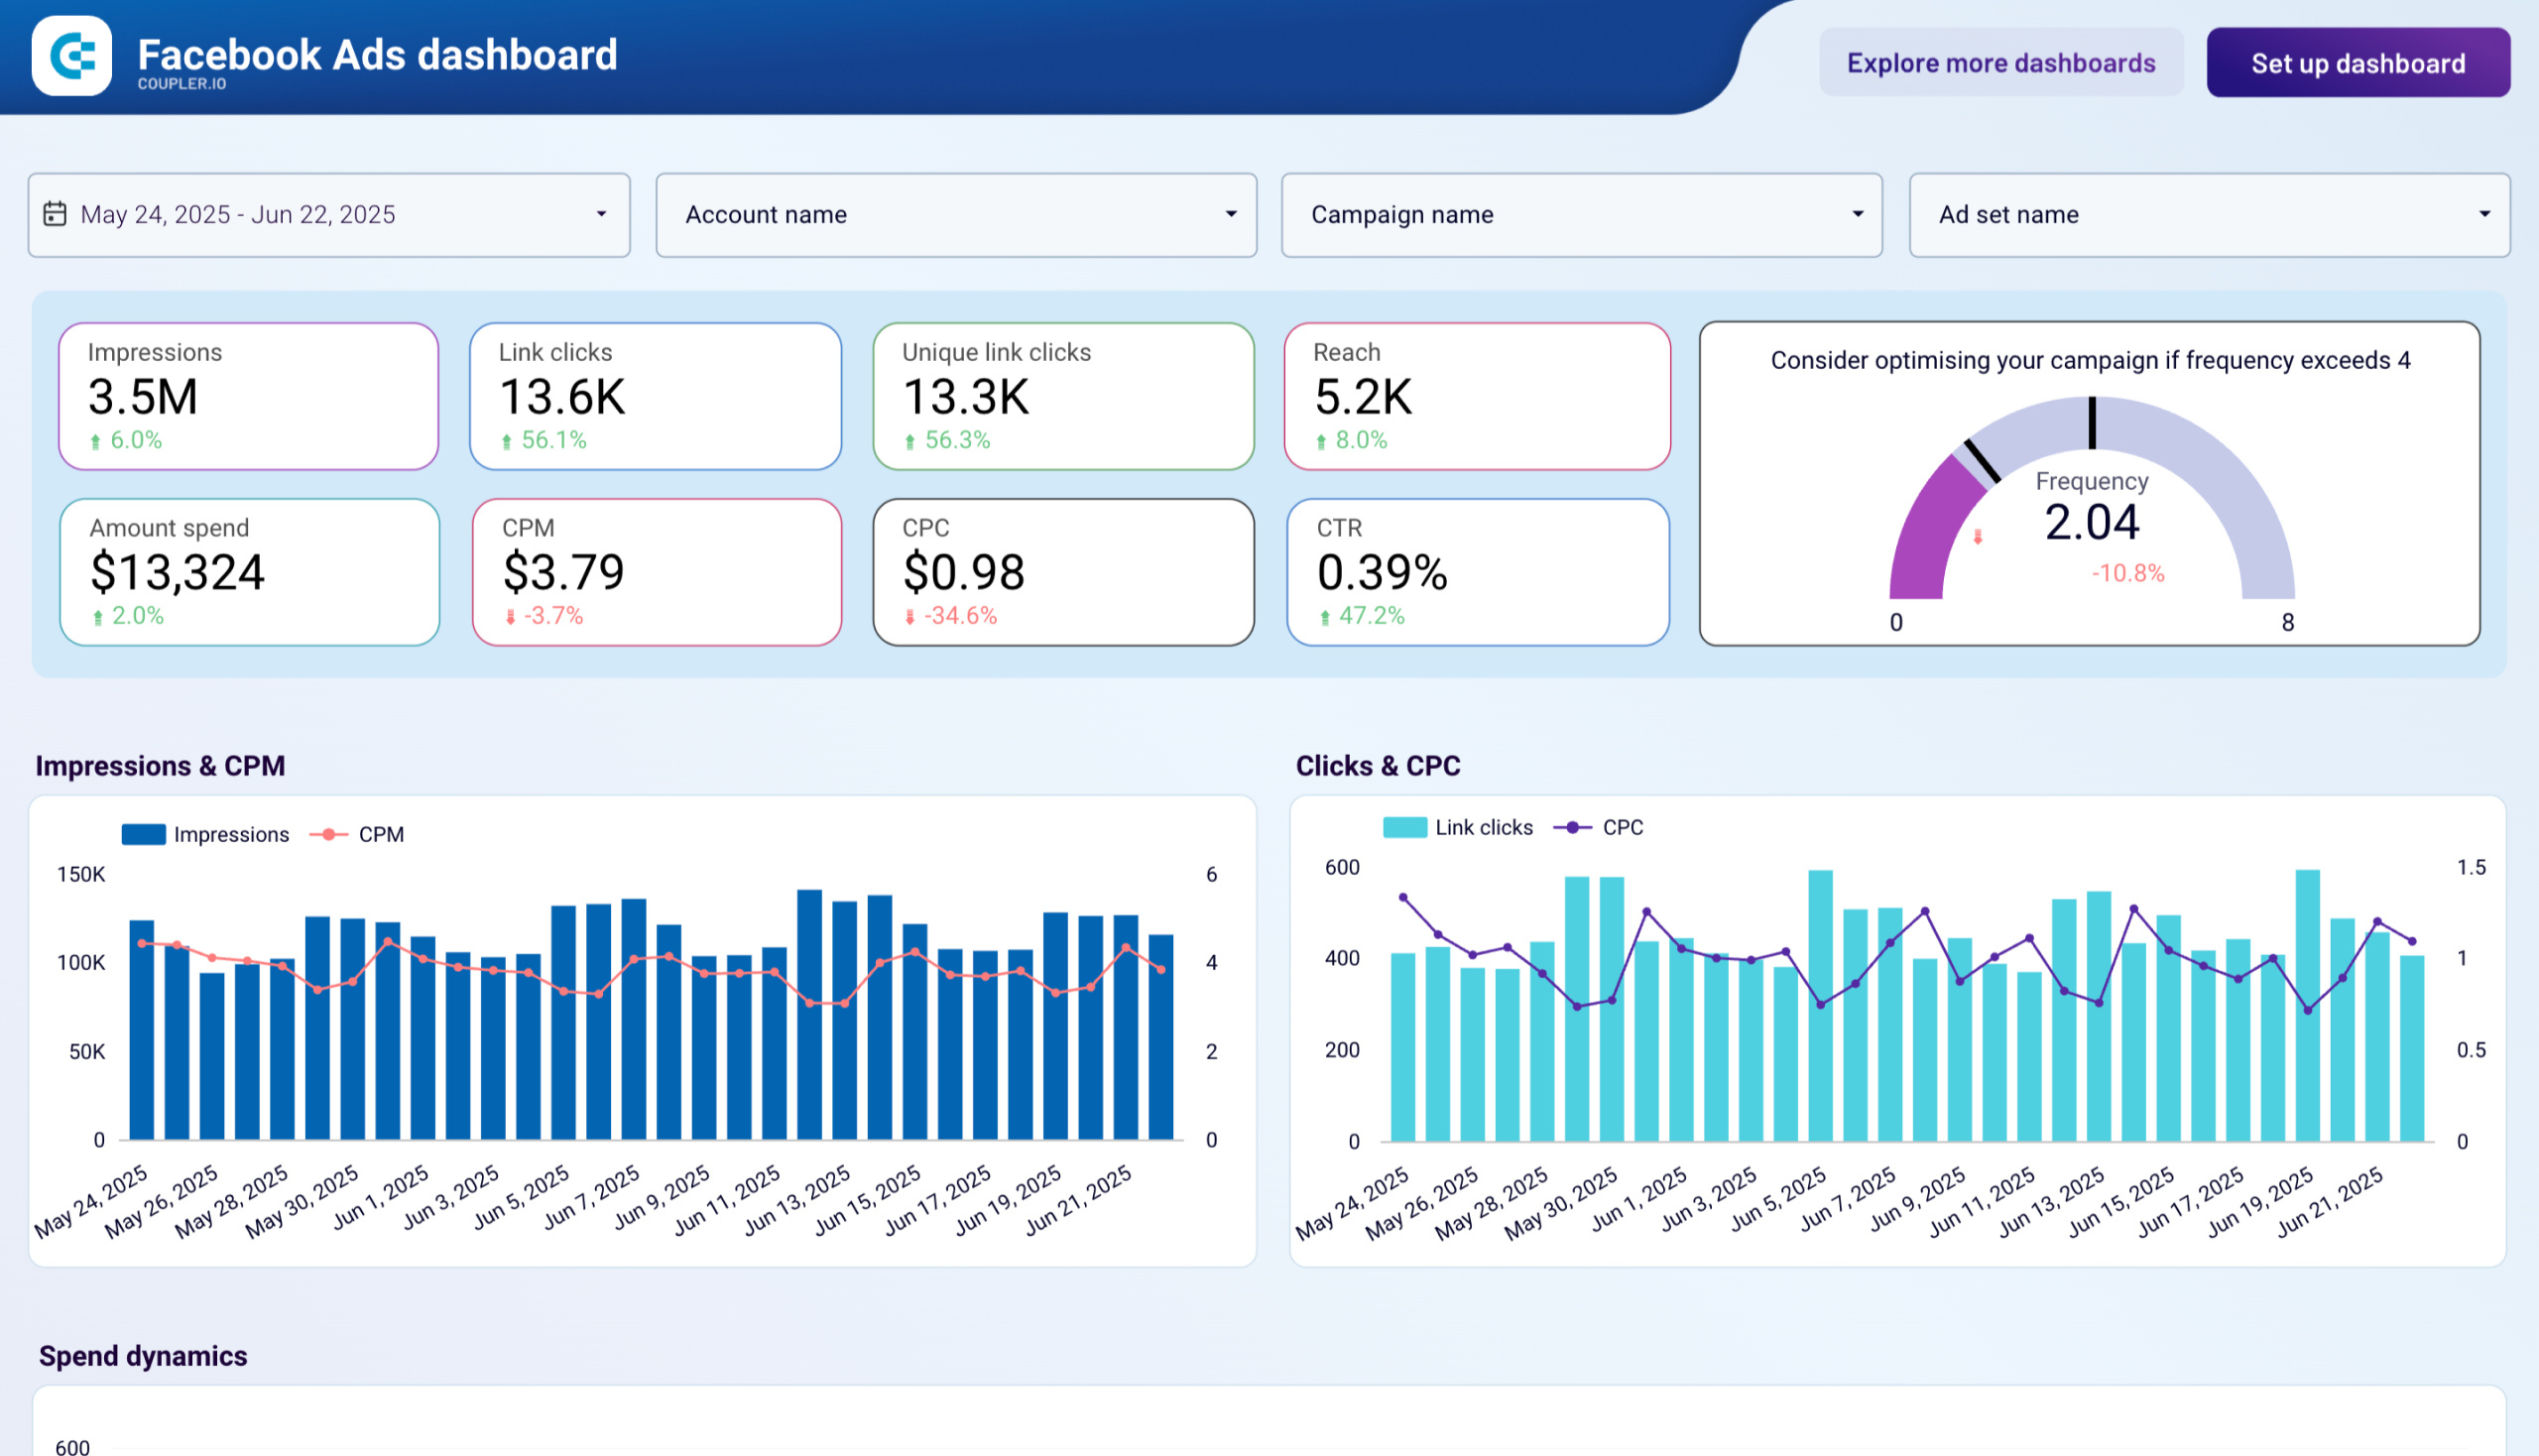
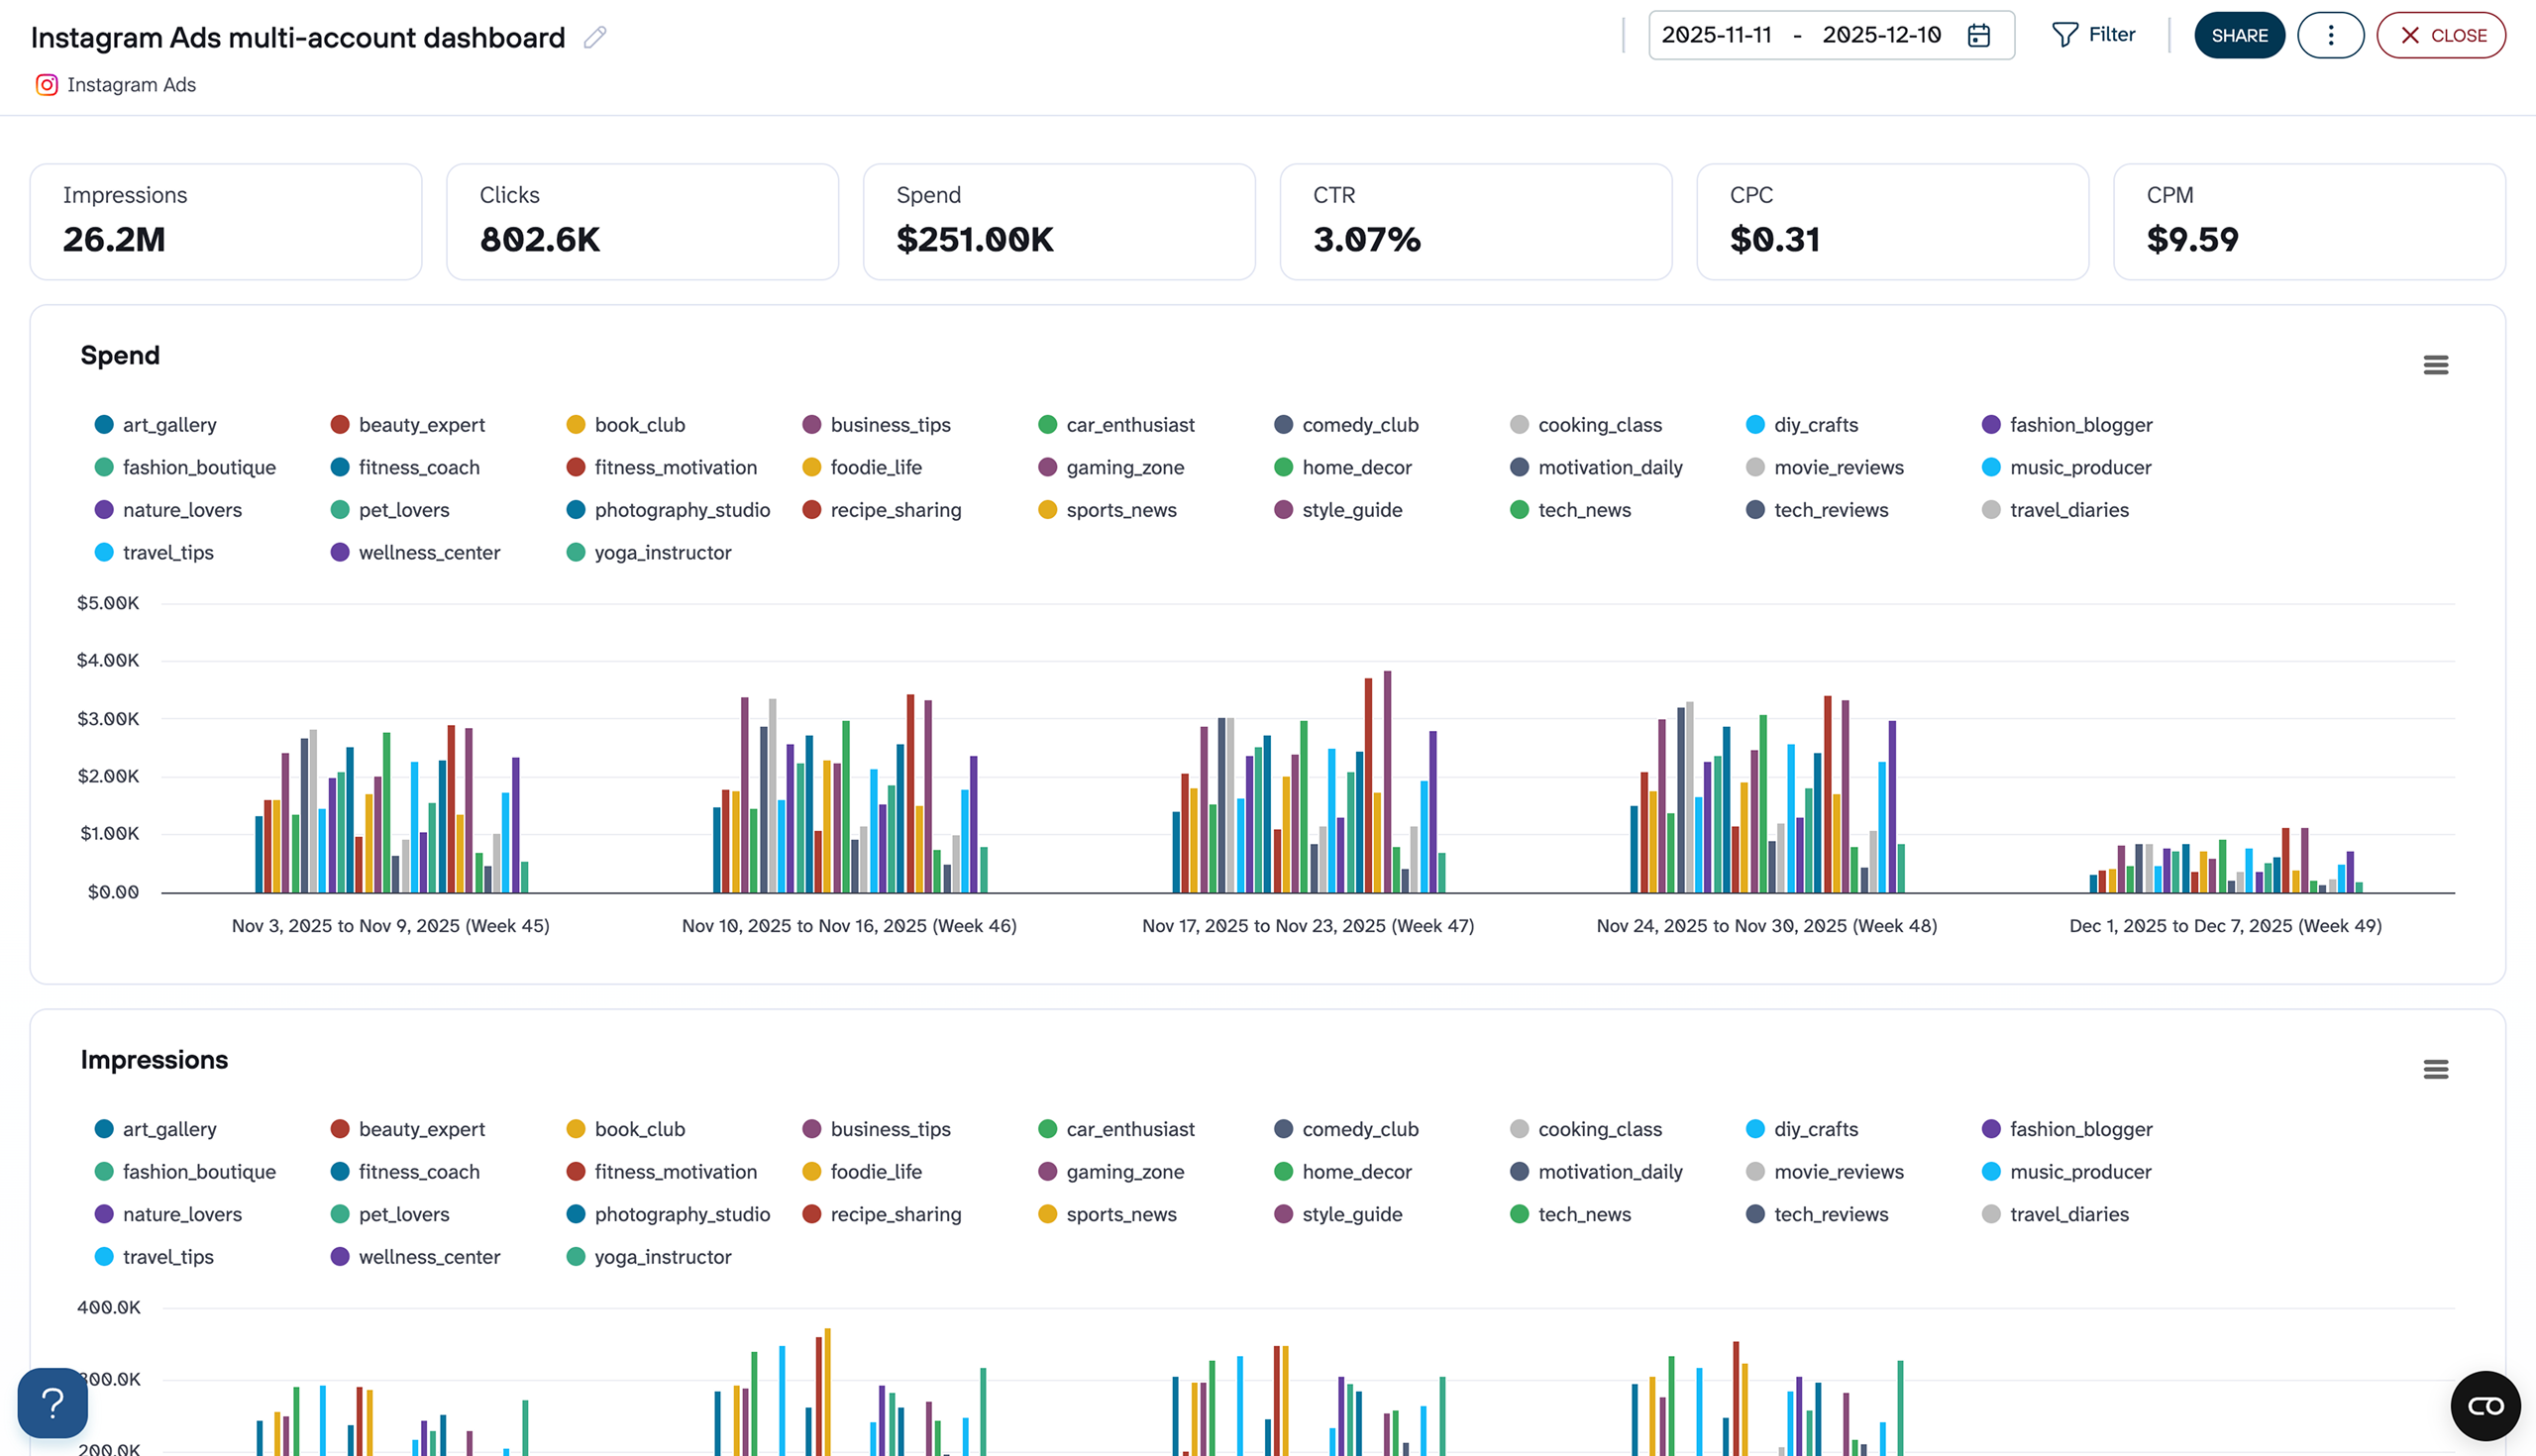
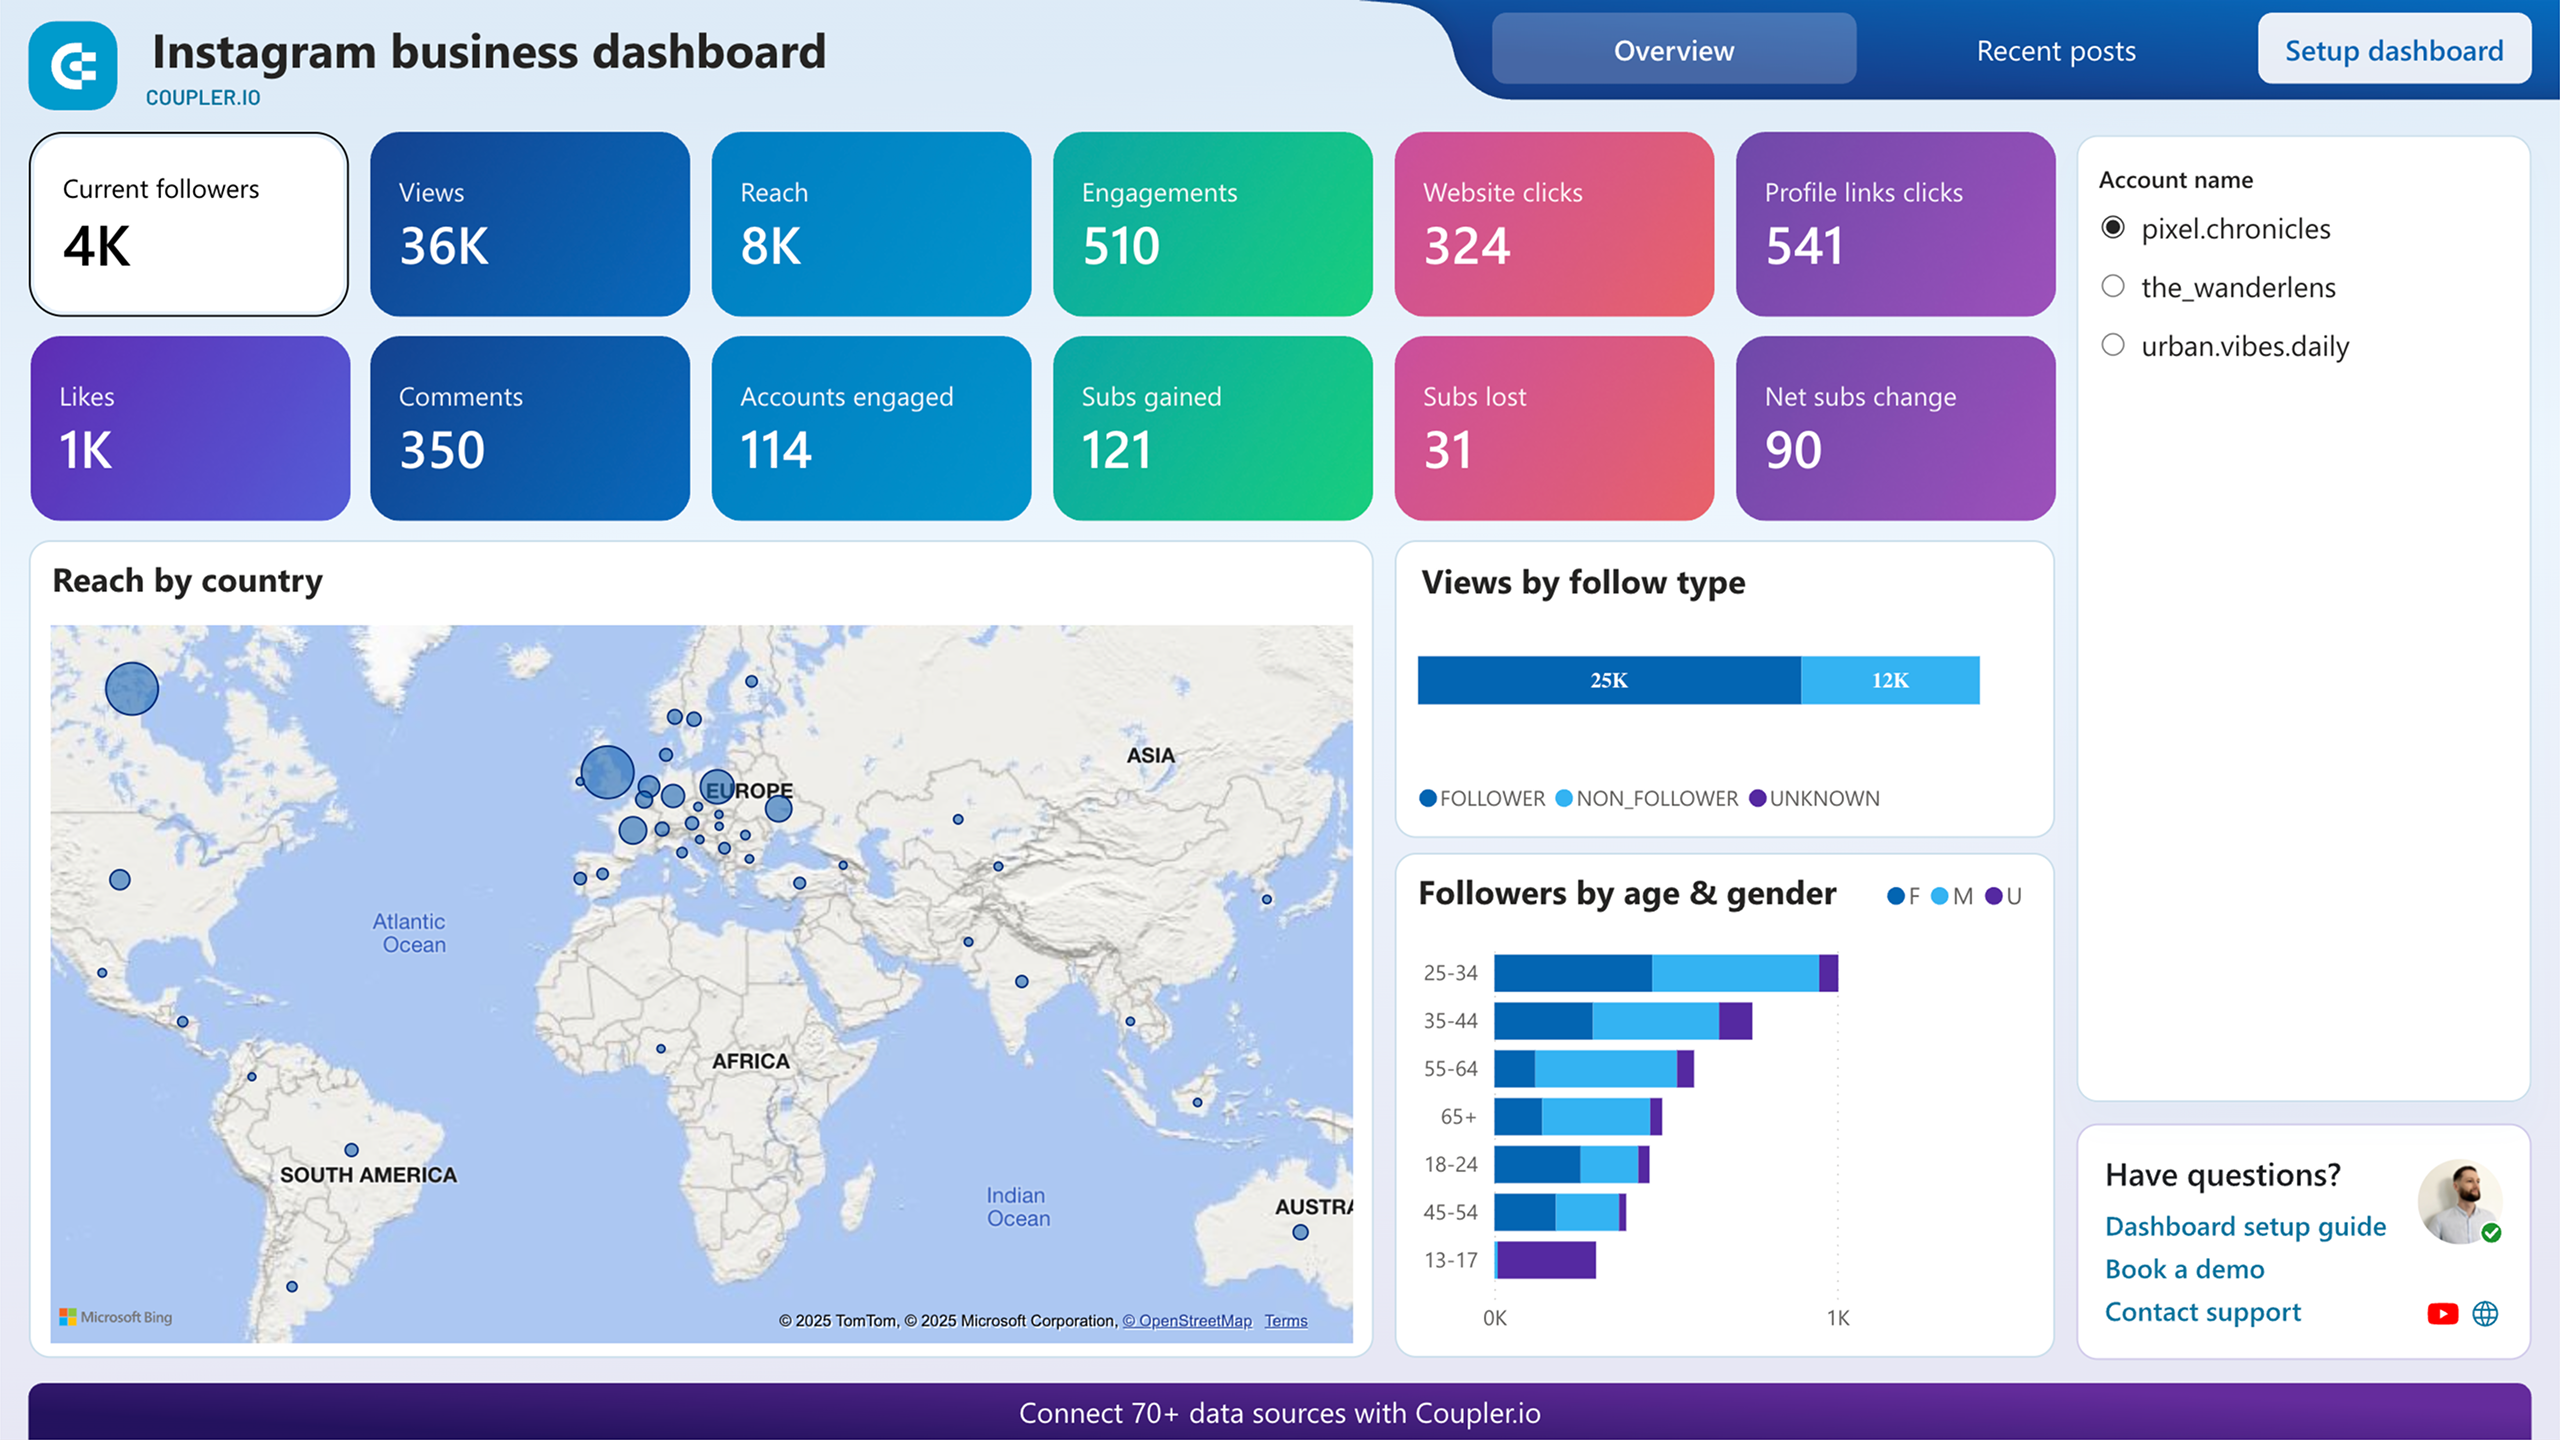
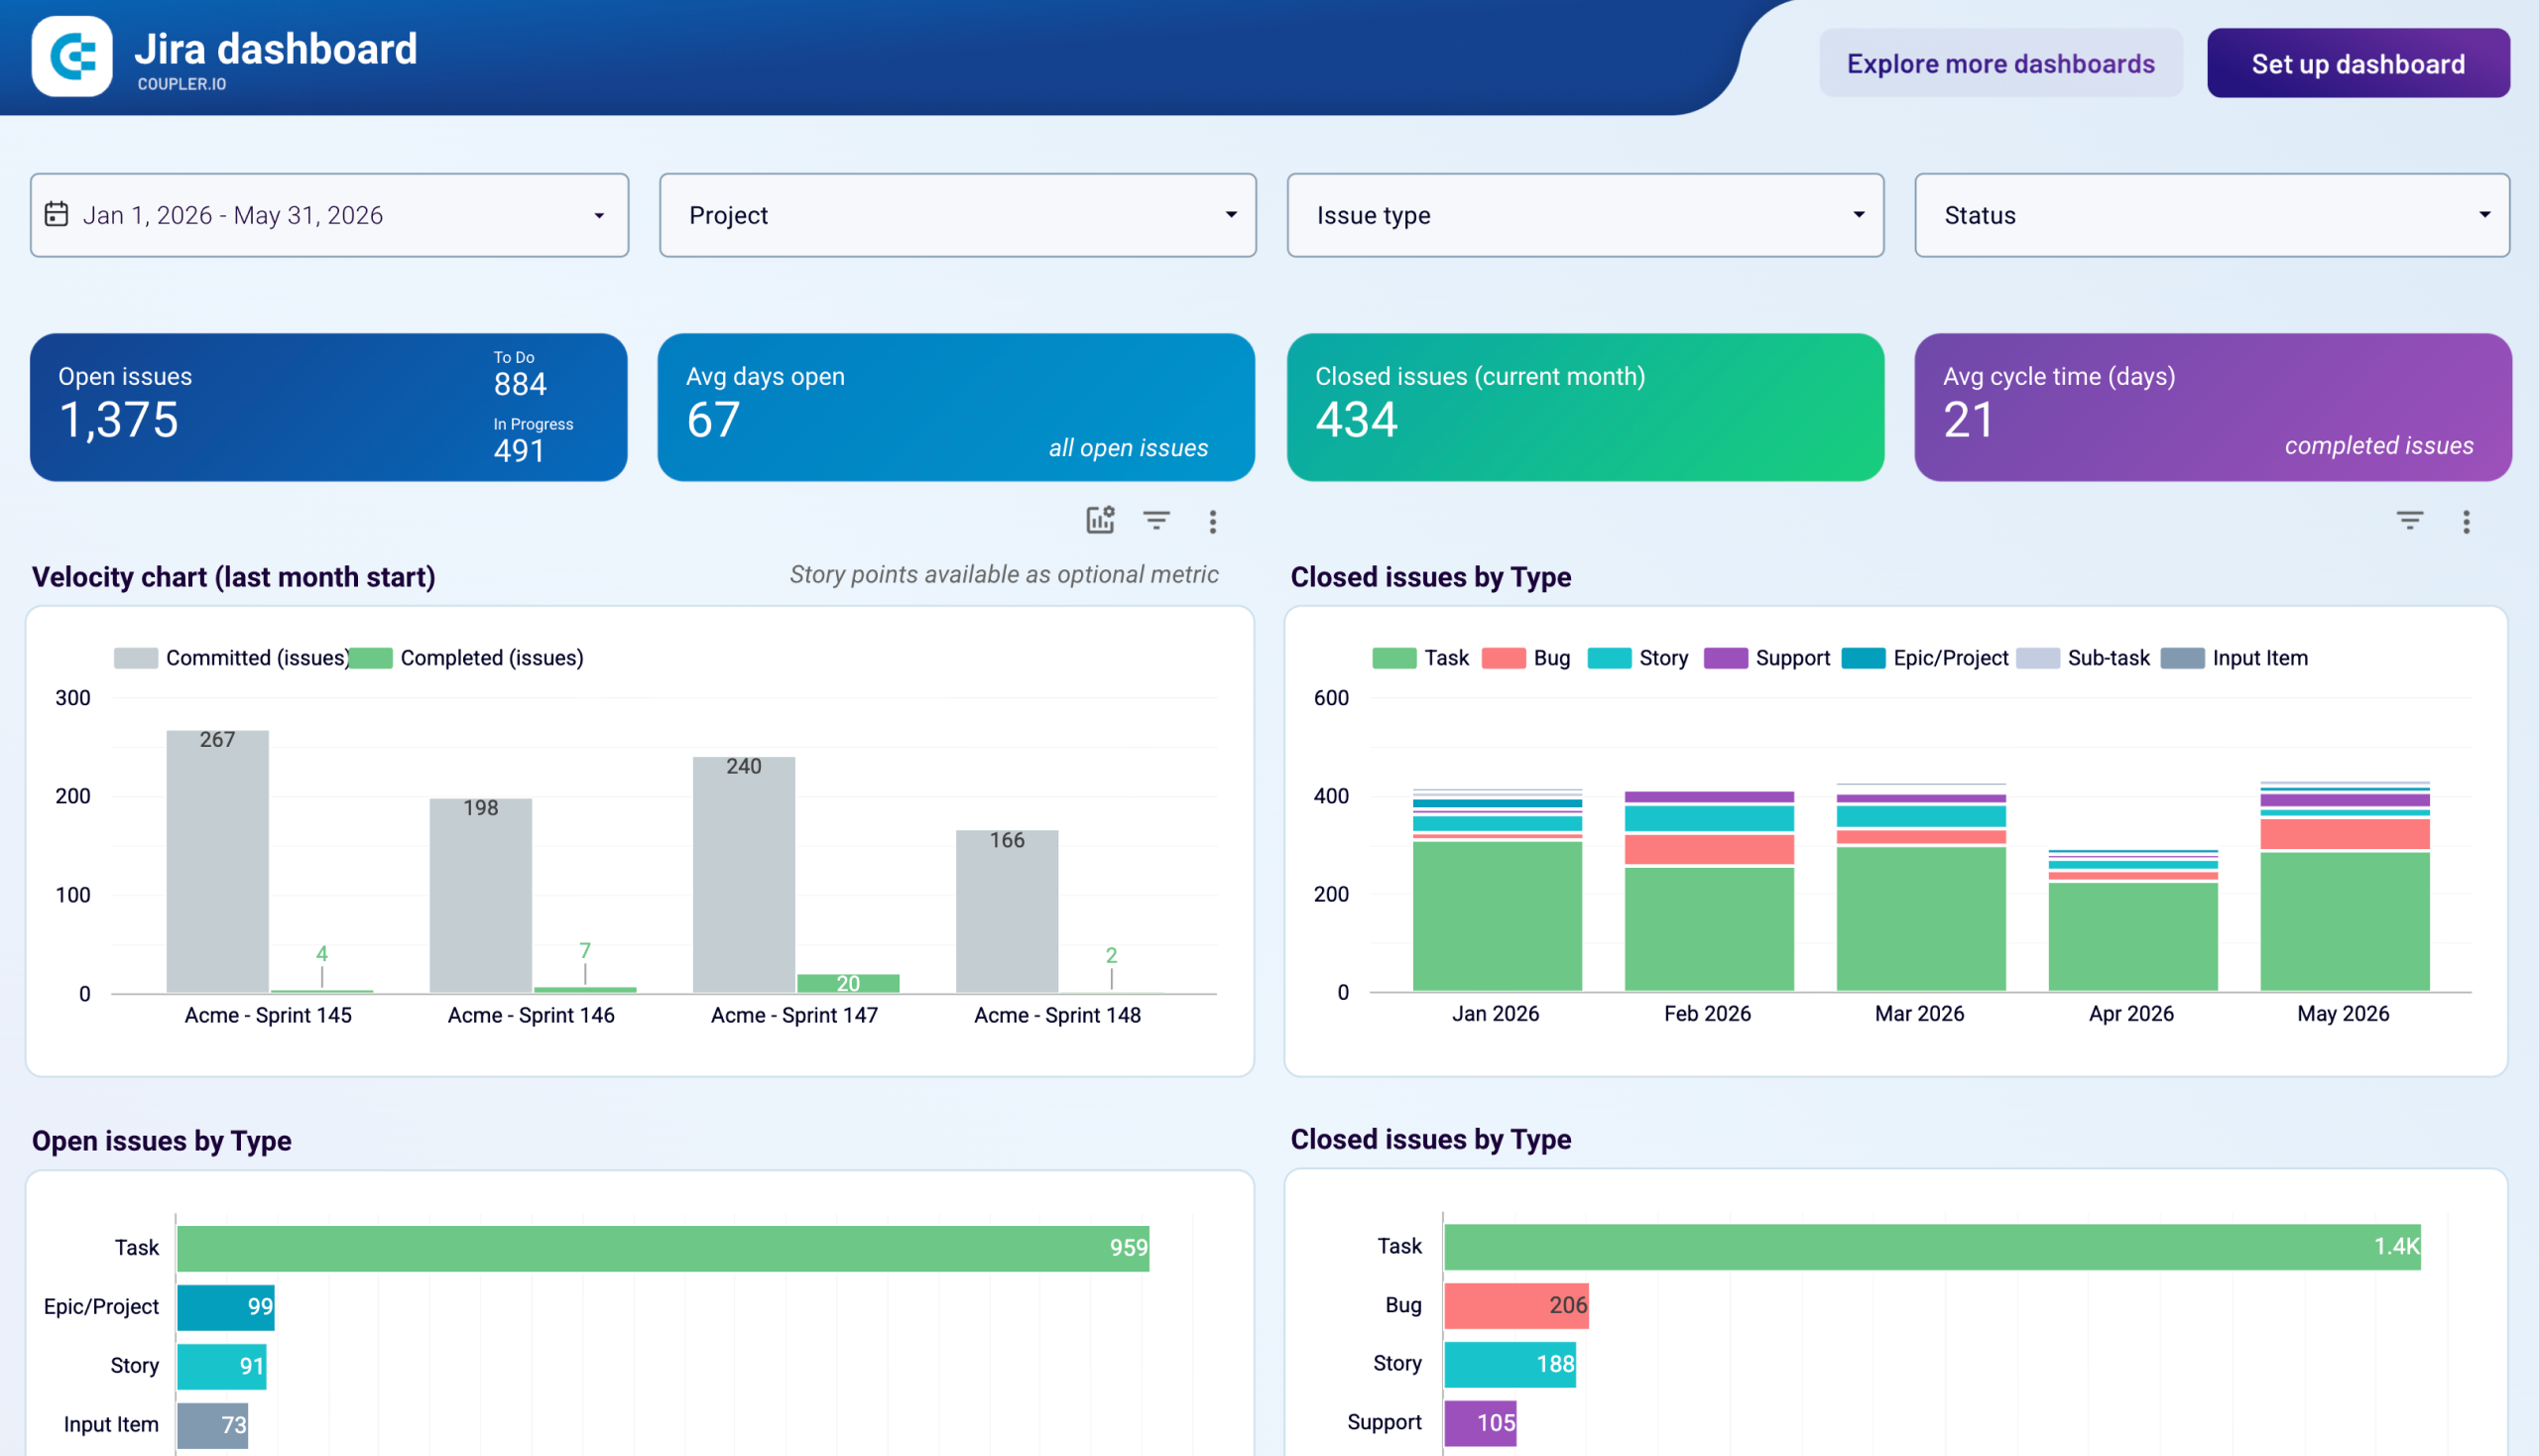
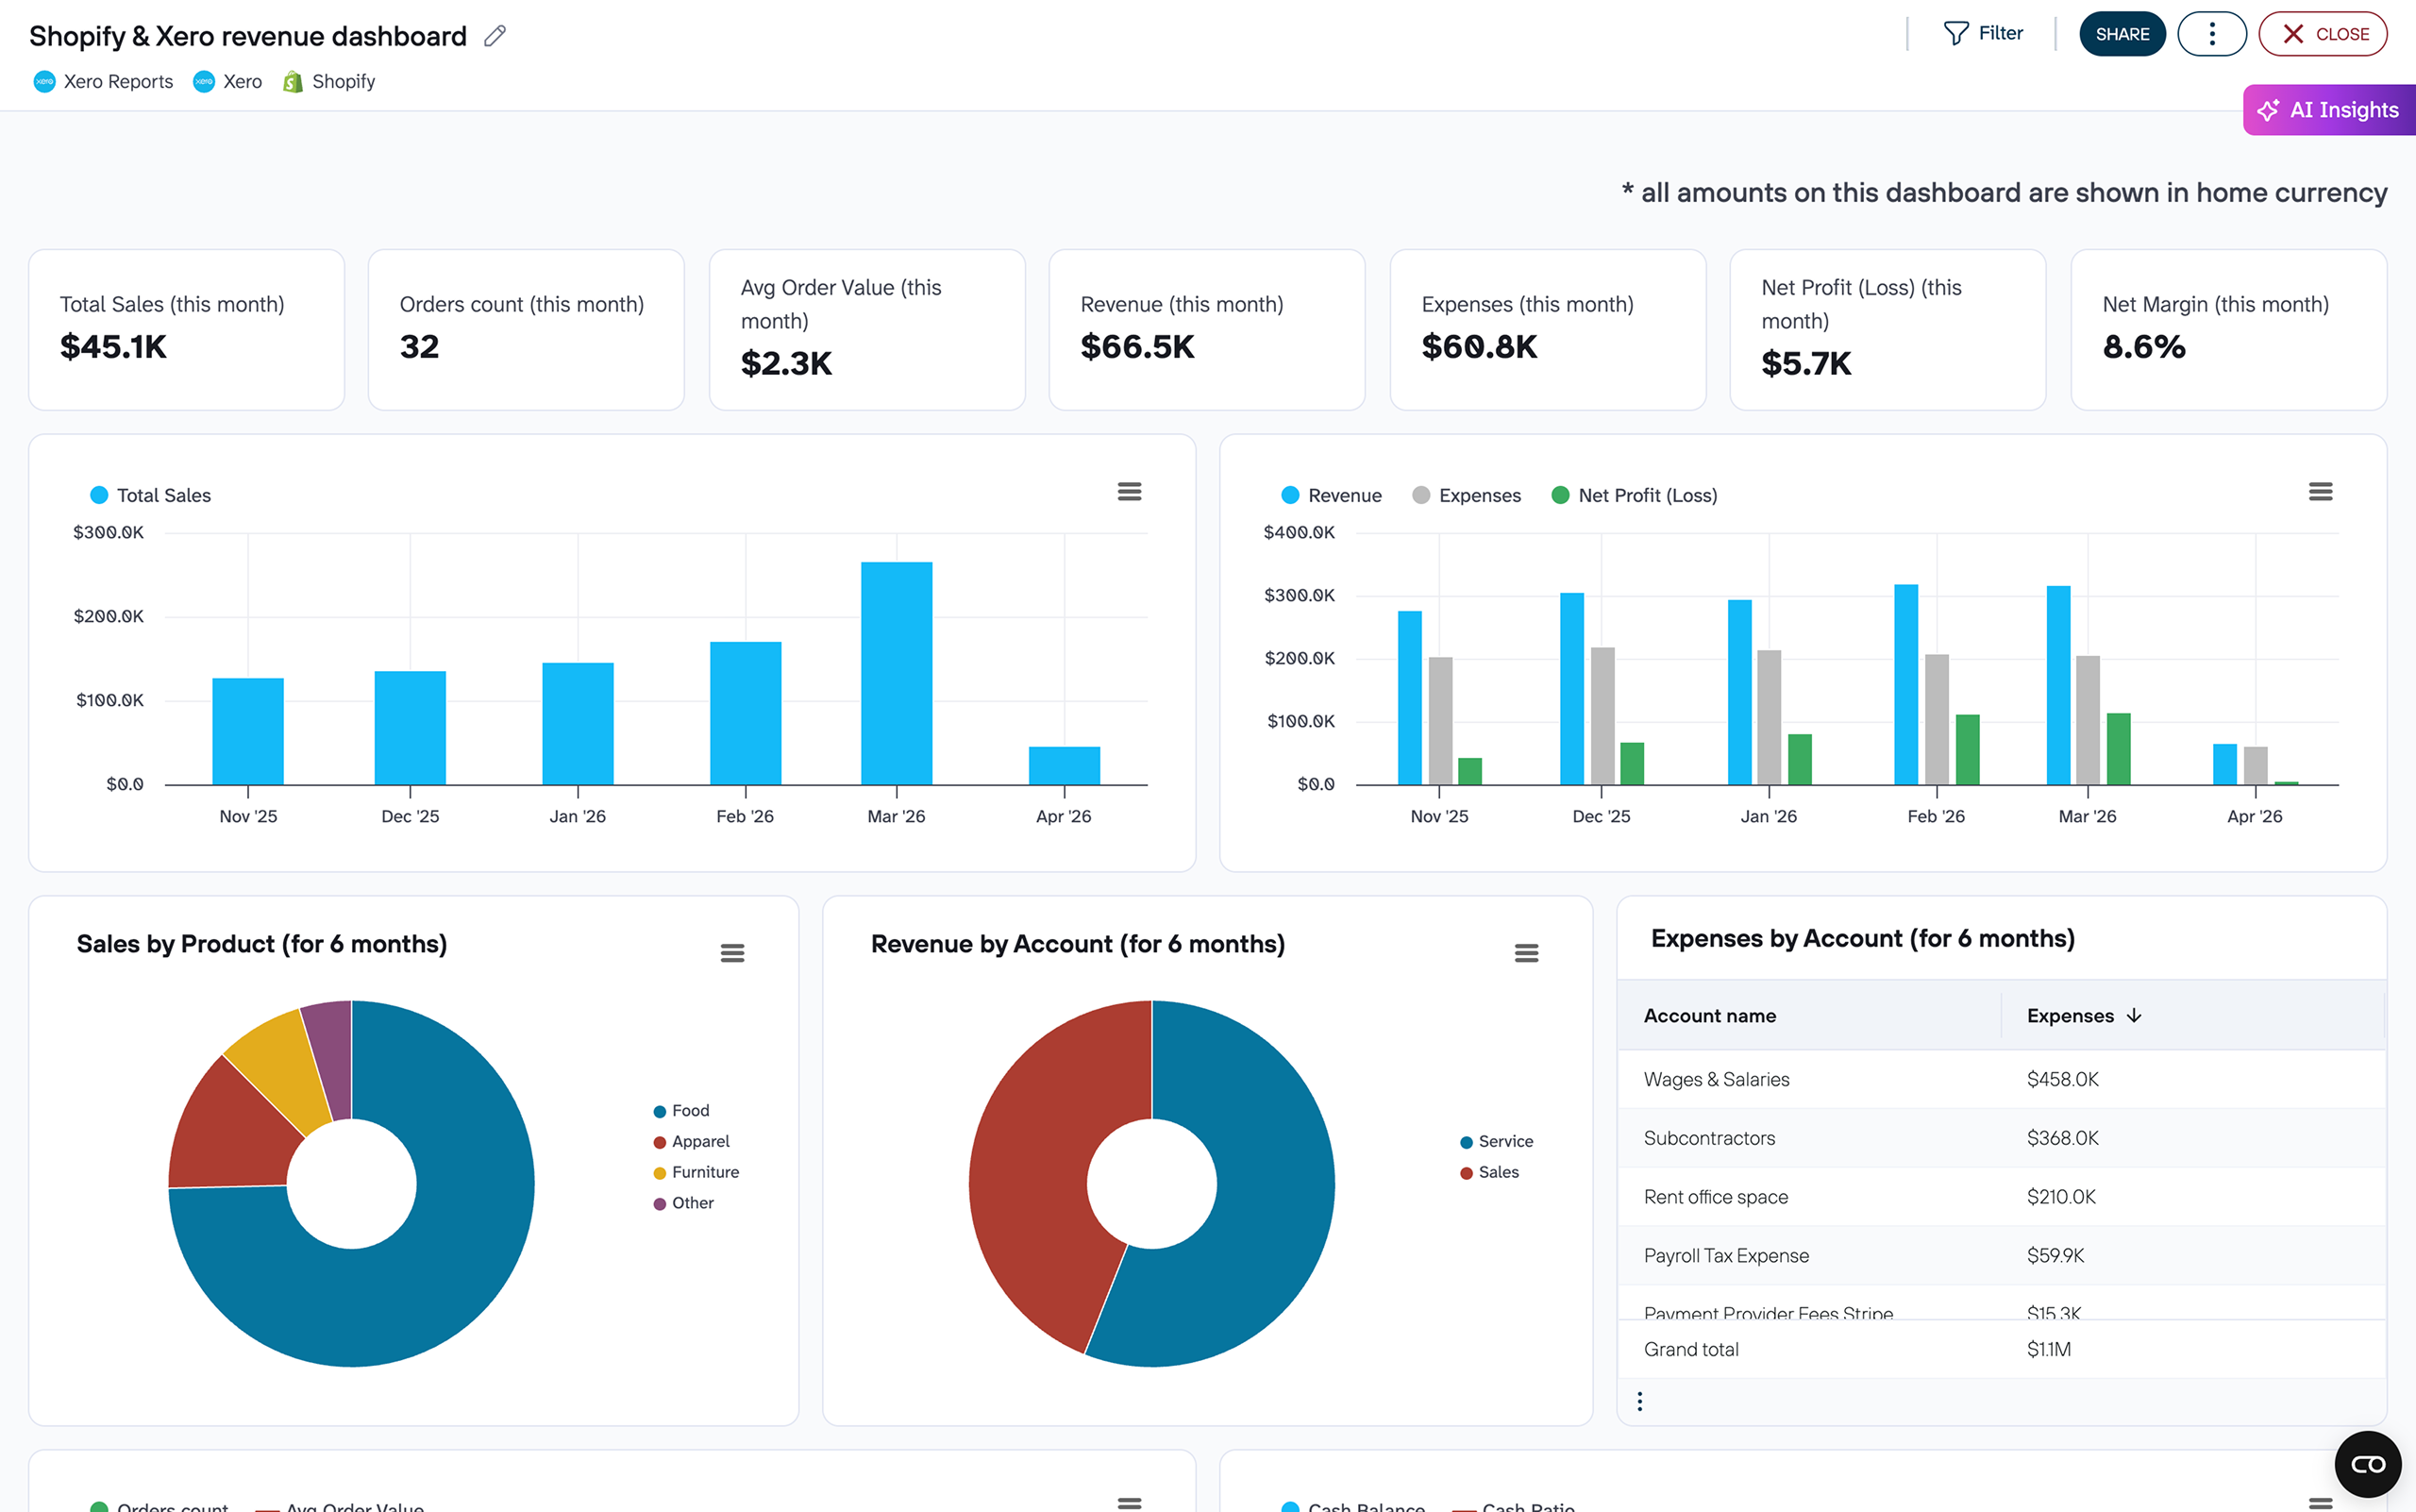
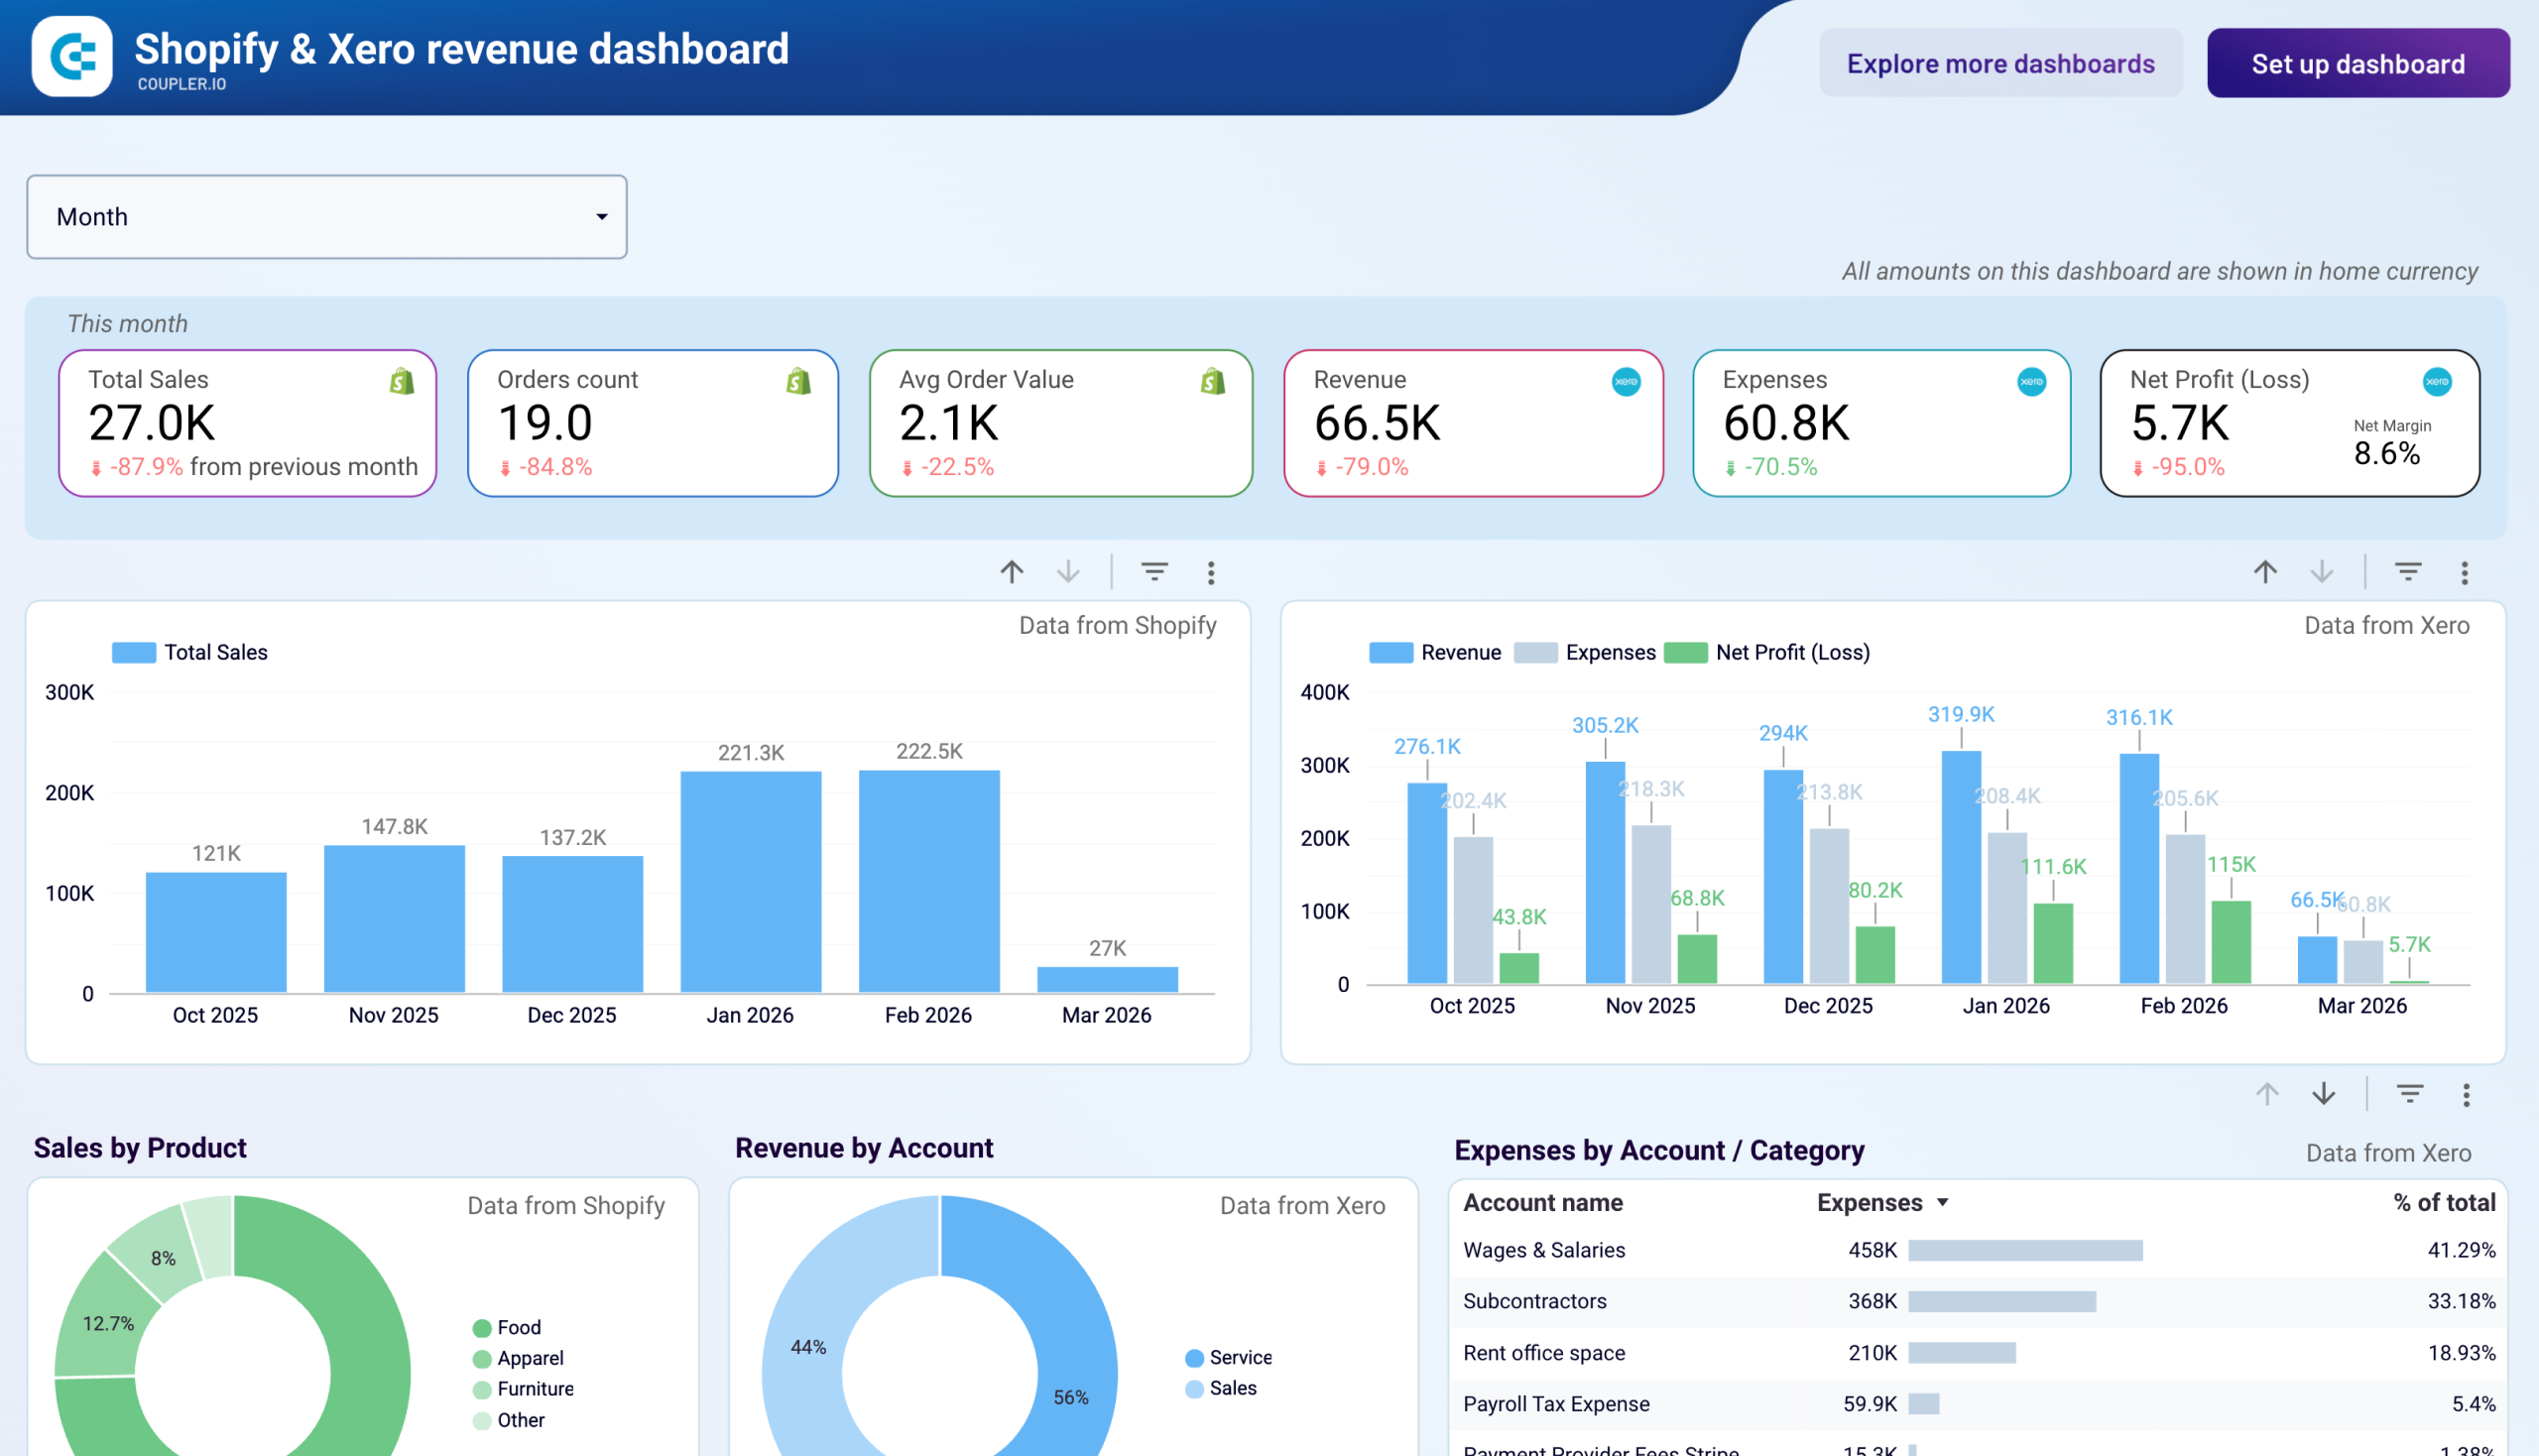
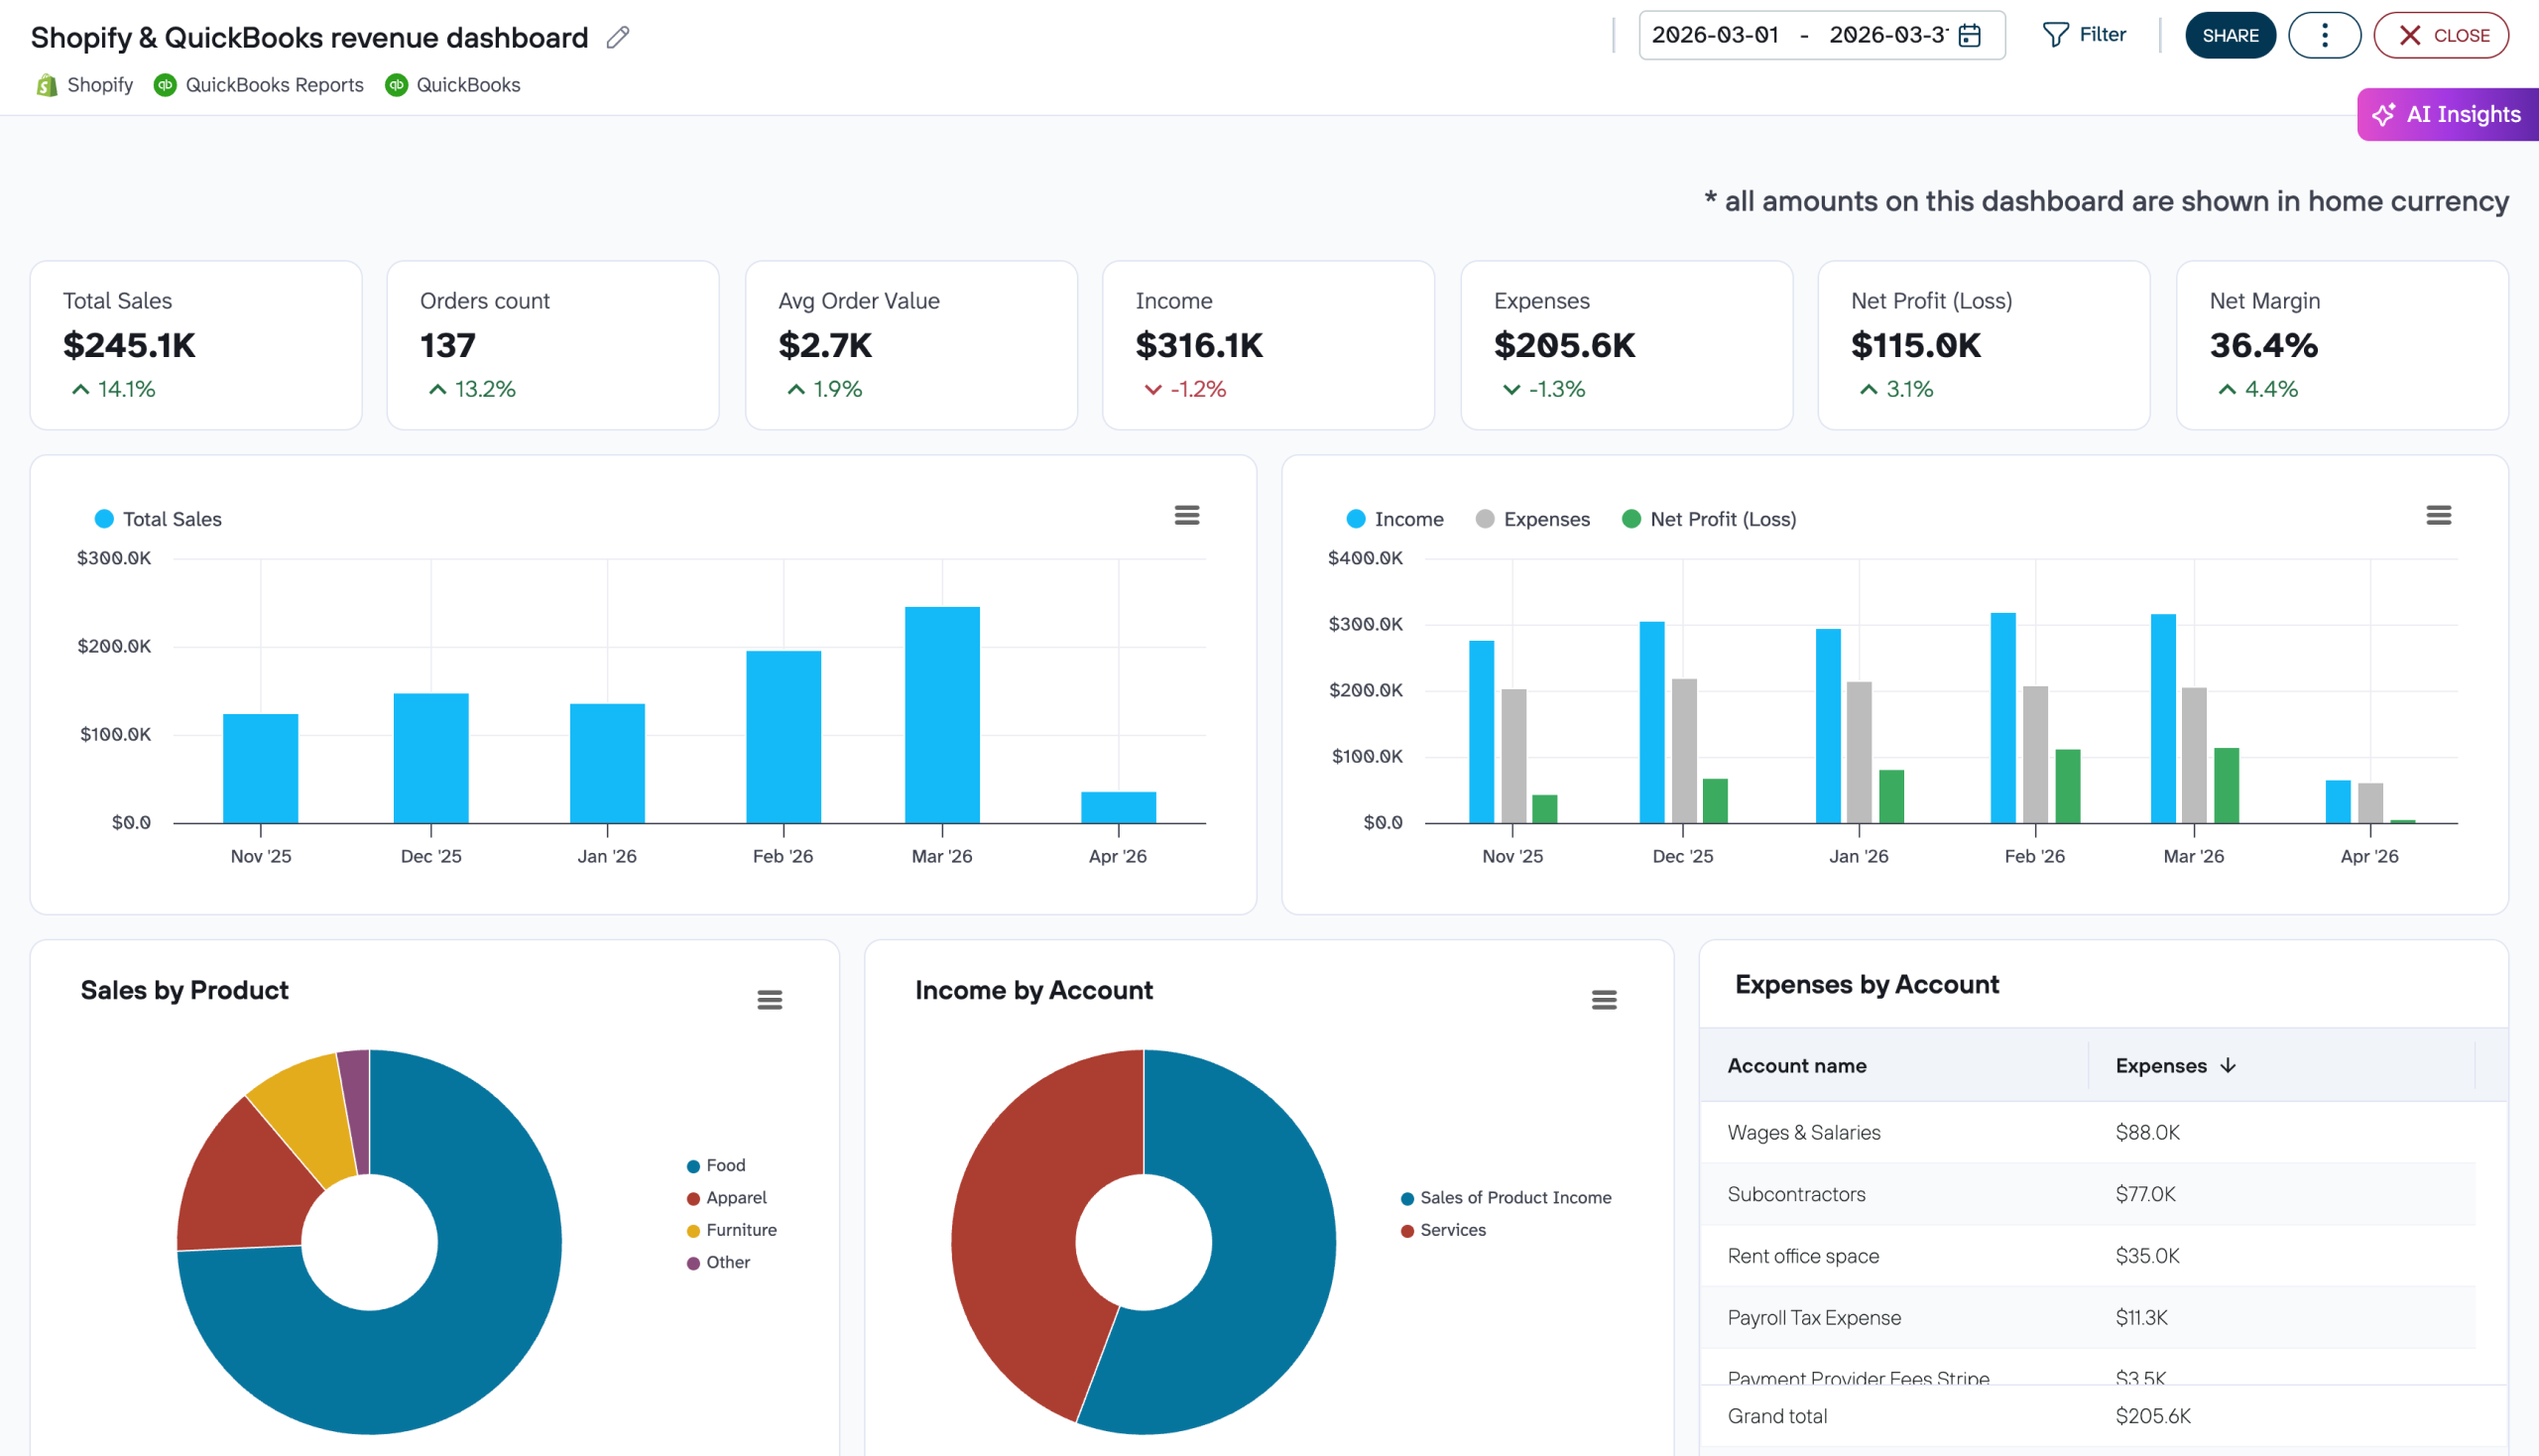
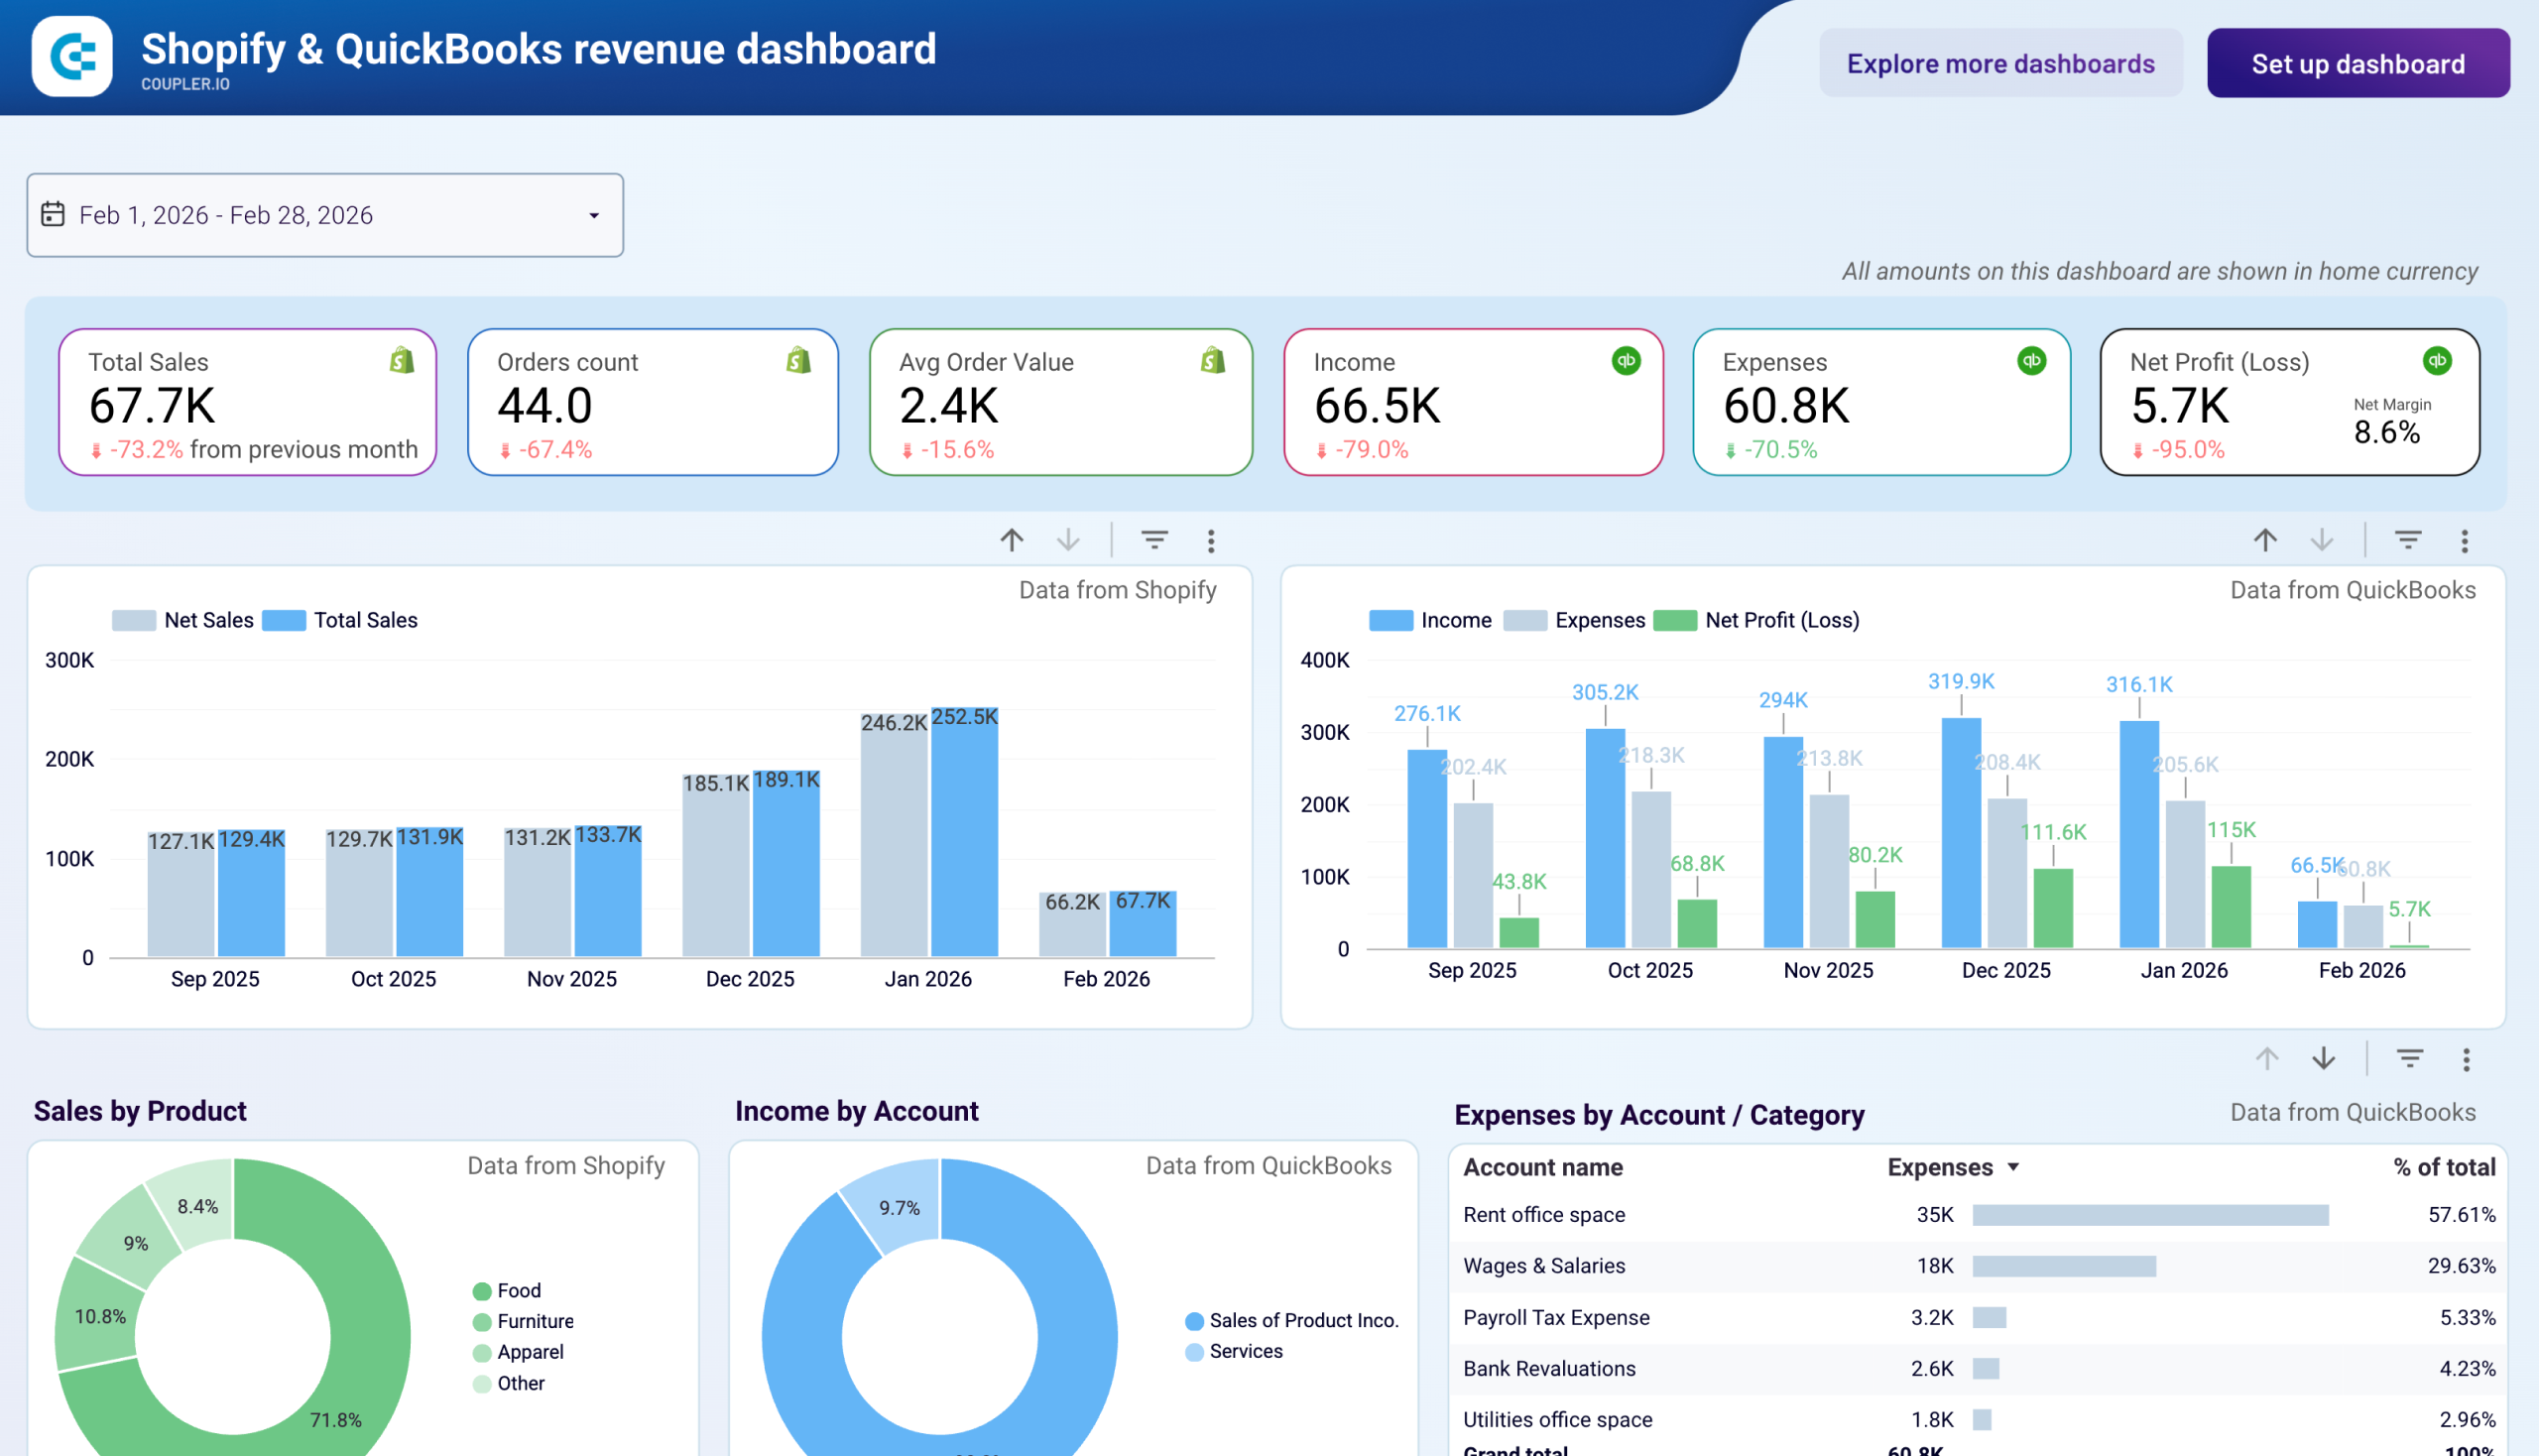
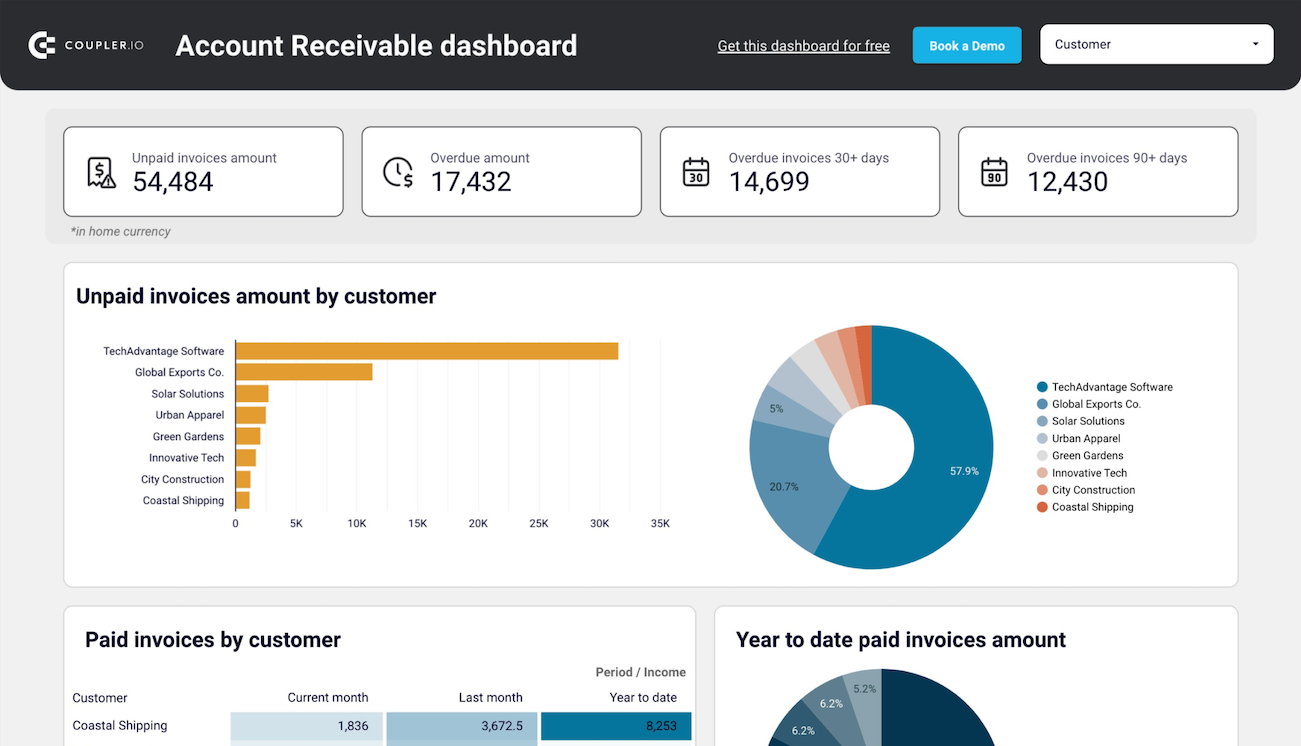
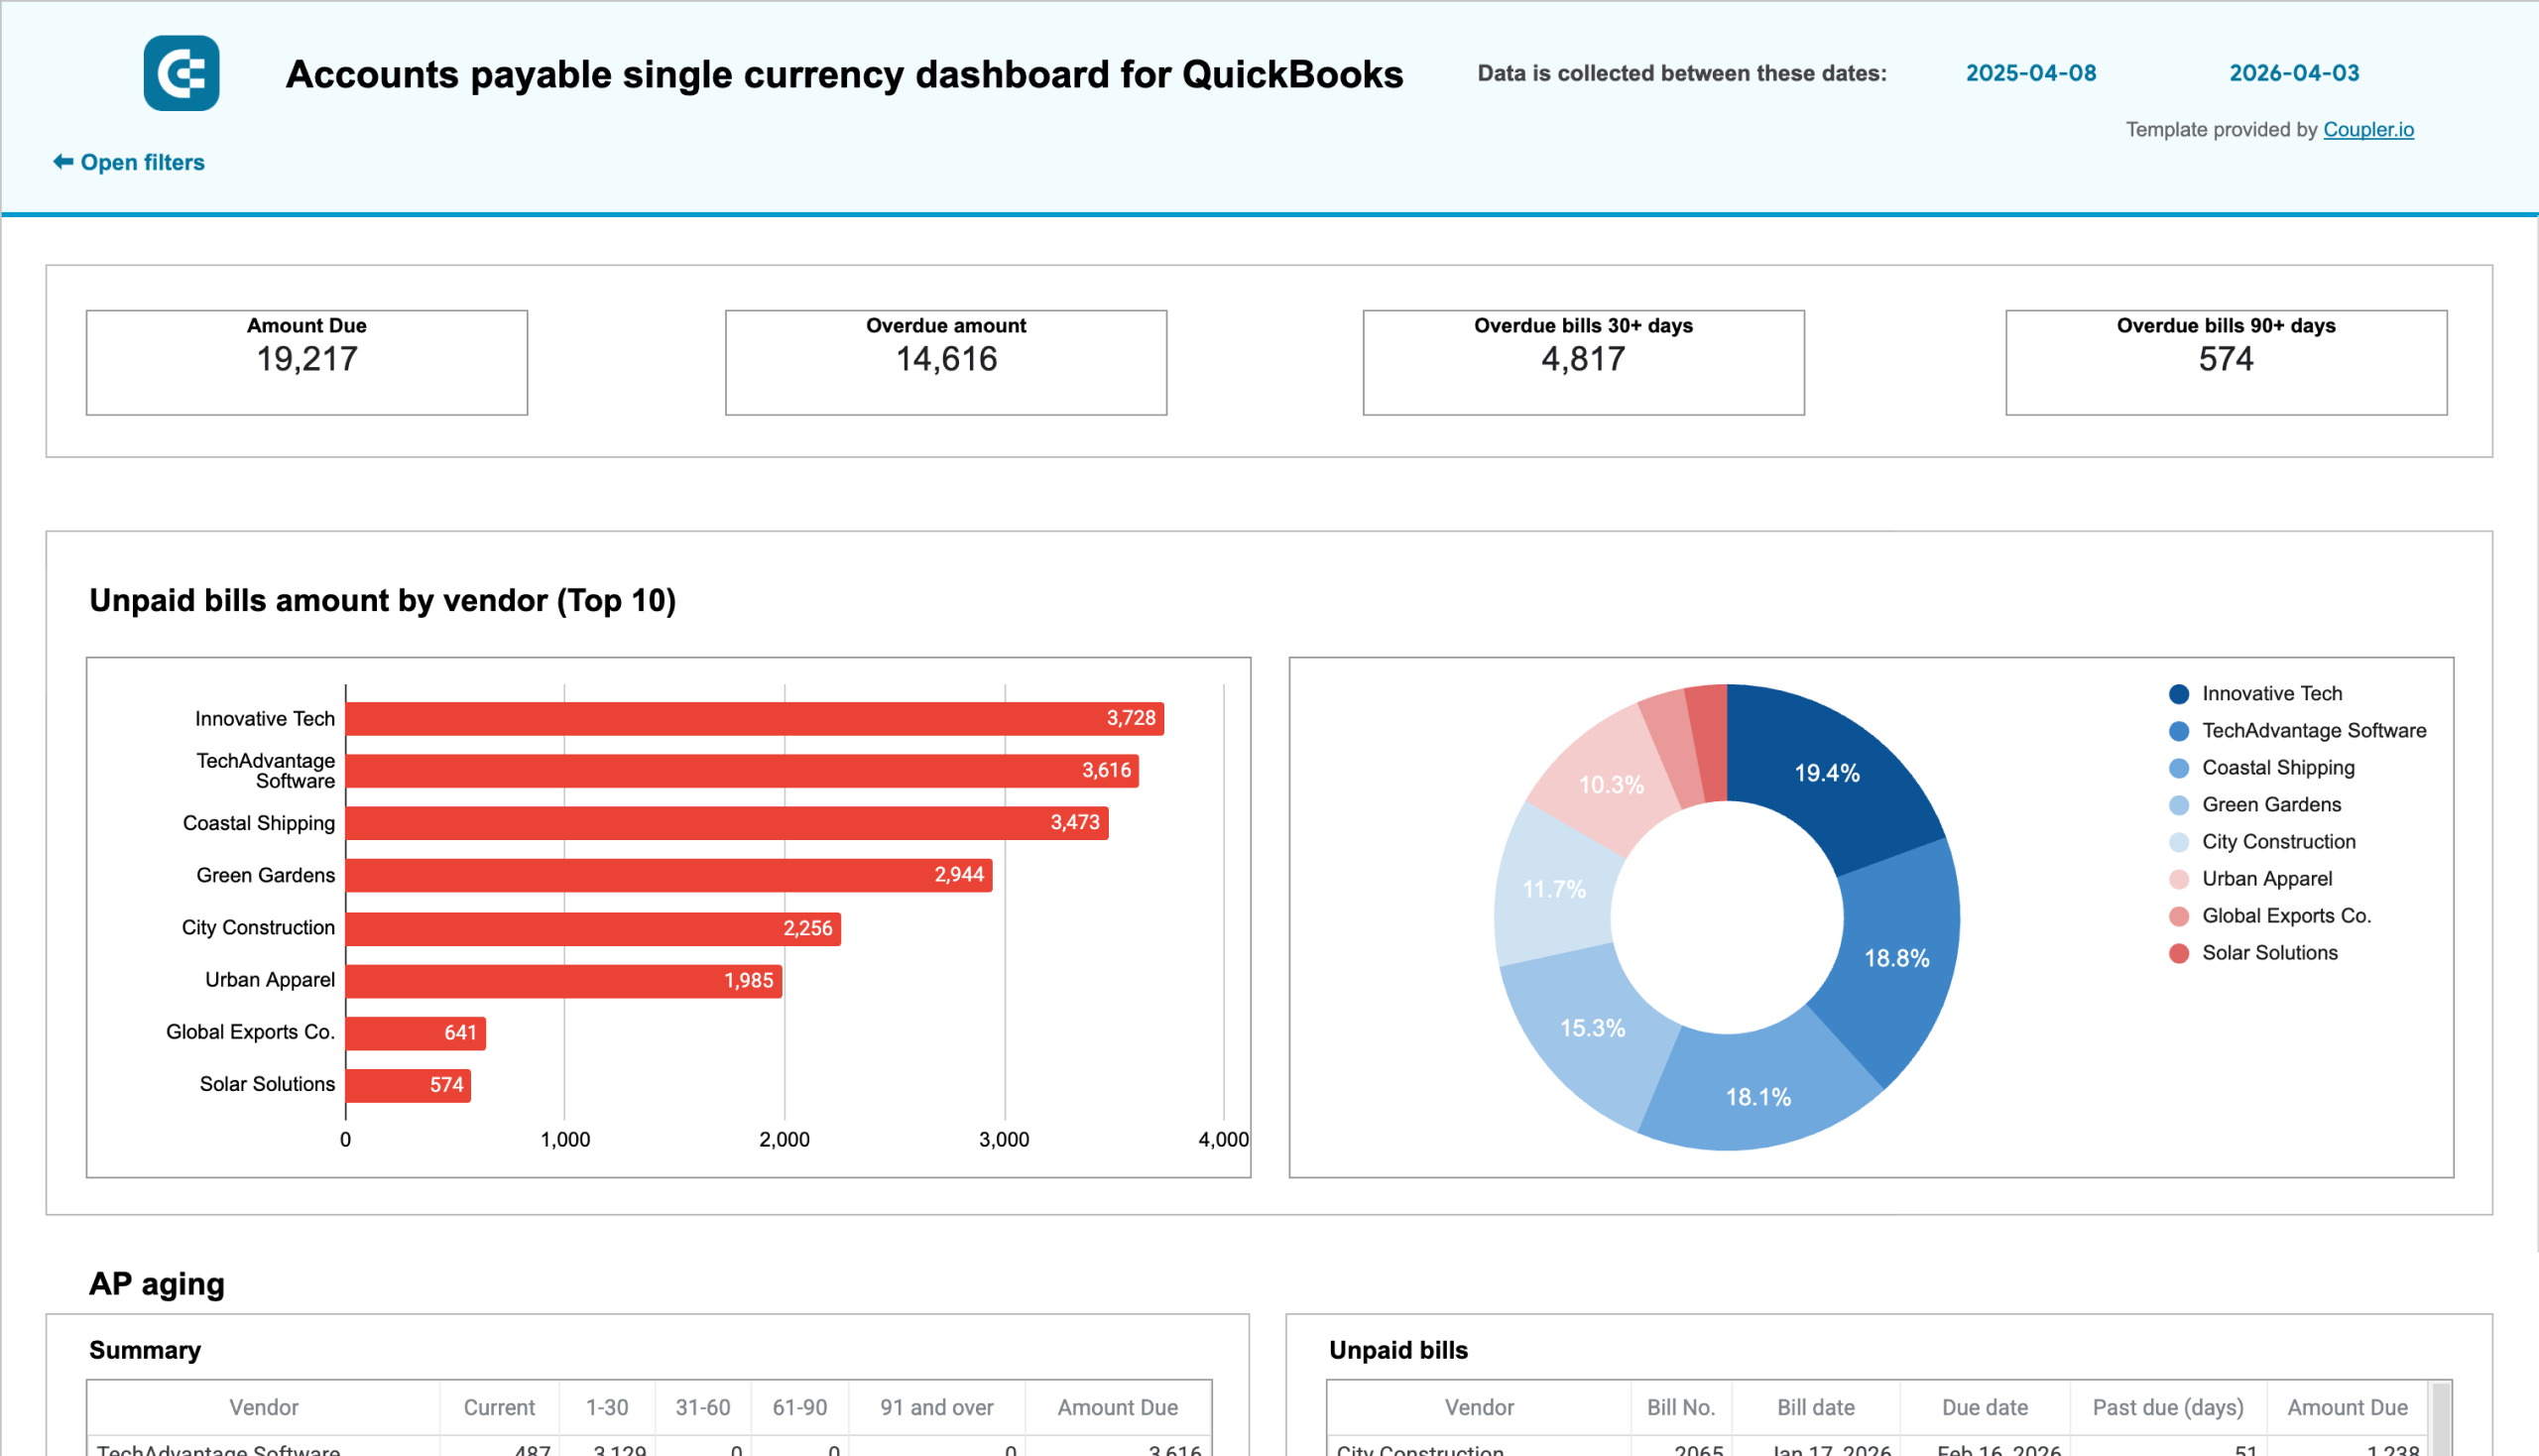
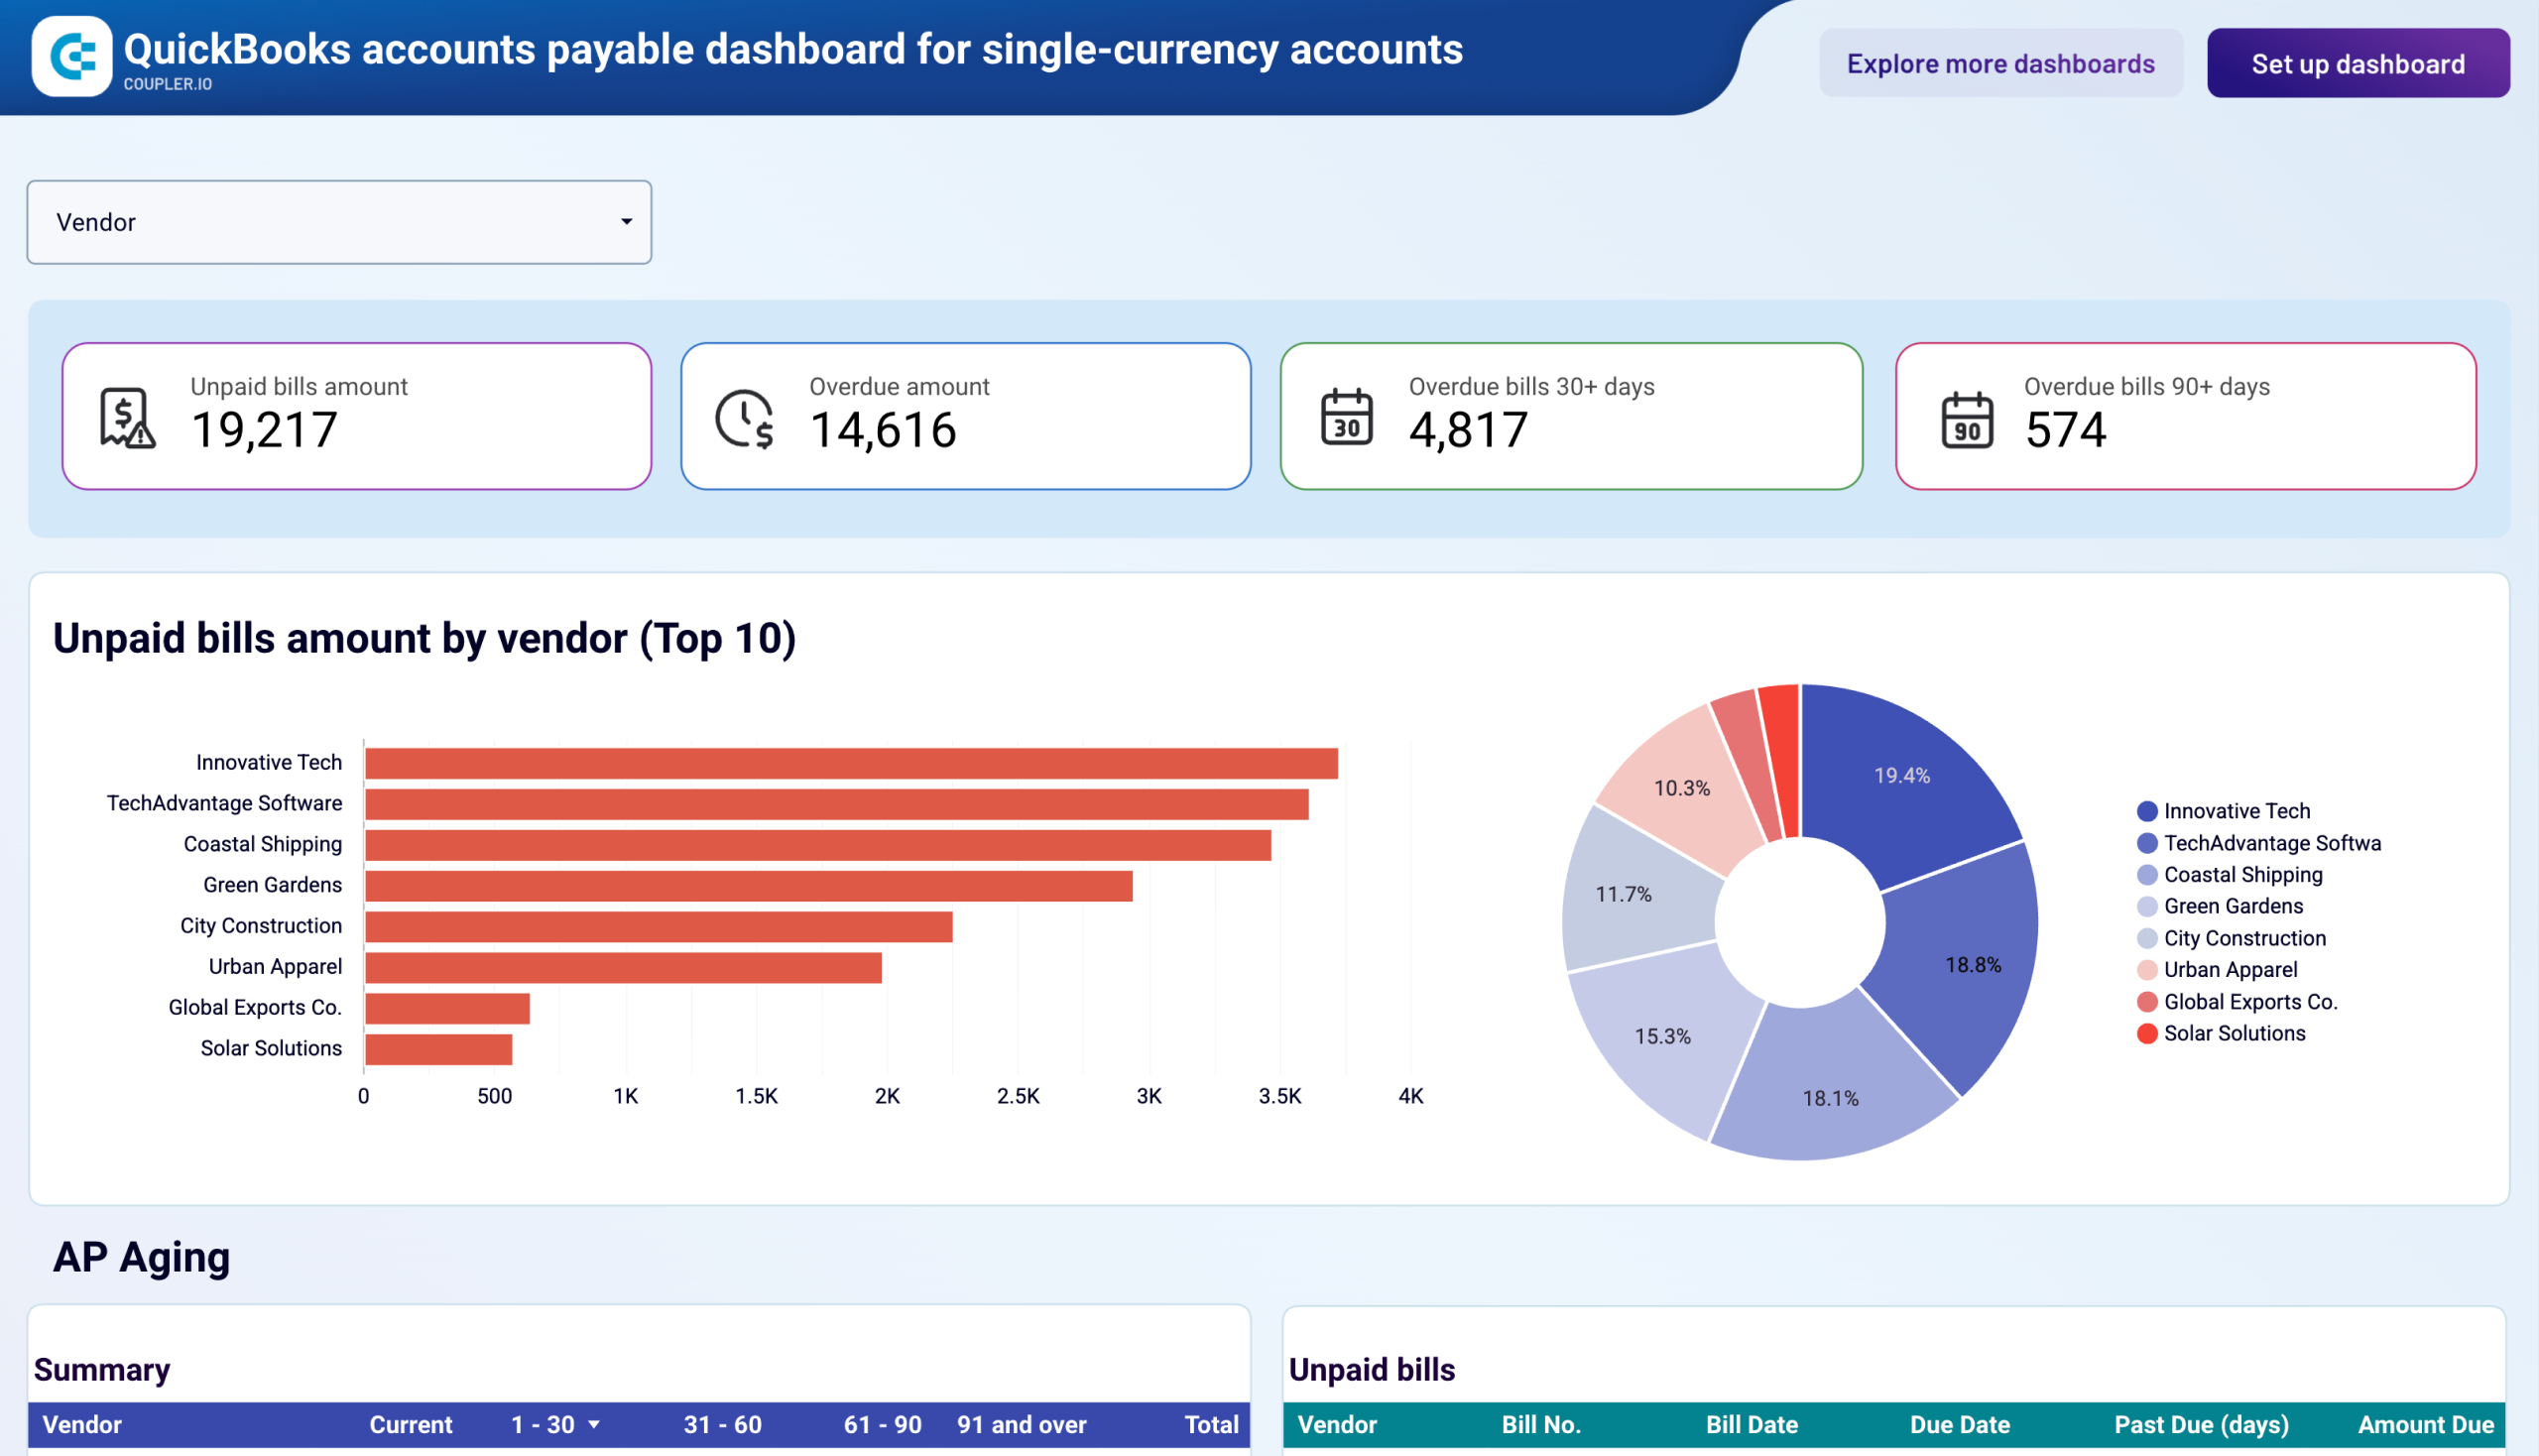
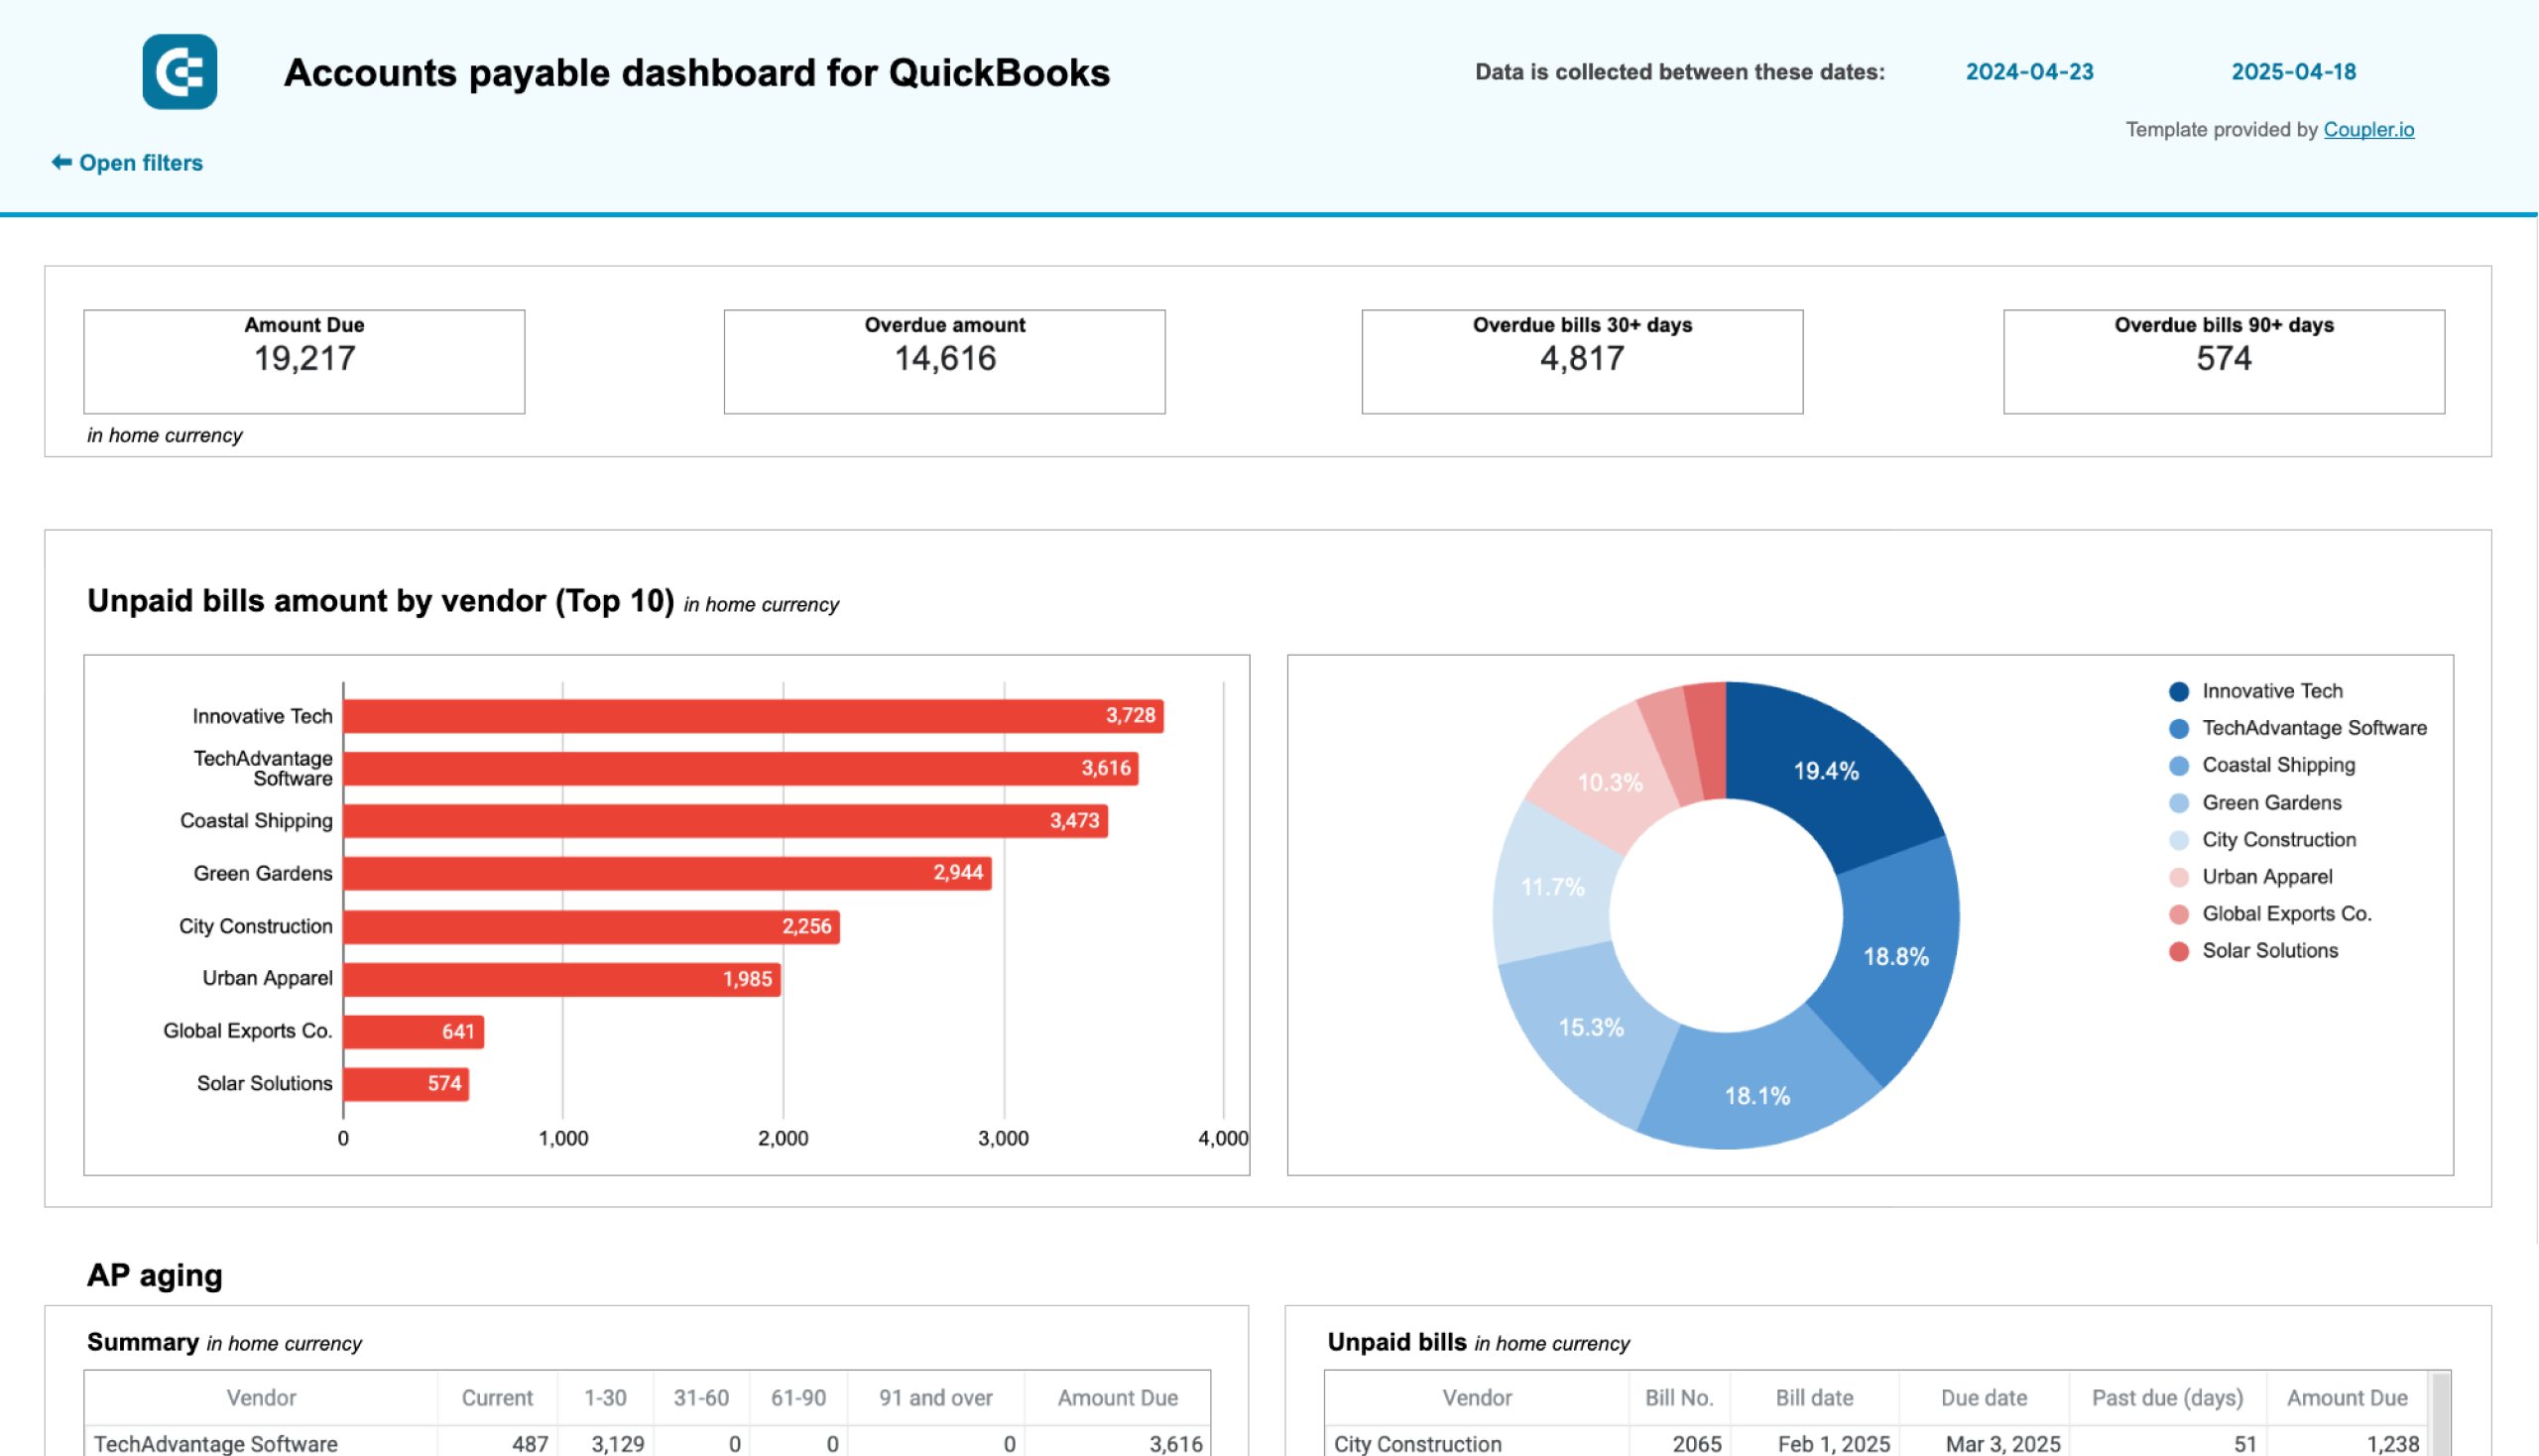
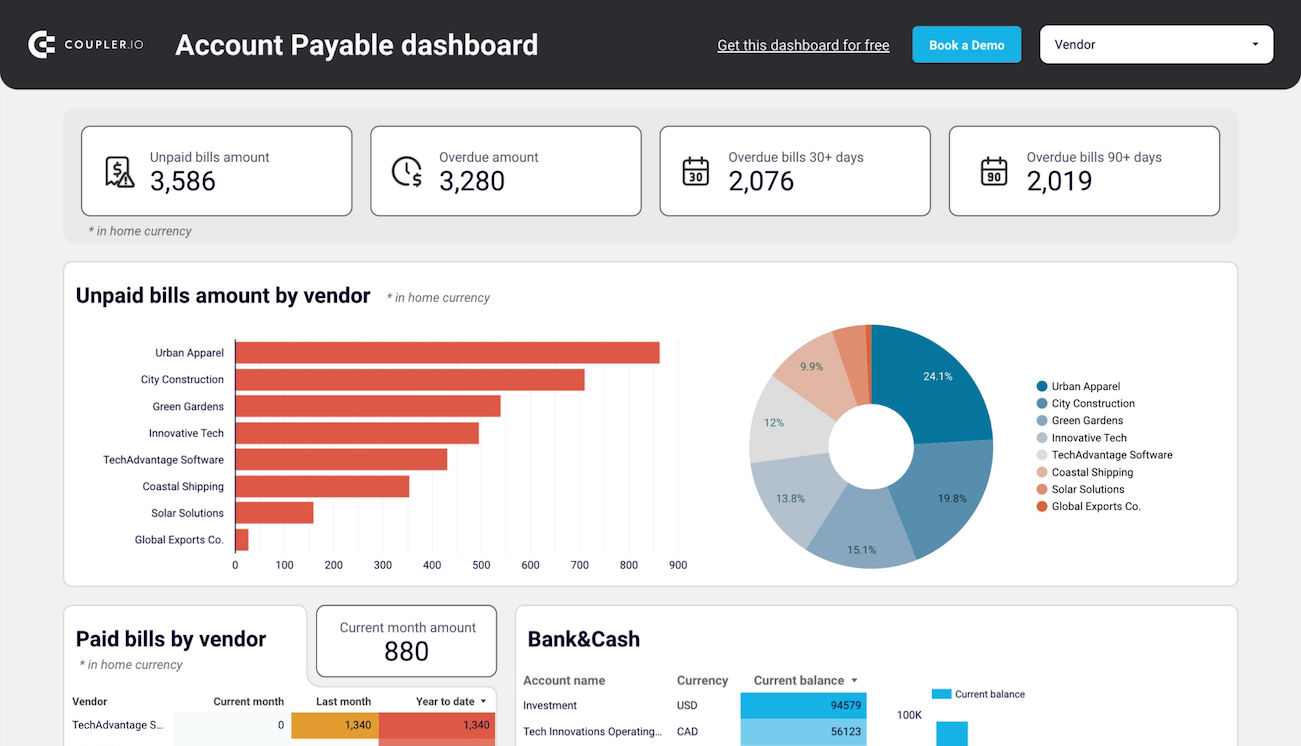
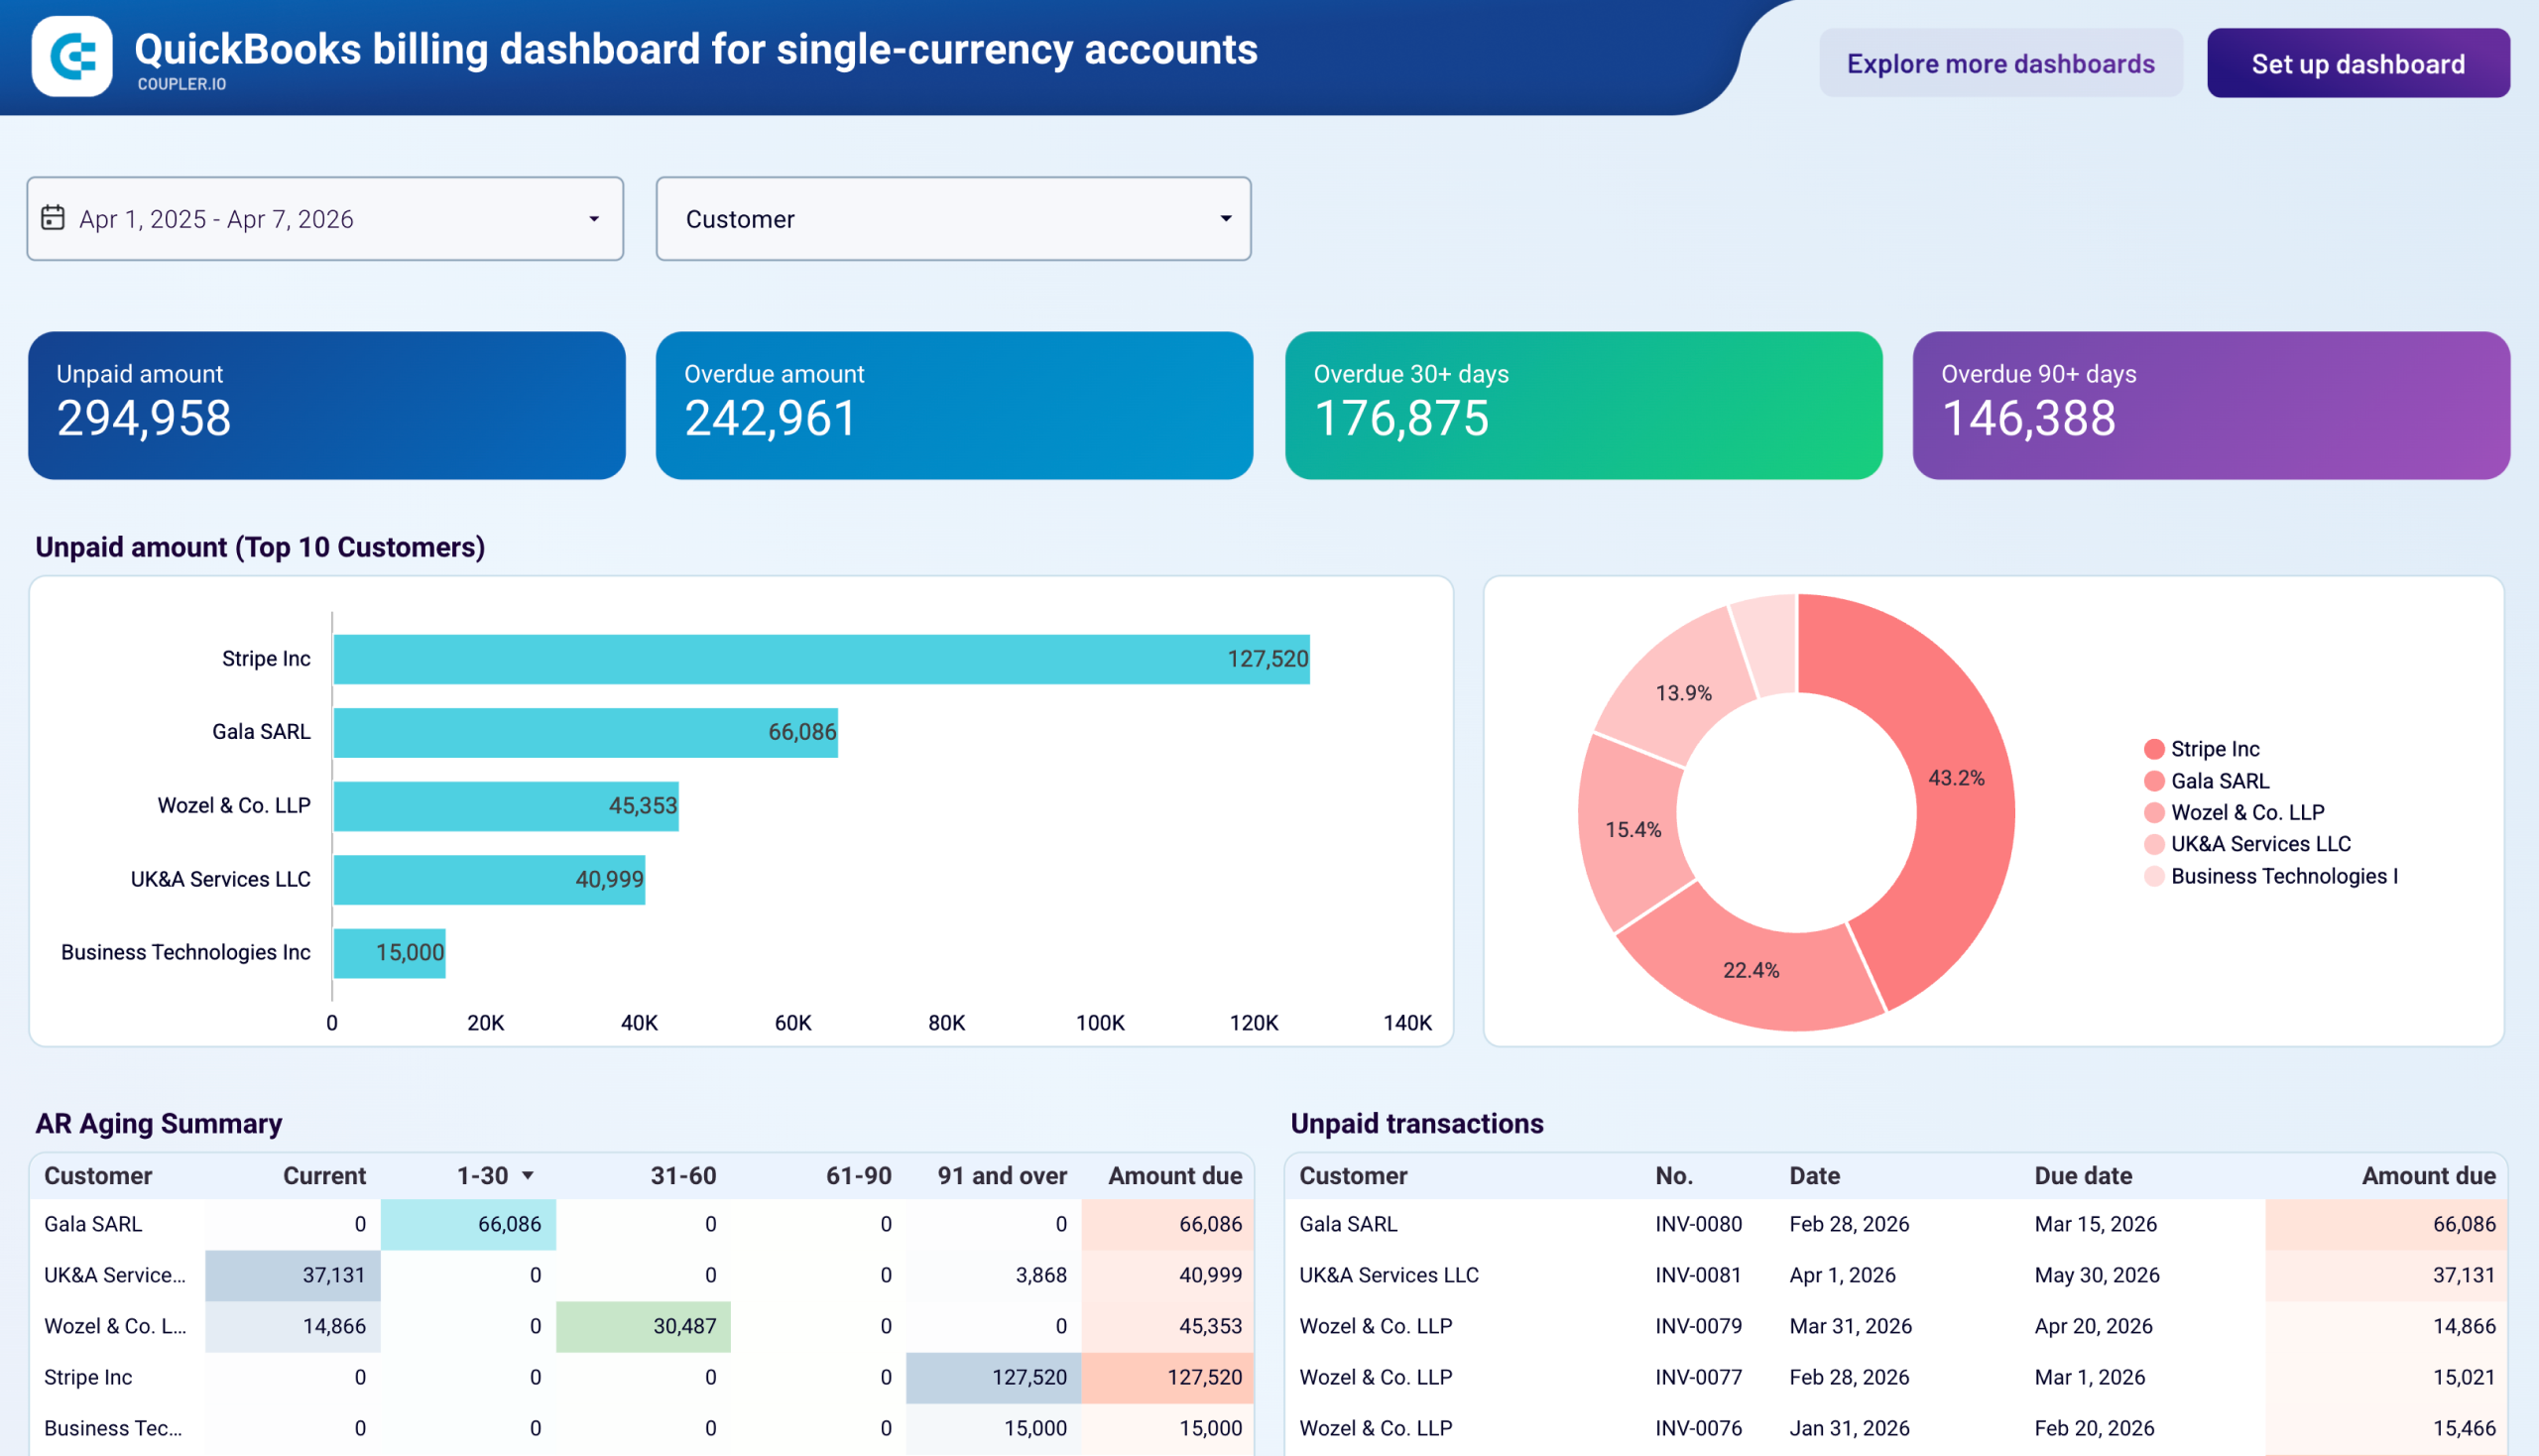
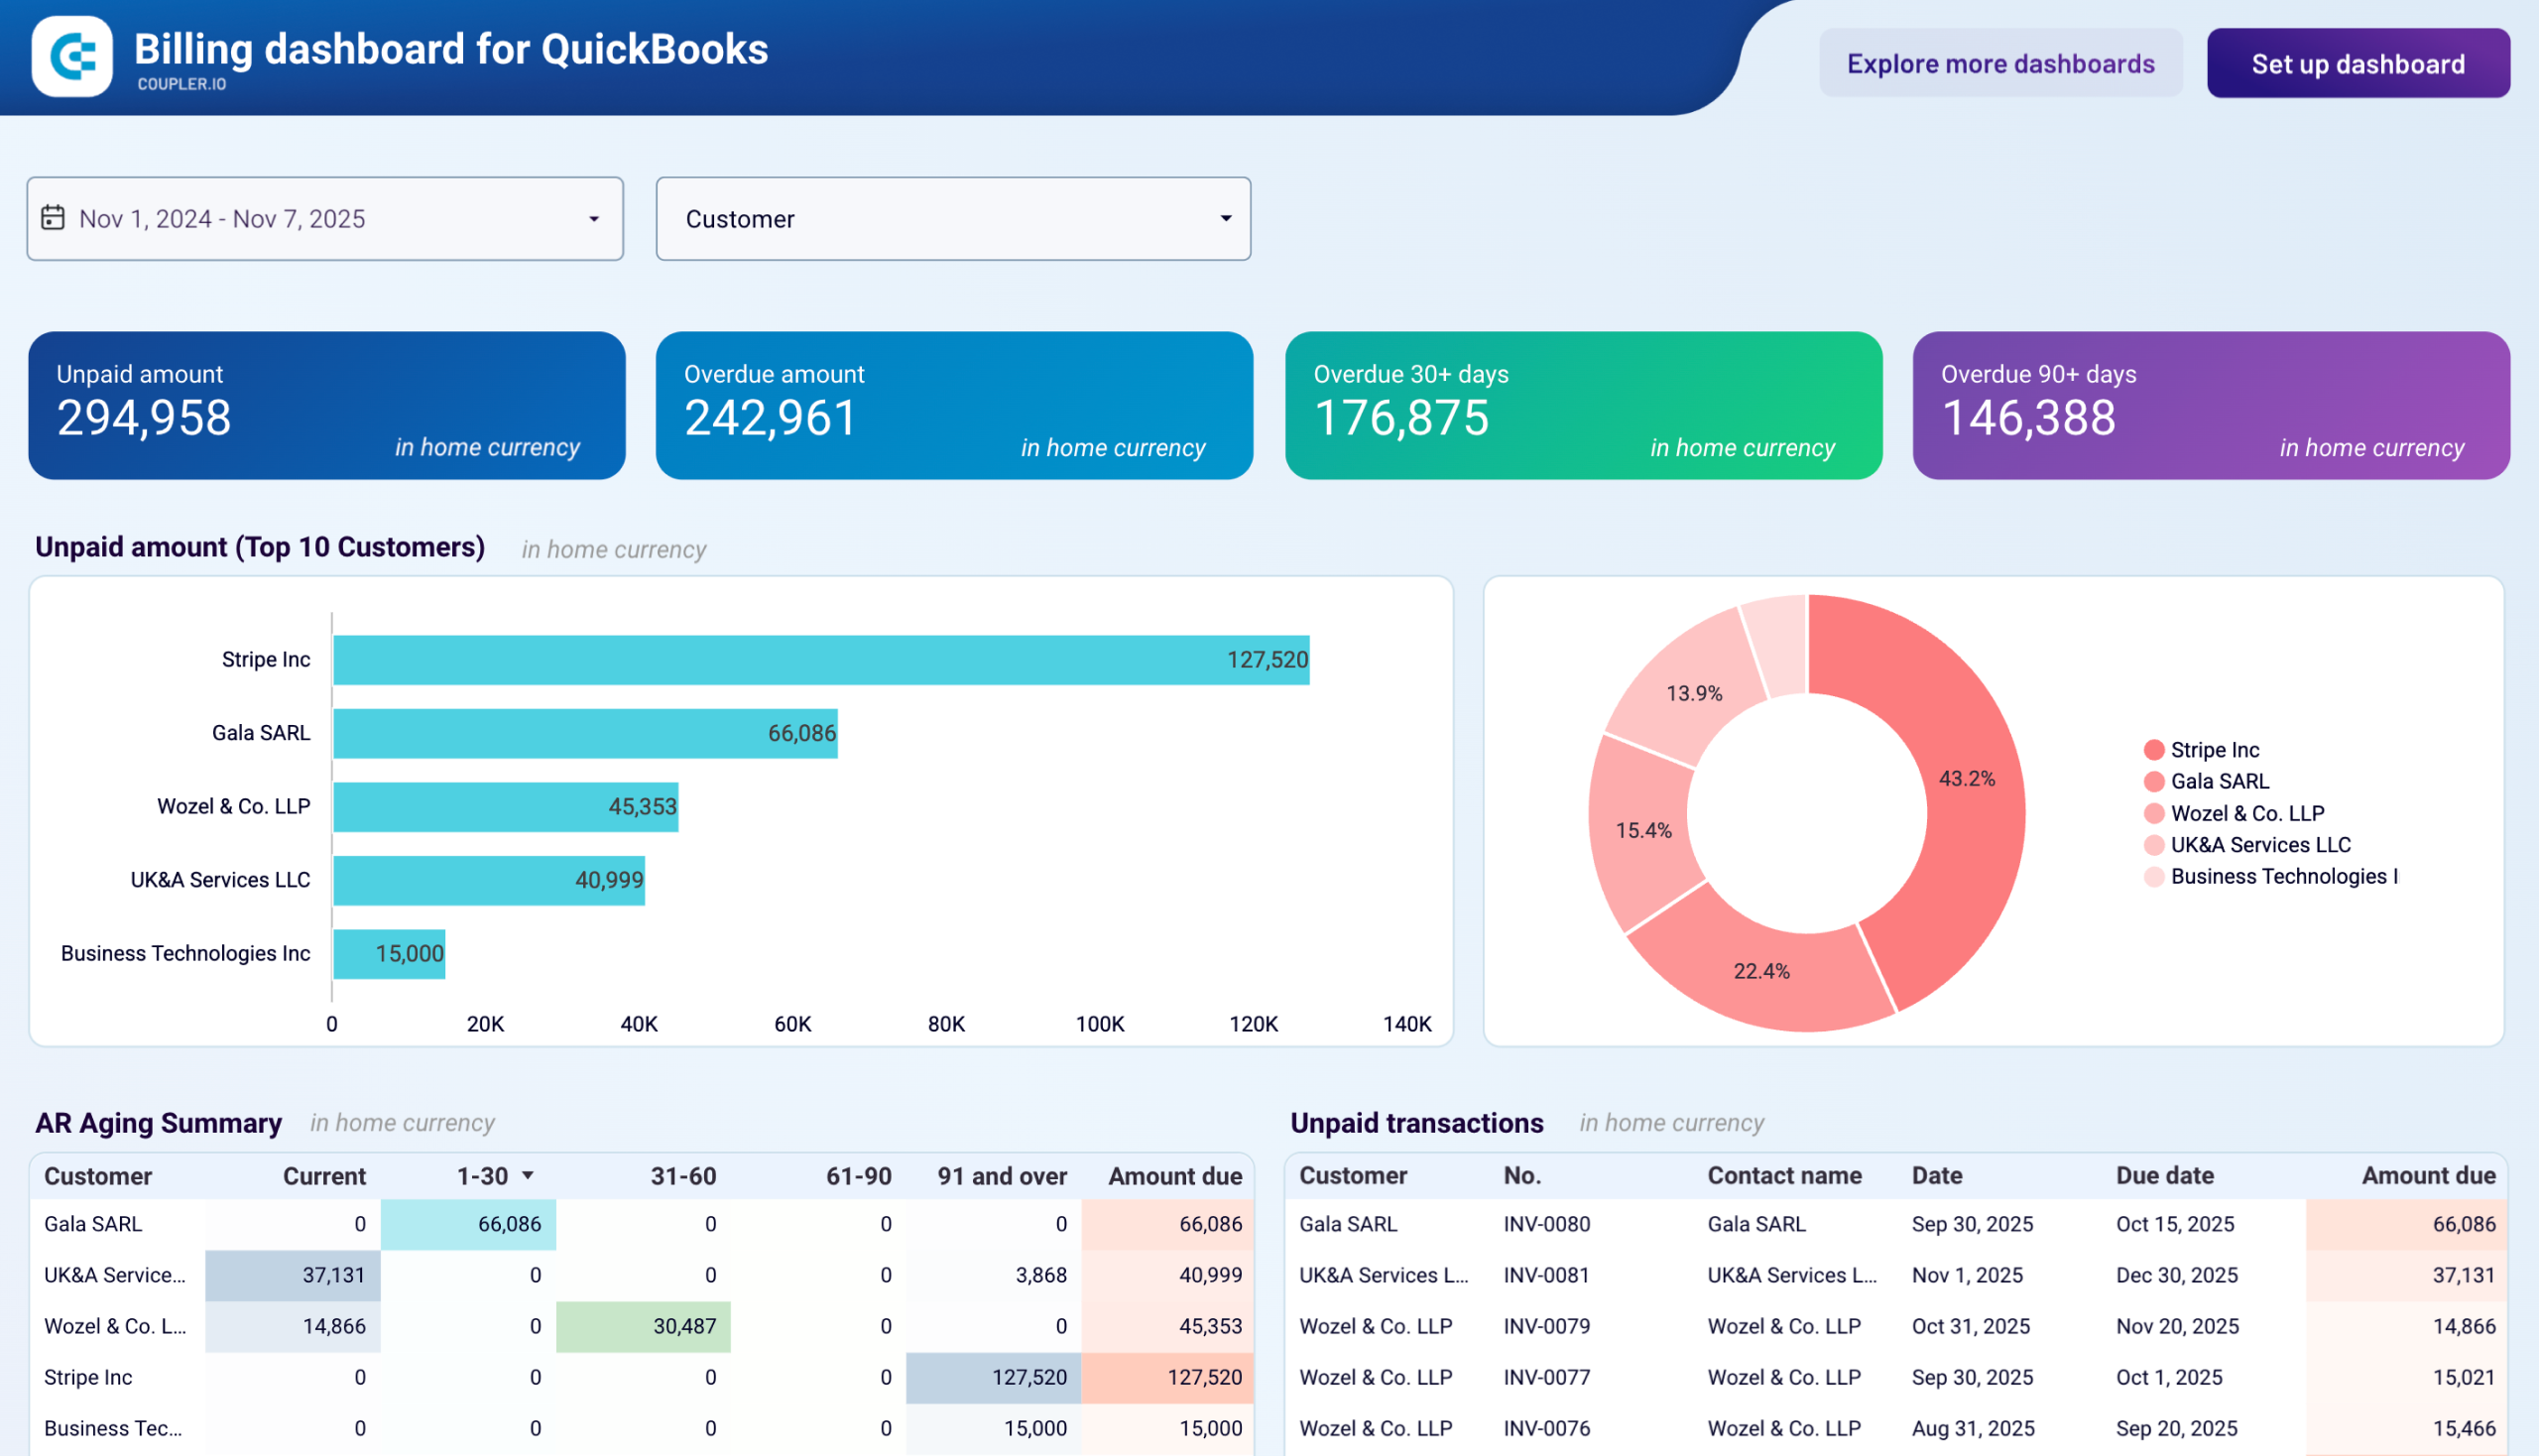
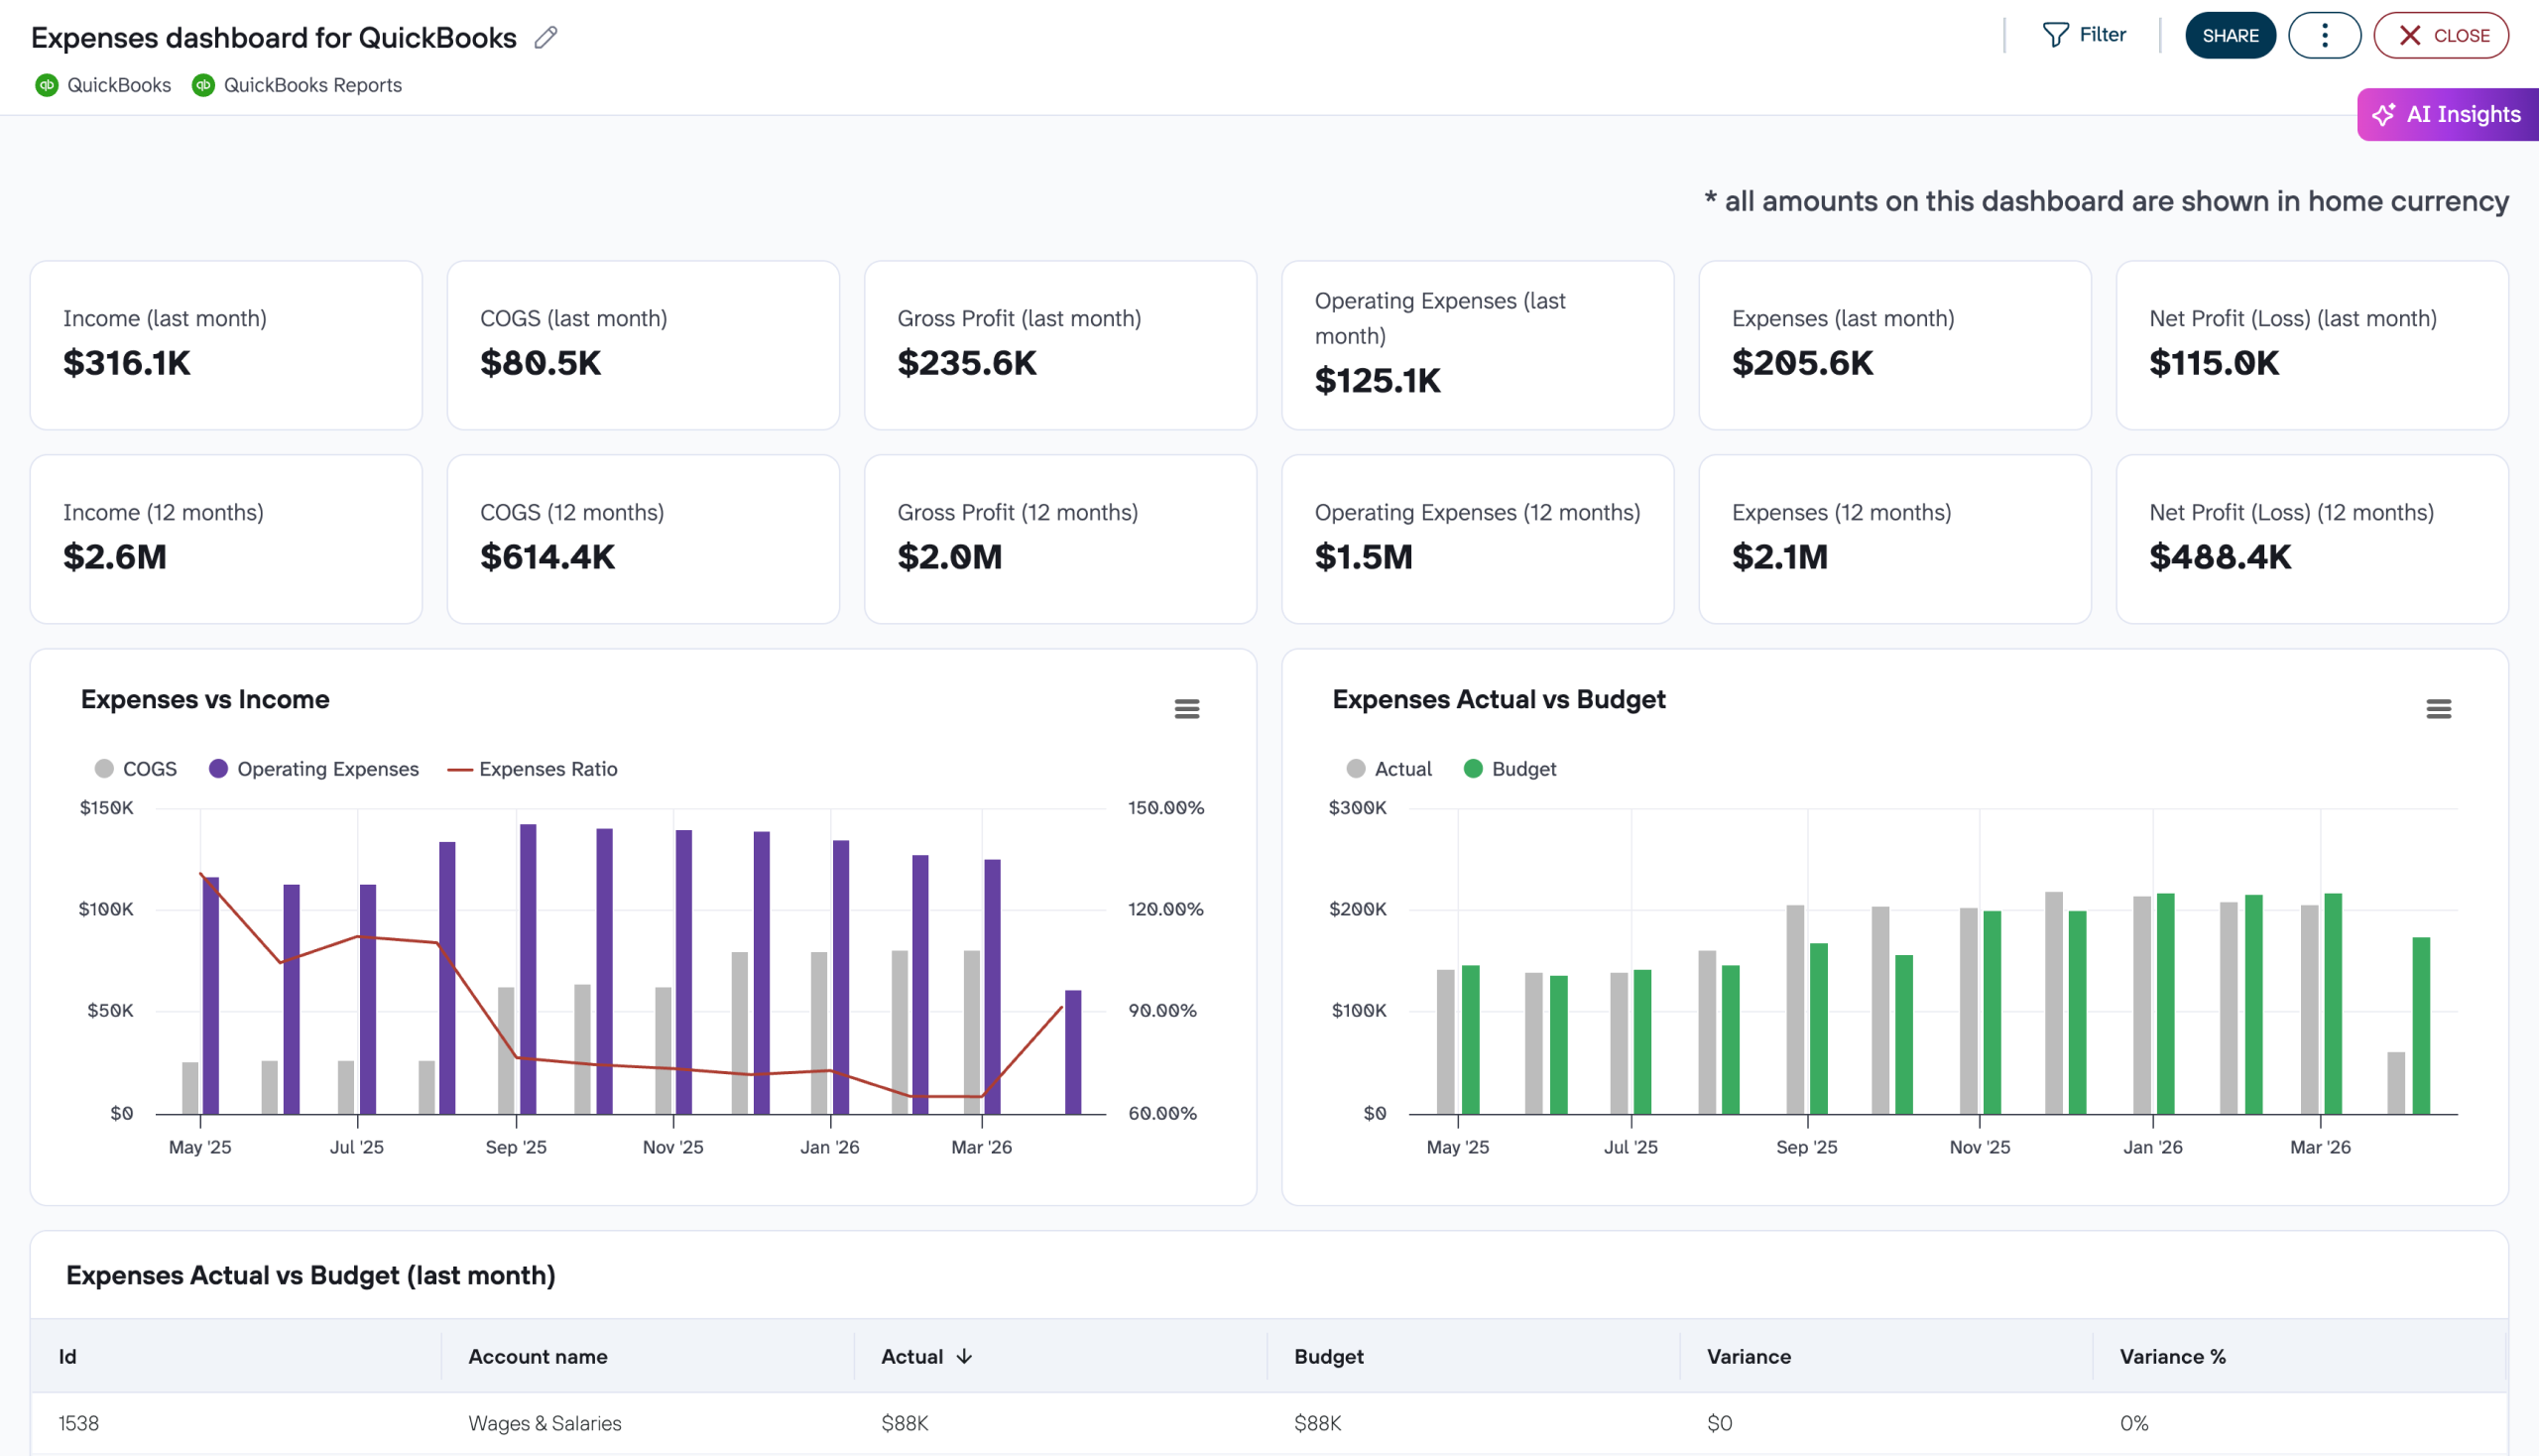
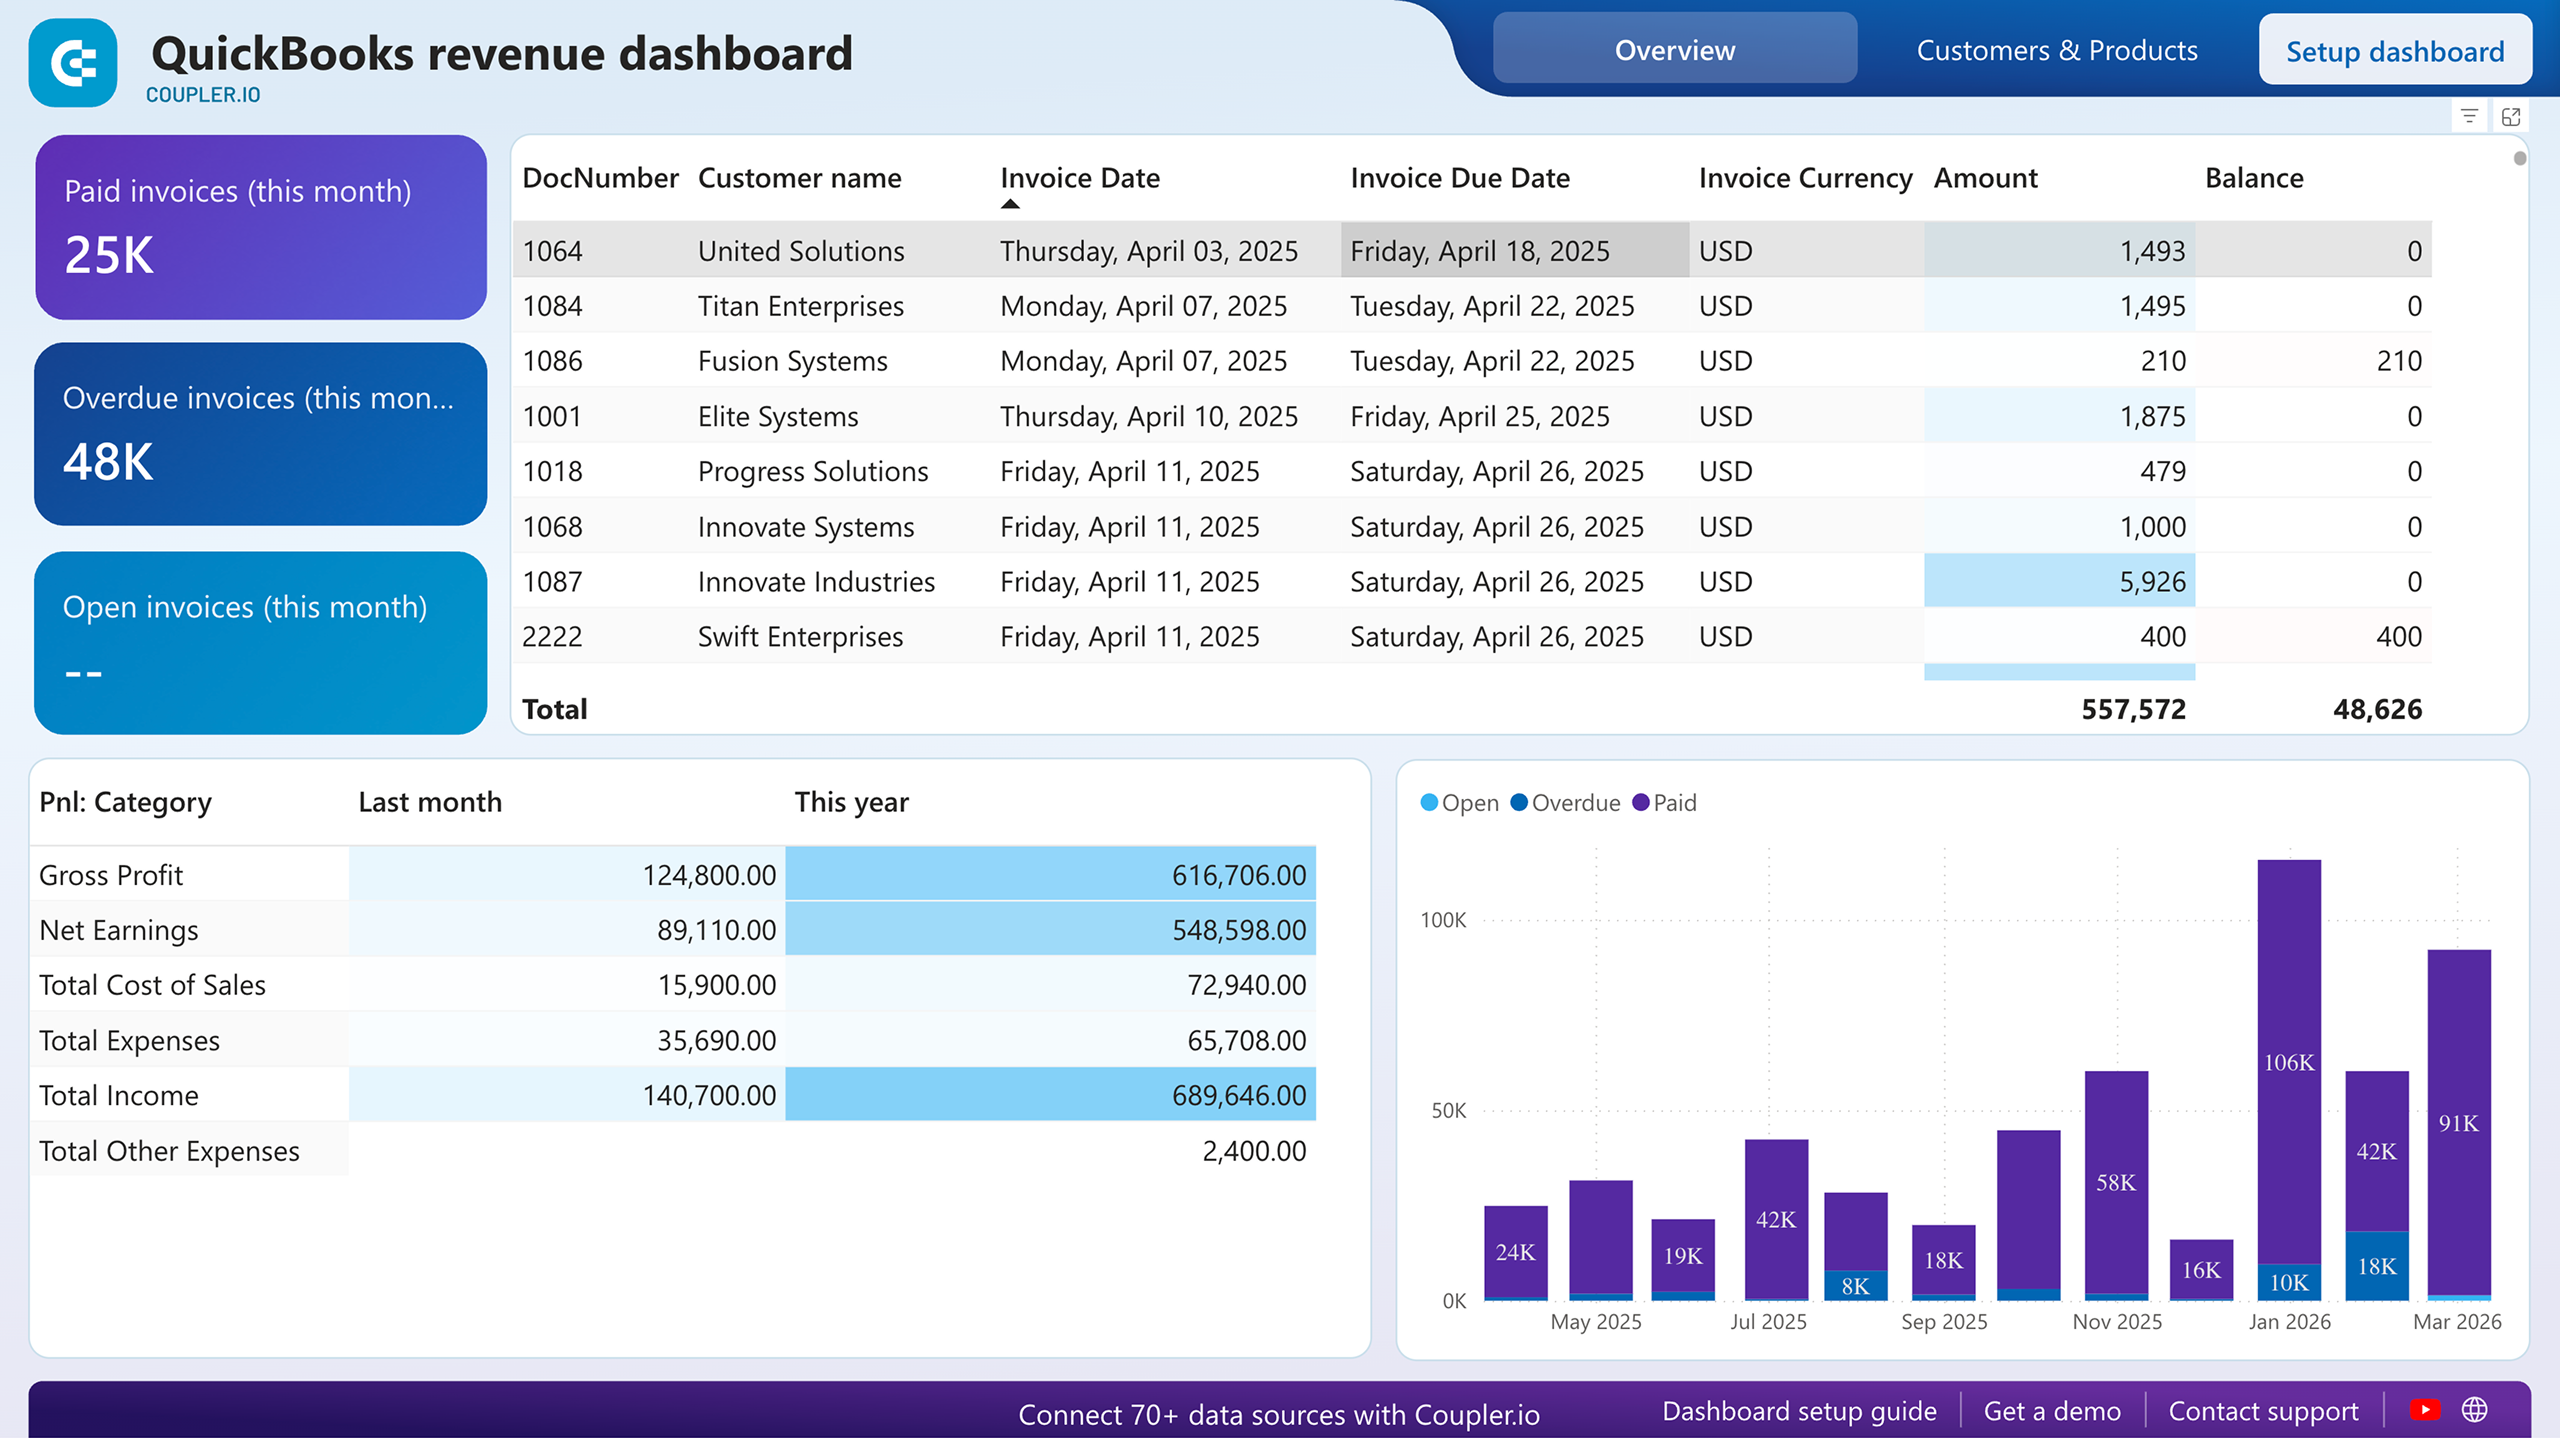
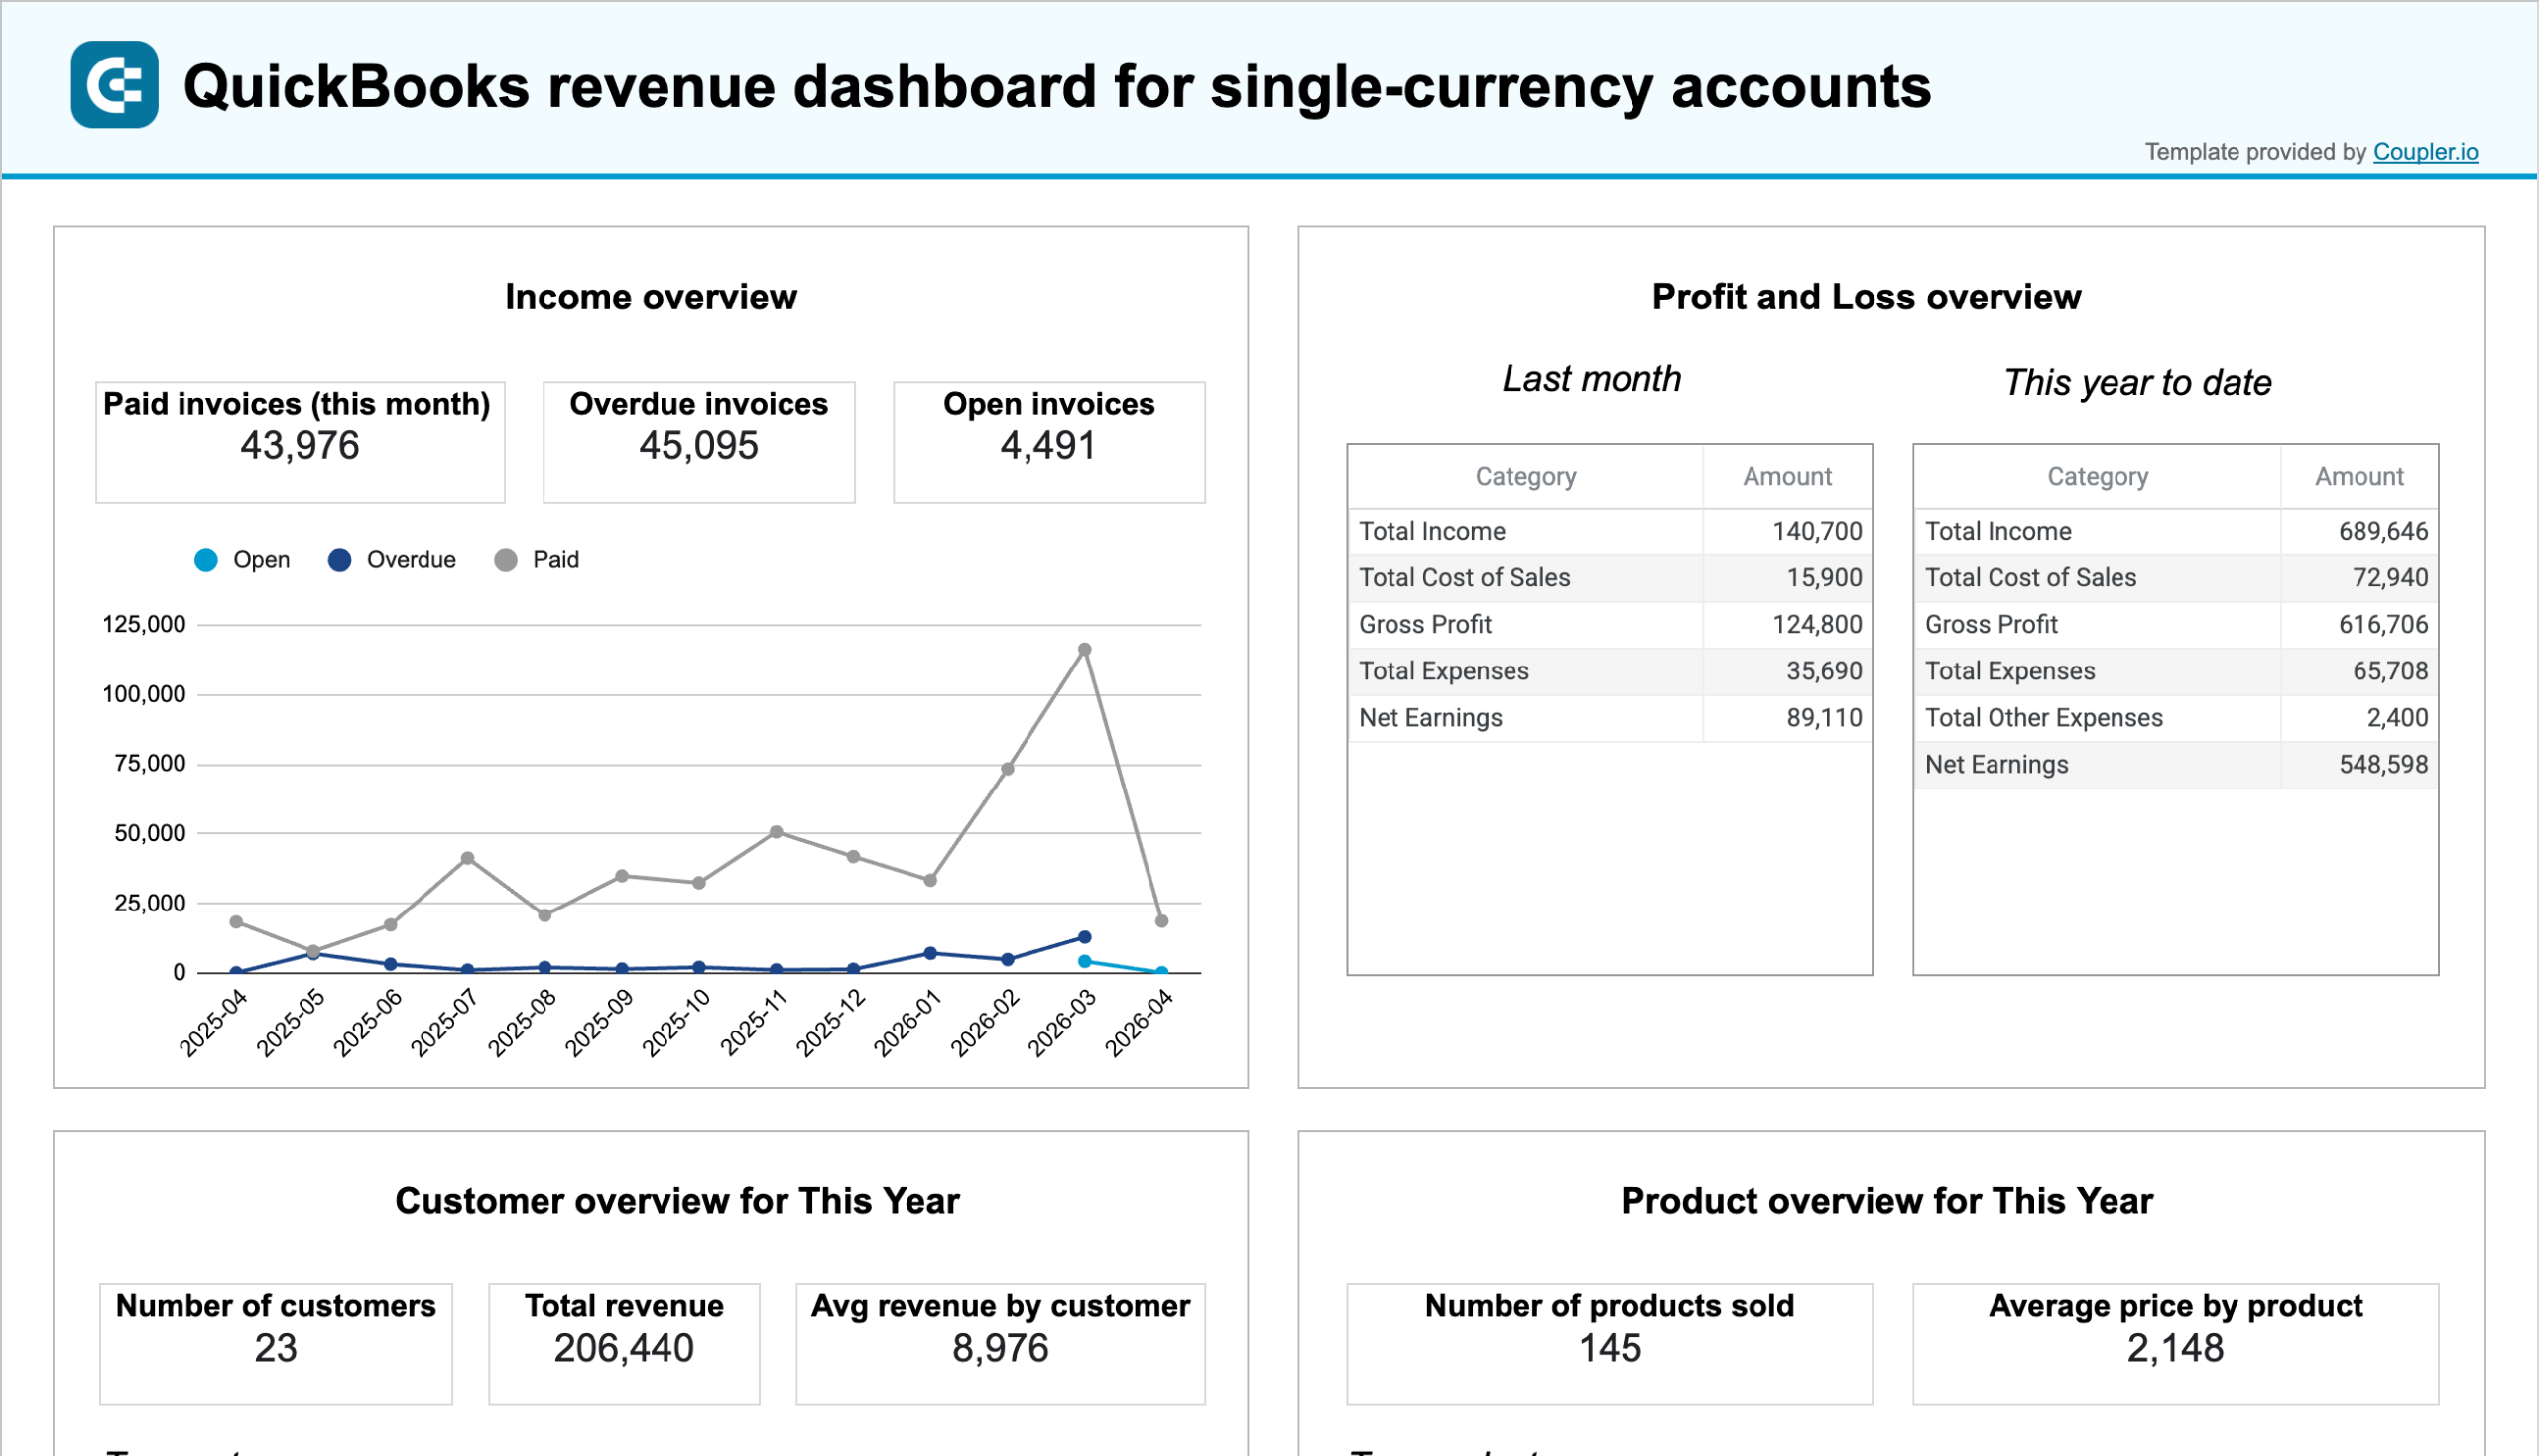
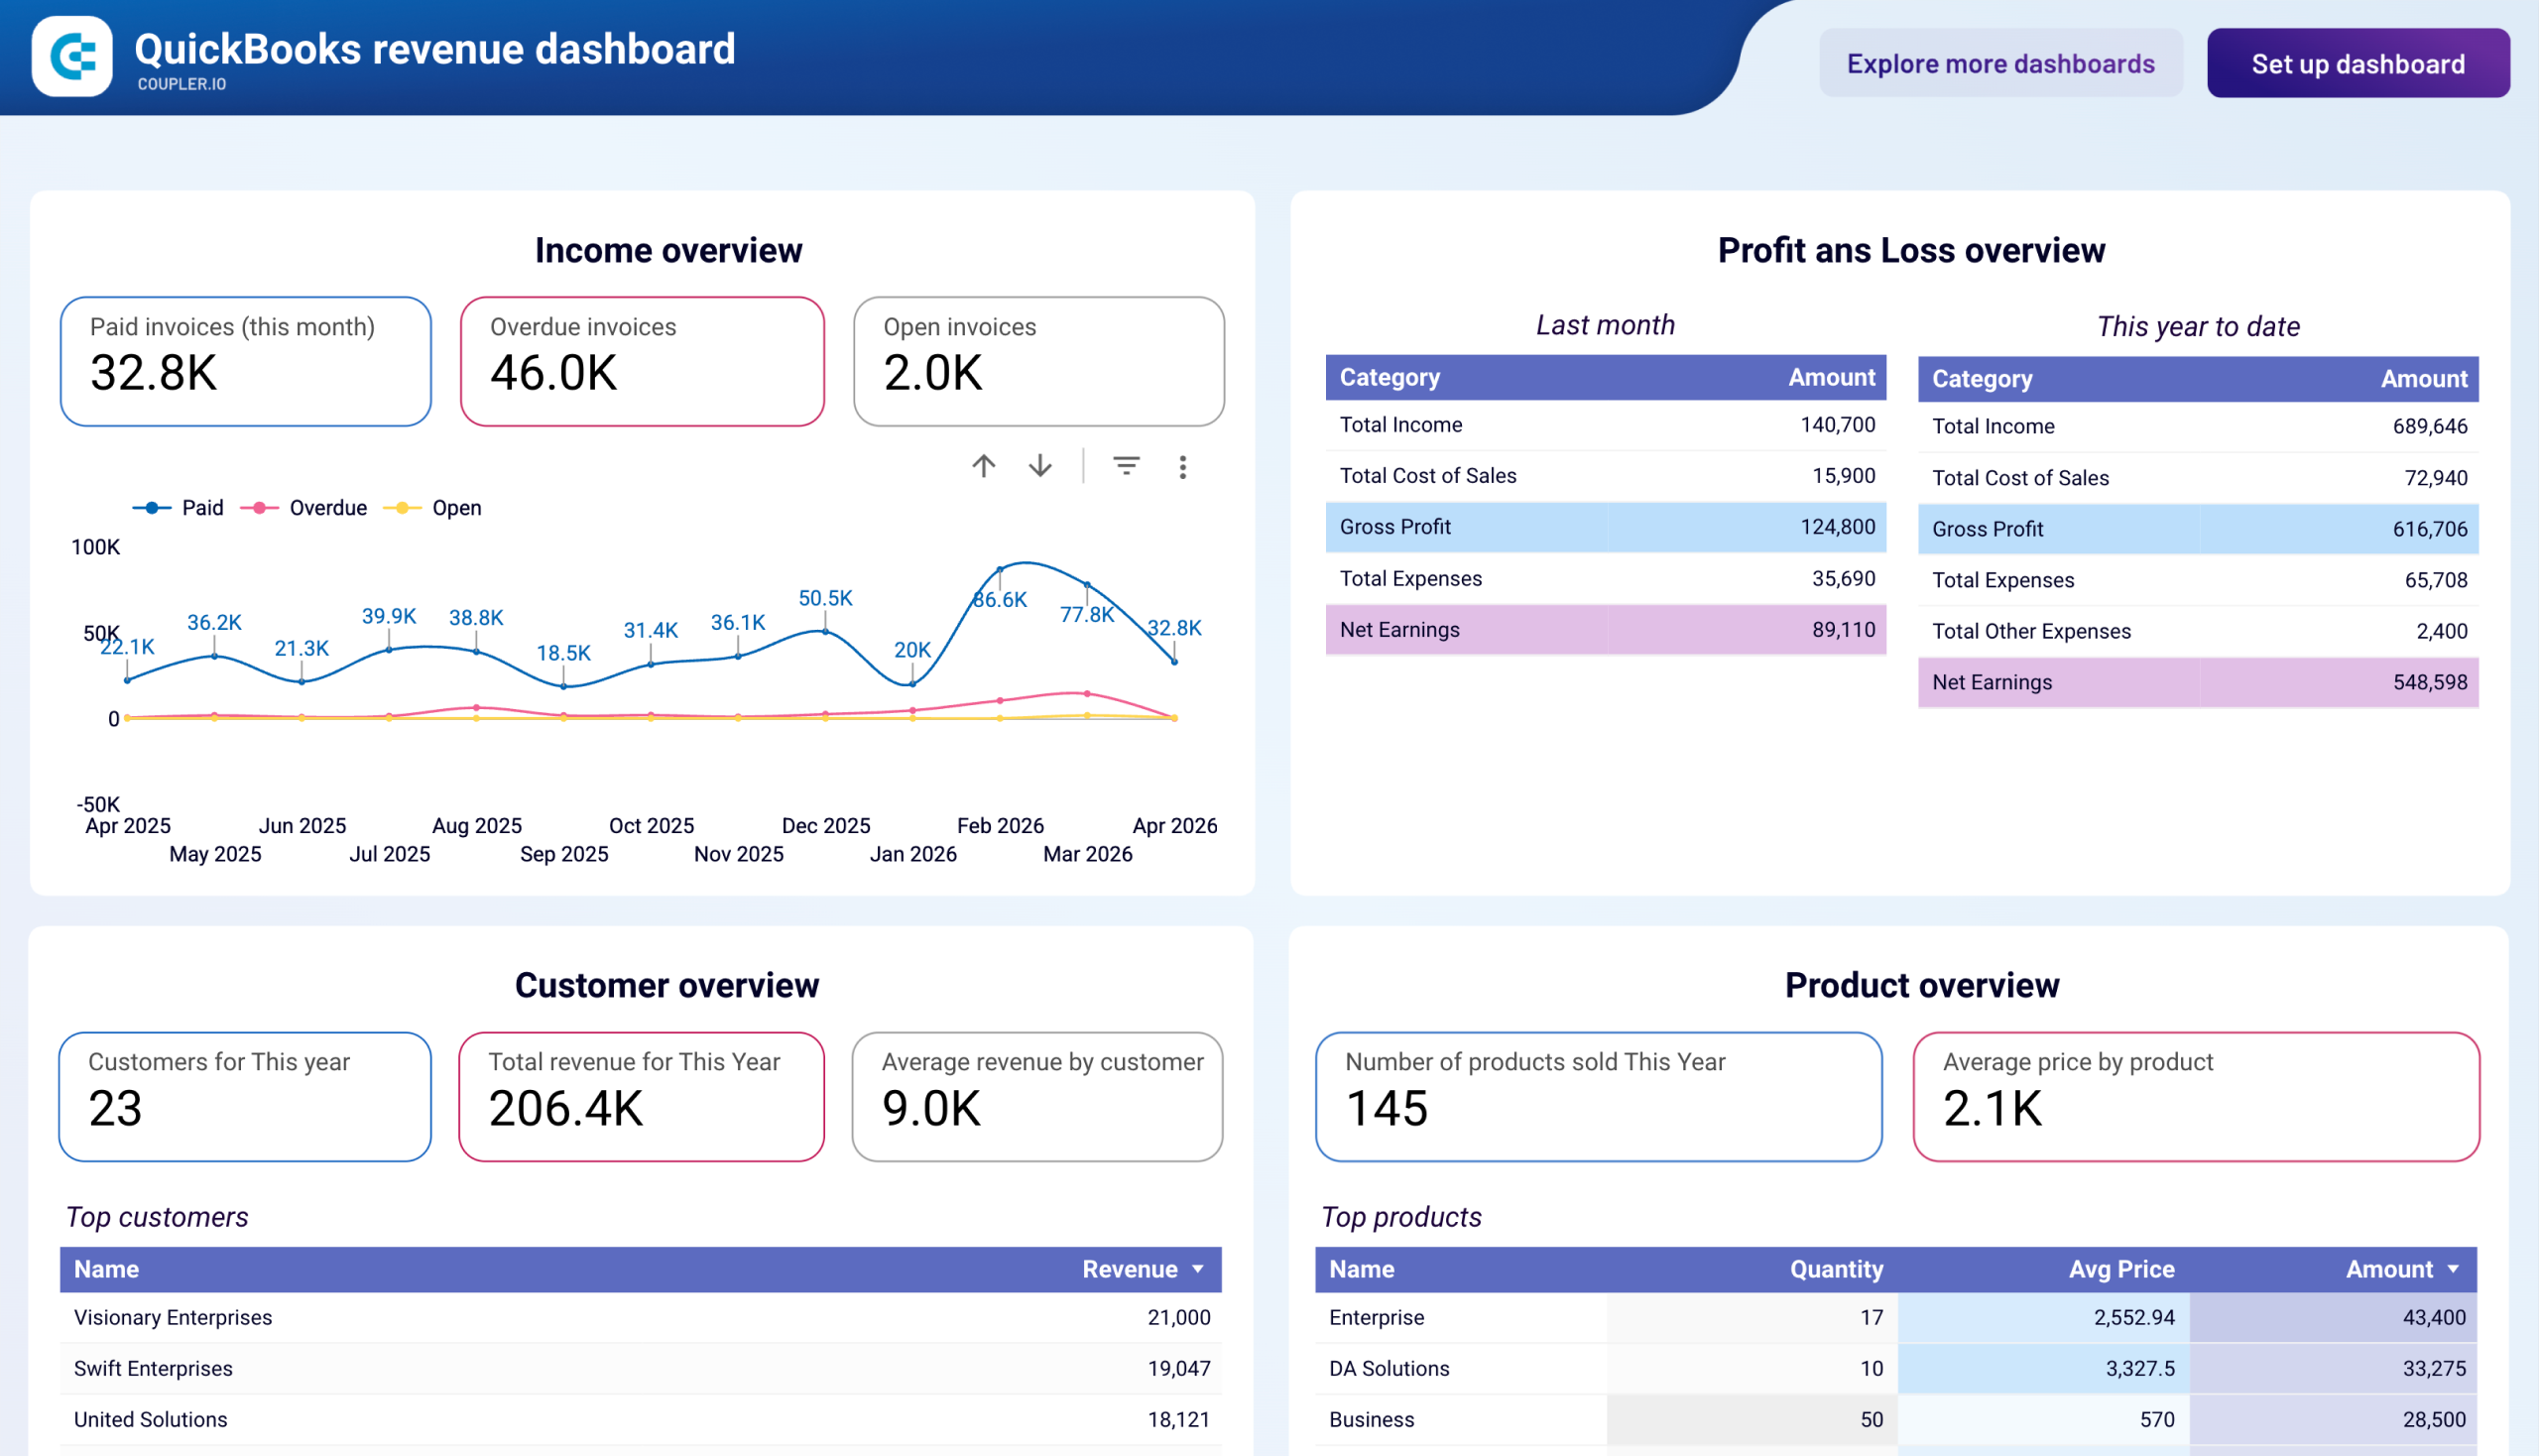
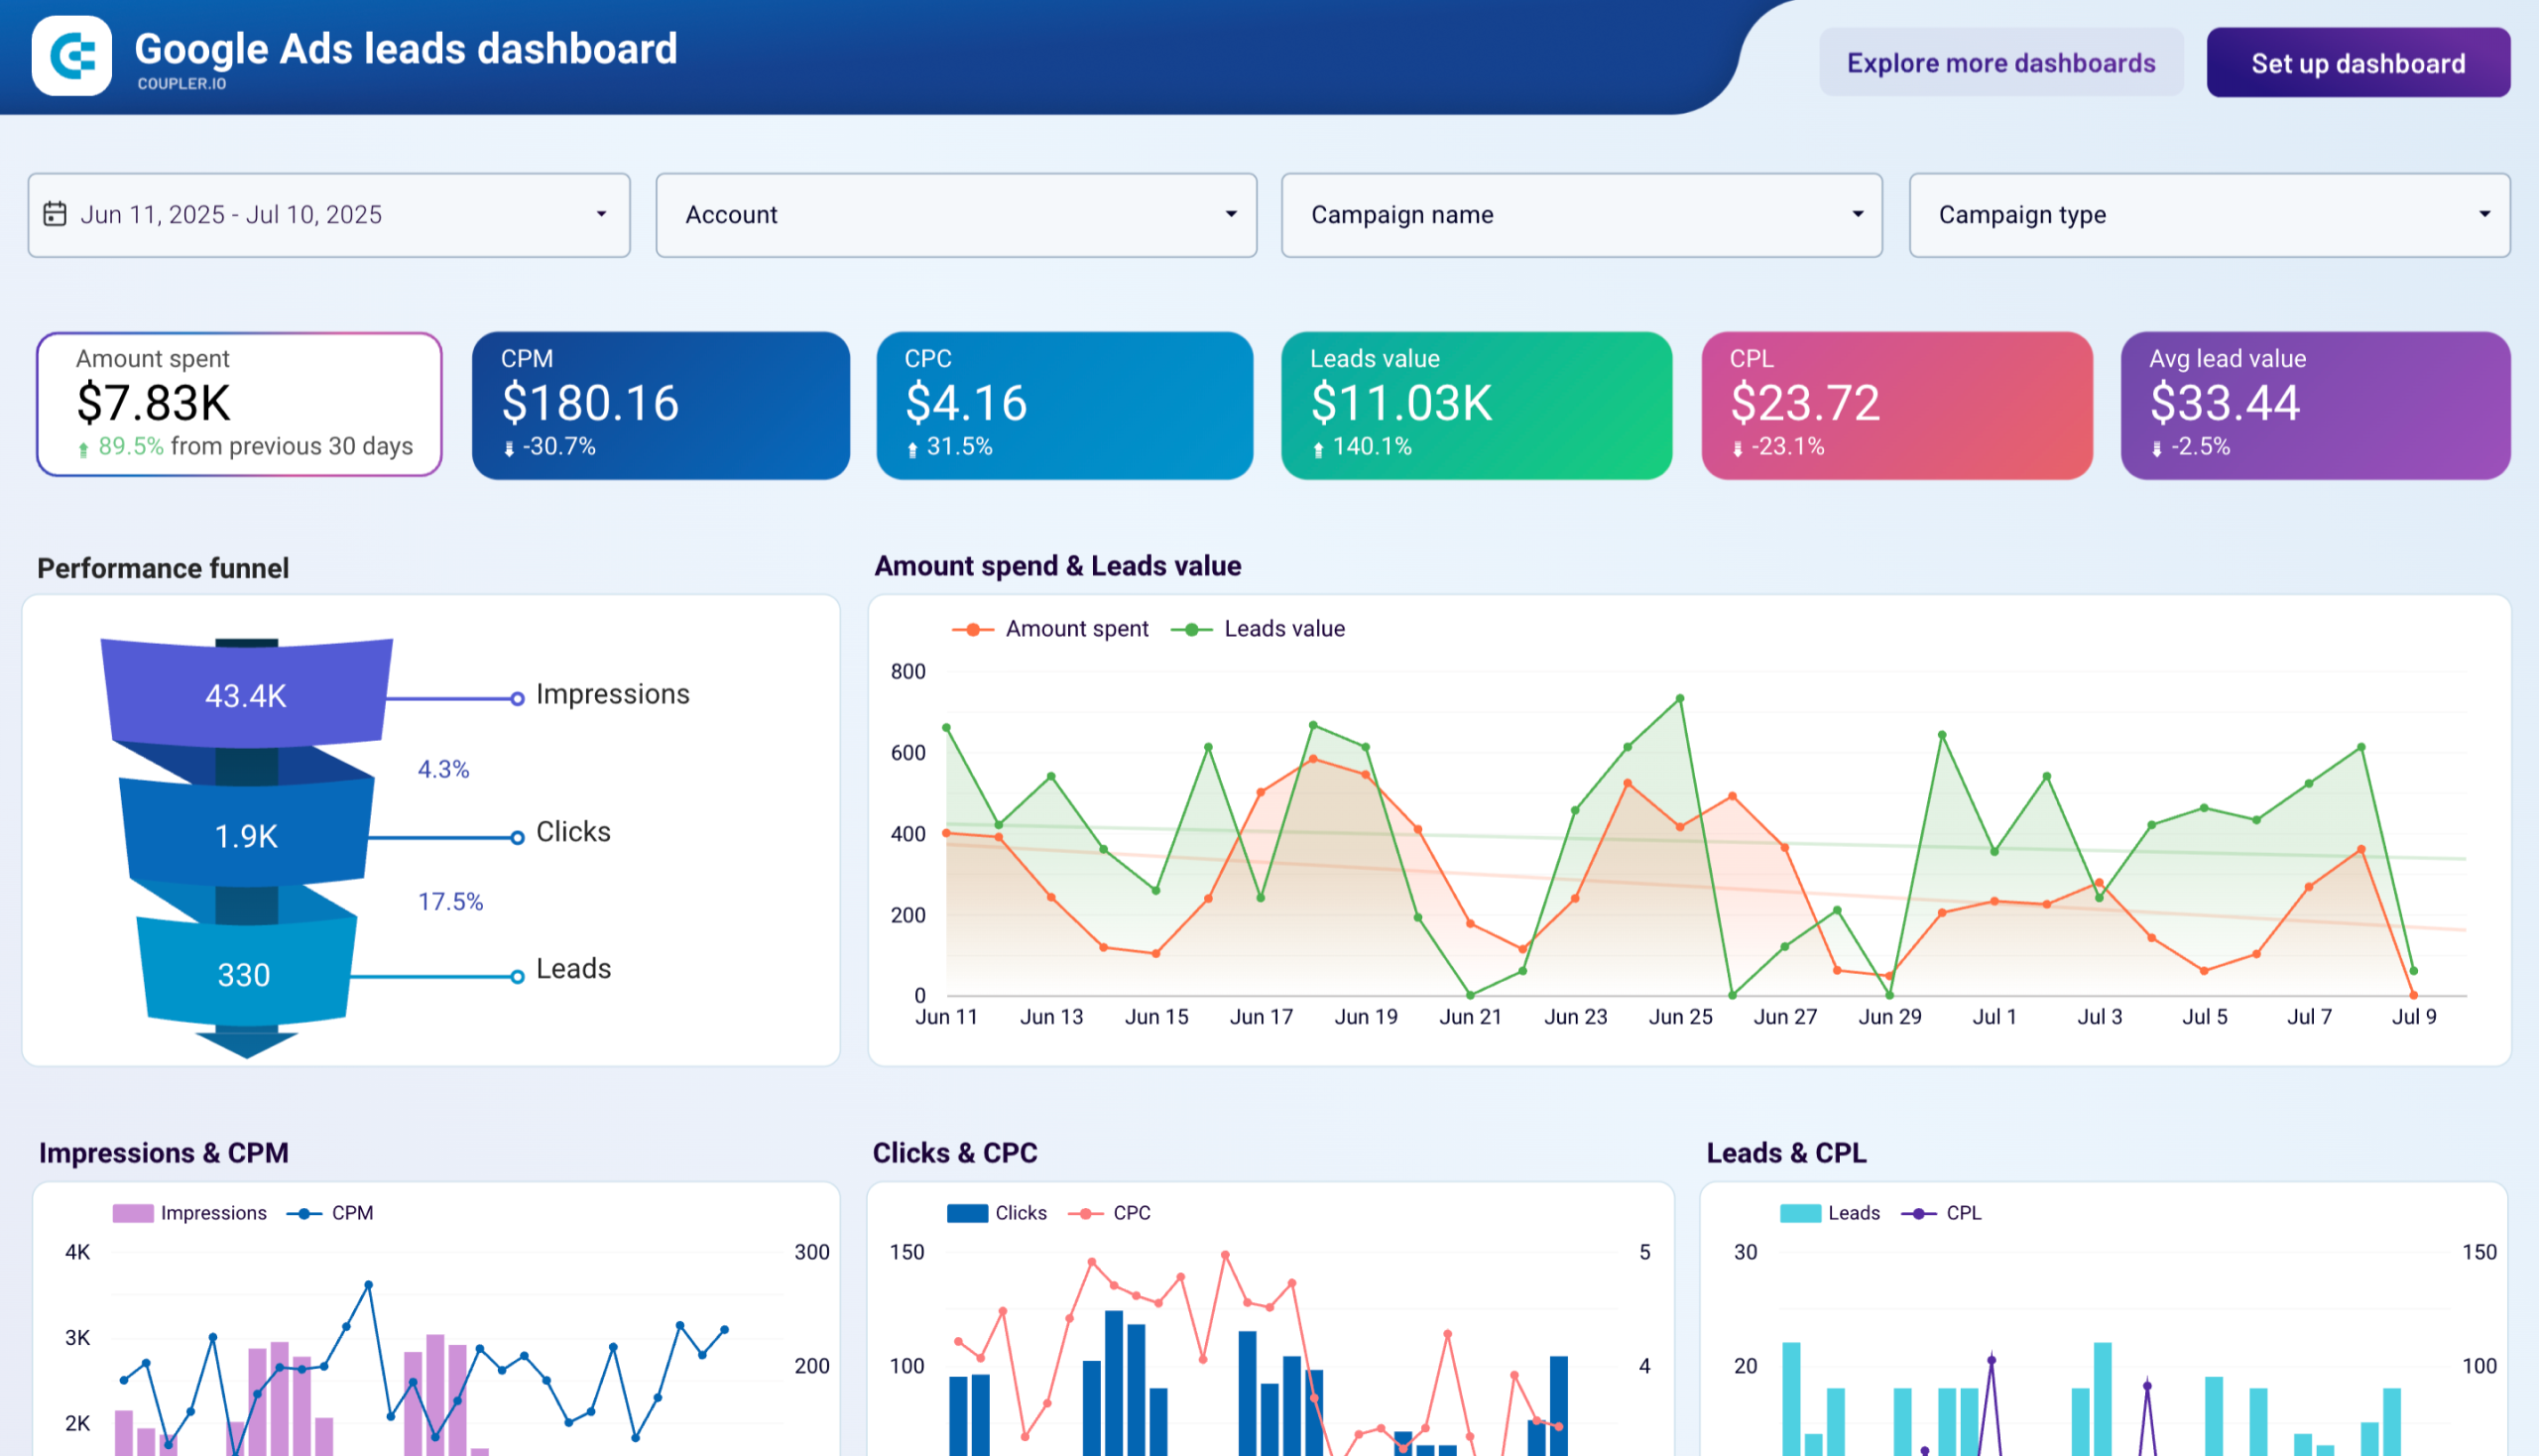
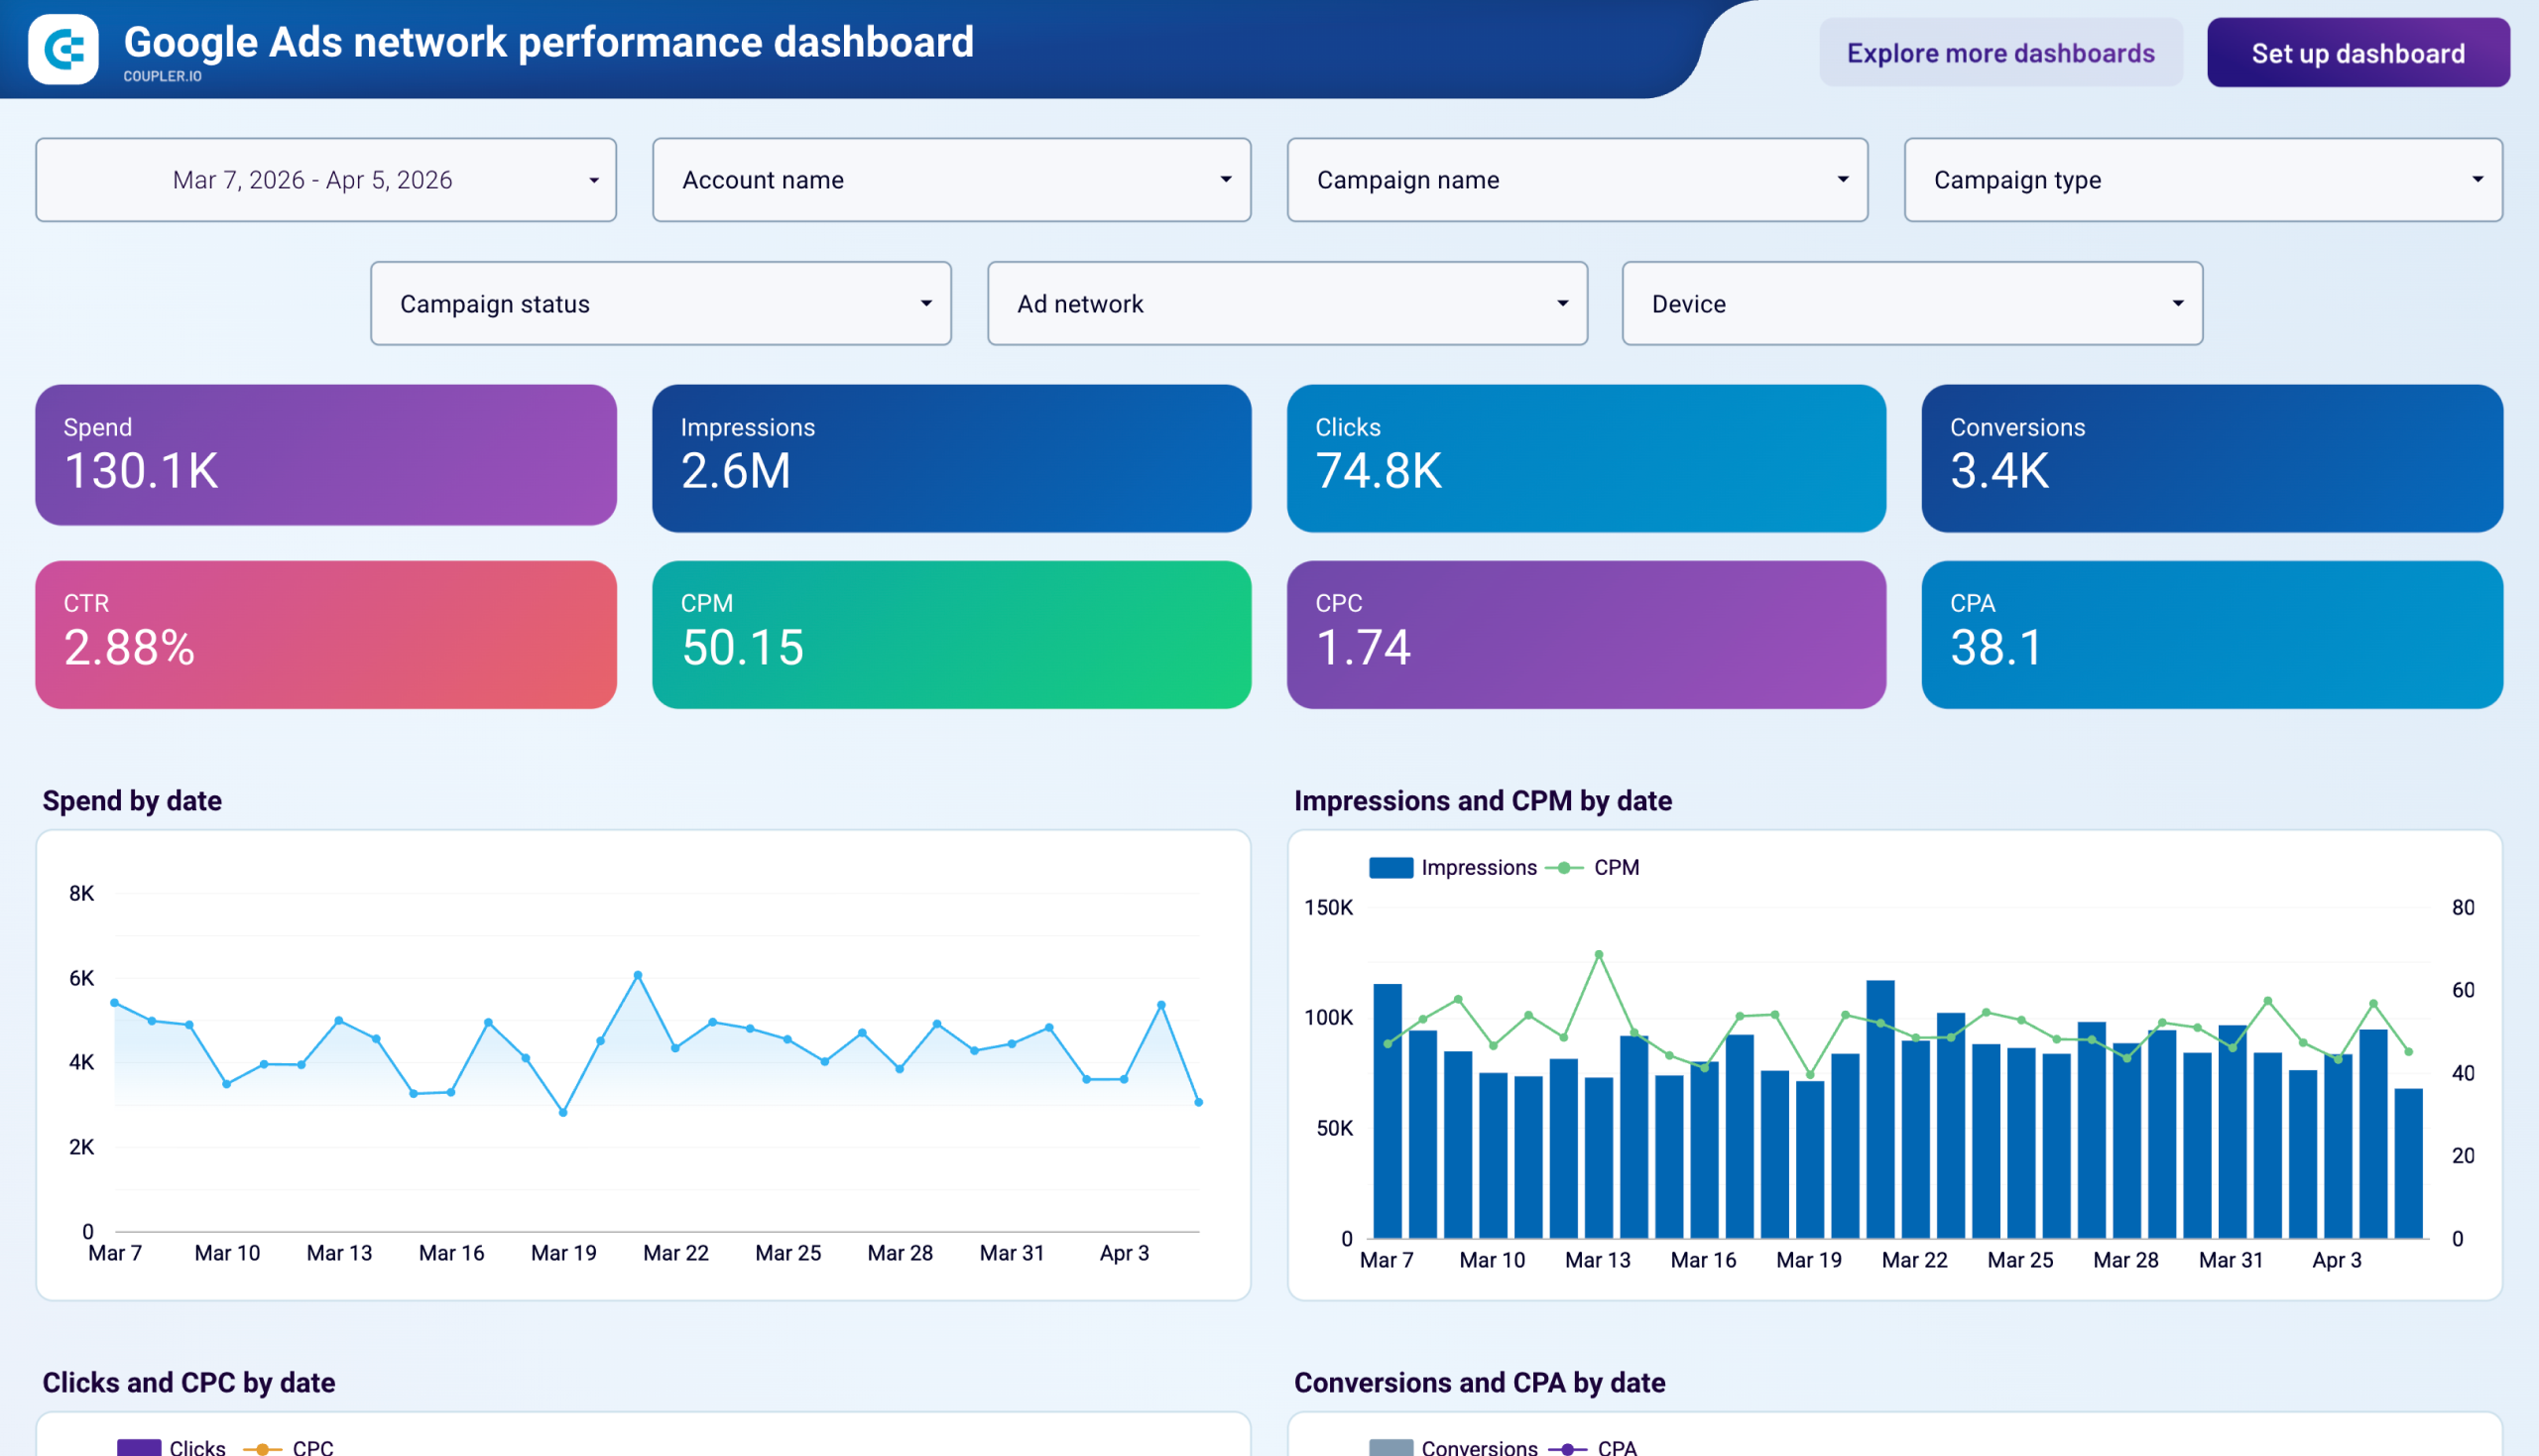
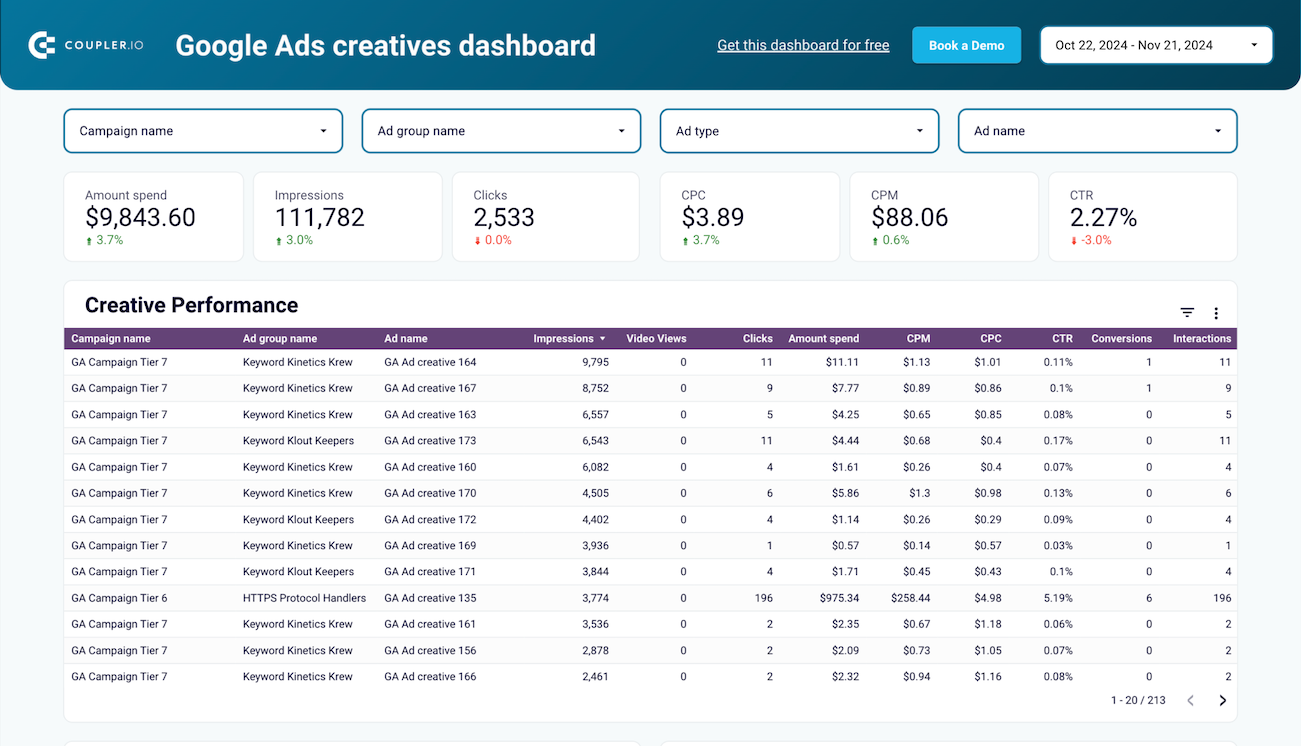
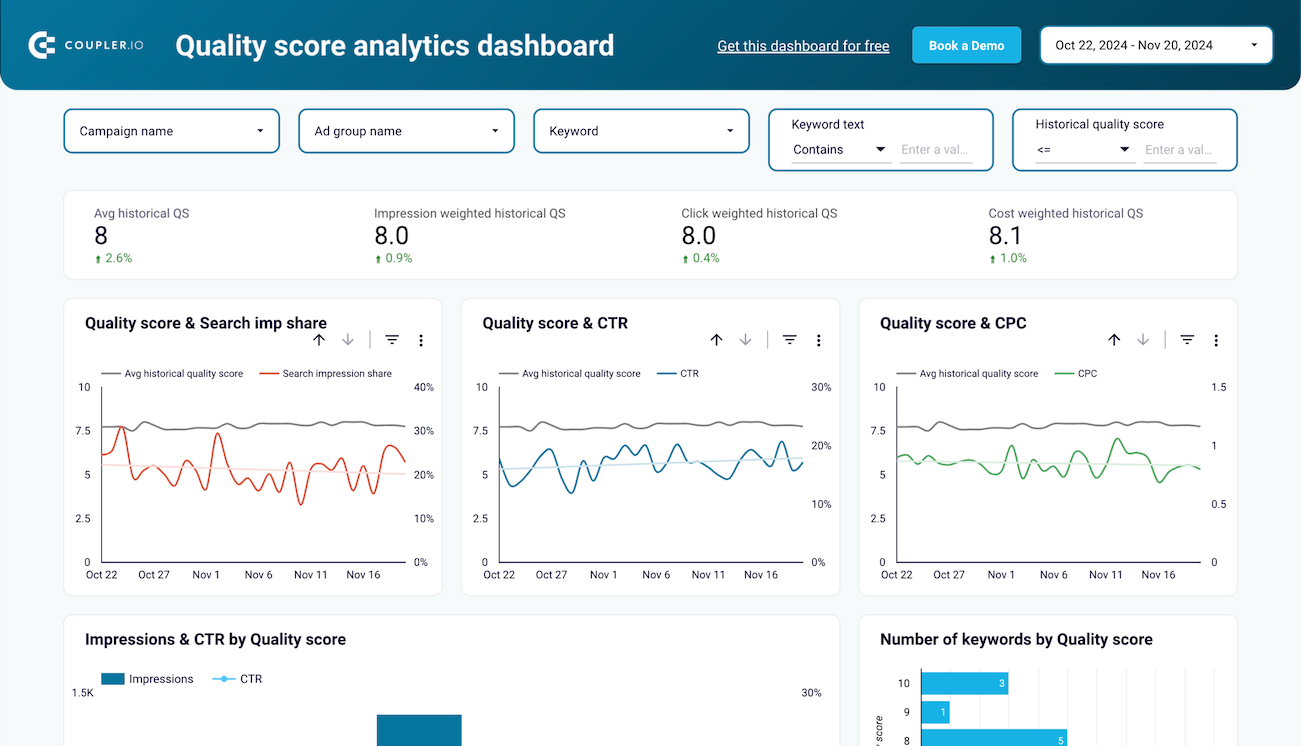
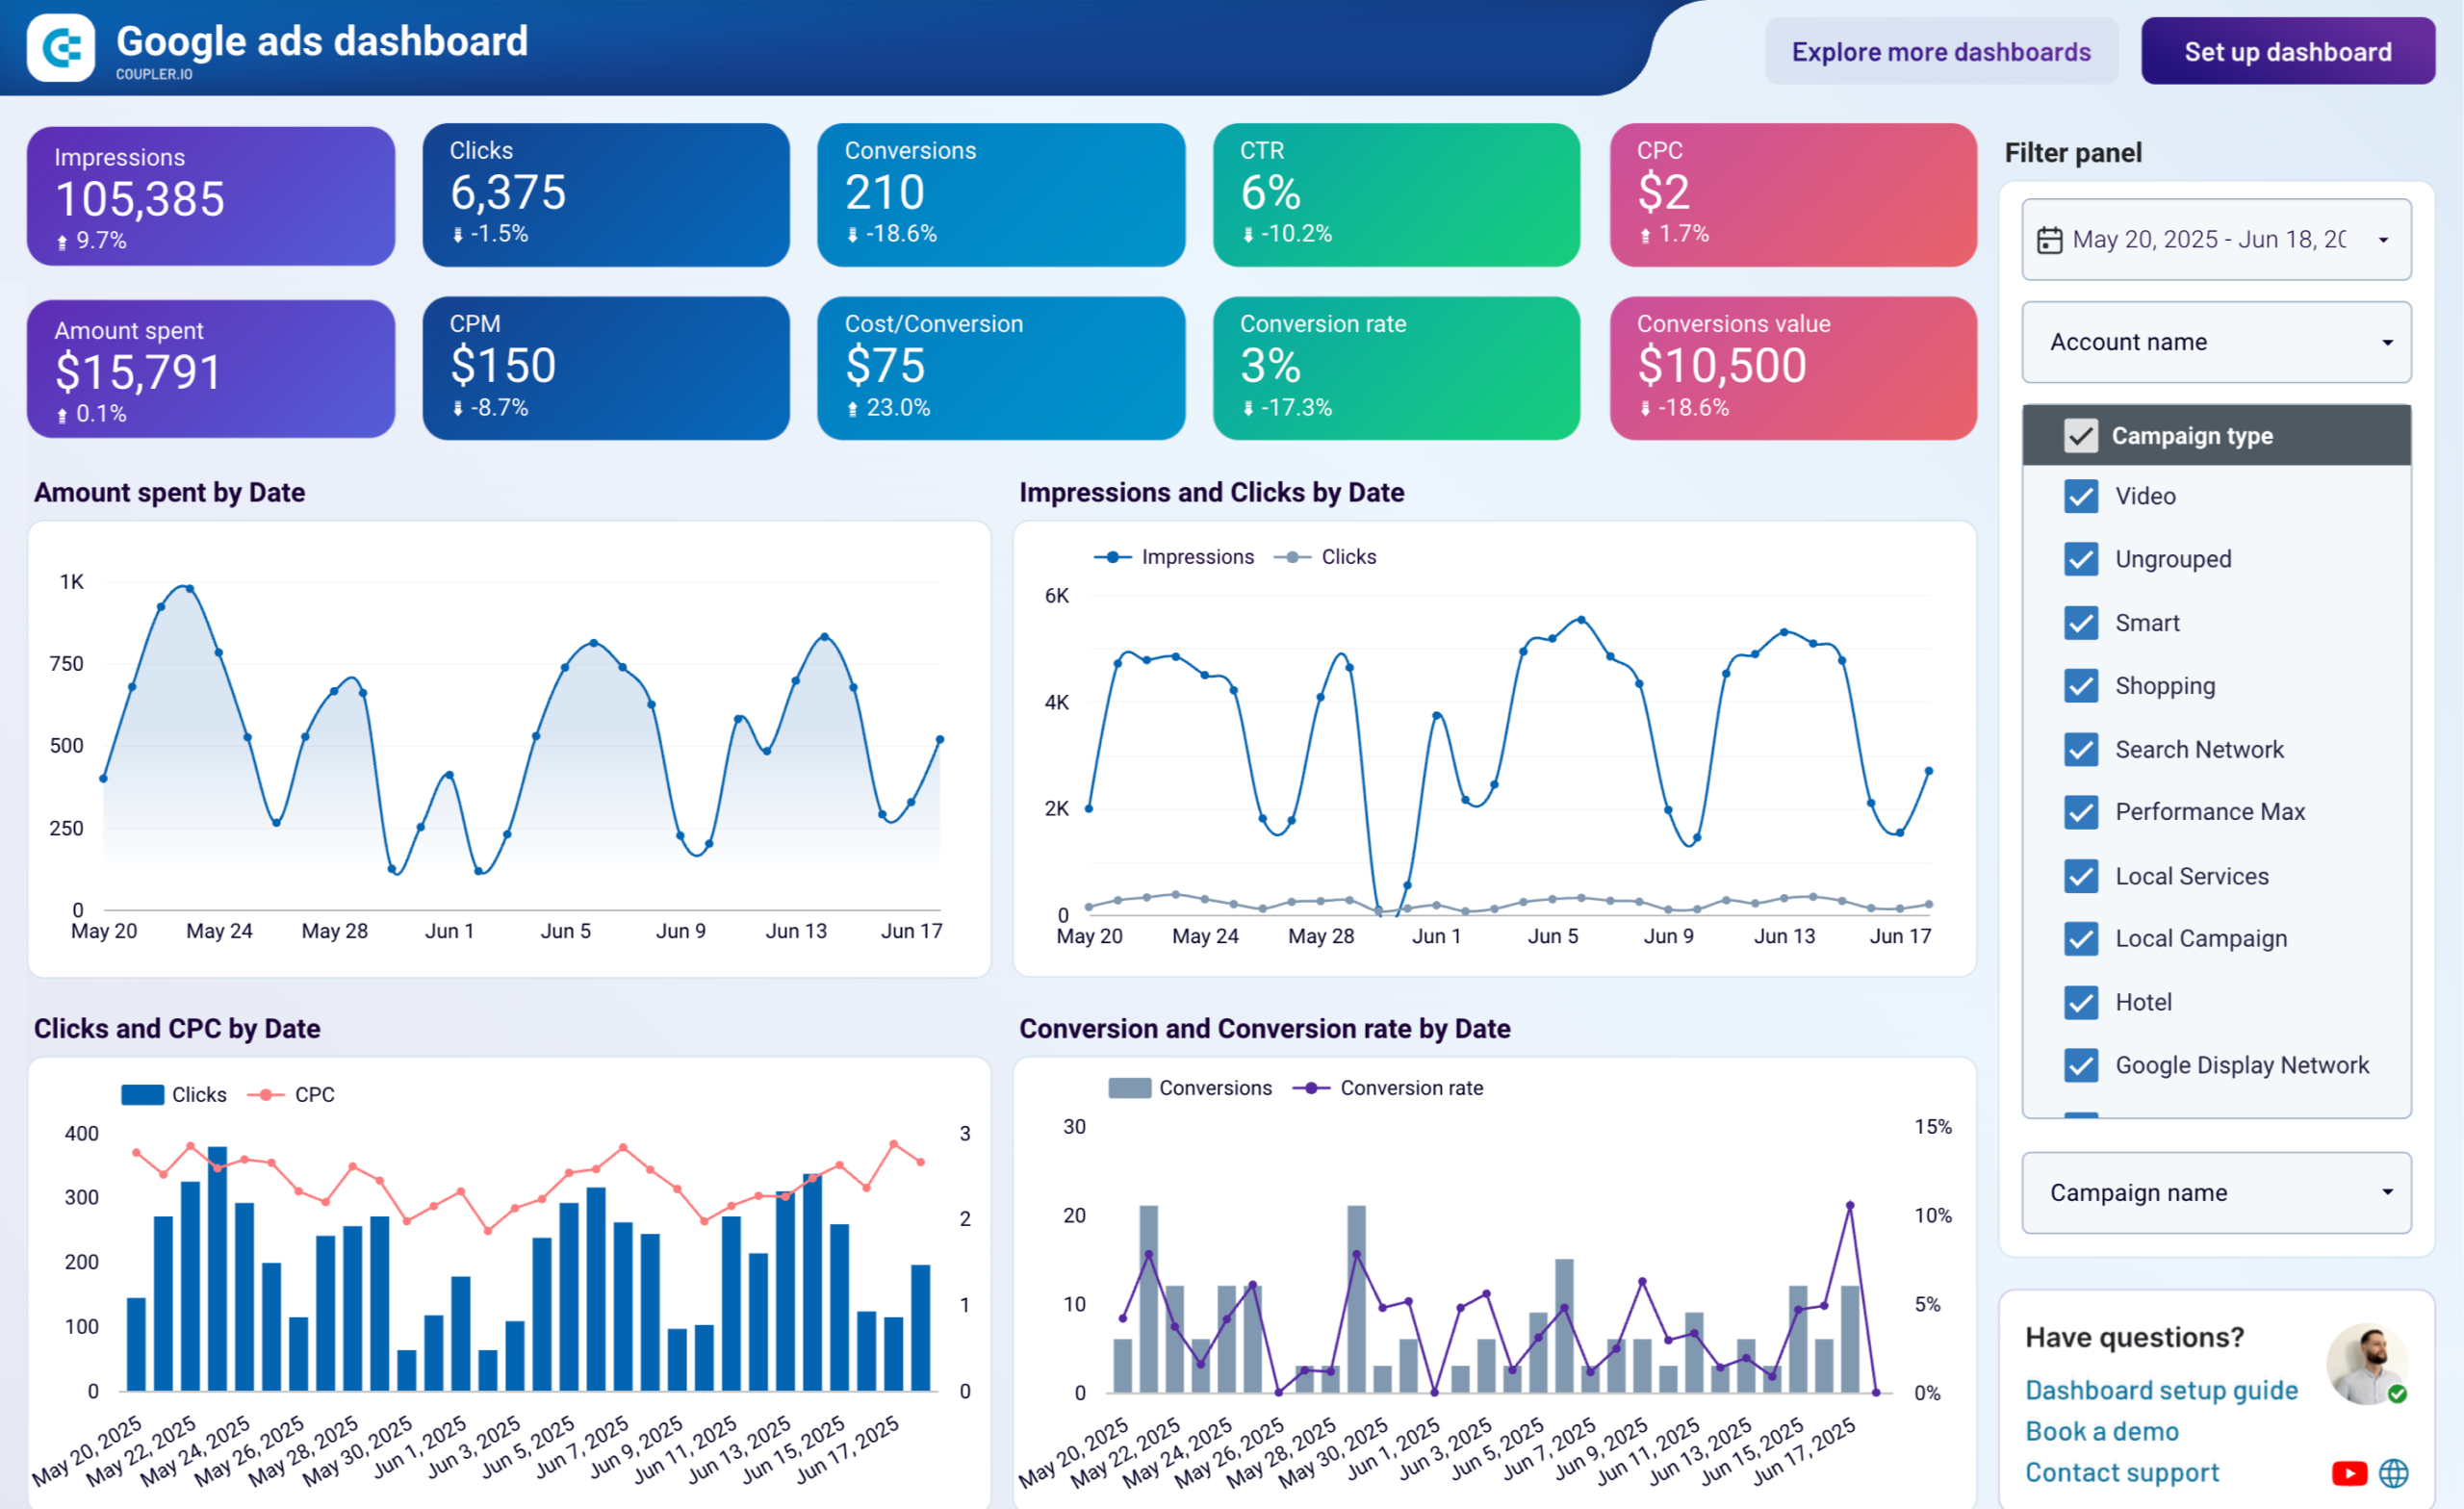
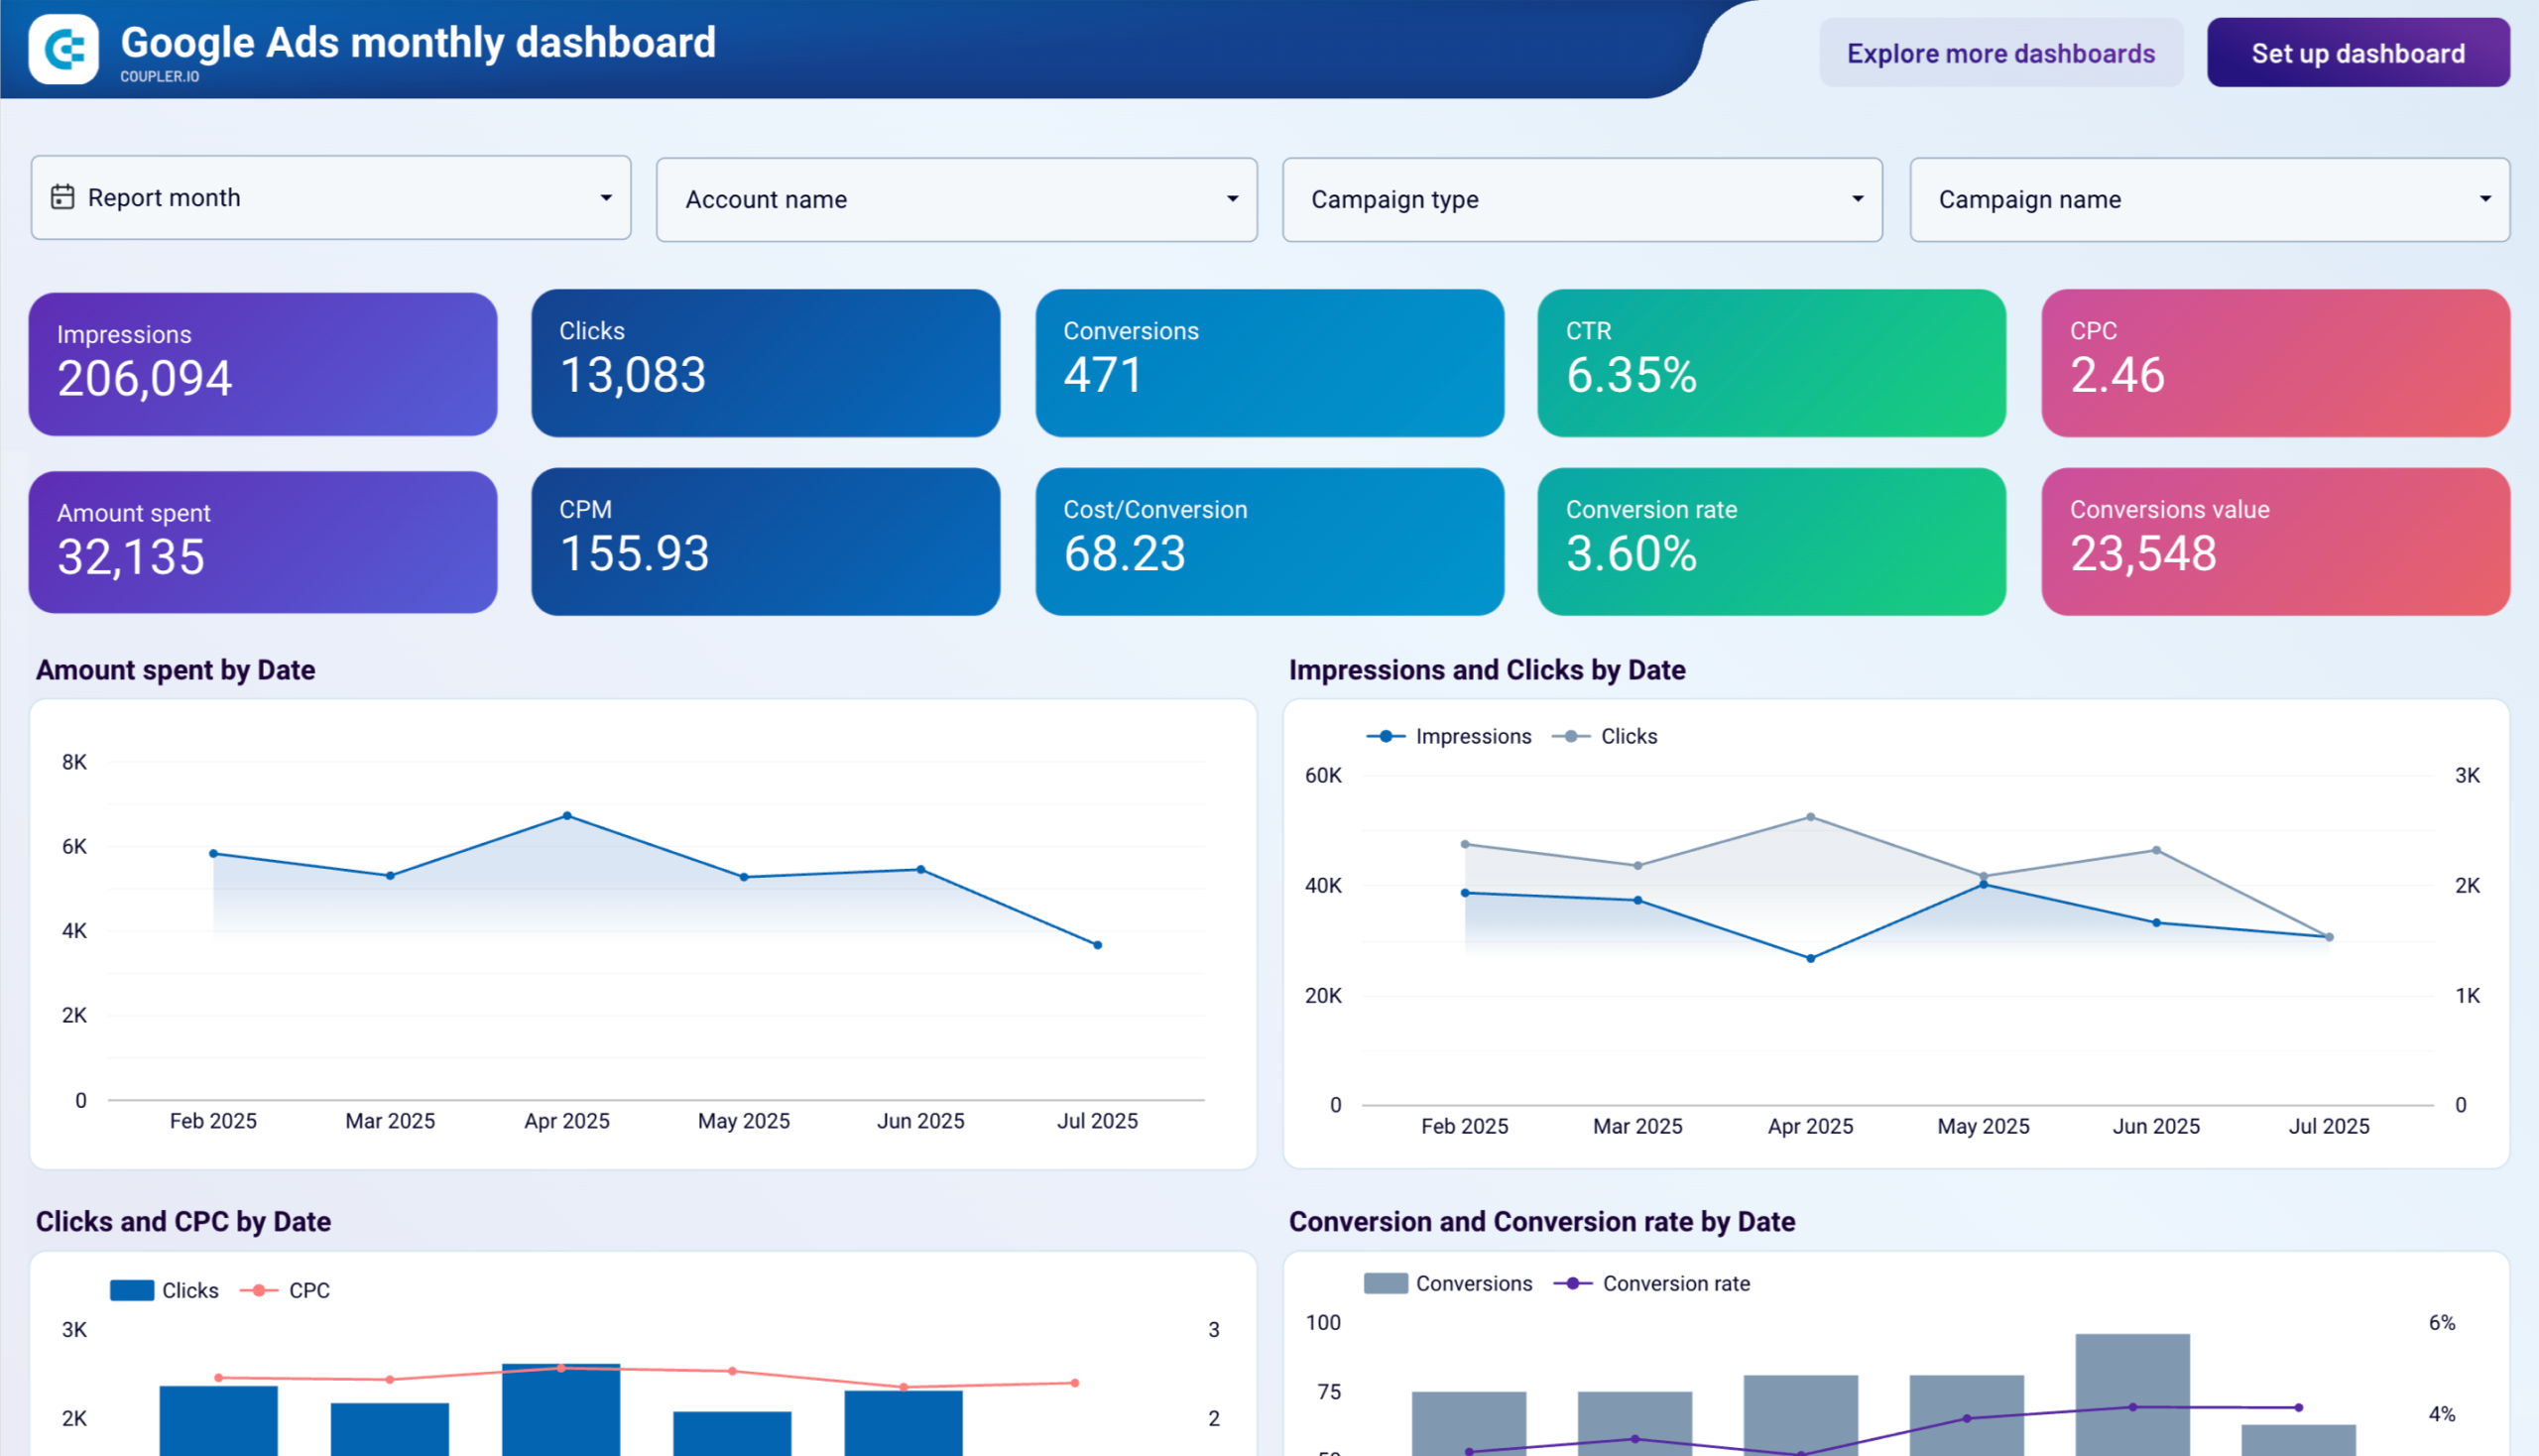
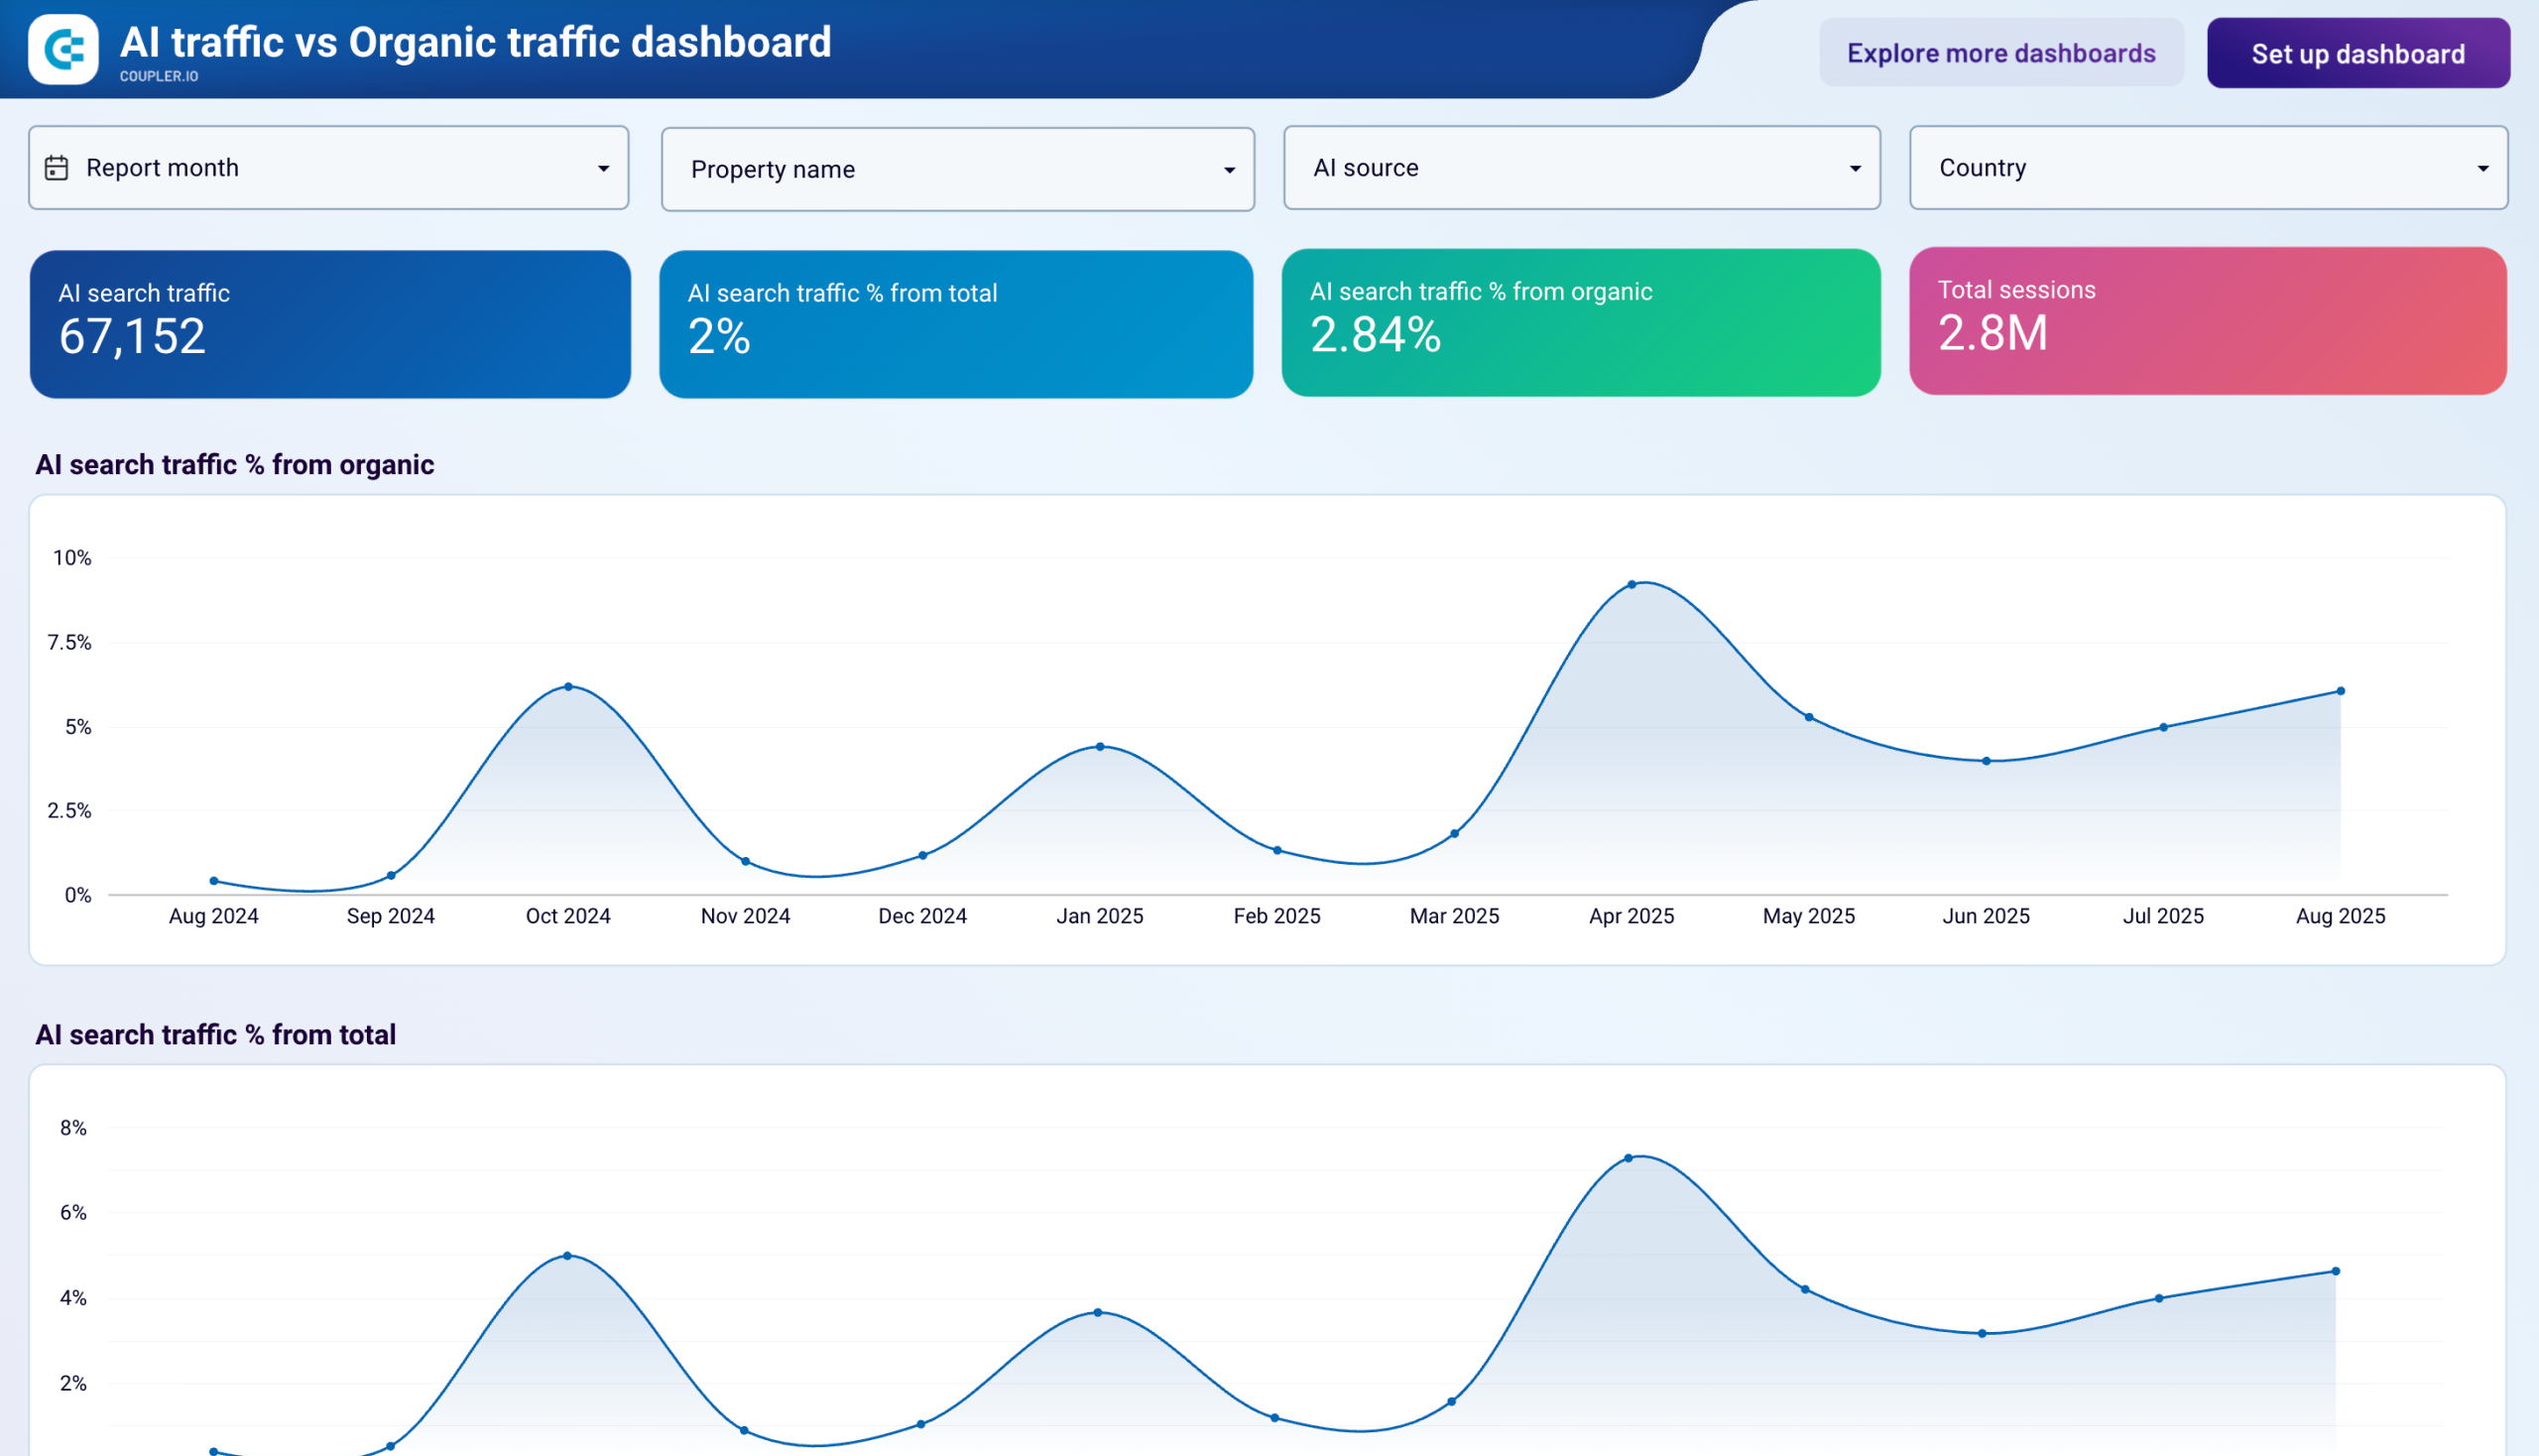
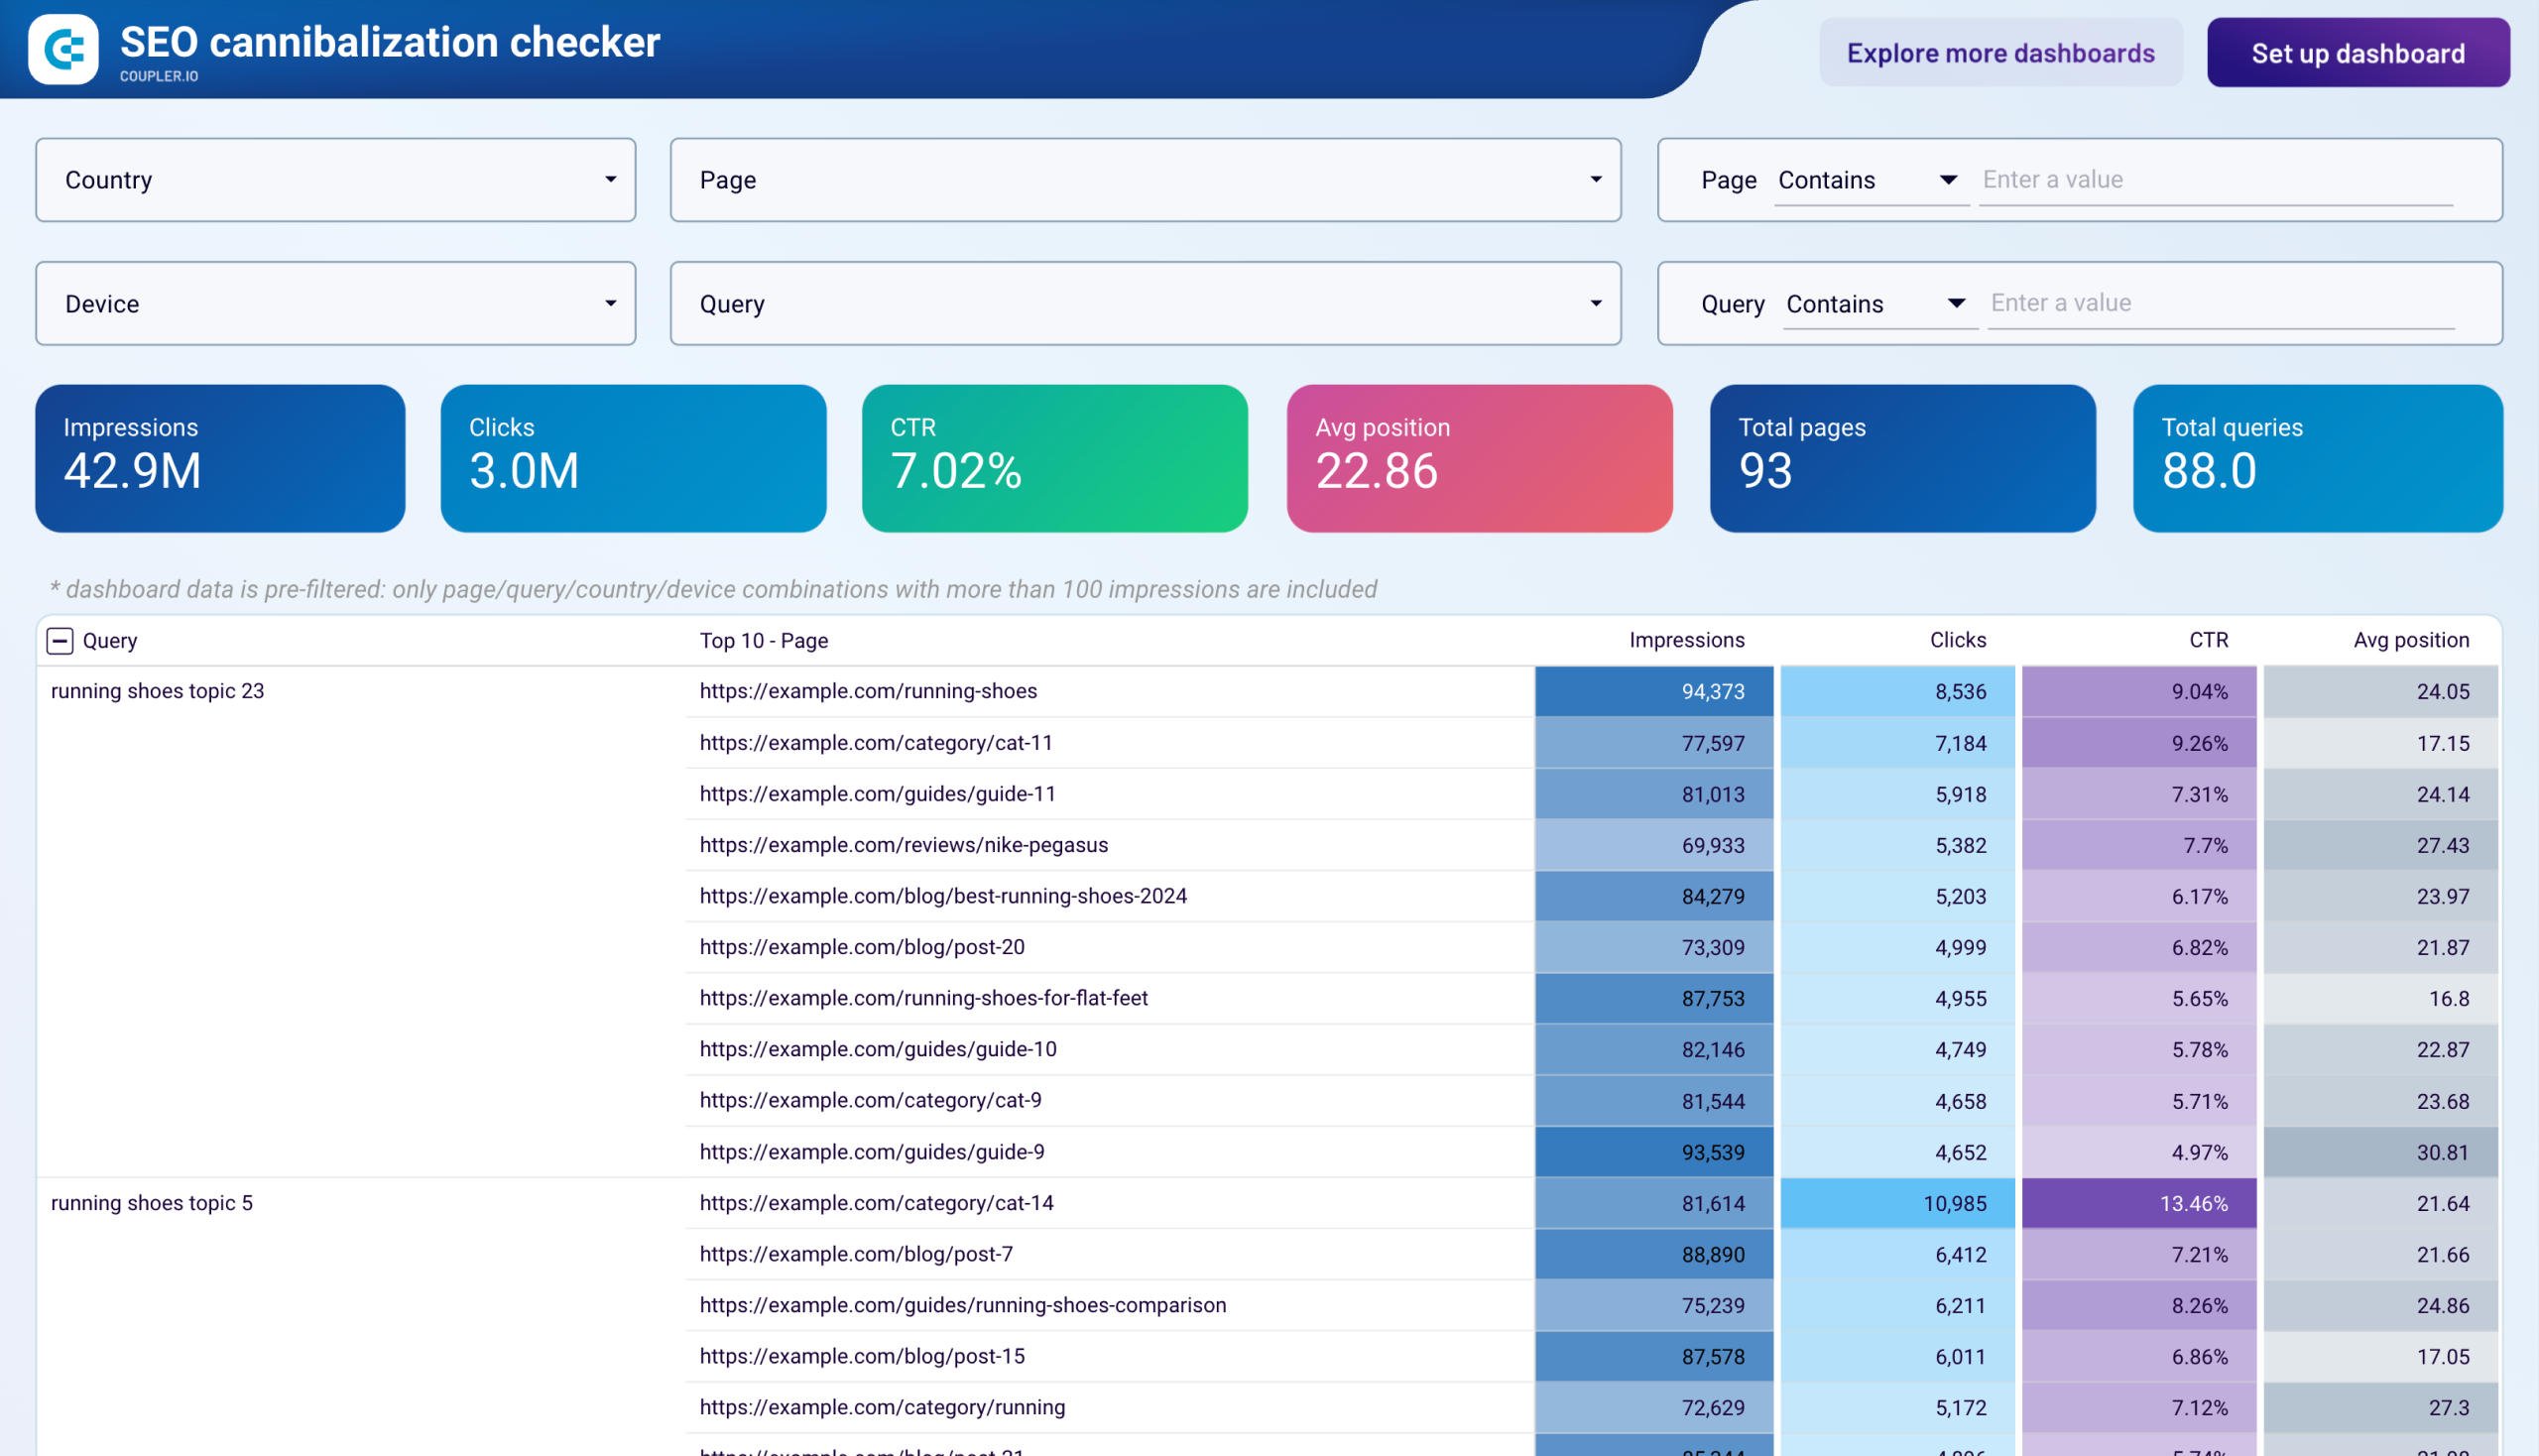
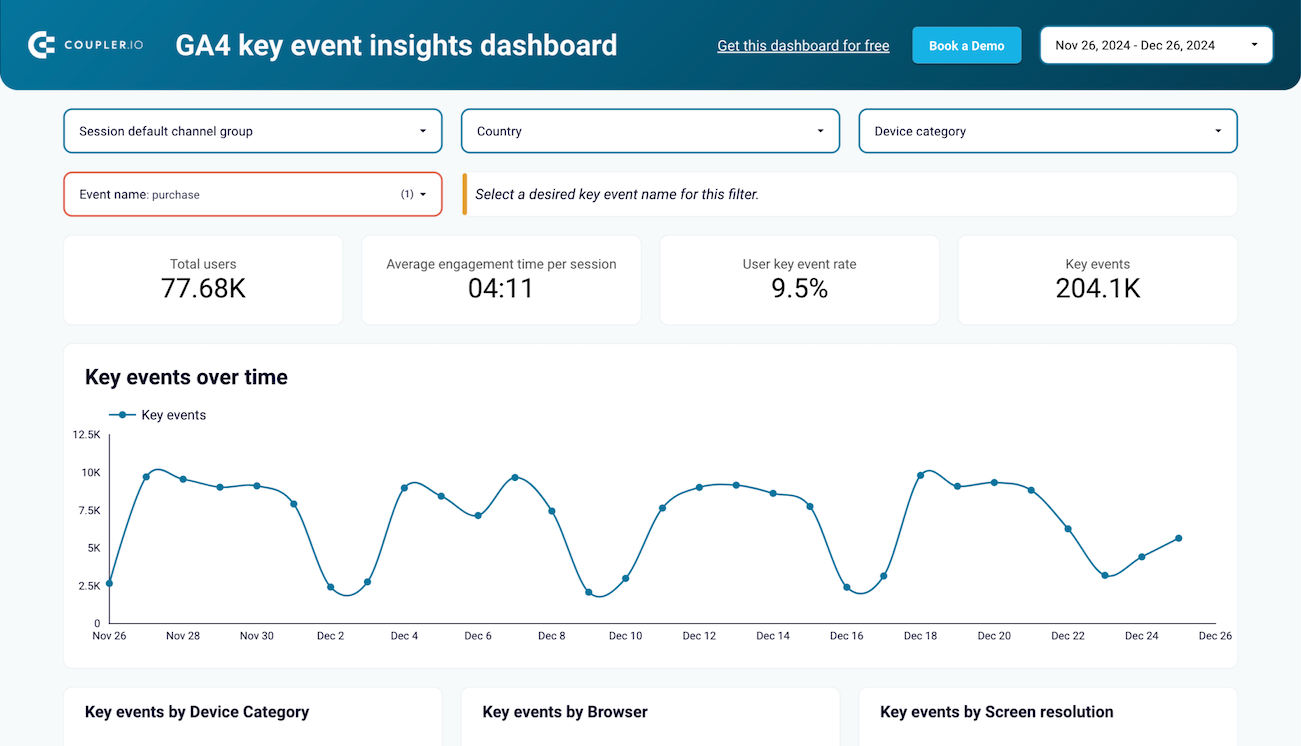
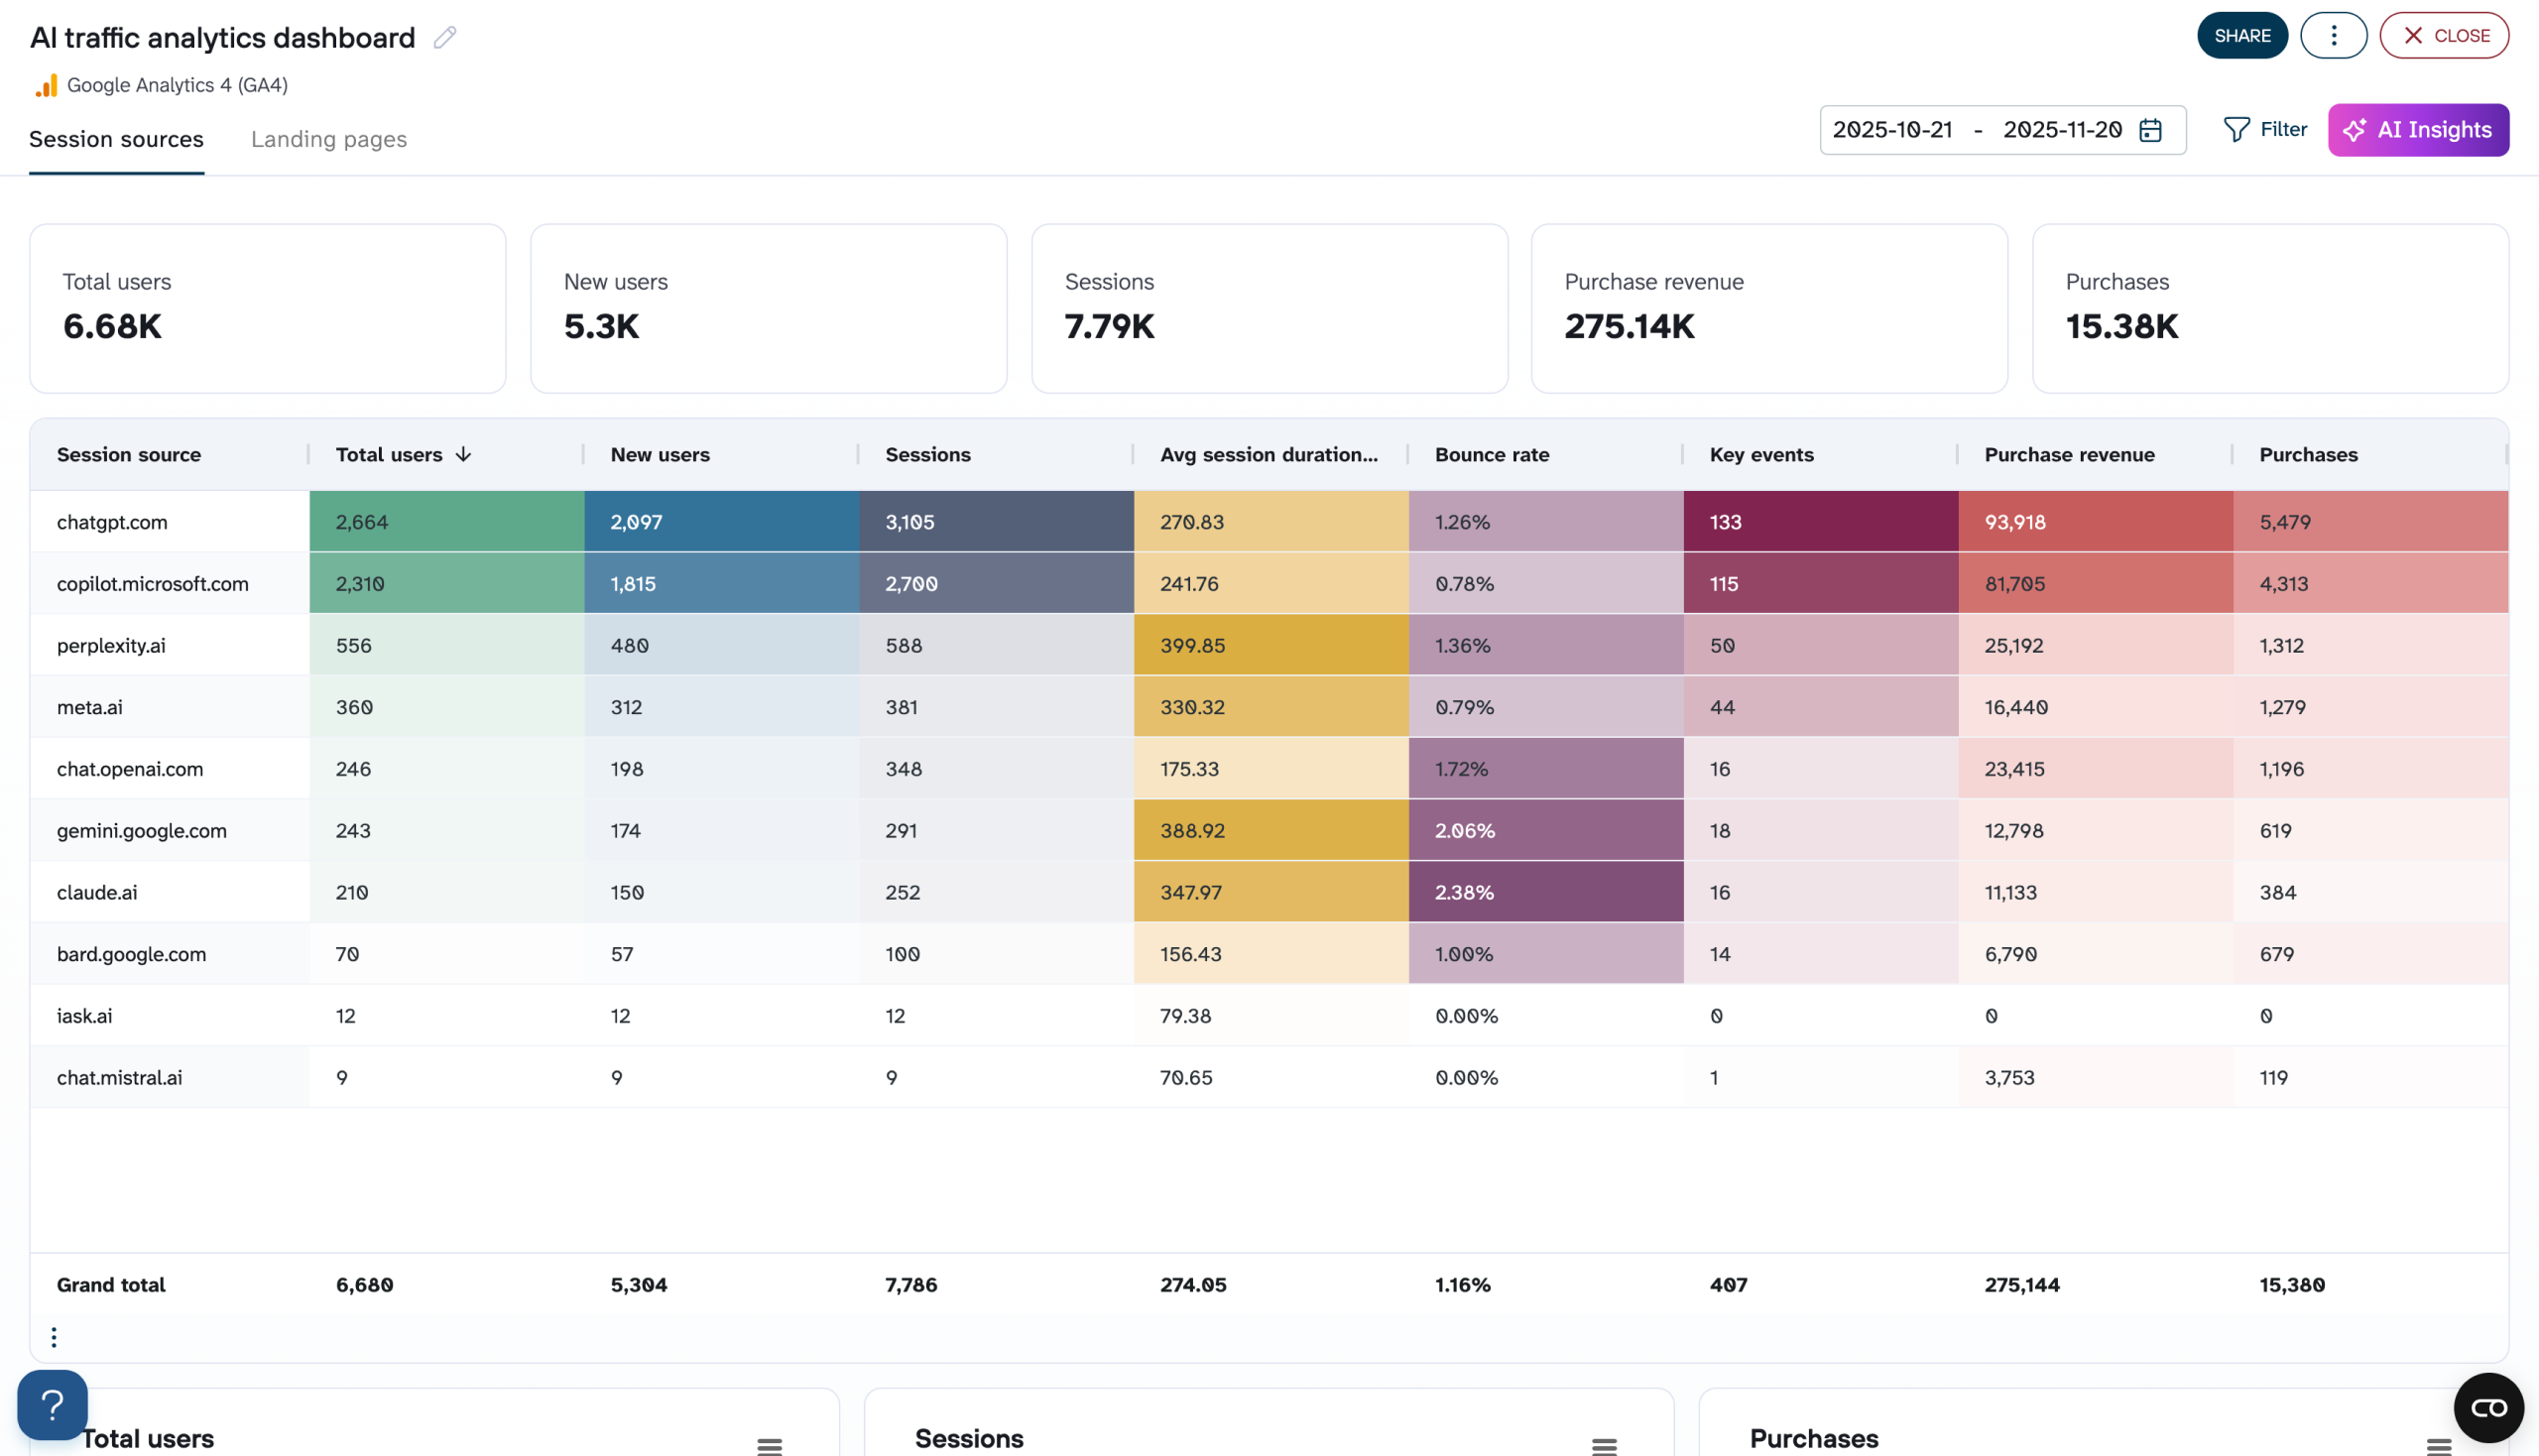
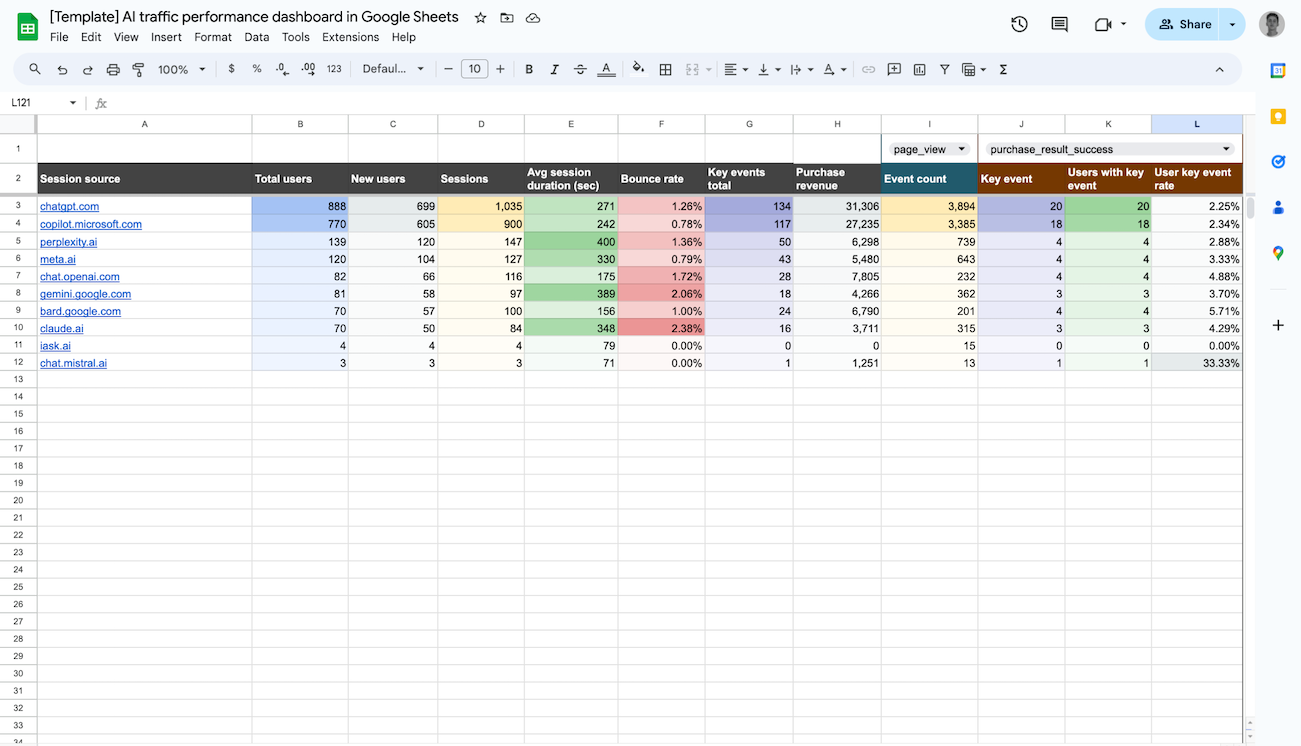
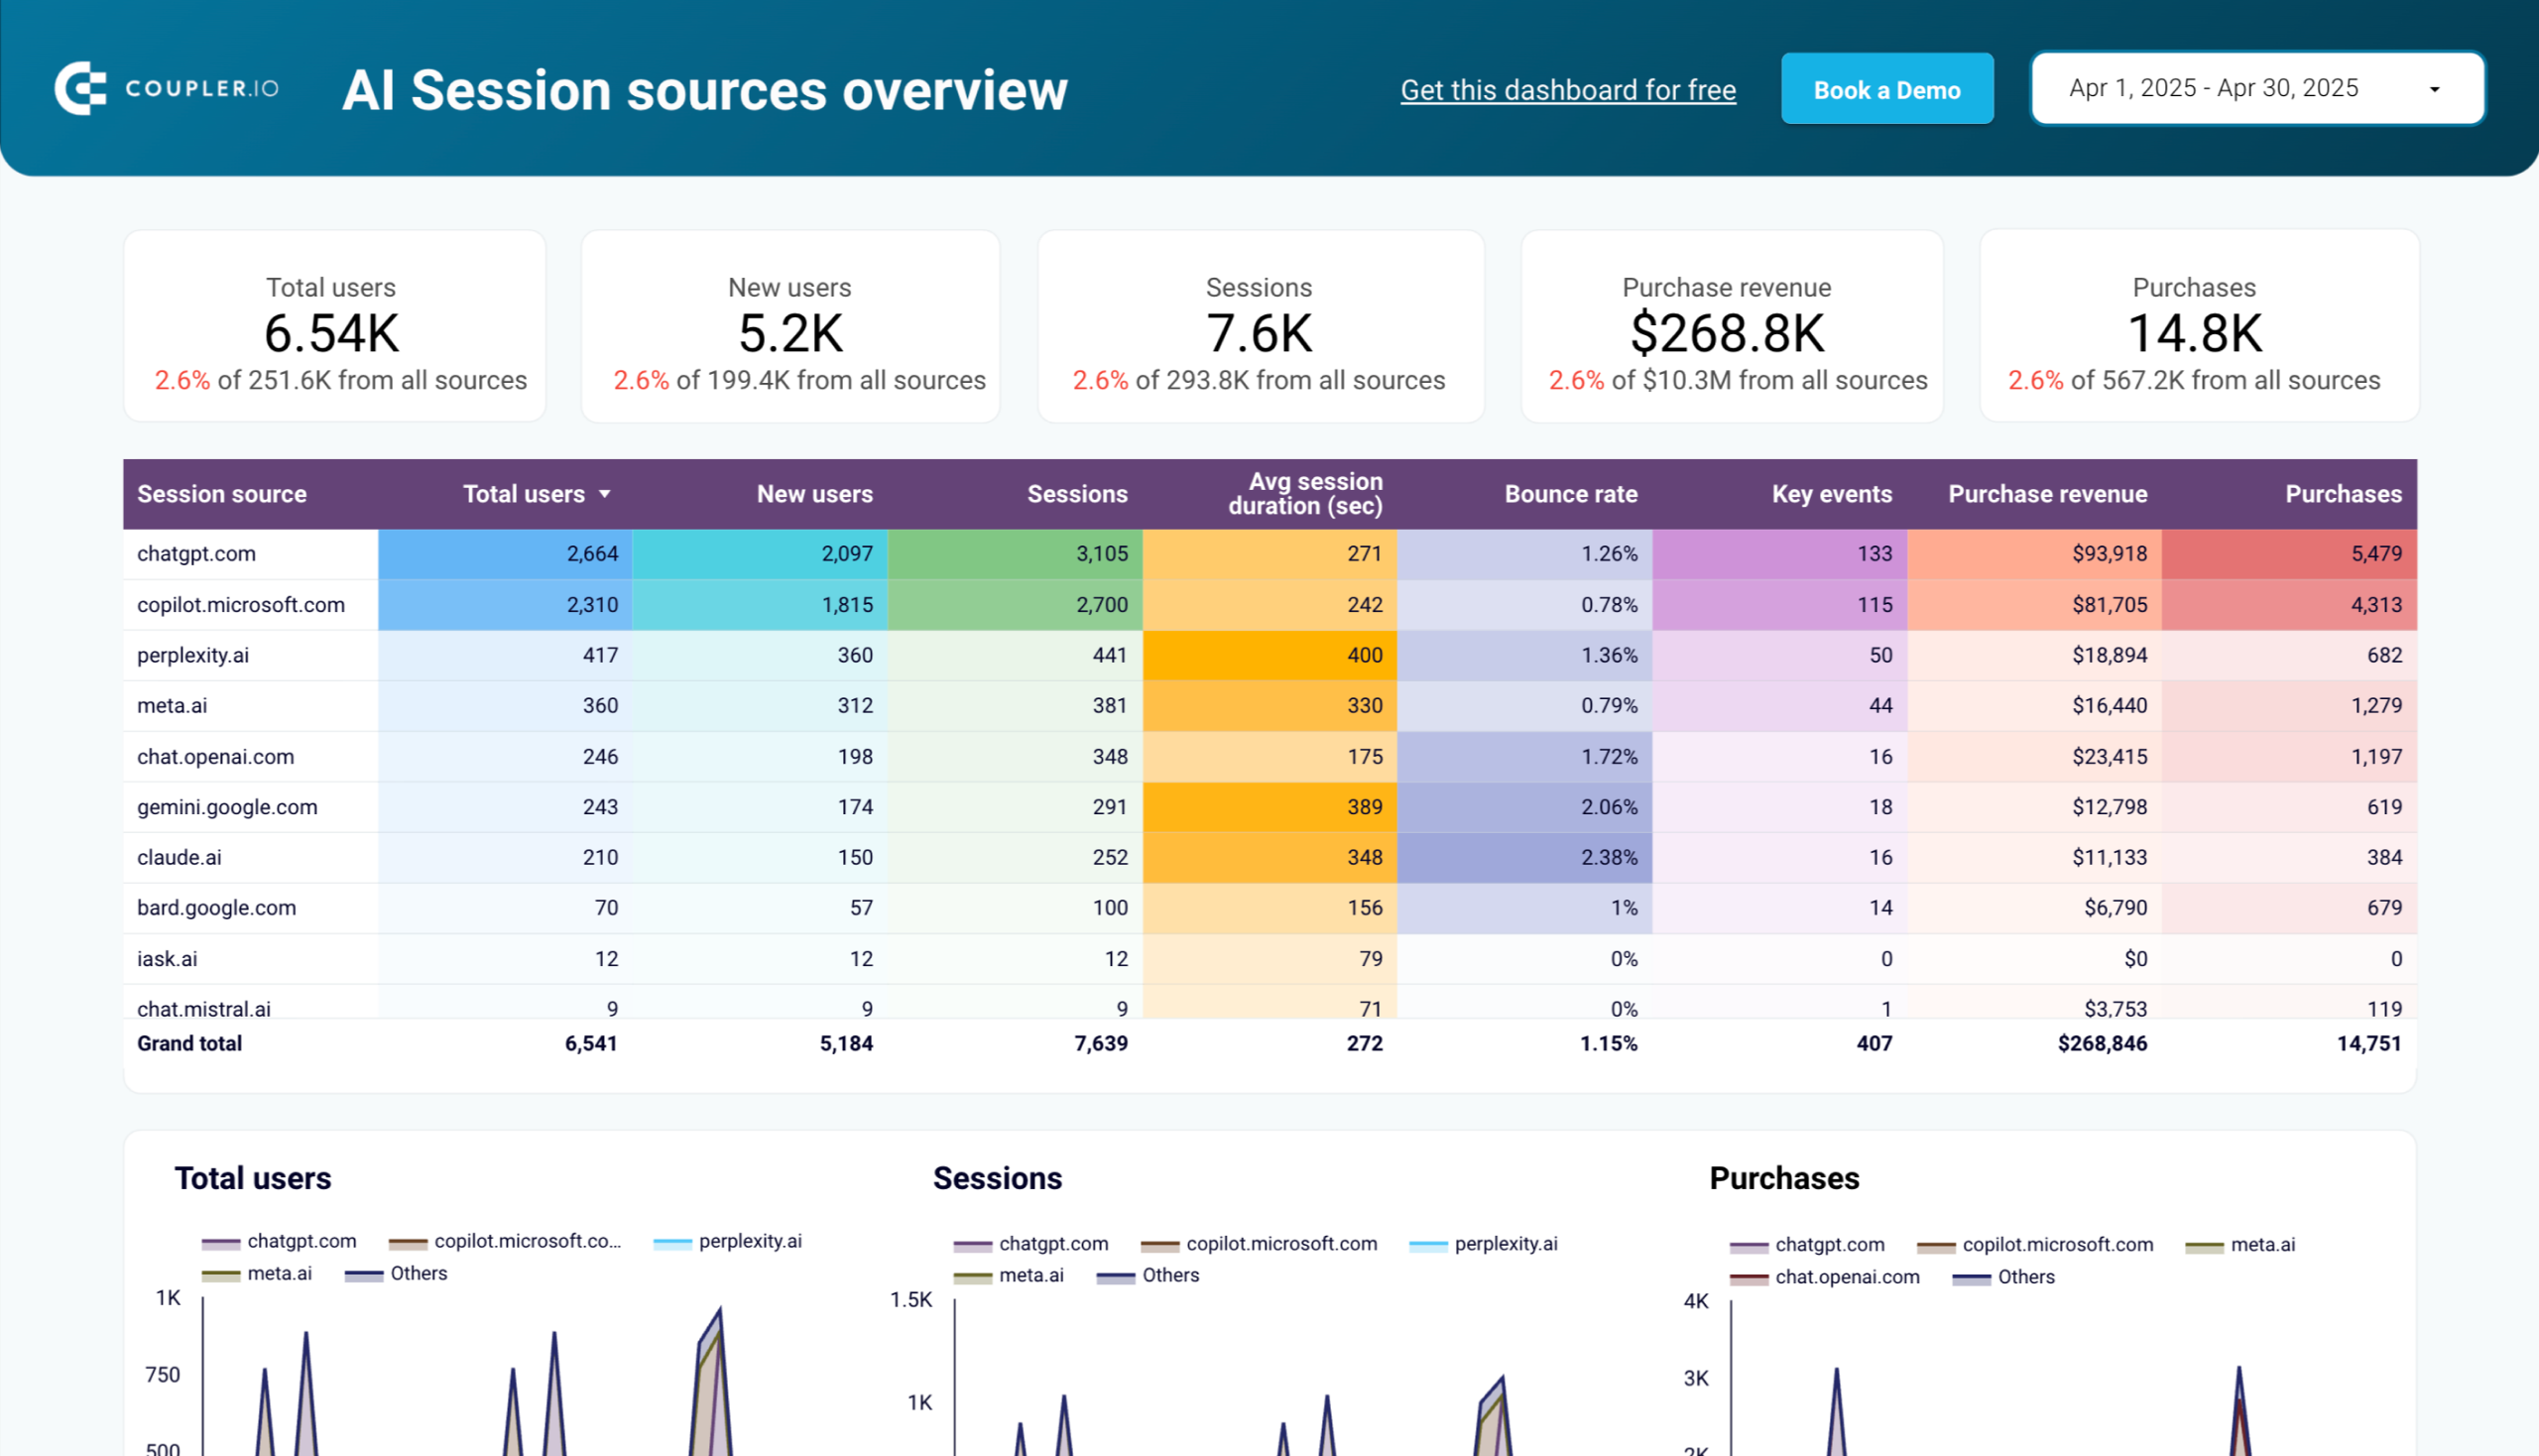
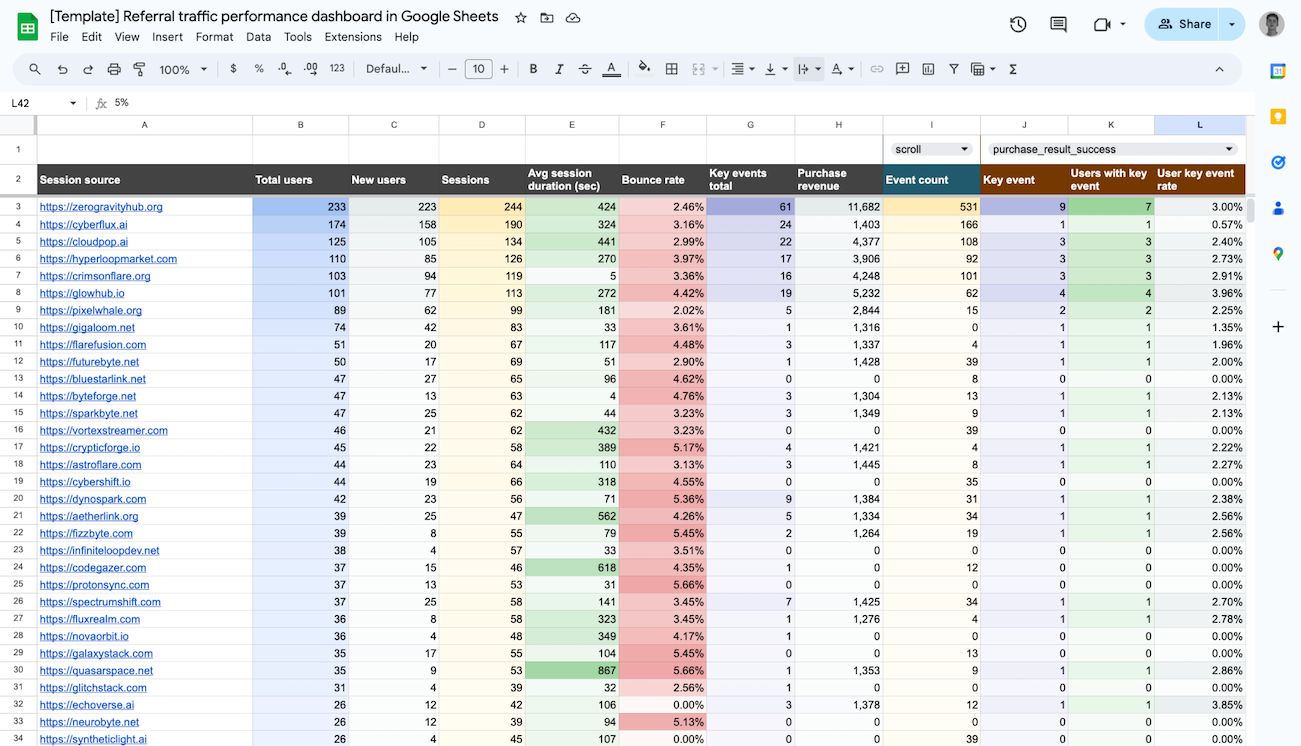
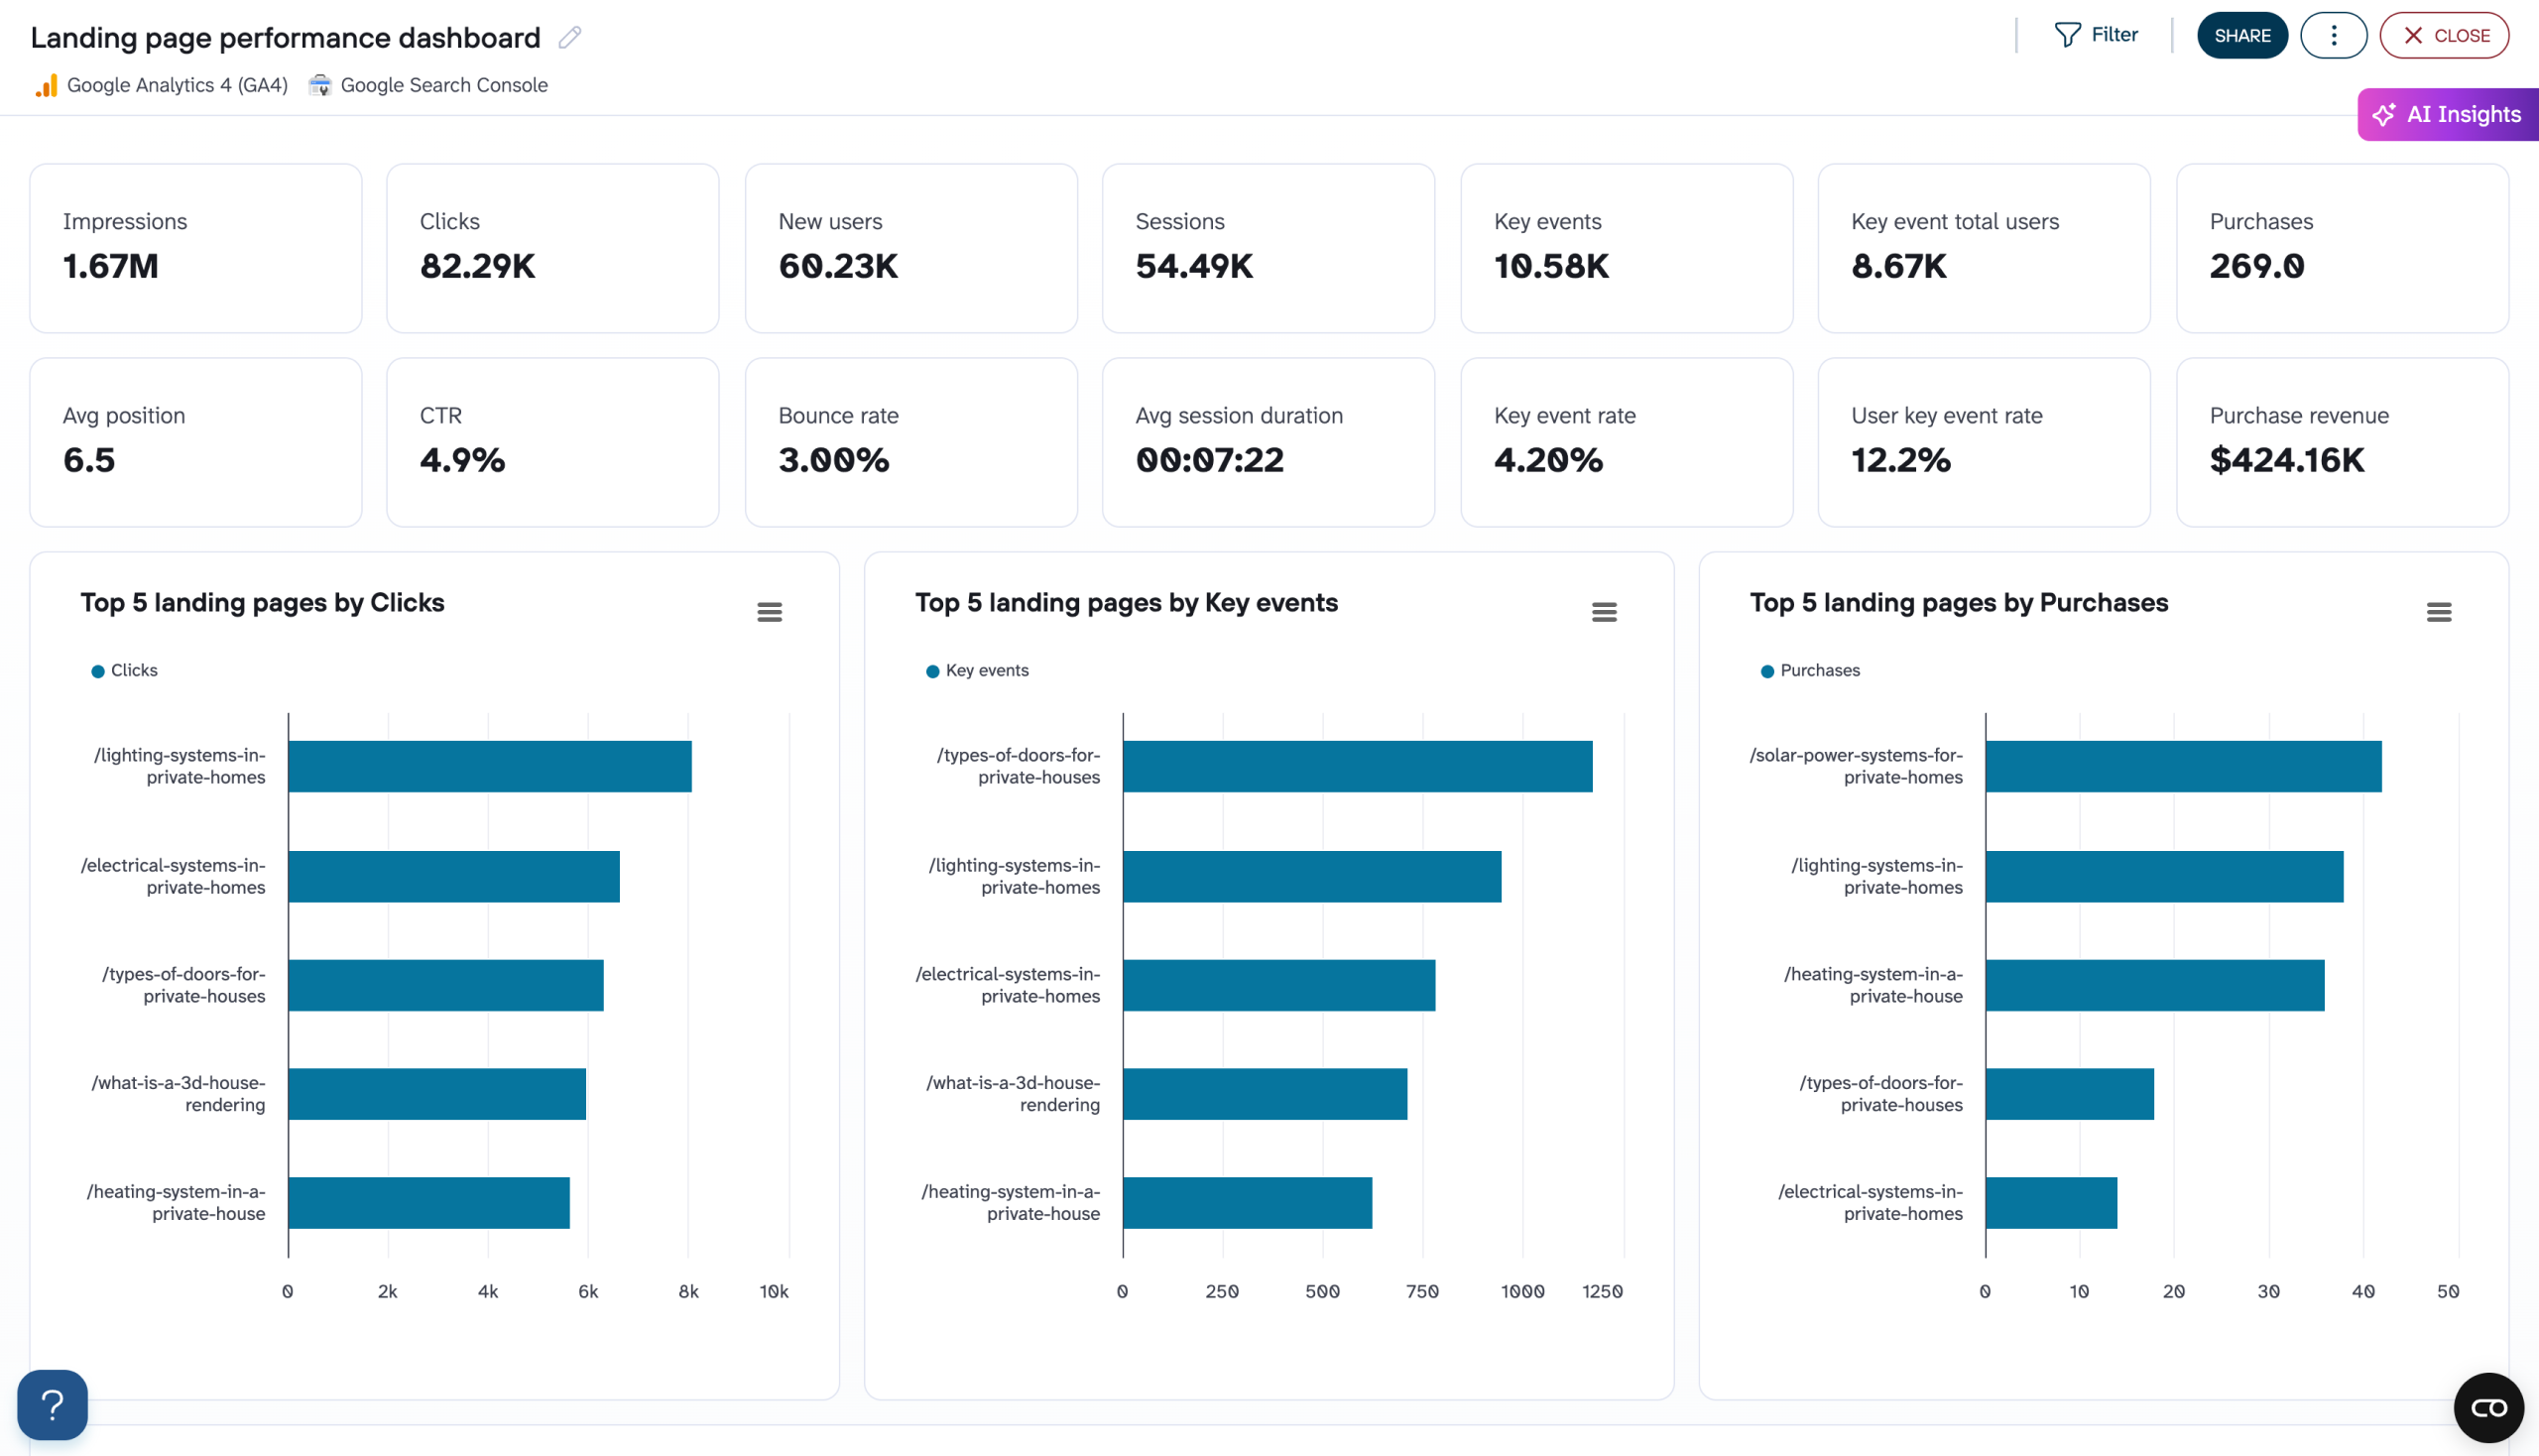
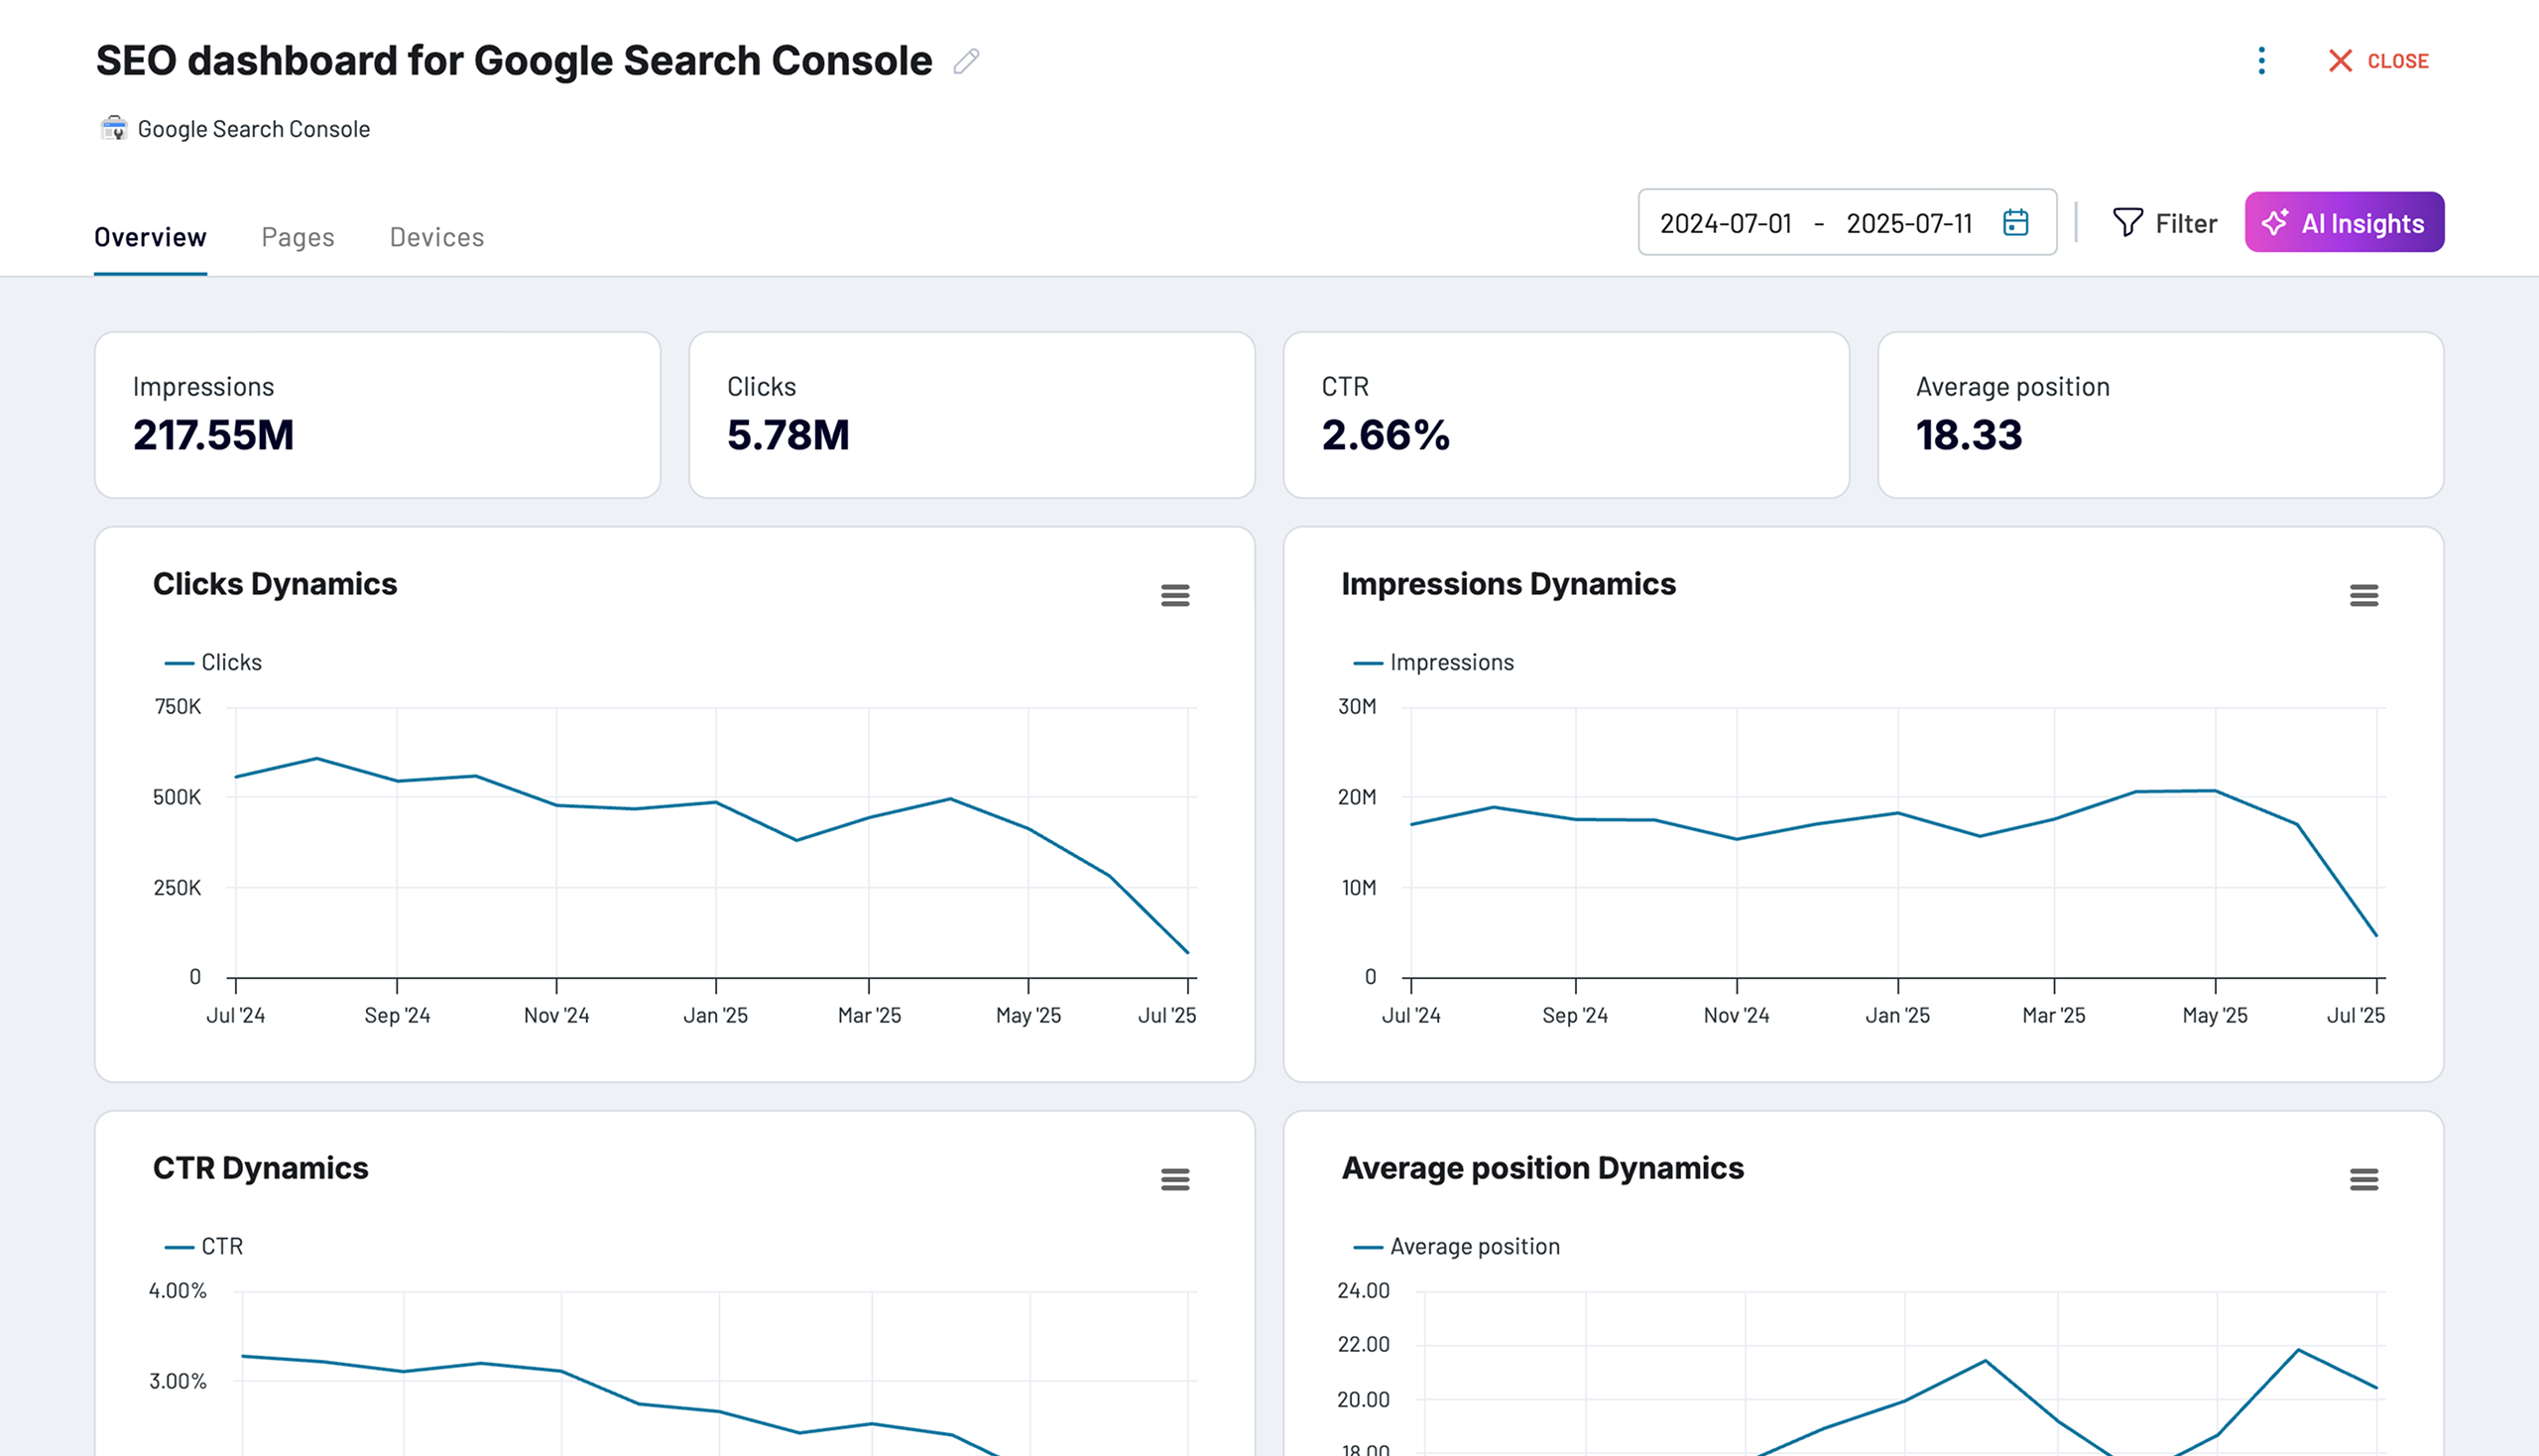
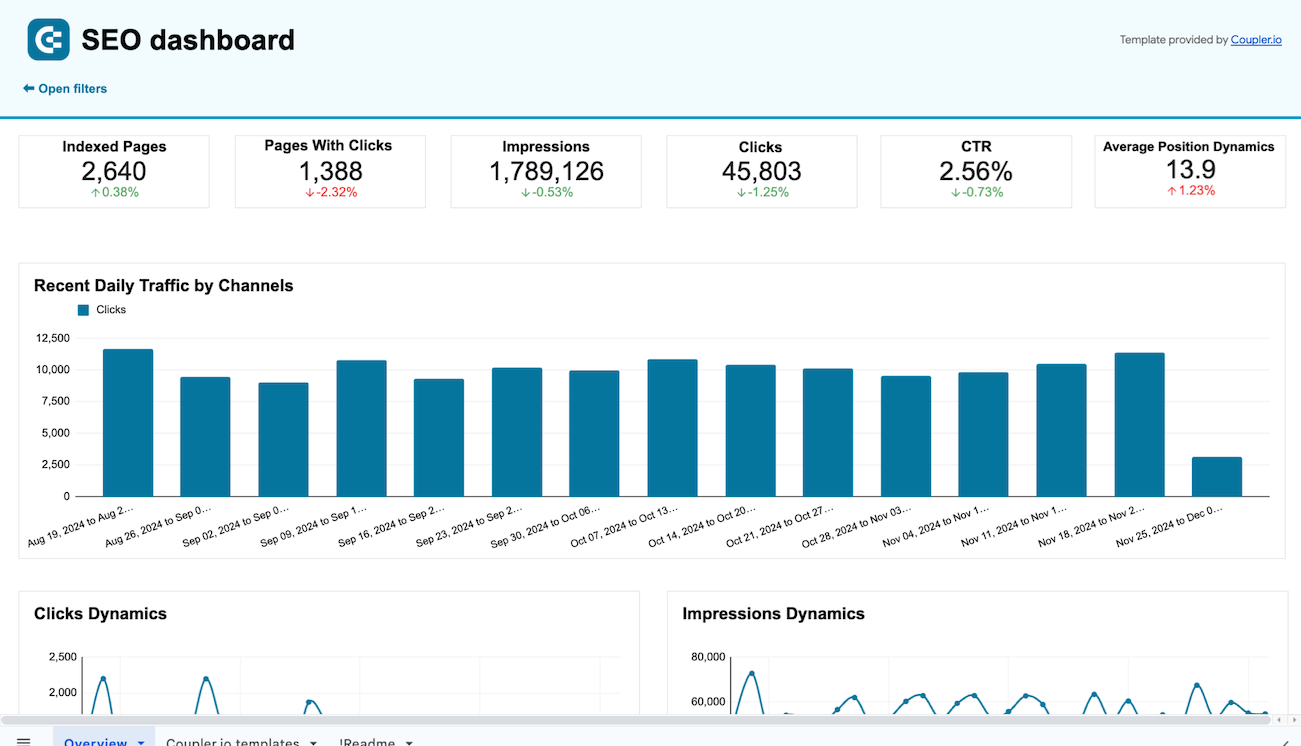
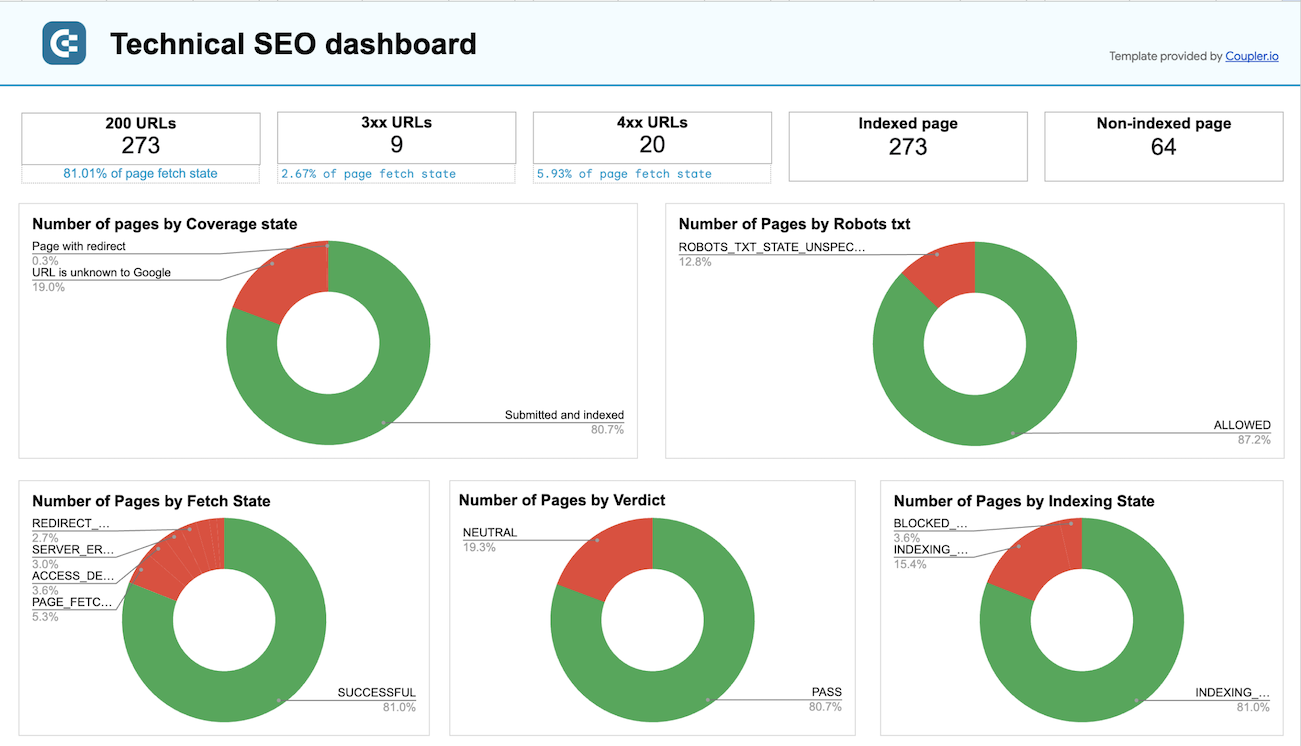
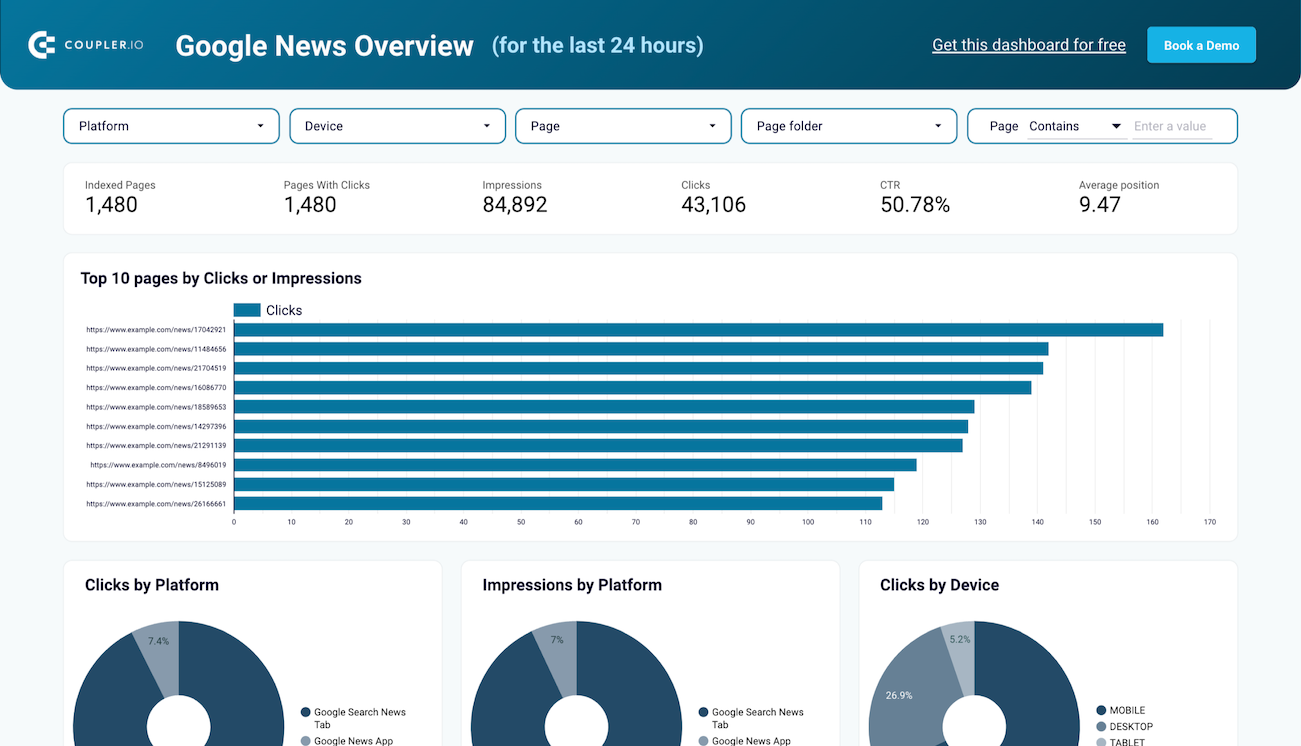
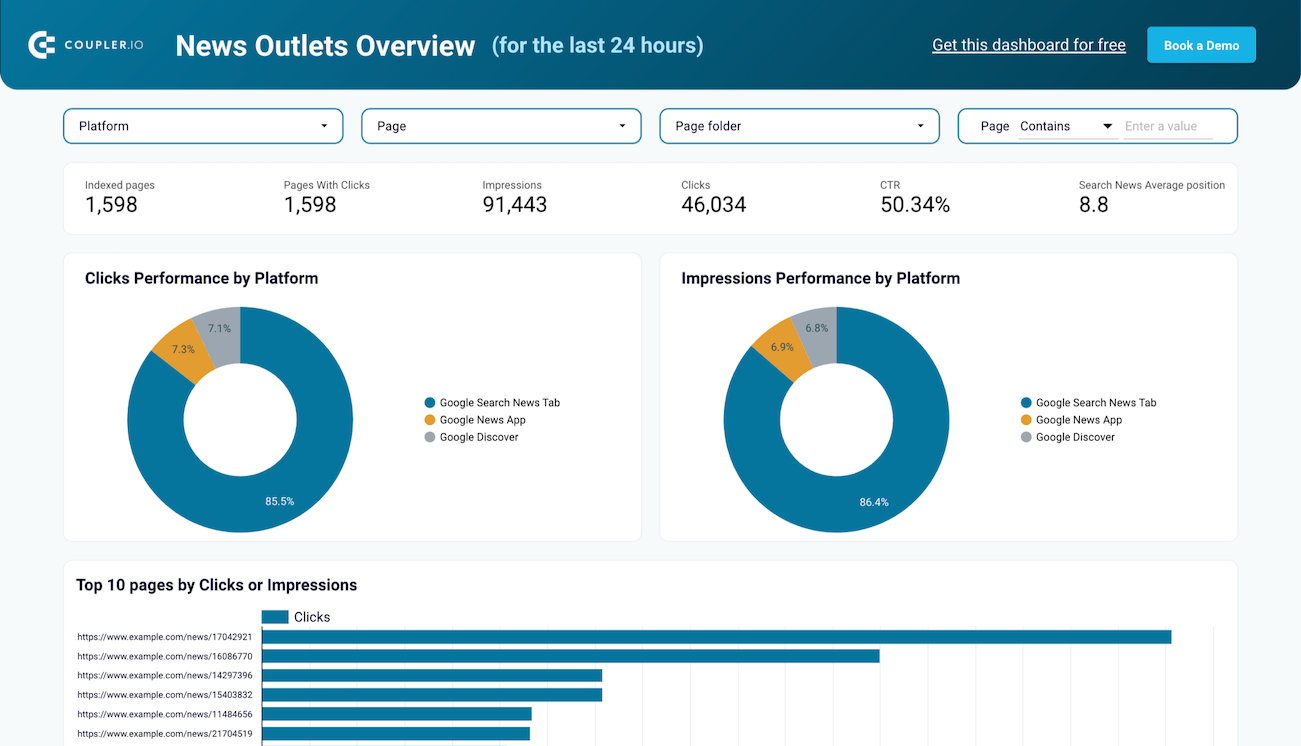
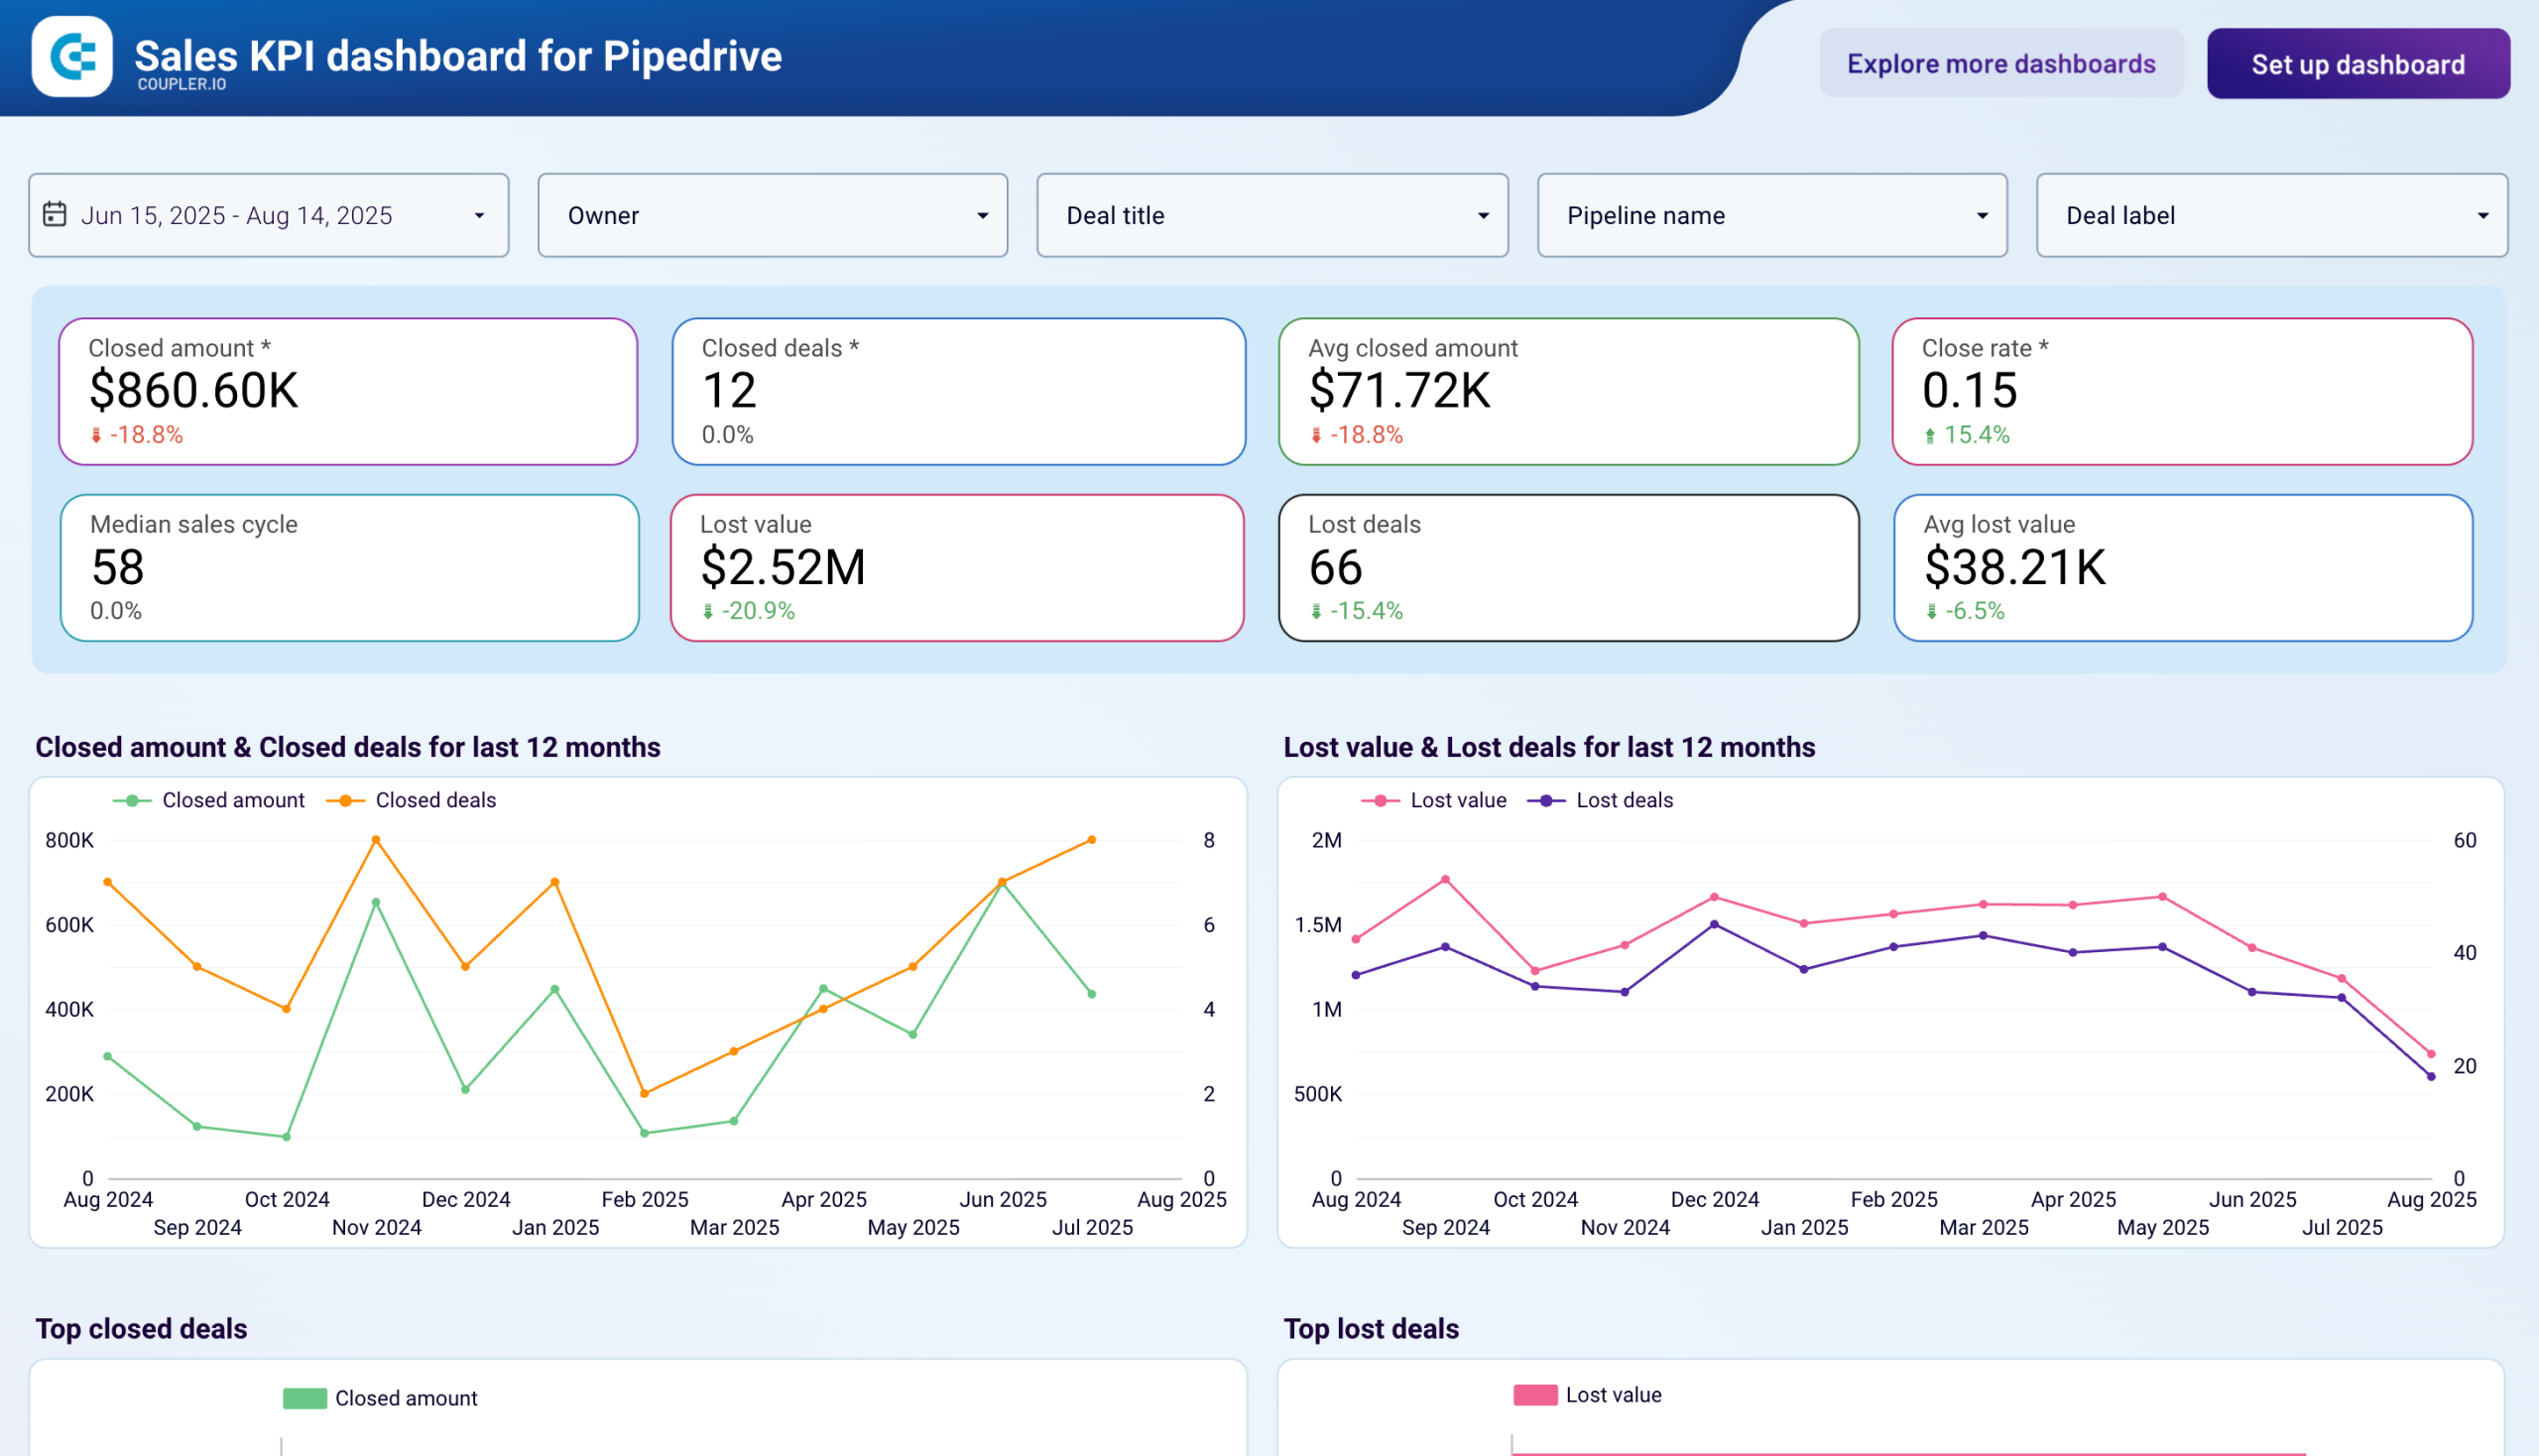
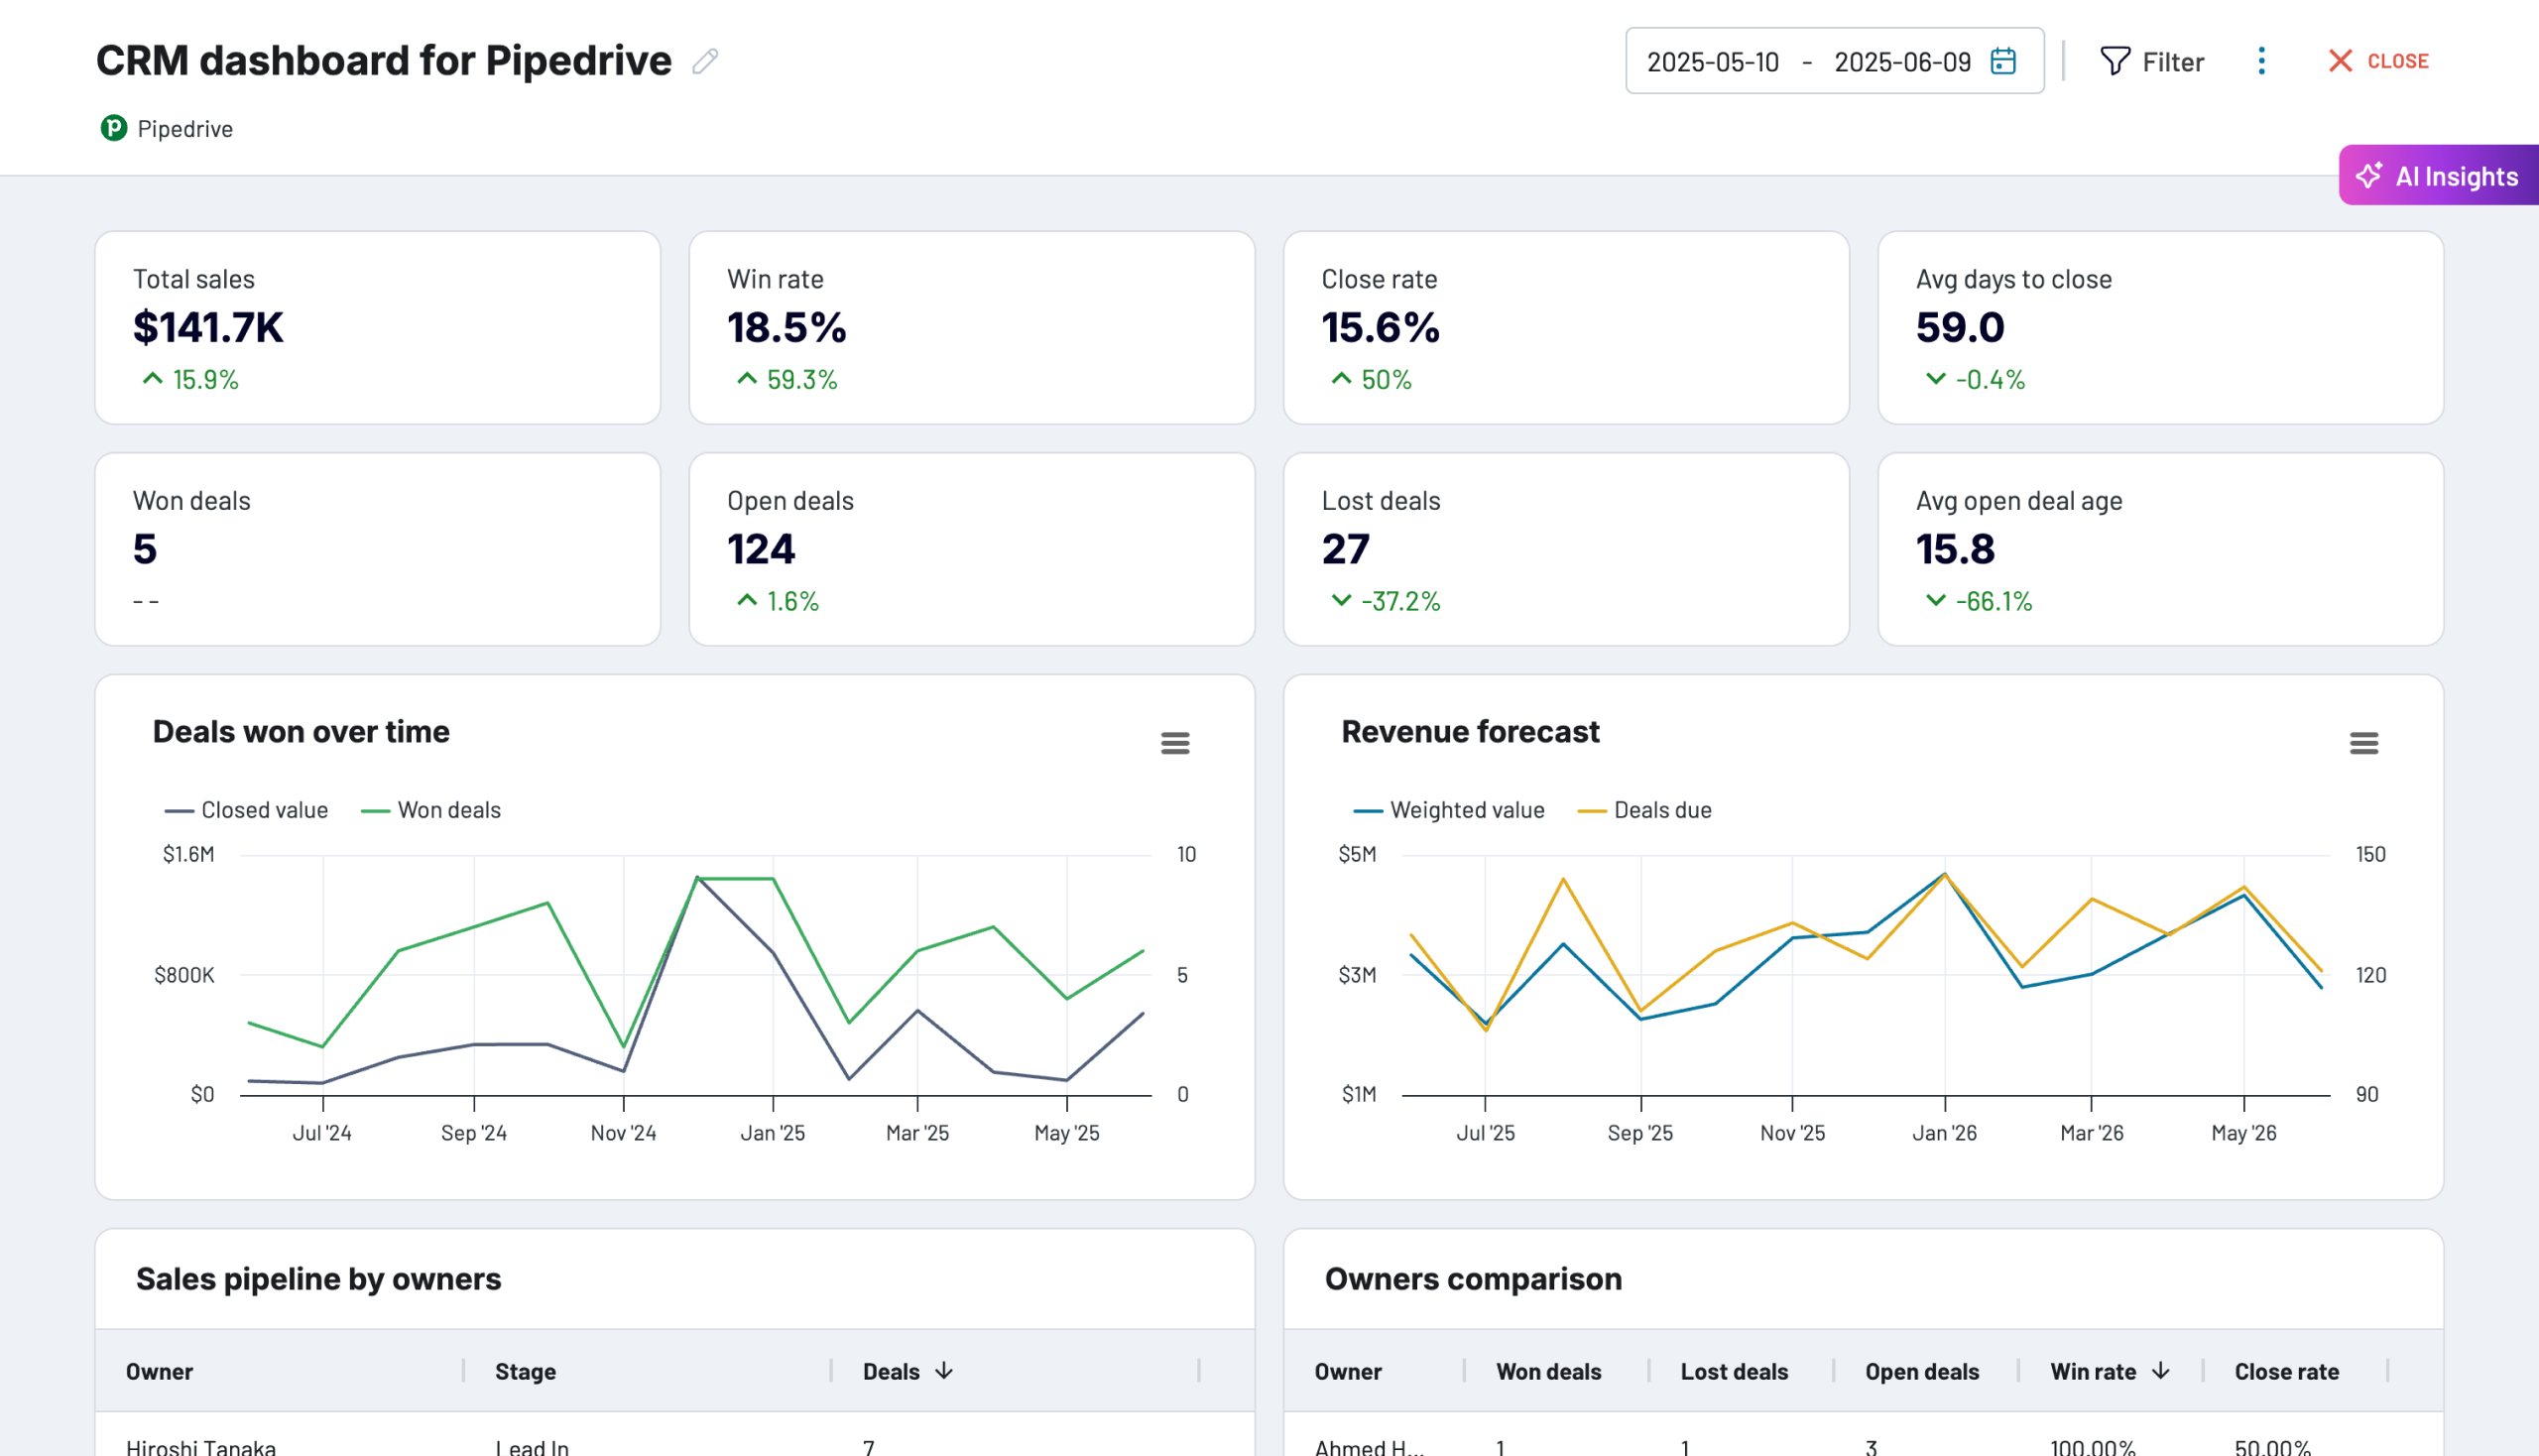
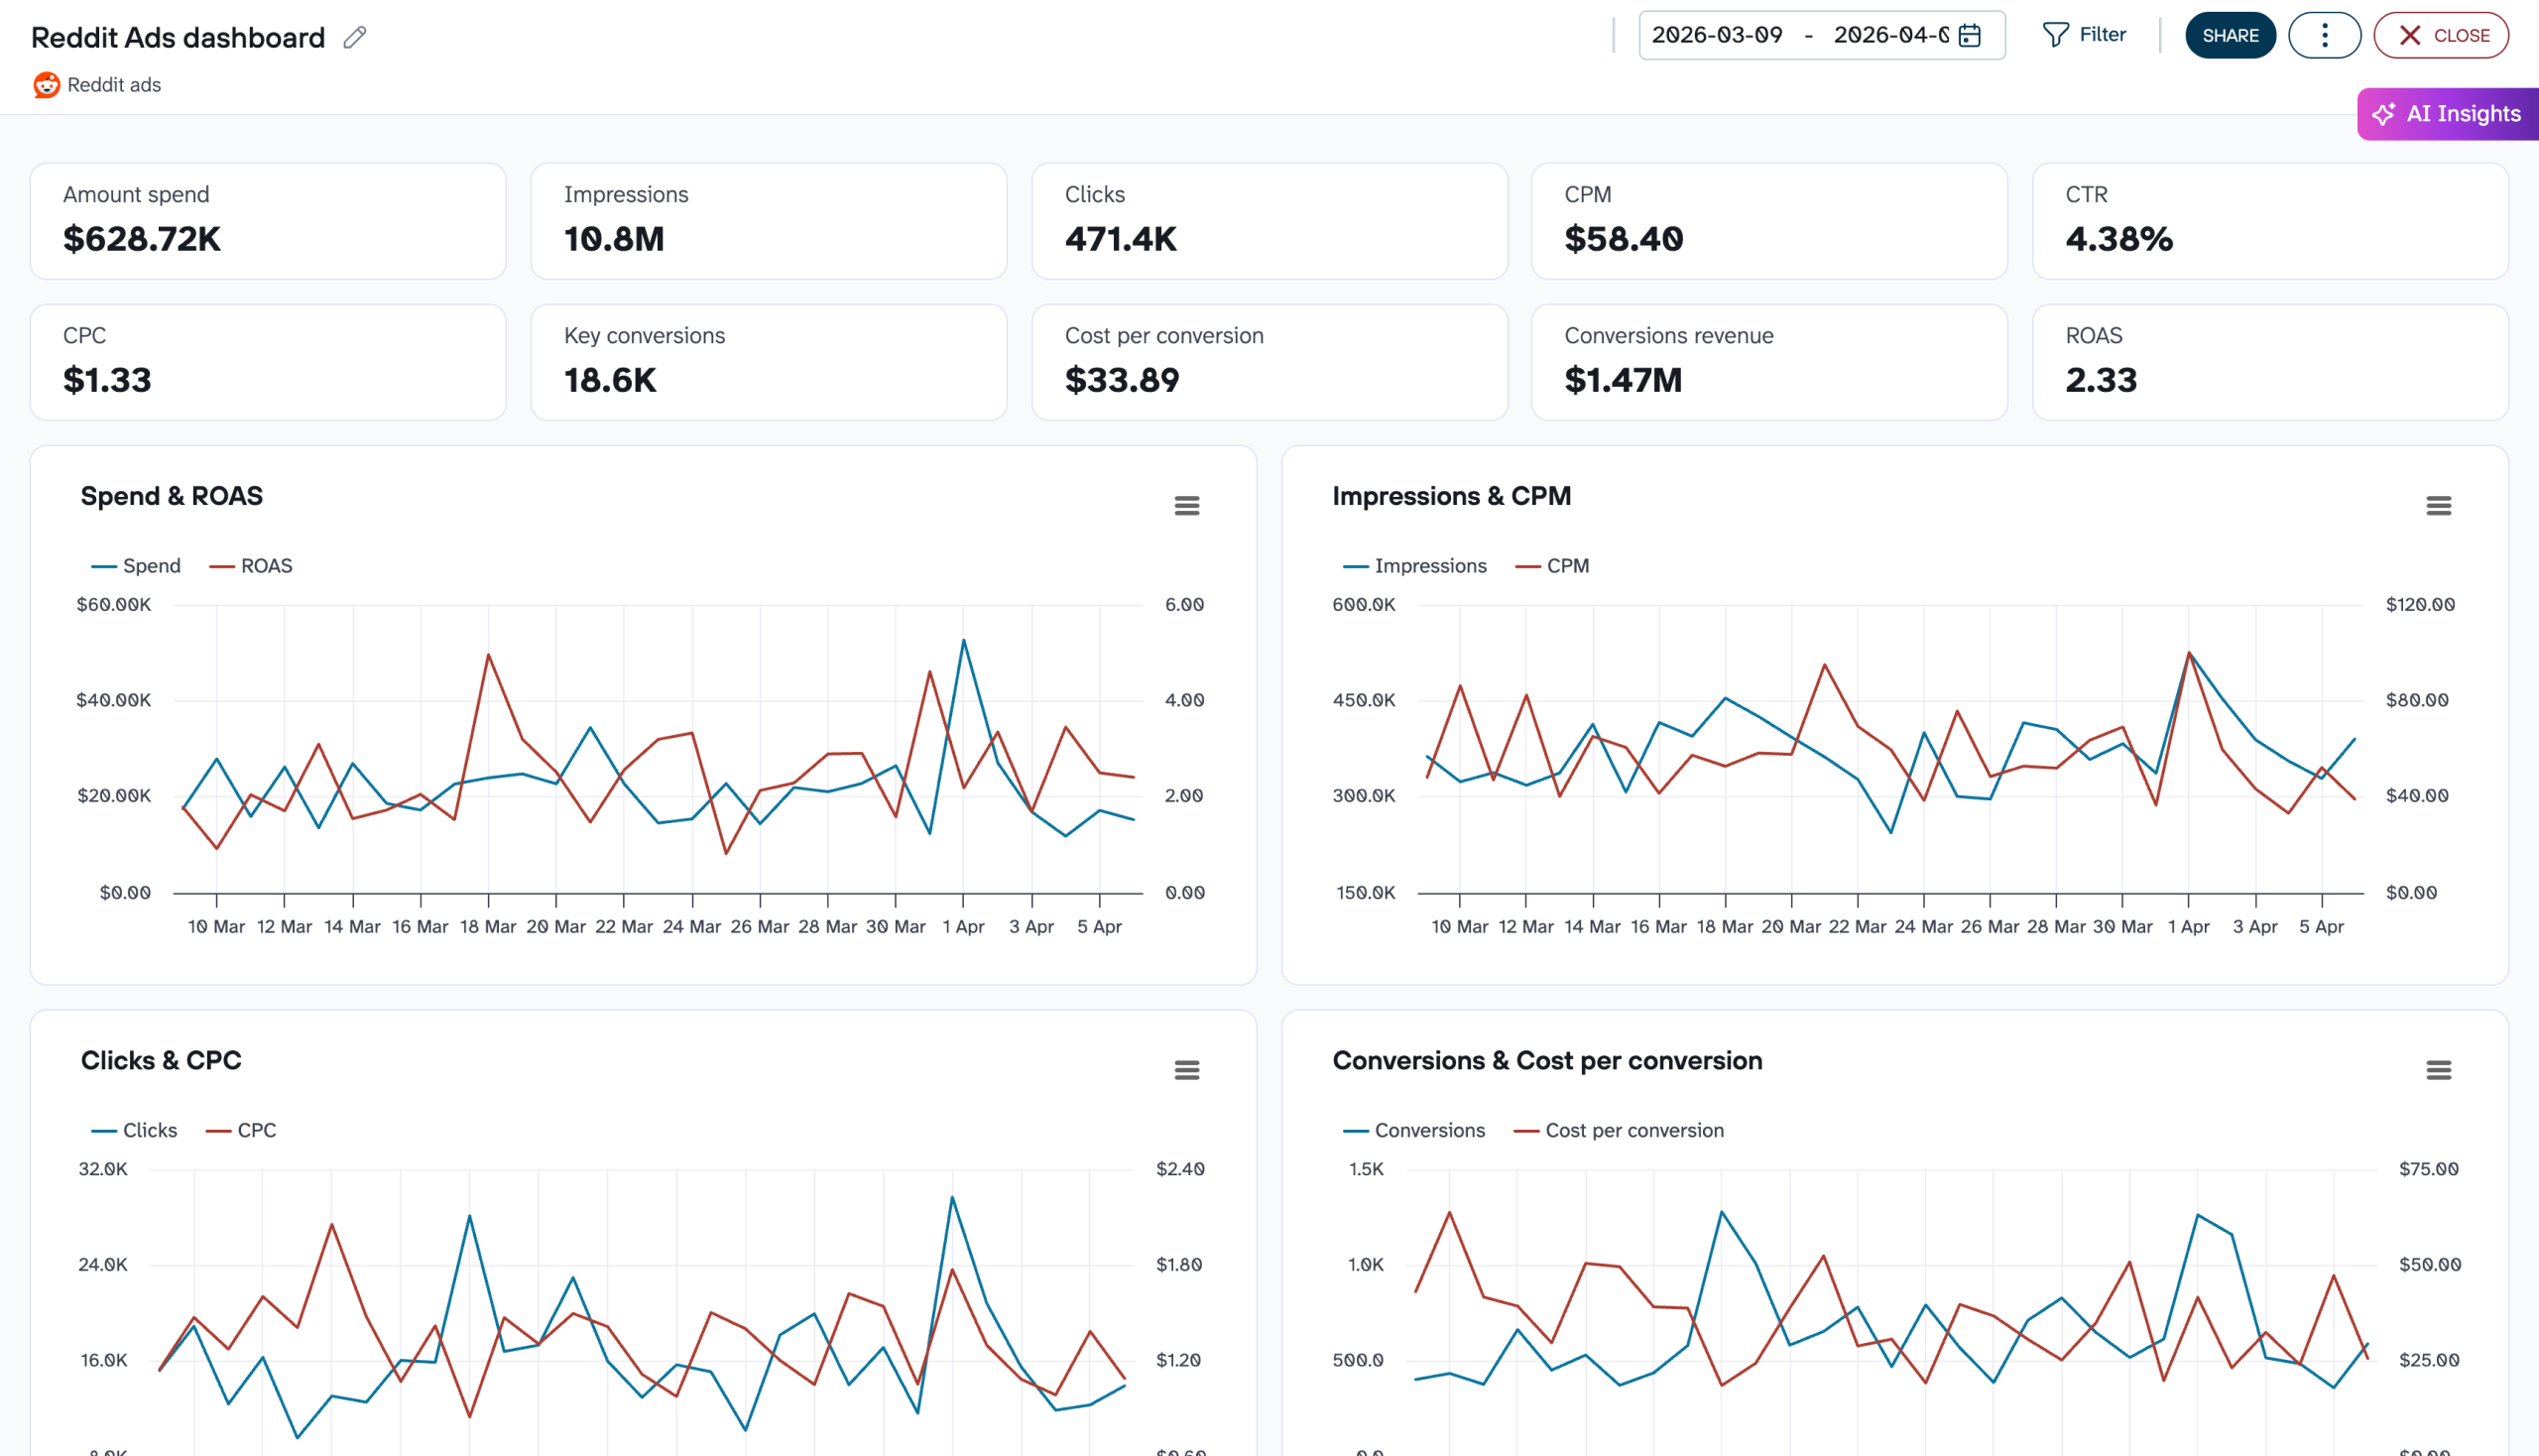
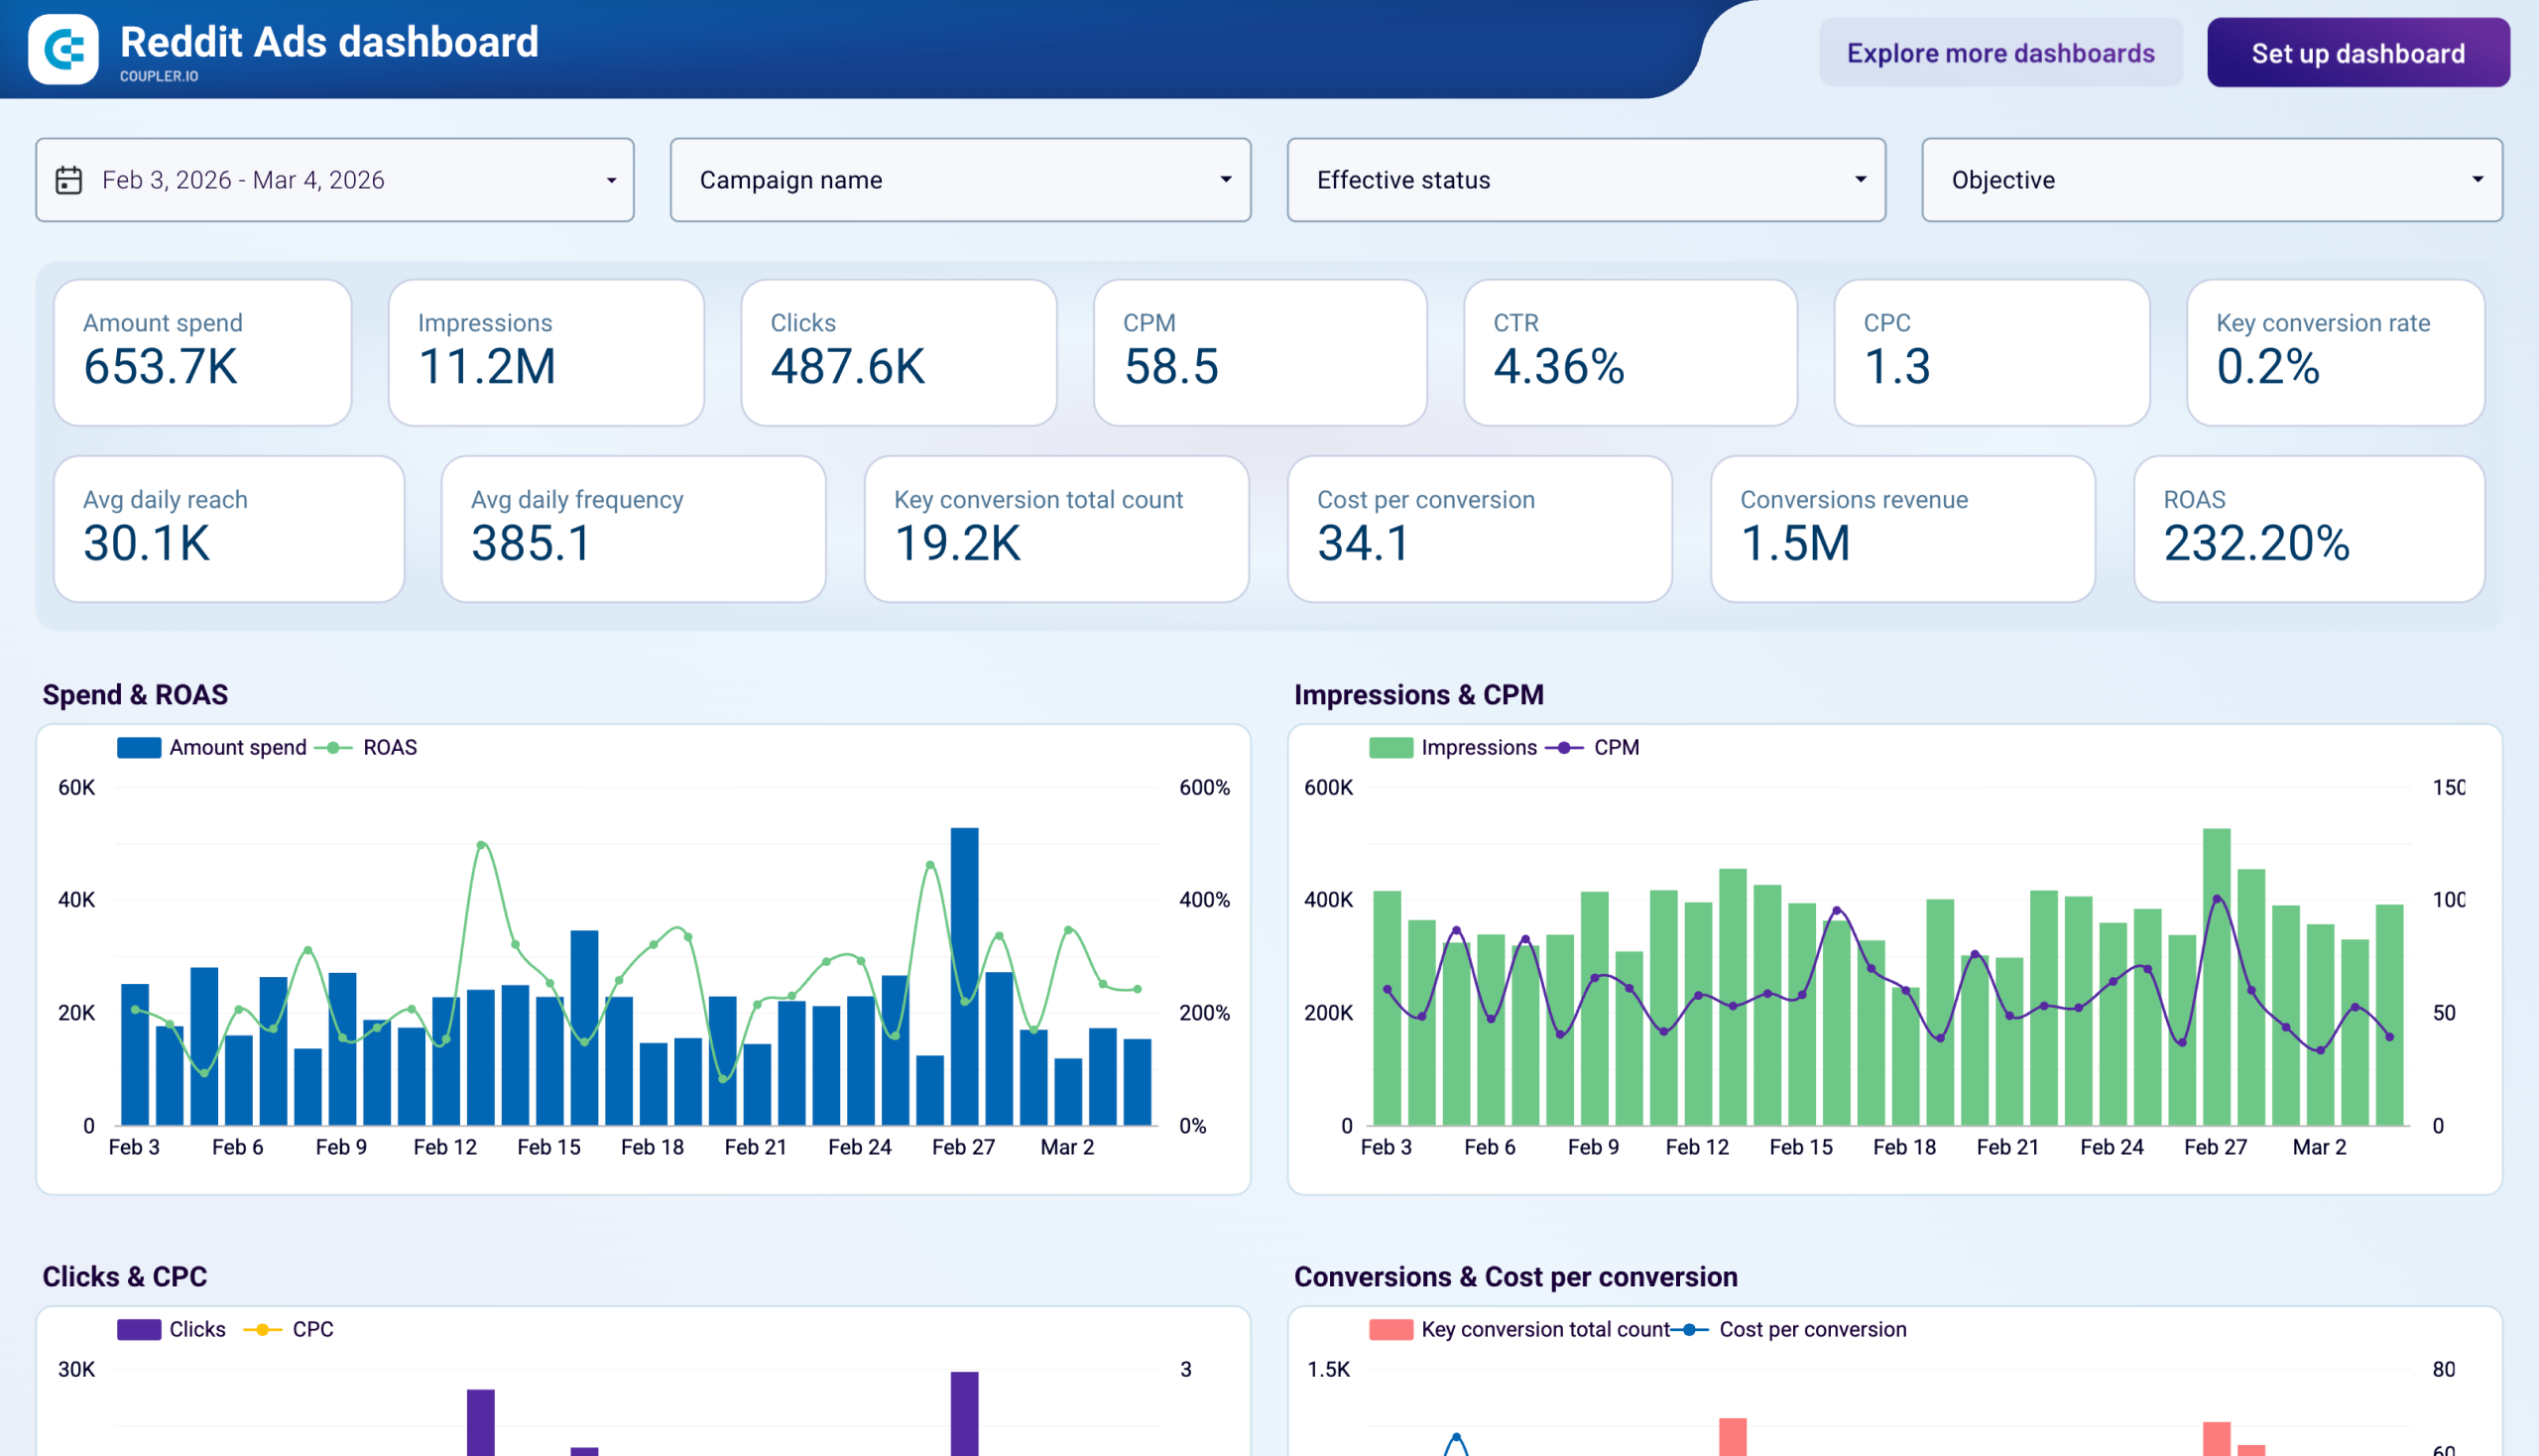
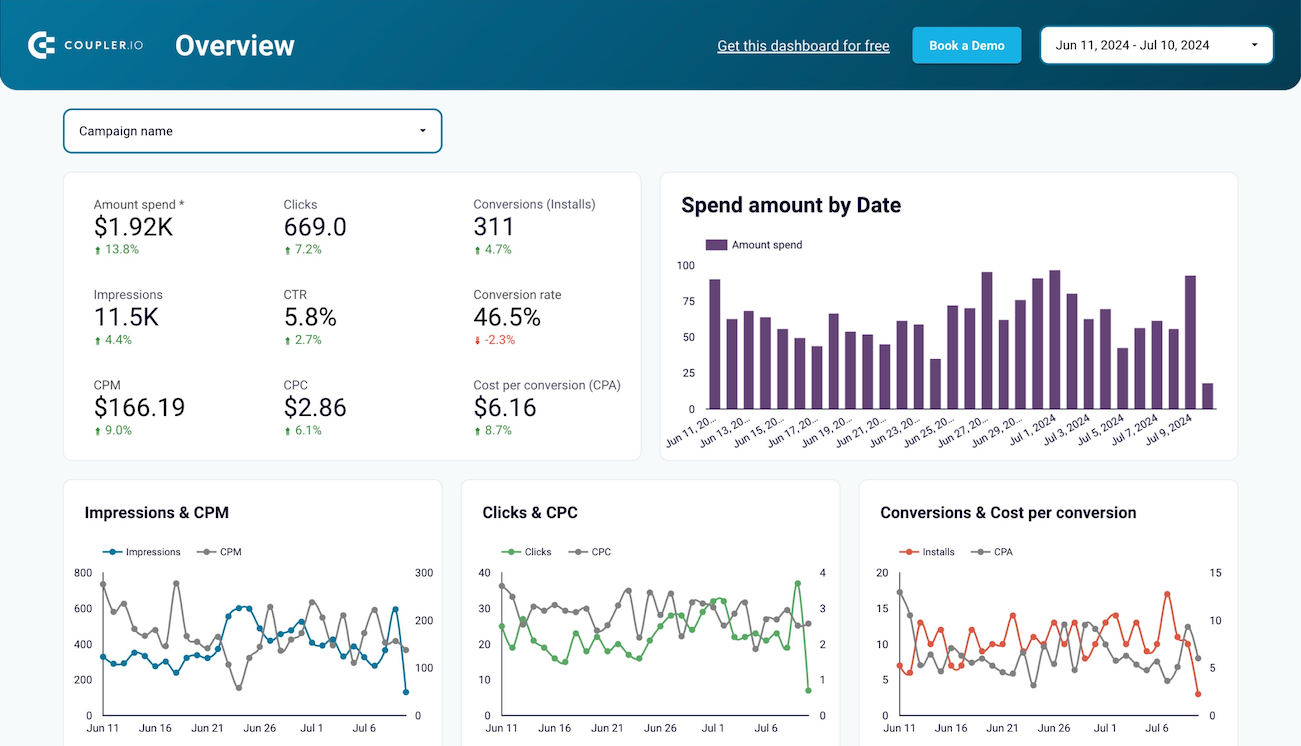
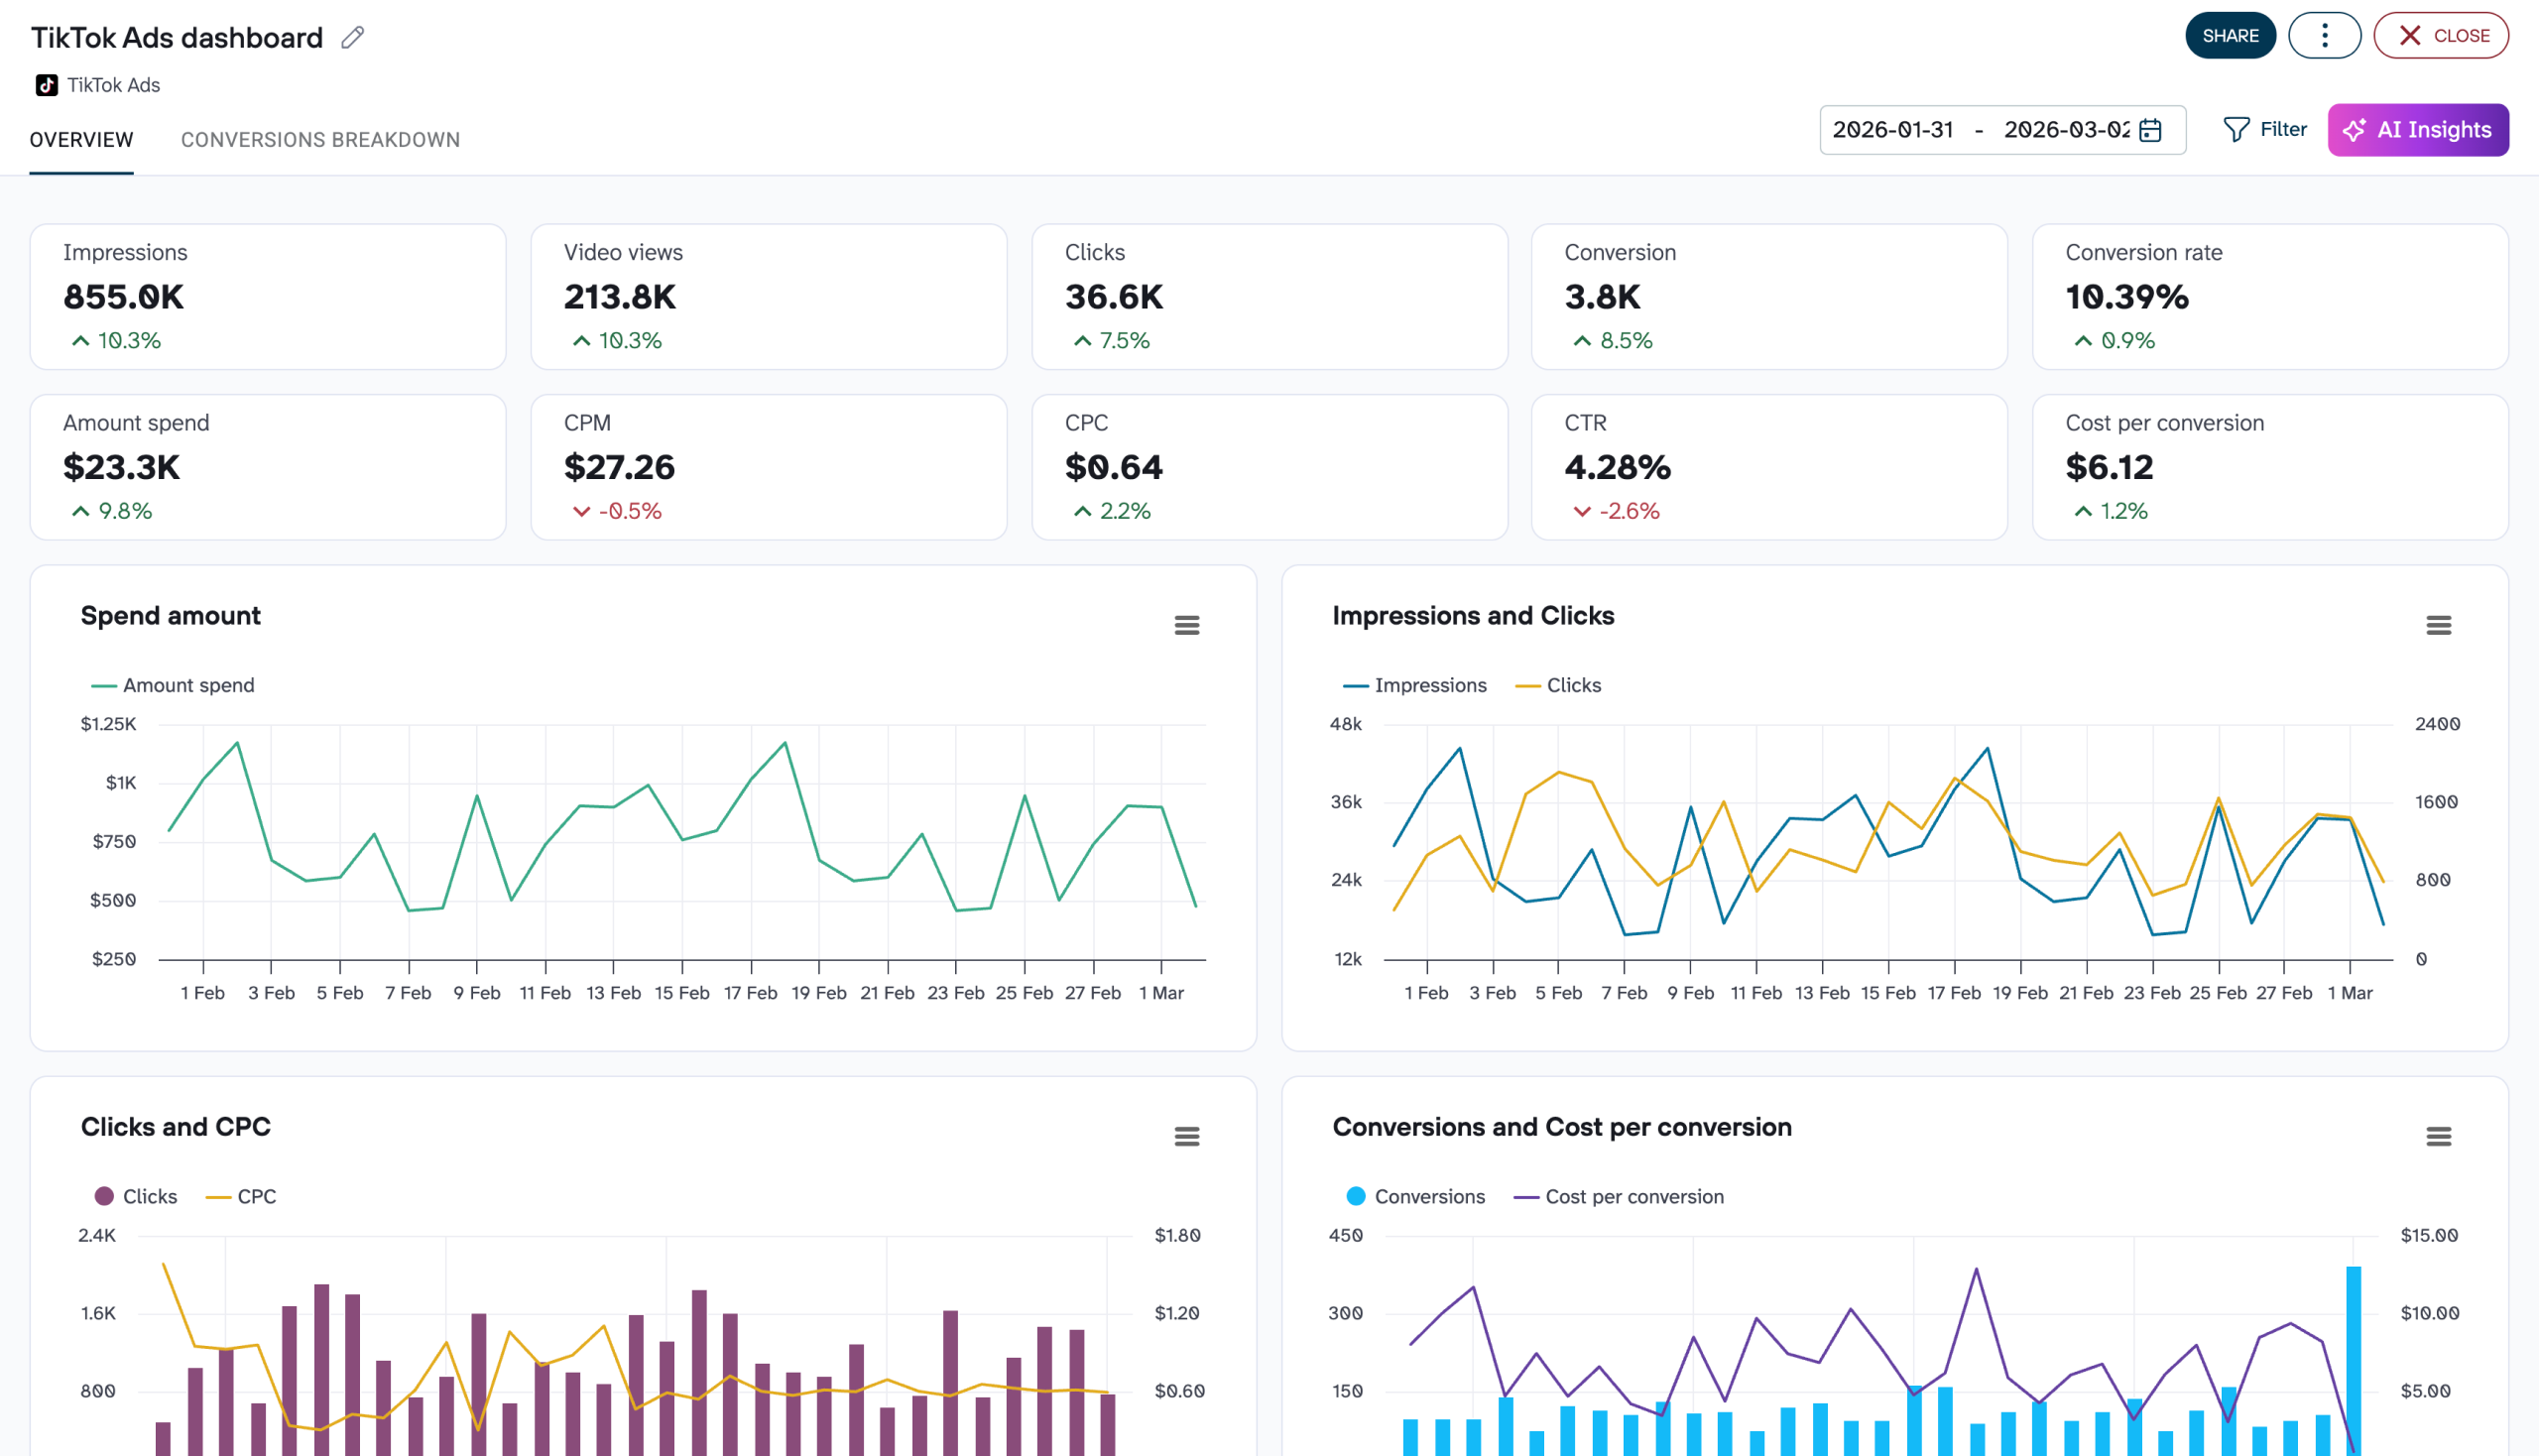
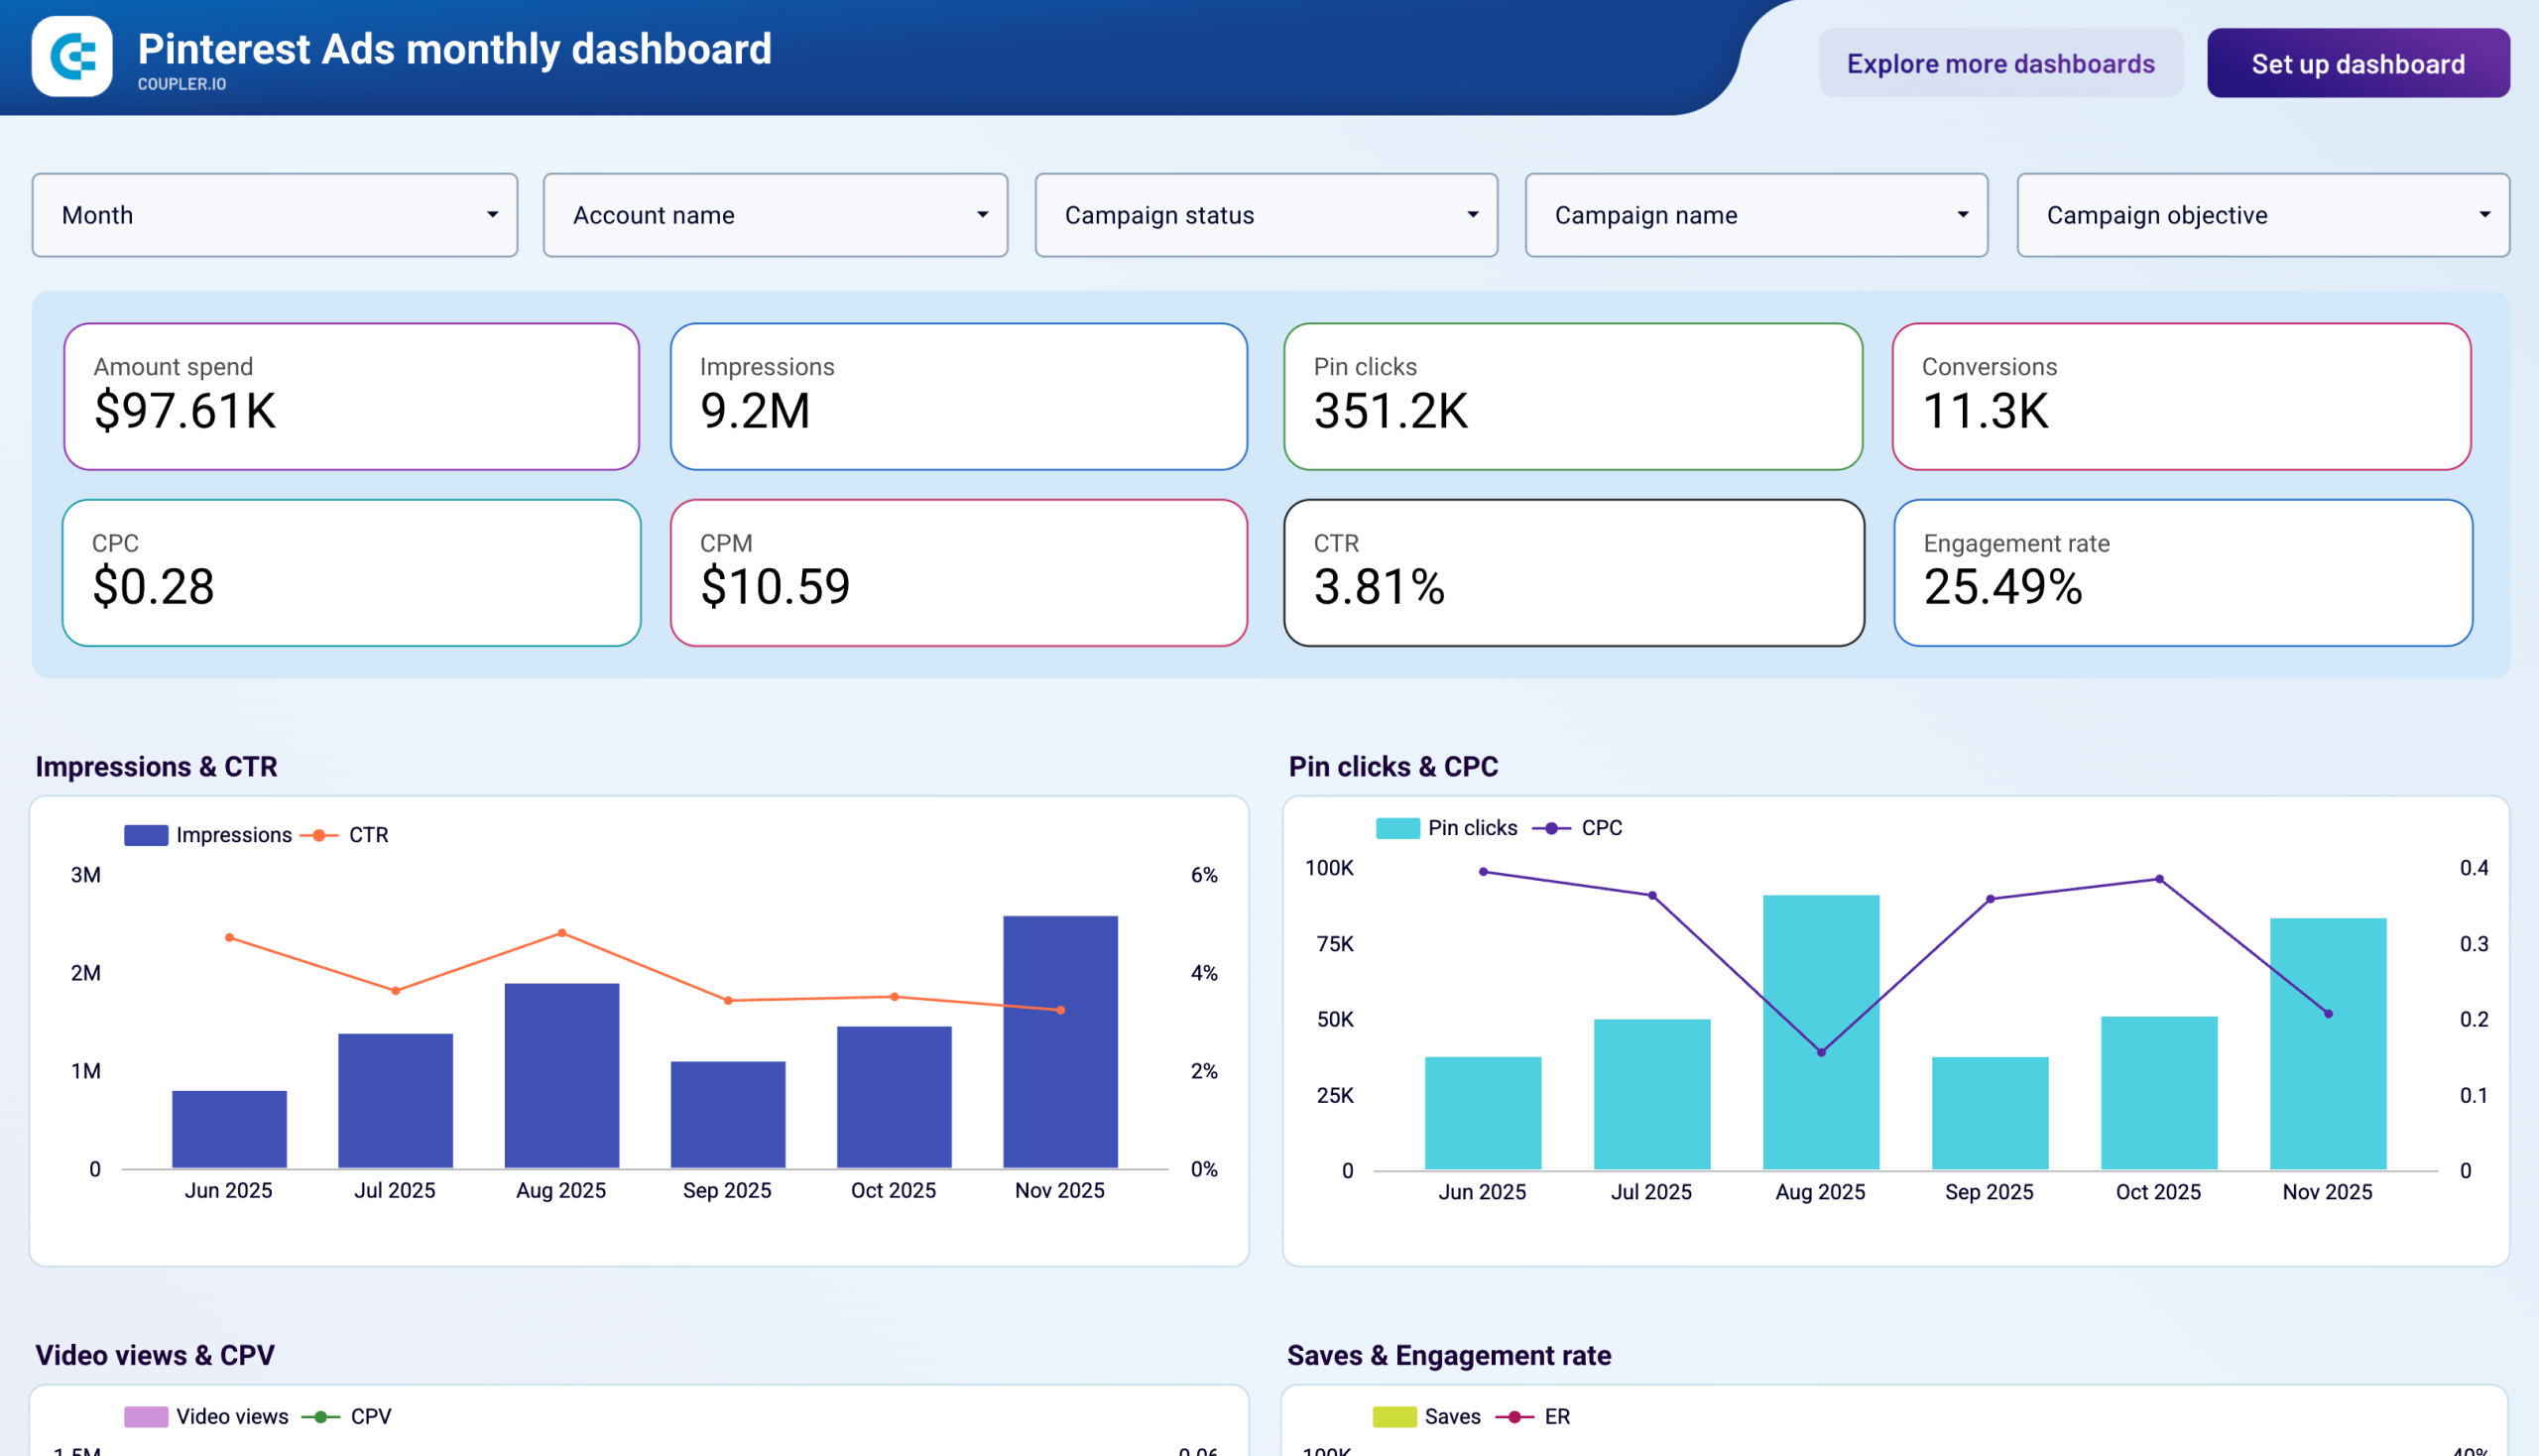
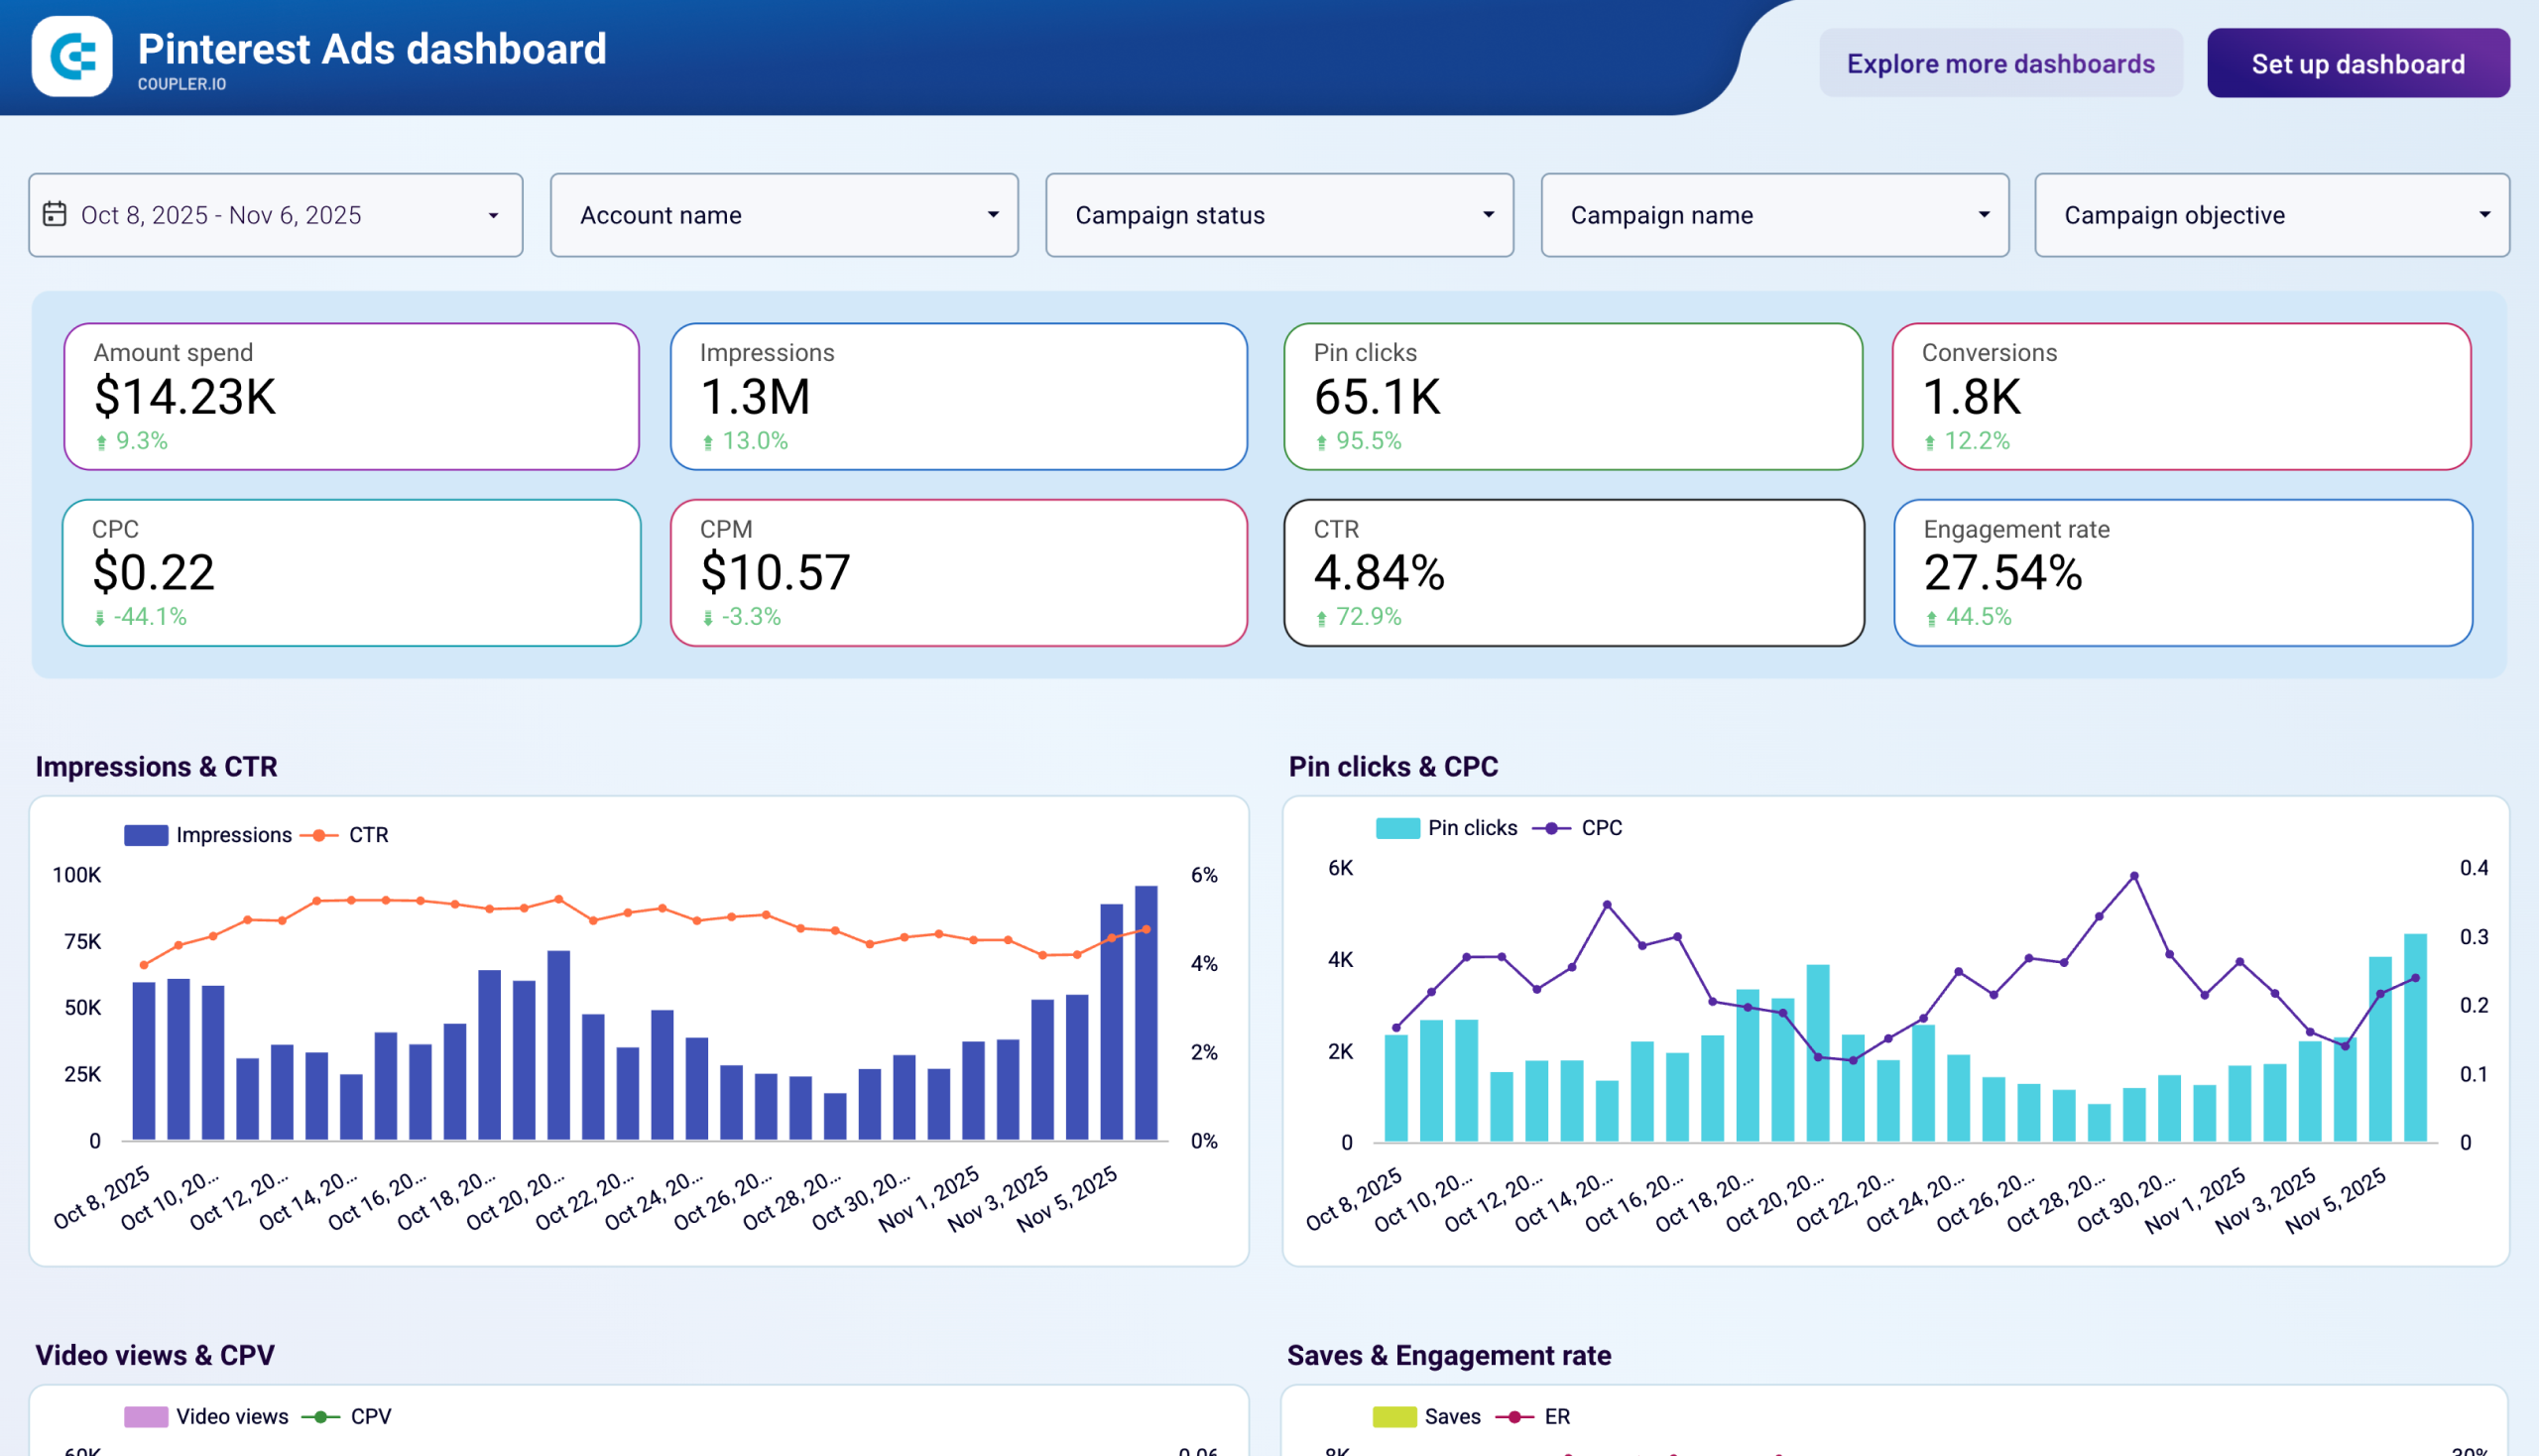
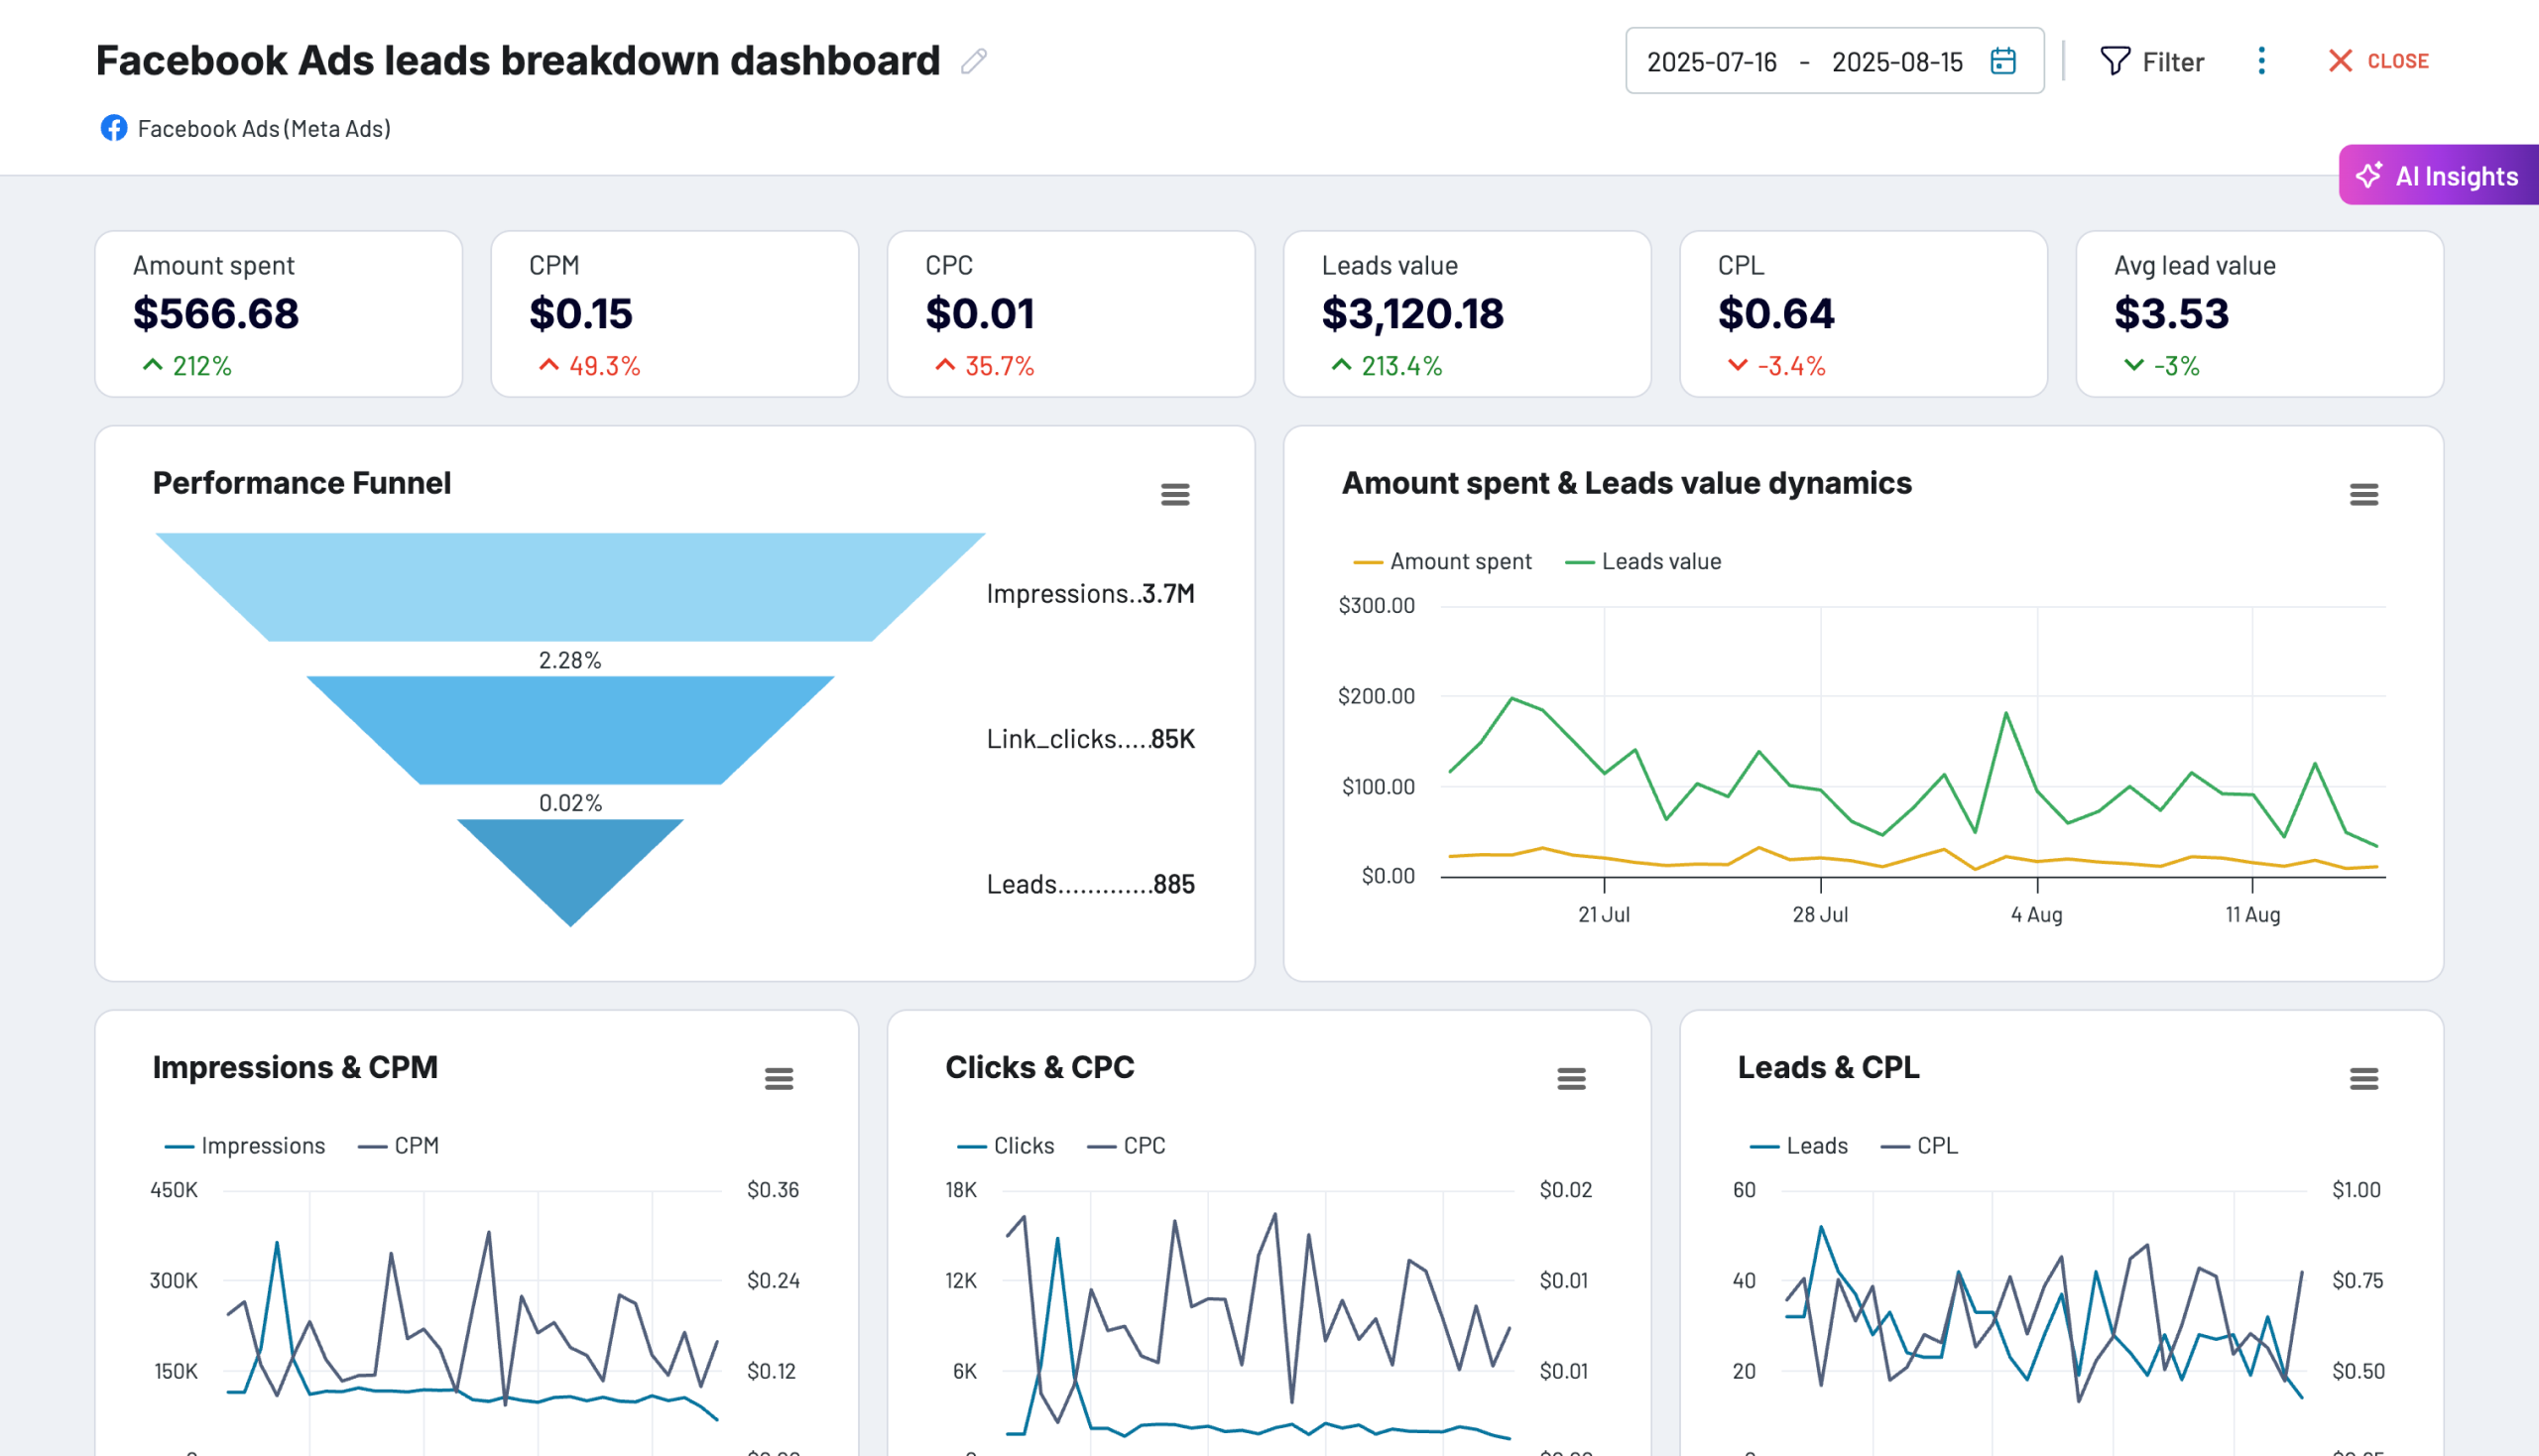
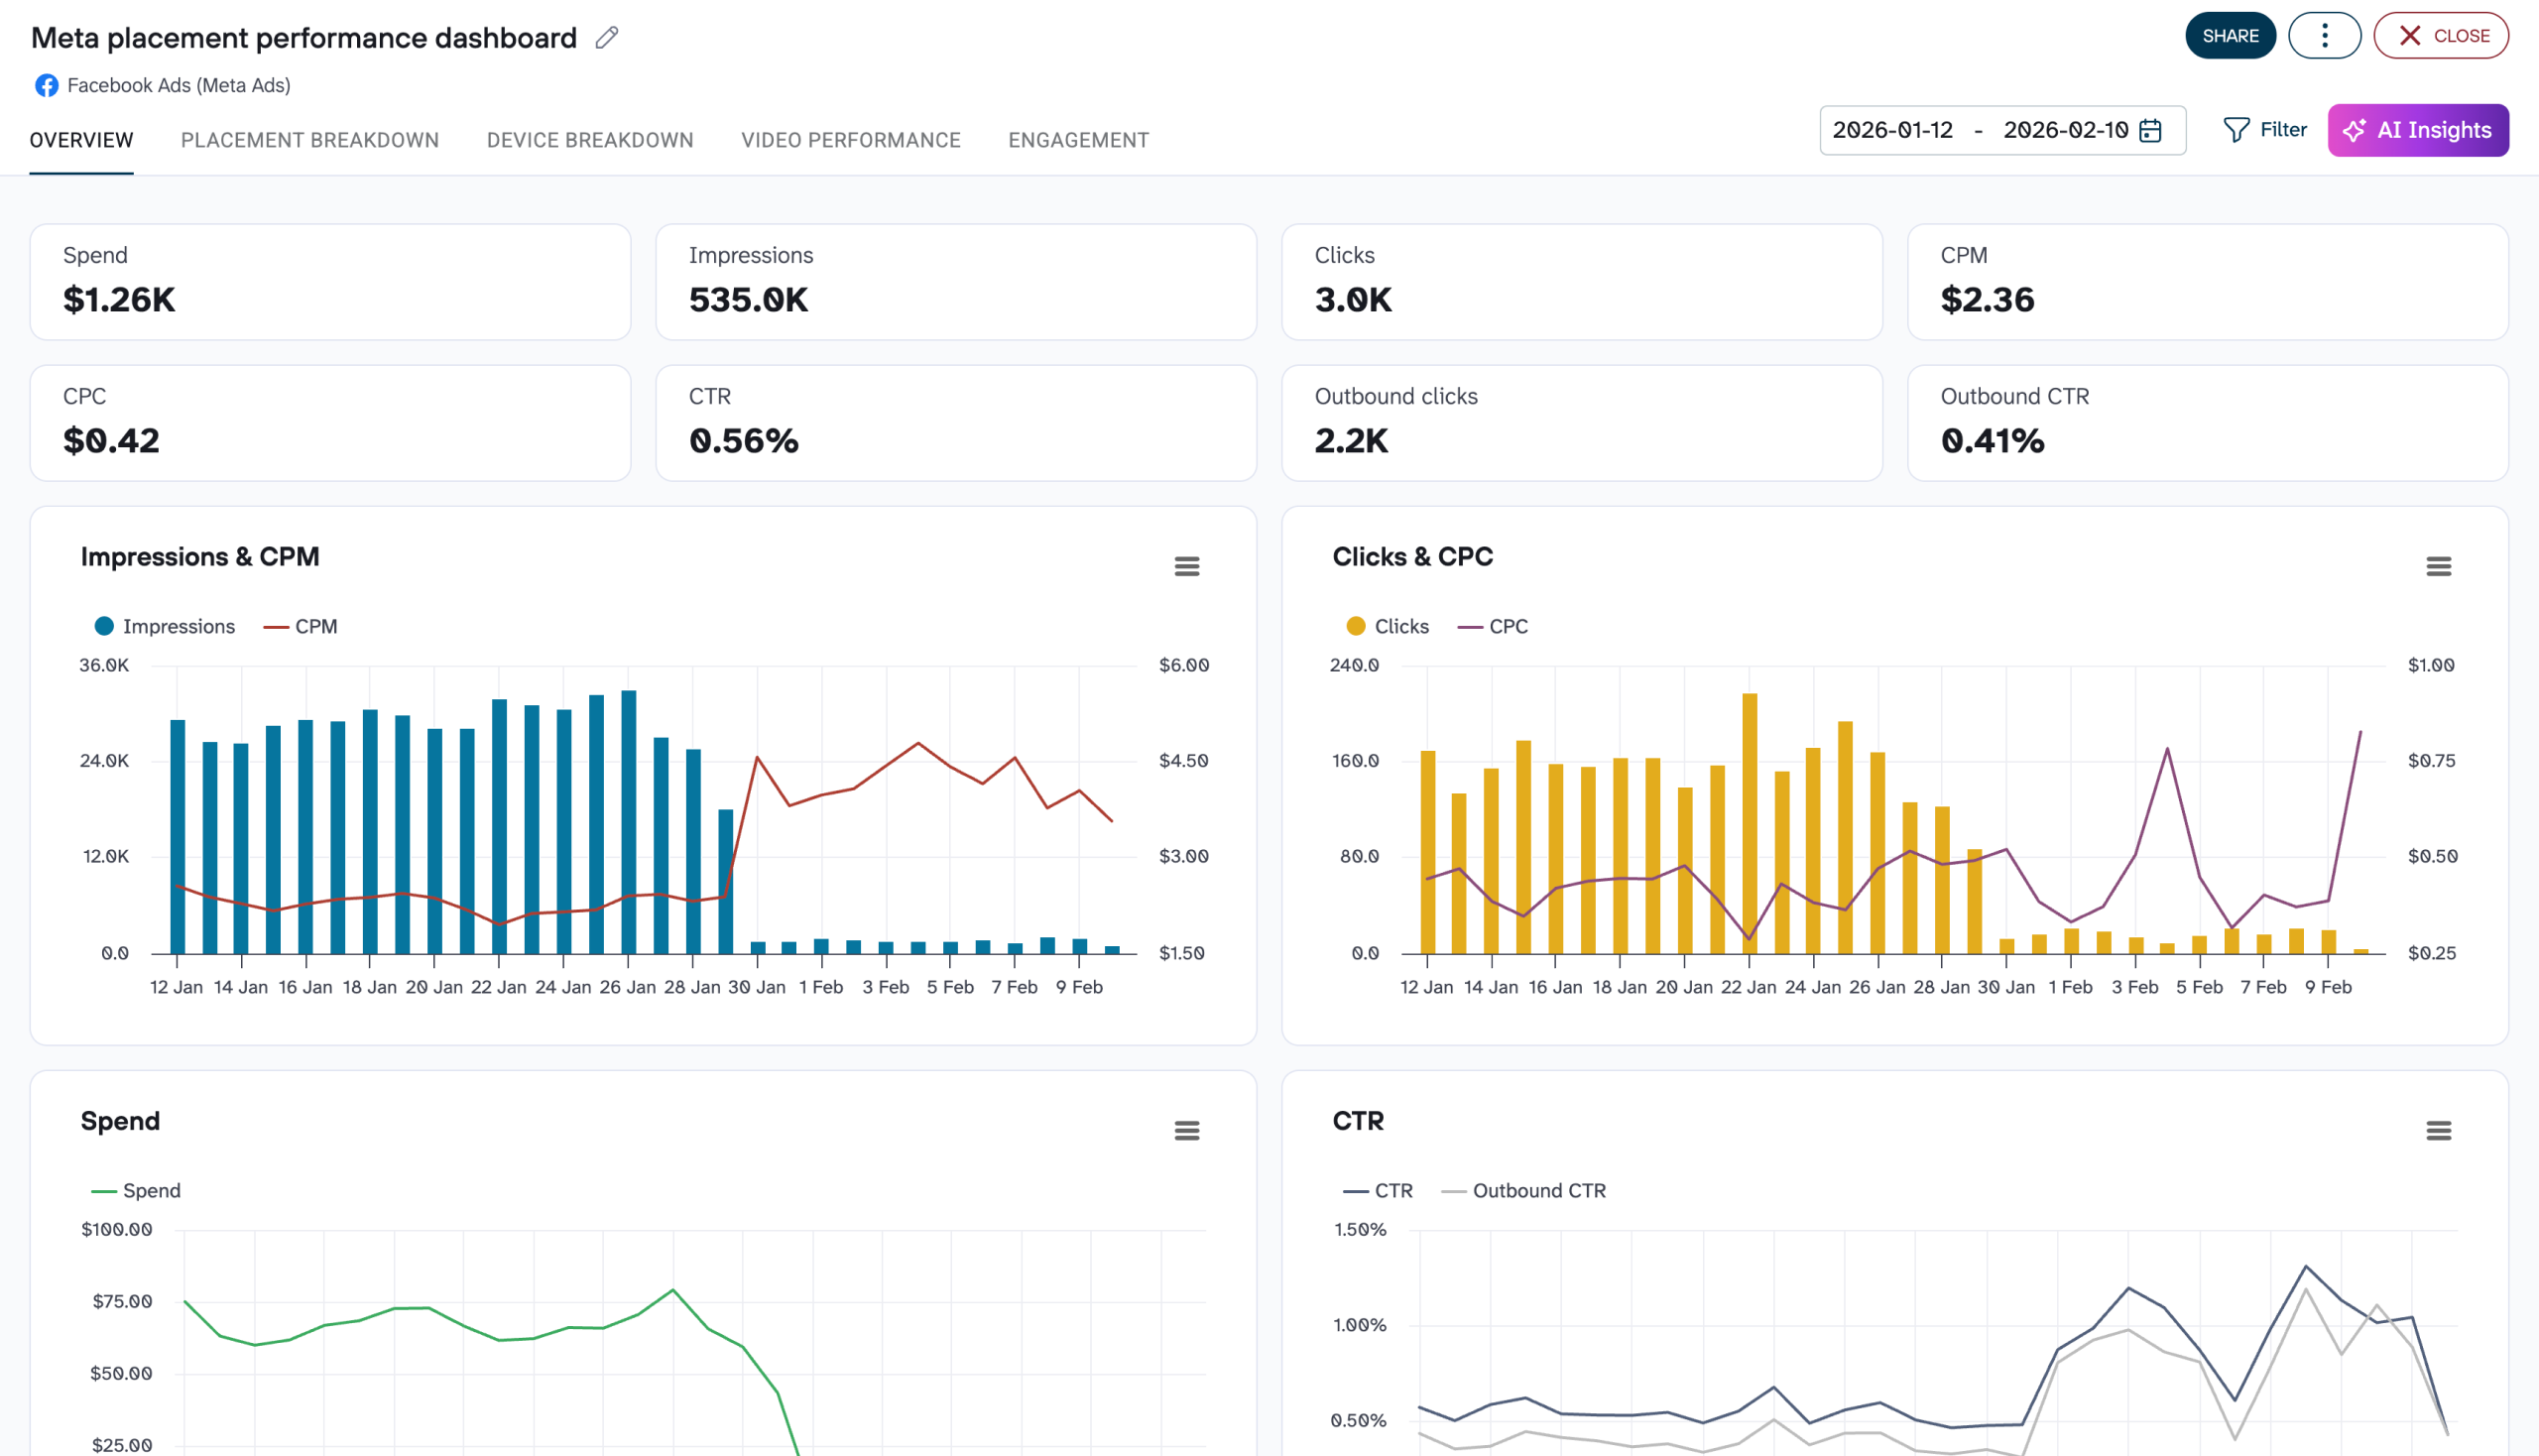
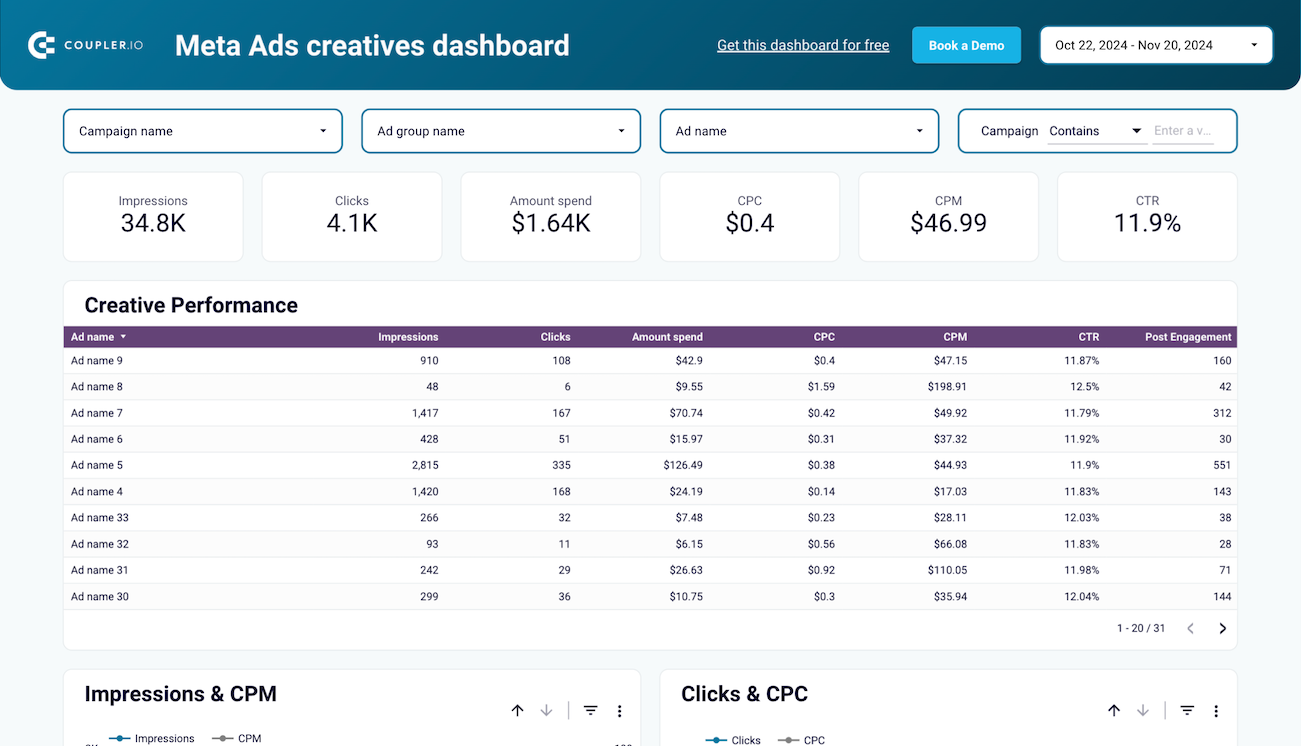
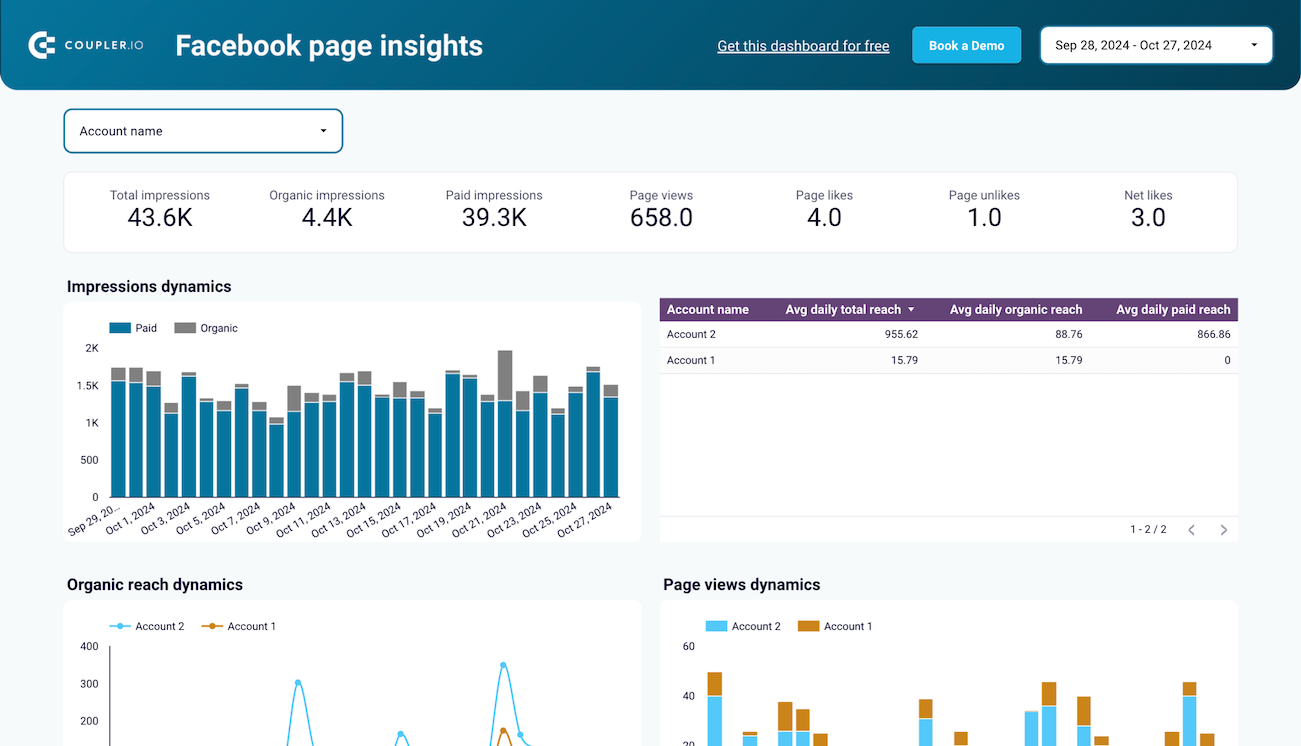
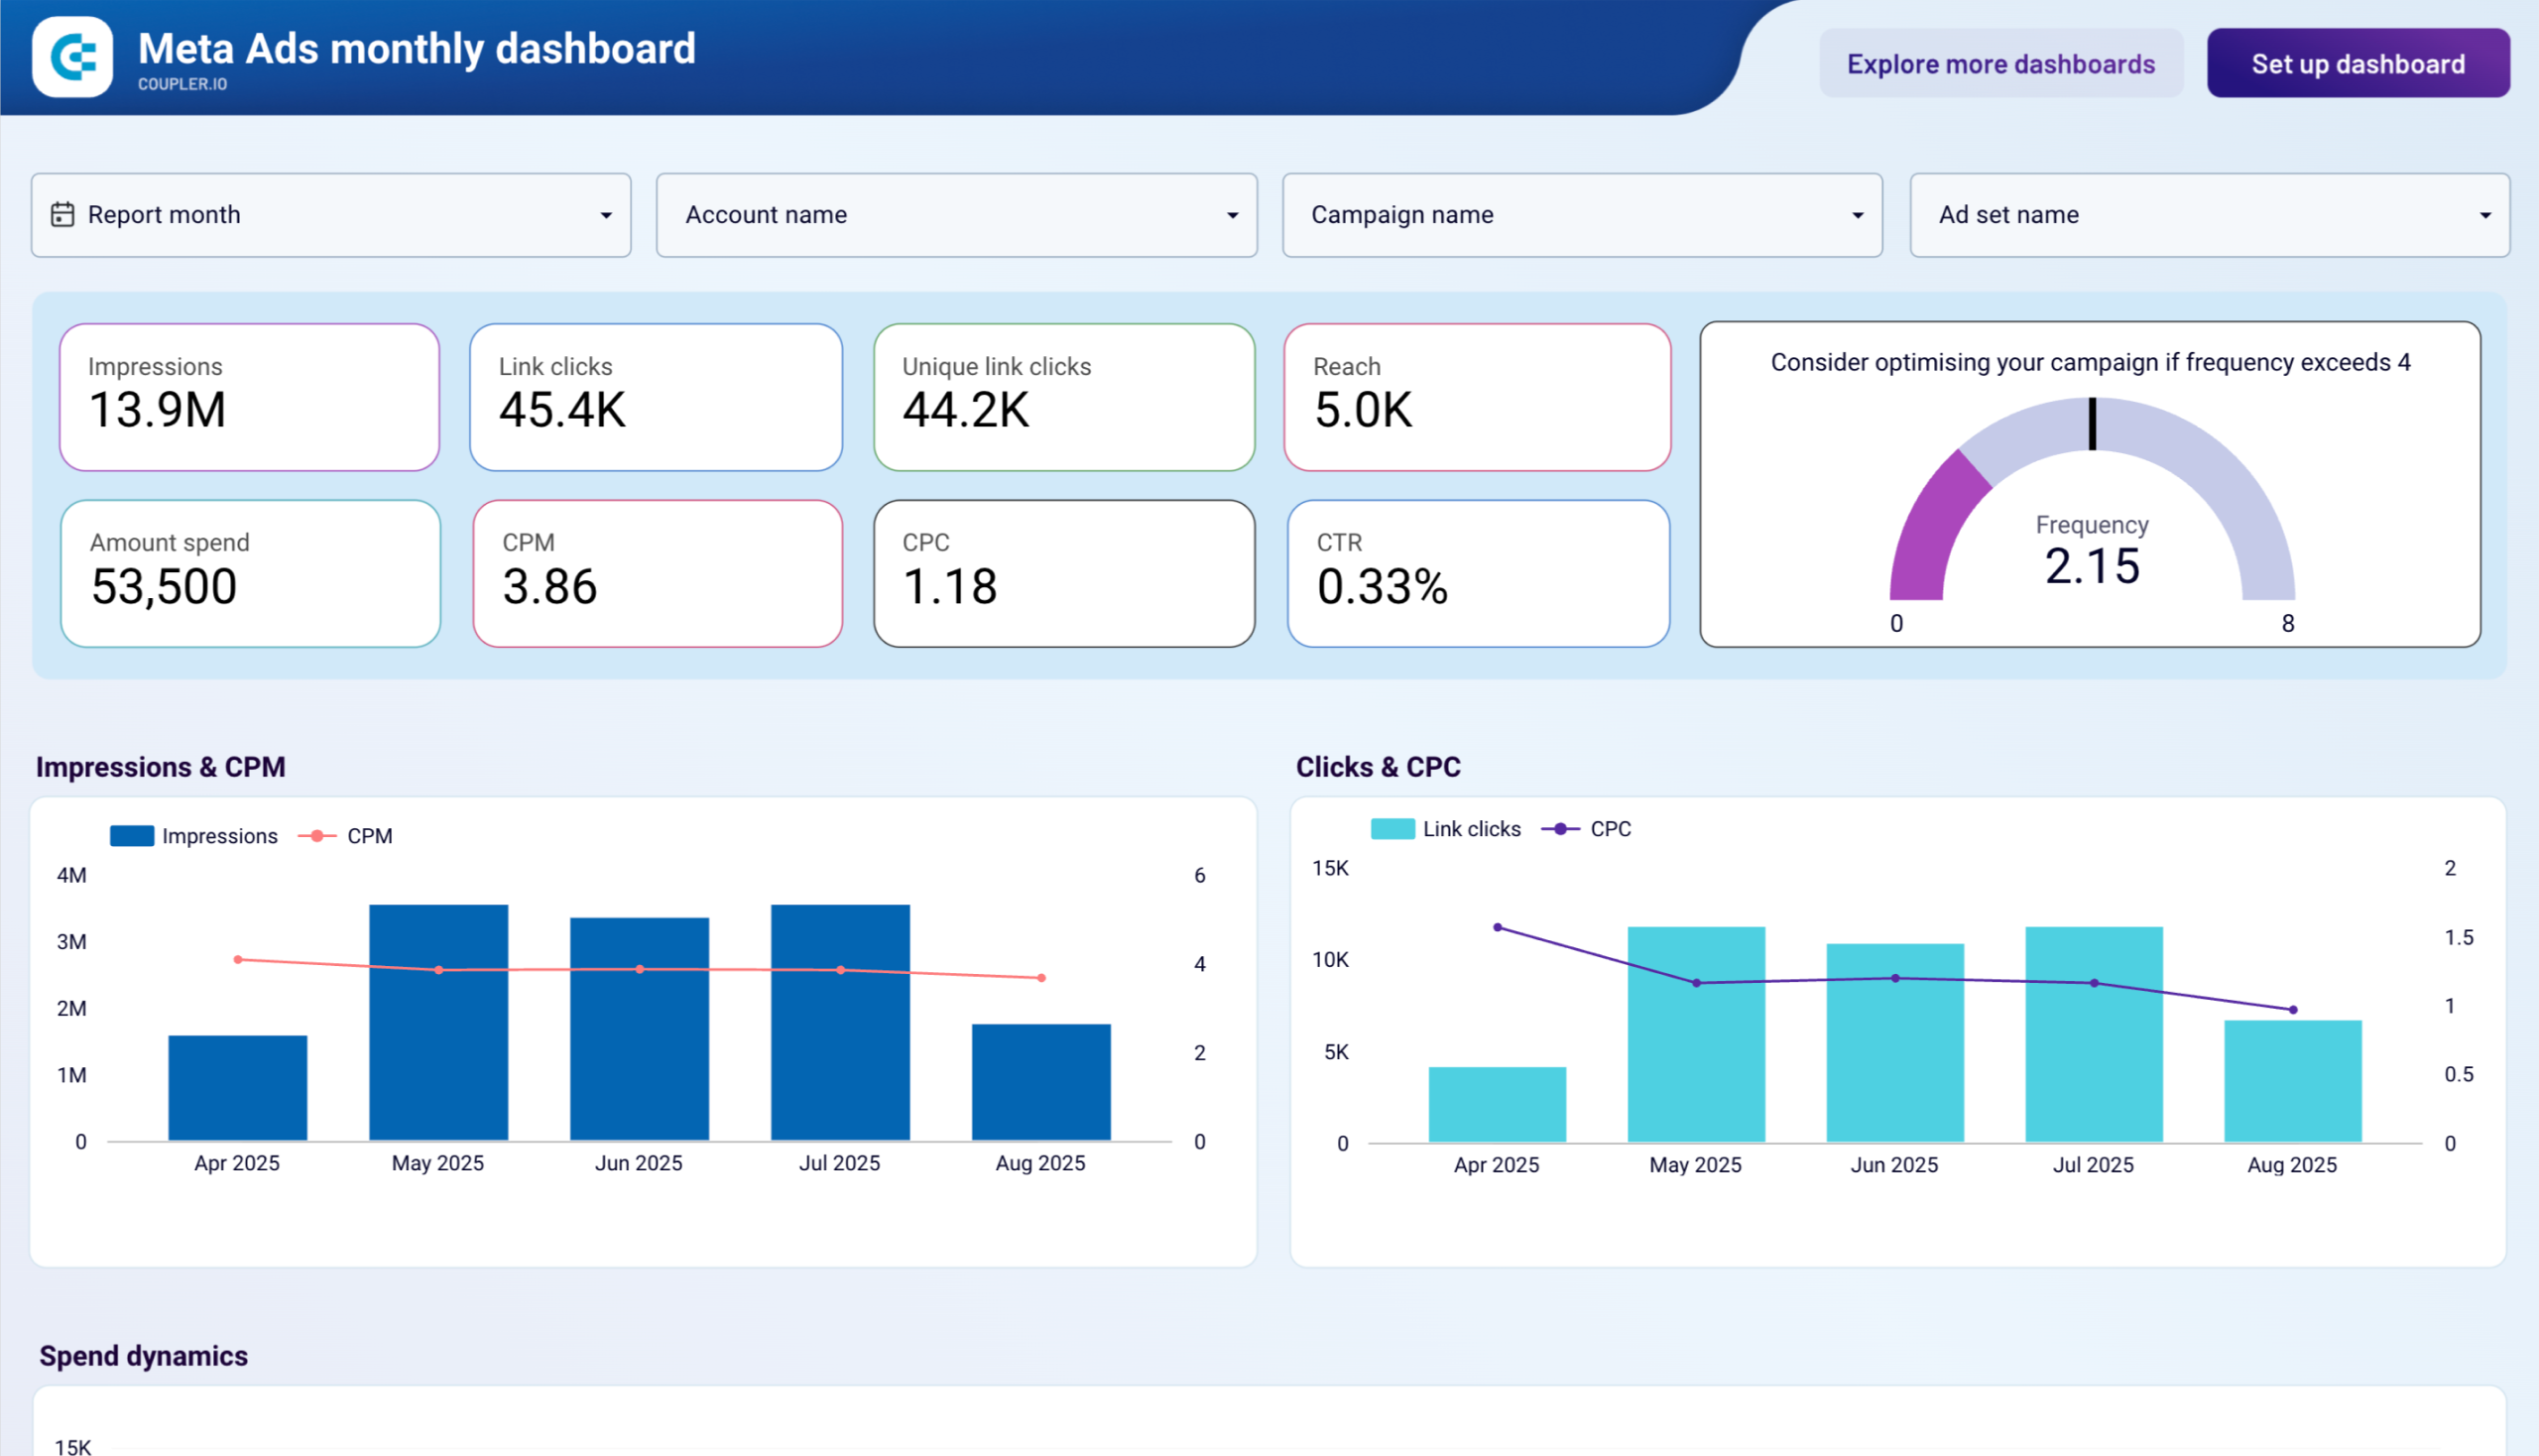
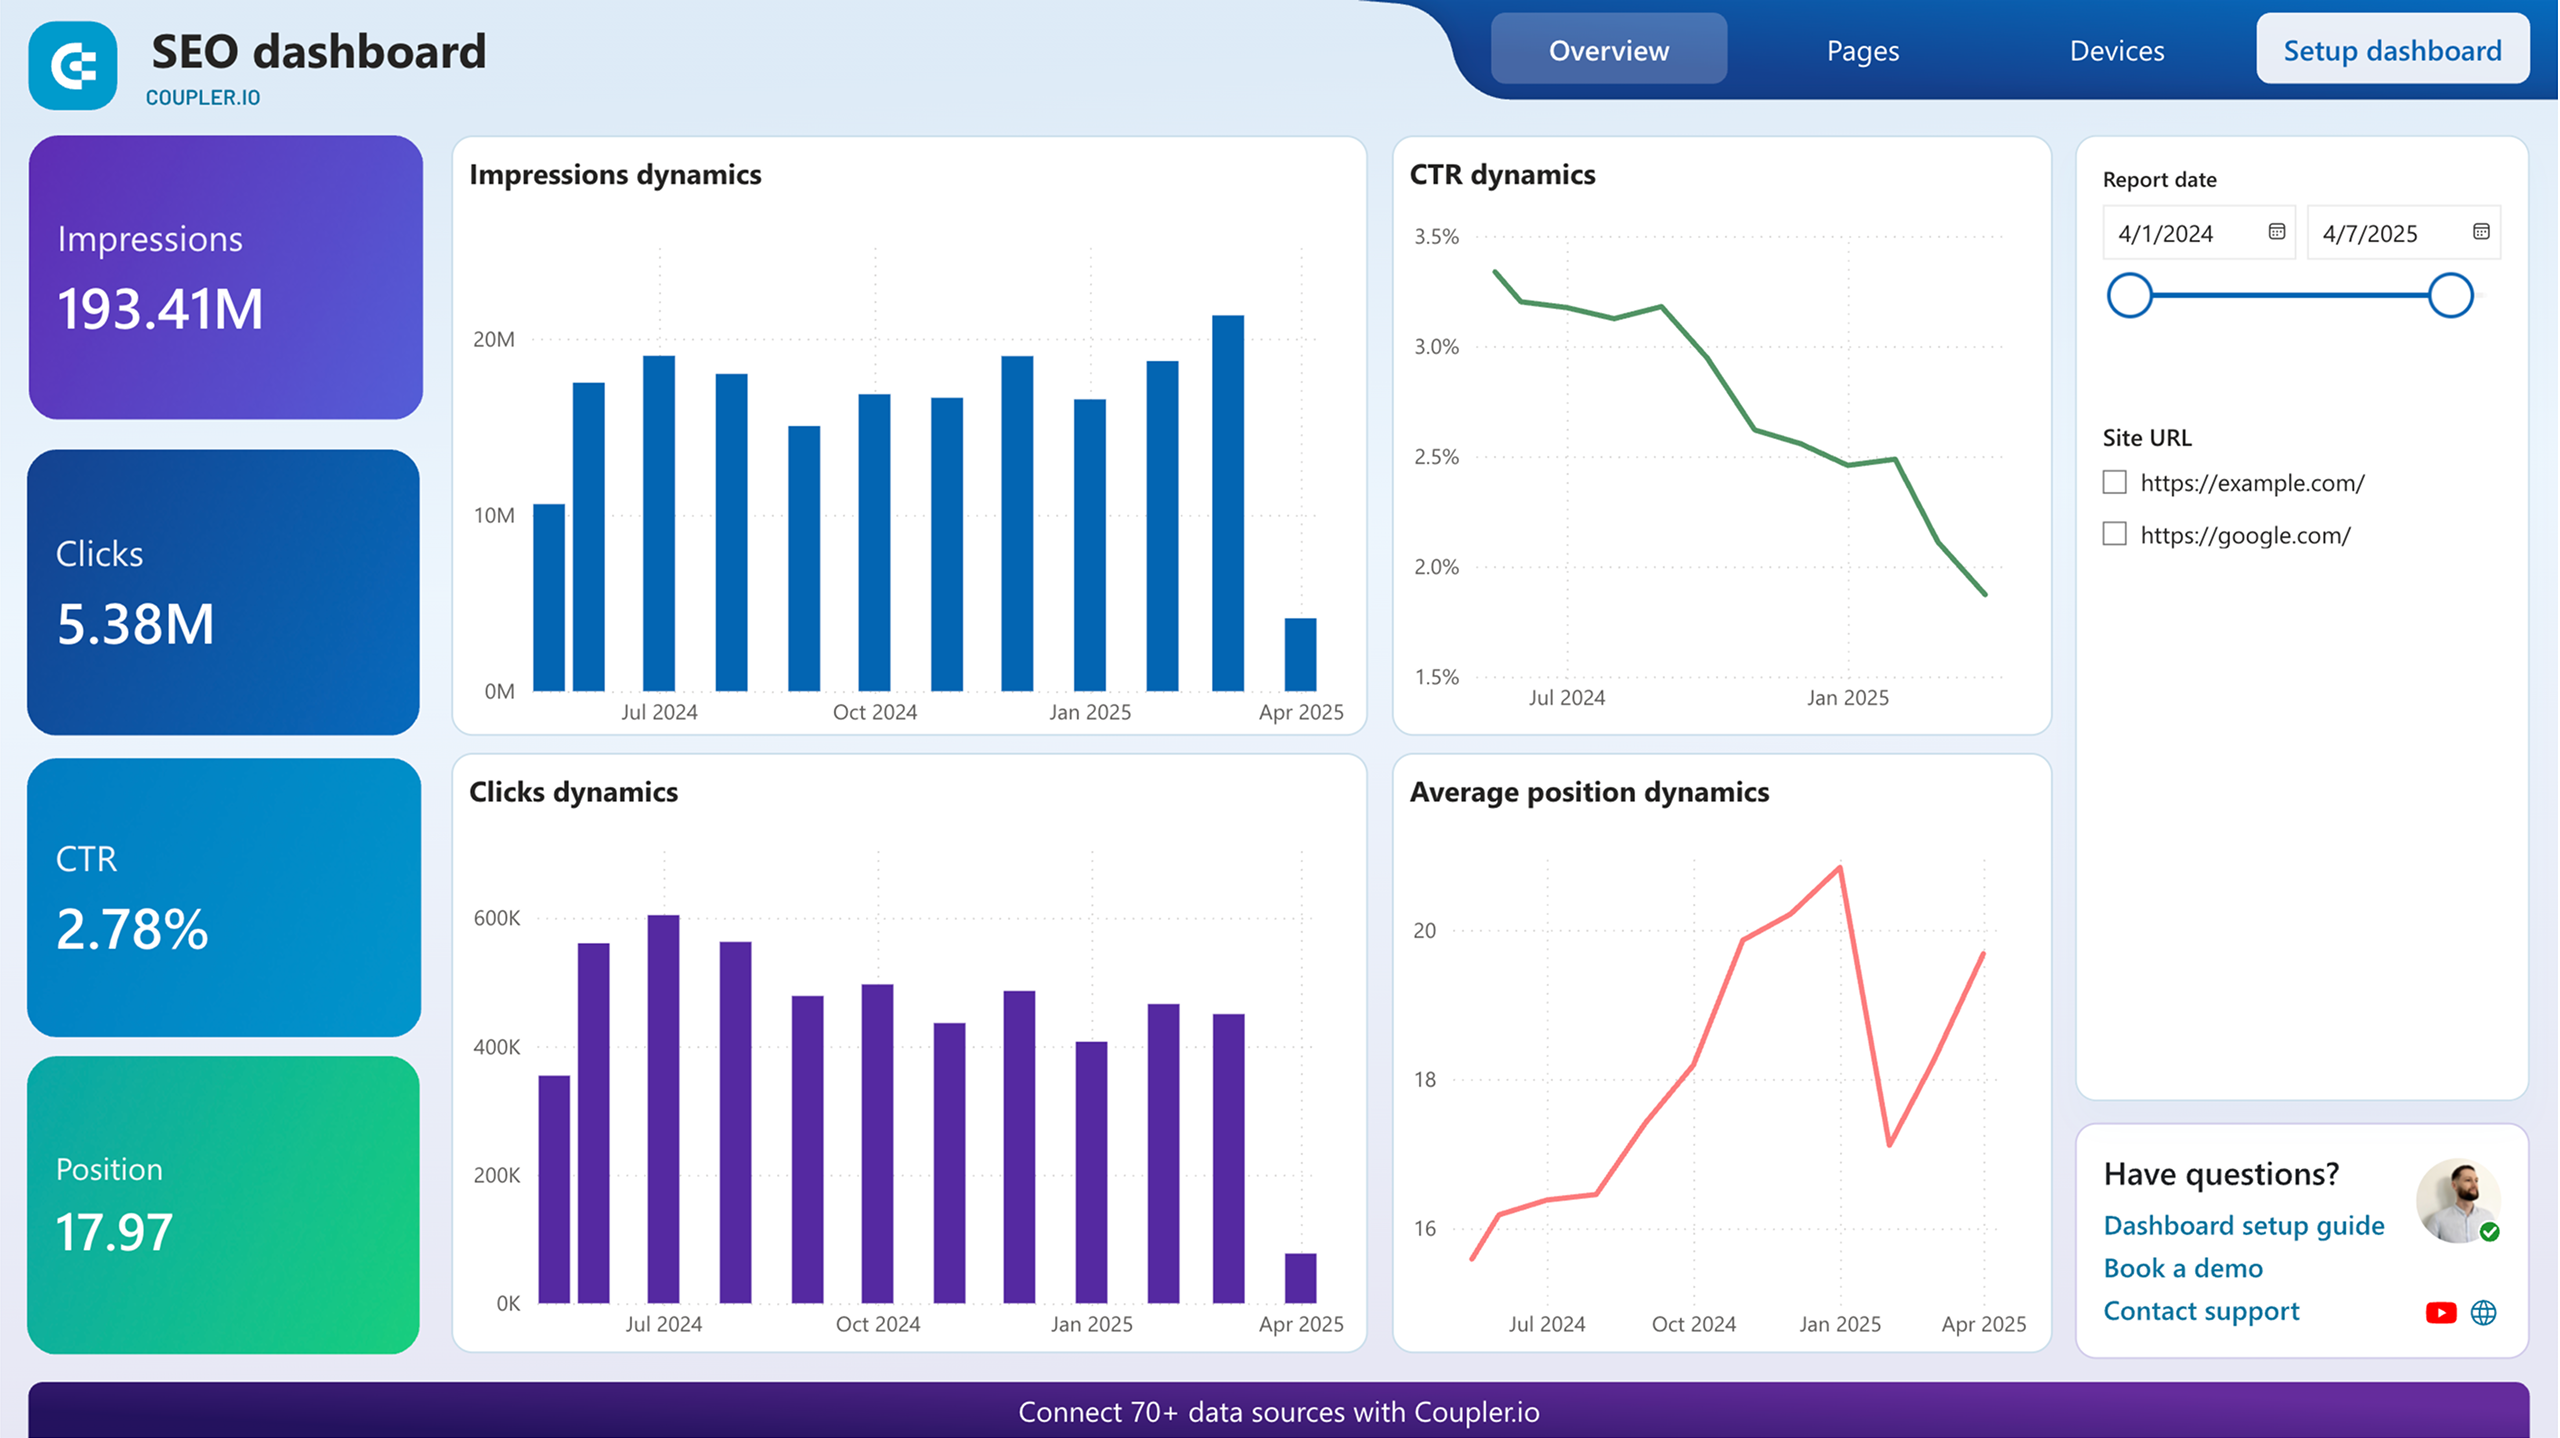
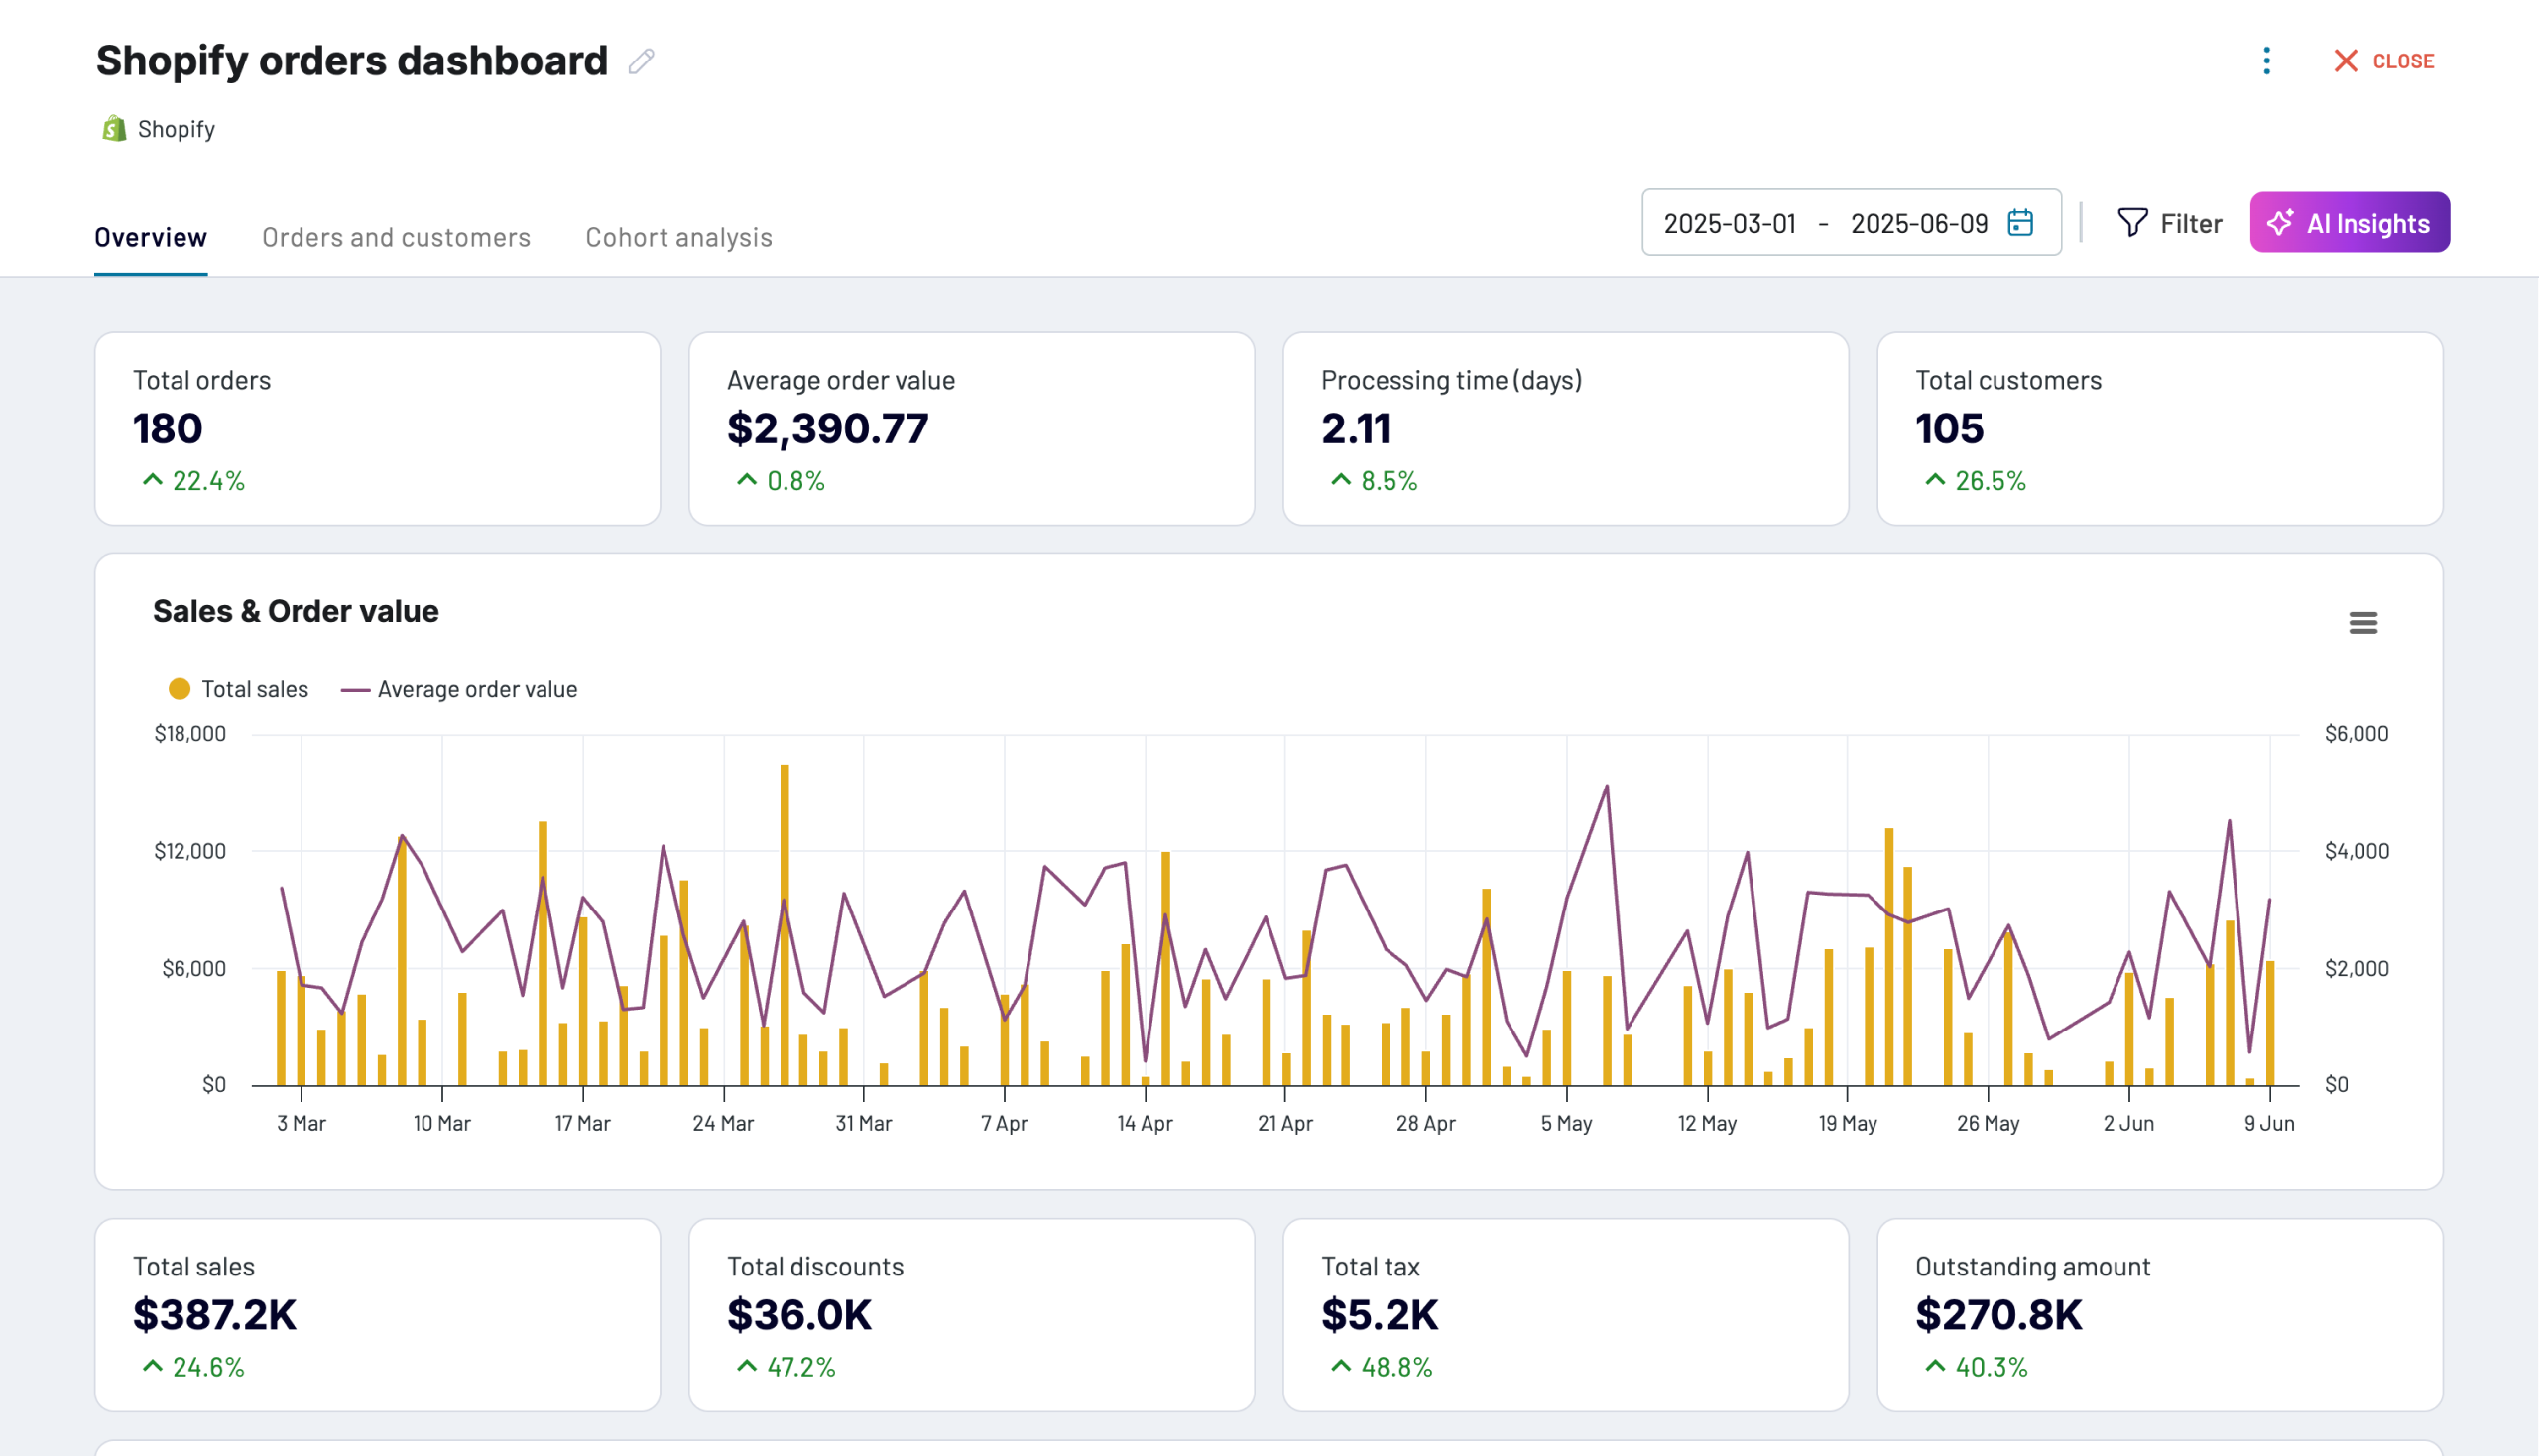
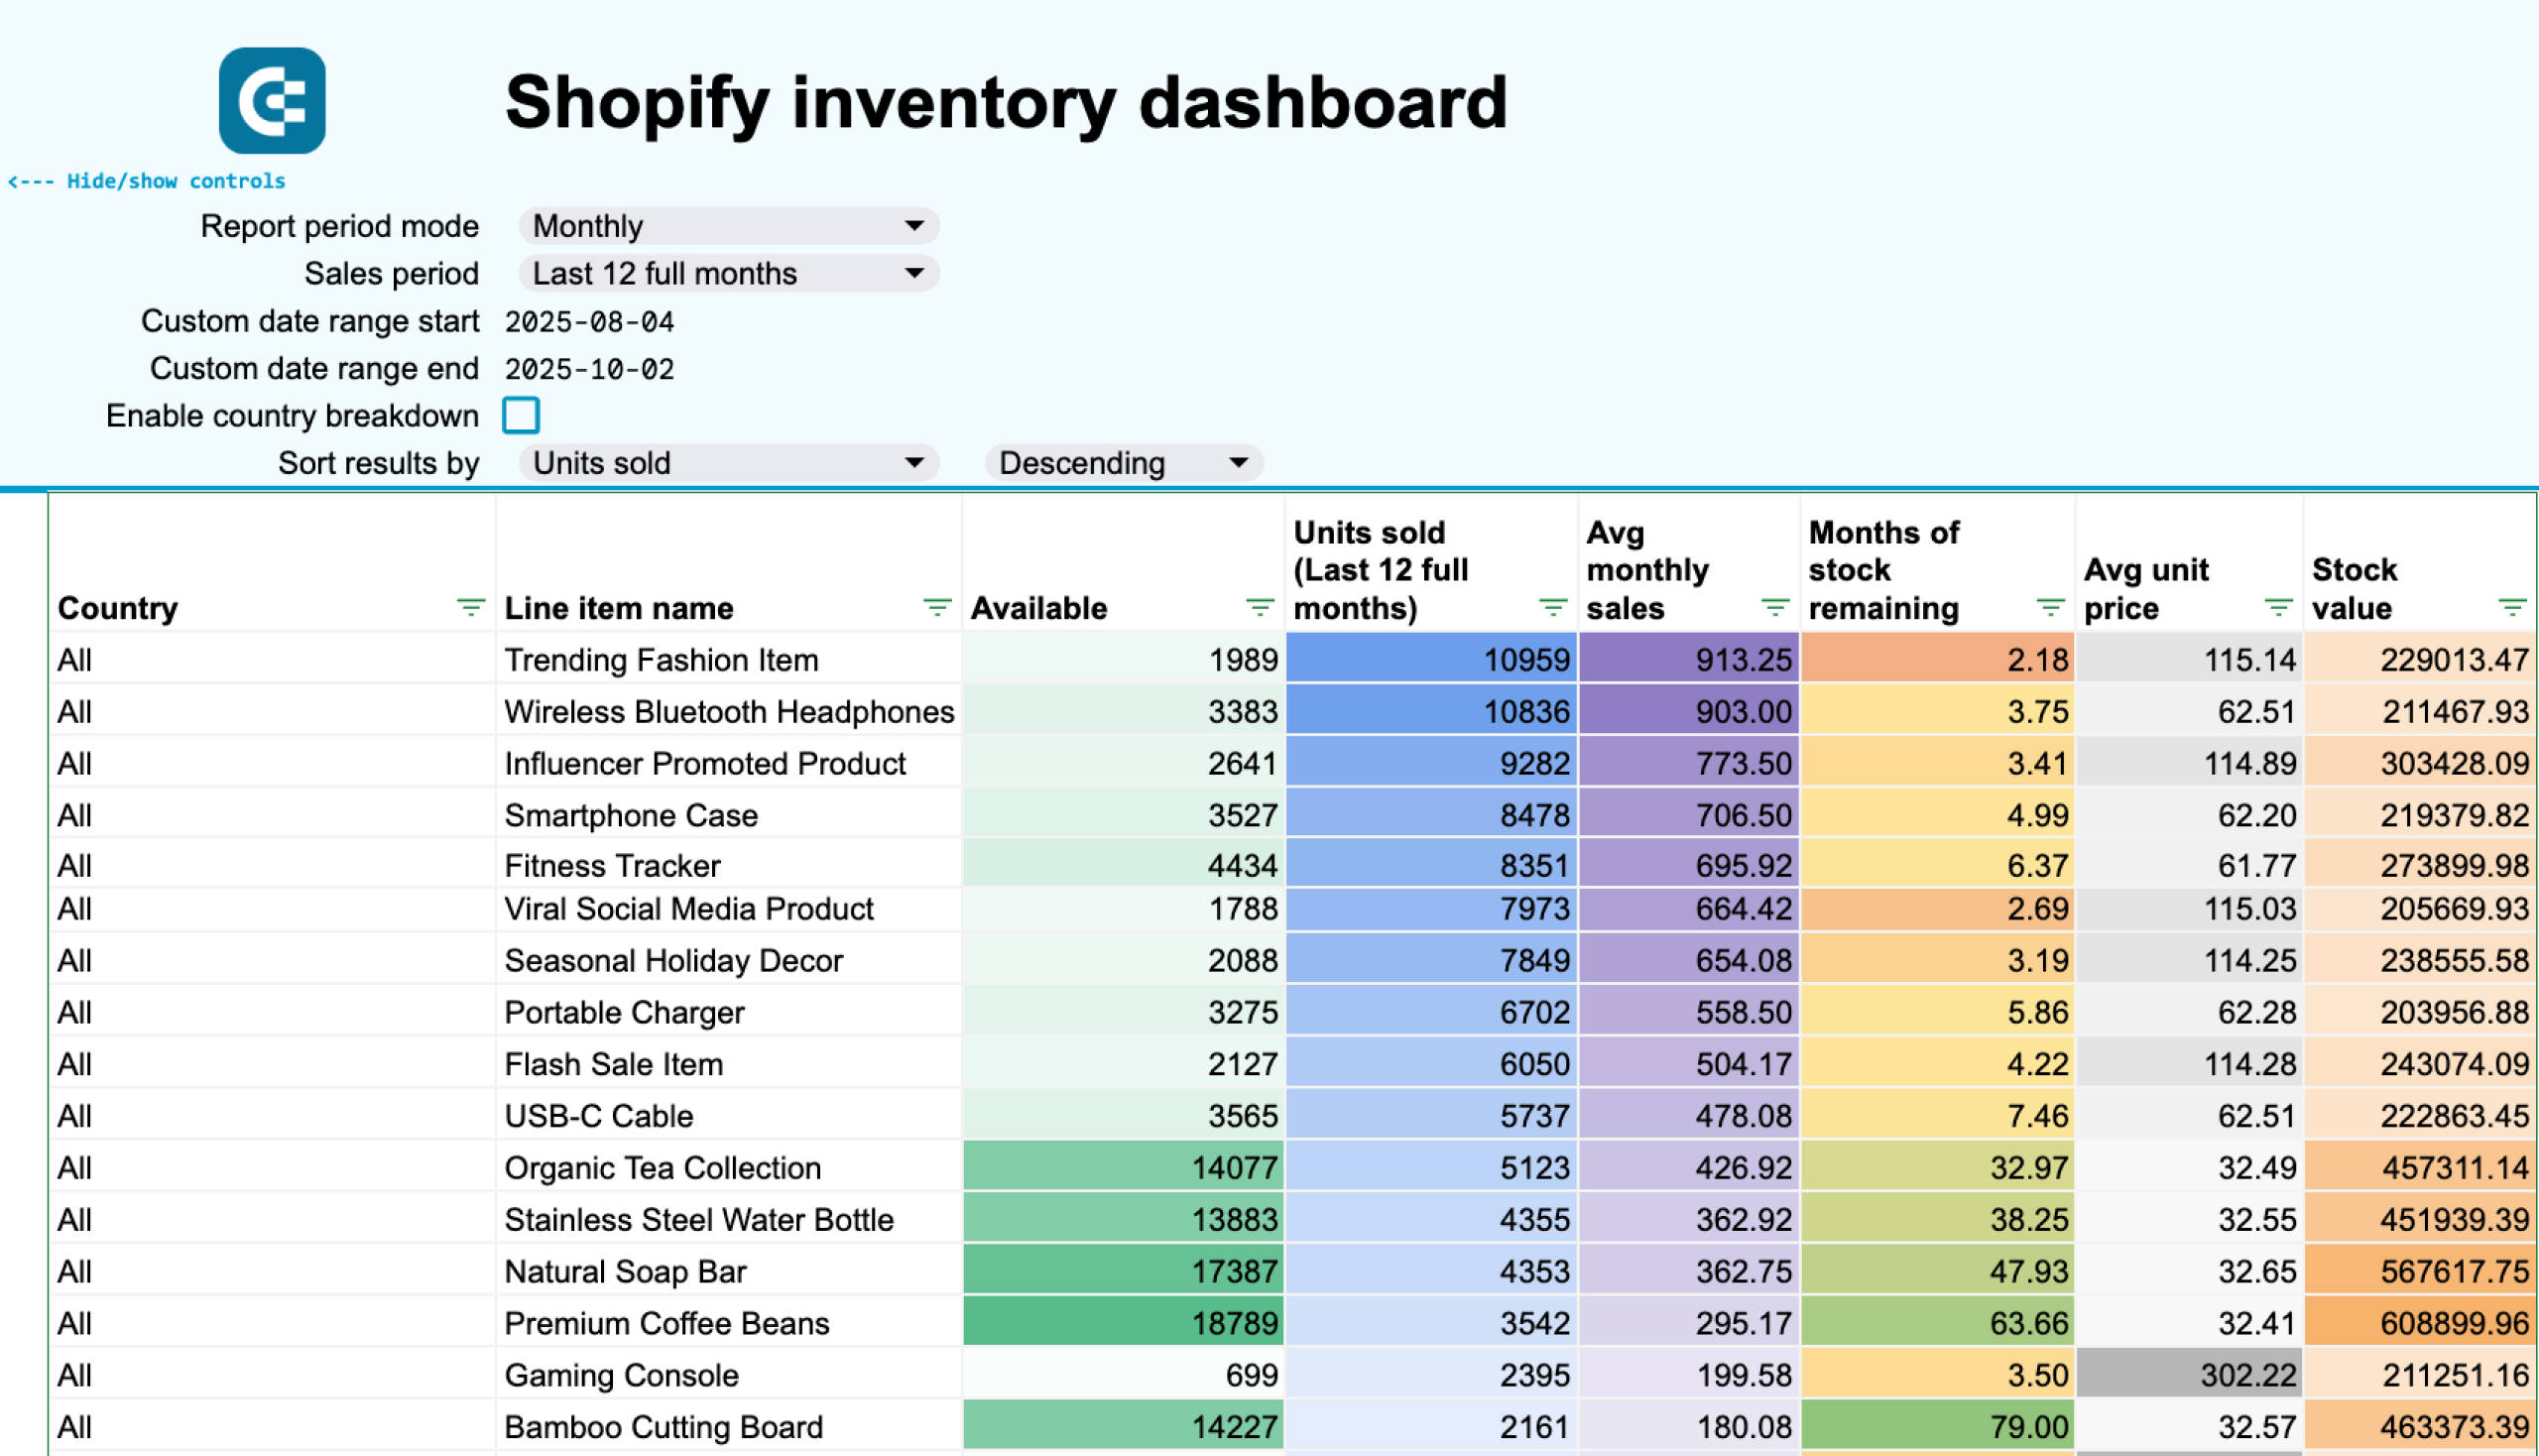
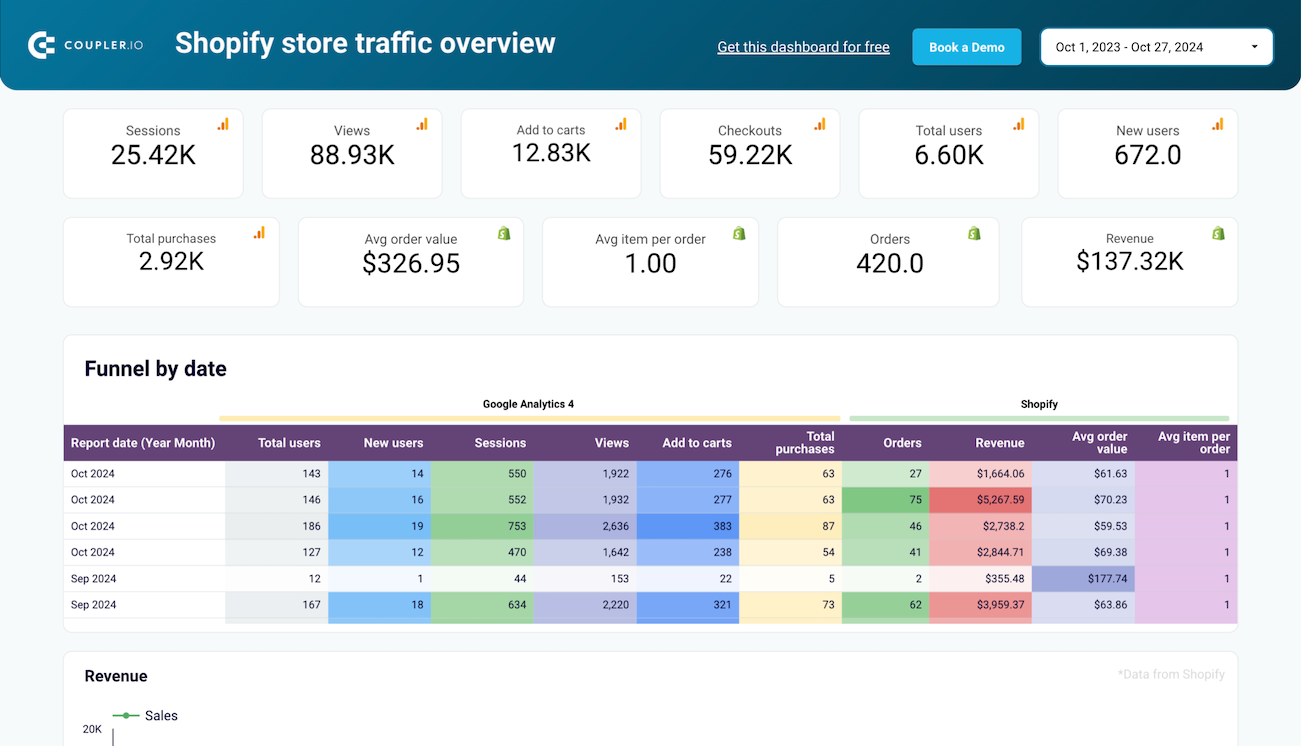
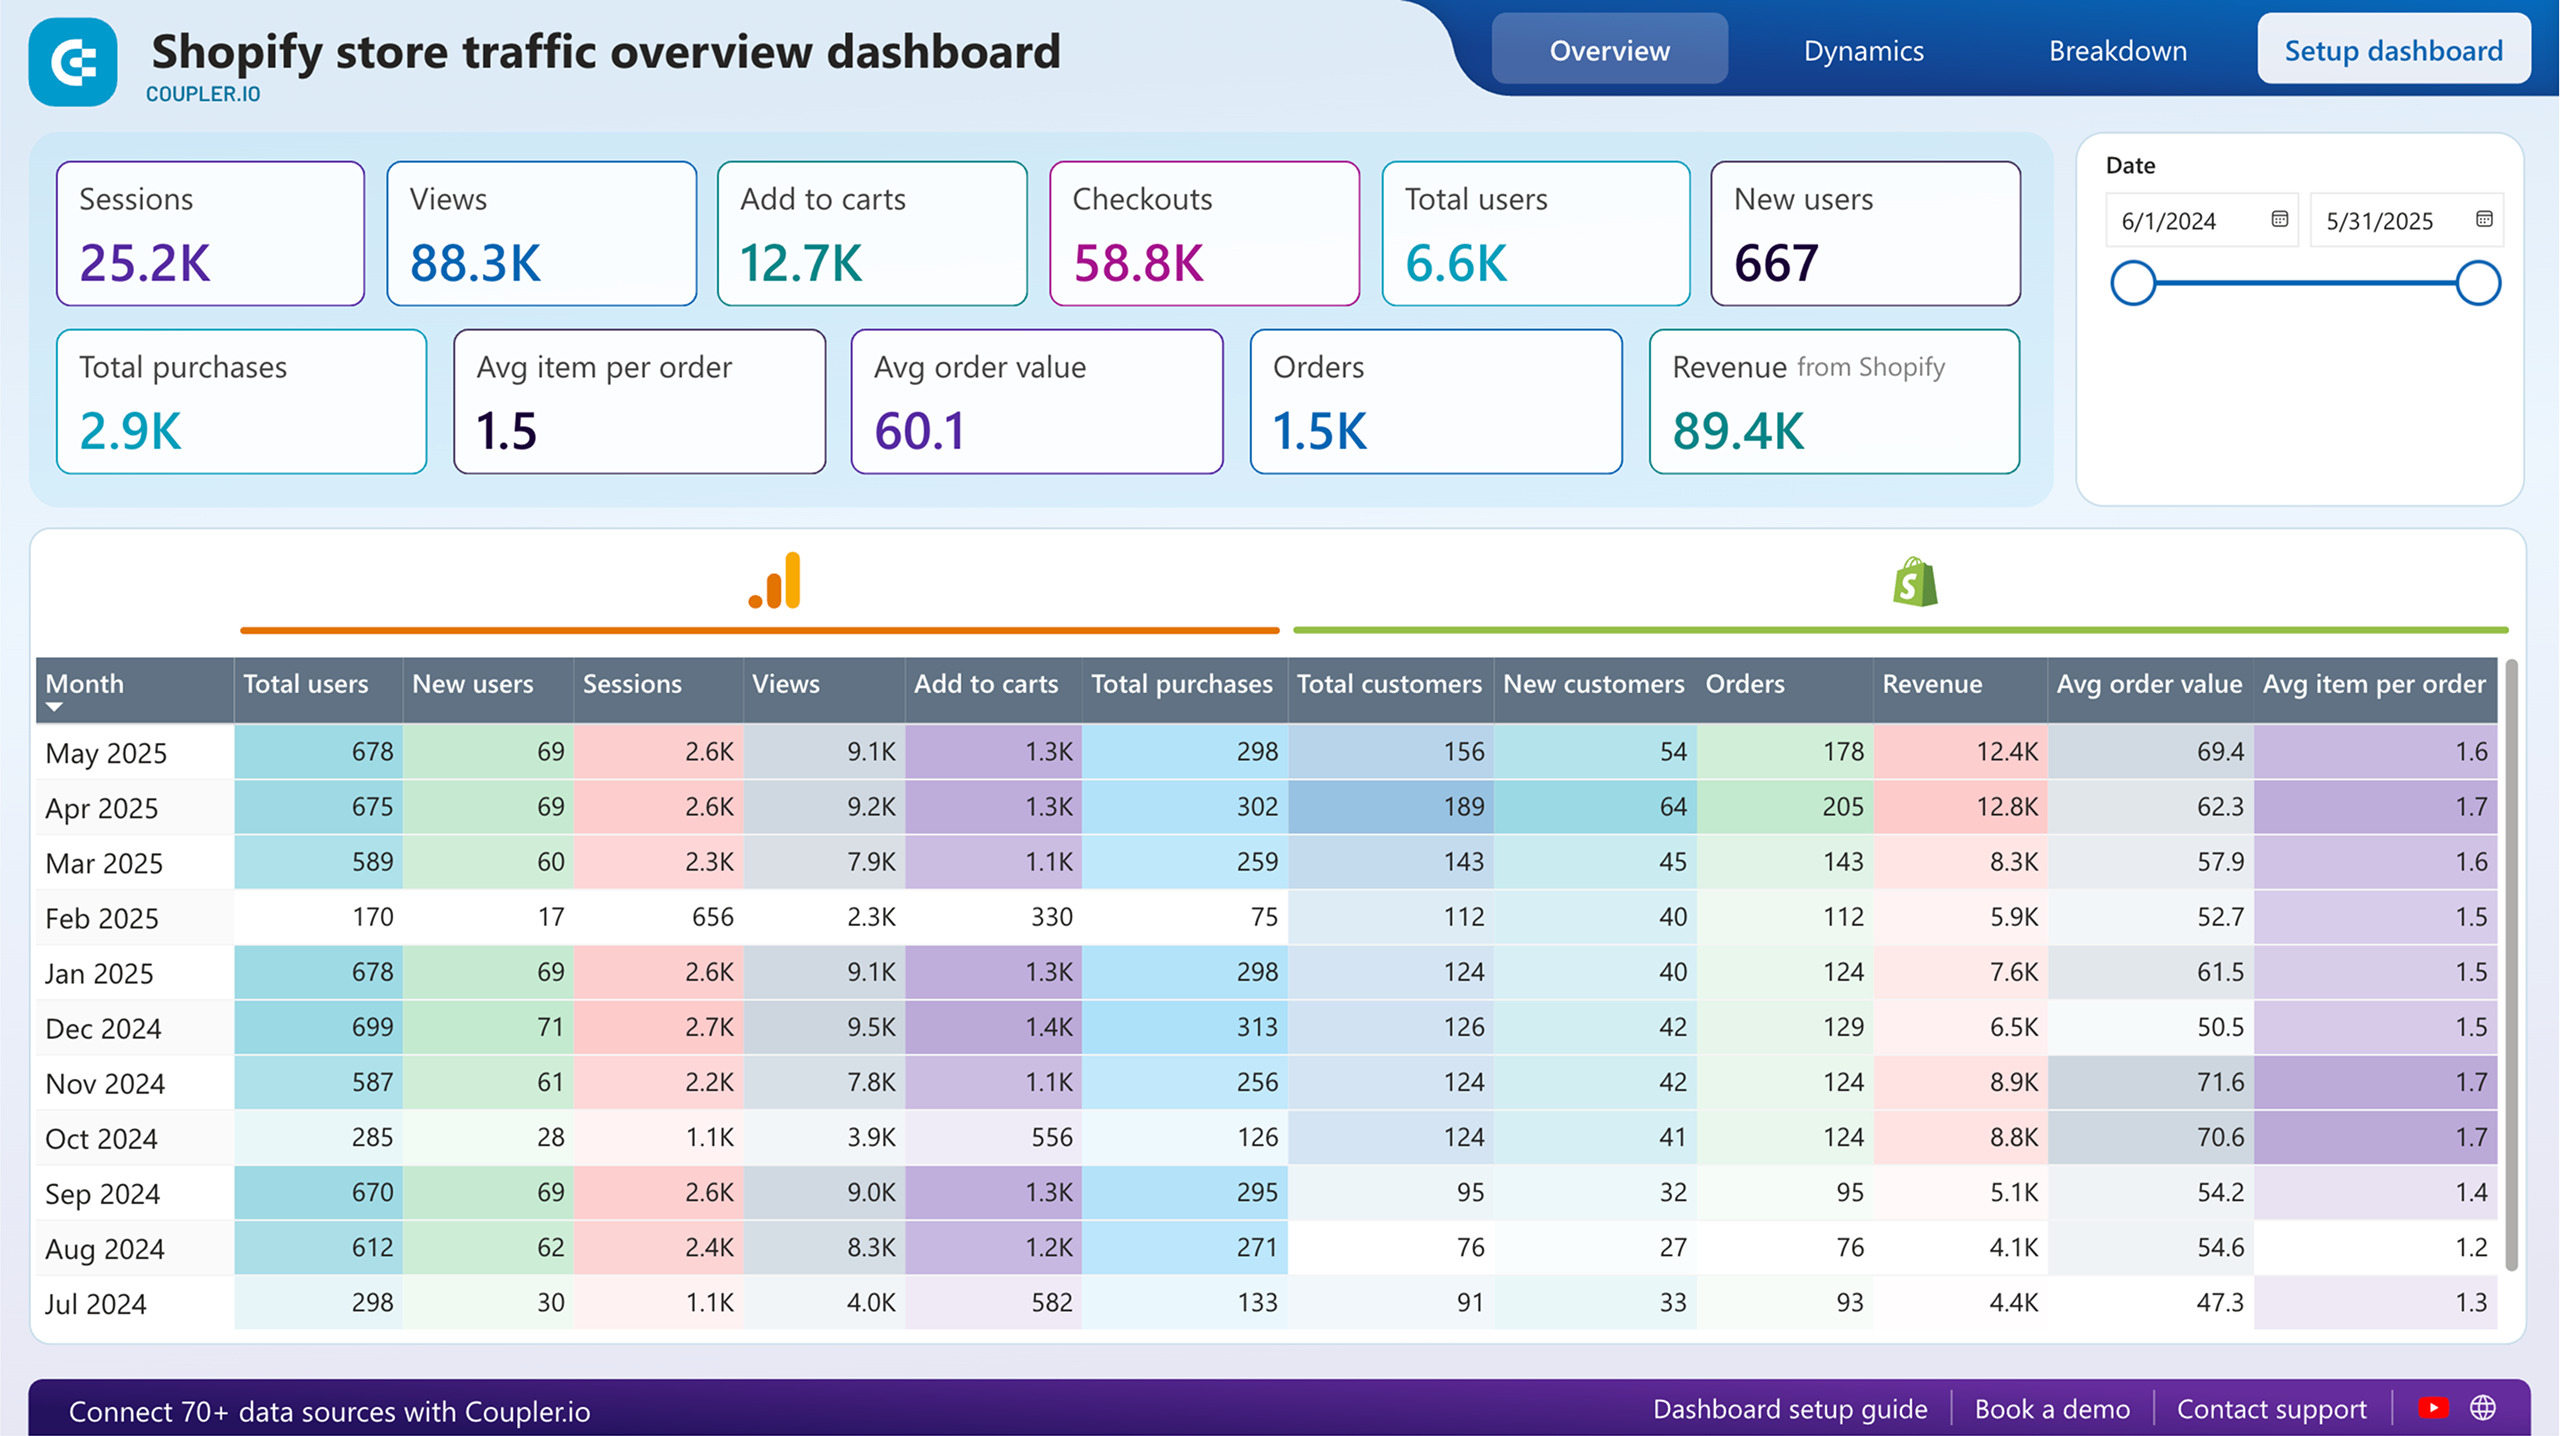
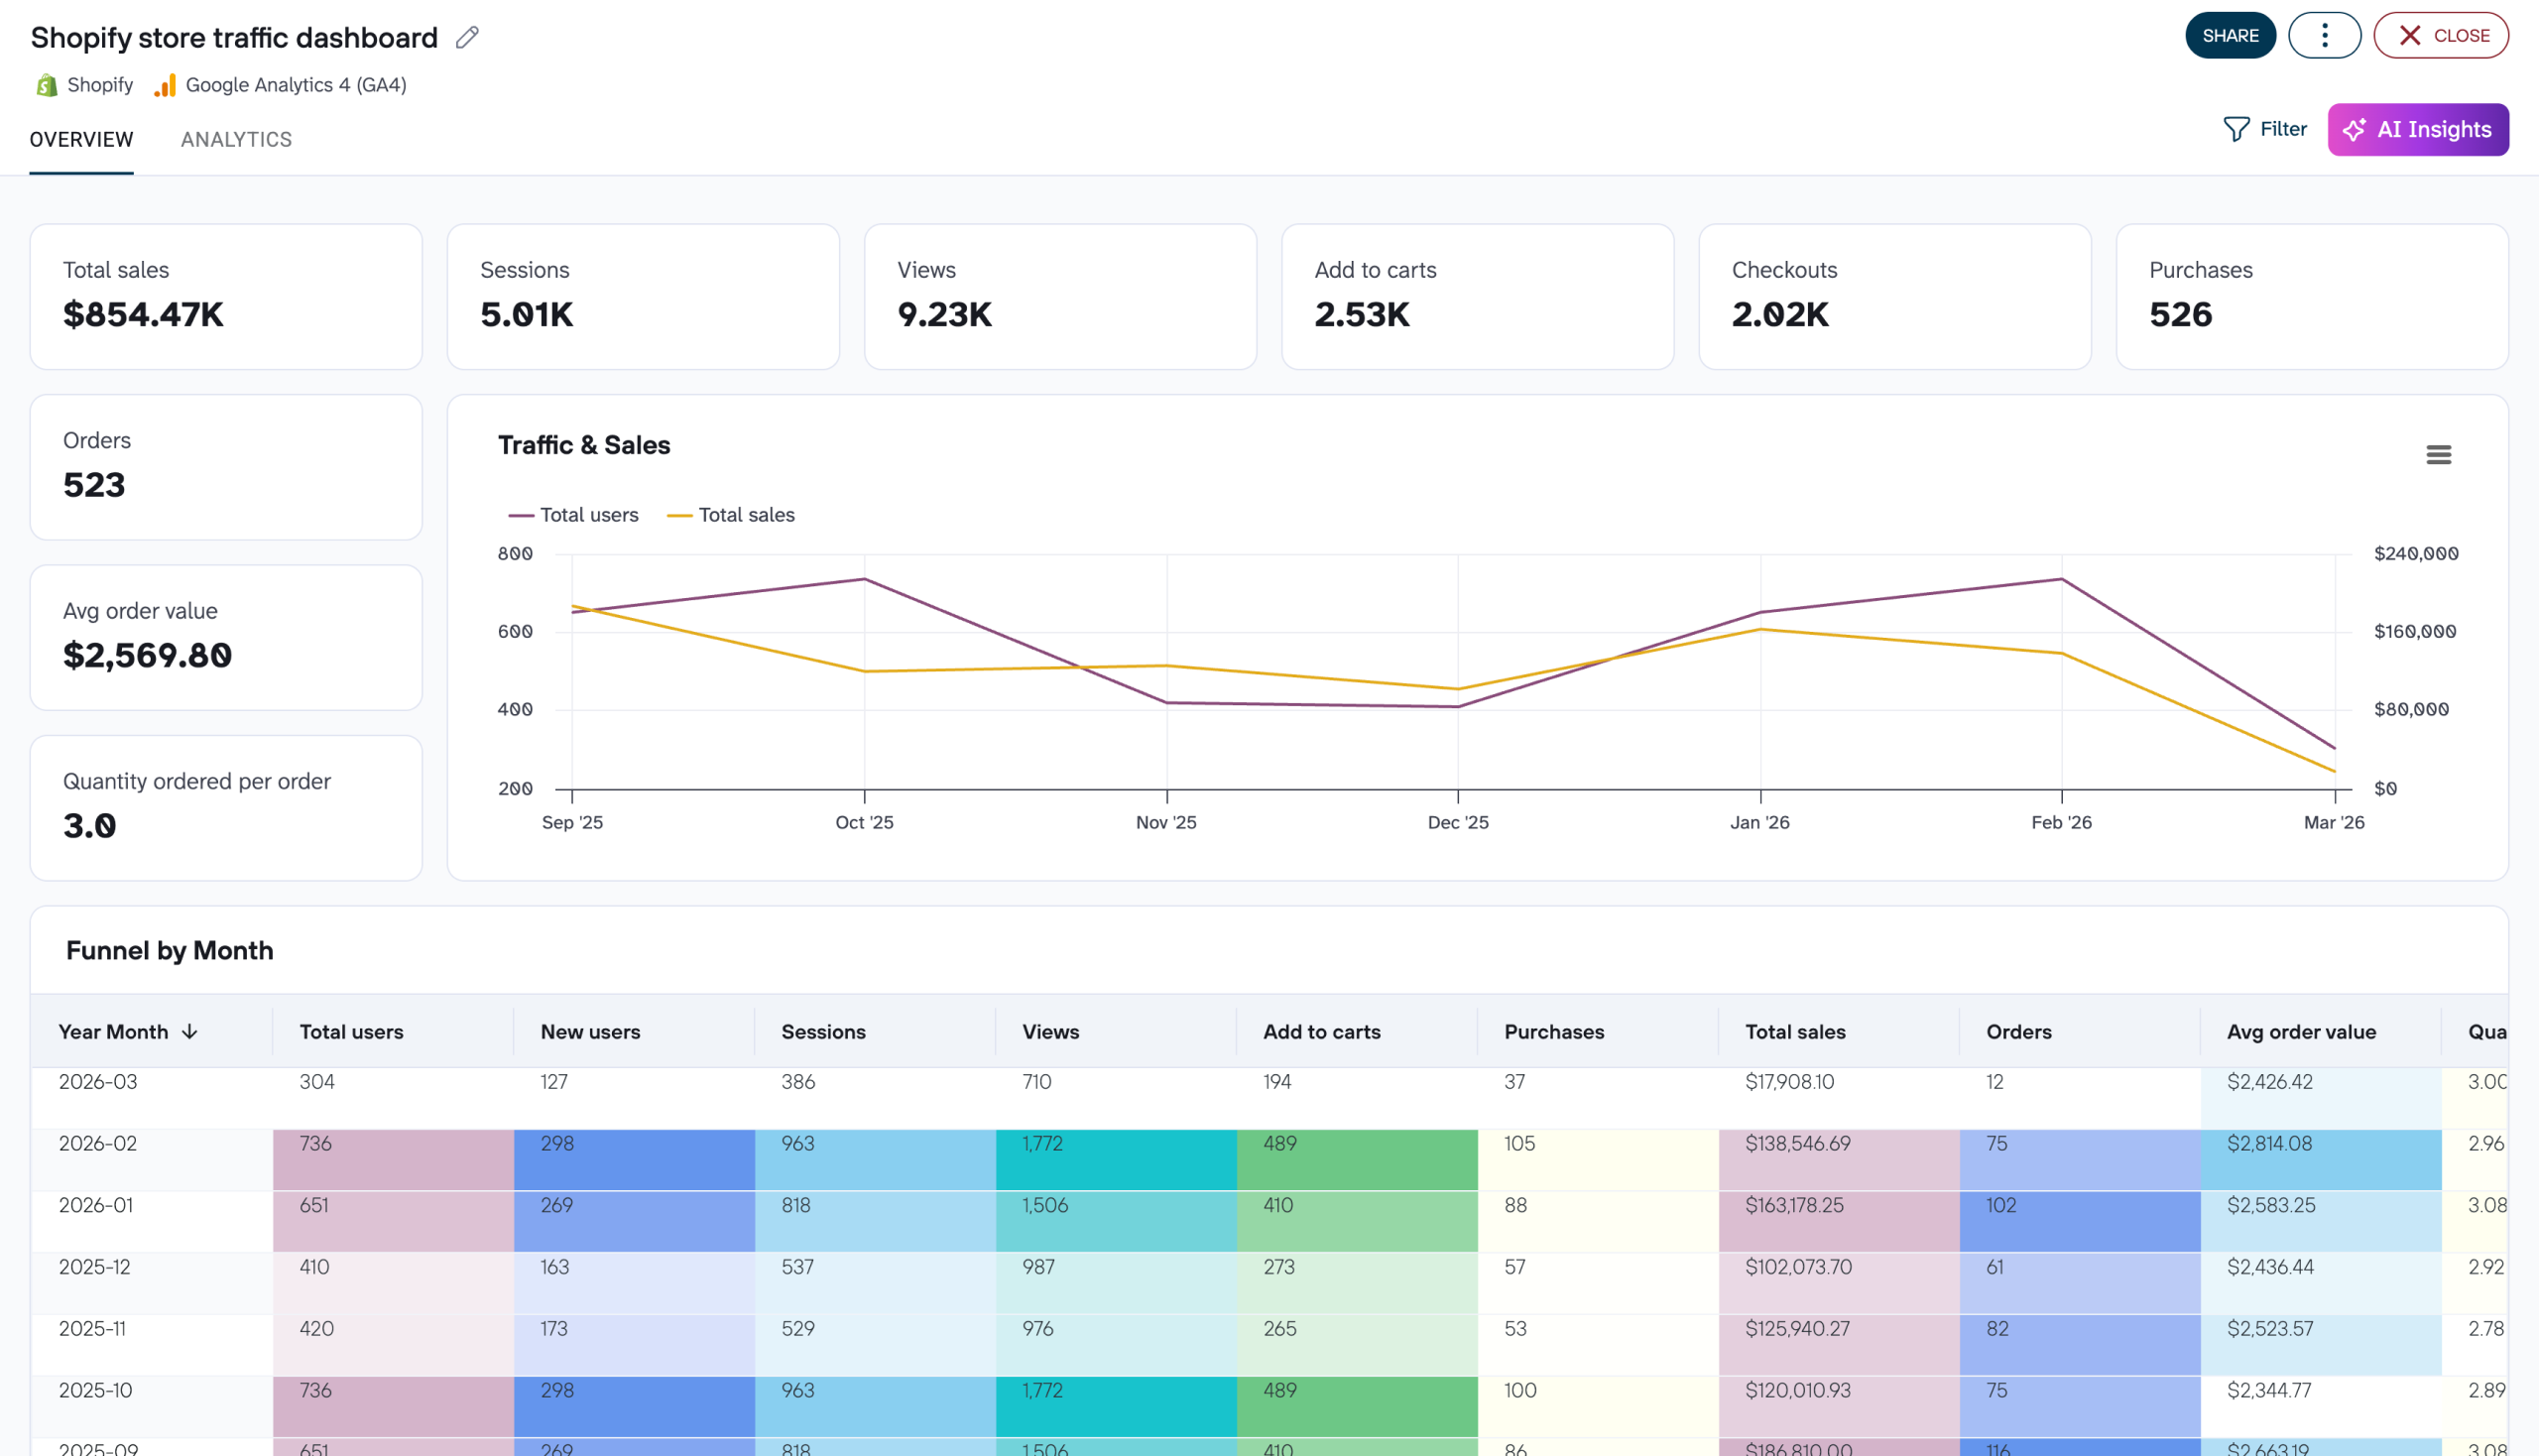
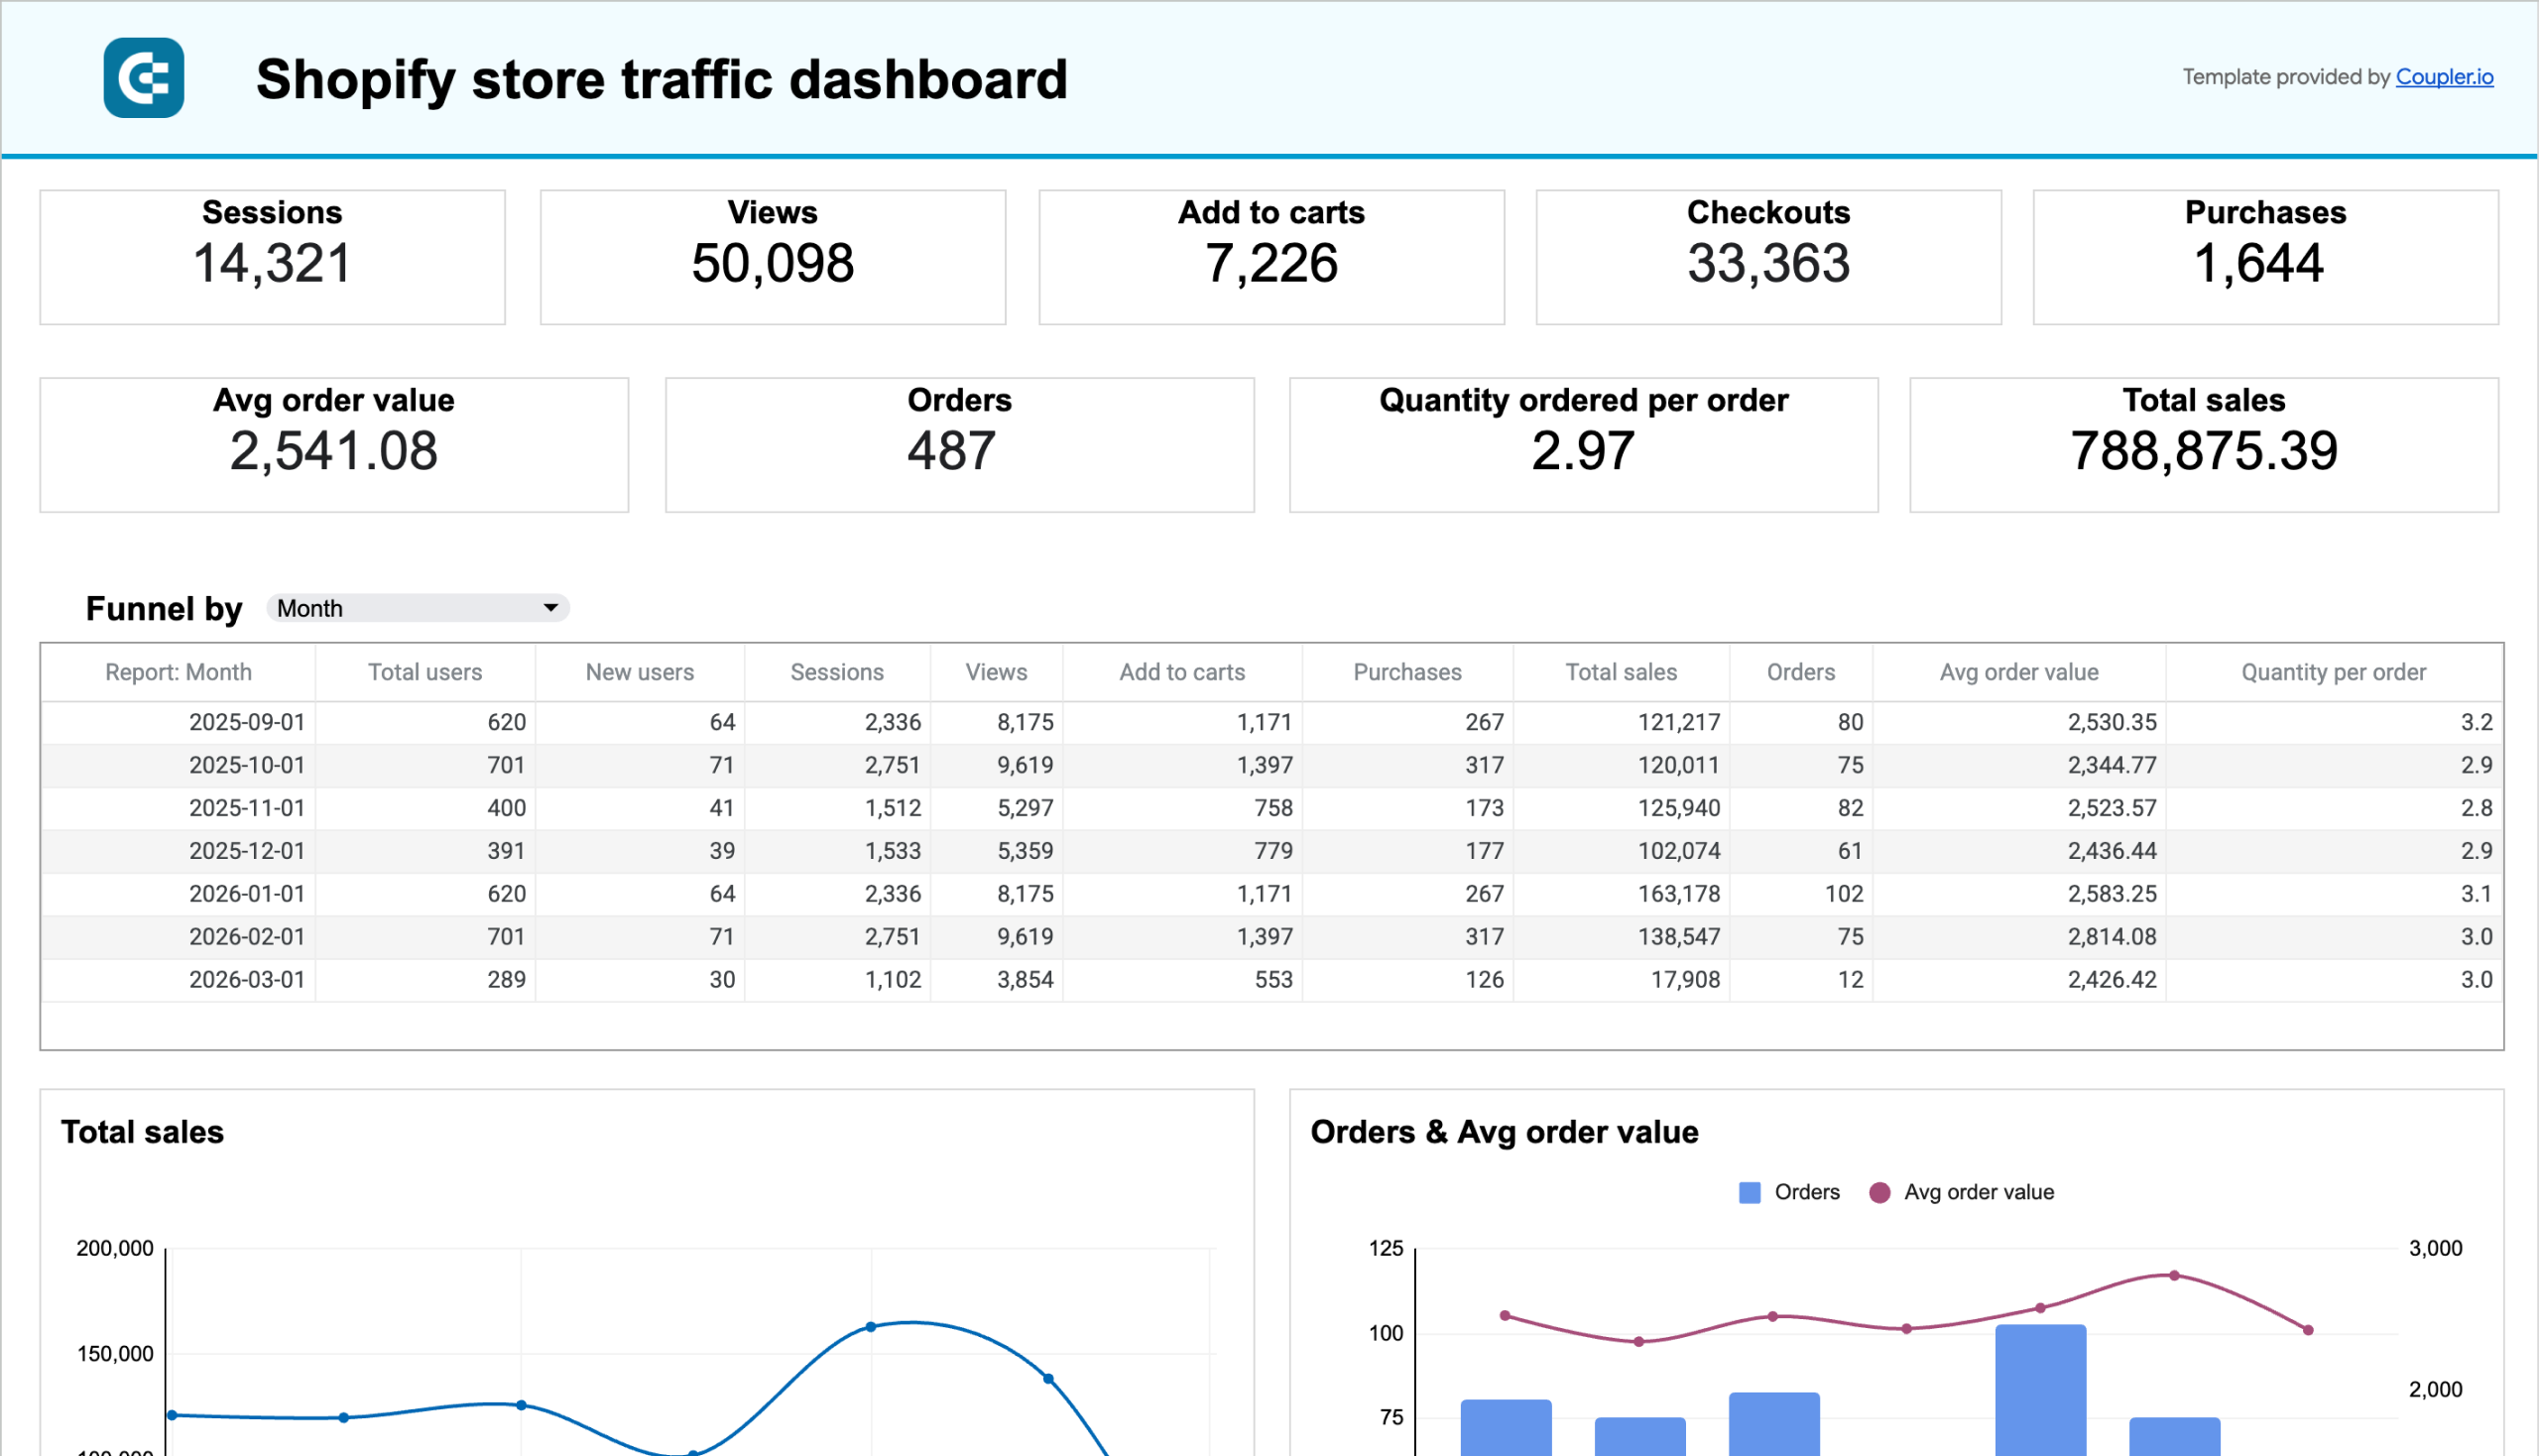
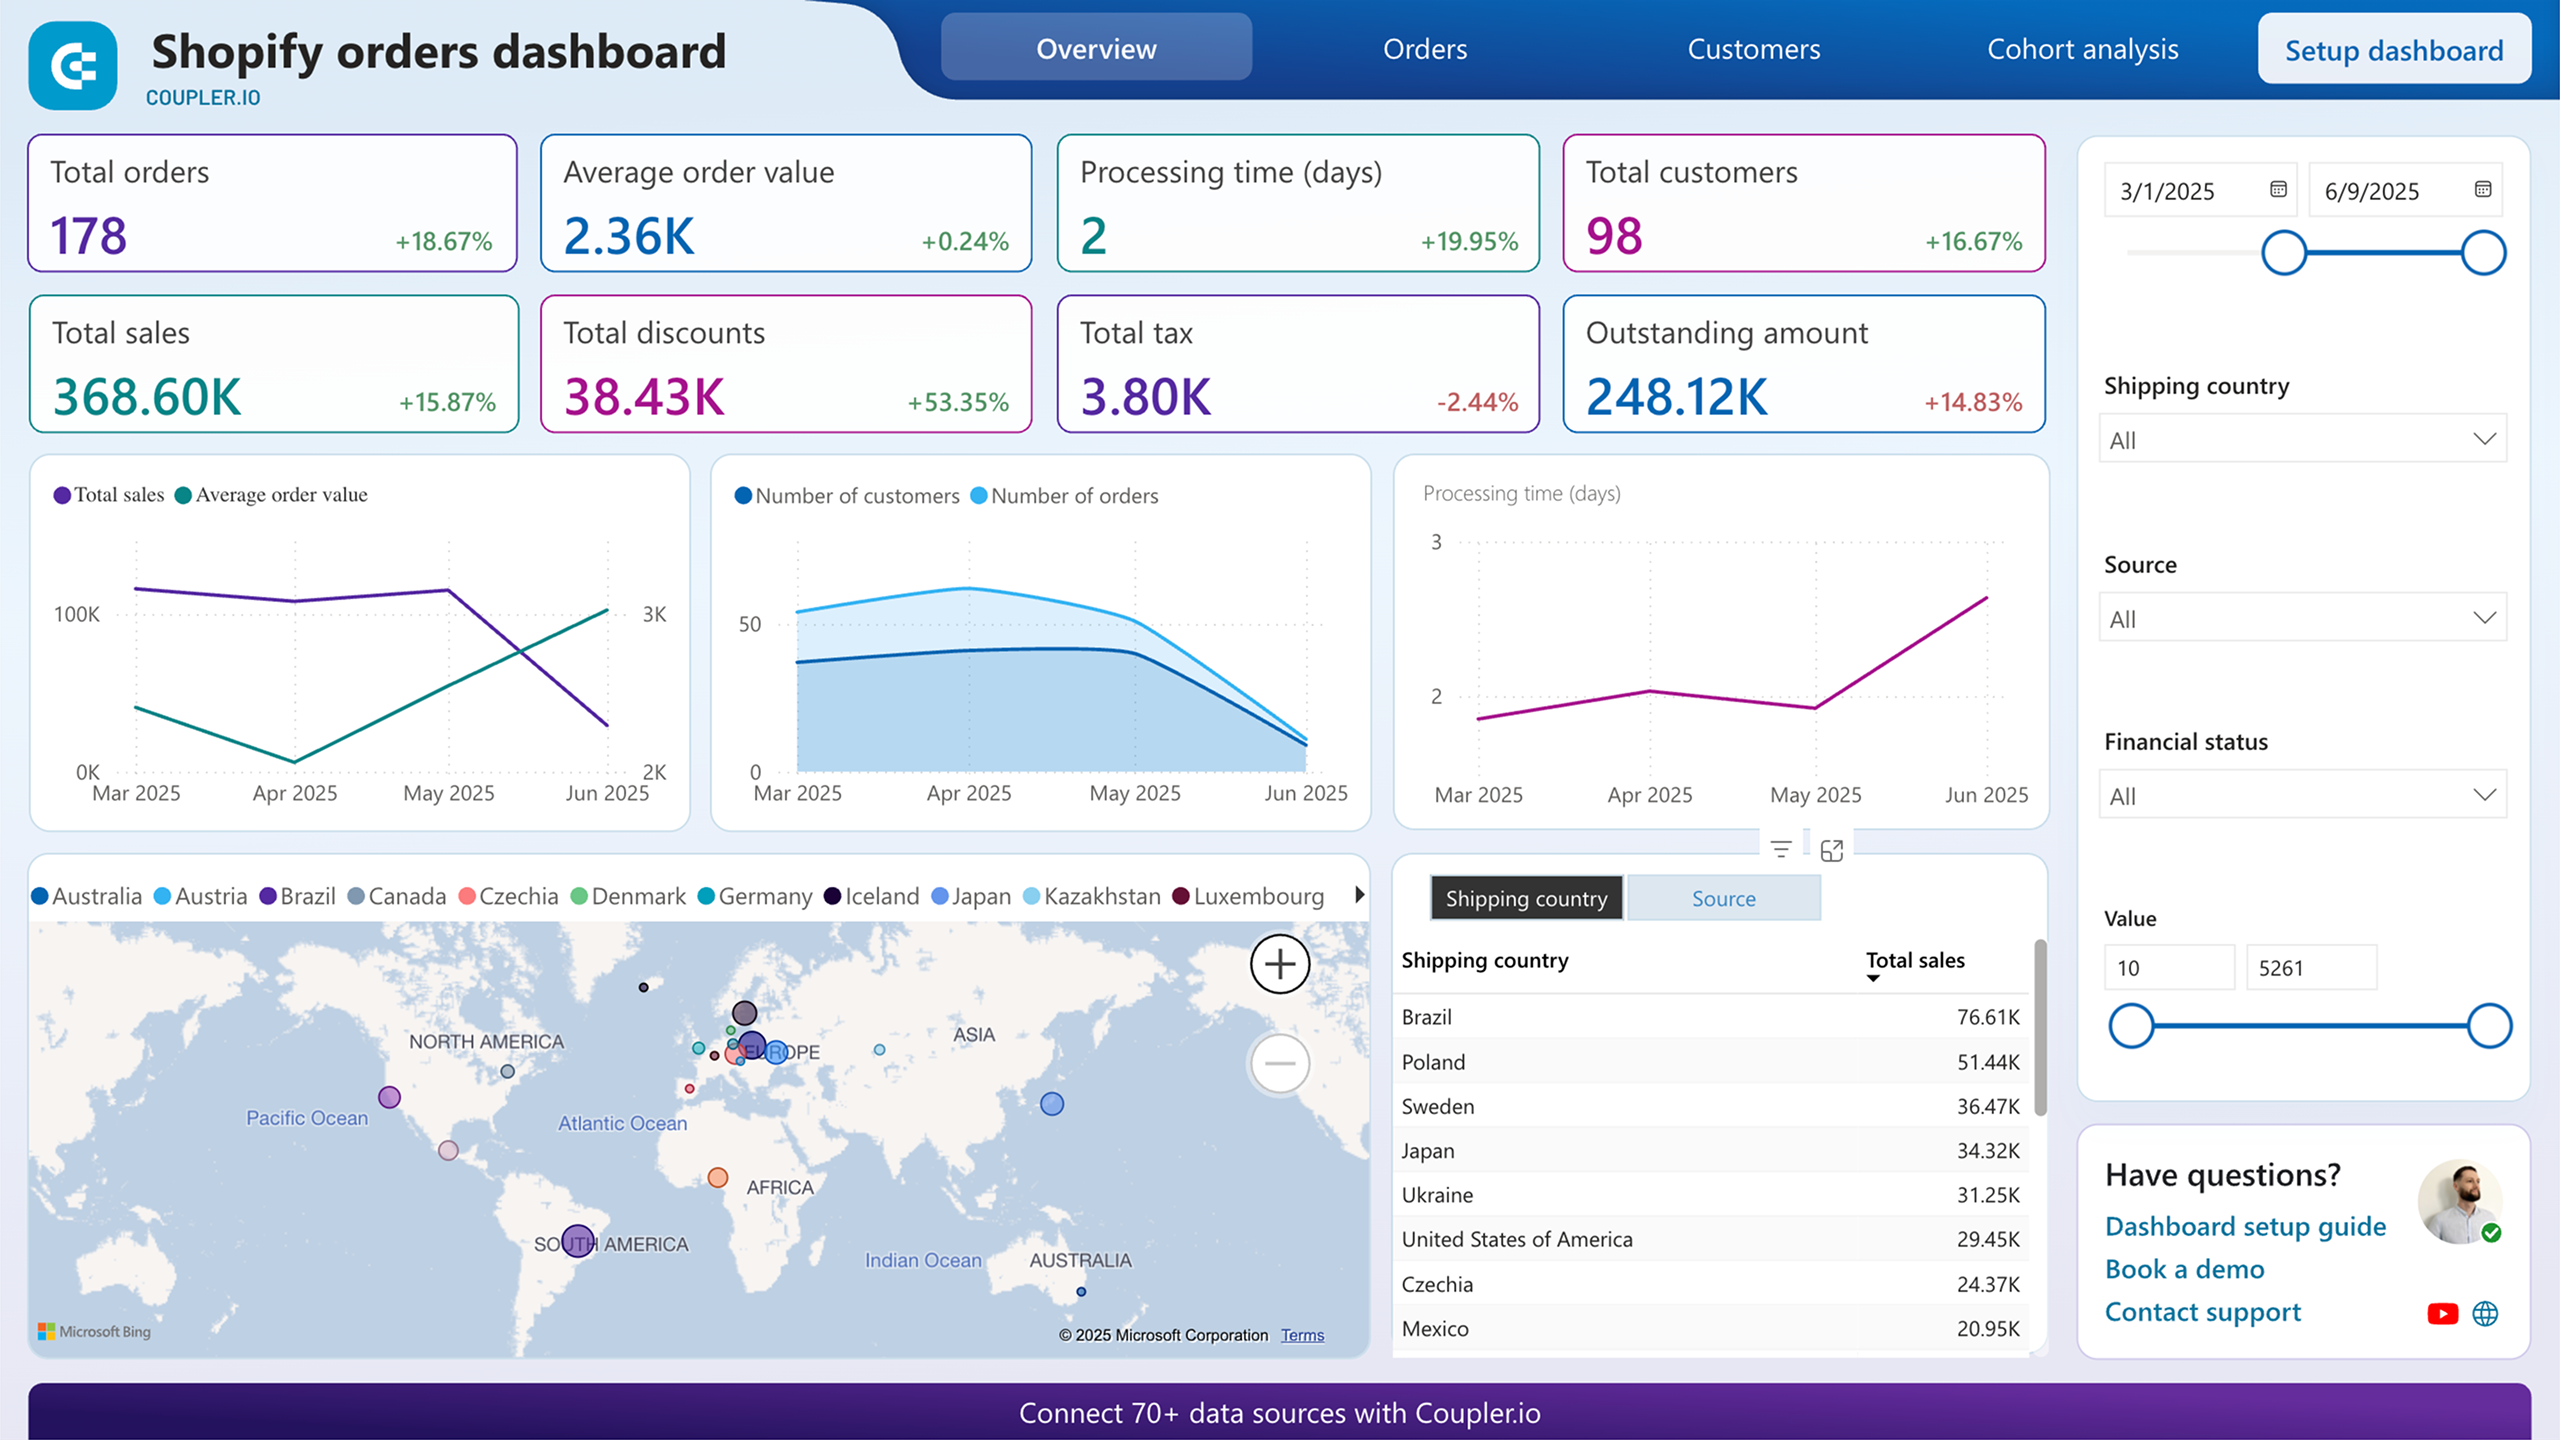
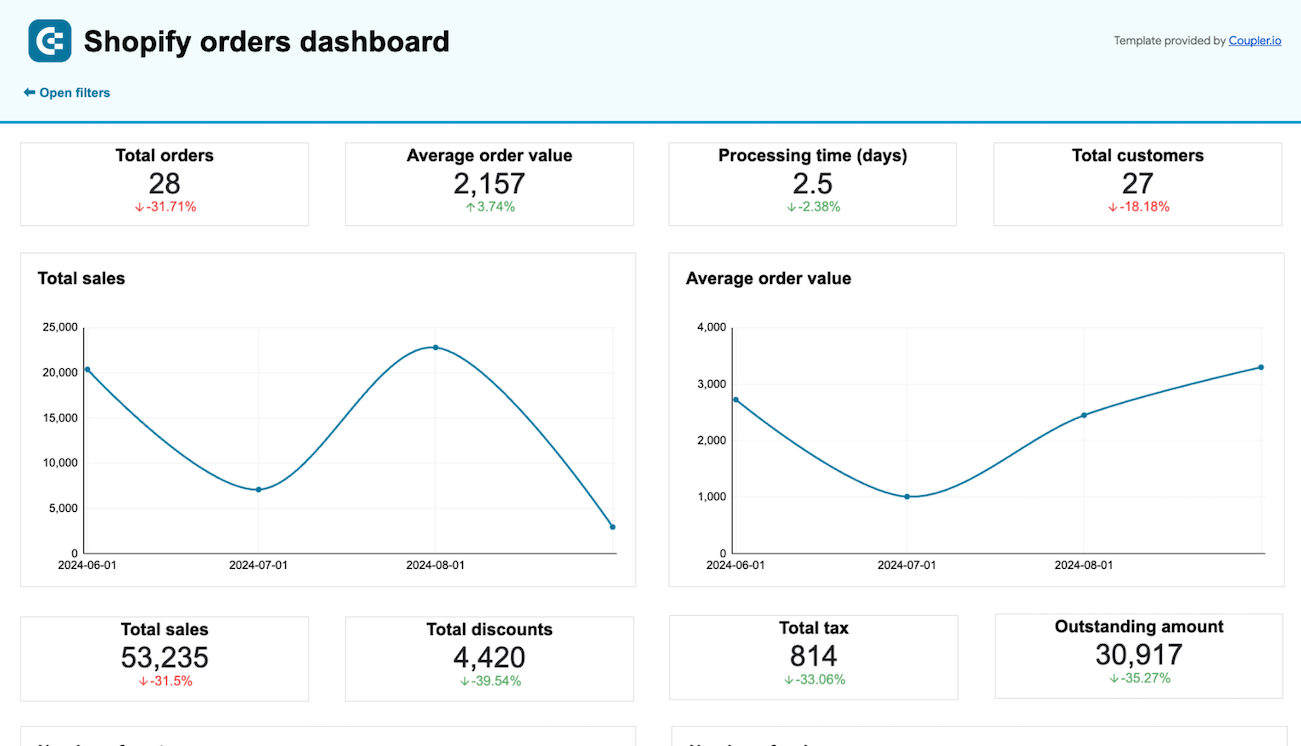
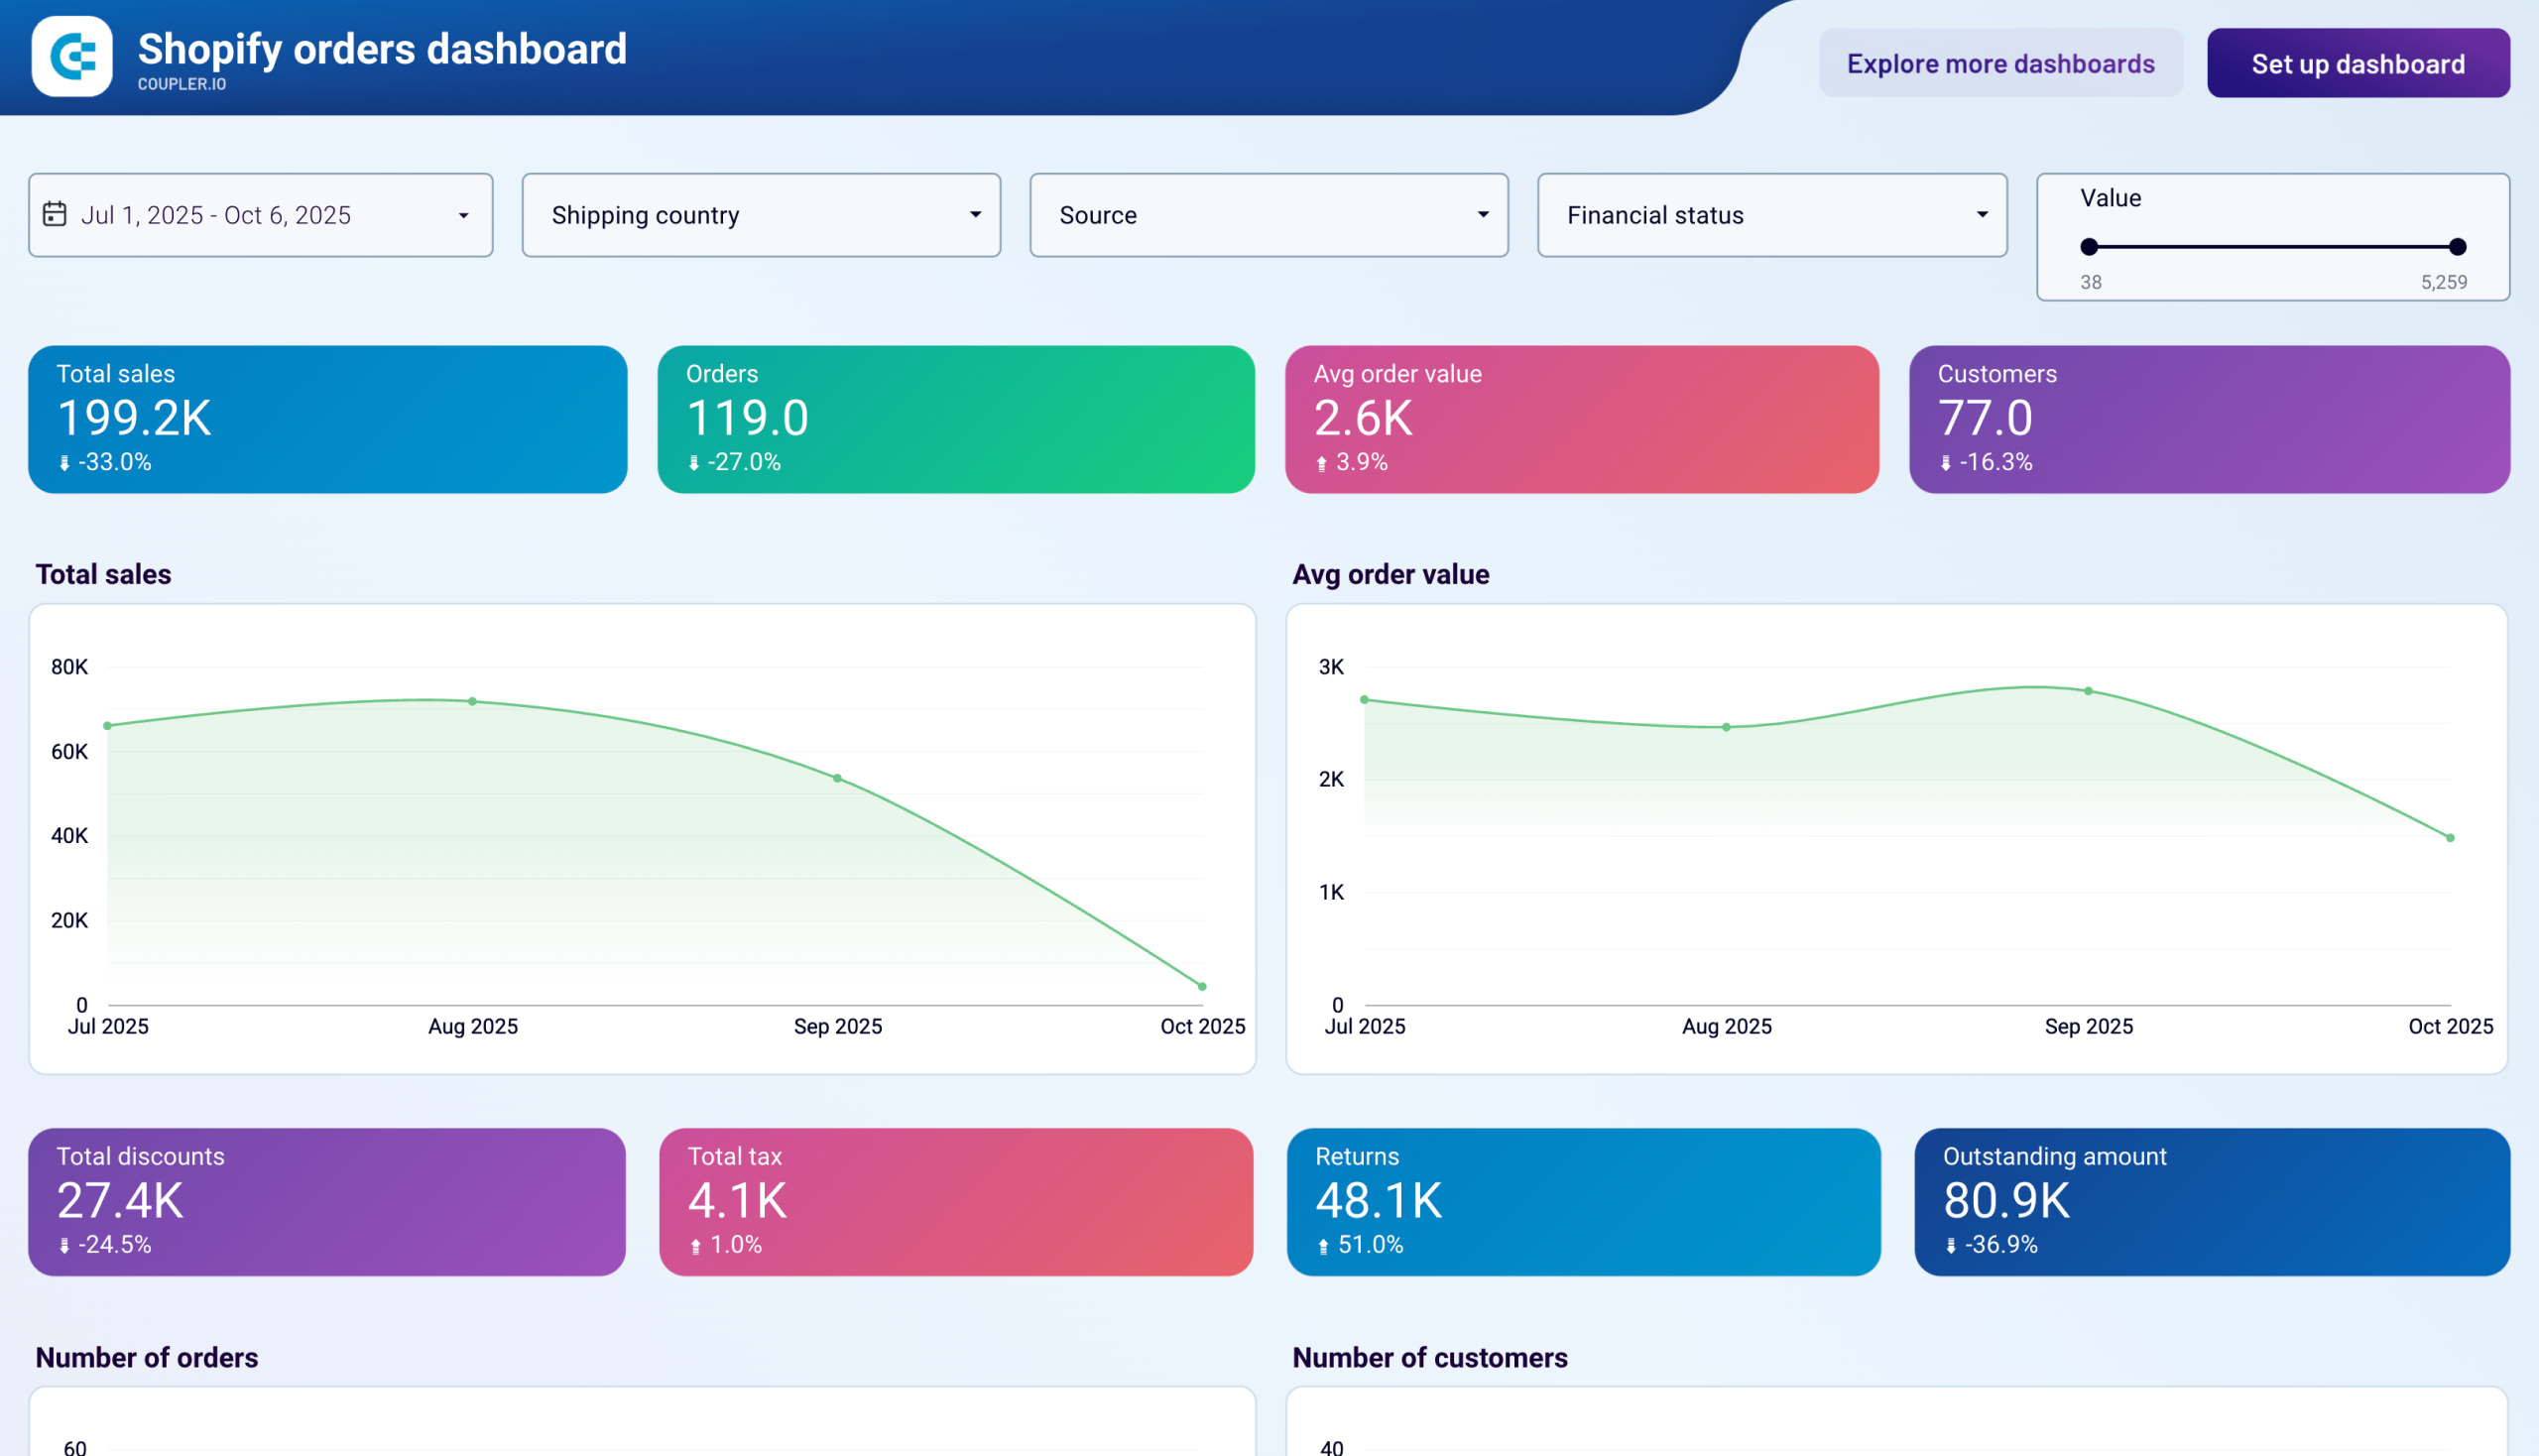
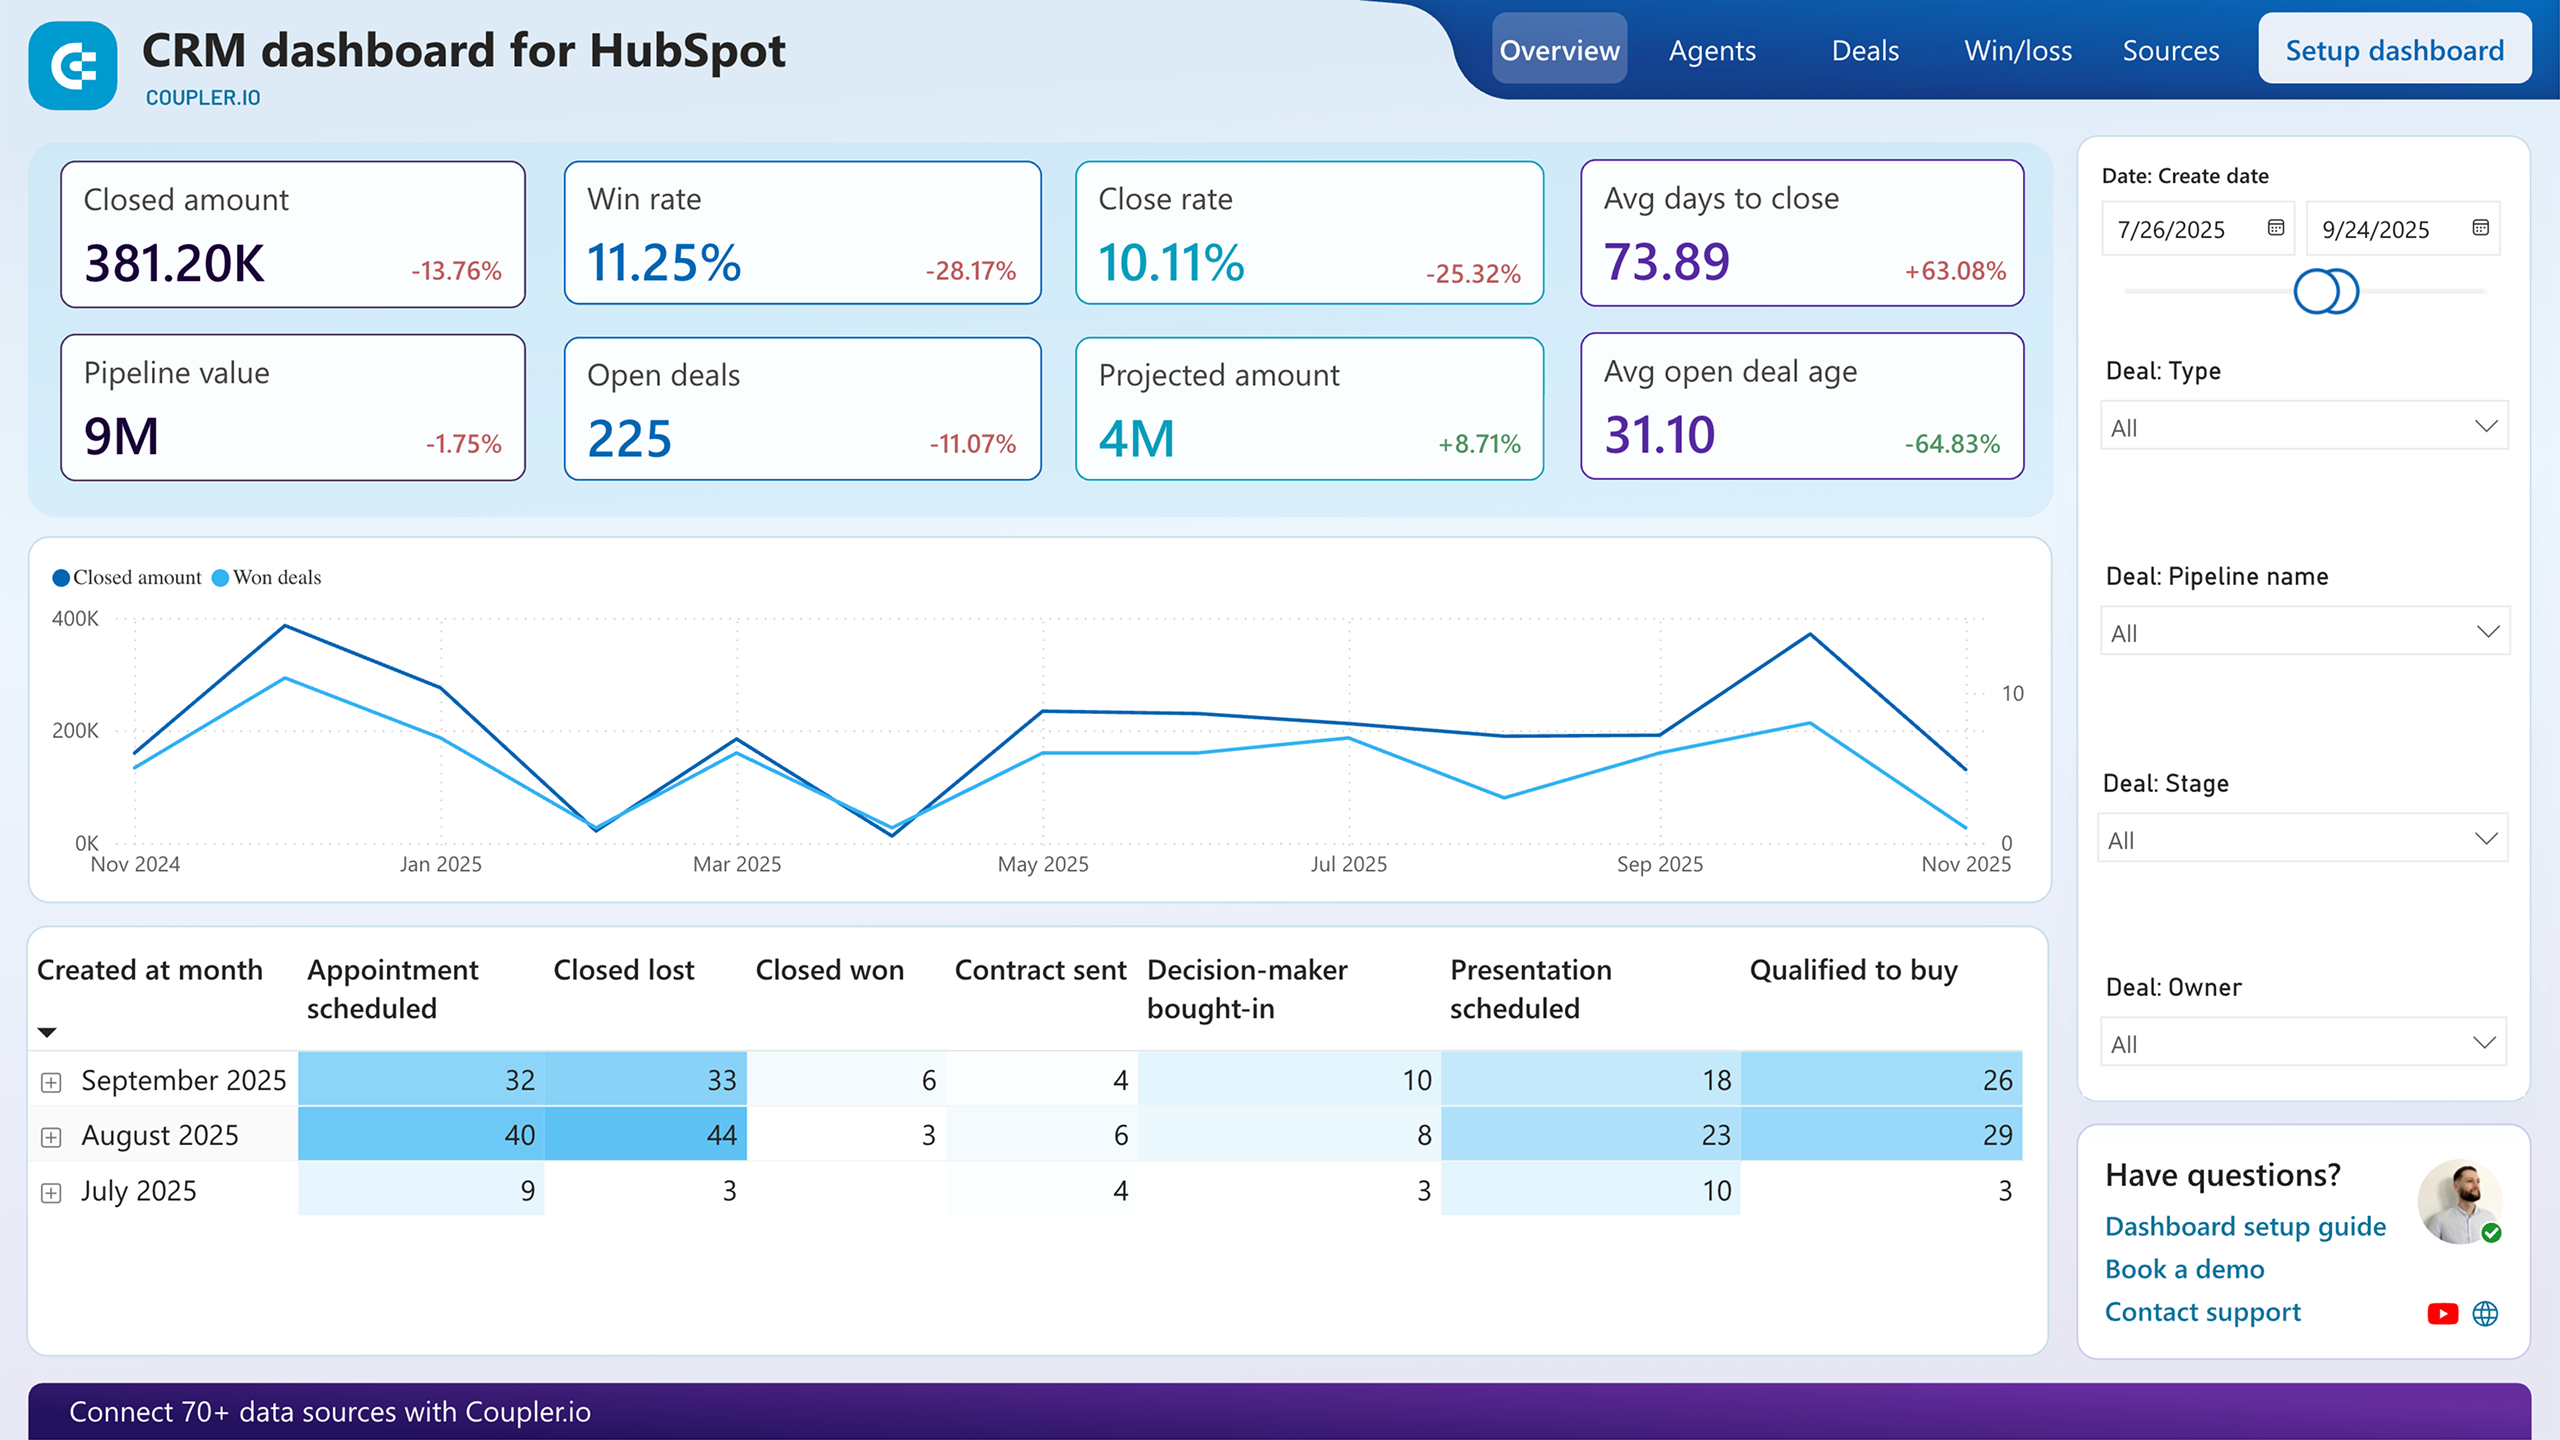
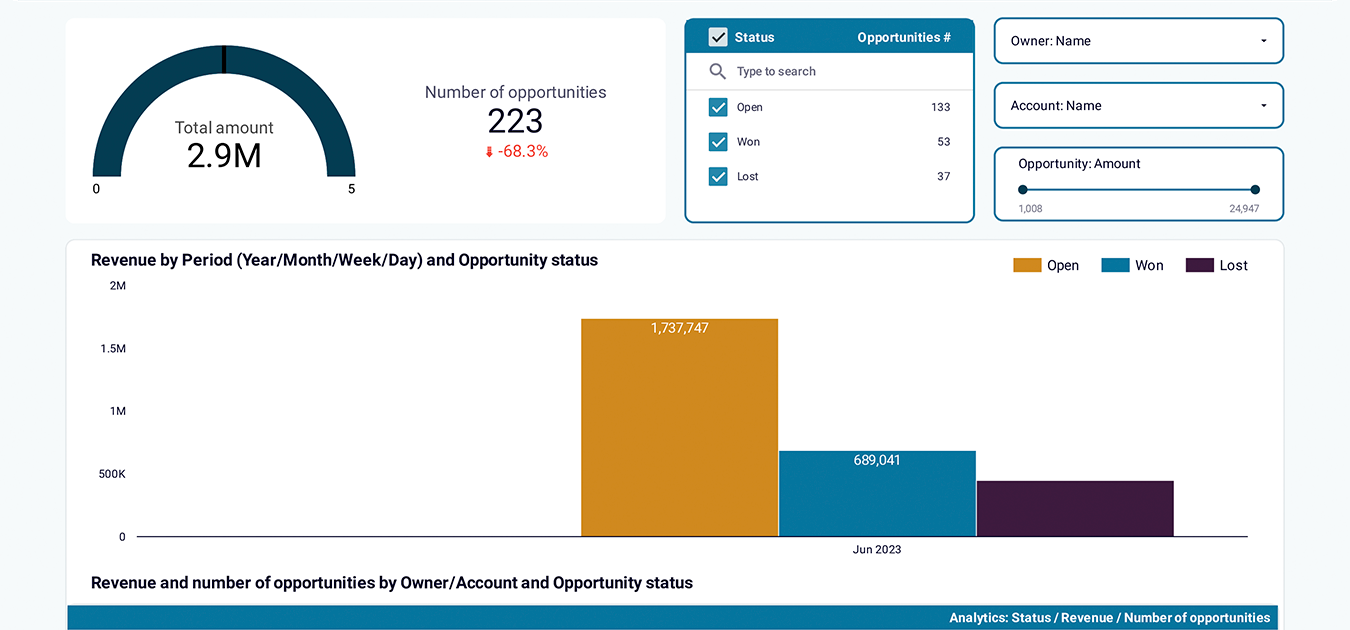
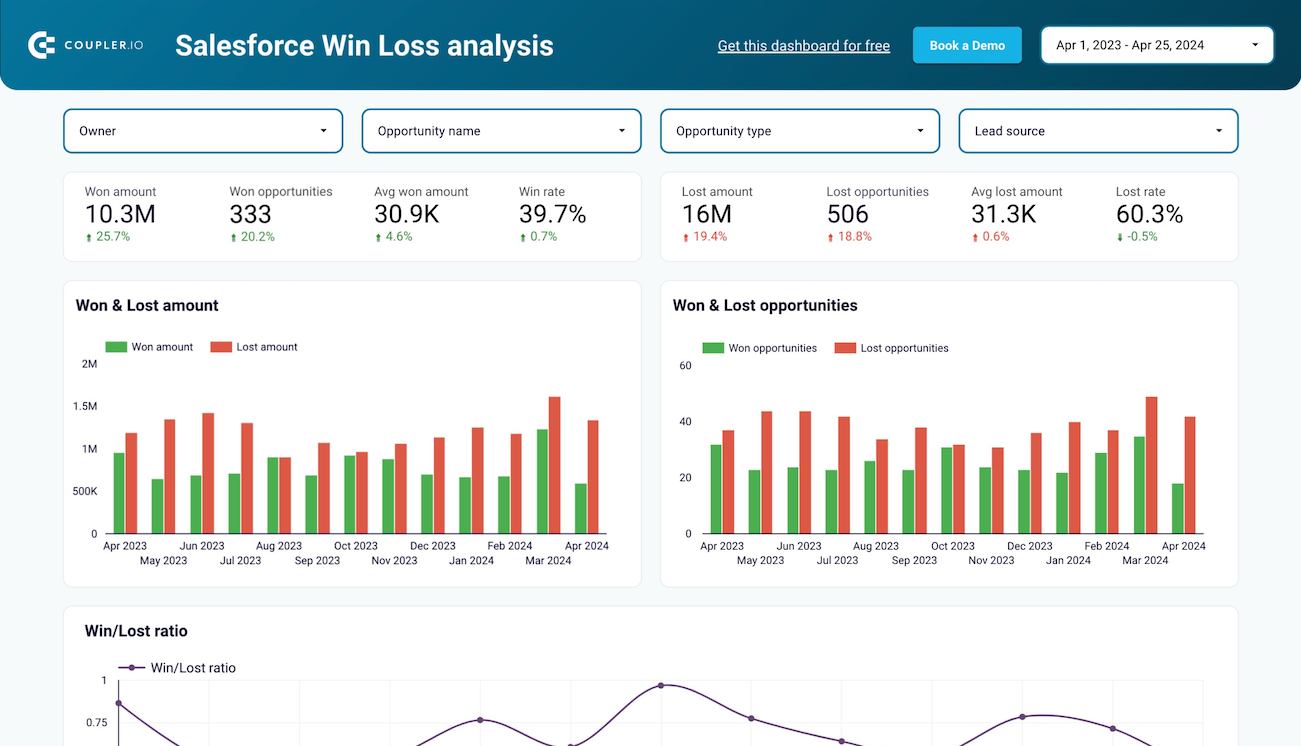
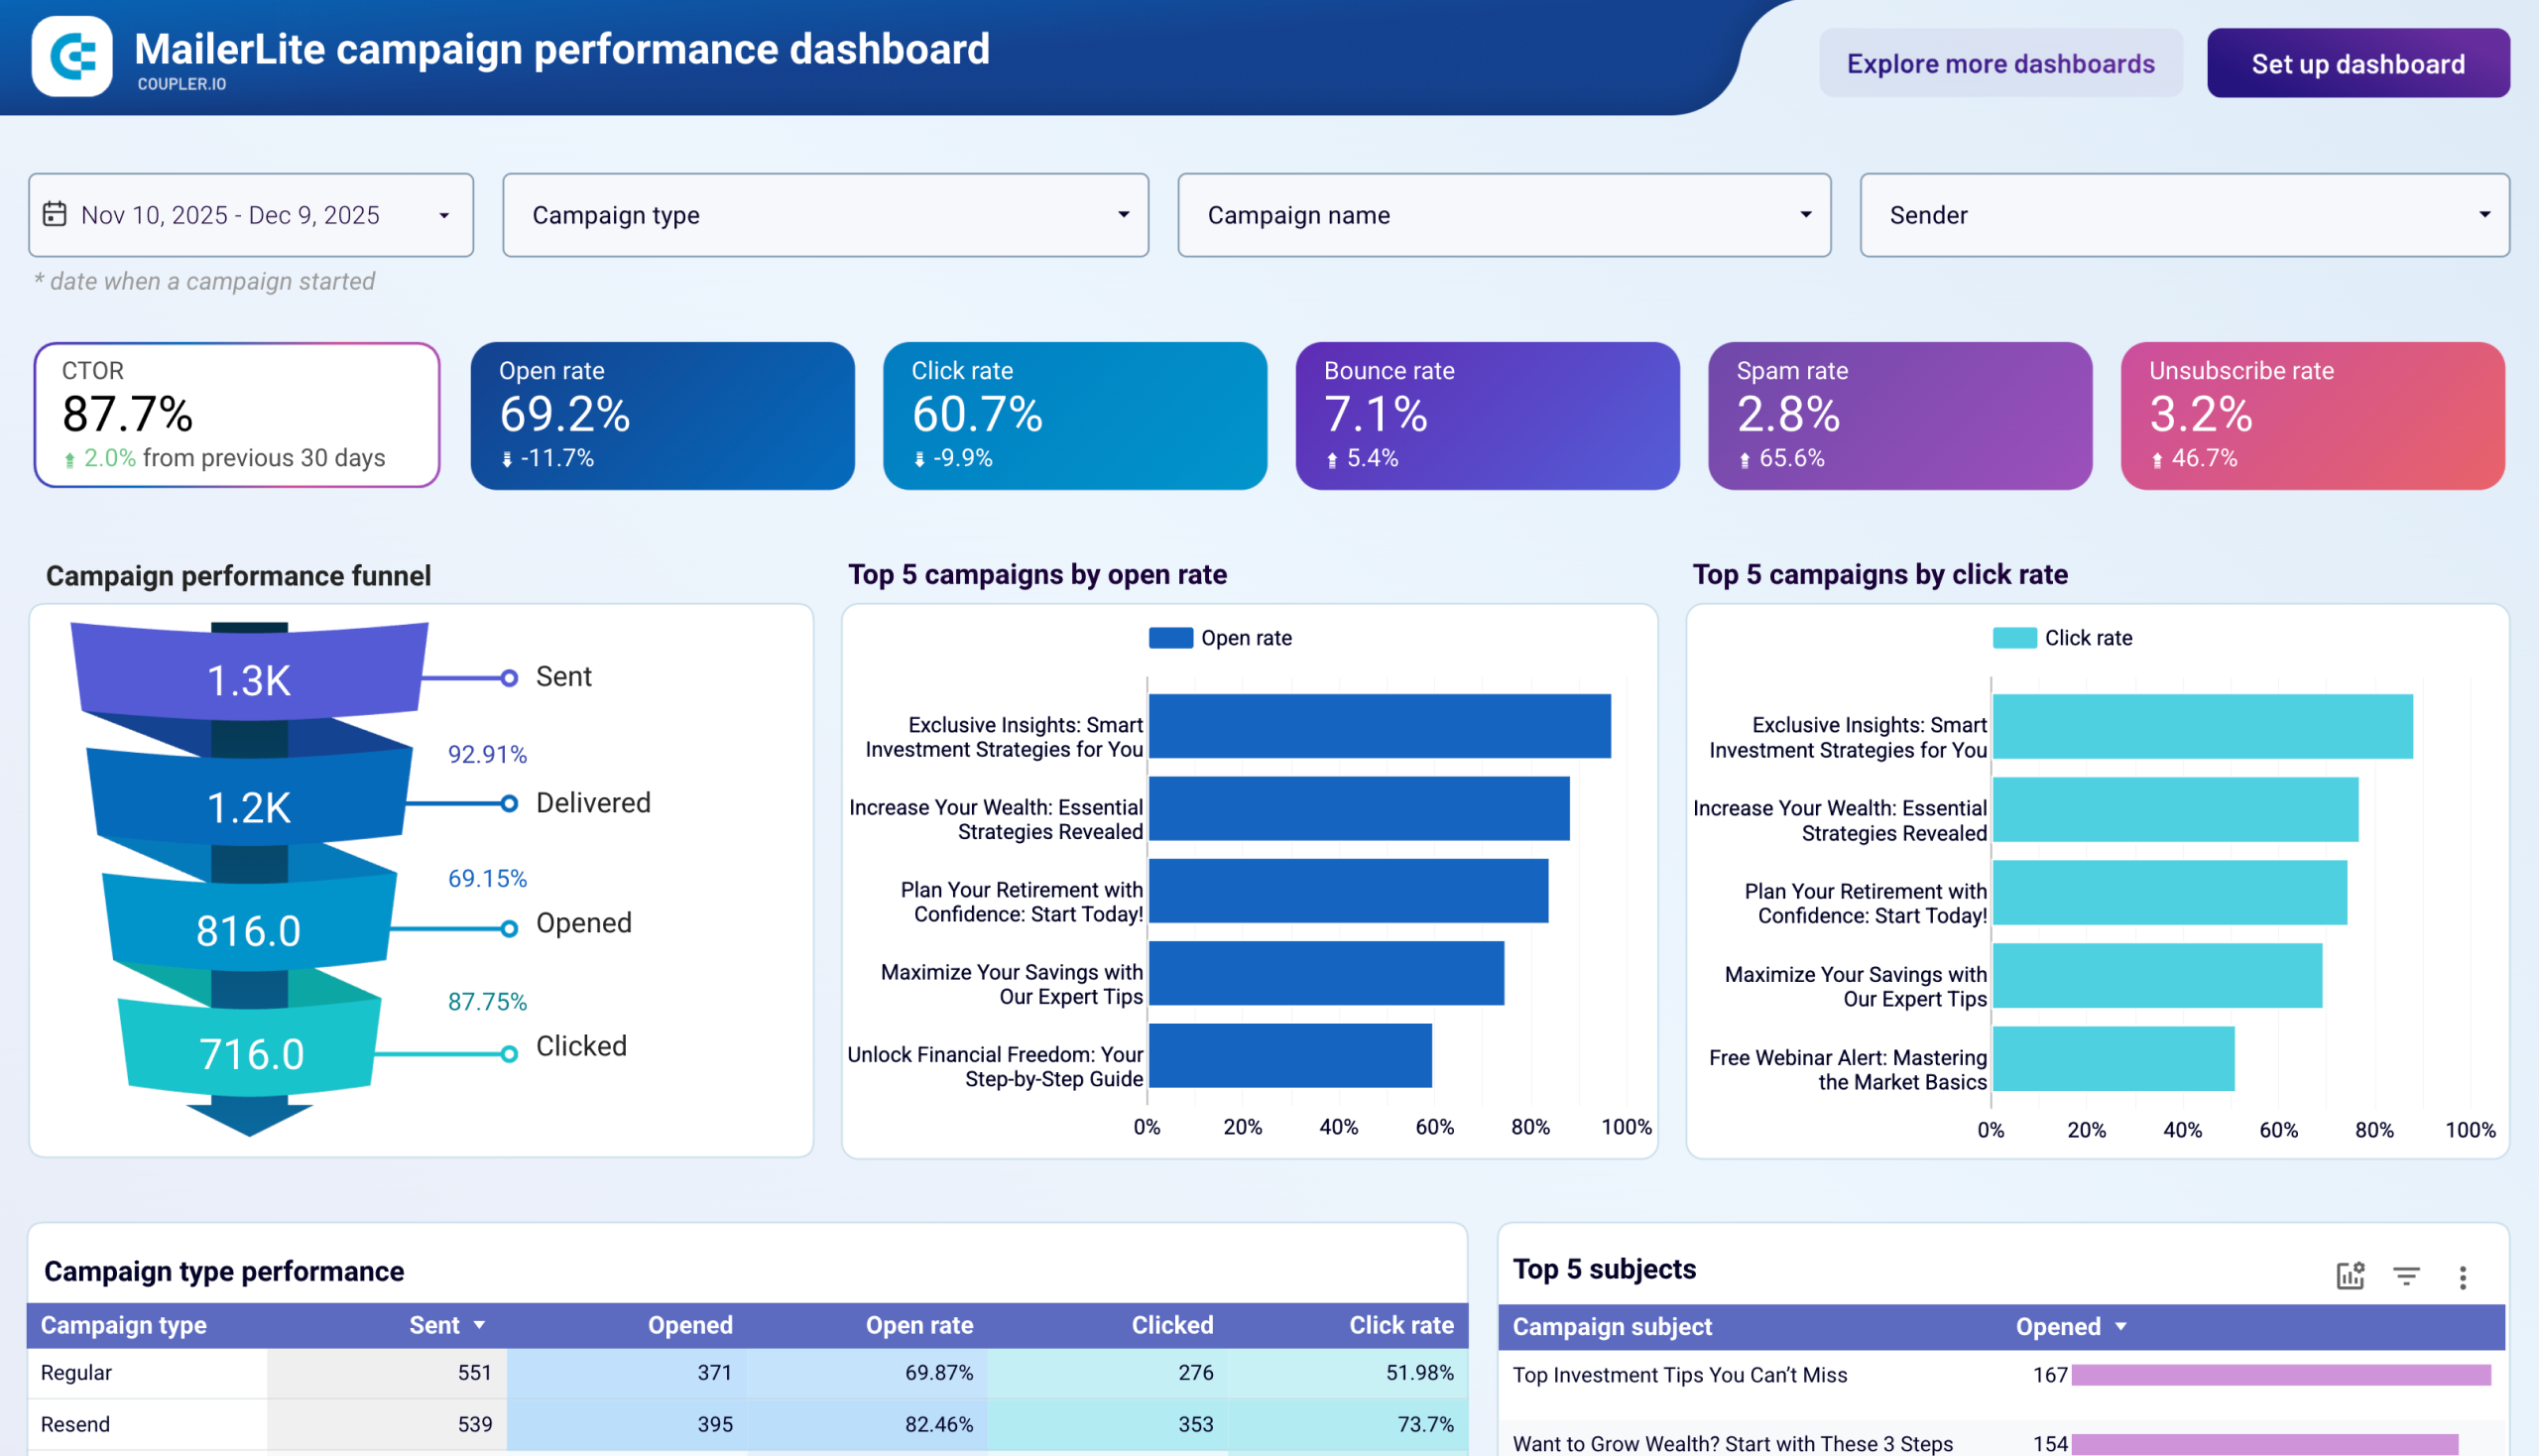
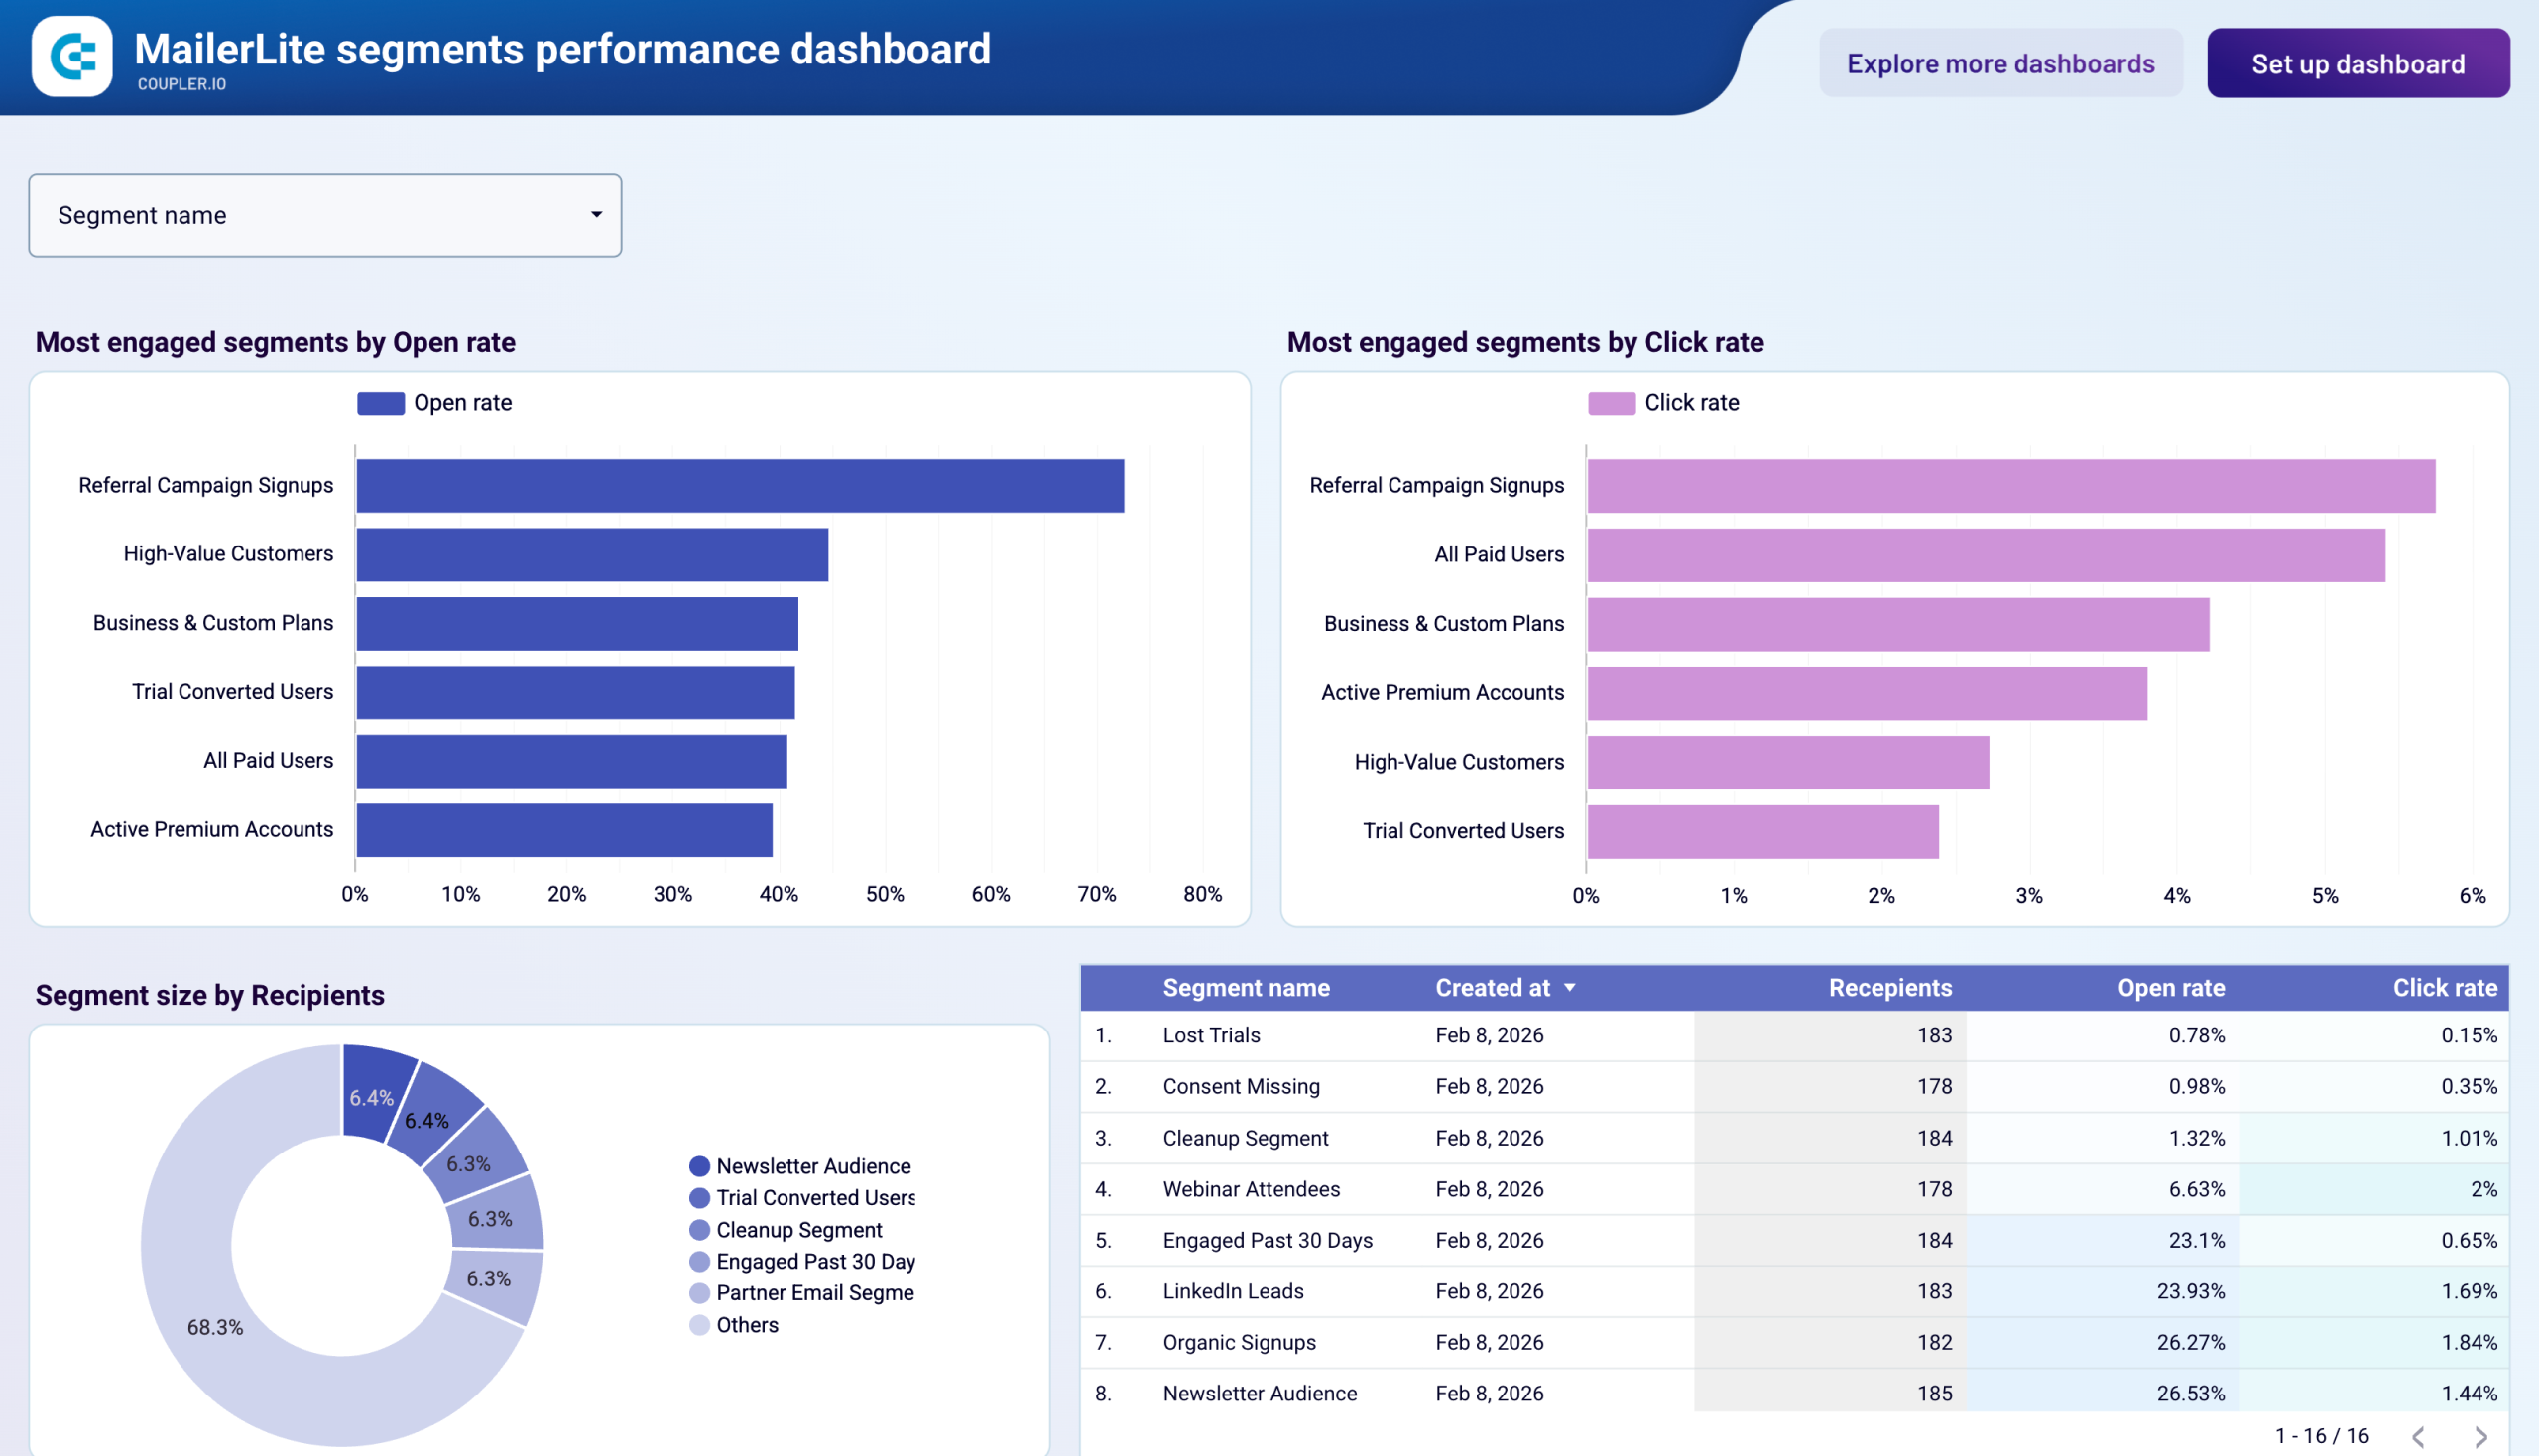
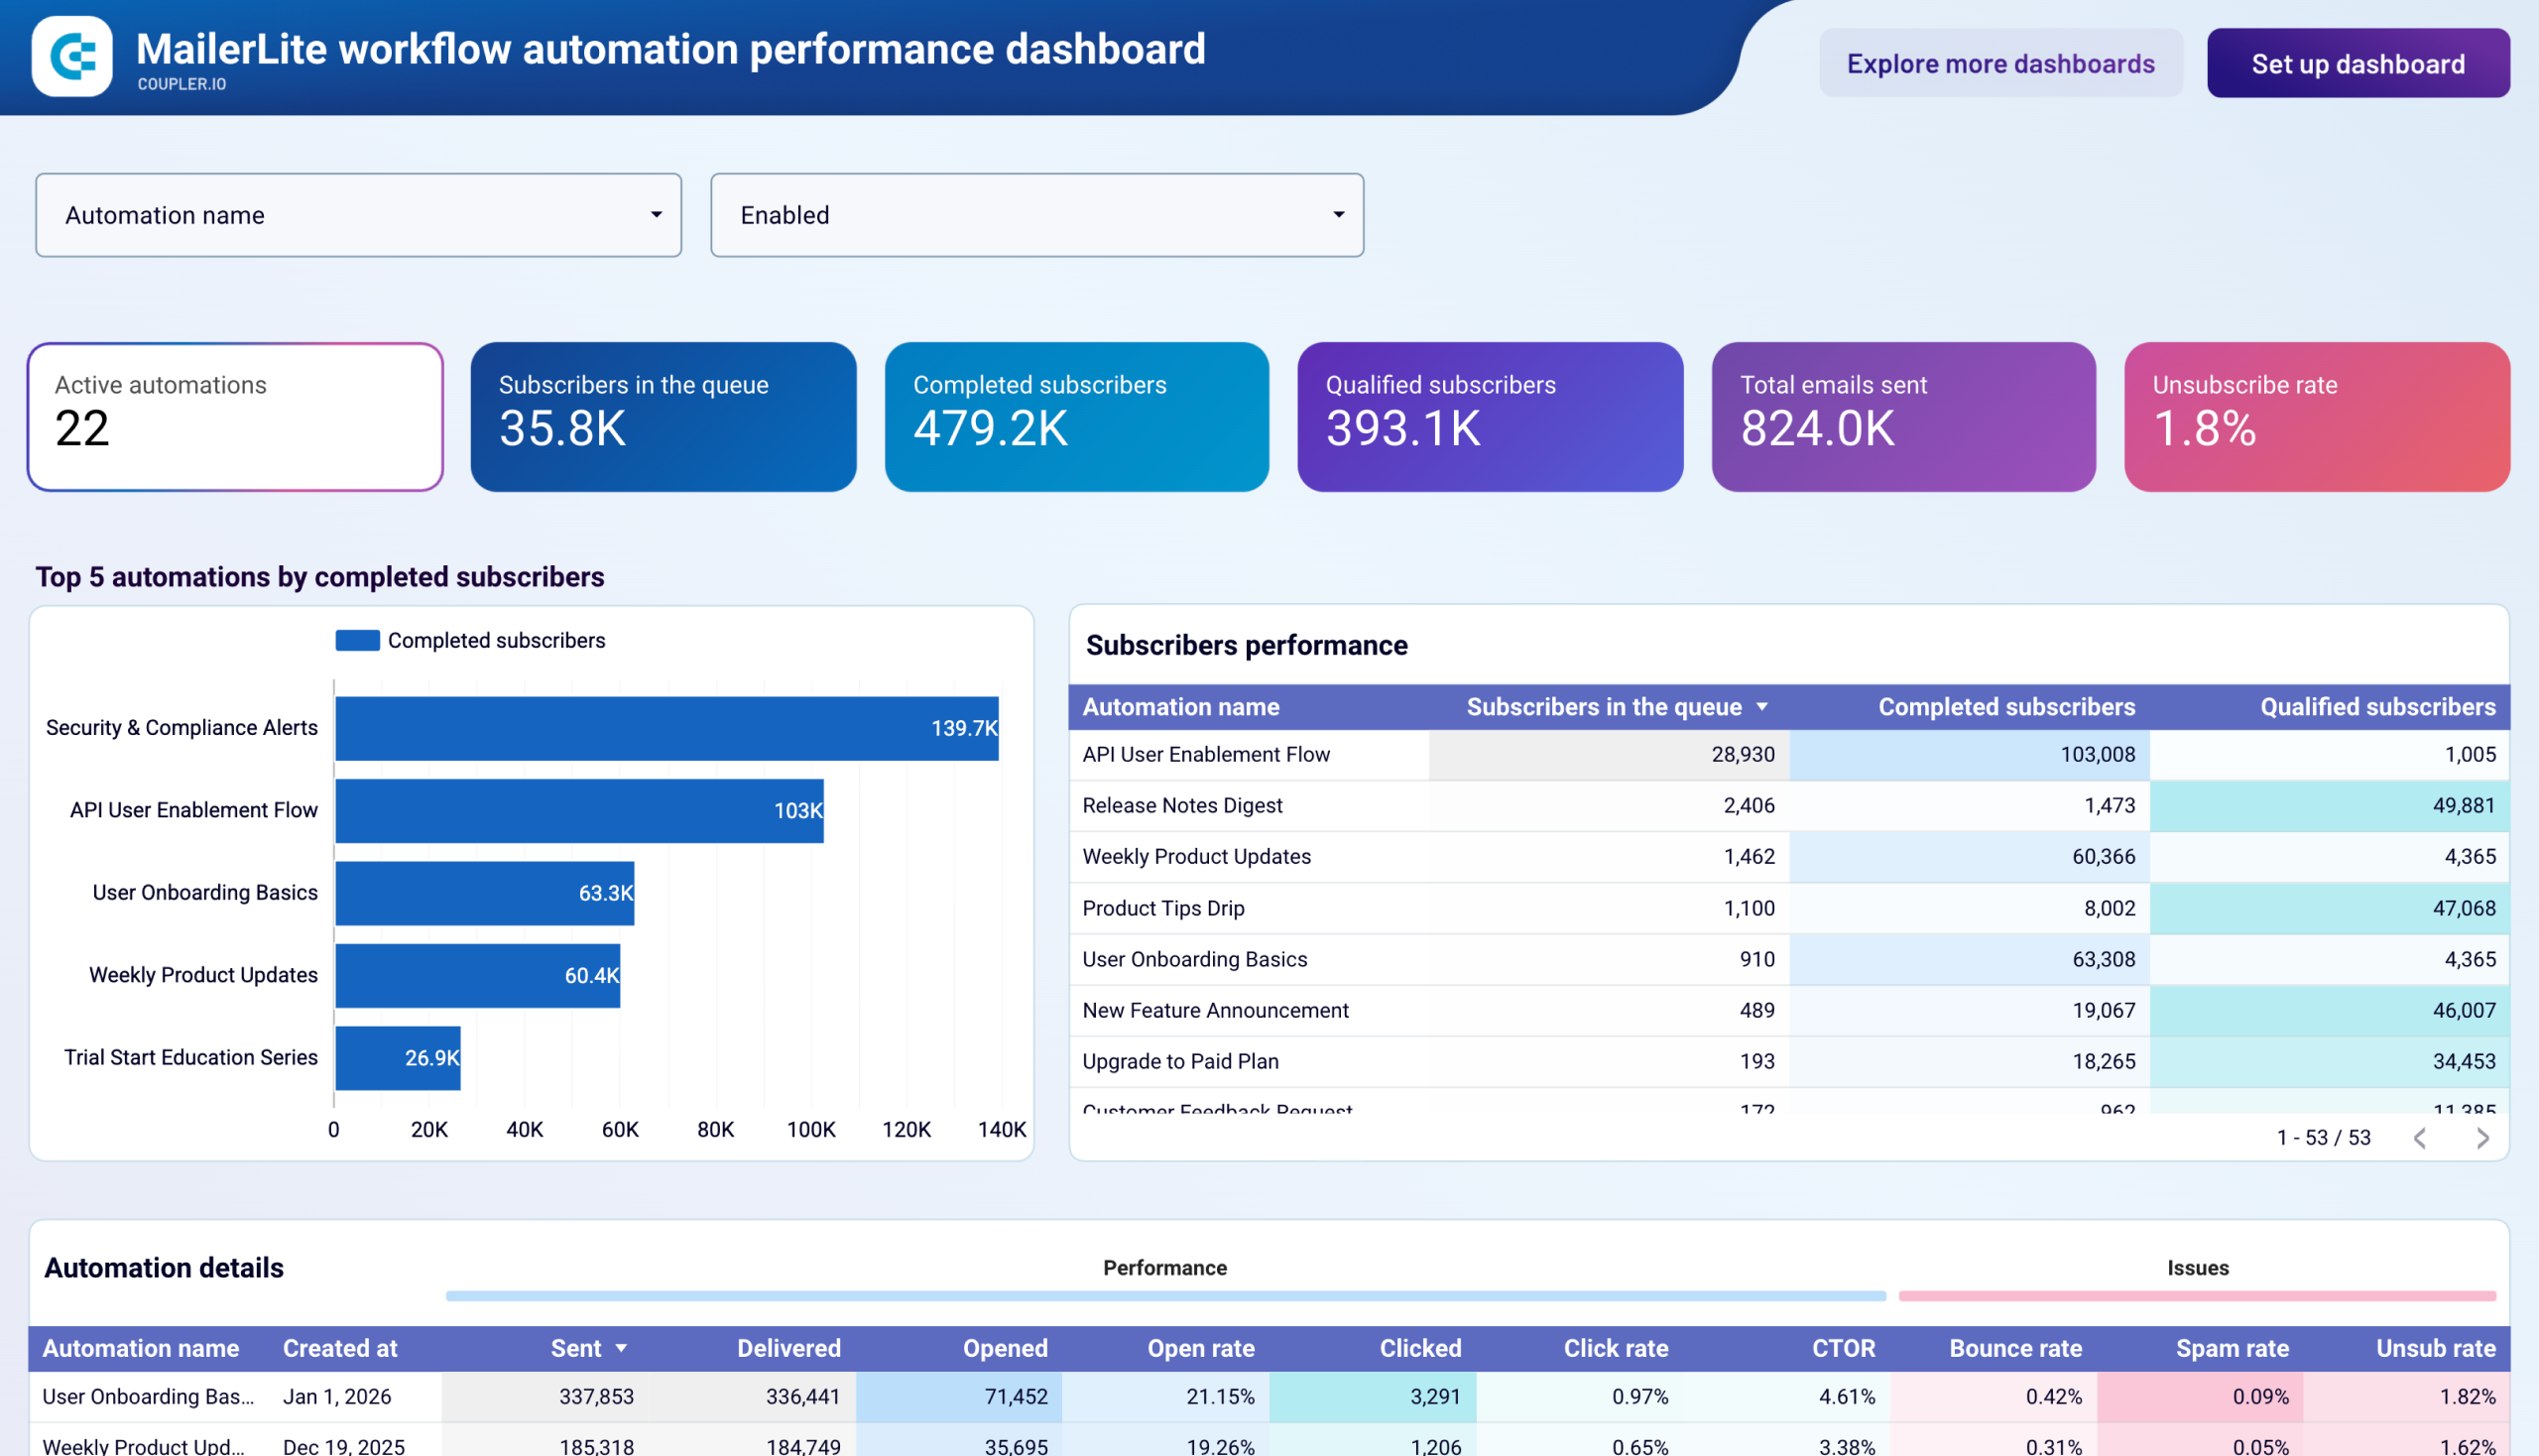
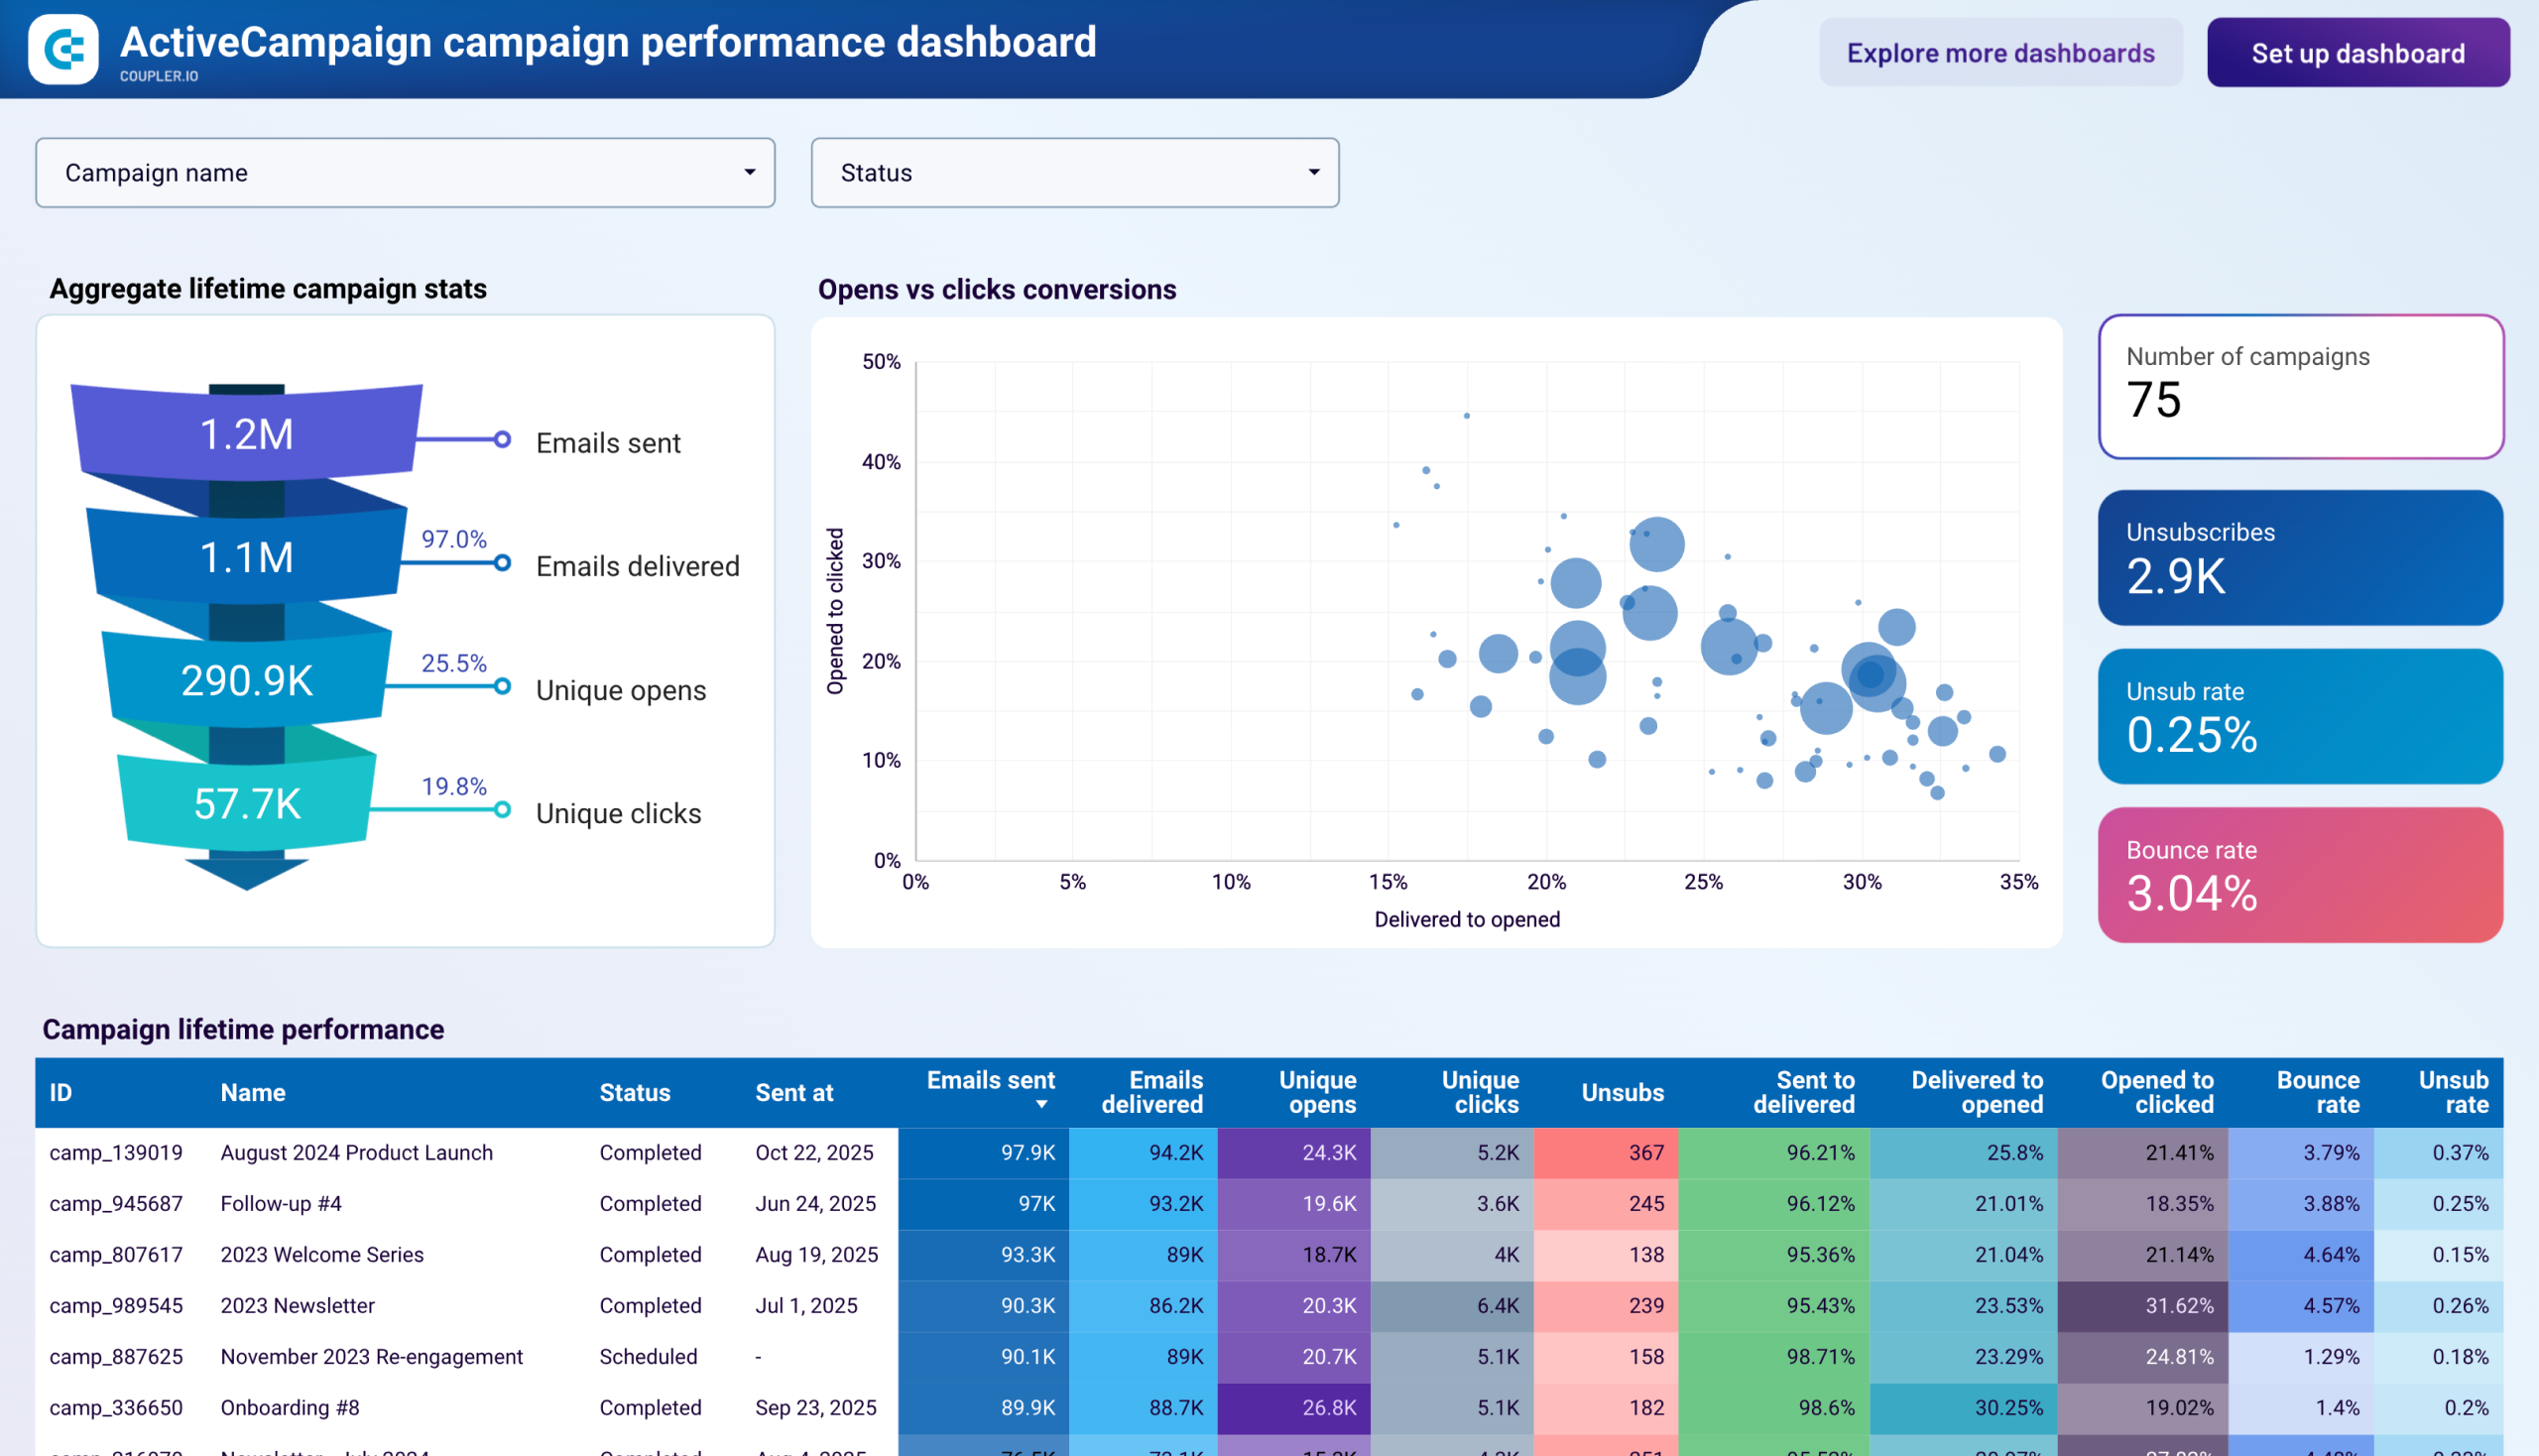
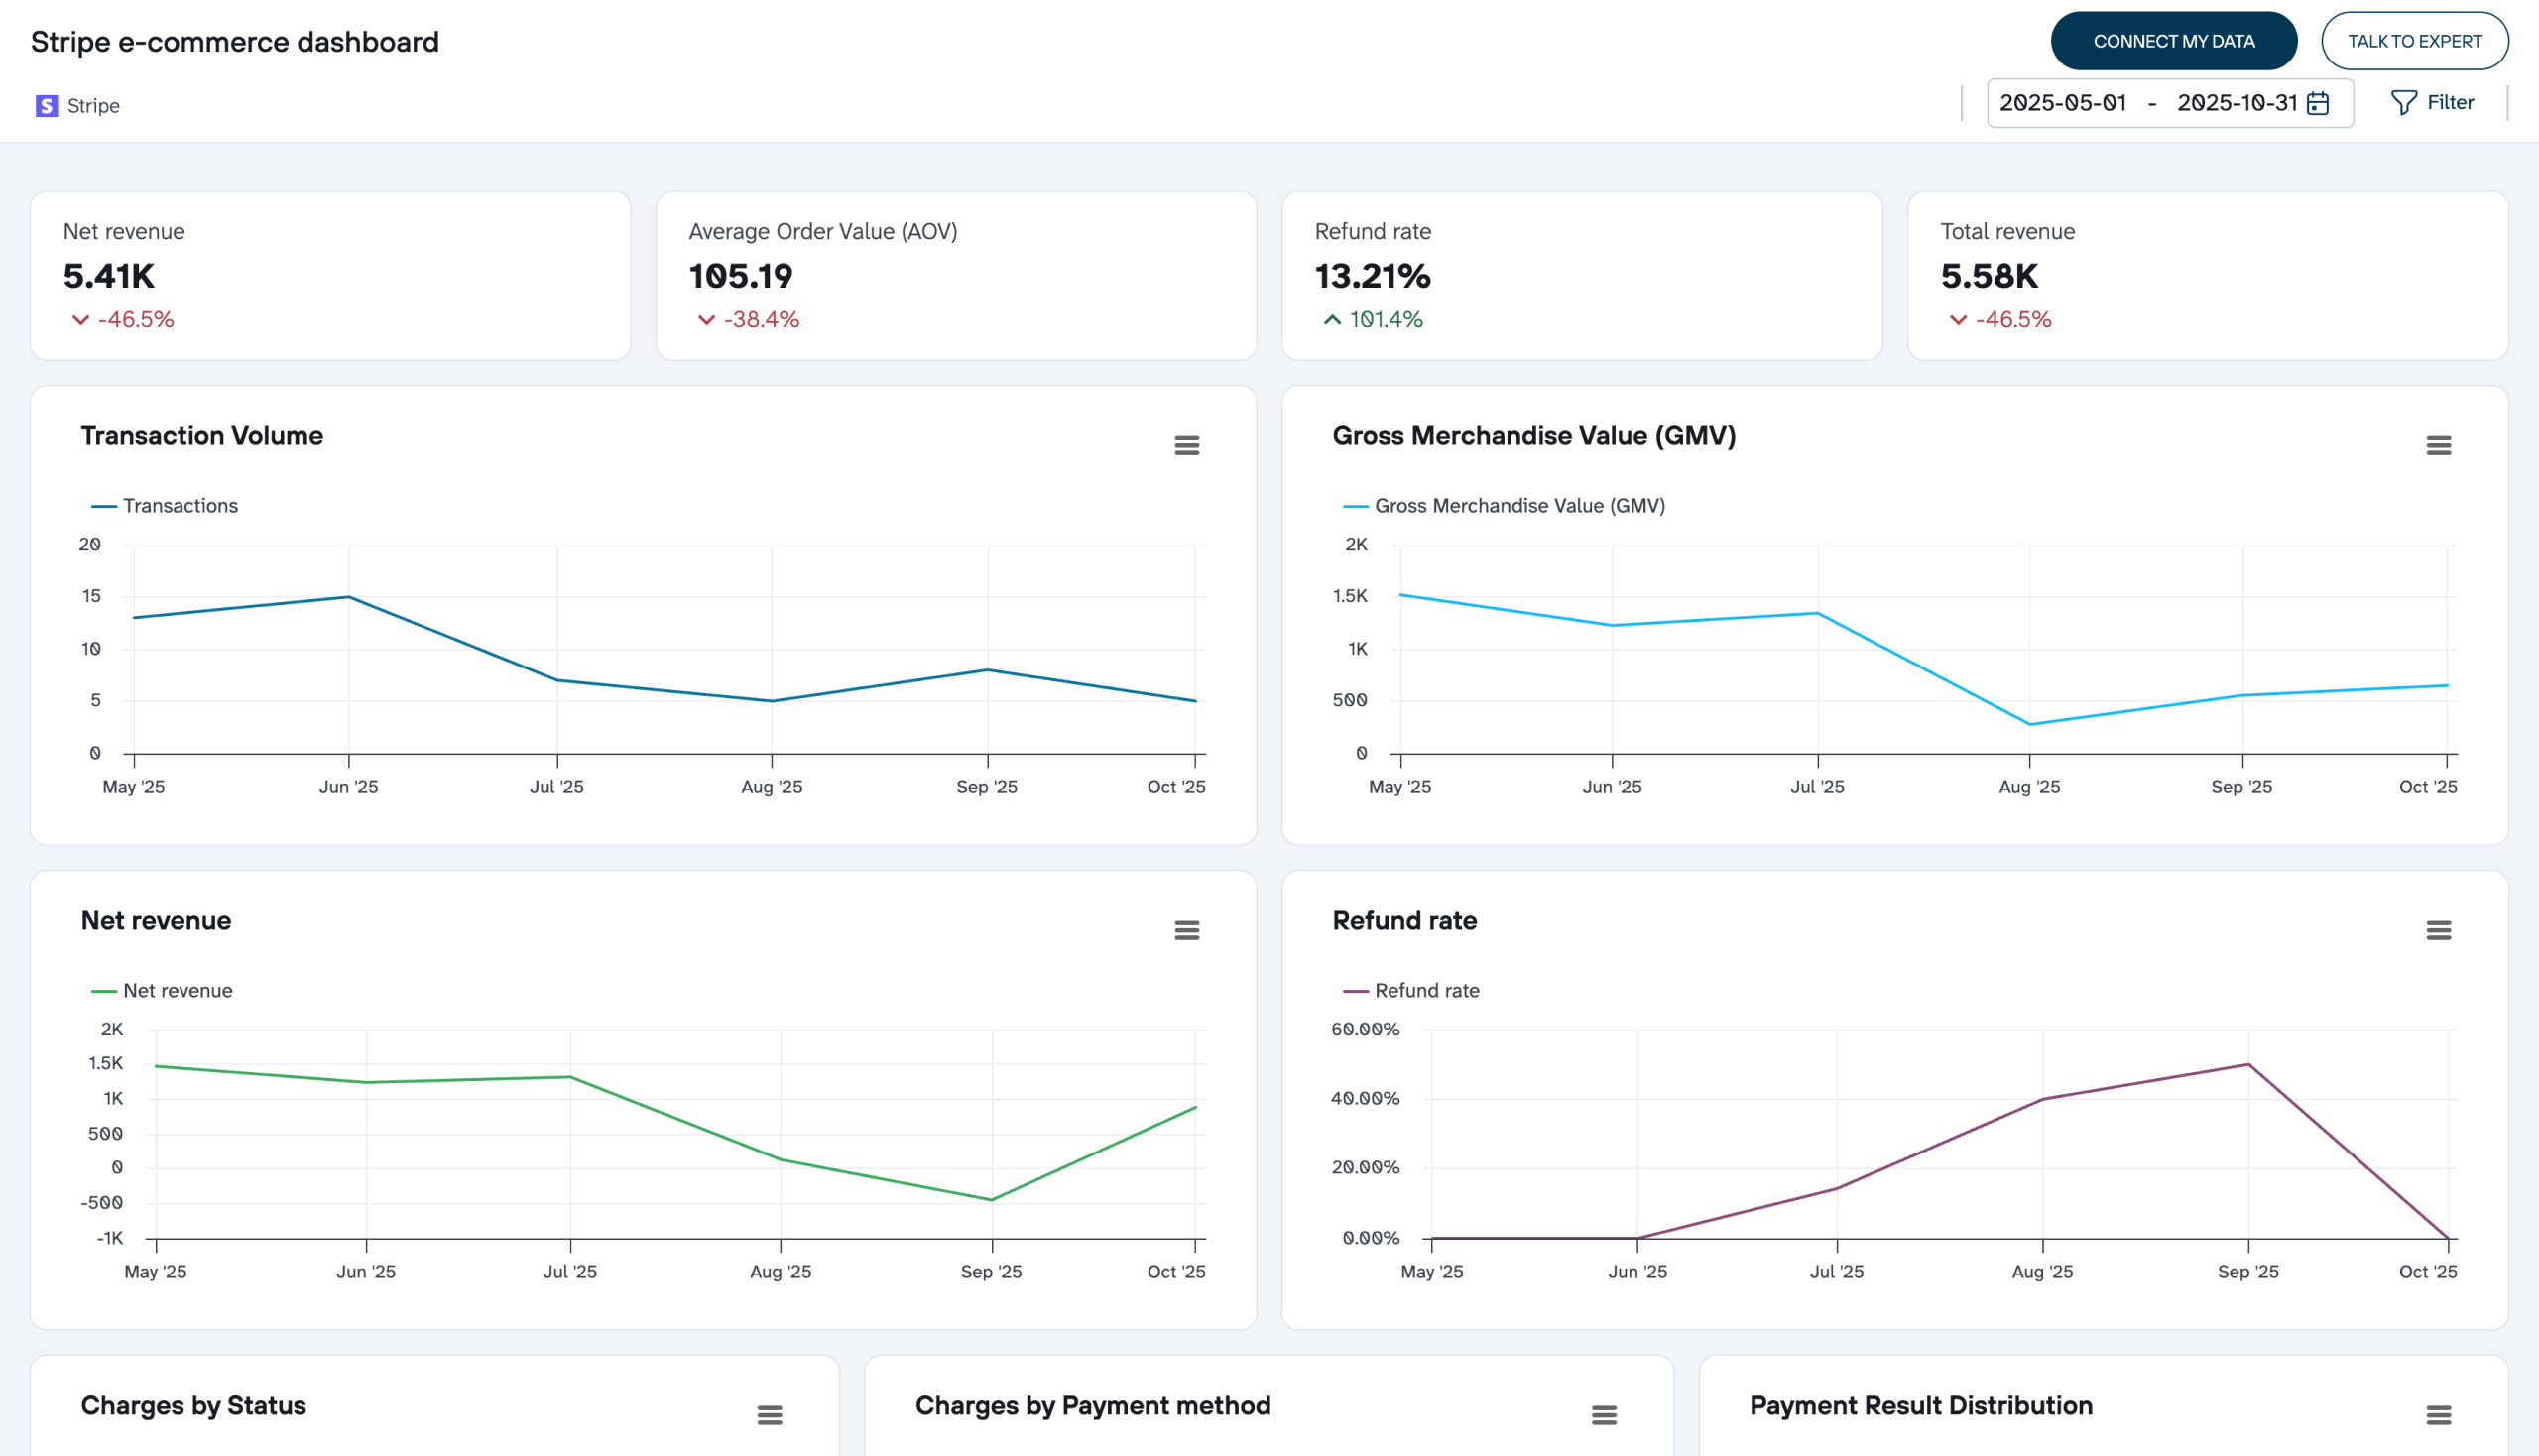
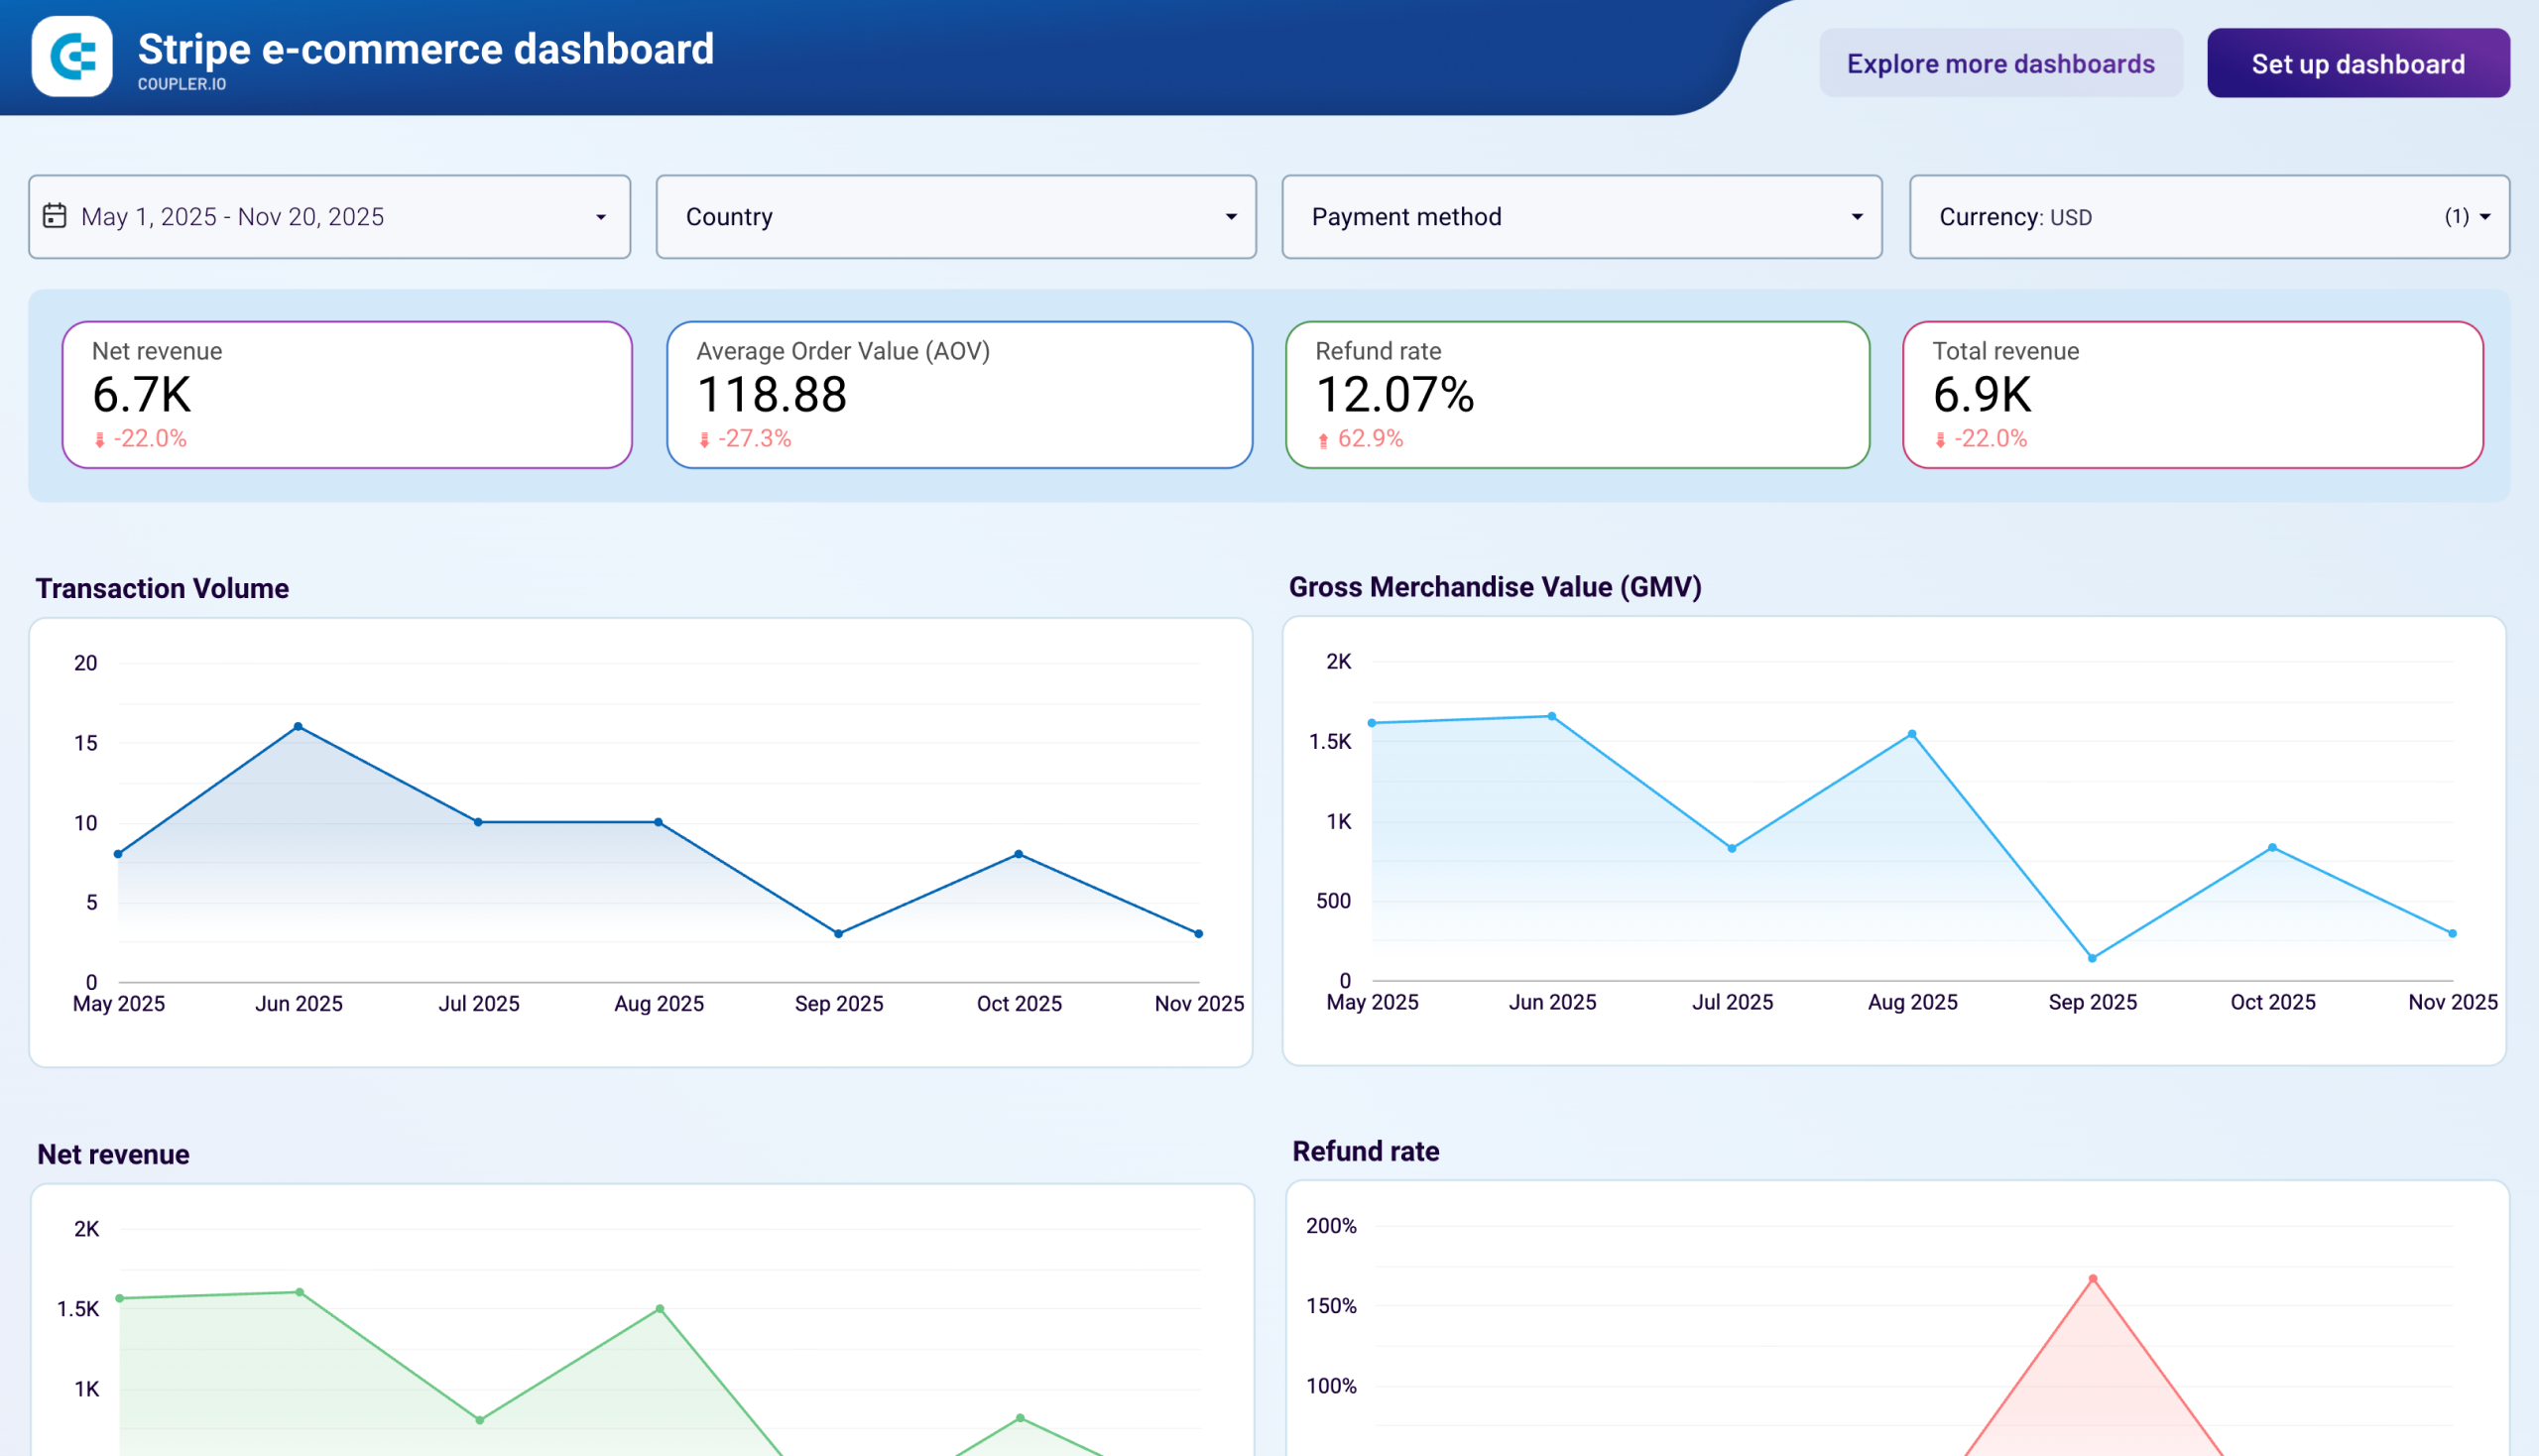
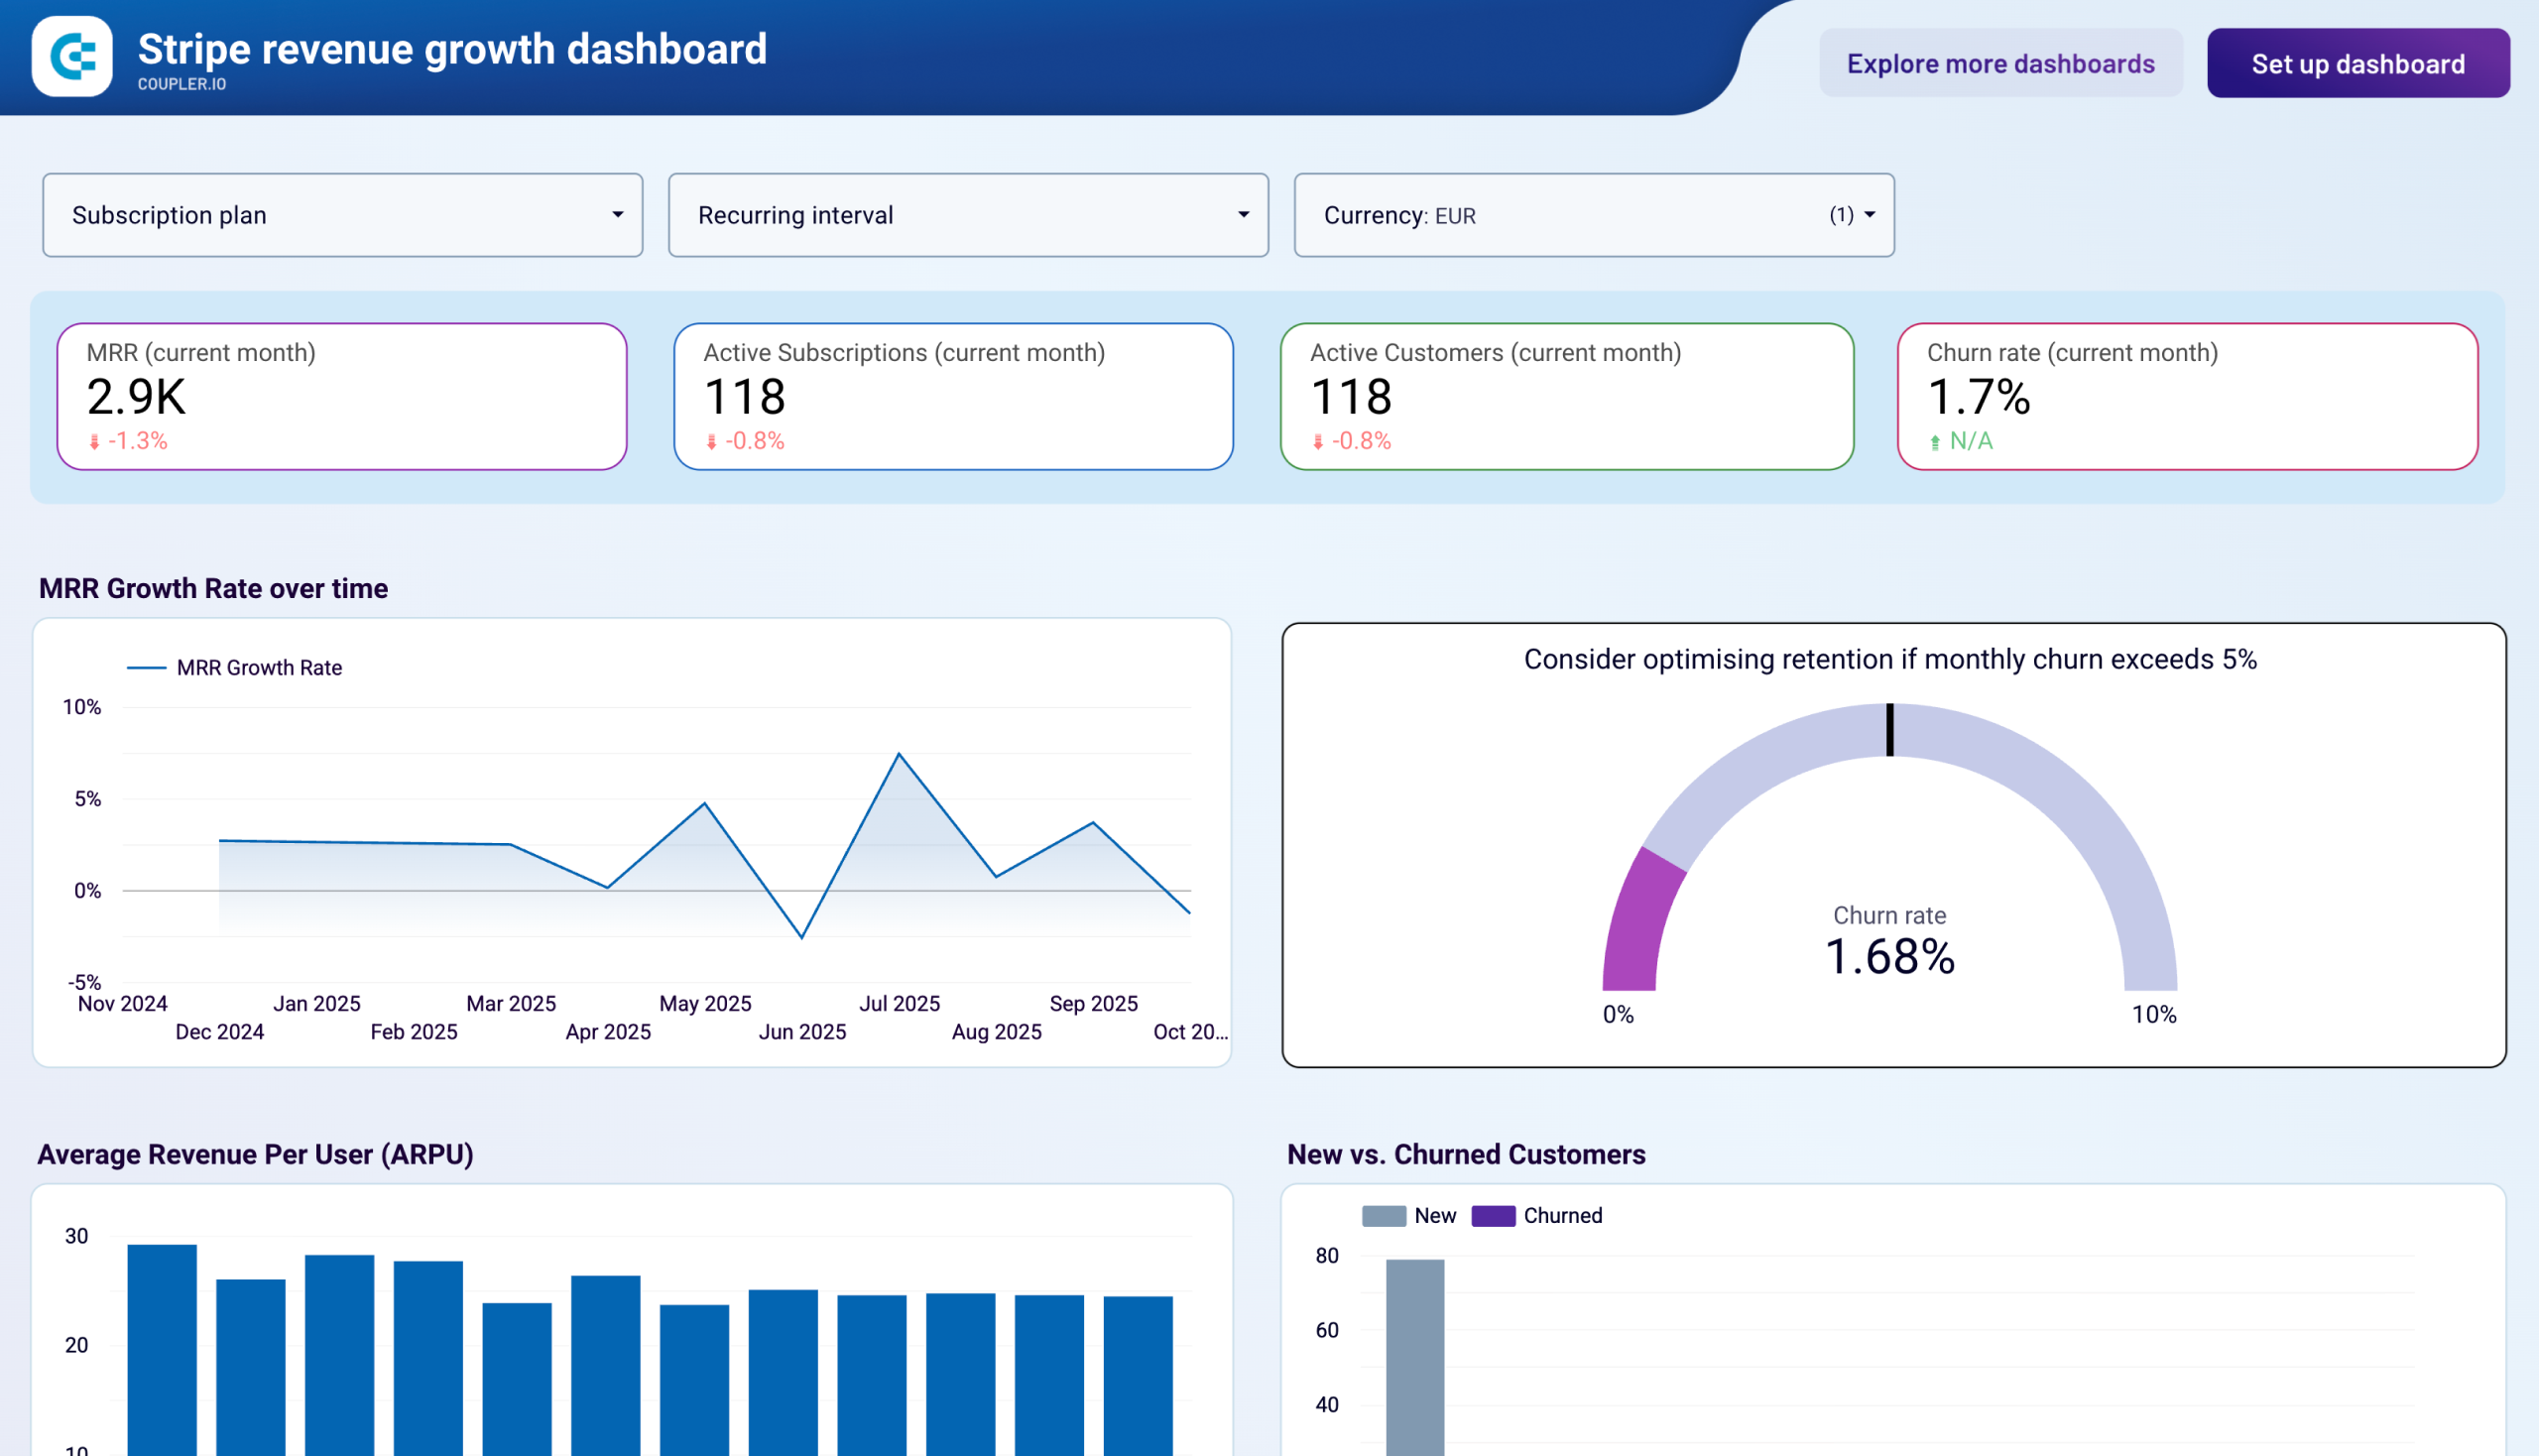
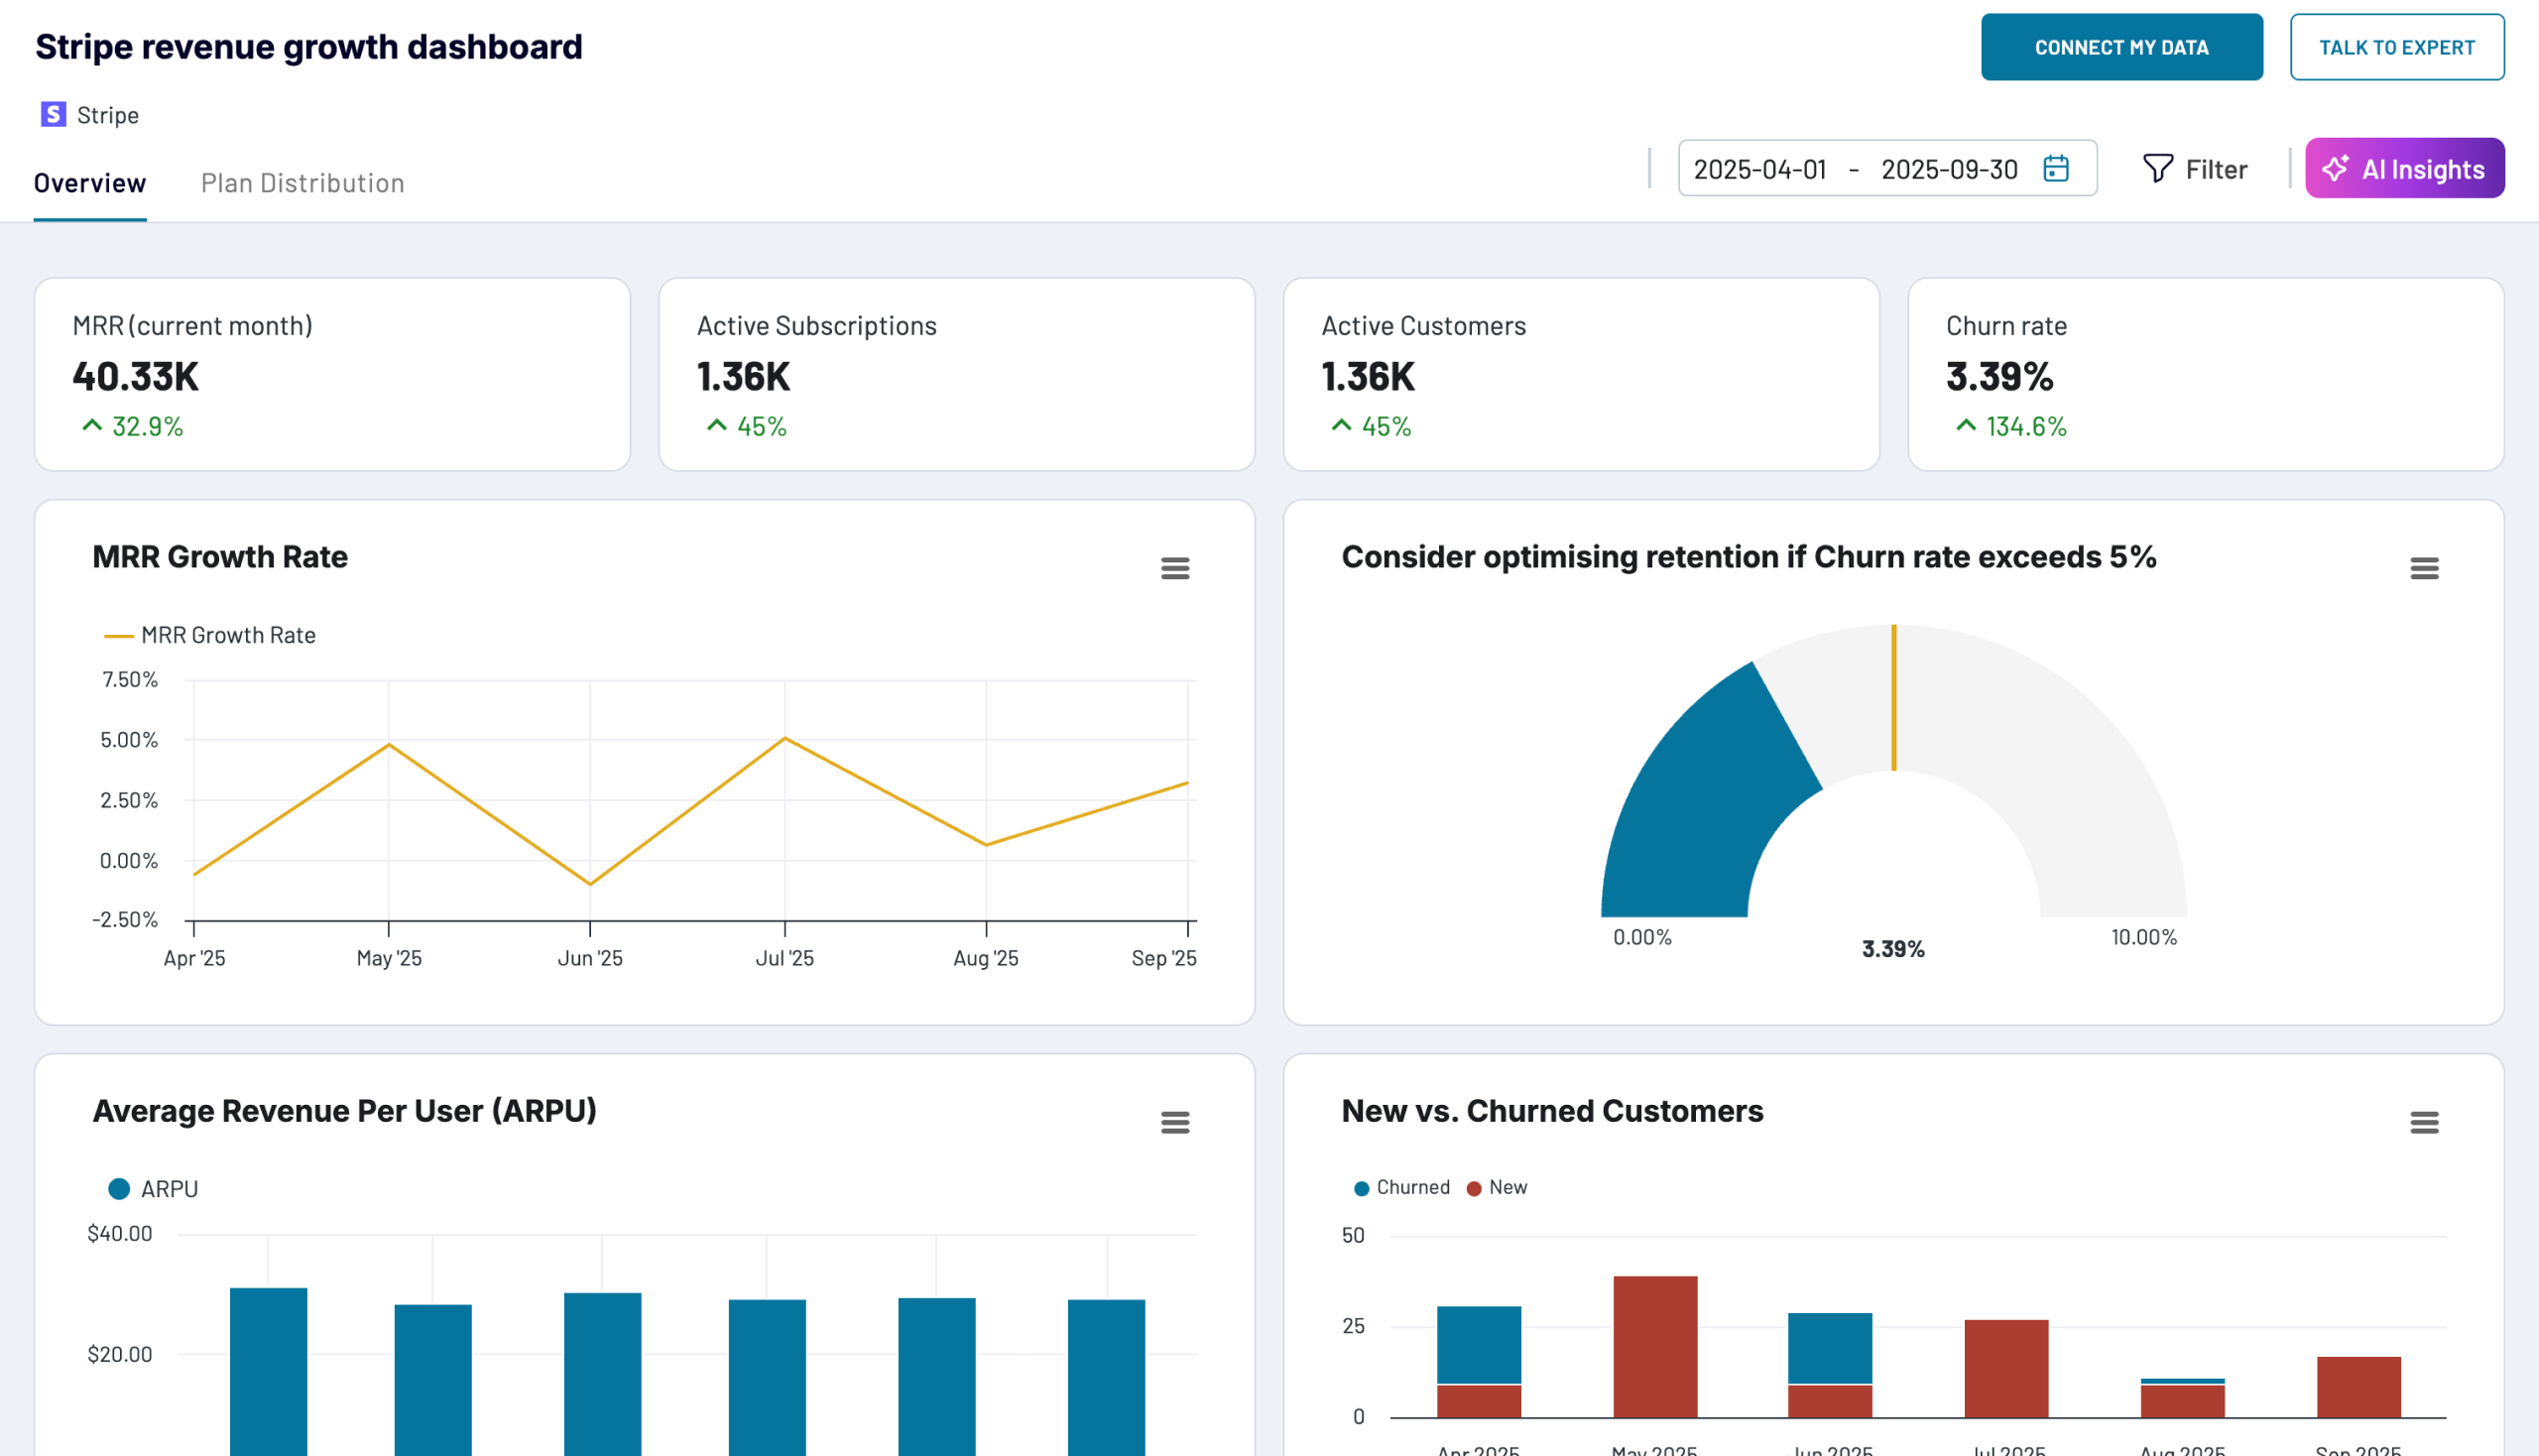
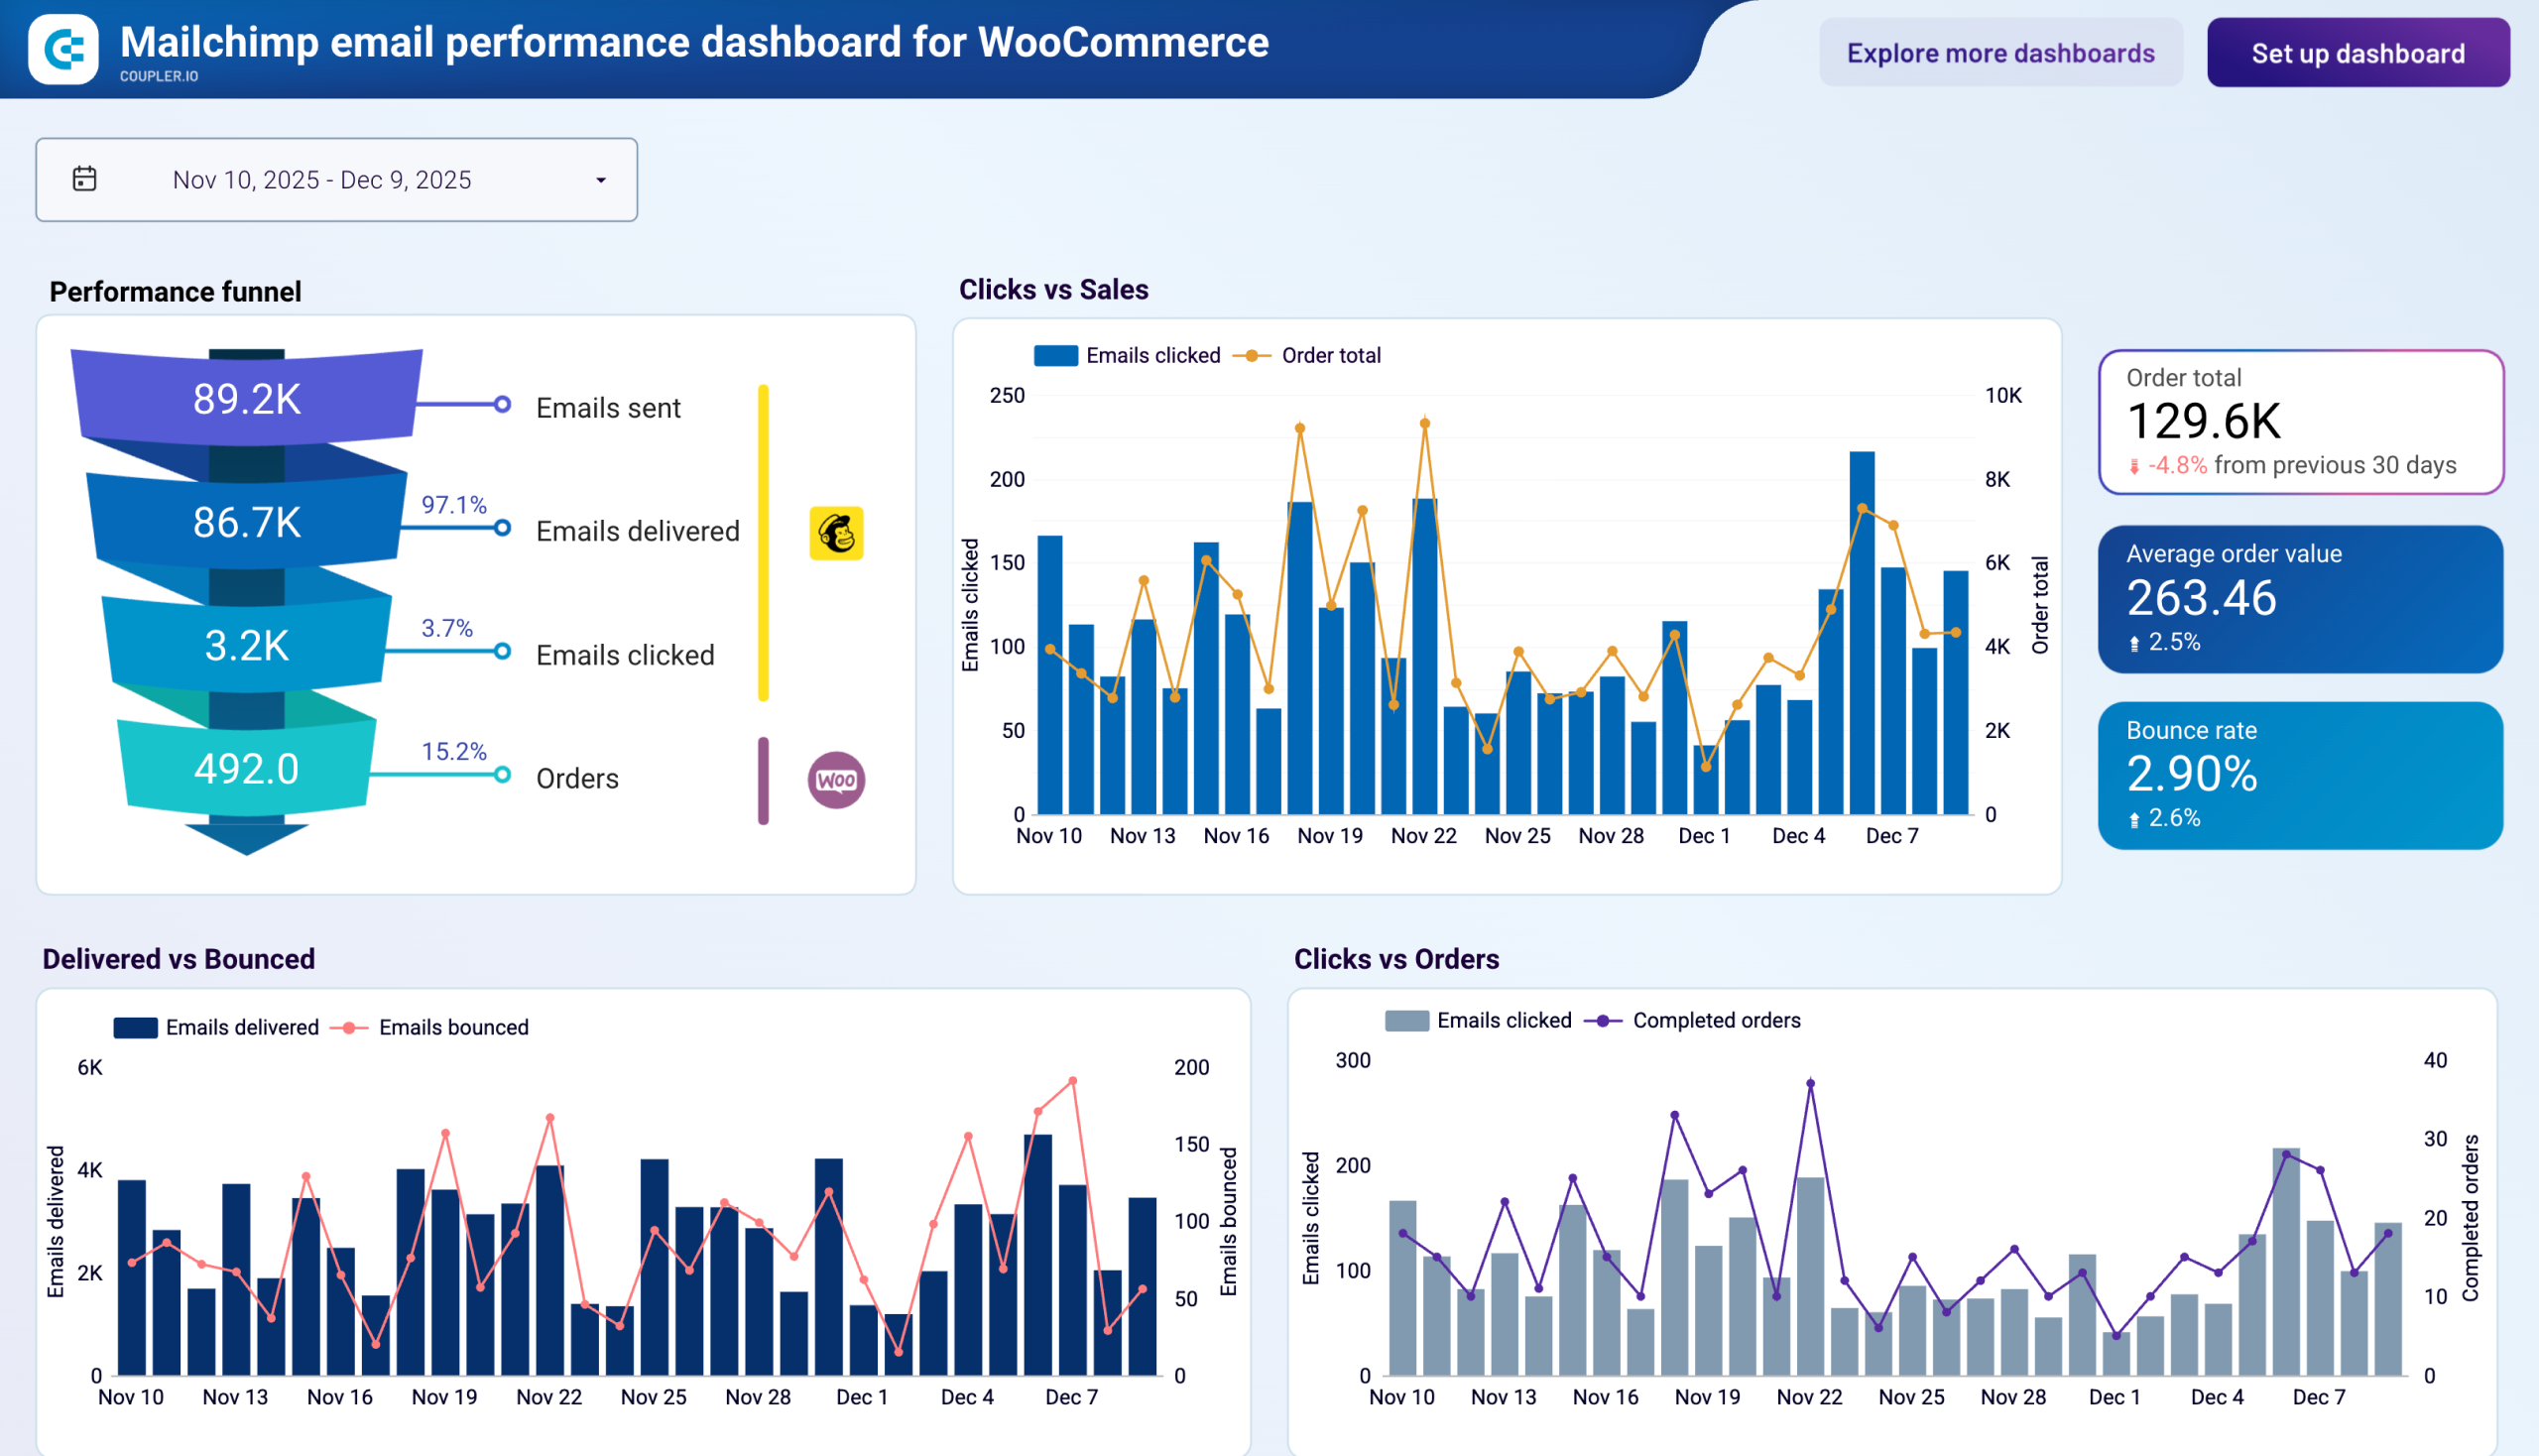
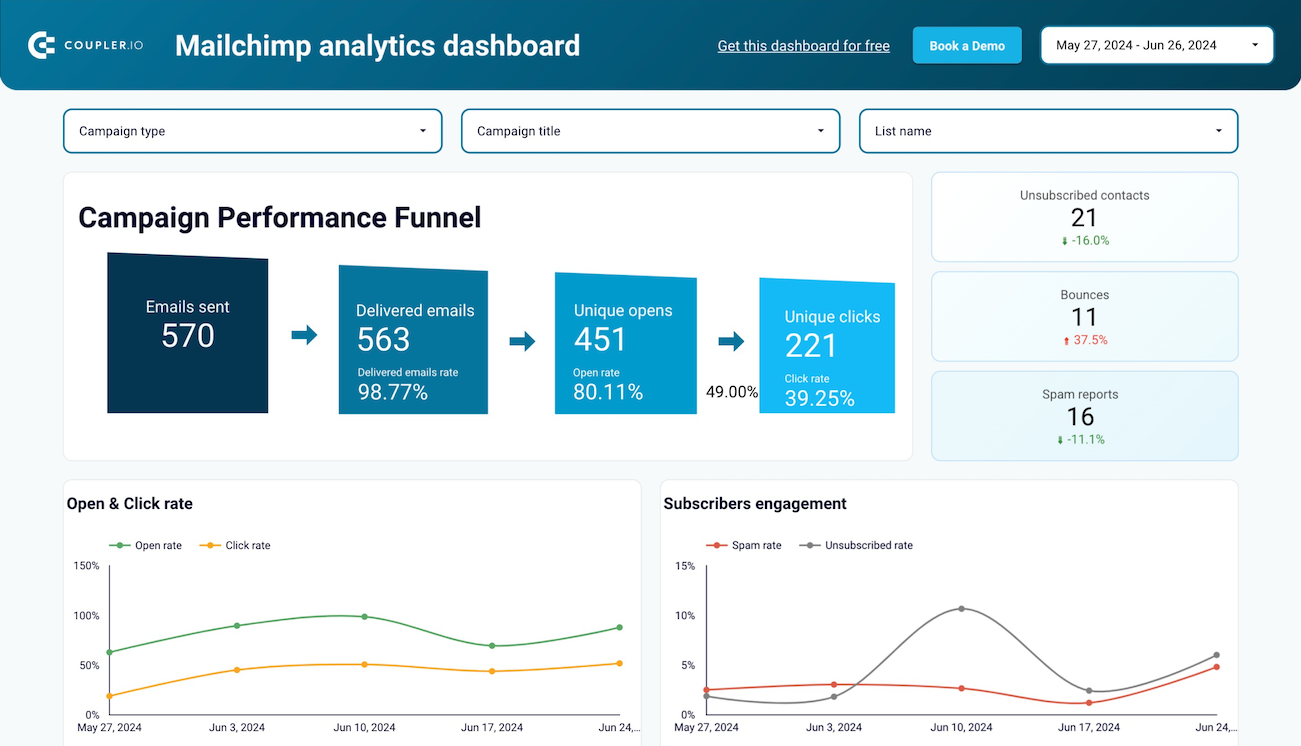
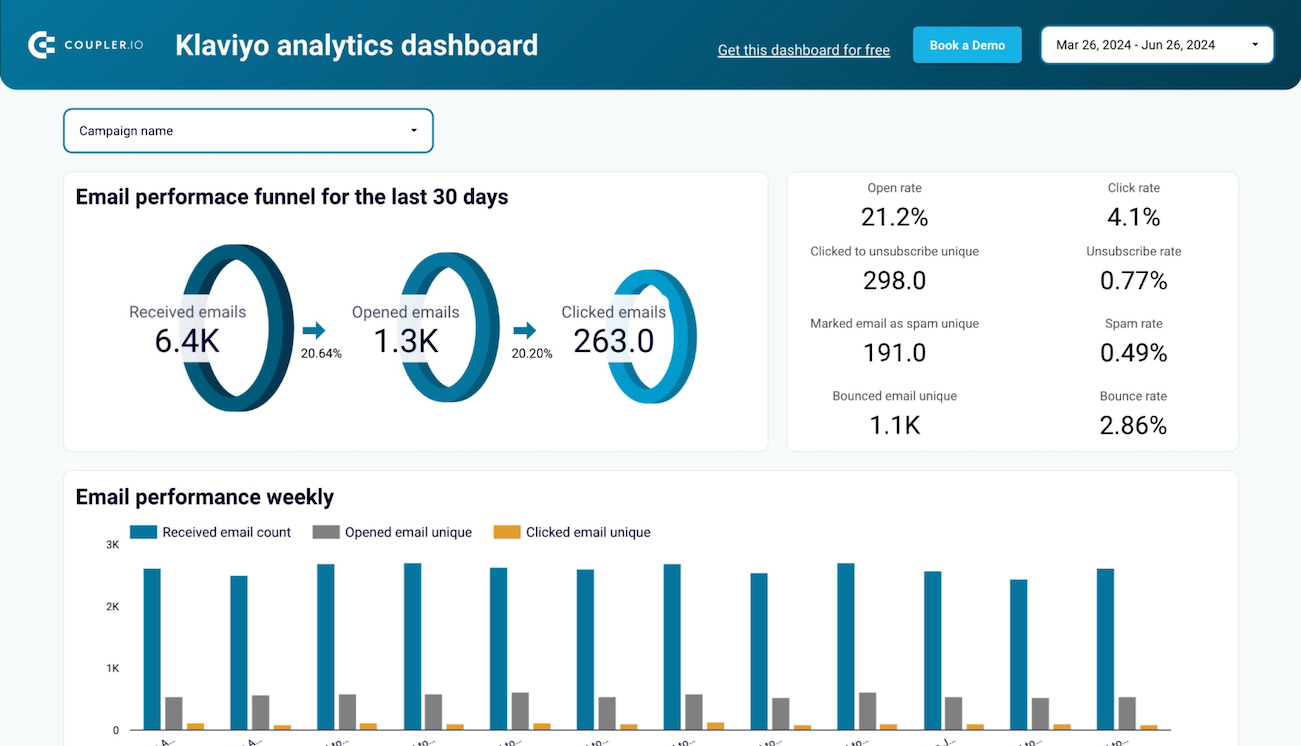
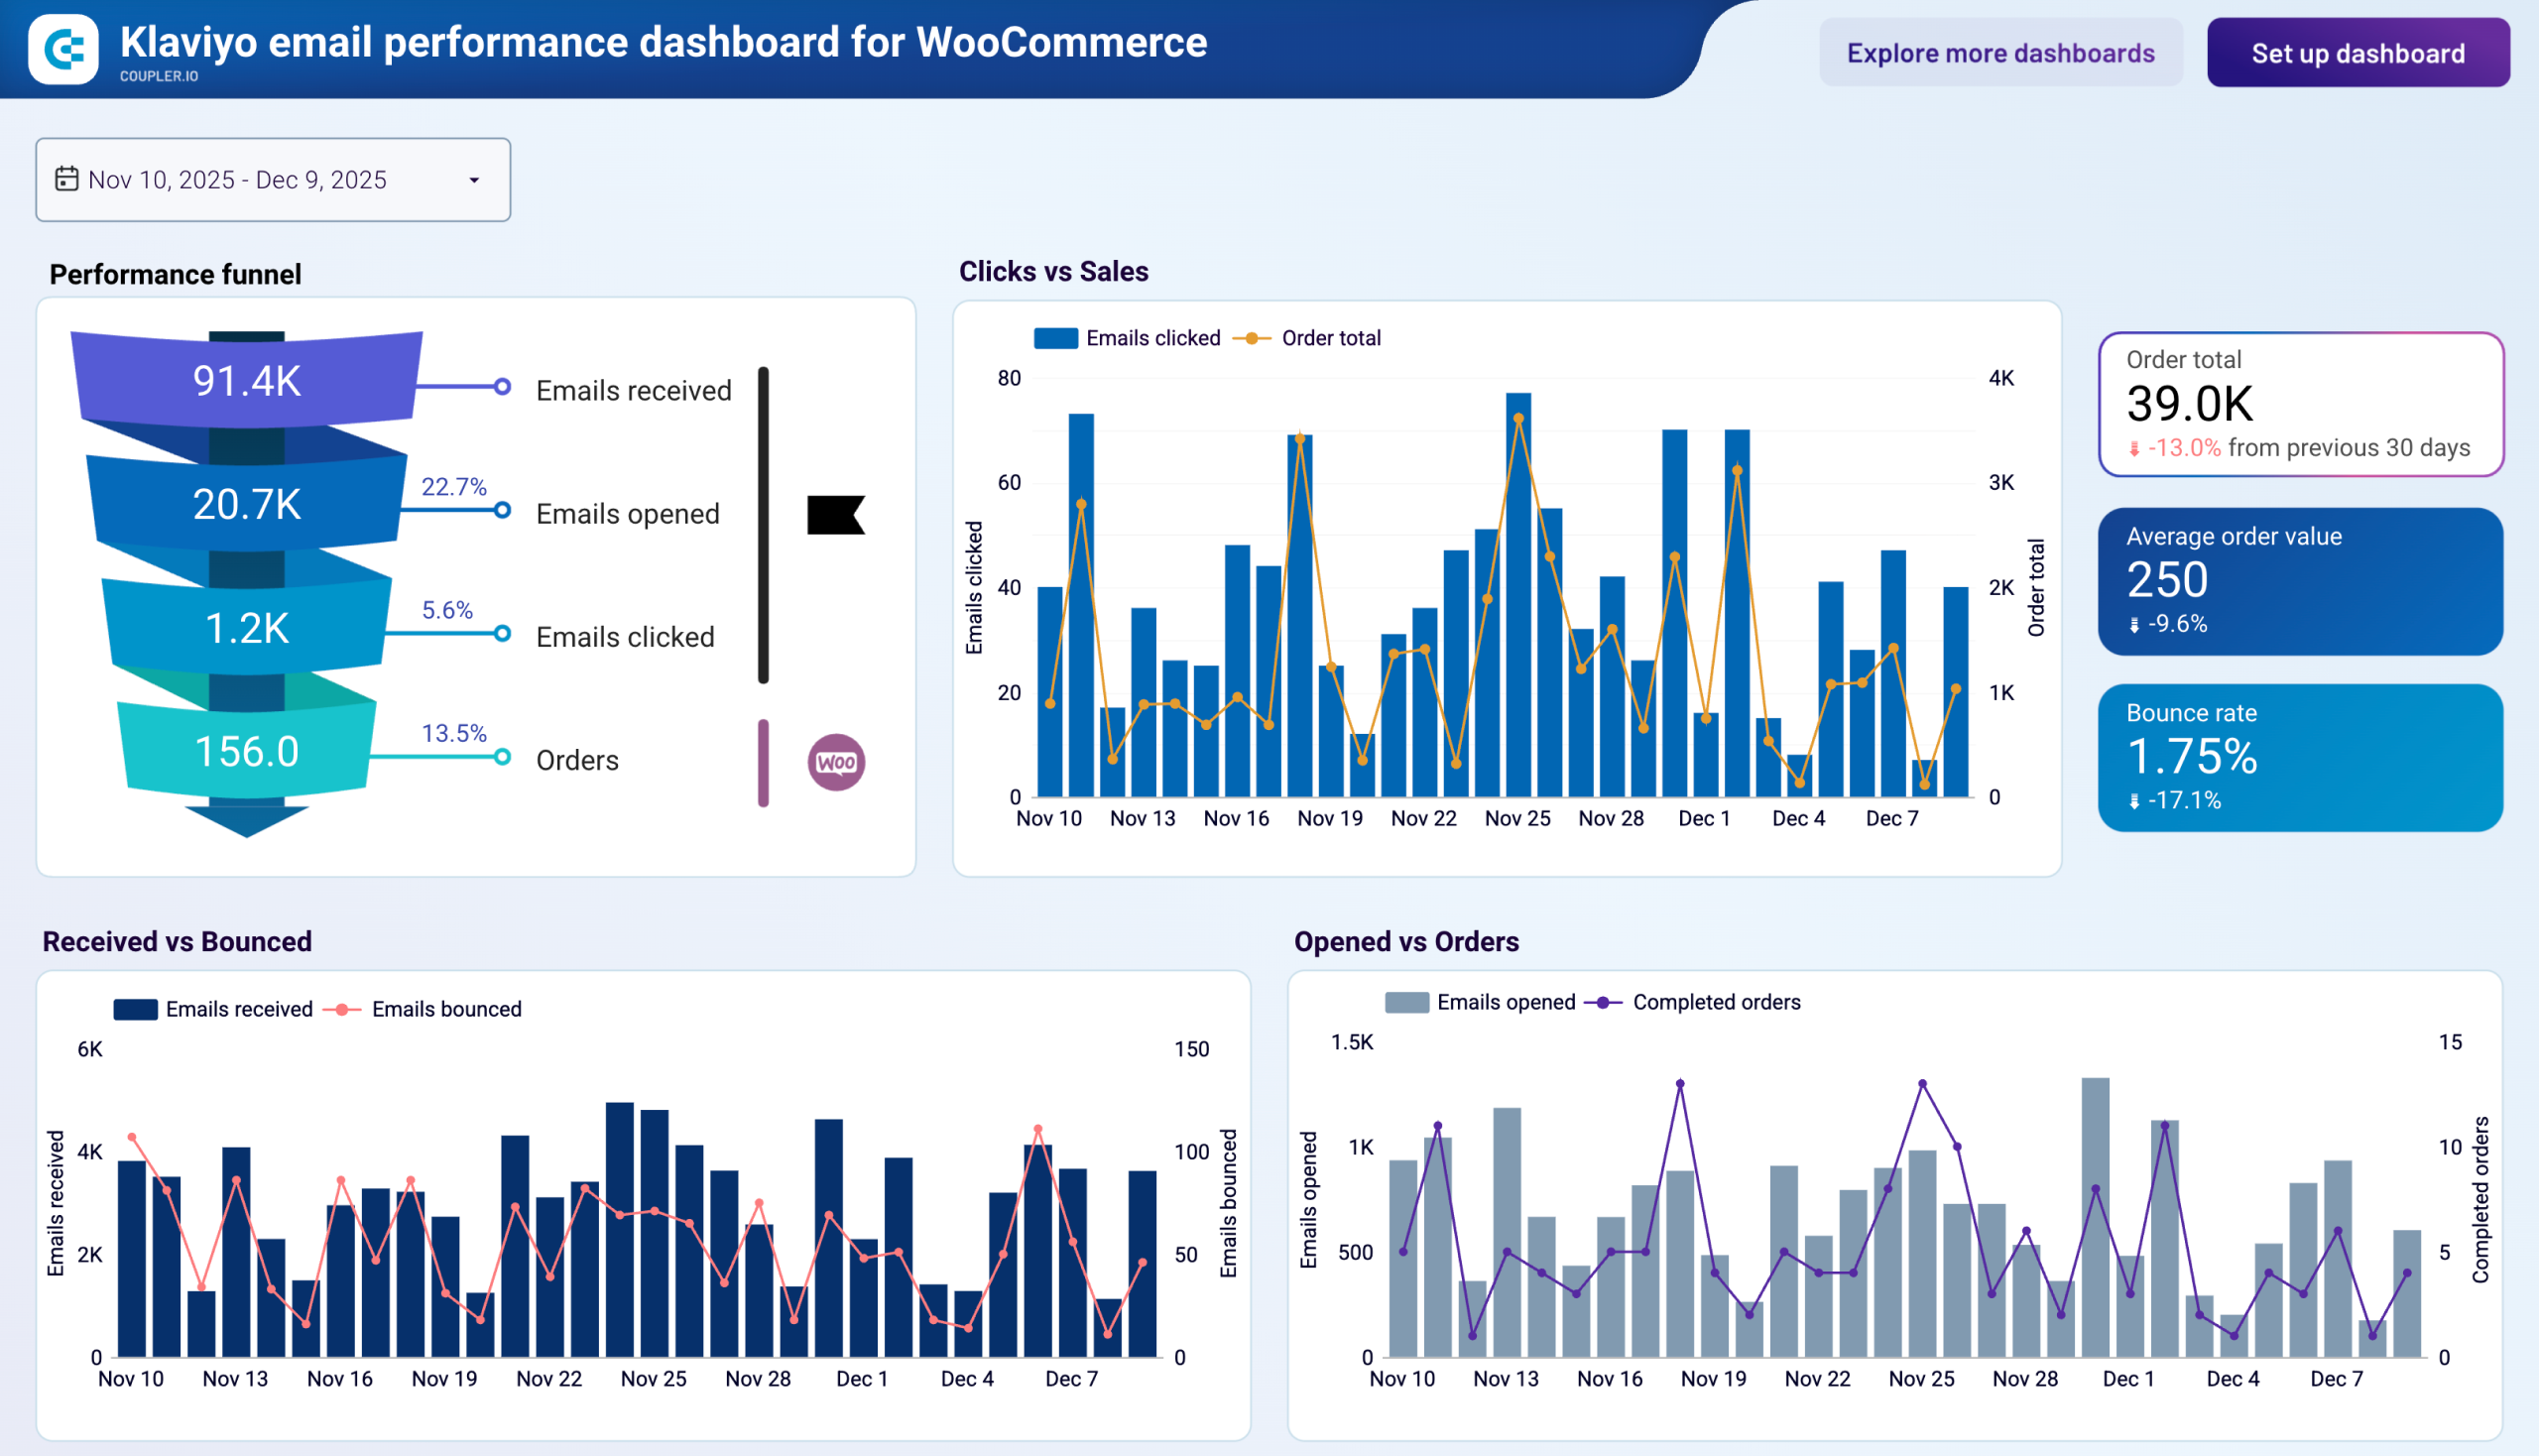
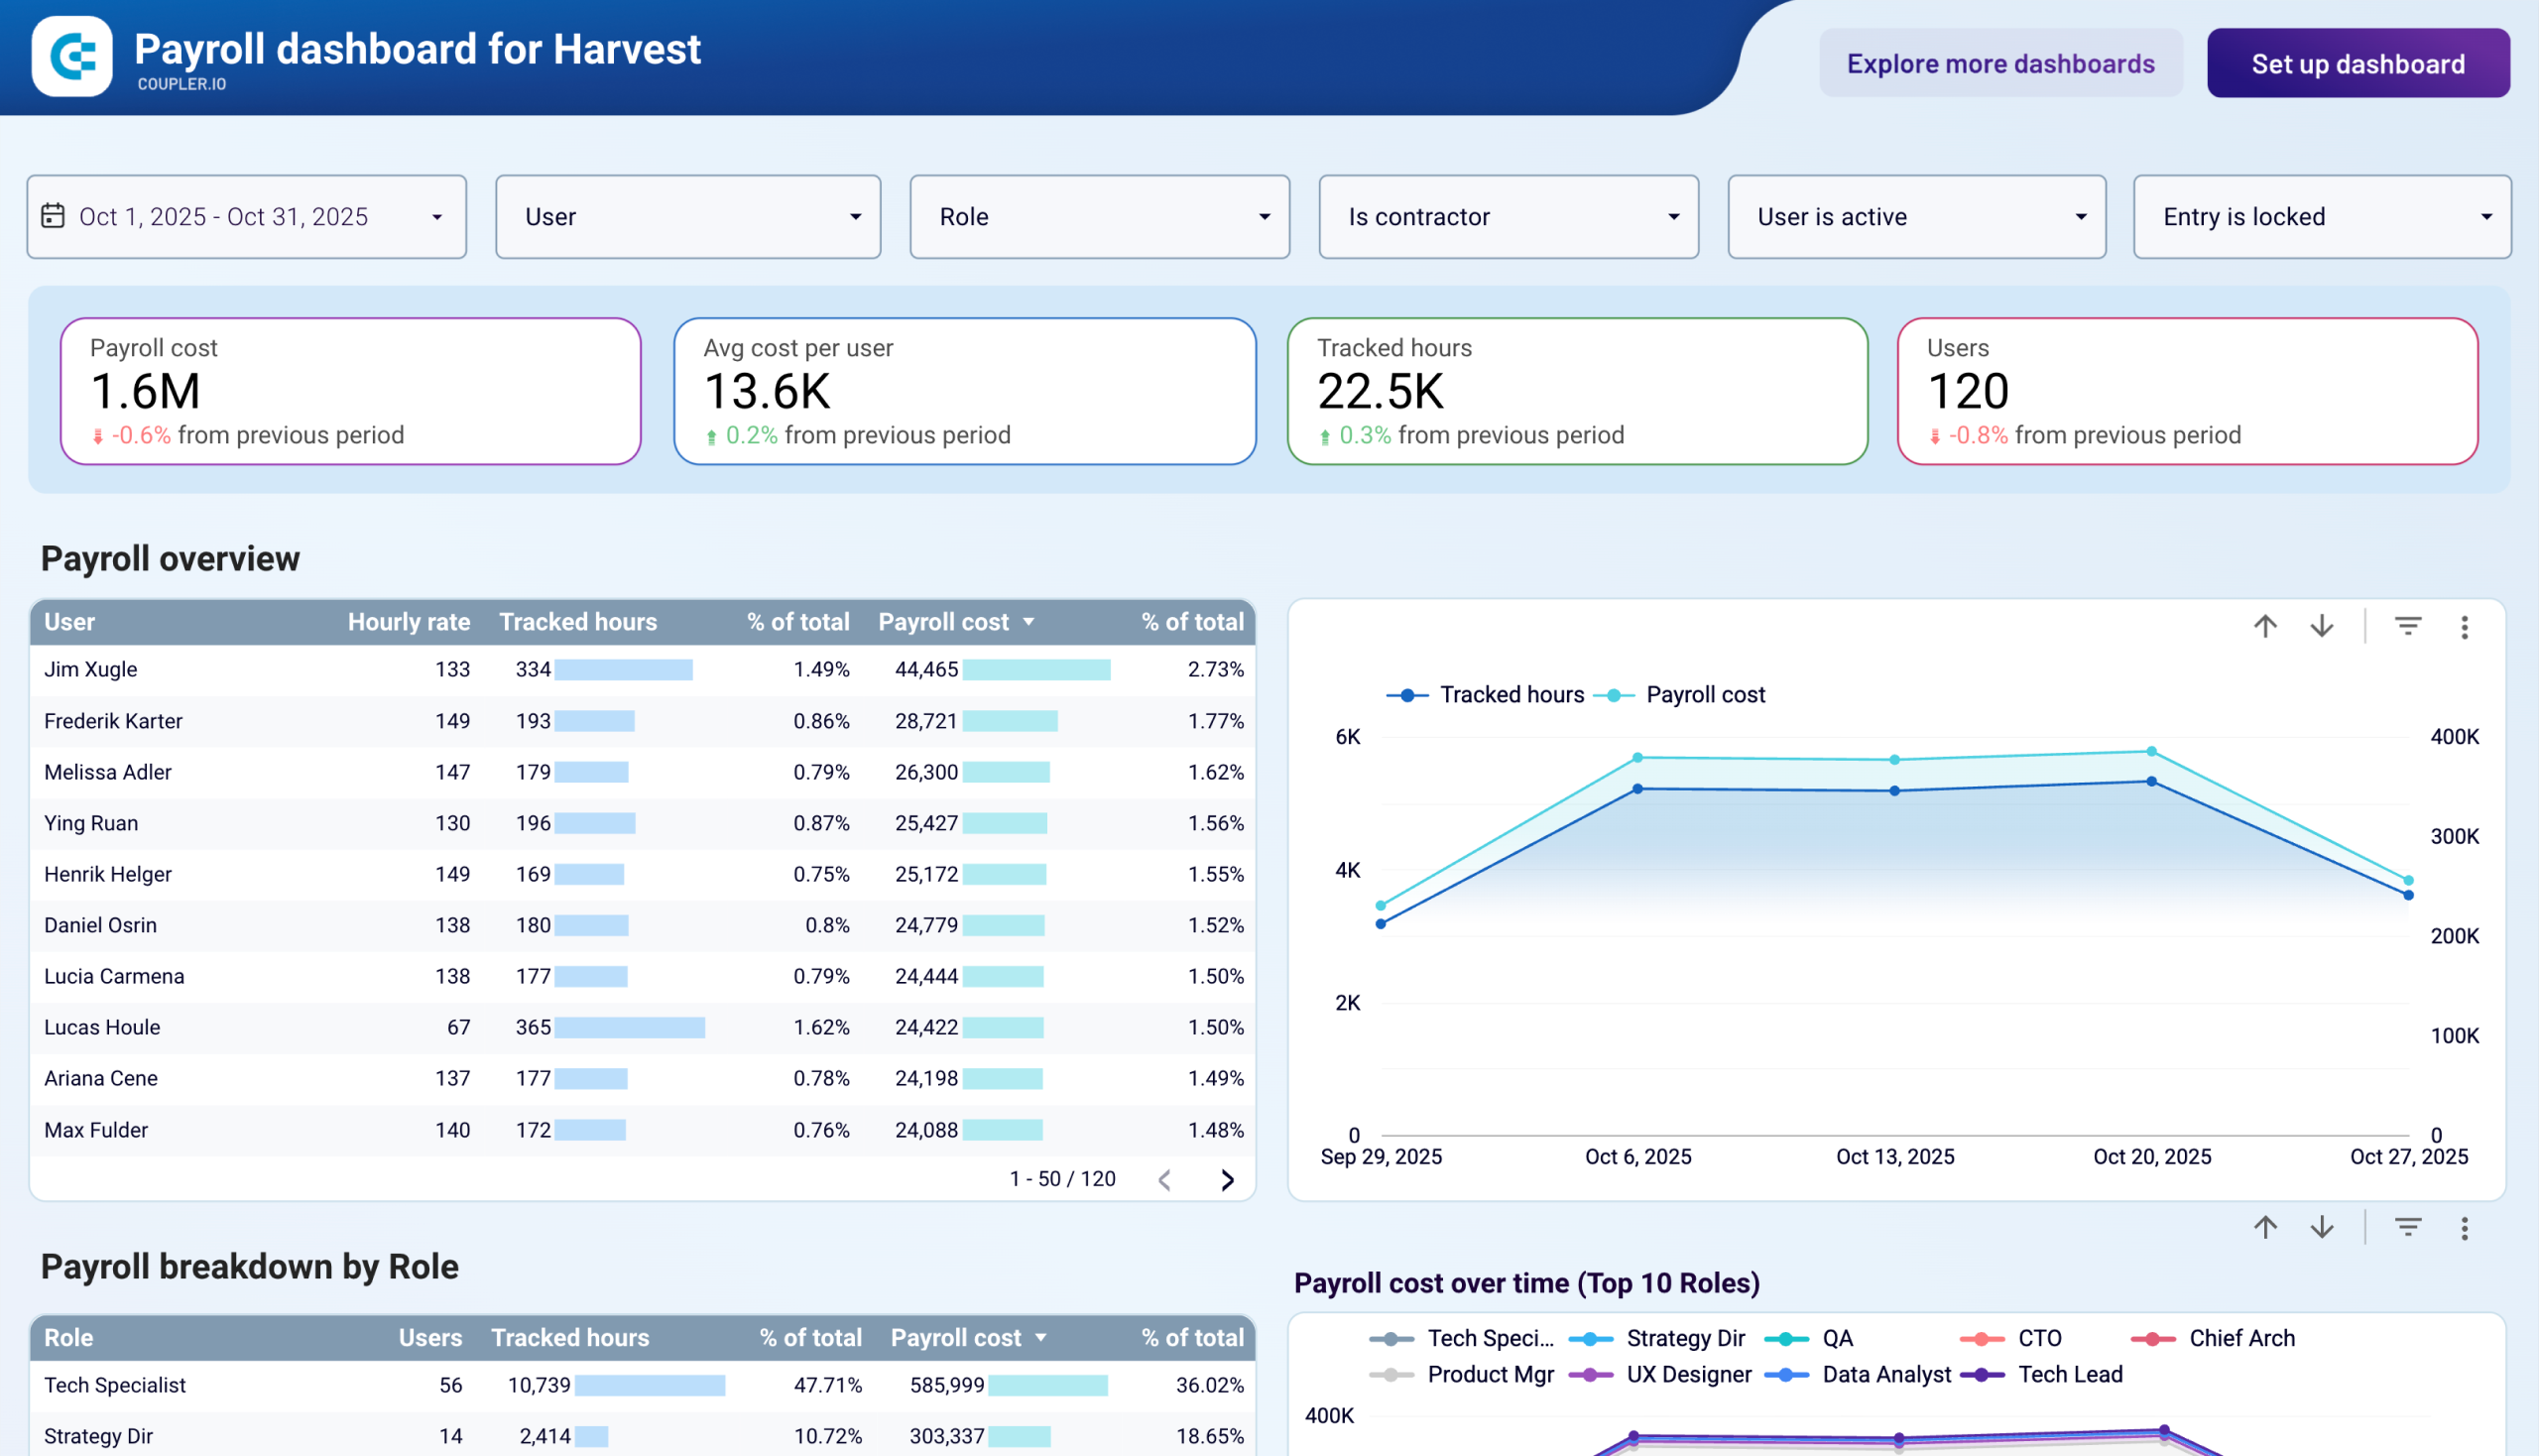
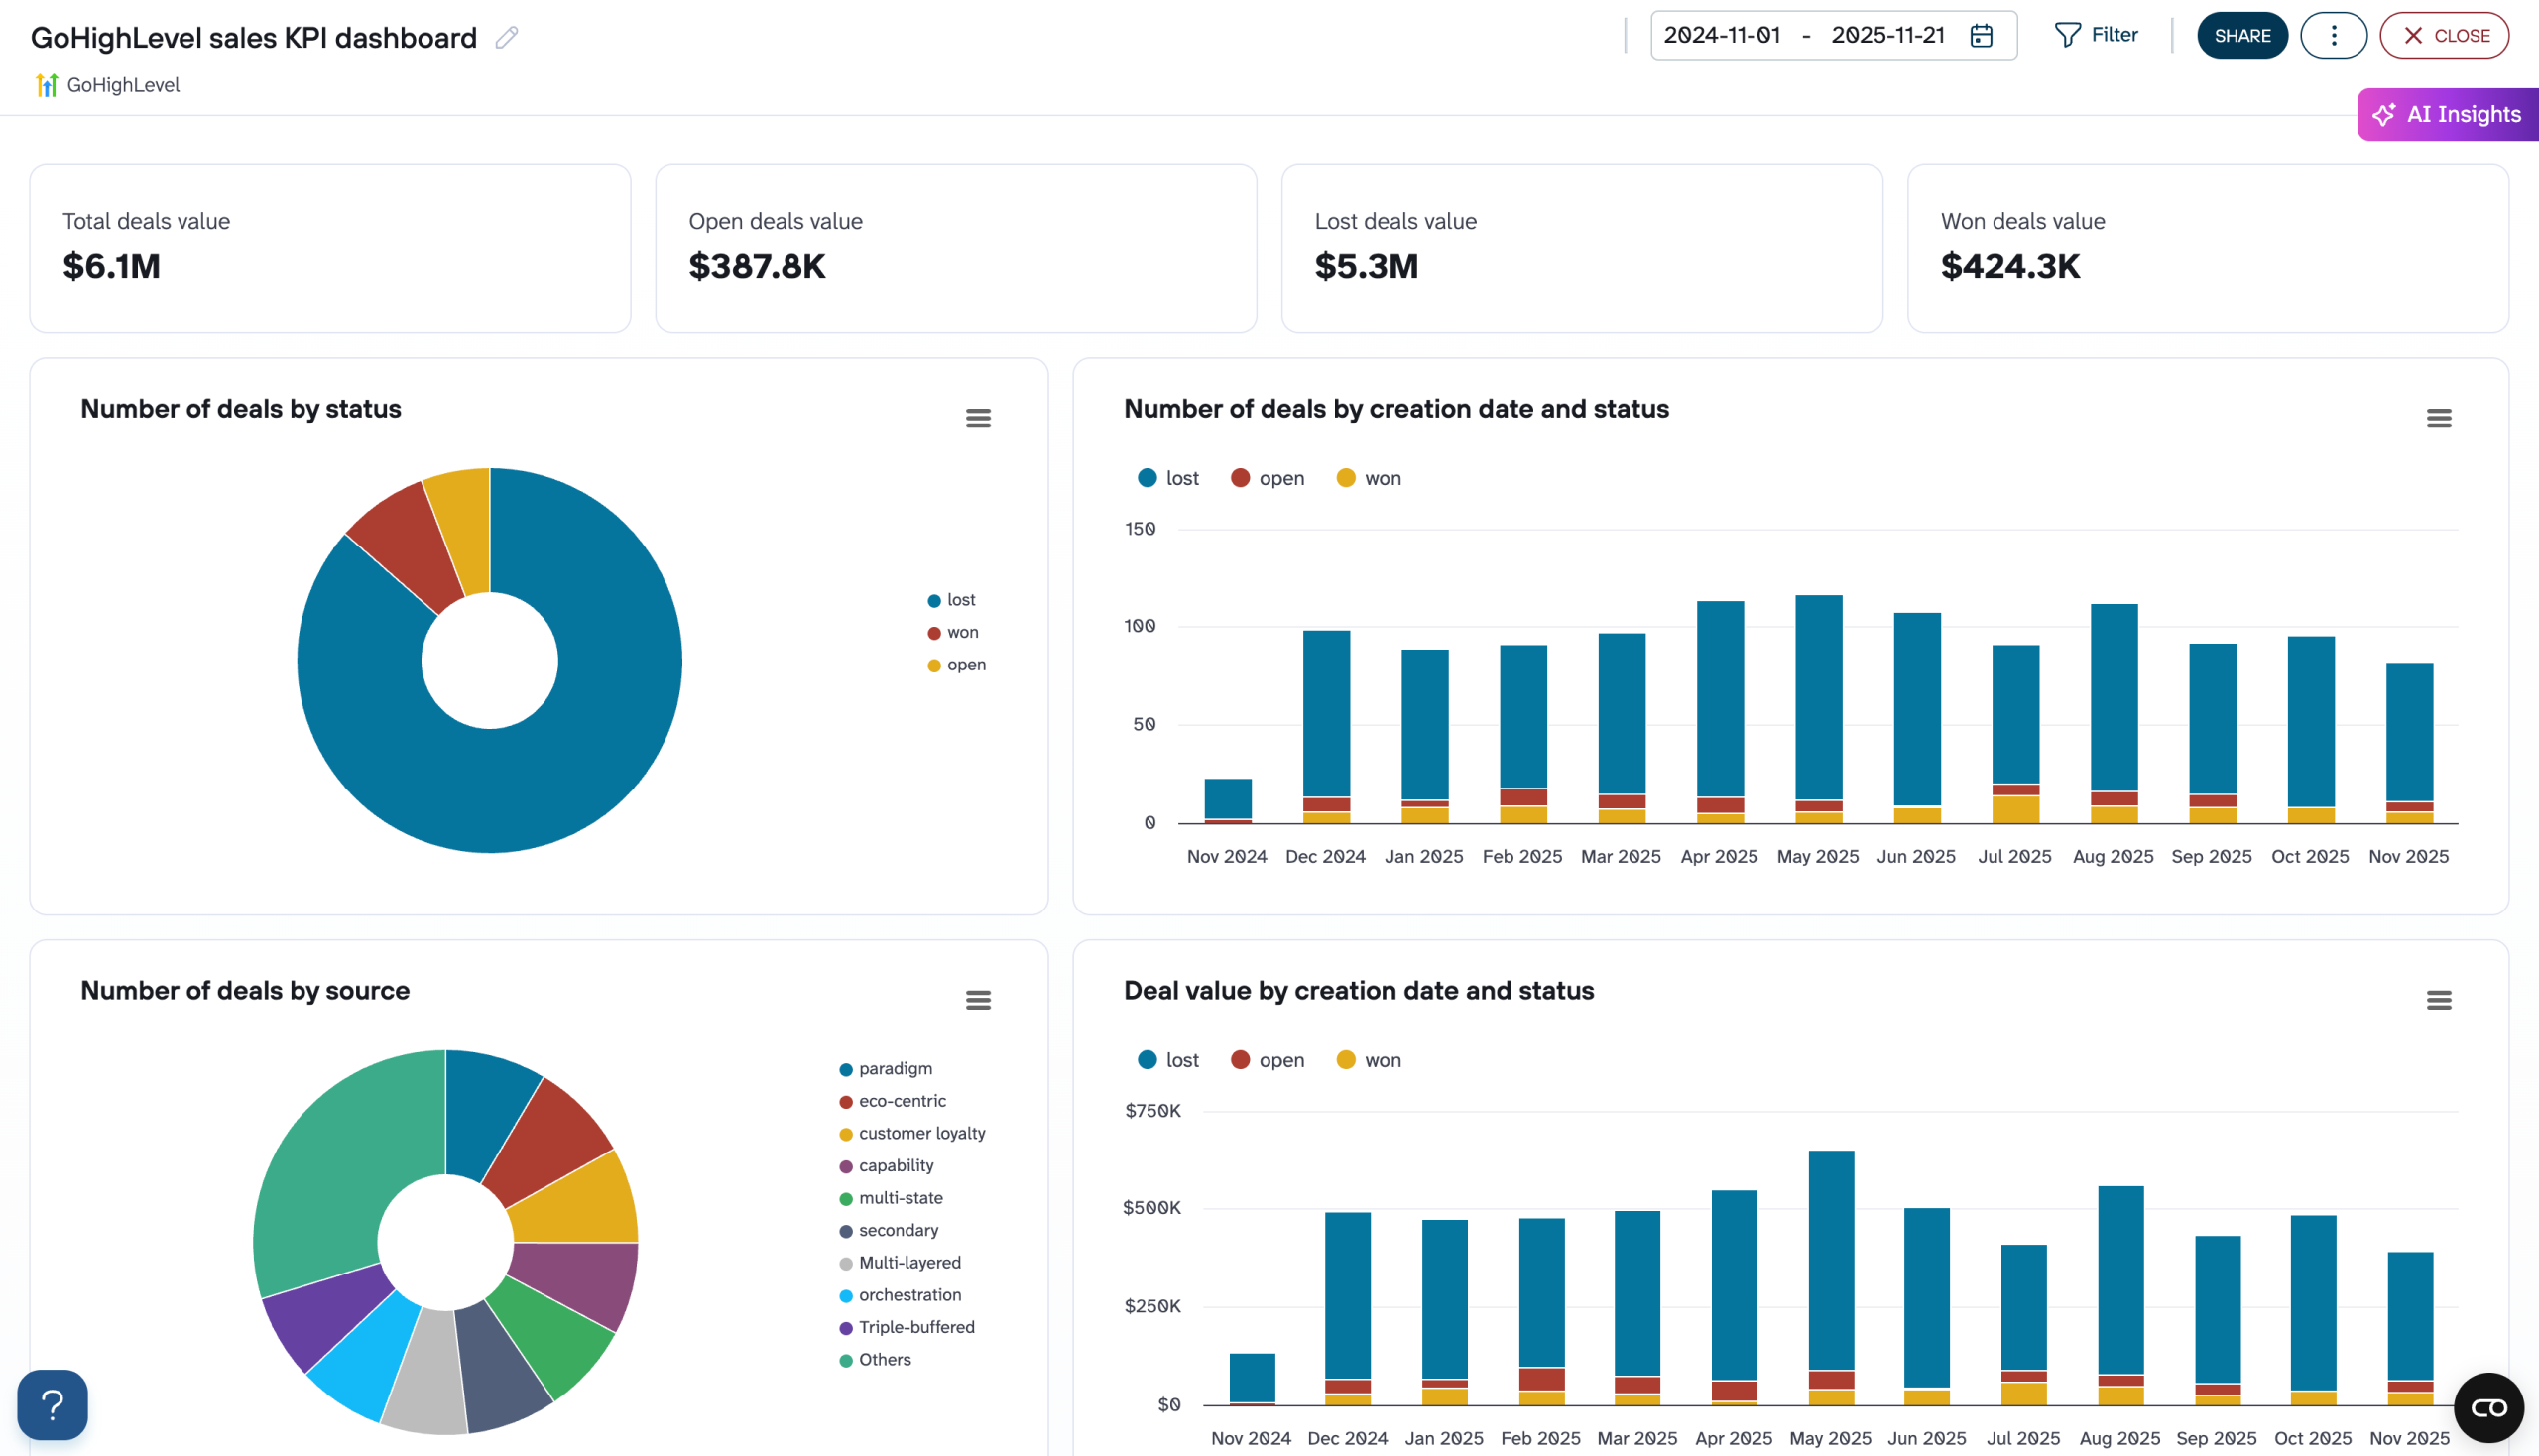
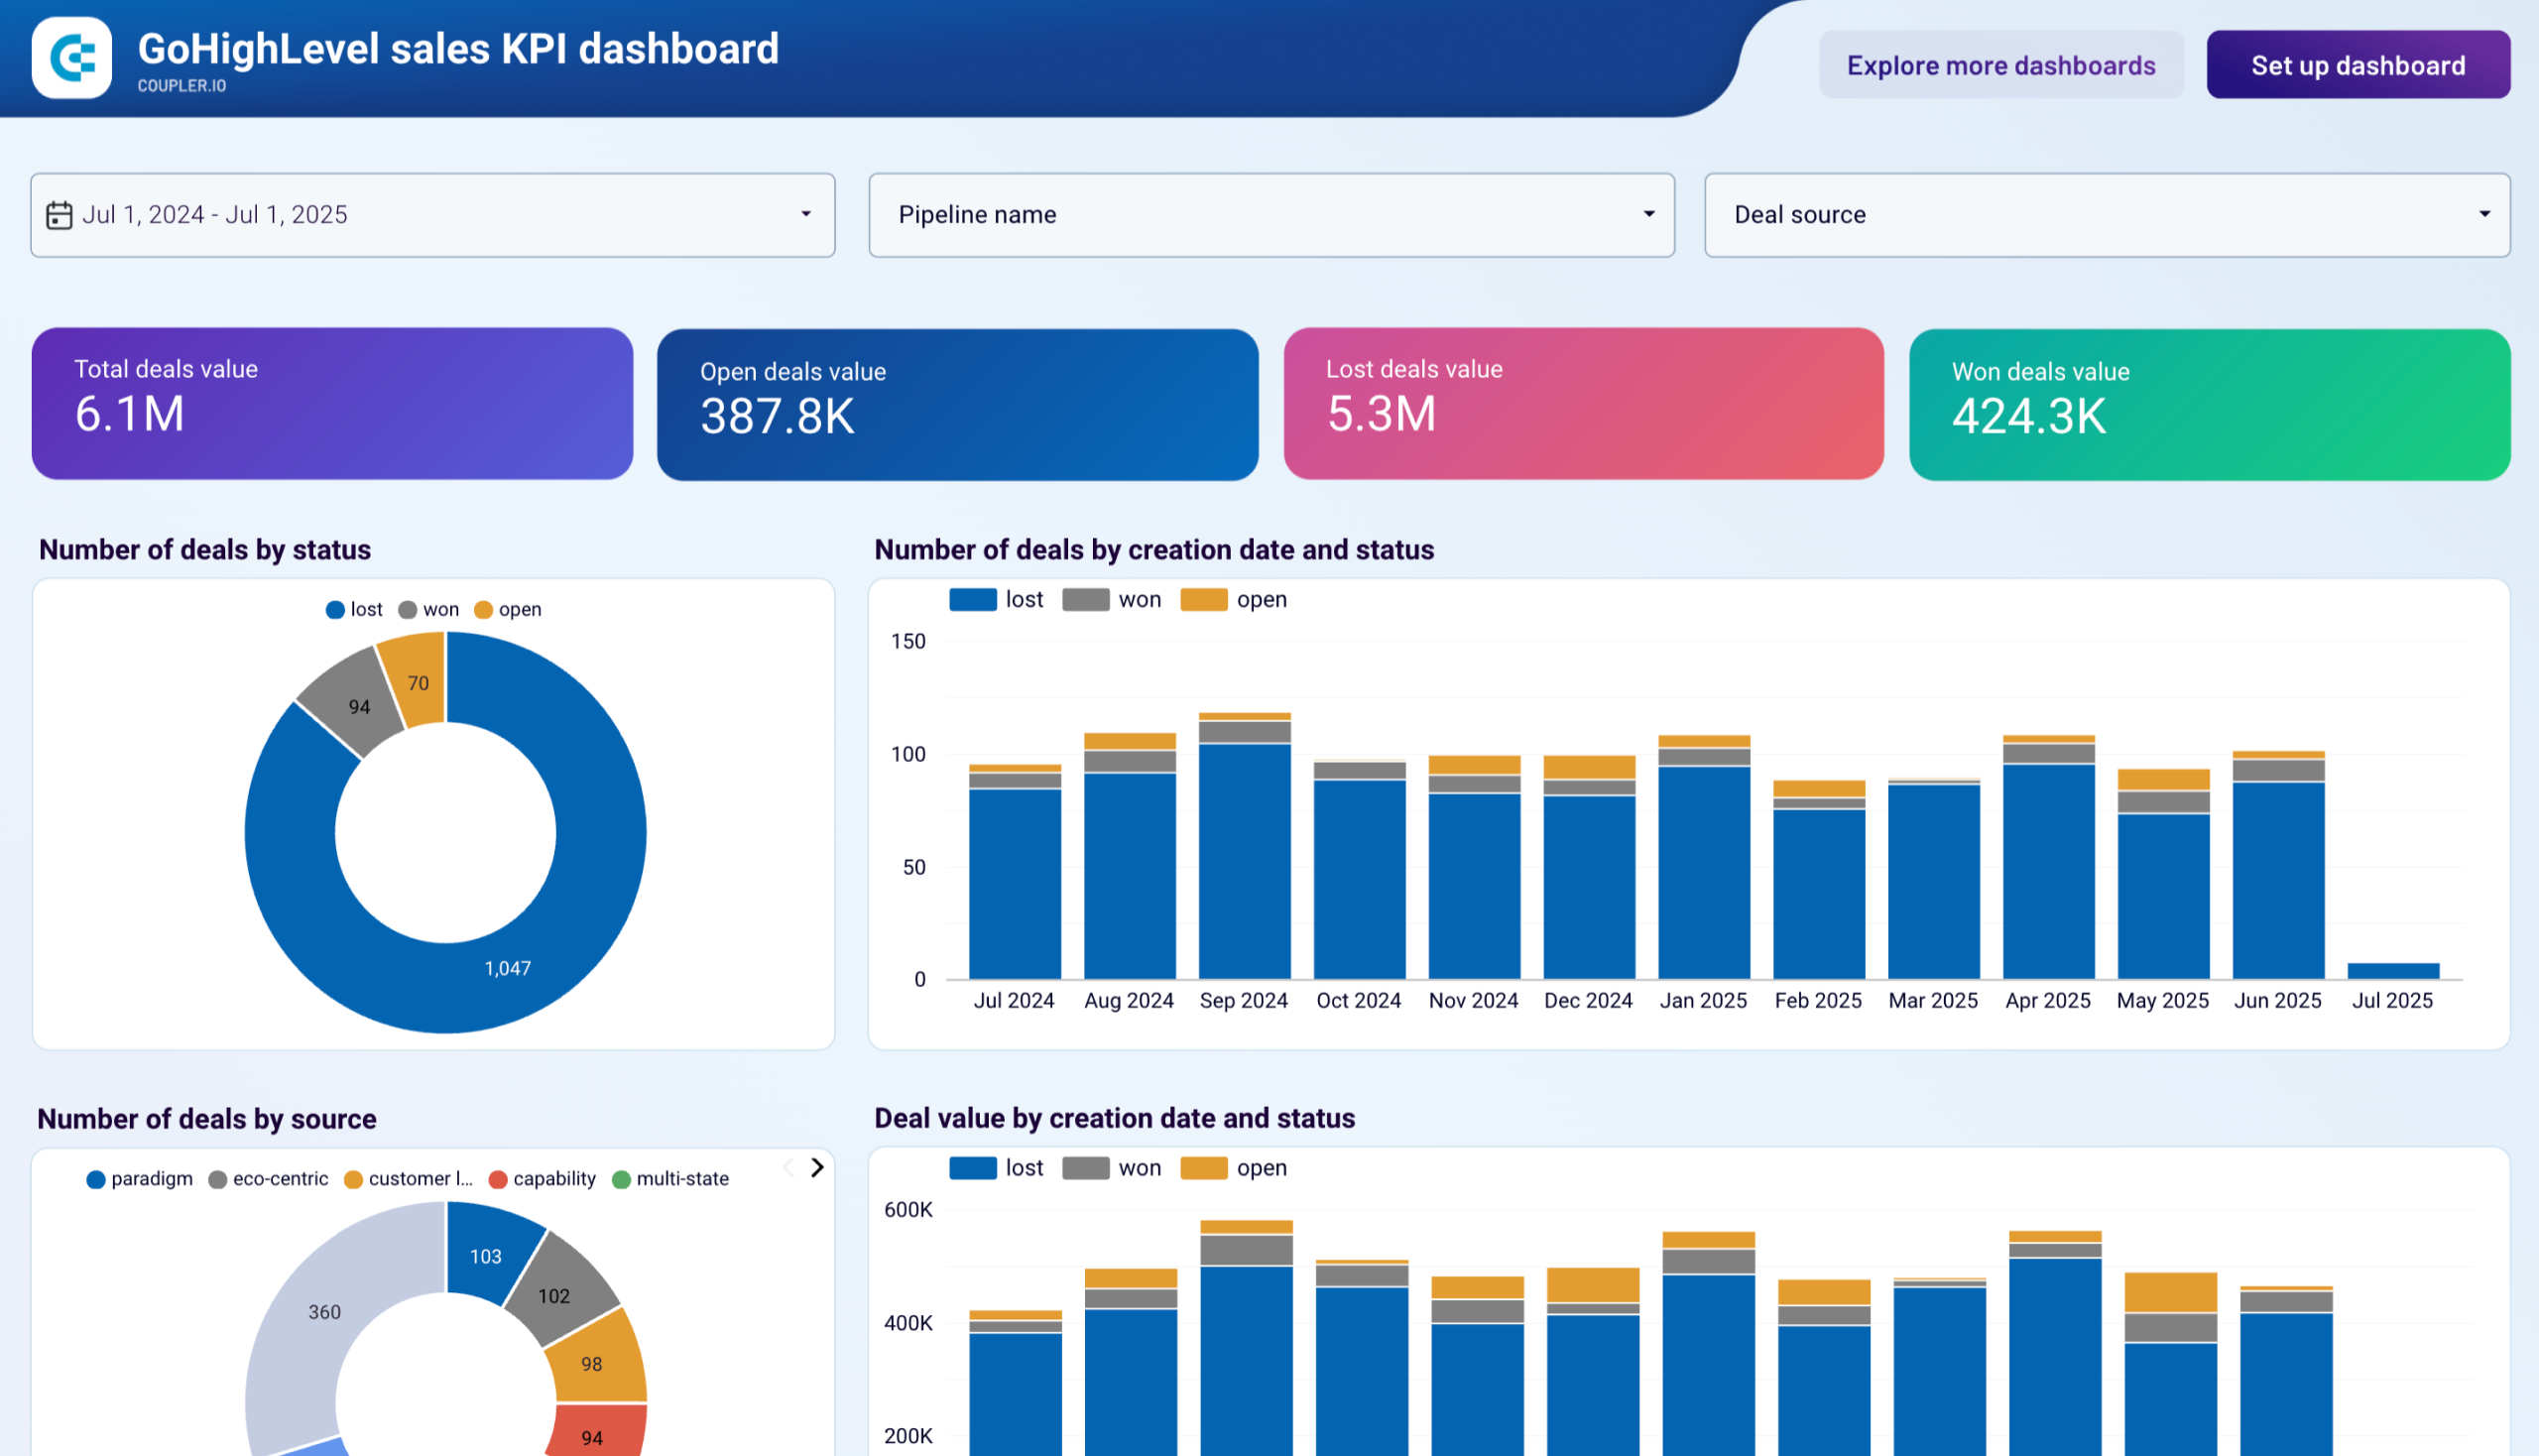
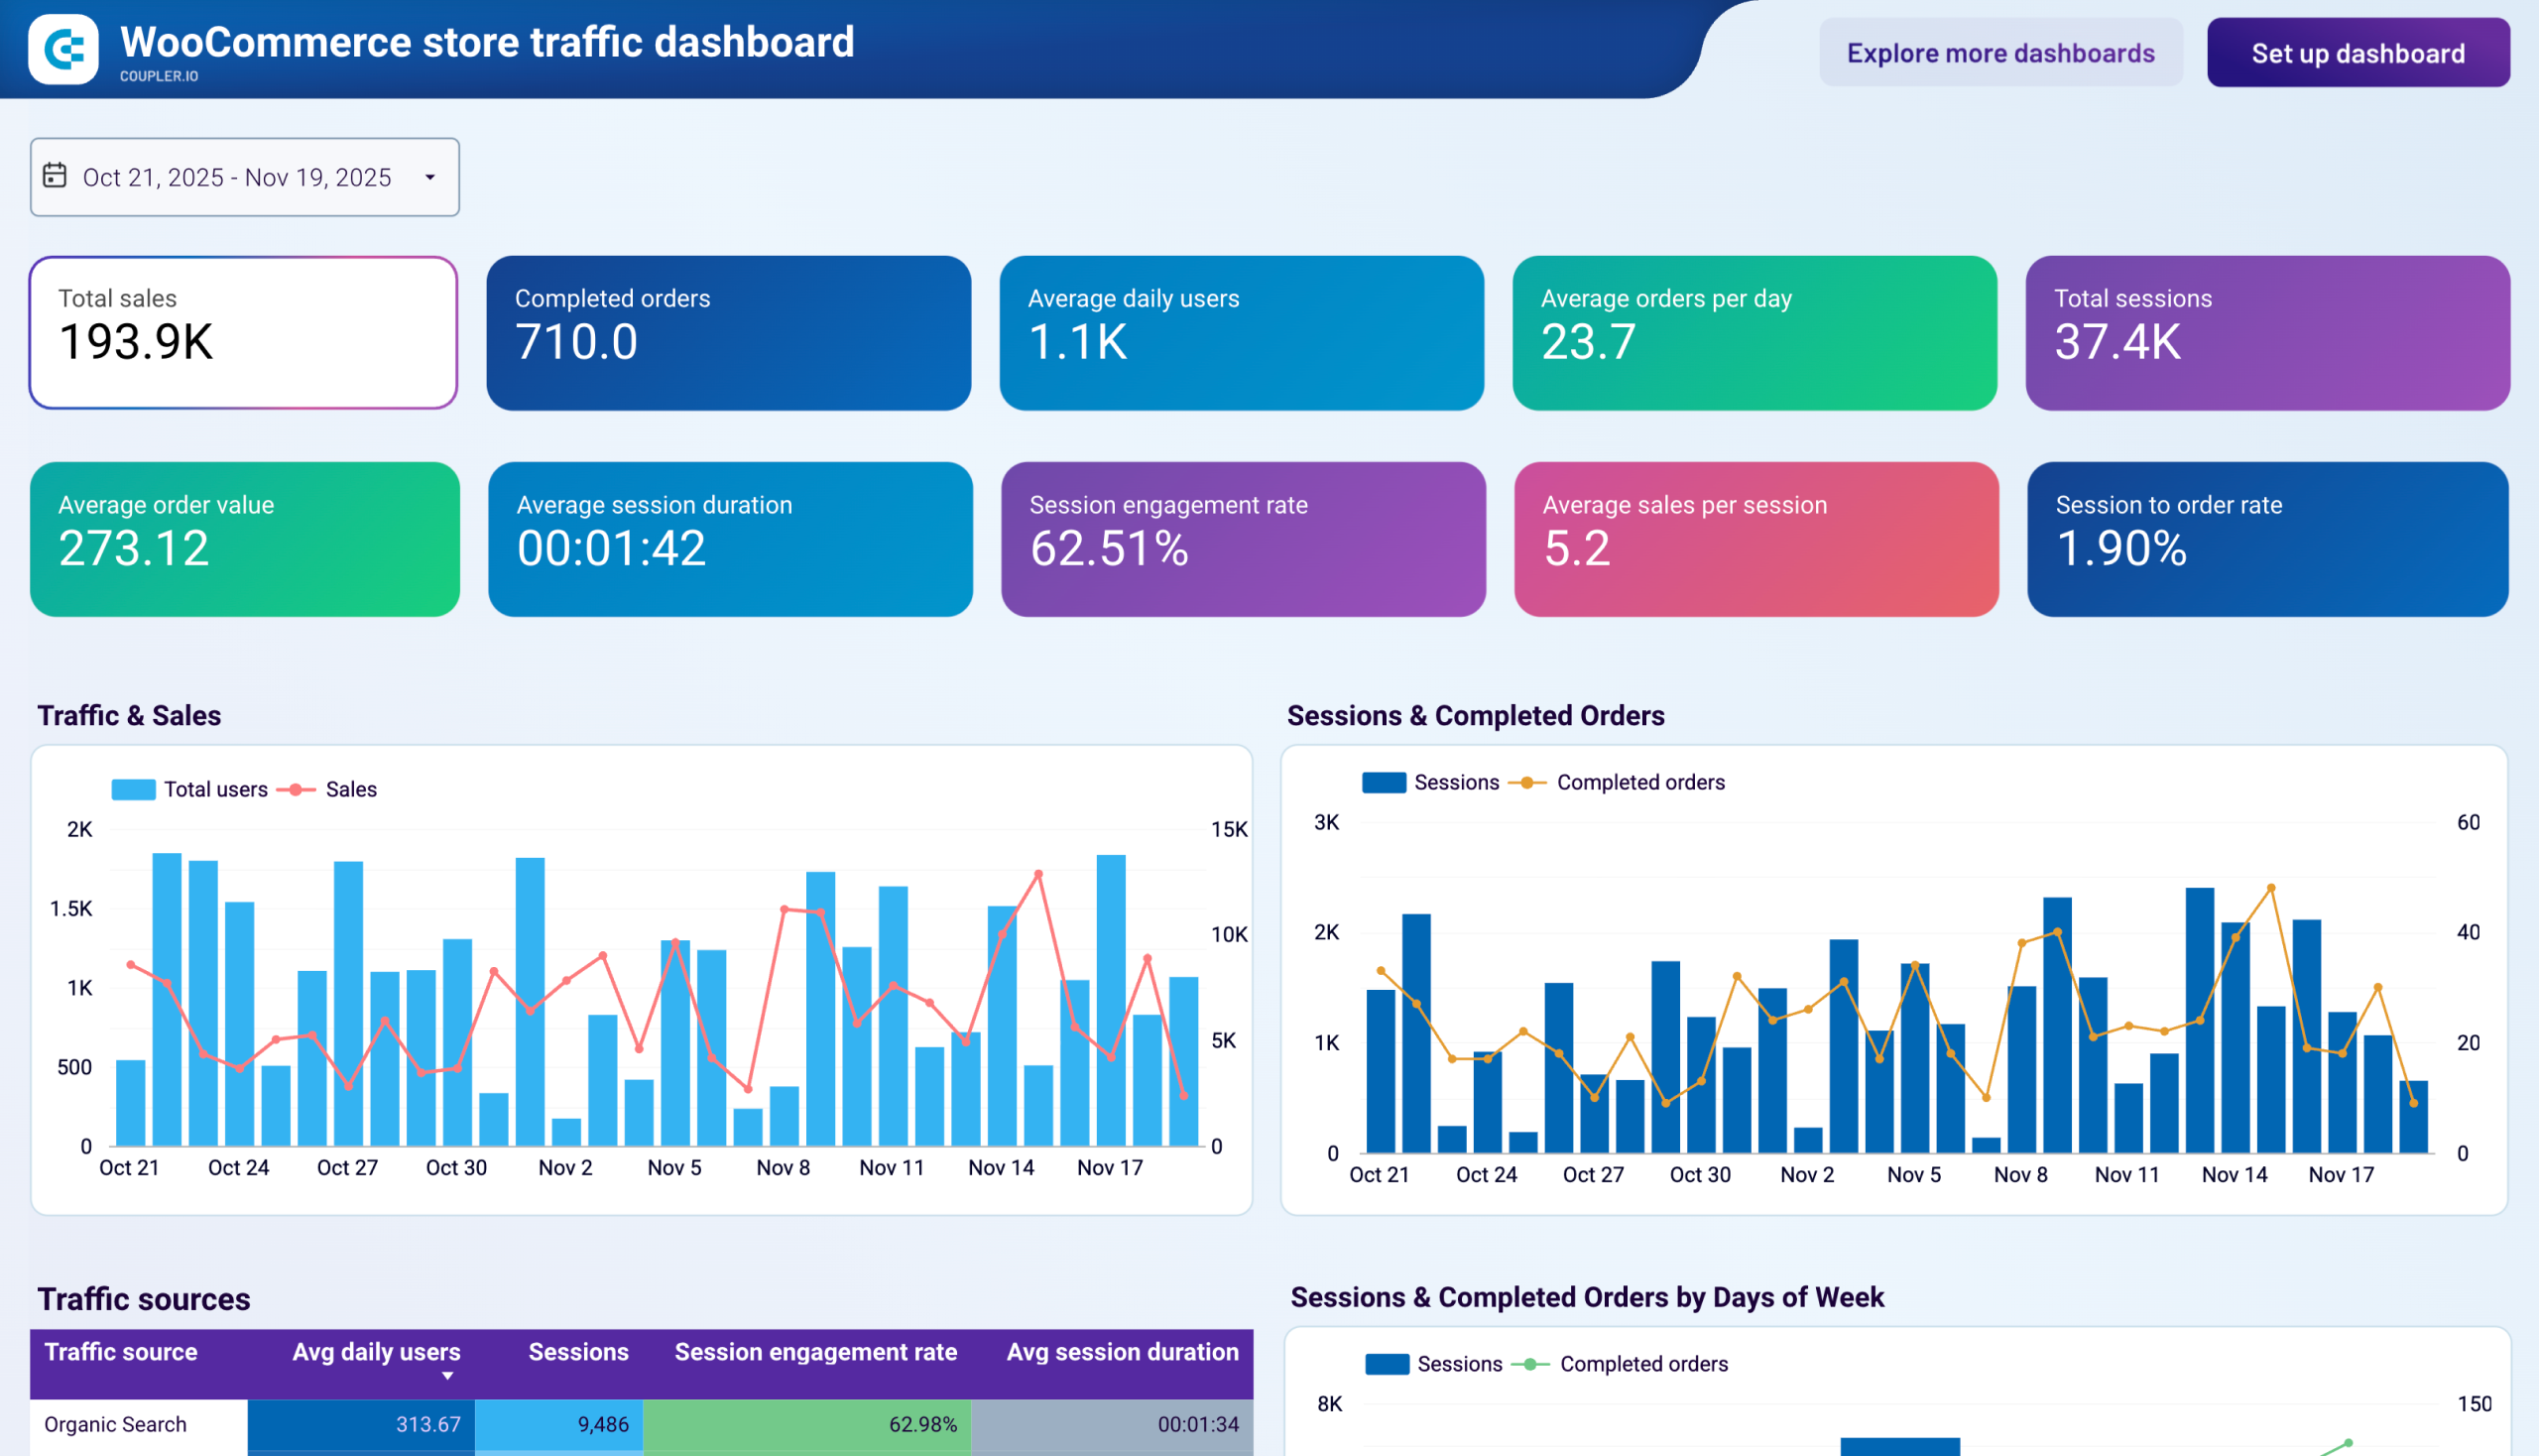
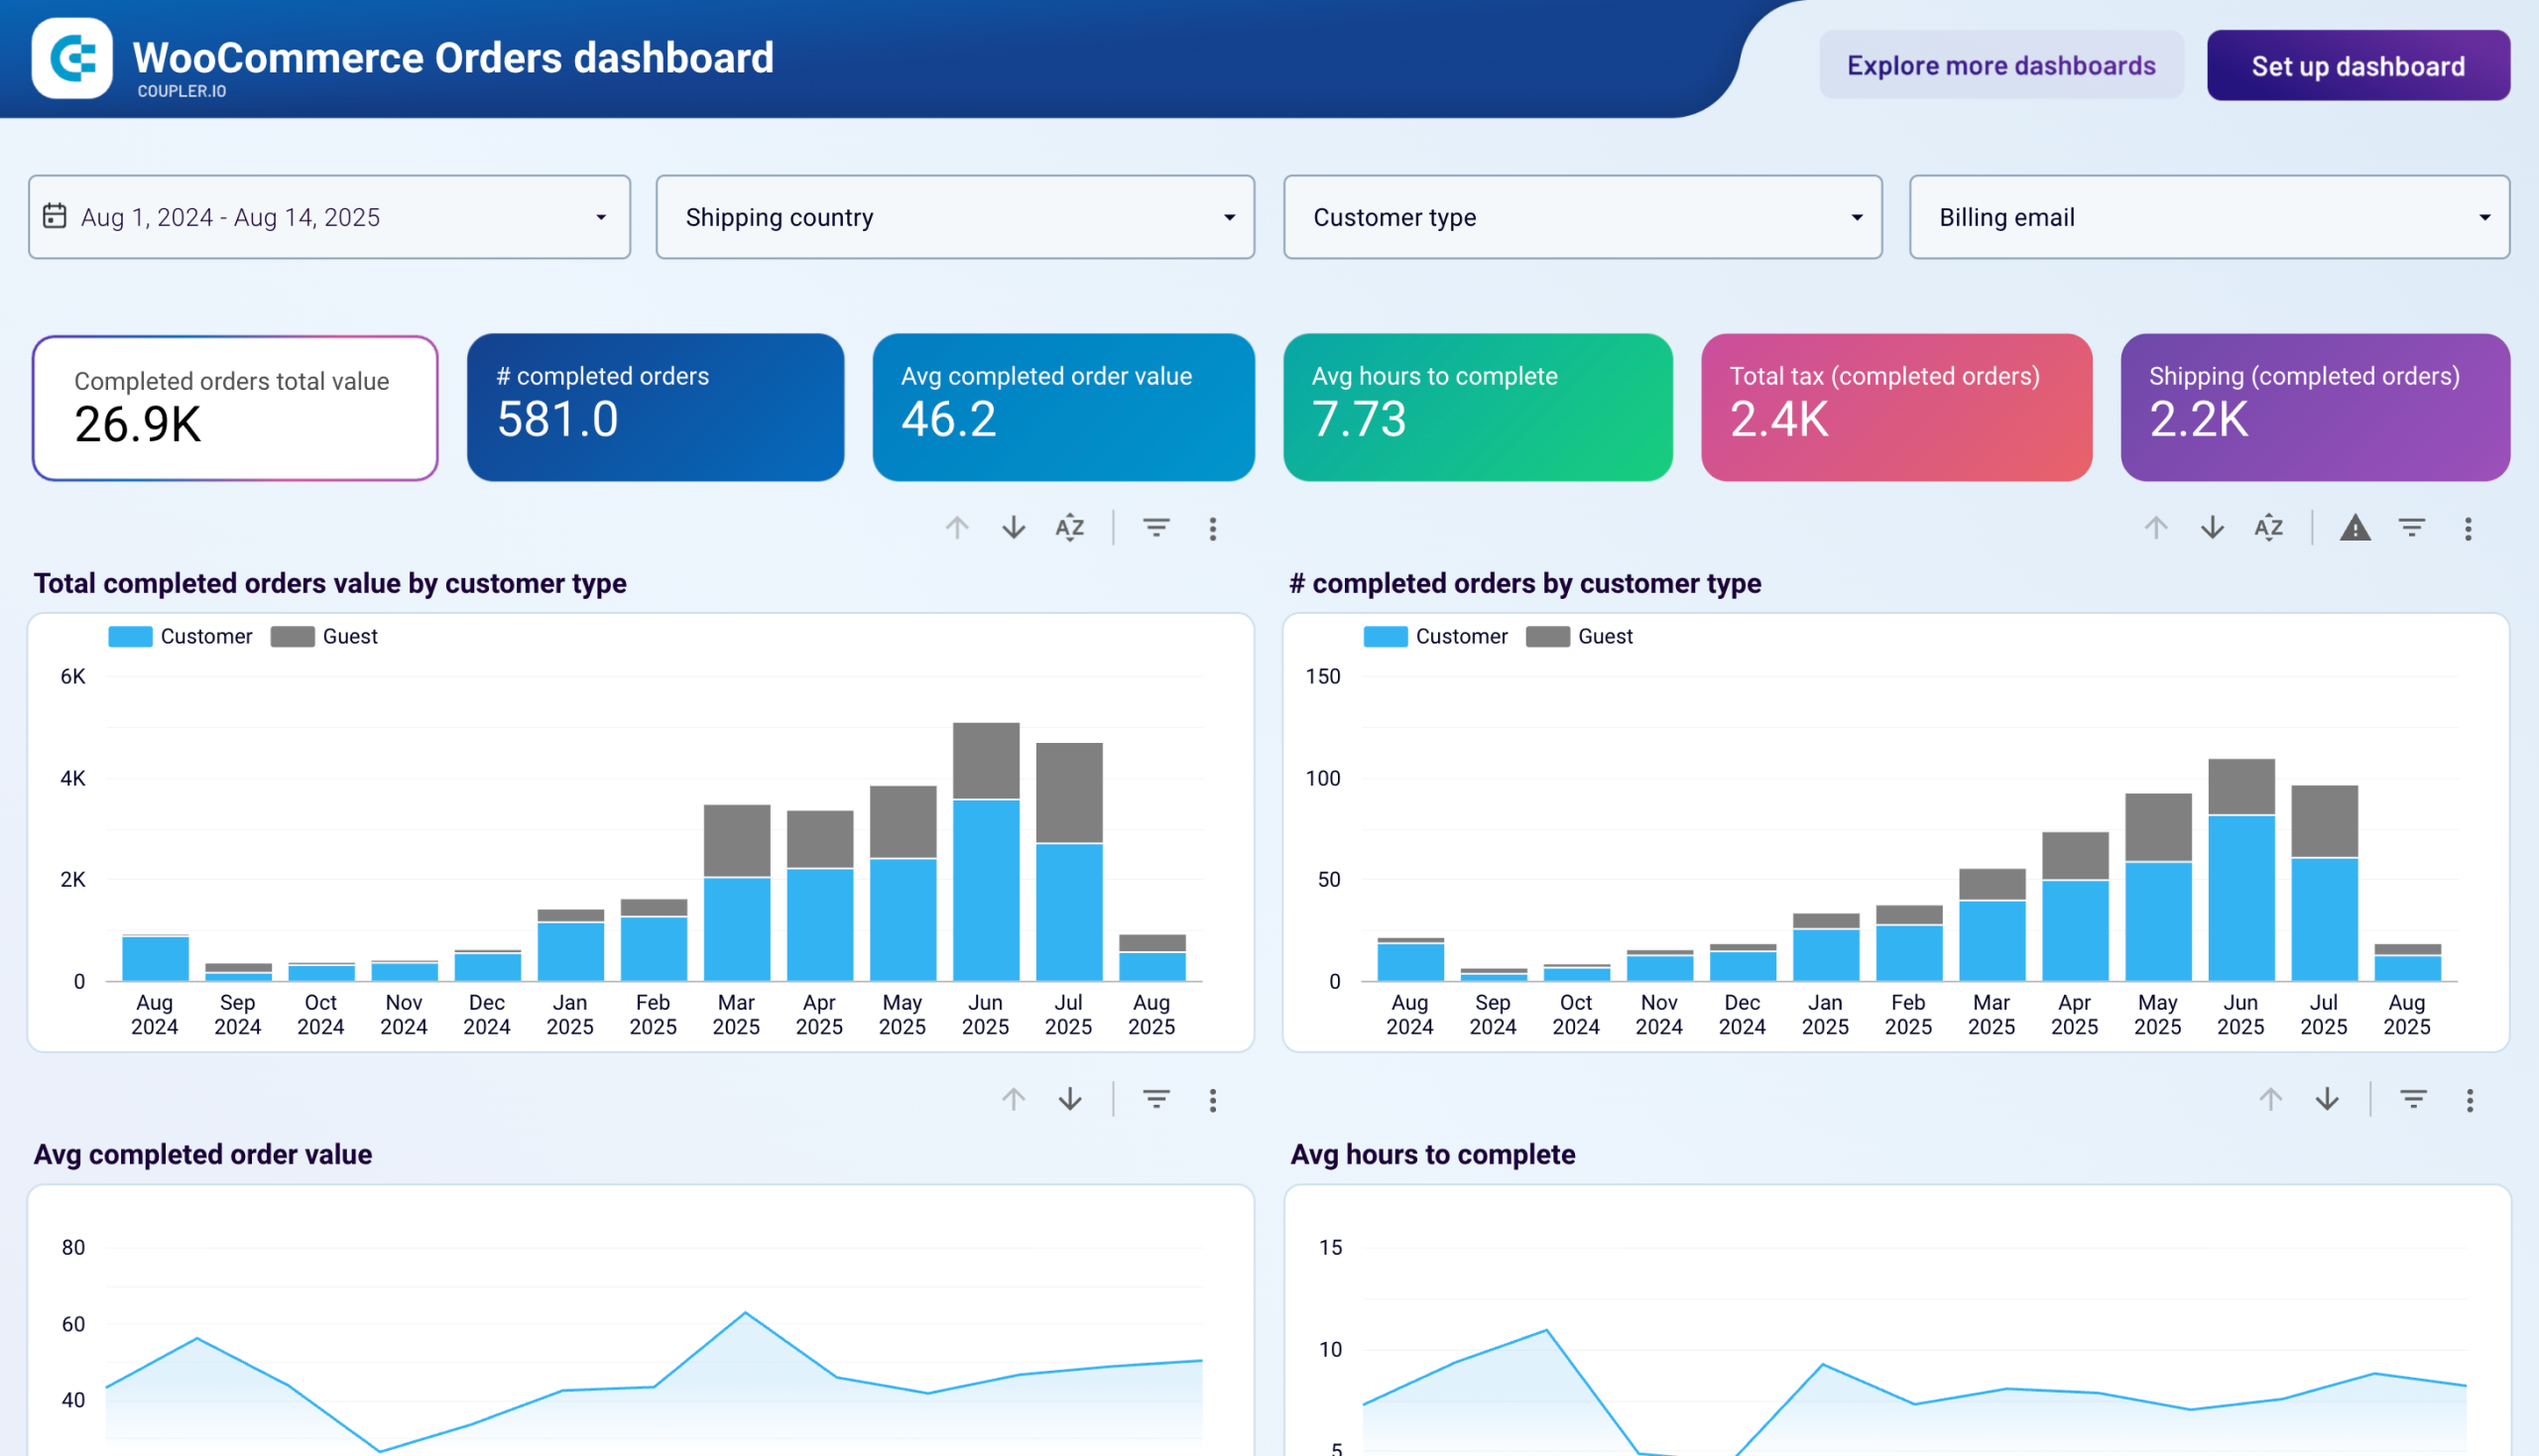
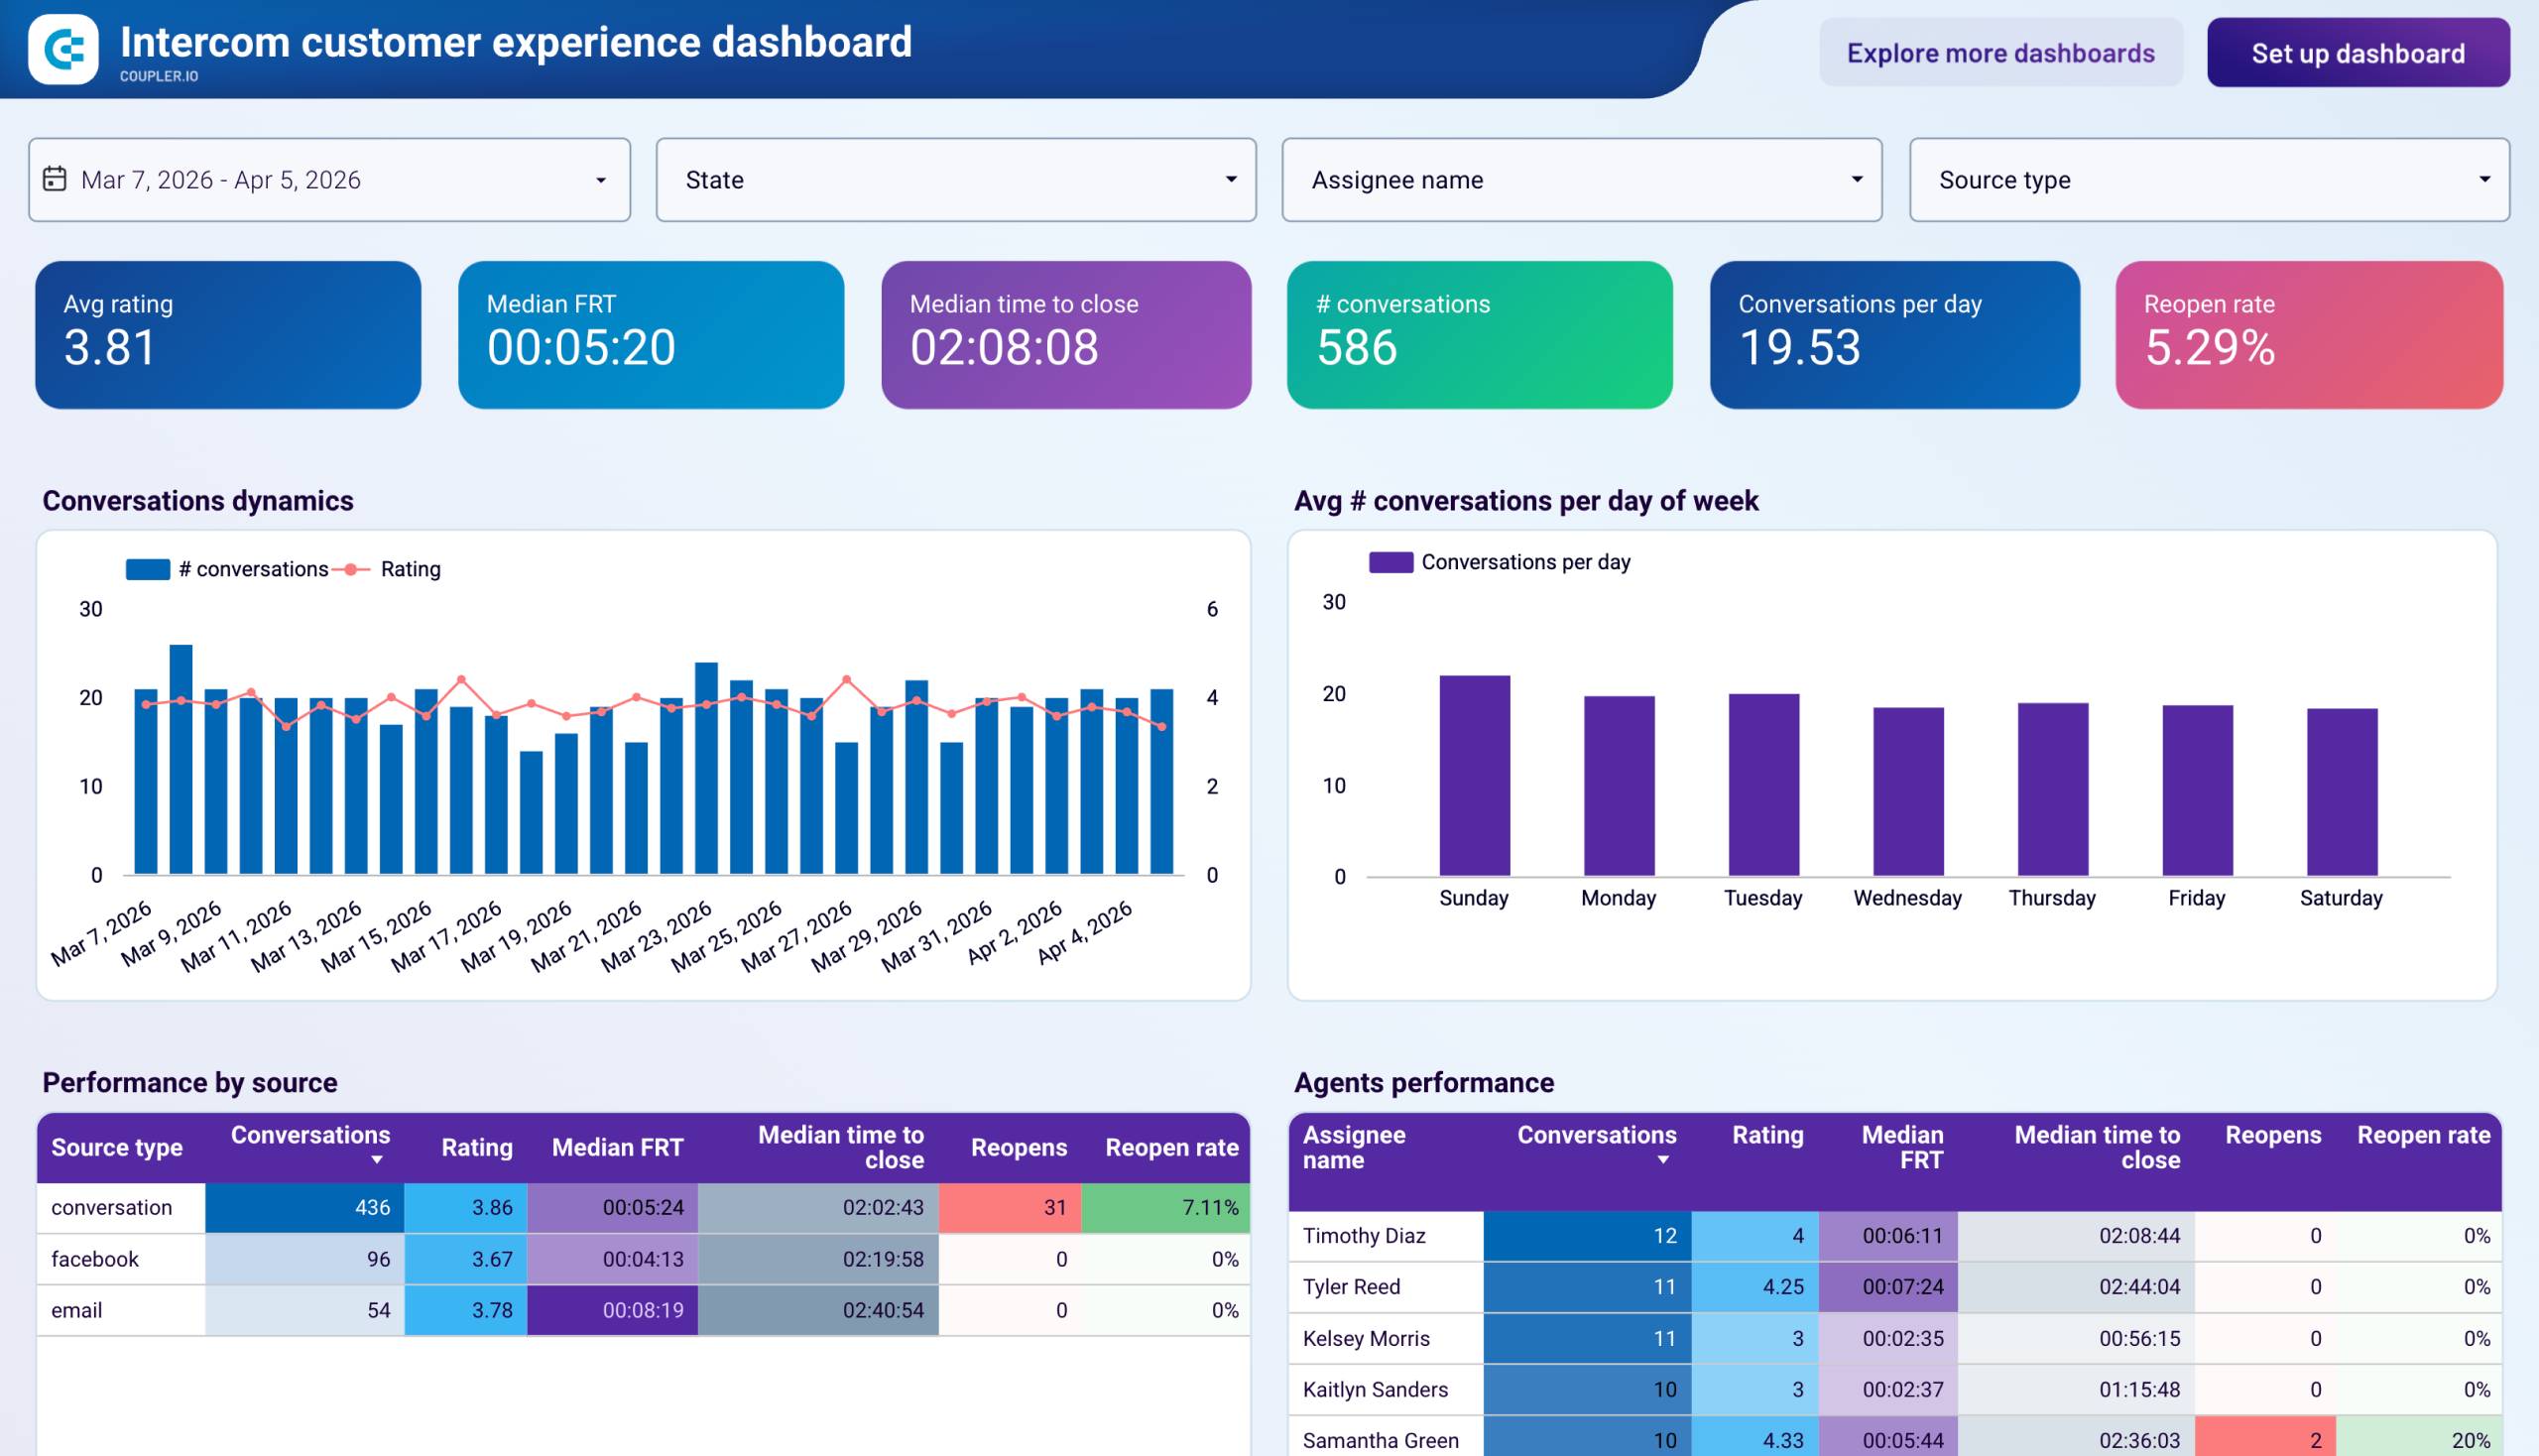
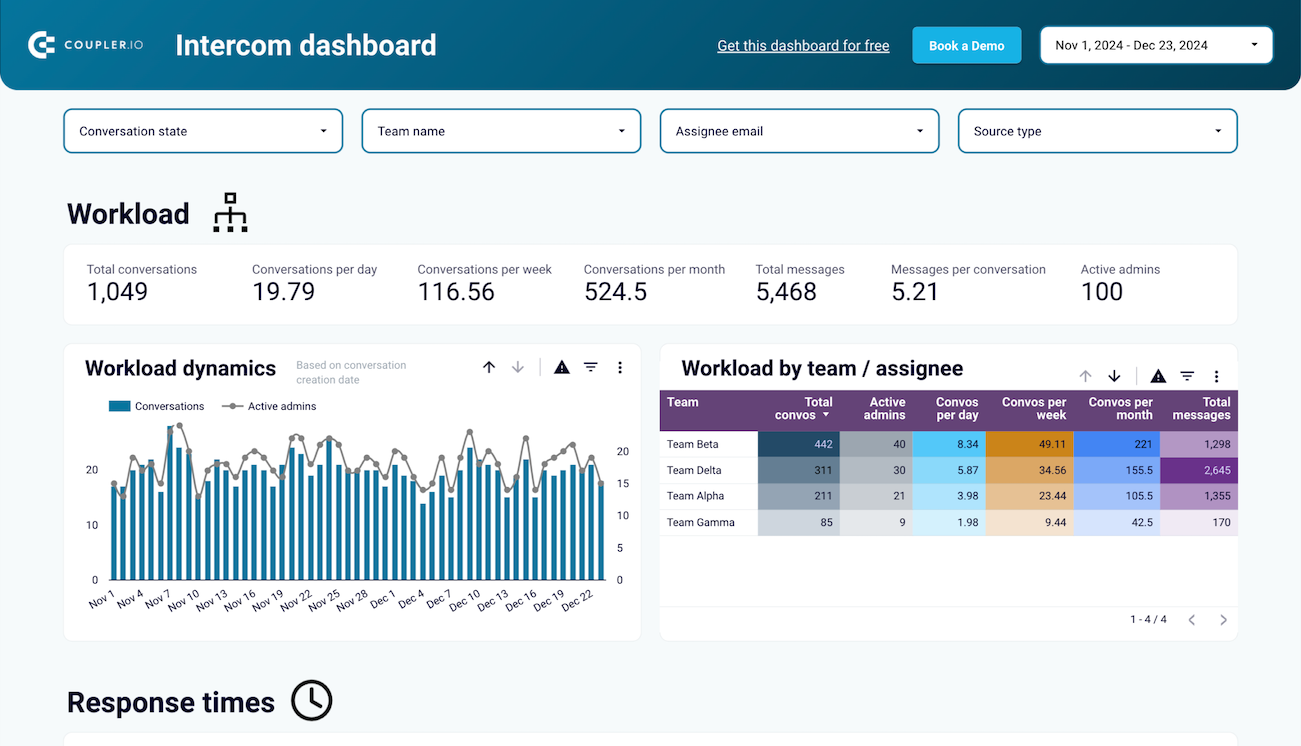
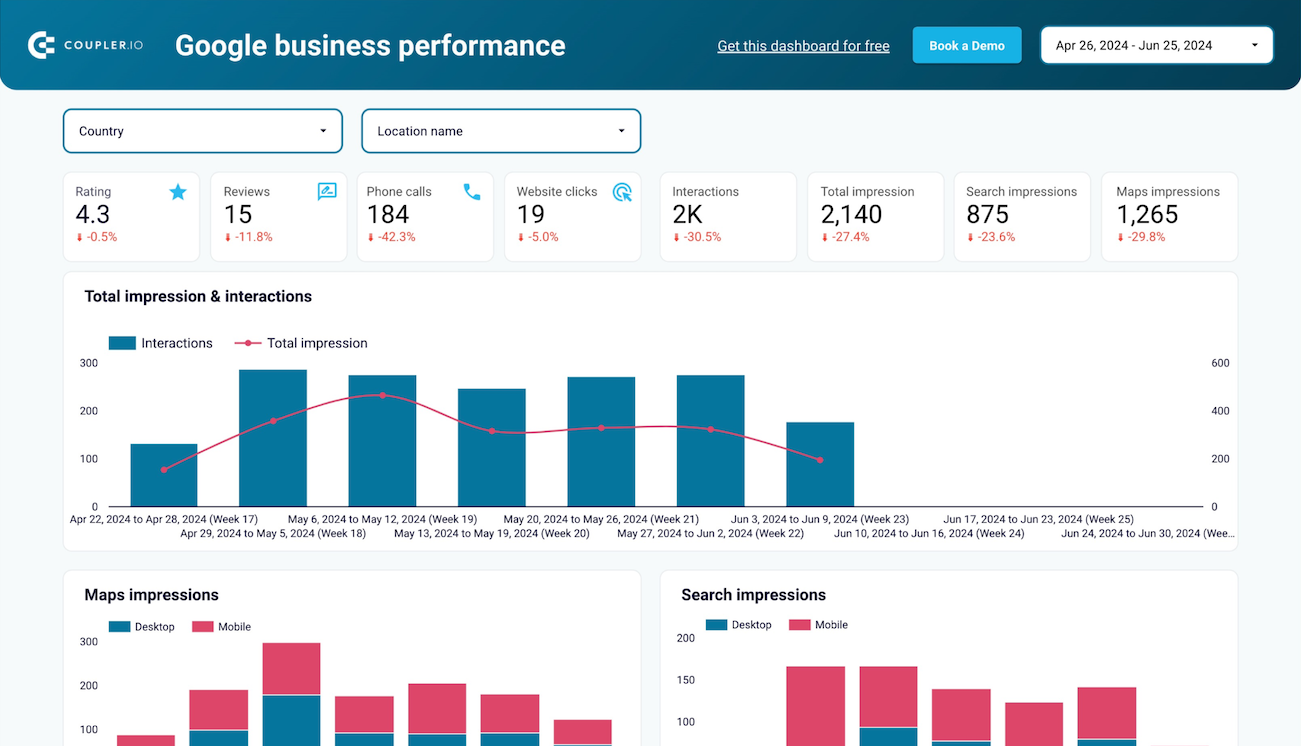
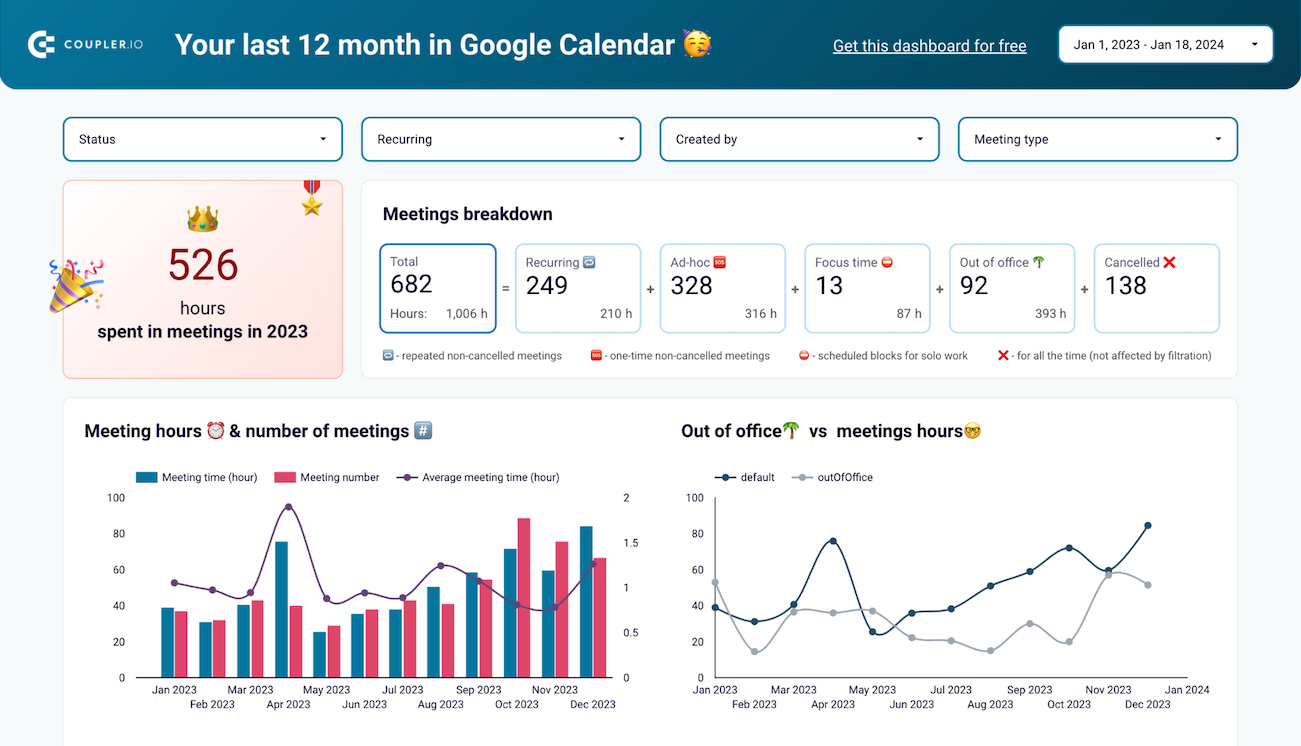
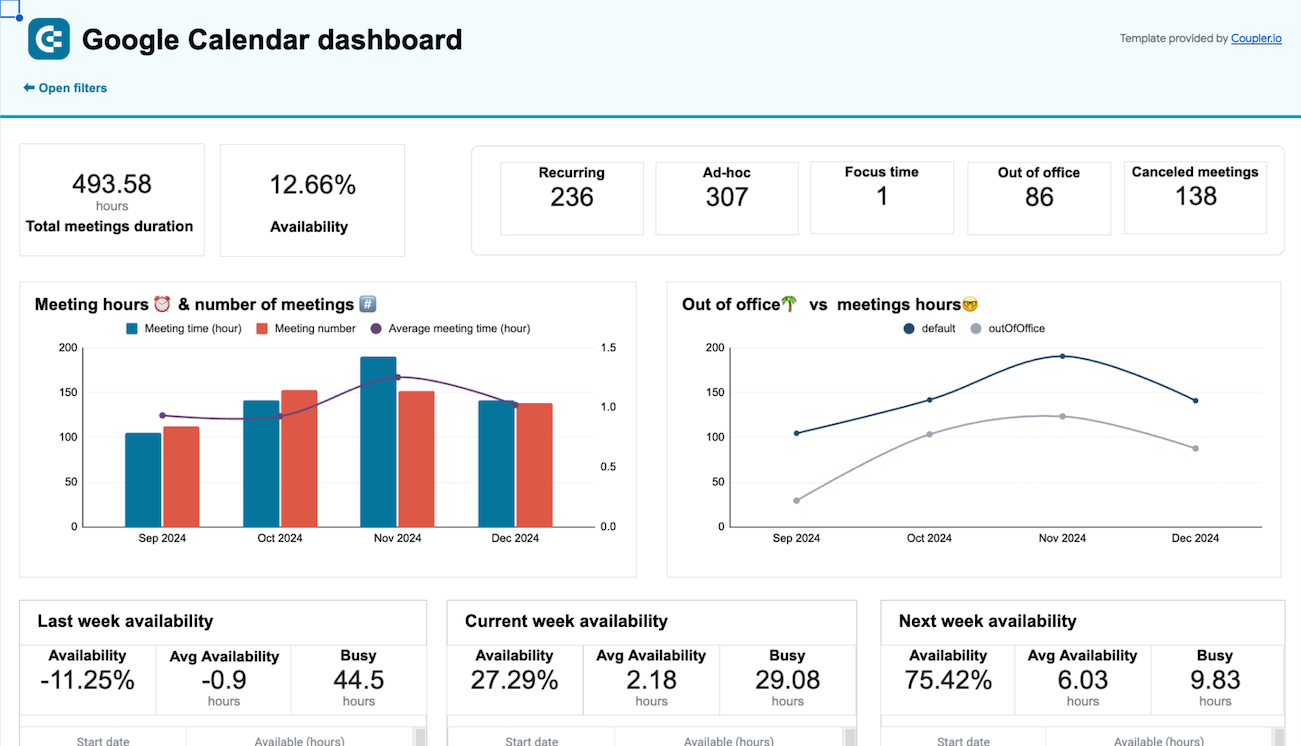
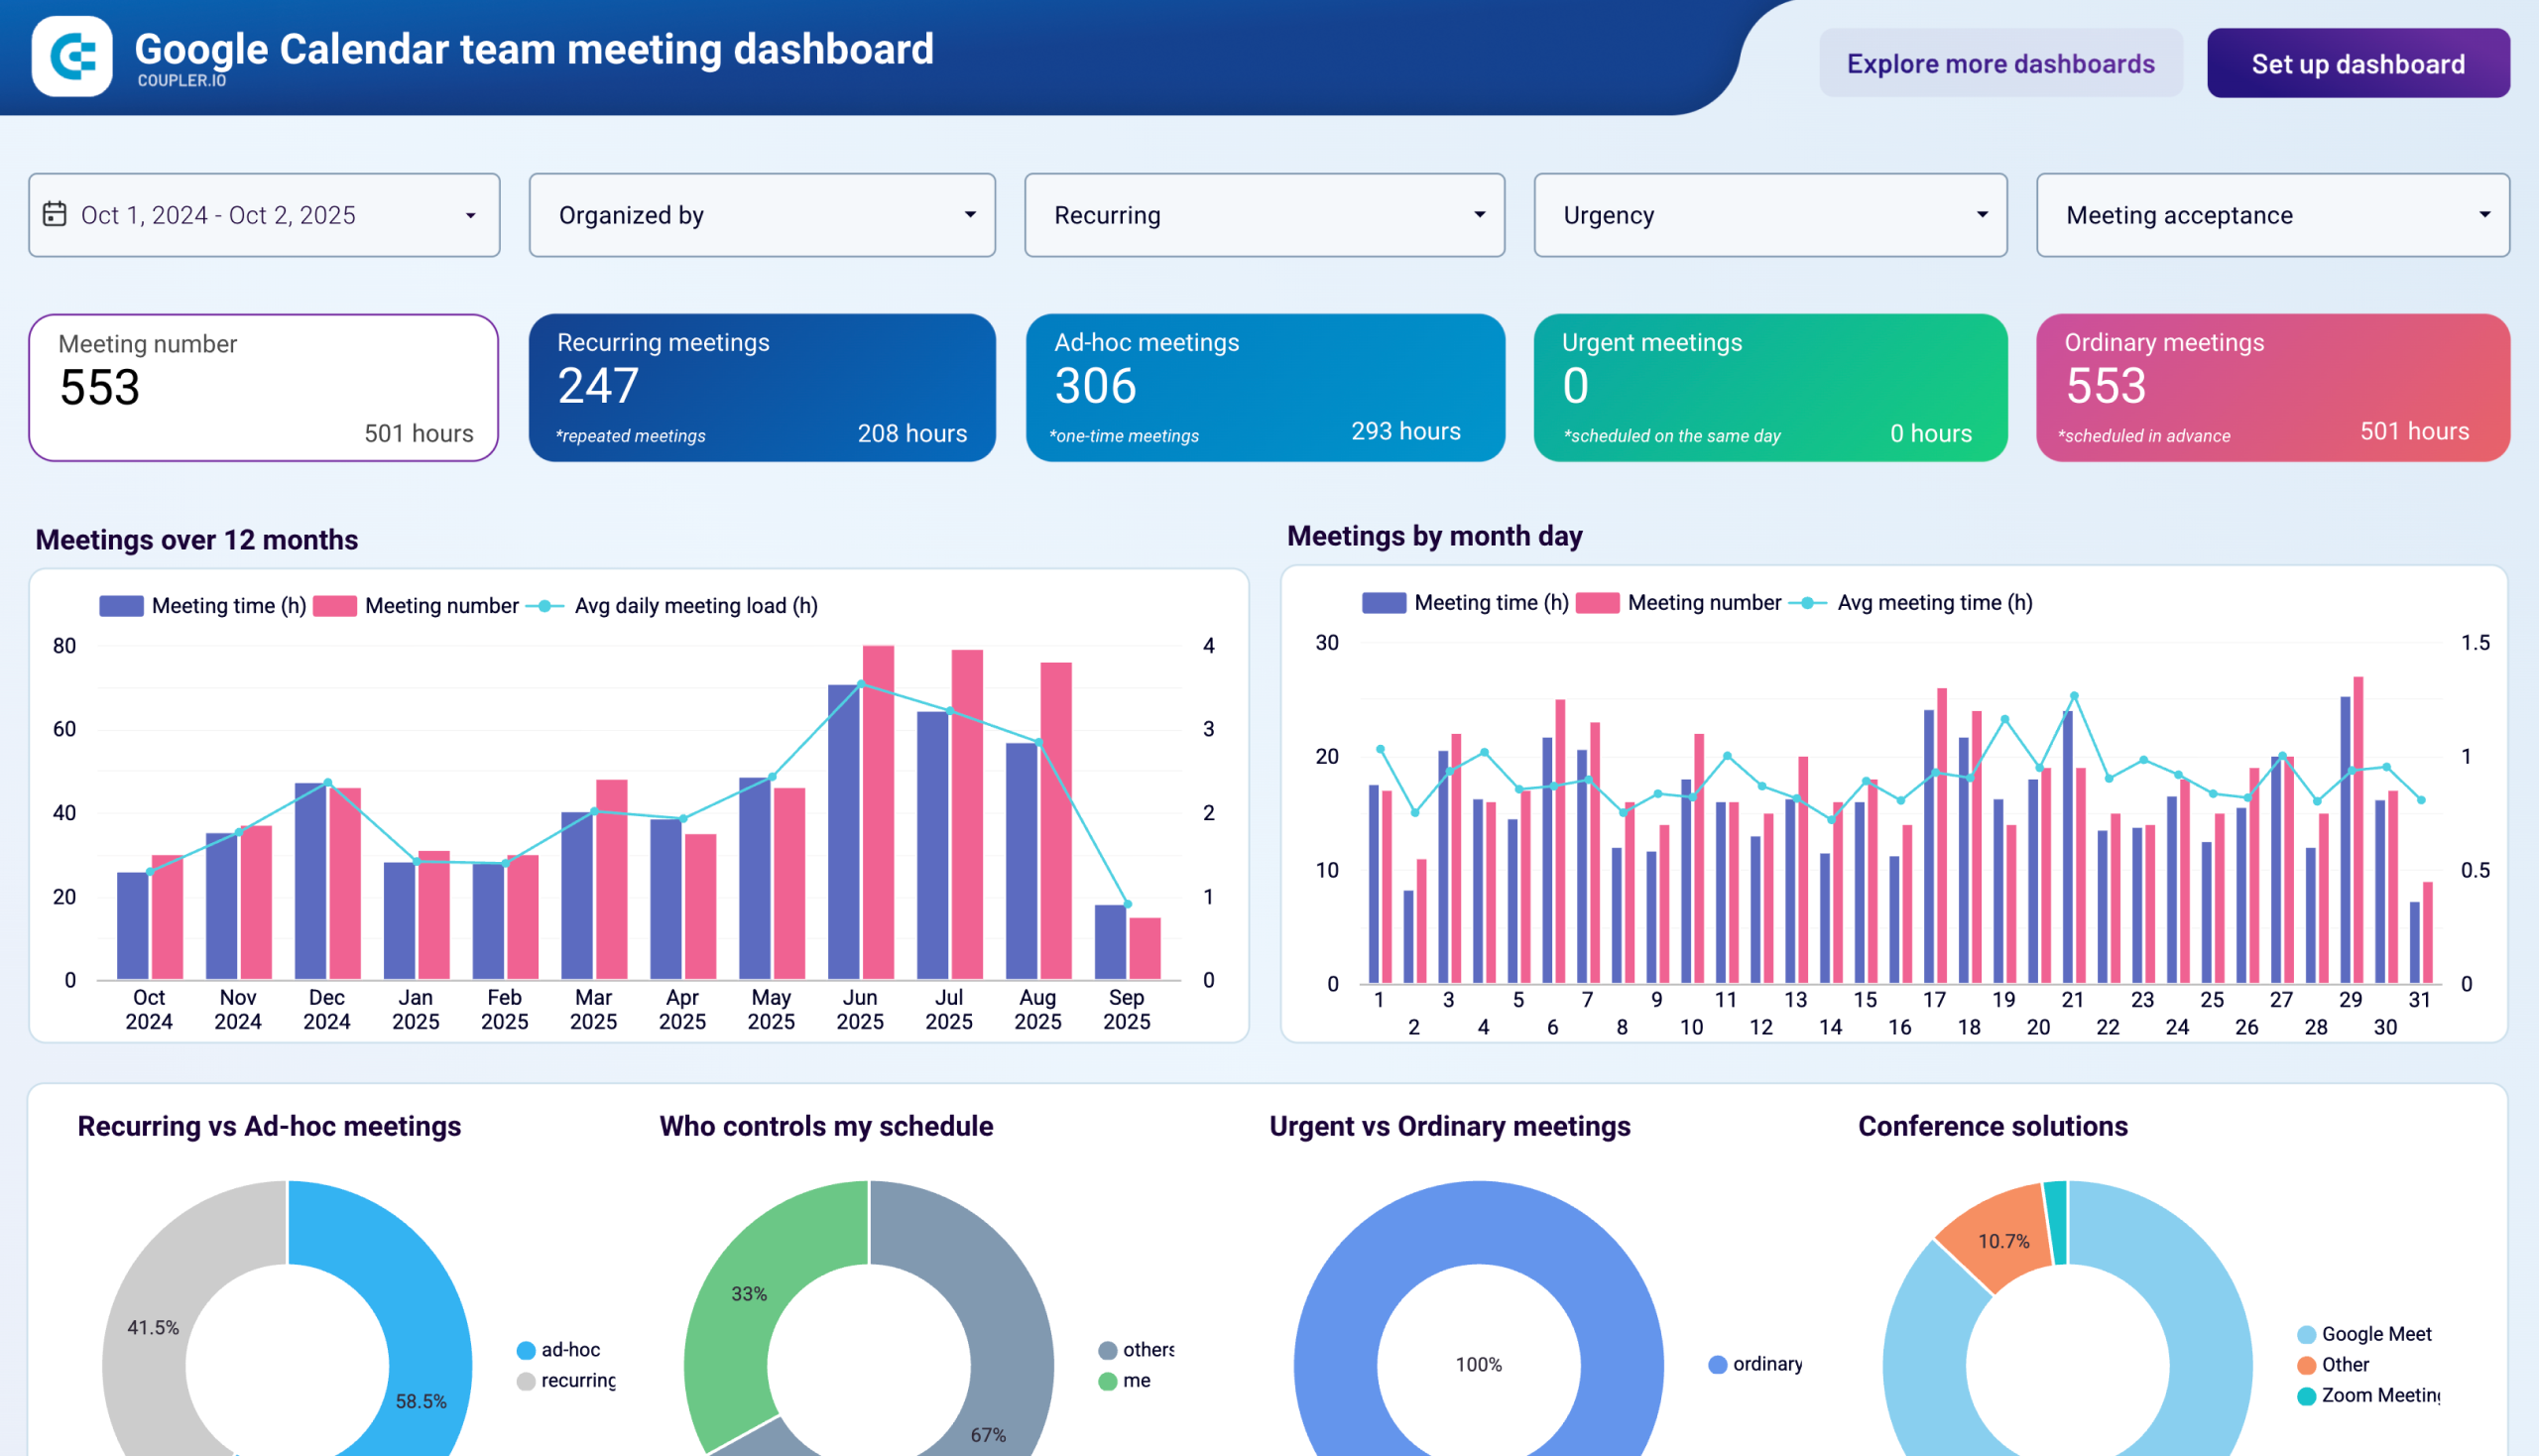
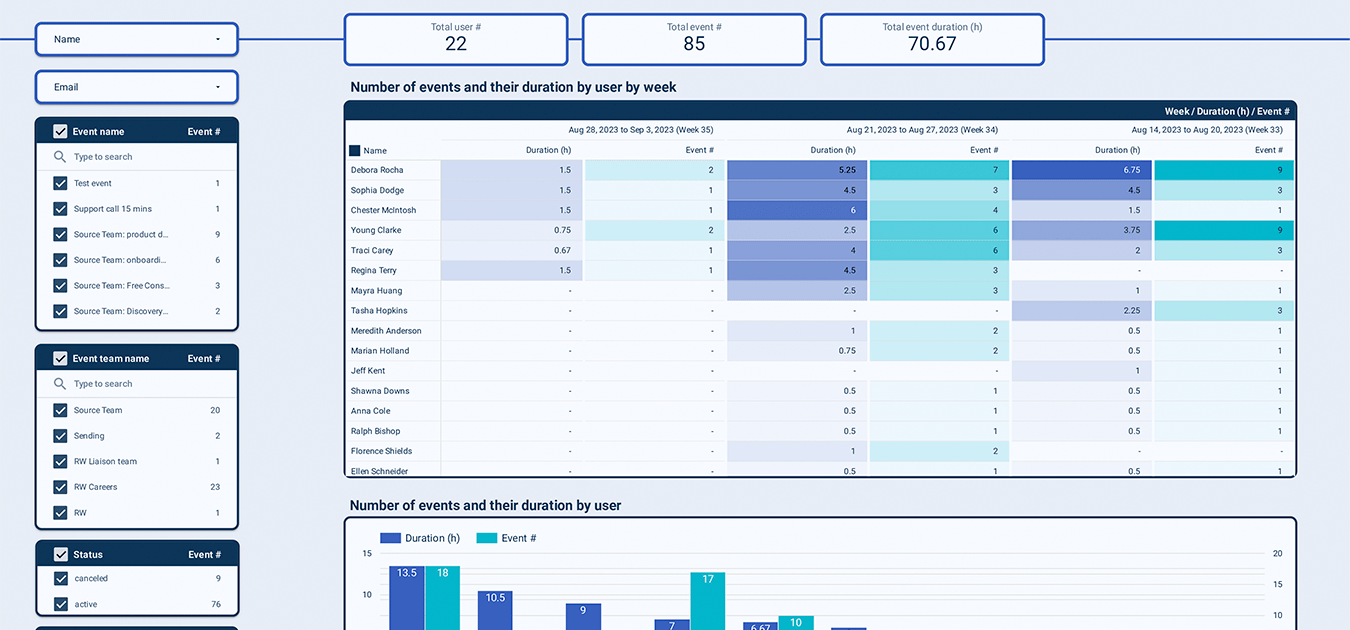
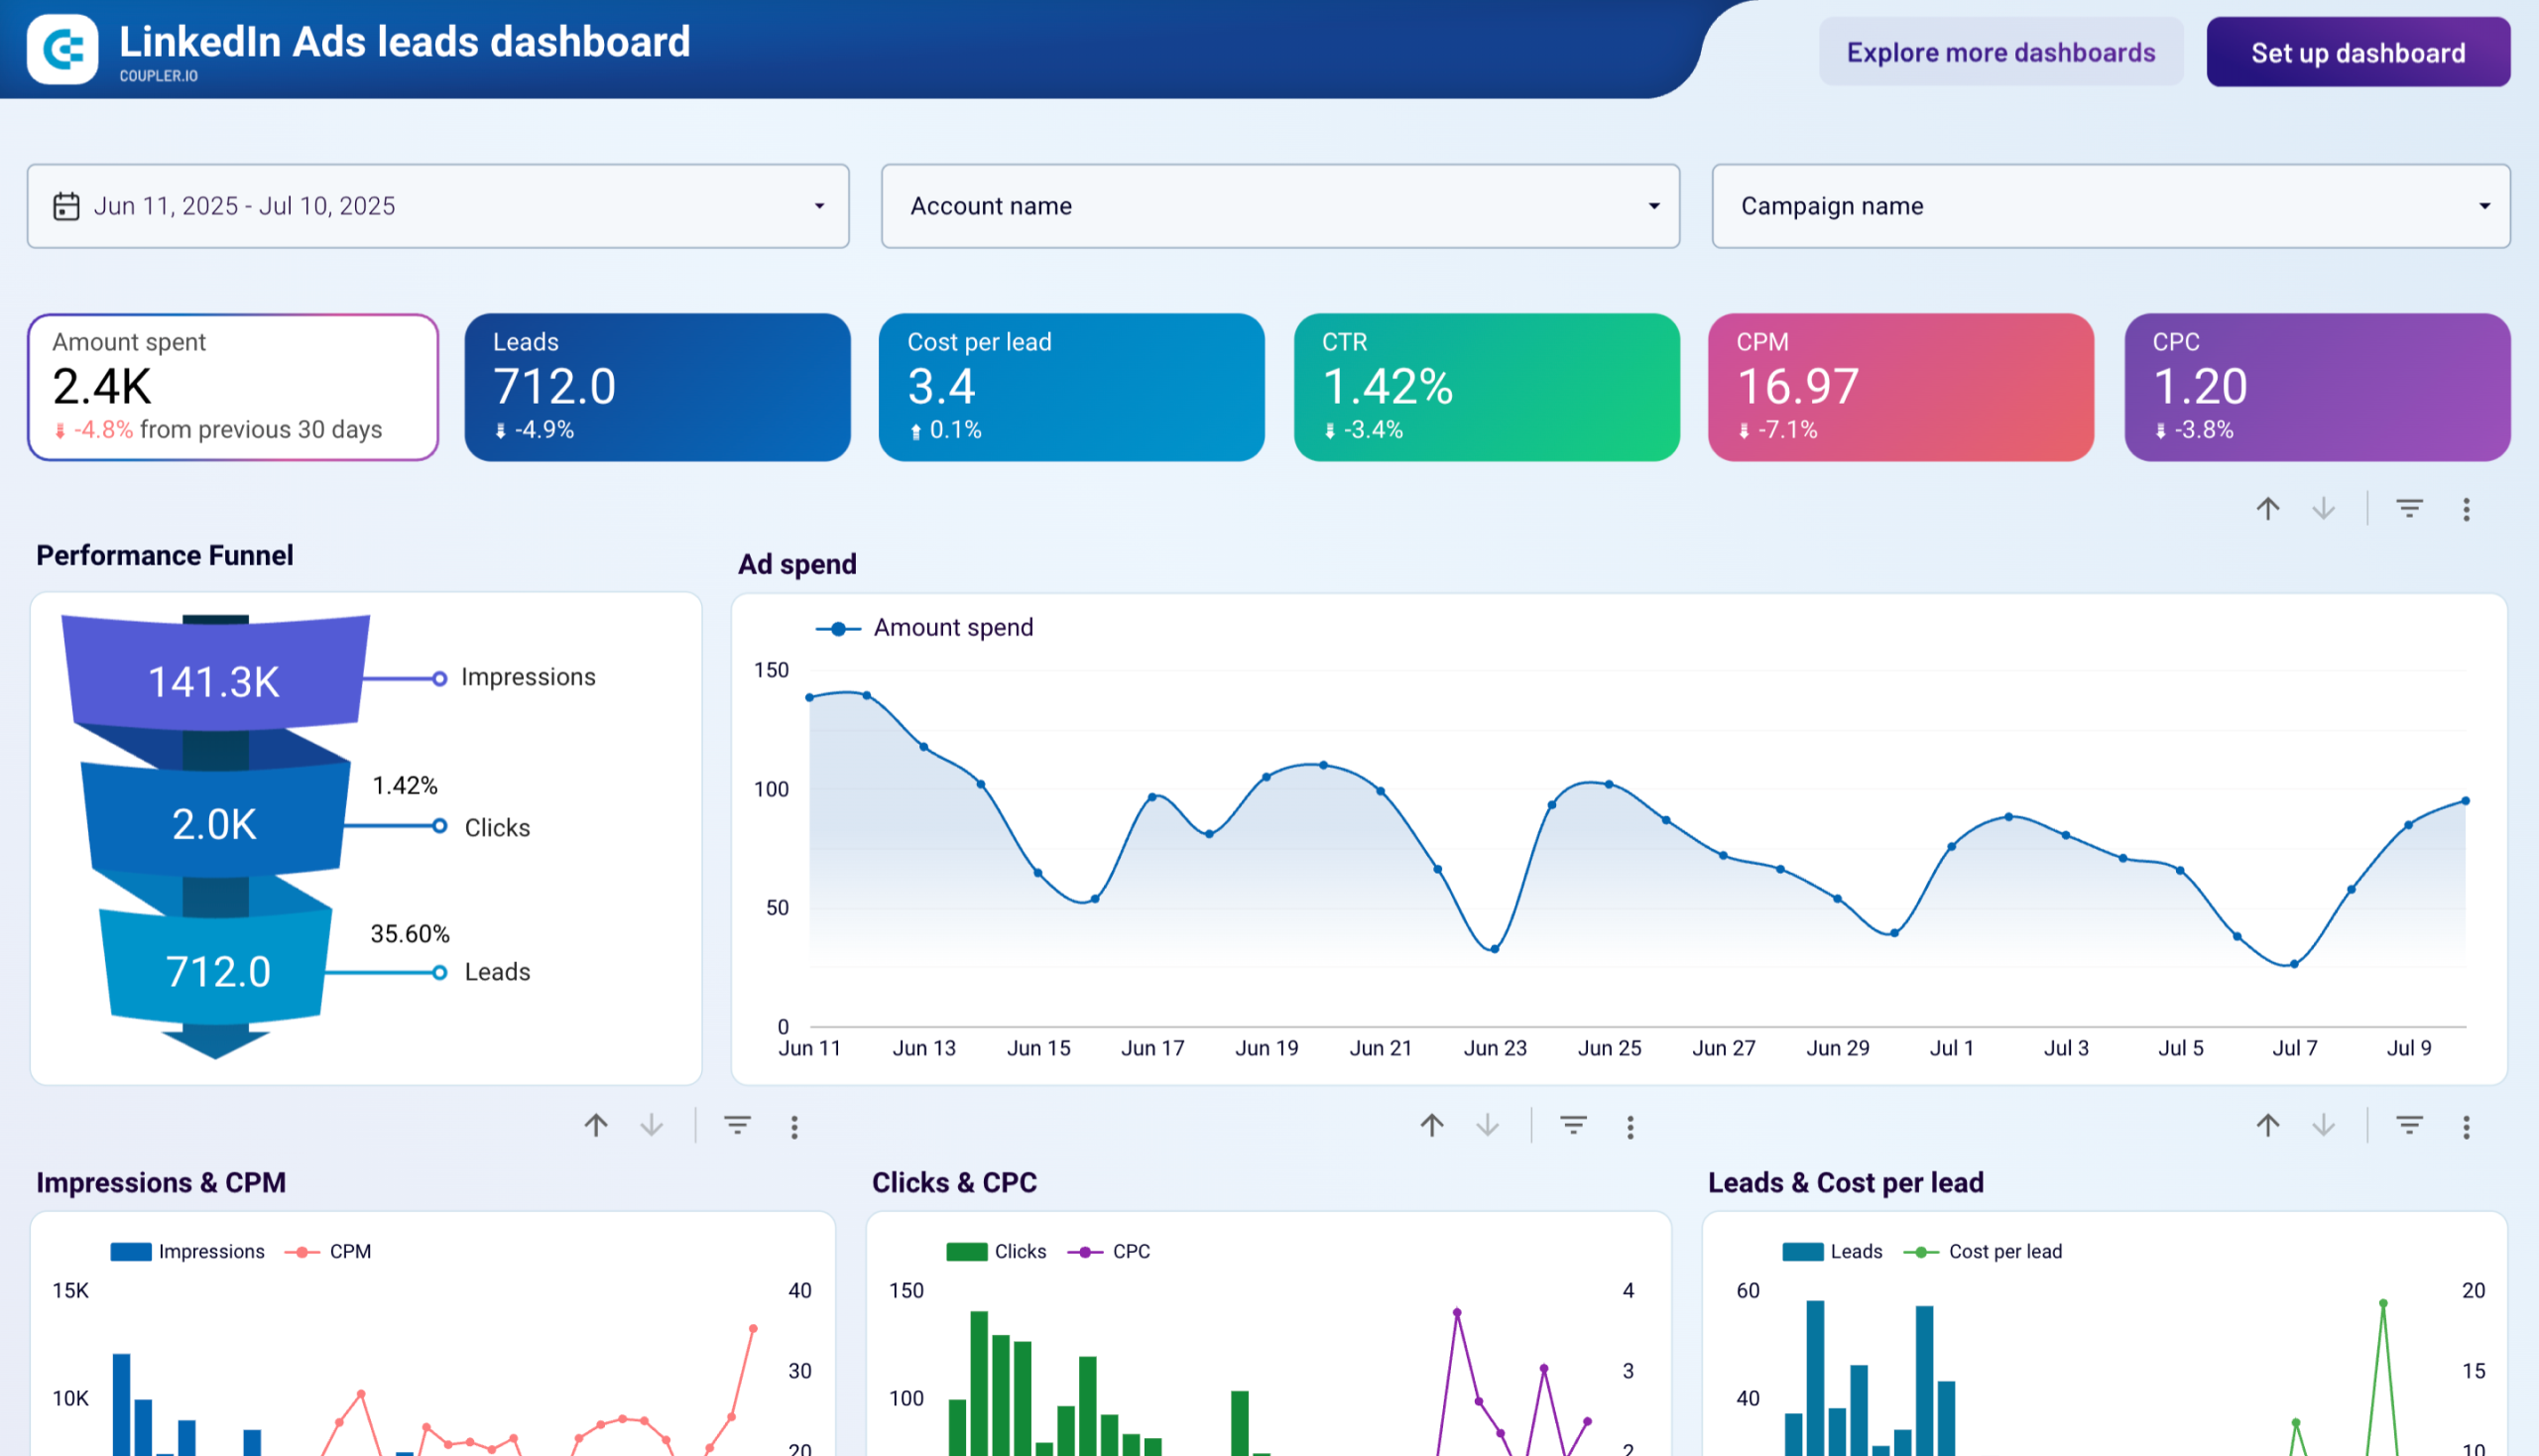
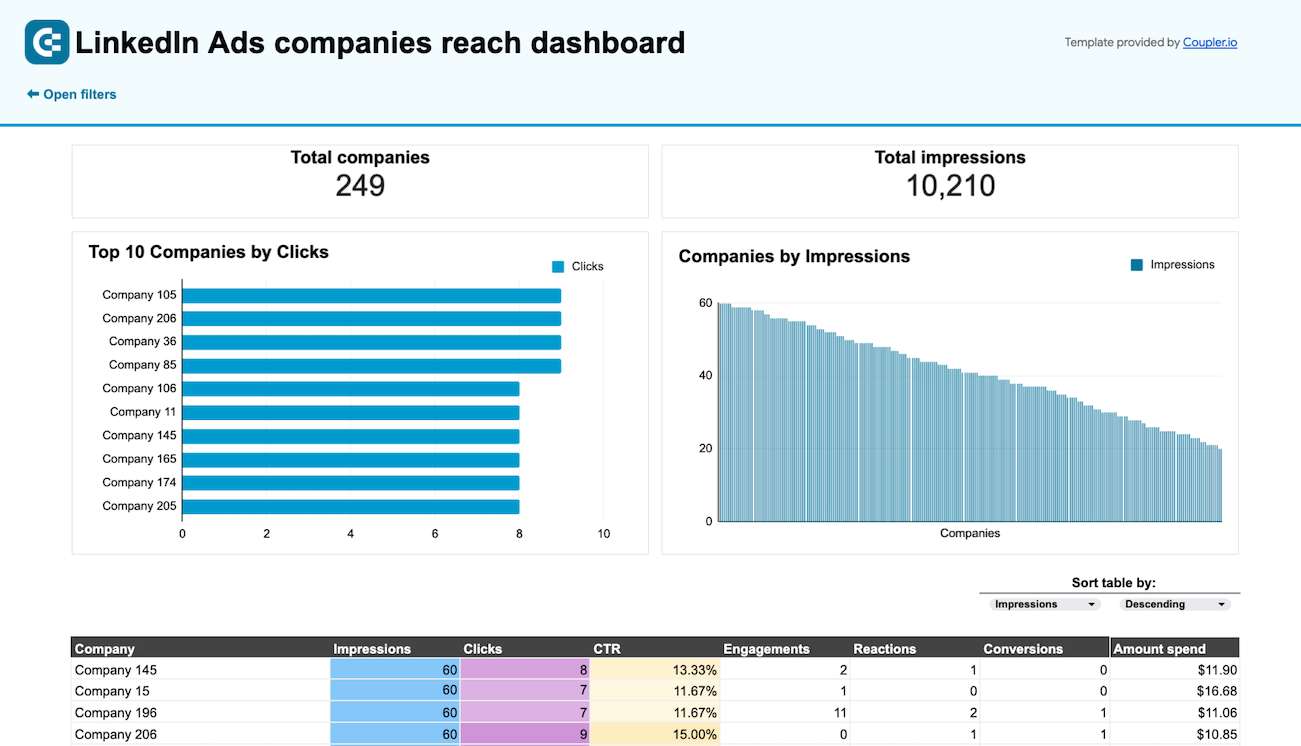
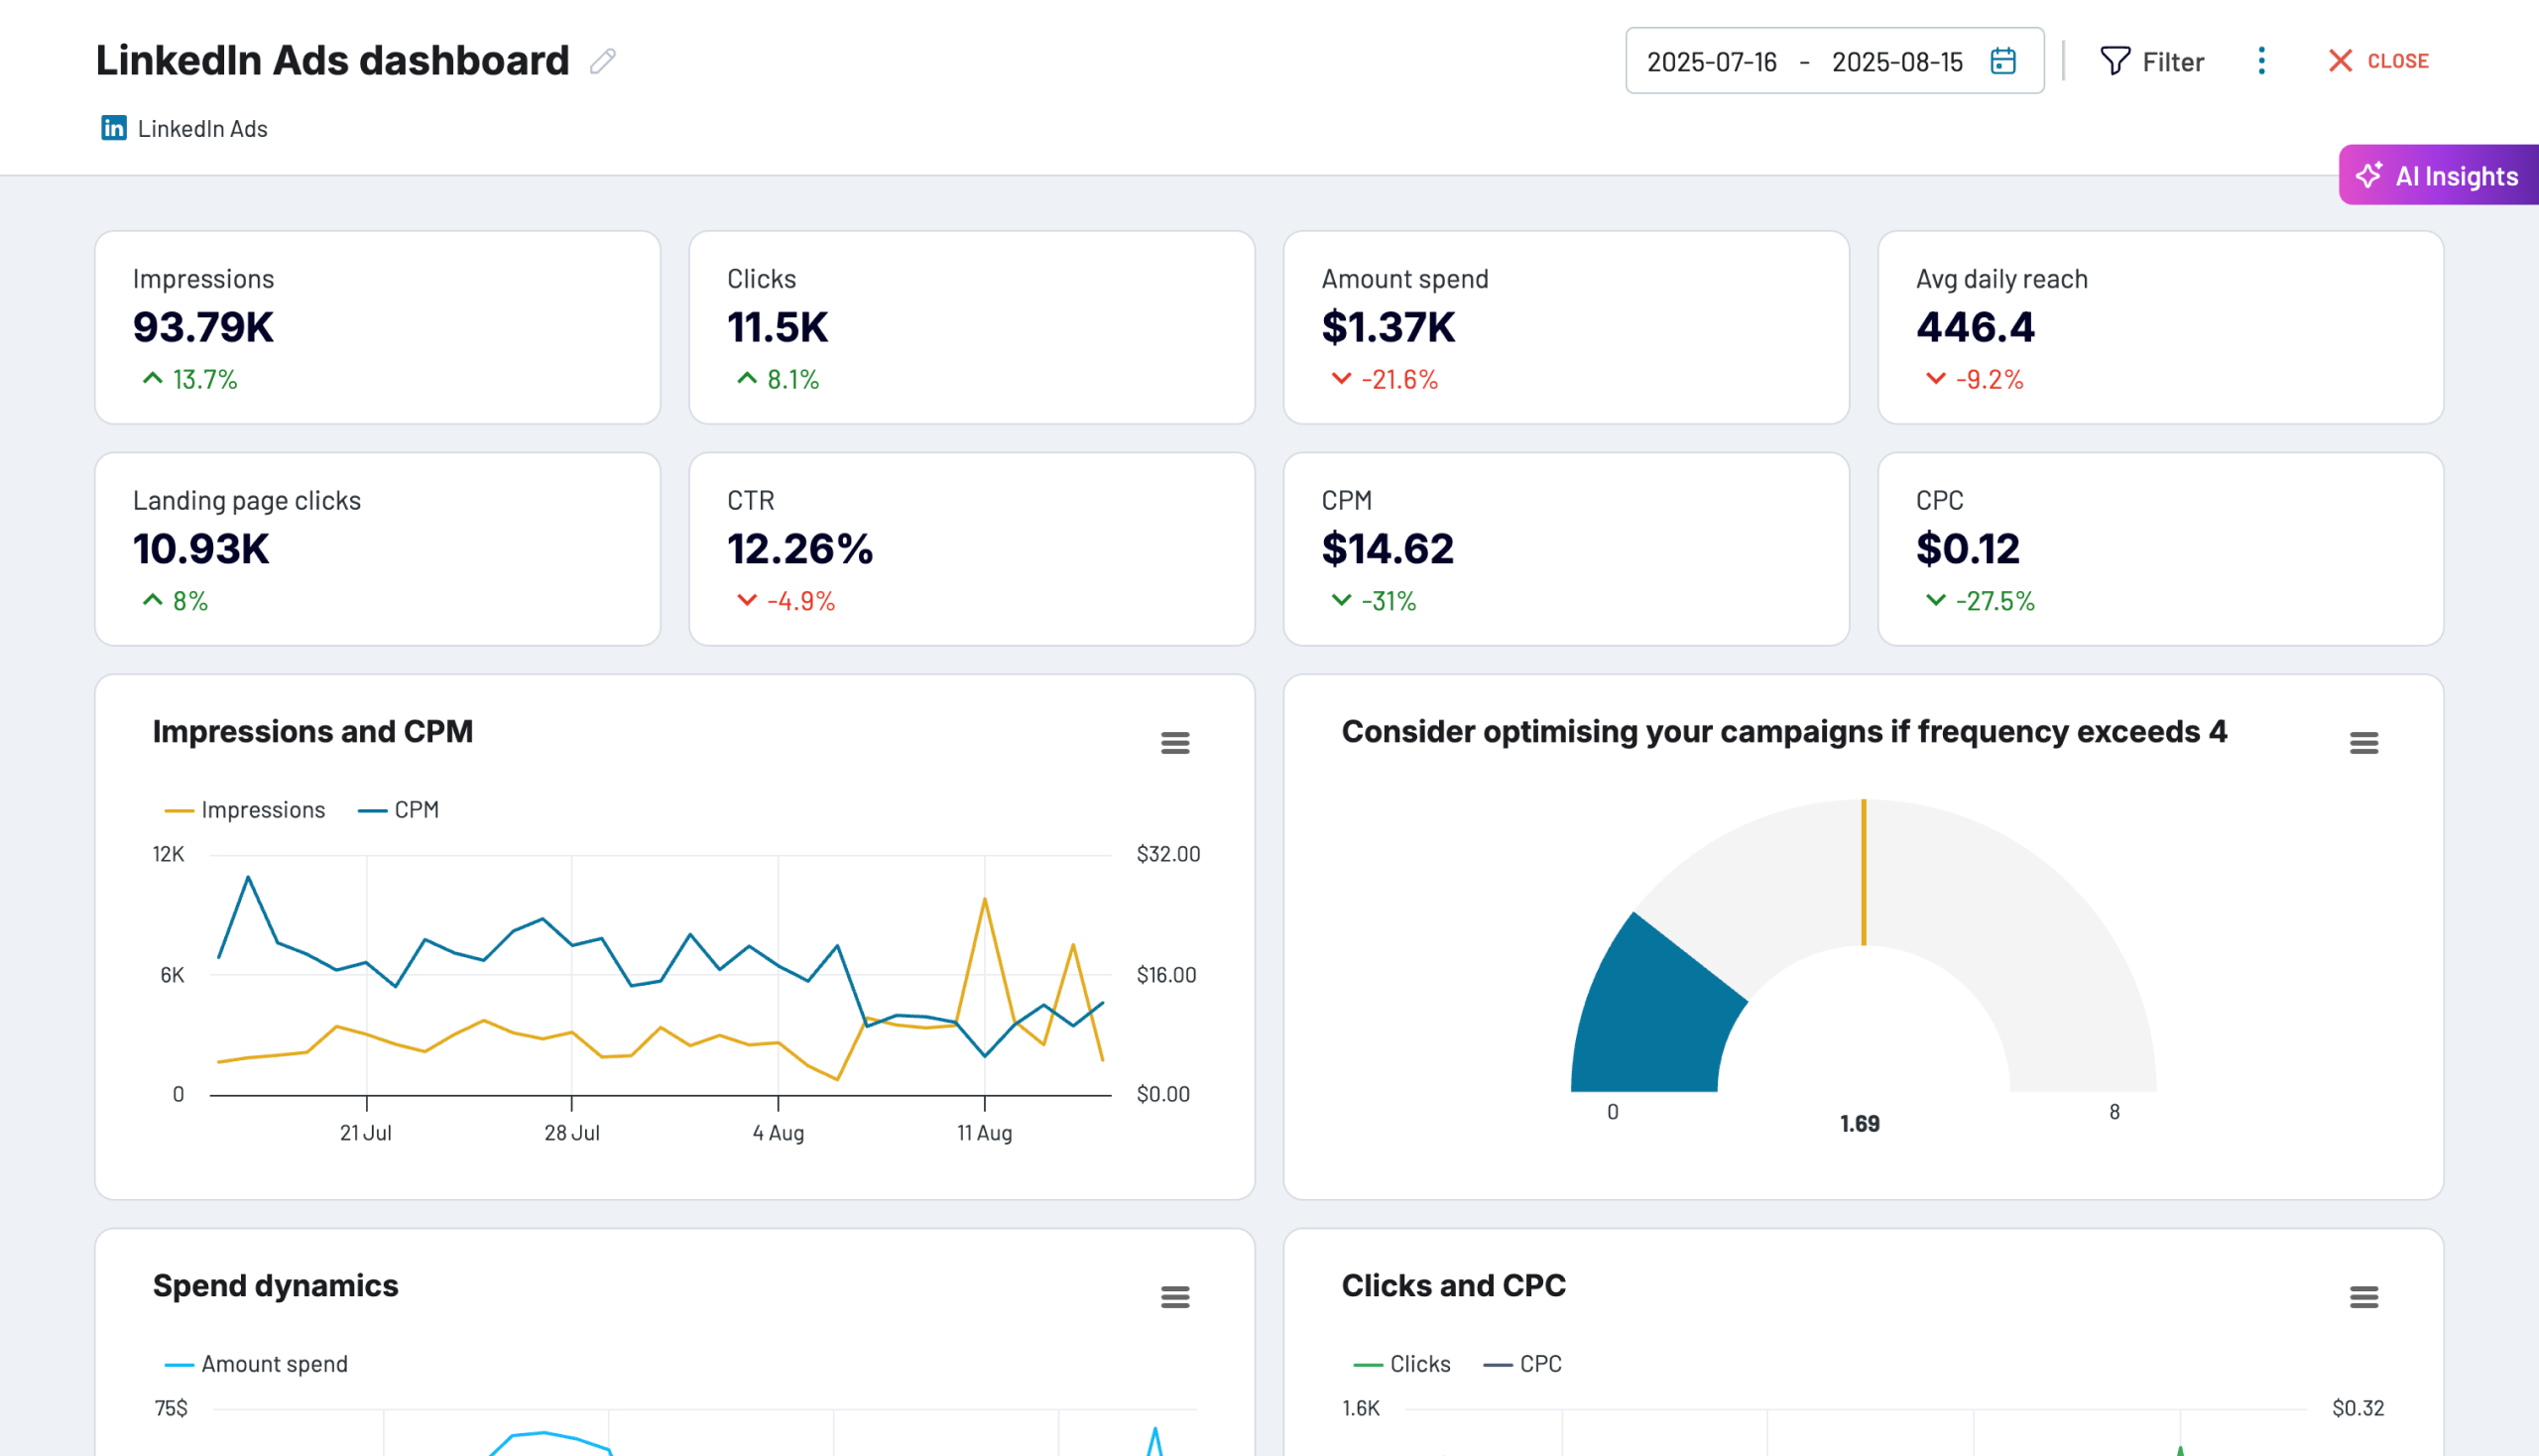
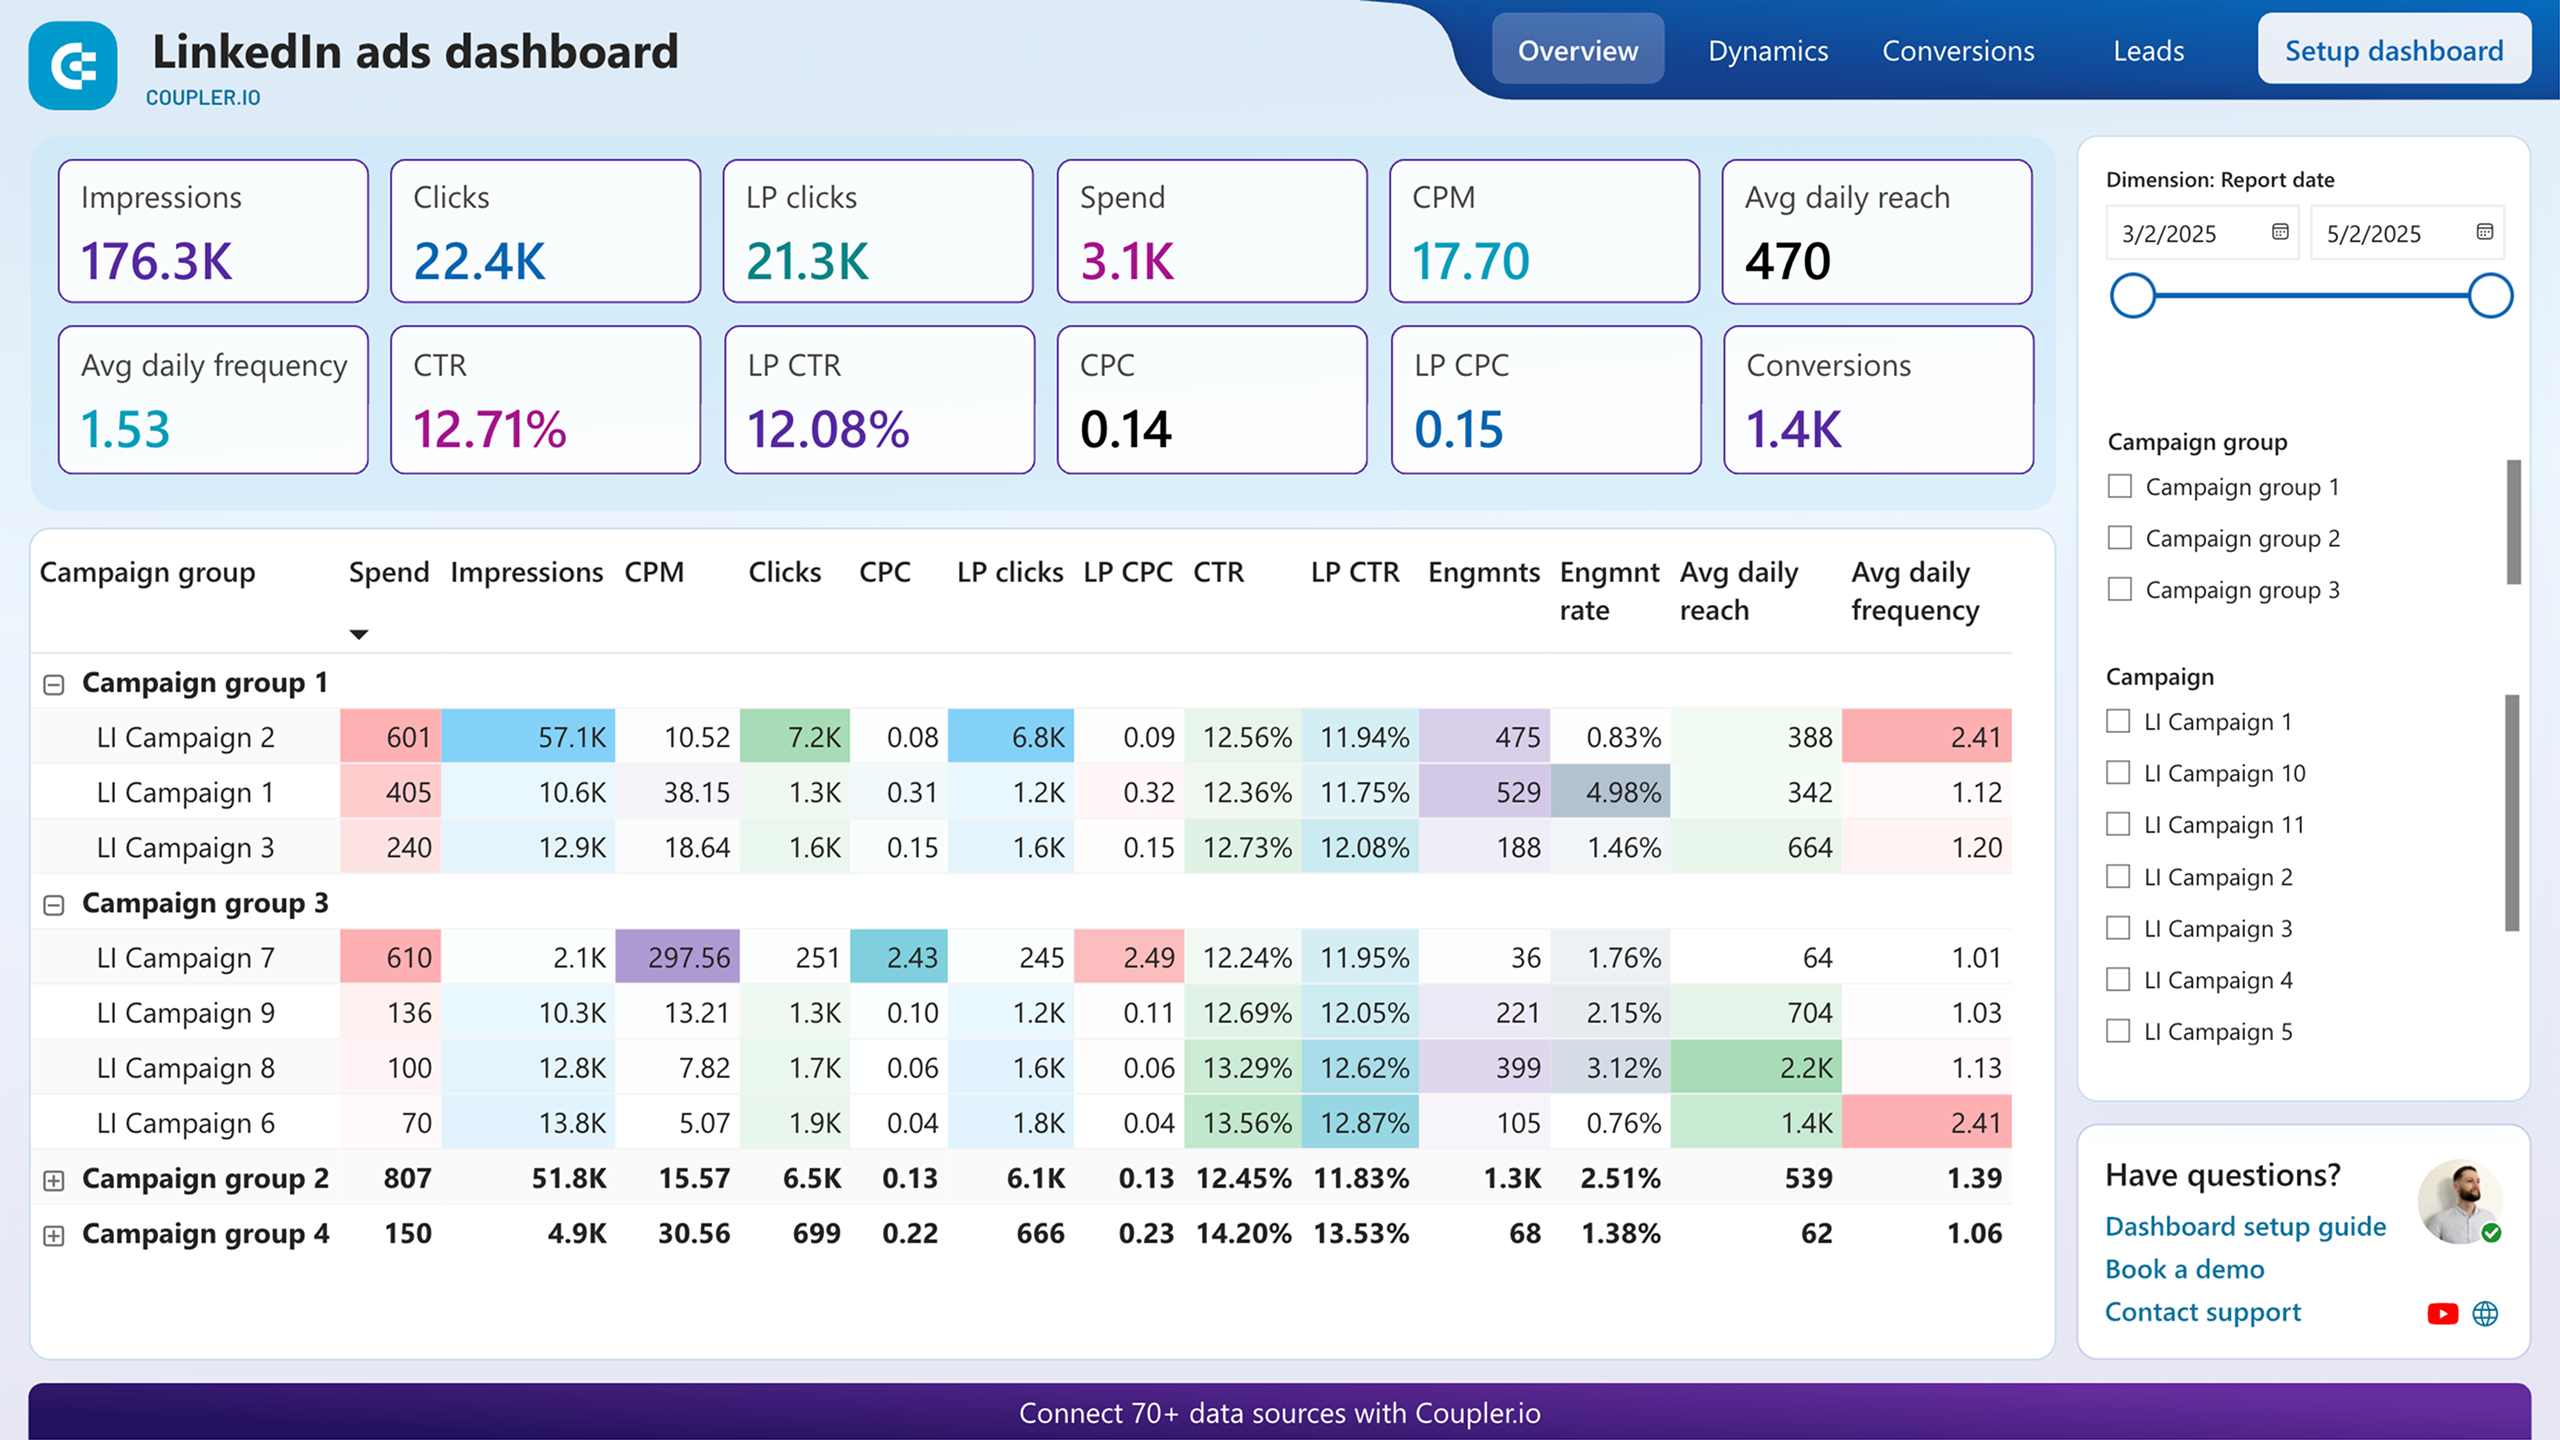
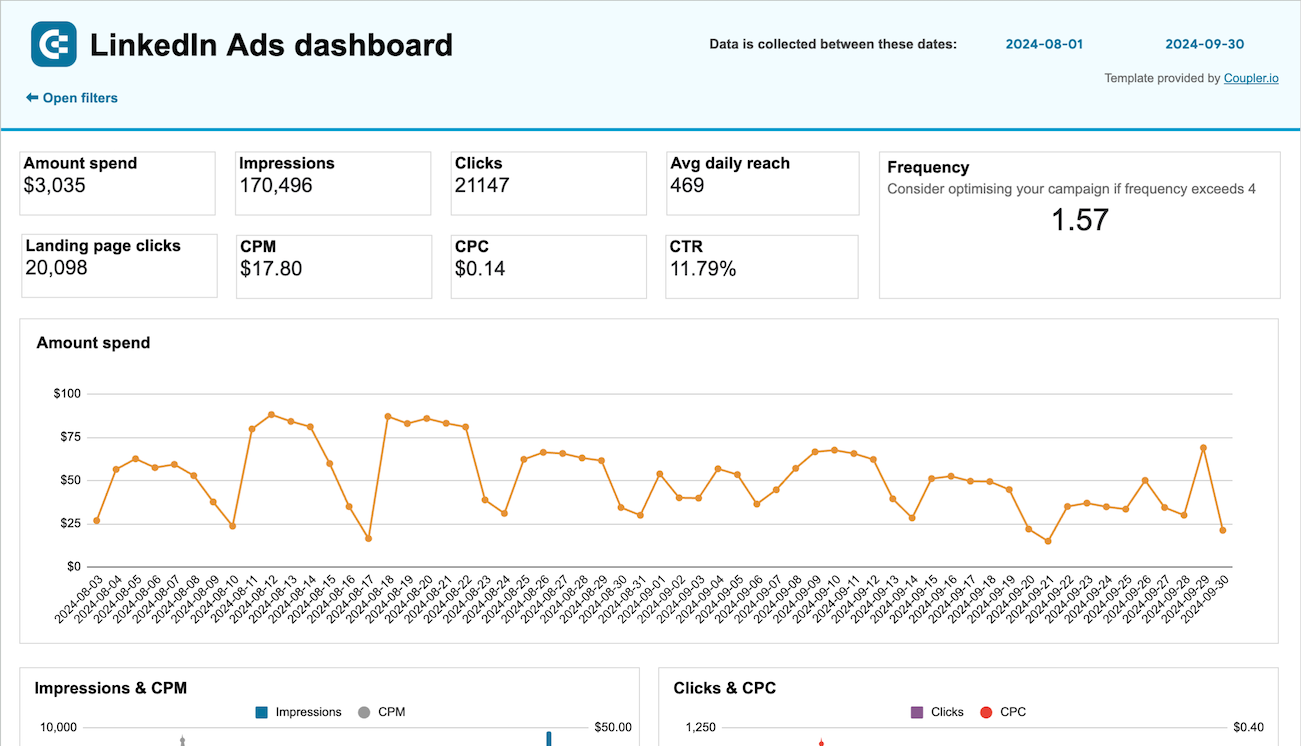
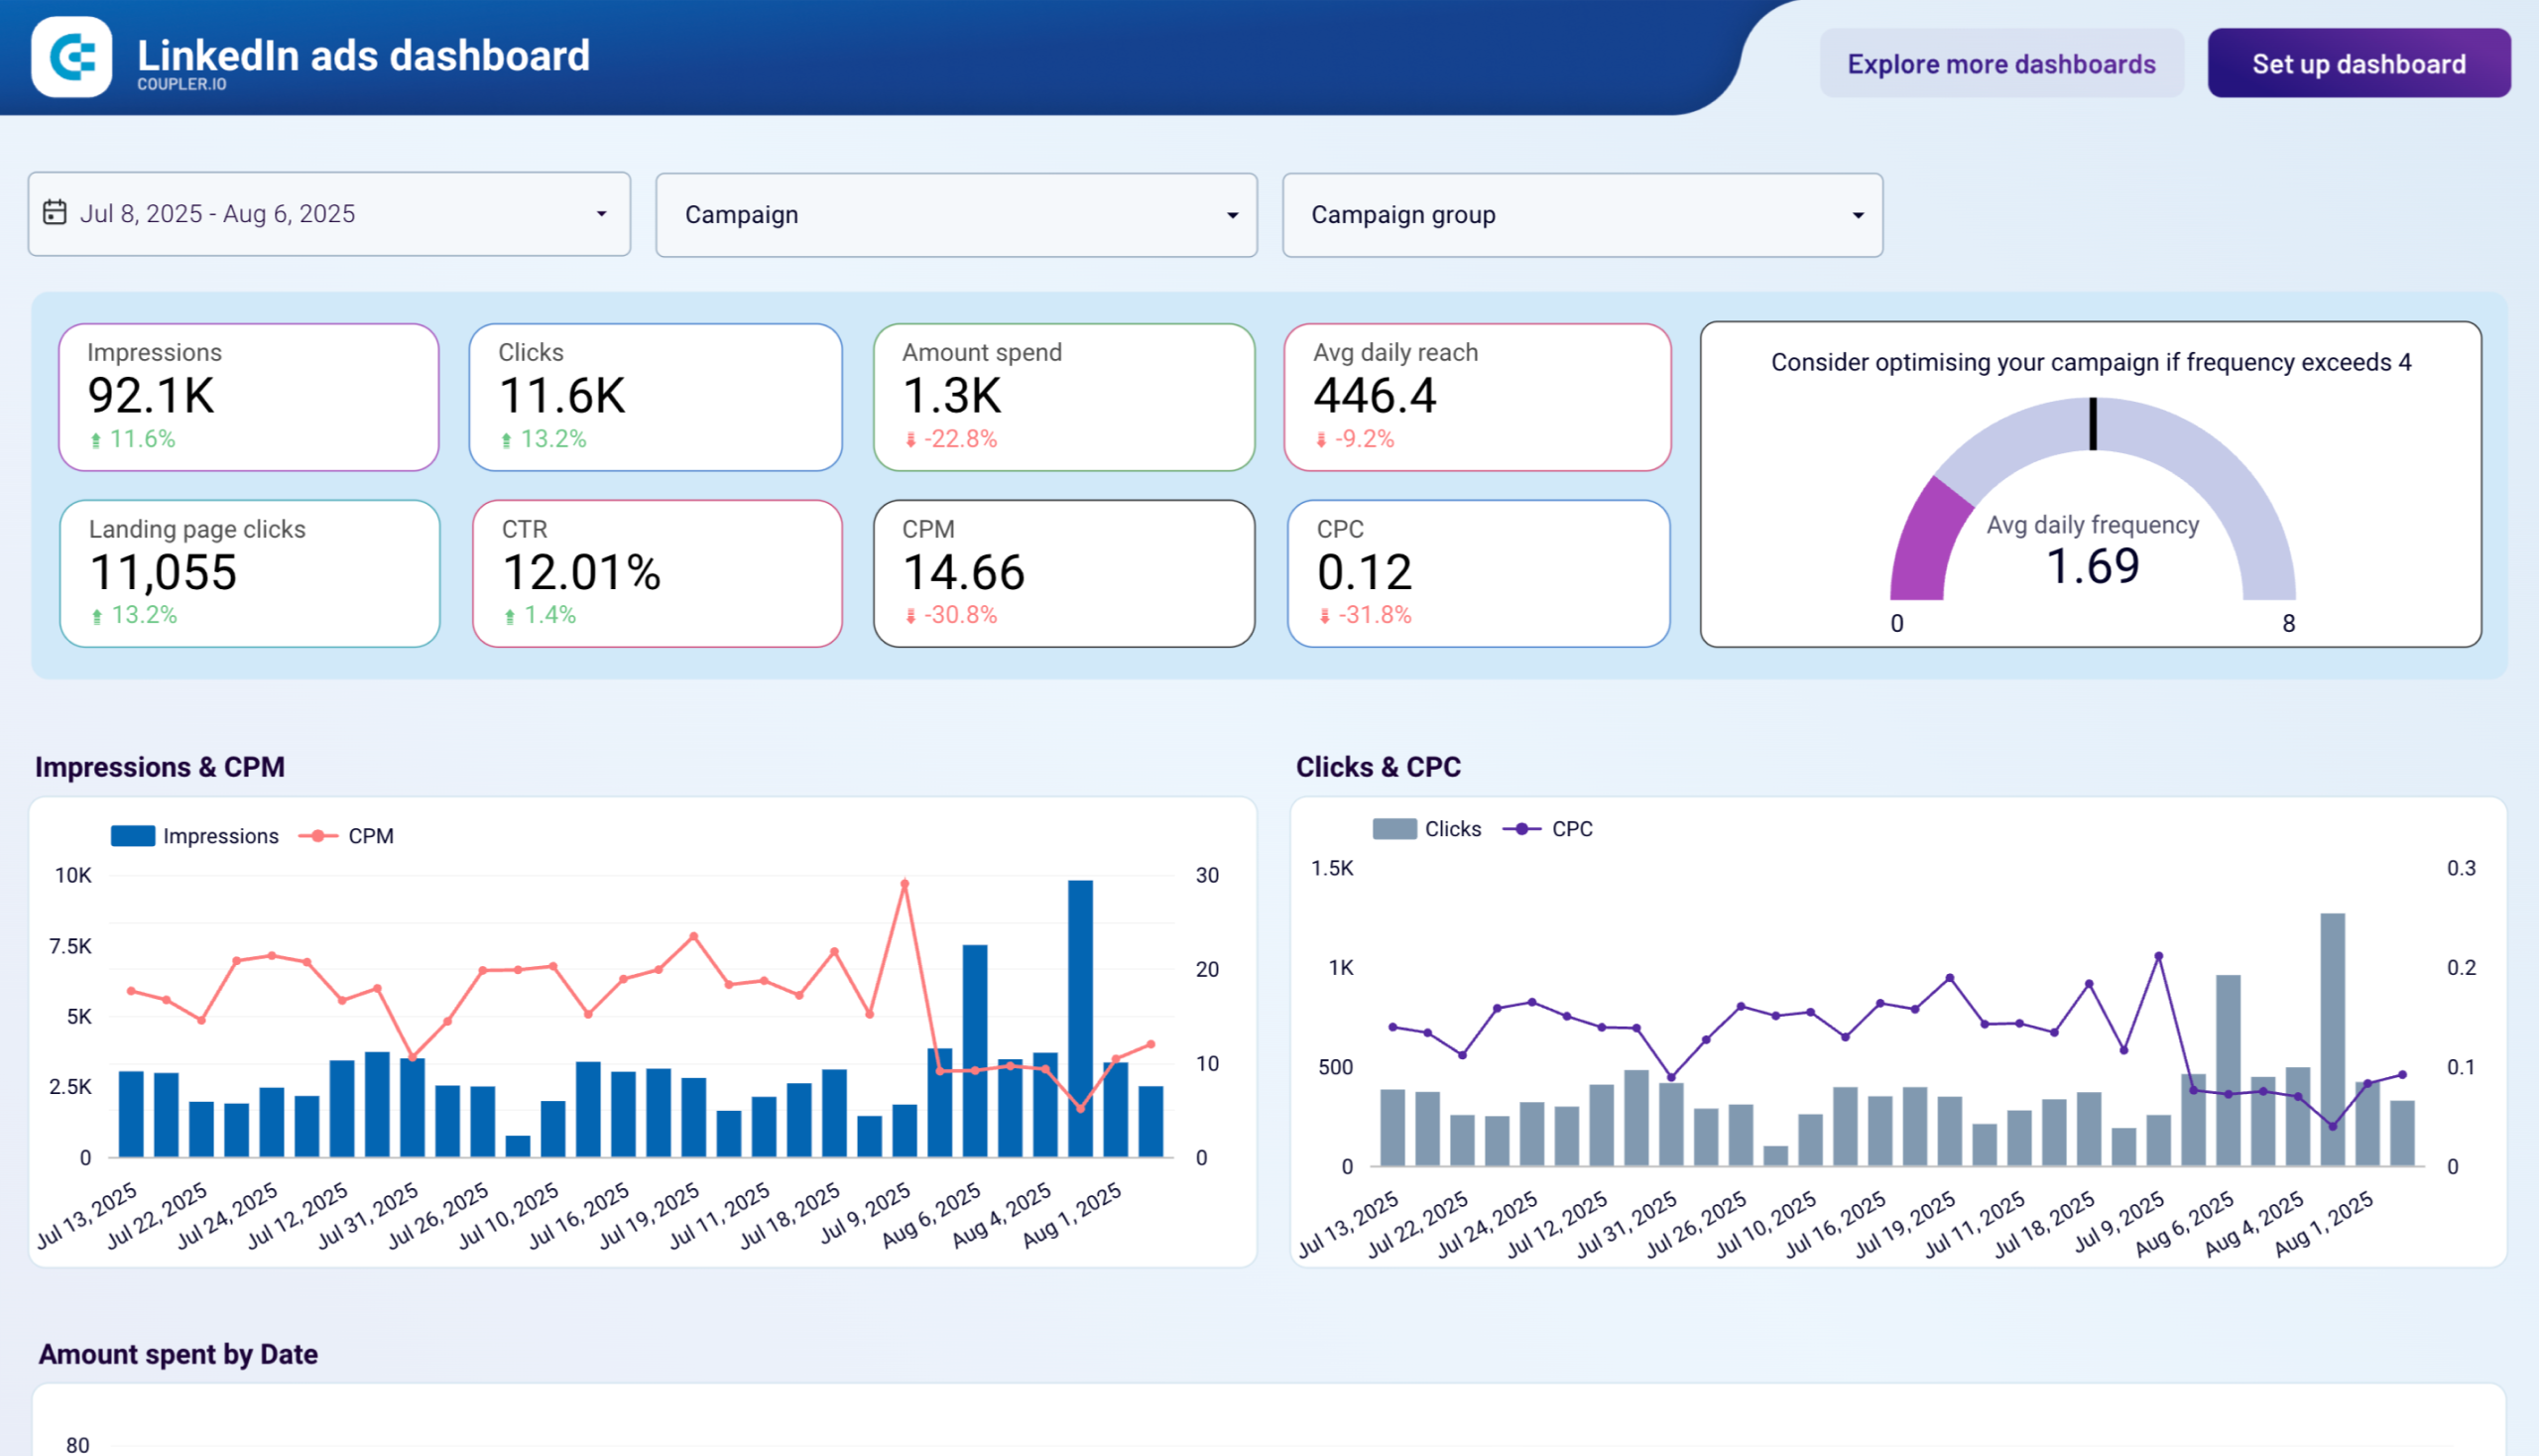
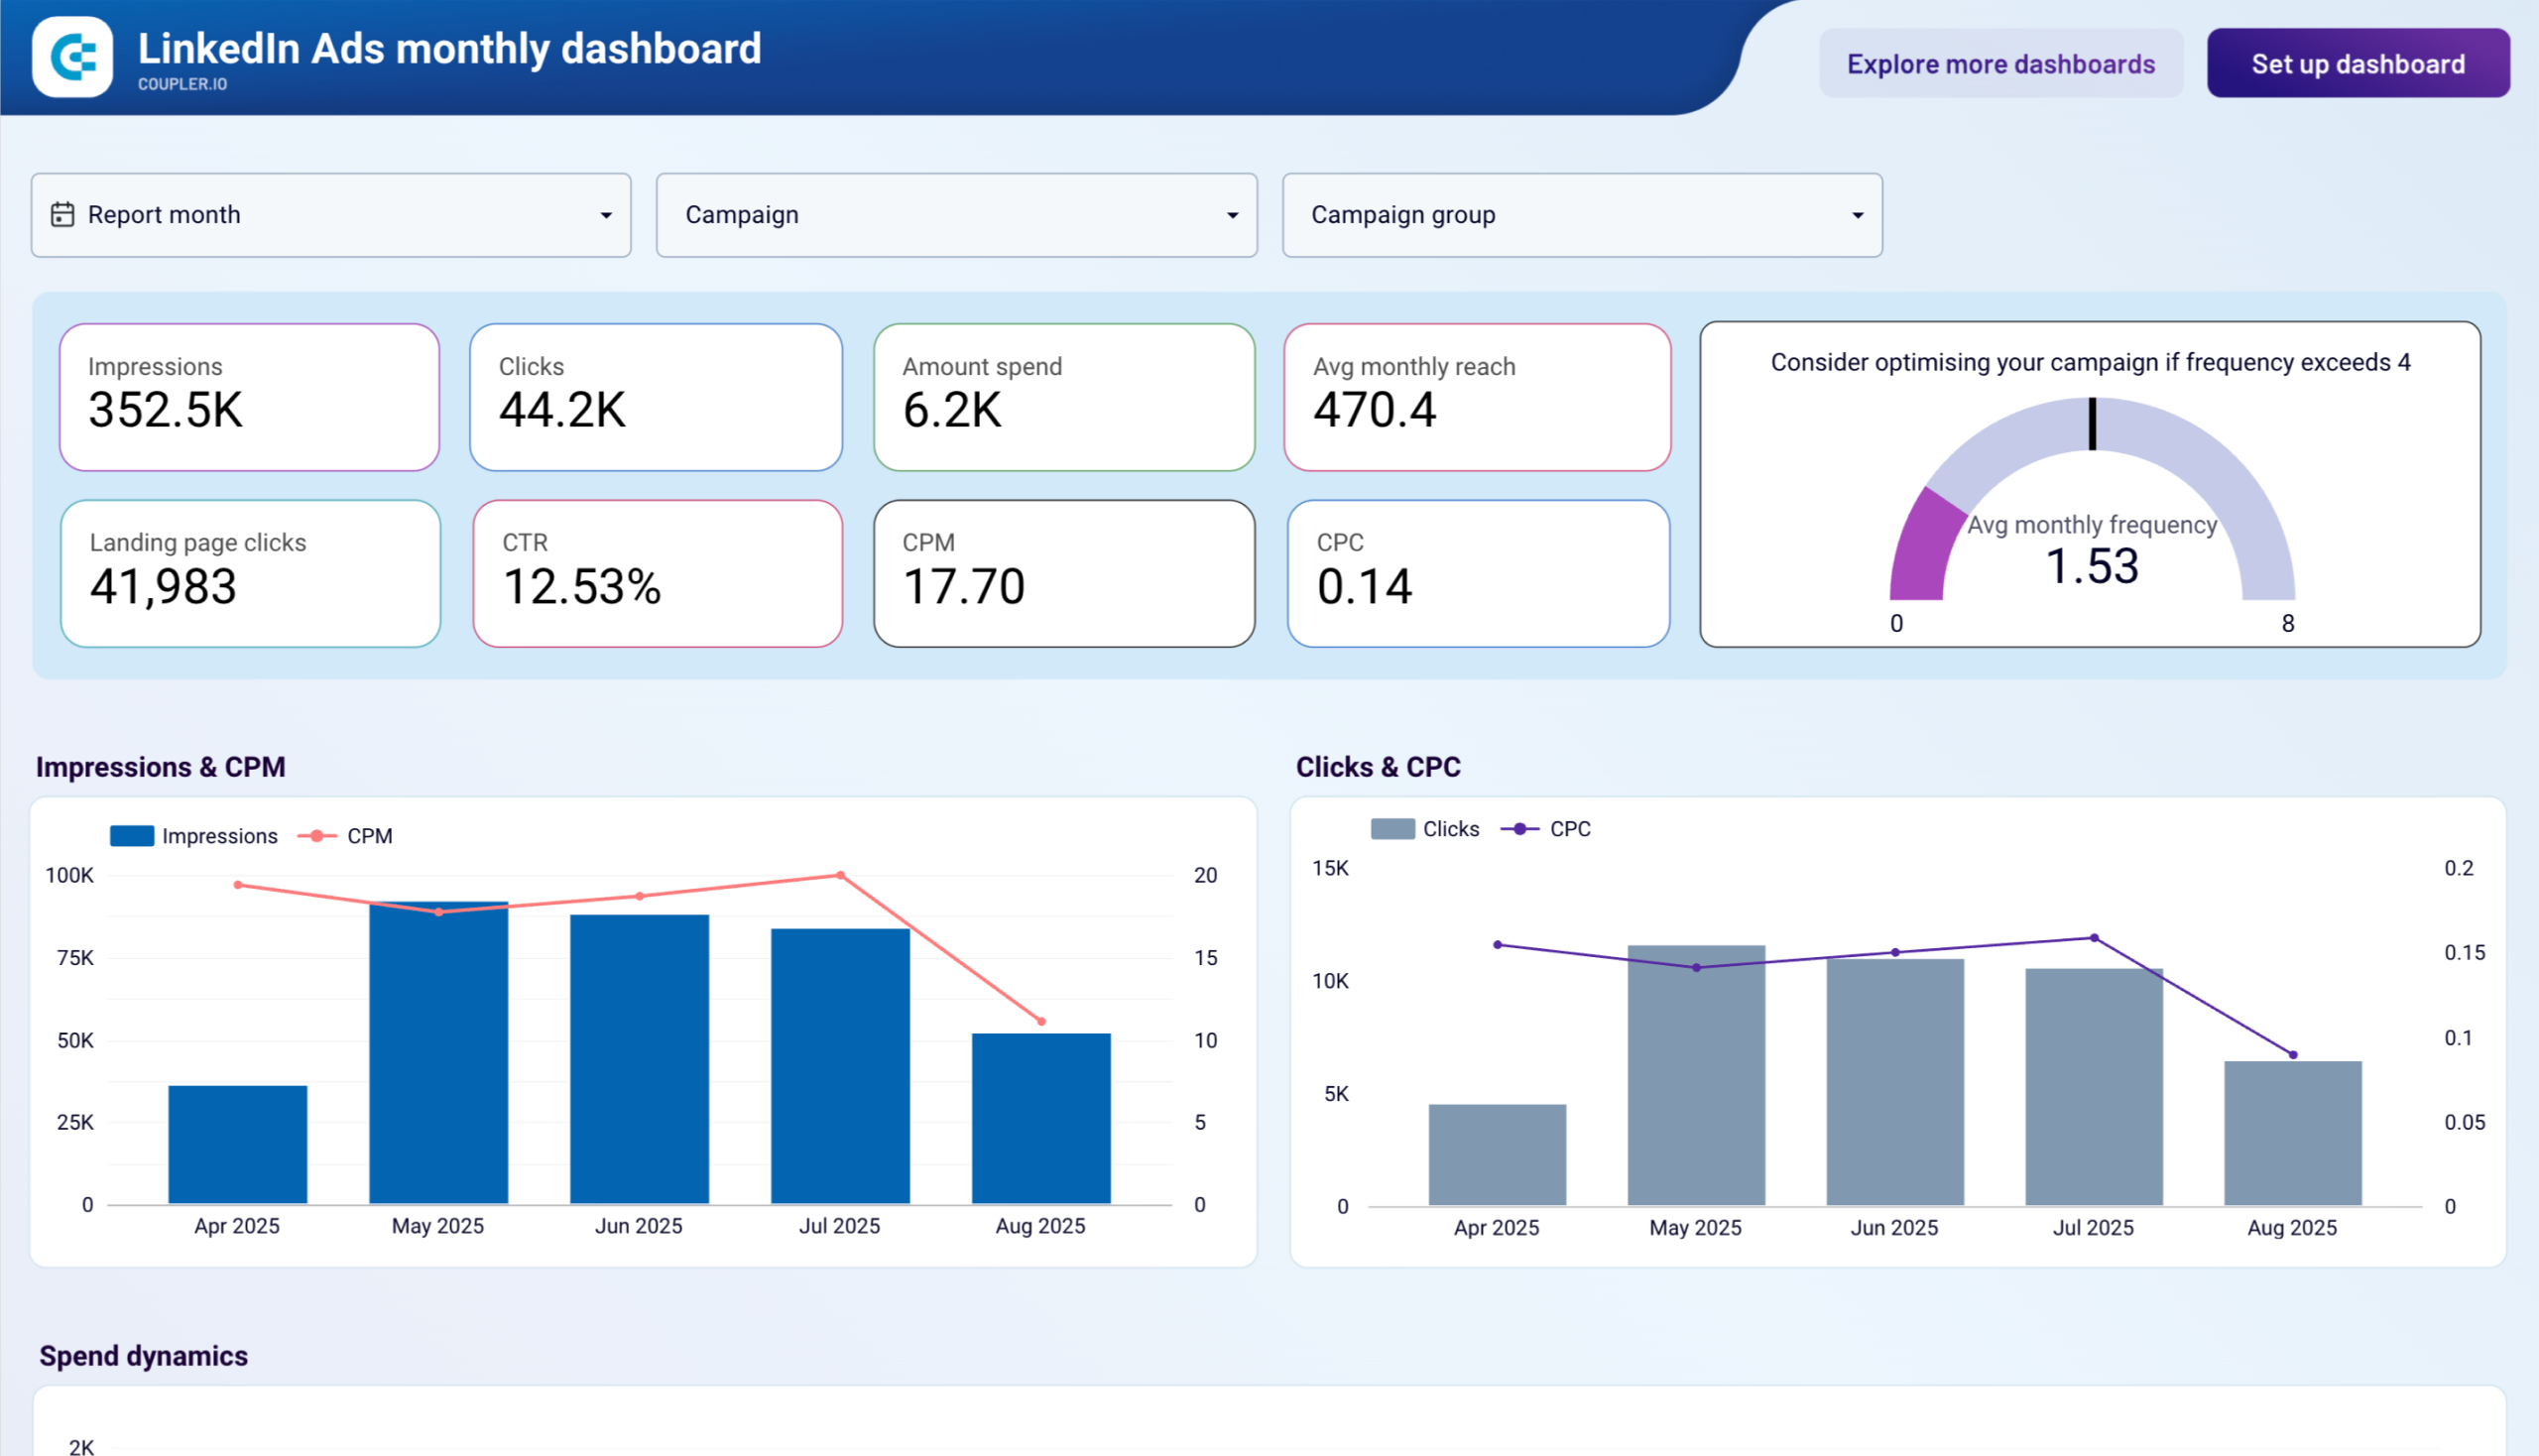
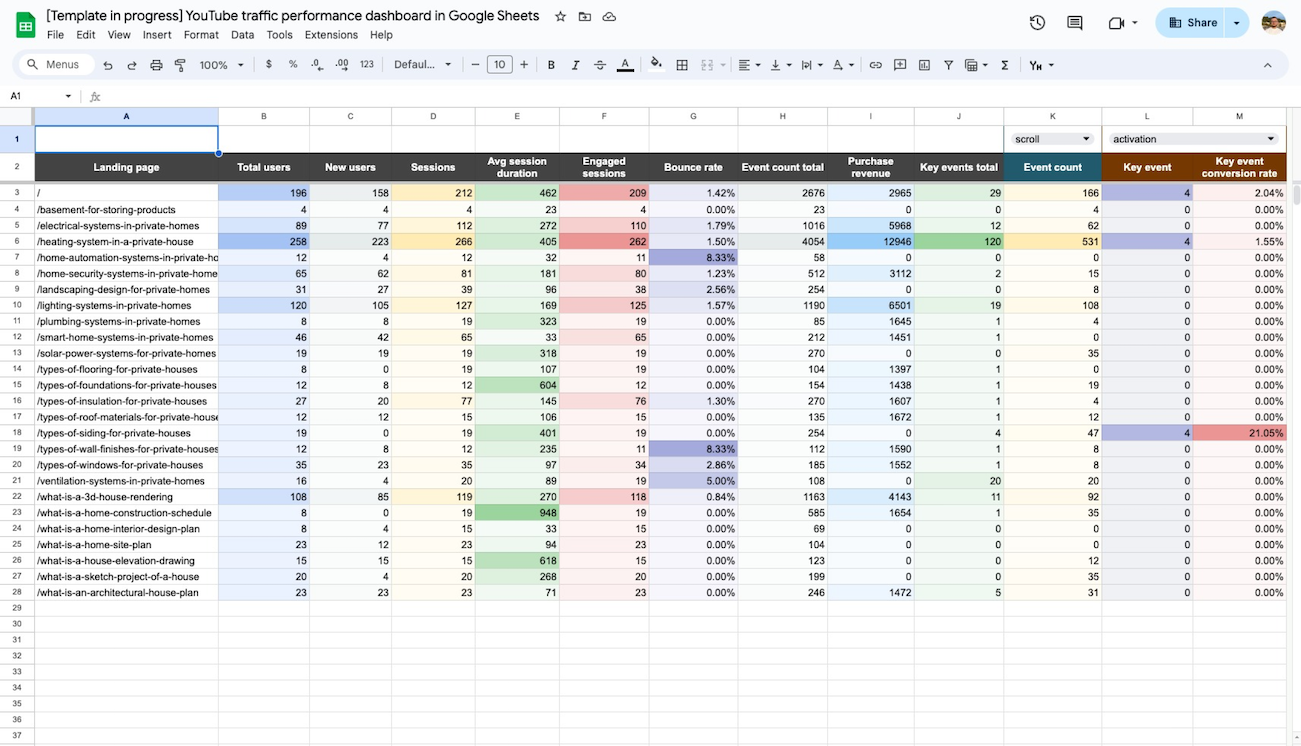
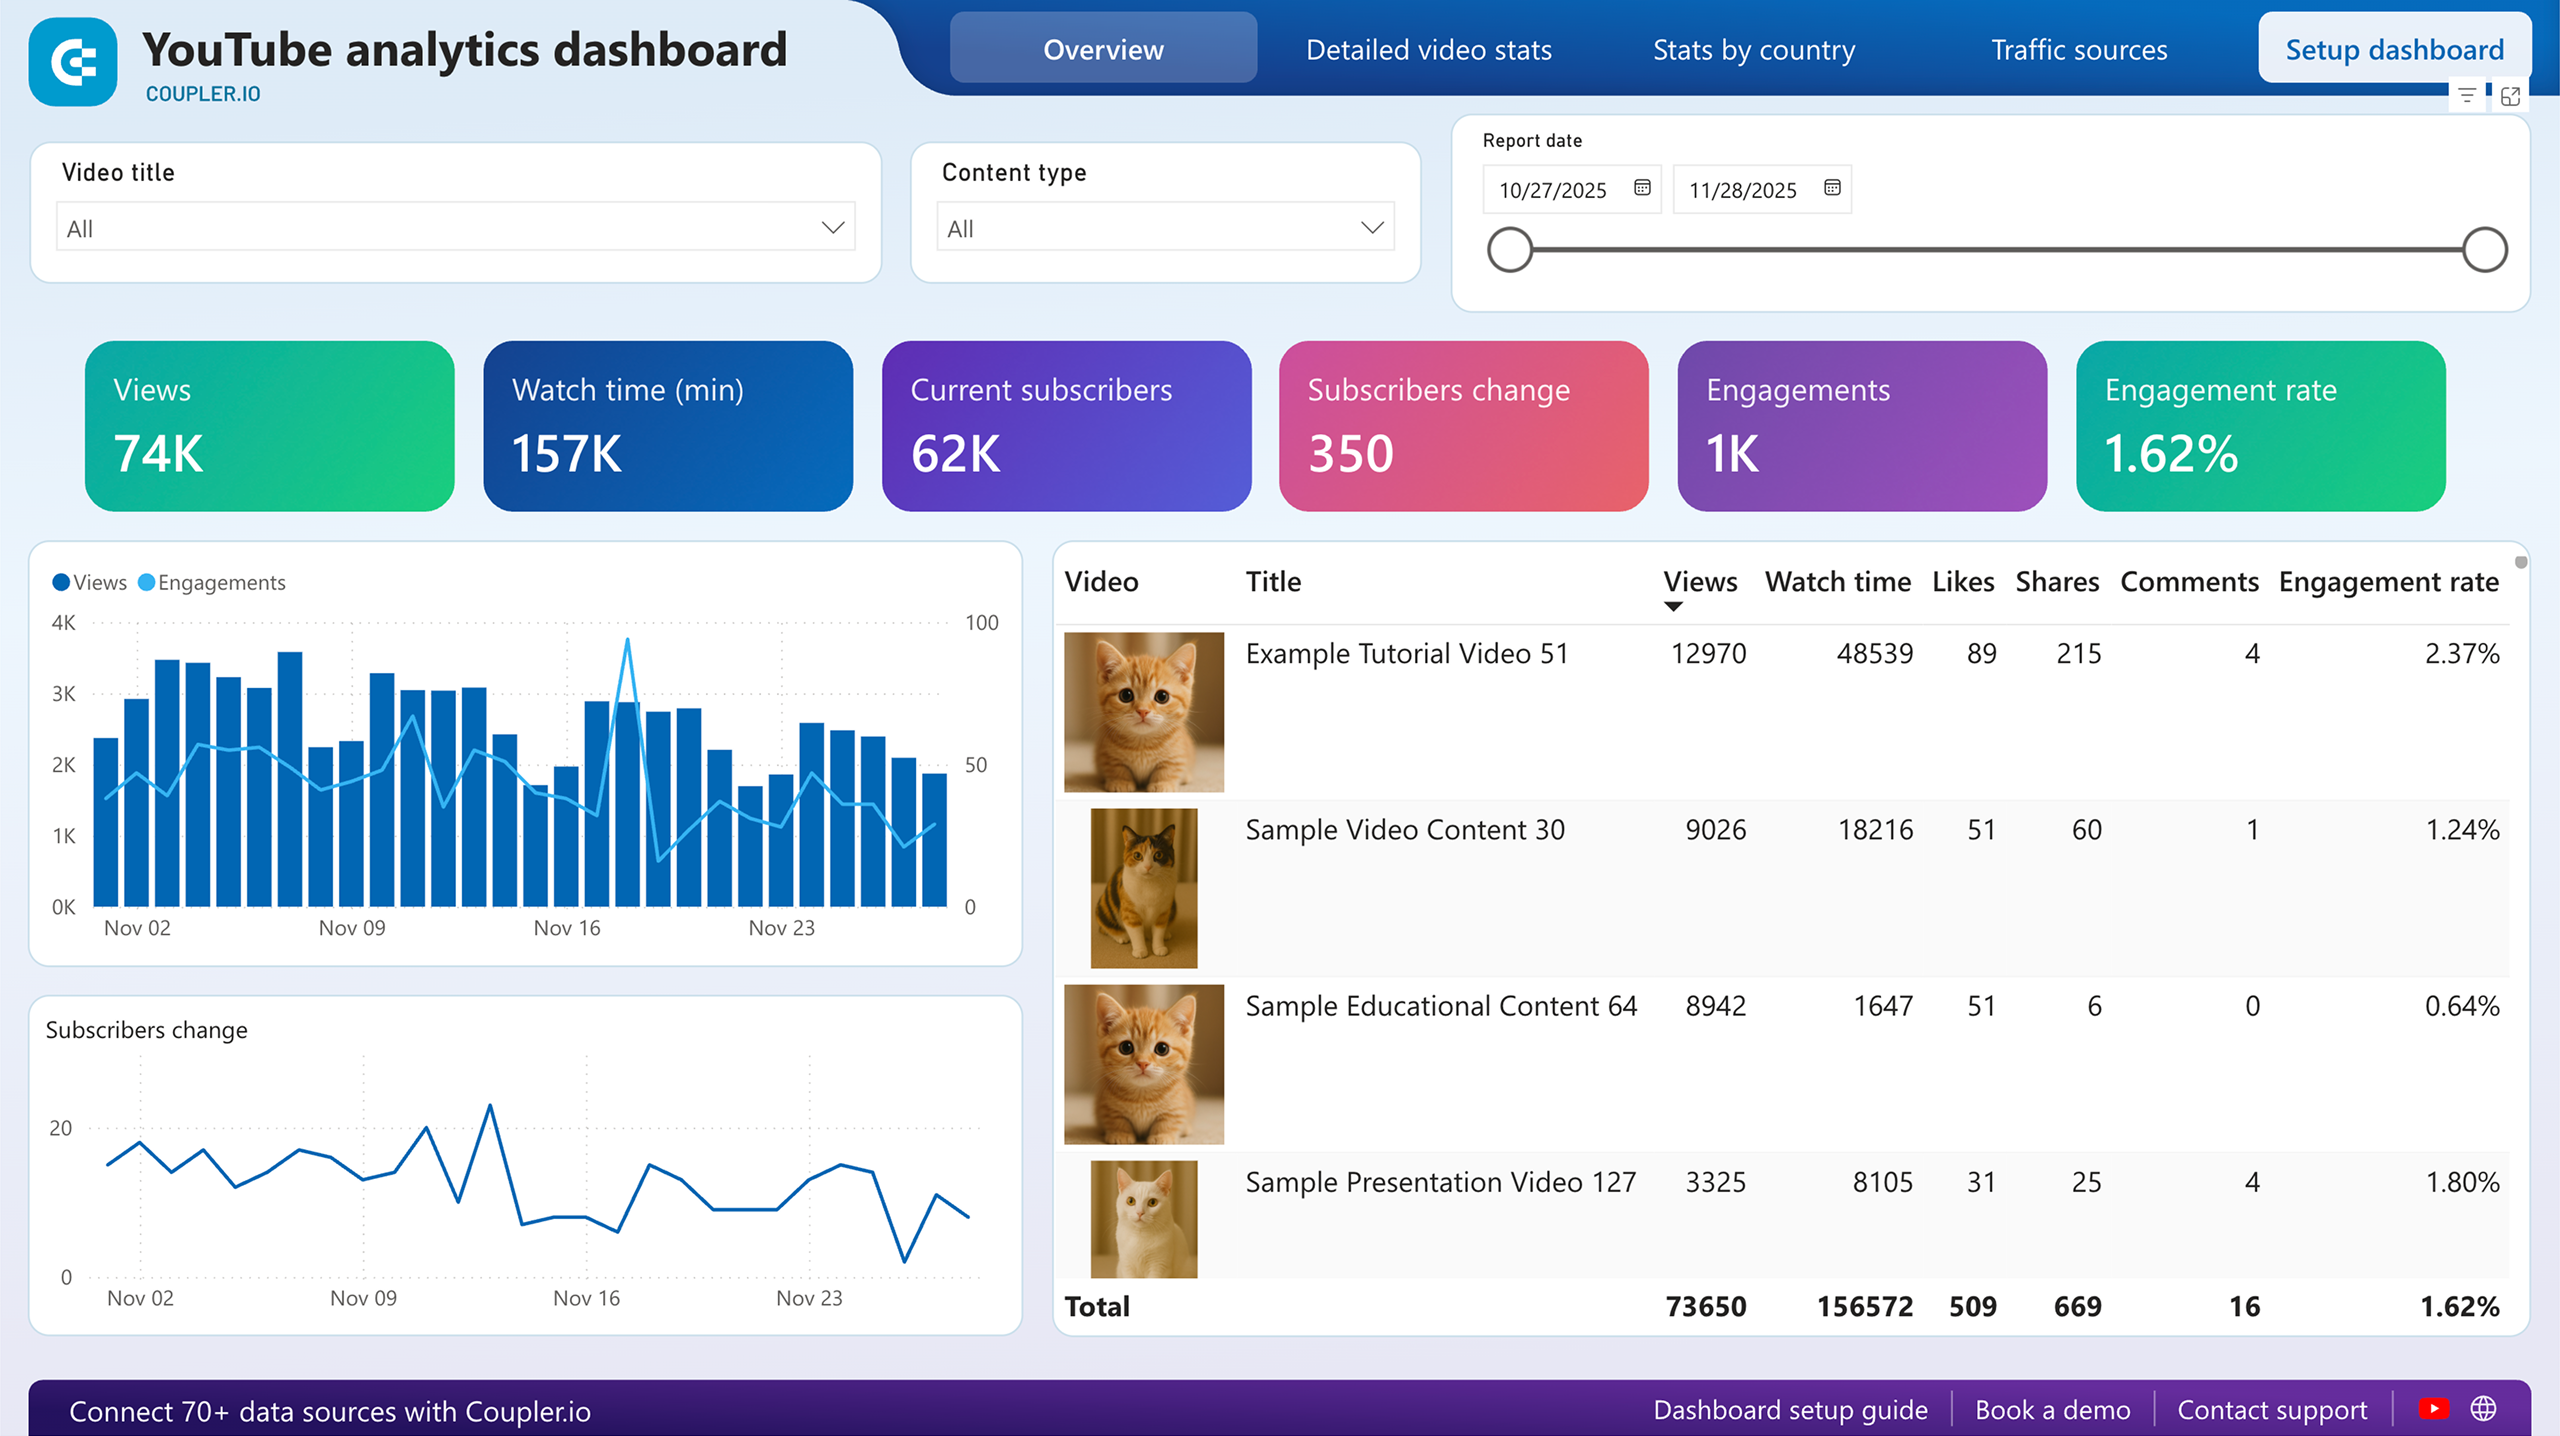
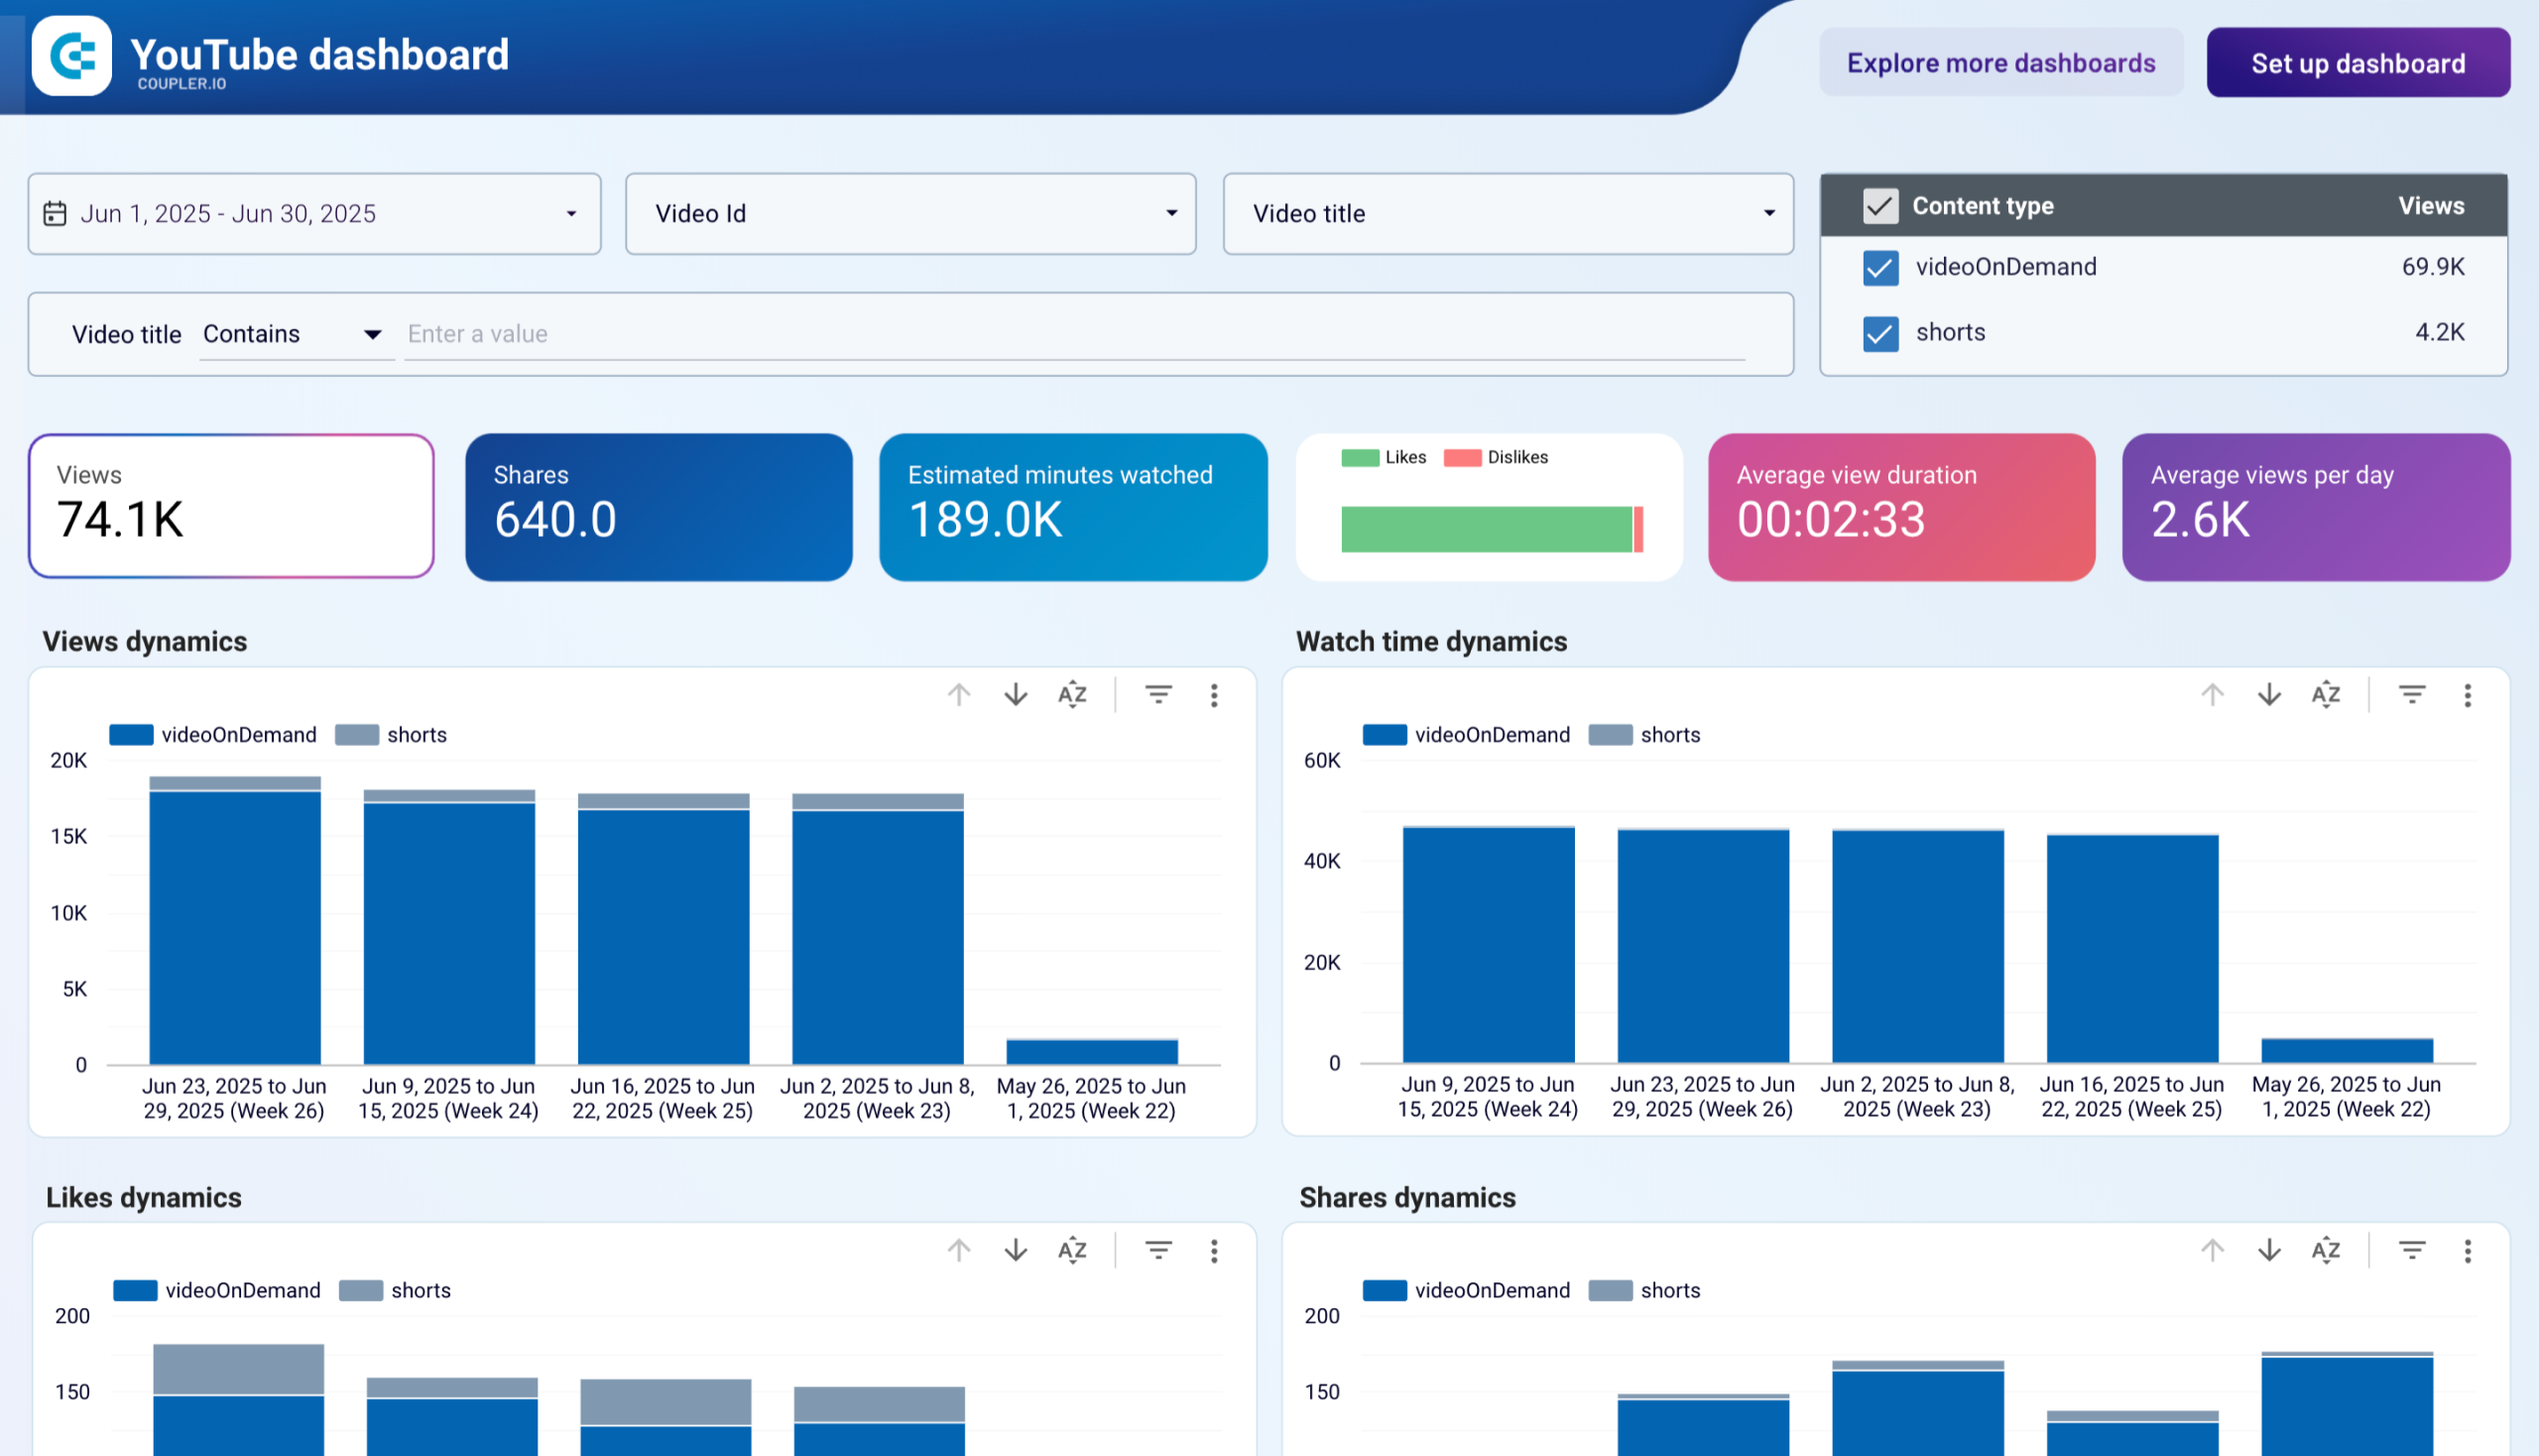
Showcase automations with our dashboard templates


 +3
+3


 +6
+6


 +5
+5
 +6
+6
 +3
+3

 +1
+1


 +4
+4
 +4
+4
 +2
+2
 +2
+2


 +5
+5
 +4
+4
 +5
+5
 +5
+5


 +3
+3

 +1
+1
 +3
+3


 +1
+1
 +3
+3
 +3
+3


 +2
+2


 +1
+1


 +1
+1


 +2
+2
 +3
+3
 +4
+4


about your case. It doesn't cost you a penny 😉
Don’t just take our word for it


Dramatically improved our reporting speed by about 60%. The interface is user-friendly, even for team members with no technical background.
Helped solve data processing issues, and customer service is 10/10. It is extremely easy to use, and allows us to extract data from multiple sources.
Coupler.io made it easy to create dashboards and reports from different data sources. The sync is reliable and the user experience is amazing.

Take your reporting to the next level
 Sign Up with Google
 Sign Up with MICROSOFT
 SIGN UP WITH EMAIL
By signing up to Coupler.io, you agree to our Privacy Policy and Terms of Use.