Sales Analytics & KPI dashboard examples and reporting templates
Optimize your sales performance with automated sales analytics dashboard templates that integrate data from Salesforce, HubSpot, and Pipedrive. Monitor pipeline progression, analyze team performance, track lost deal patterns, and identify revenue opportunities through comprehensive sales KPI dashboard visualizations that transform raw CRM data into strategic business intelligence.
Sales Analytics & KPI dashboard examples for every need


 +1
+1


about your case. It doesn't cost you a penny 😉
What is a sales analytics & KPI reporting dashboard?
The dashboard consolidates deal progression tracking, win/loss analysis, and customer acquisition funnels into visual formats that enable sales leaders to make informed decisions quickly. Through automated data integration via Coupler.io, your sales KPI dashboard eliminates manual reporting while providing instant visibility into revenue trends, bottlenecks, and growth opportunities across your entire sales organization.

Choose your white label sales analytics dashboard to kick off
What reports should be included in sales analytics & kpi dashboards?
A comprehensive sales analytics dashboard requires multiple specialized reports that work together to provide complete visibility into your sales performance. Based on our analysis of successful CRM implementations across Salesforce, HubSpot, and Pipedrive platforms, we recommend incorporating these four critical report types that address the most common sales management challenges.
The acquisition funnel report bridges the gap between marketing efforts and sales outcomes by combining website traffic data from GA4 with deal conversion information from your CRM. This visualization tracks the complete customer journey from initial ad impressions and website visits through lead qualification to closed deals. The report enables you to identify conversion bottlenecks at each stage, compare performance against industry benchmarks, and optimize both marketing spend and sales processes. By correlating traffic sources with deal outcomes, sales teams can focus efforts on channels that generate the highest-quality leads while marketing teams can adjust campaigns based on actual revenue attribution.
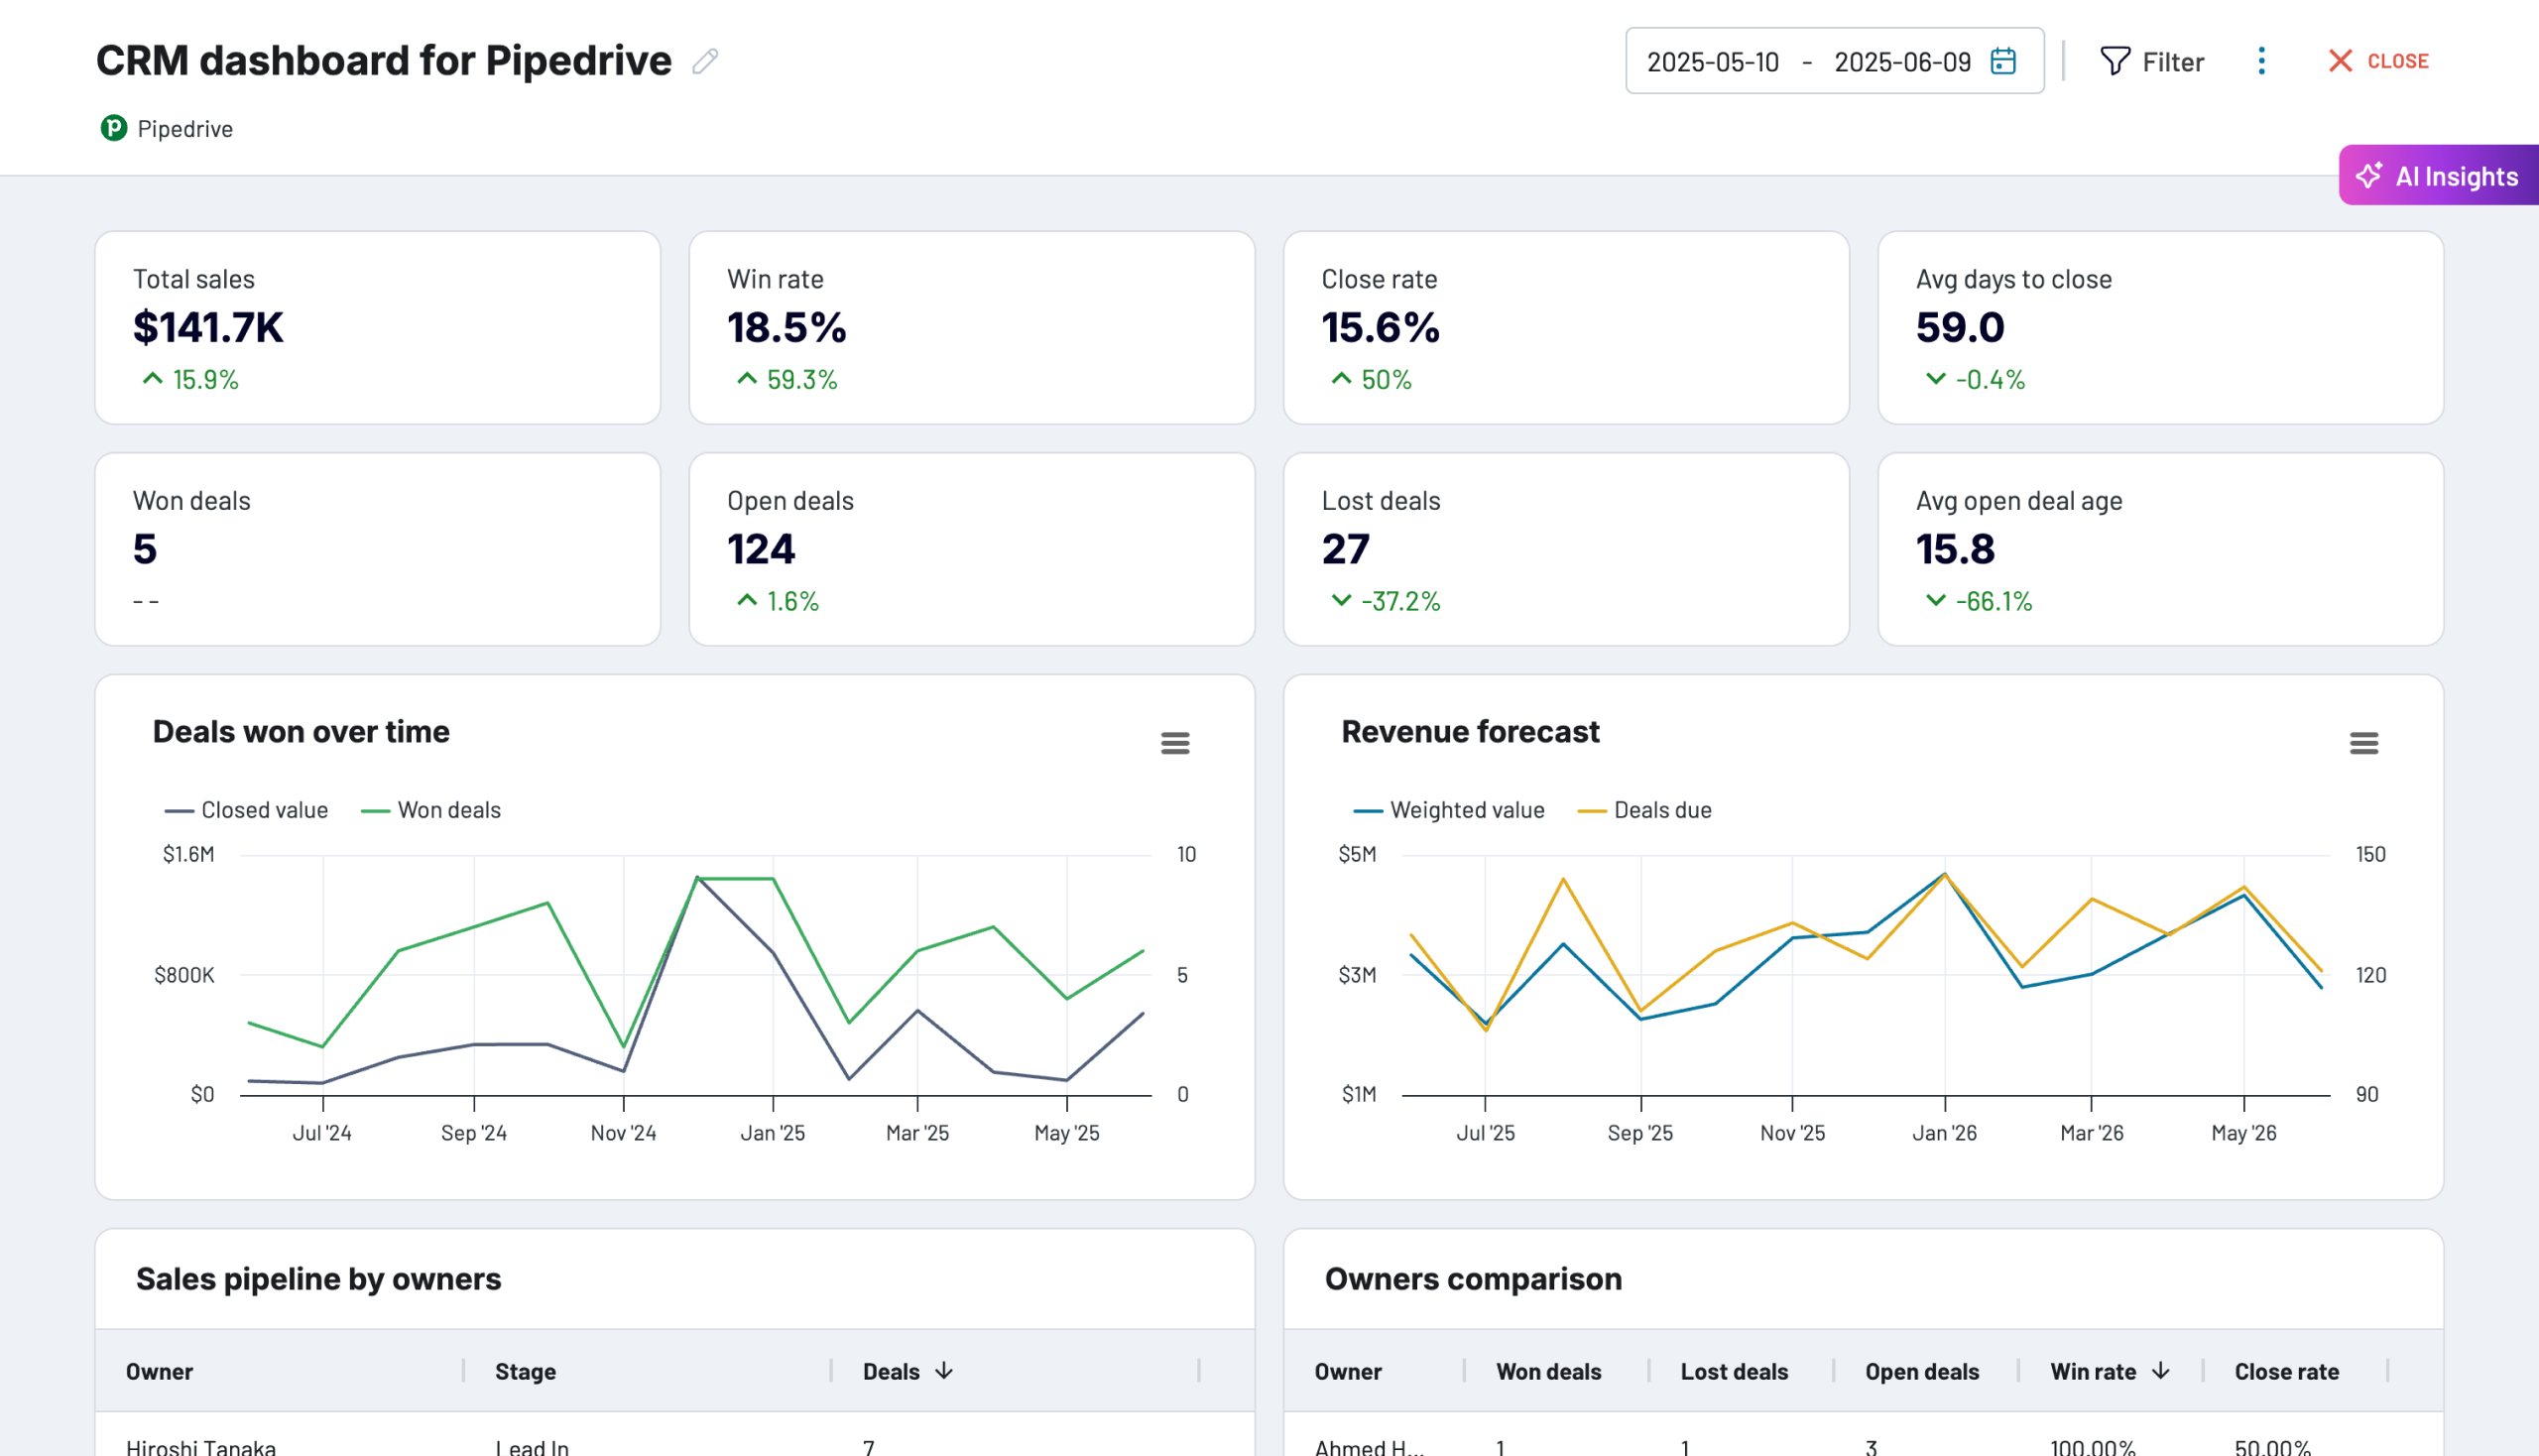
Individual and team performance tracking reveals productivity patterns, deal closure rates, and revenue contribution across your sales organization. This report segments performance data by team member, deal type, and pipeline stage to identify top performers and coaching opportunities. The analysis includes win rates, average deal size, sales cycle length, and quota attainment metrics. Sales managers can use these insights to redistribute high-value opportunities to top performers, provide targeted training for underperforming team members, and establish realistic performance benchmarks based on historical data and deal characteristics.
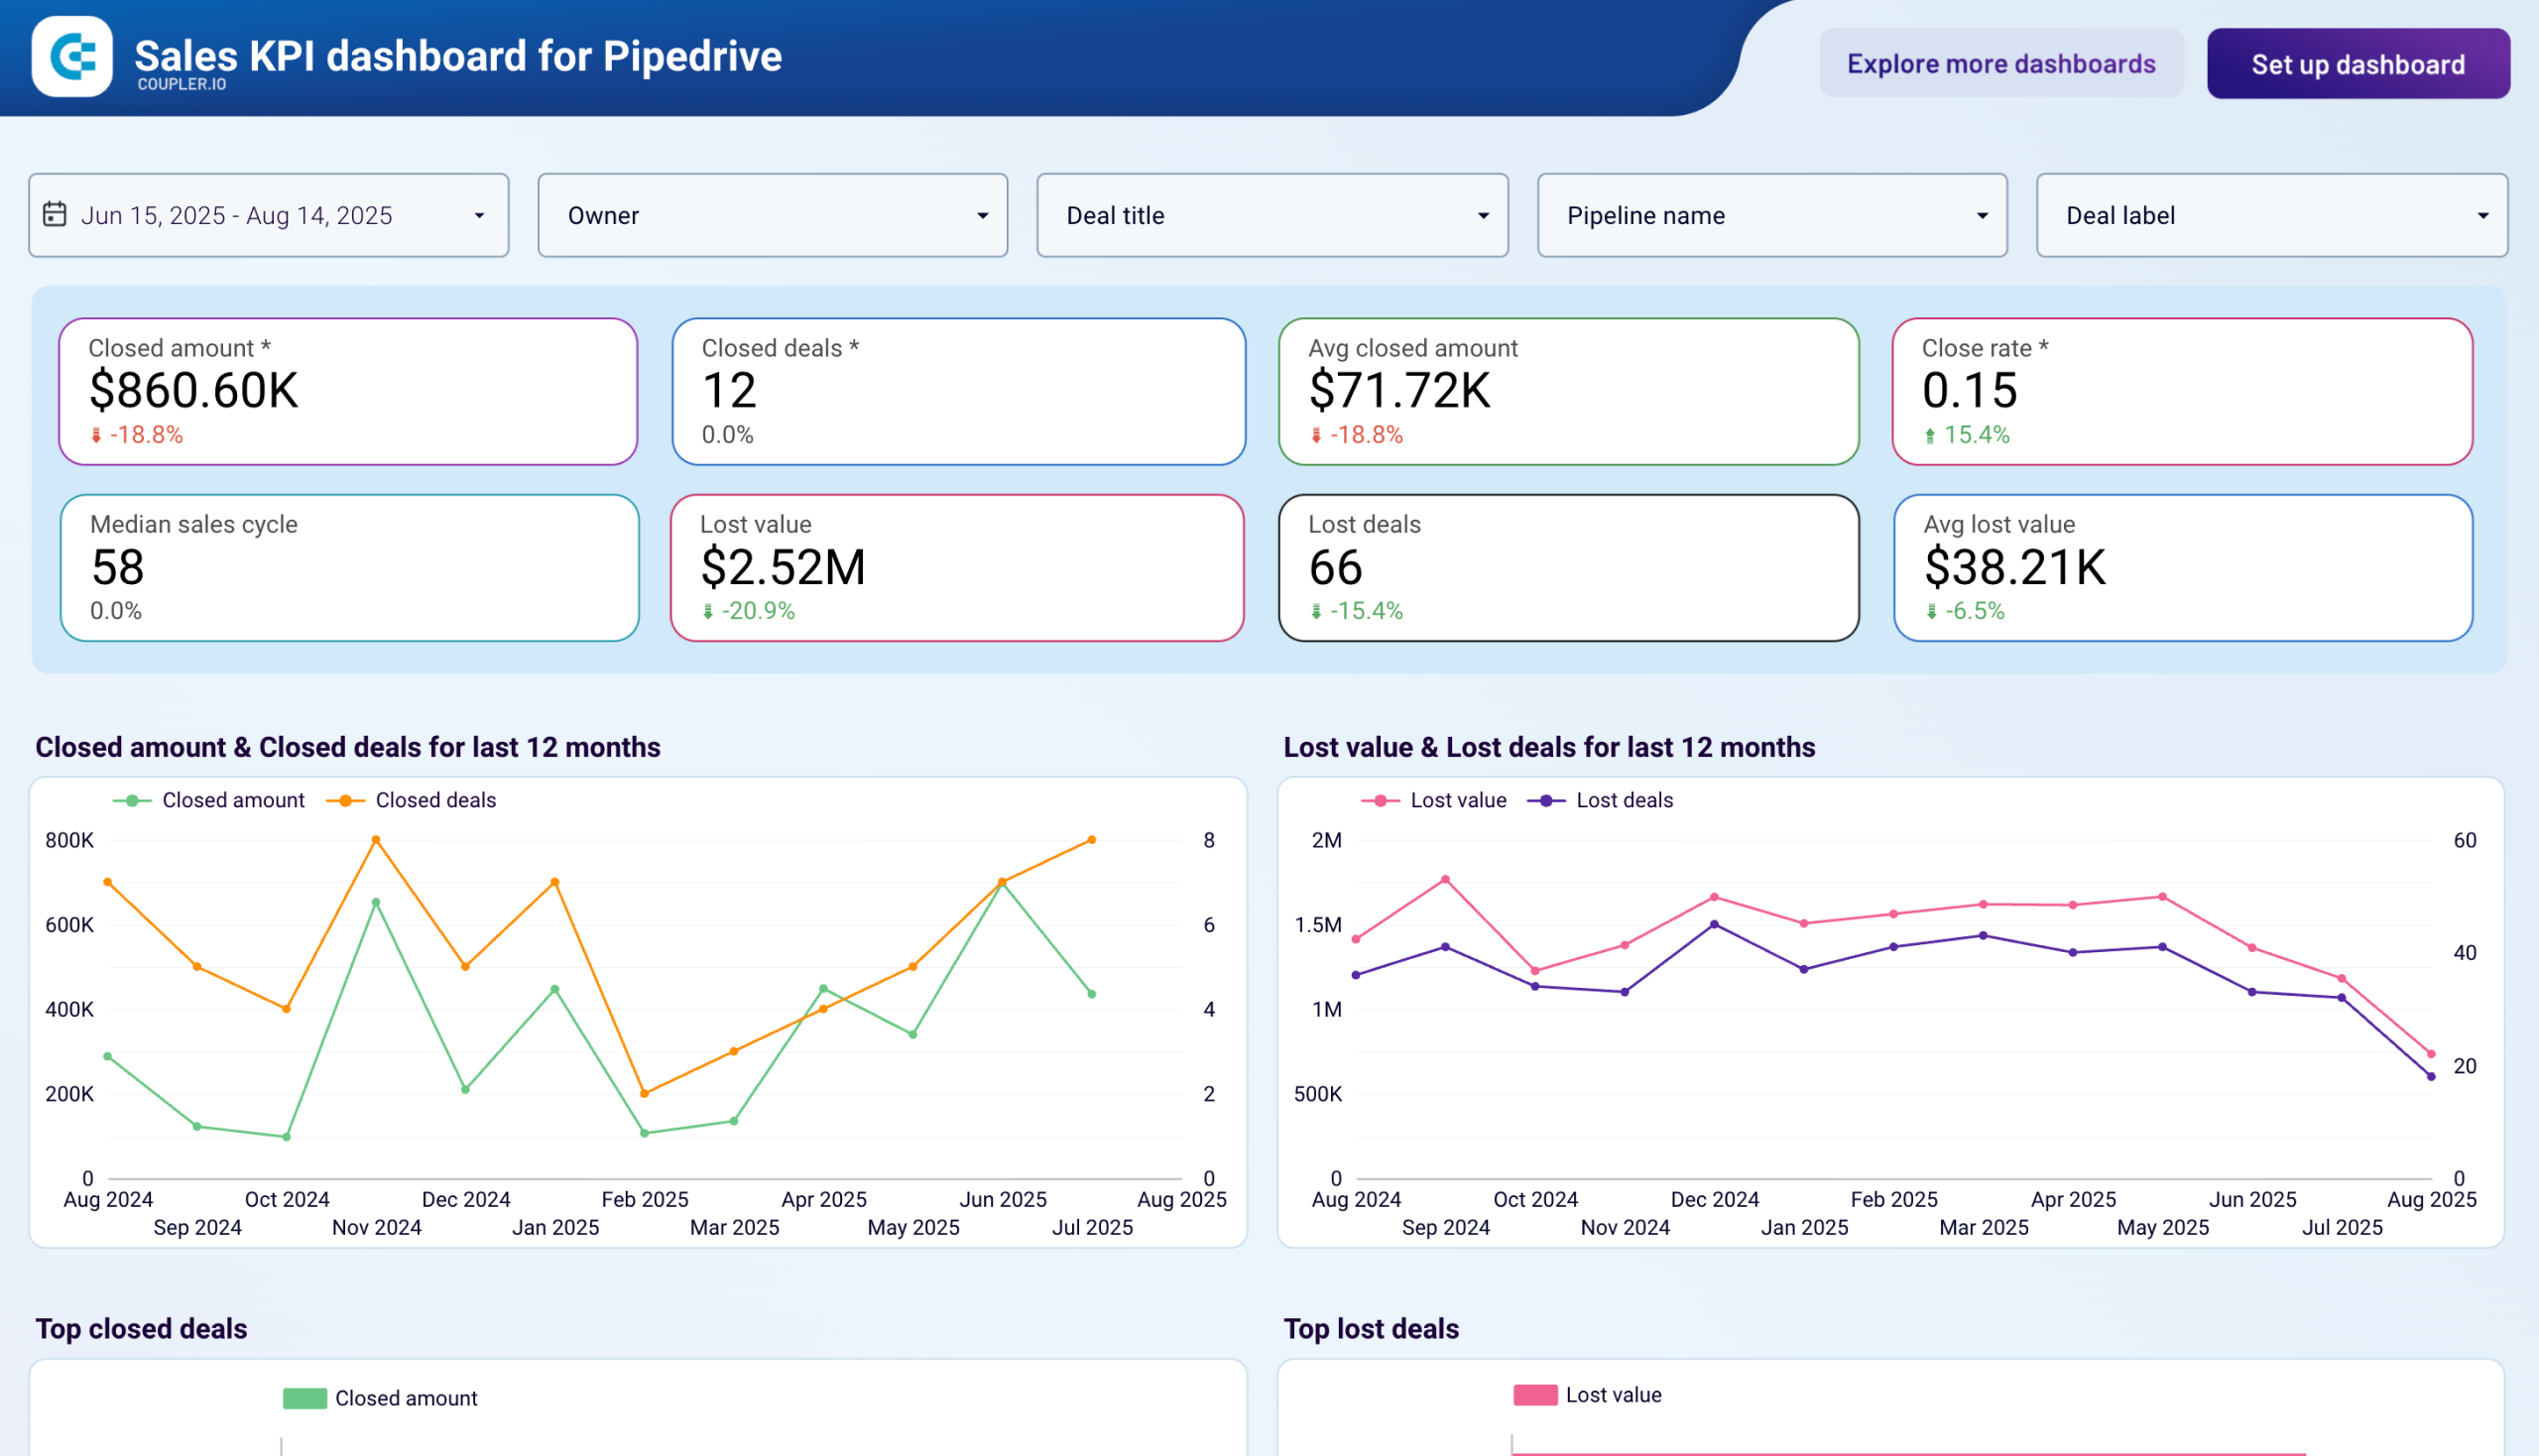
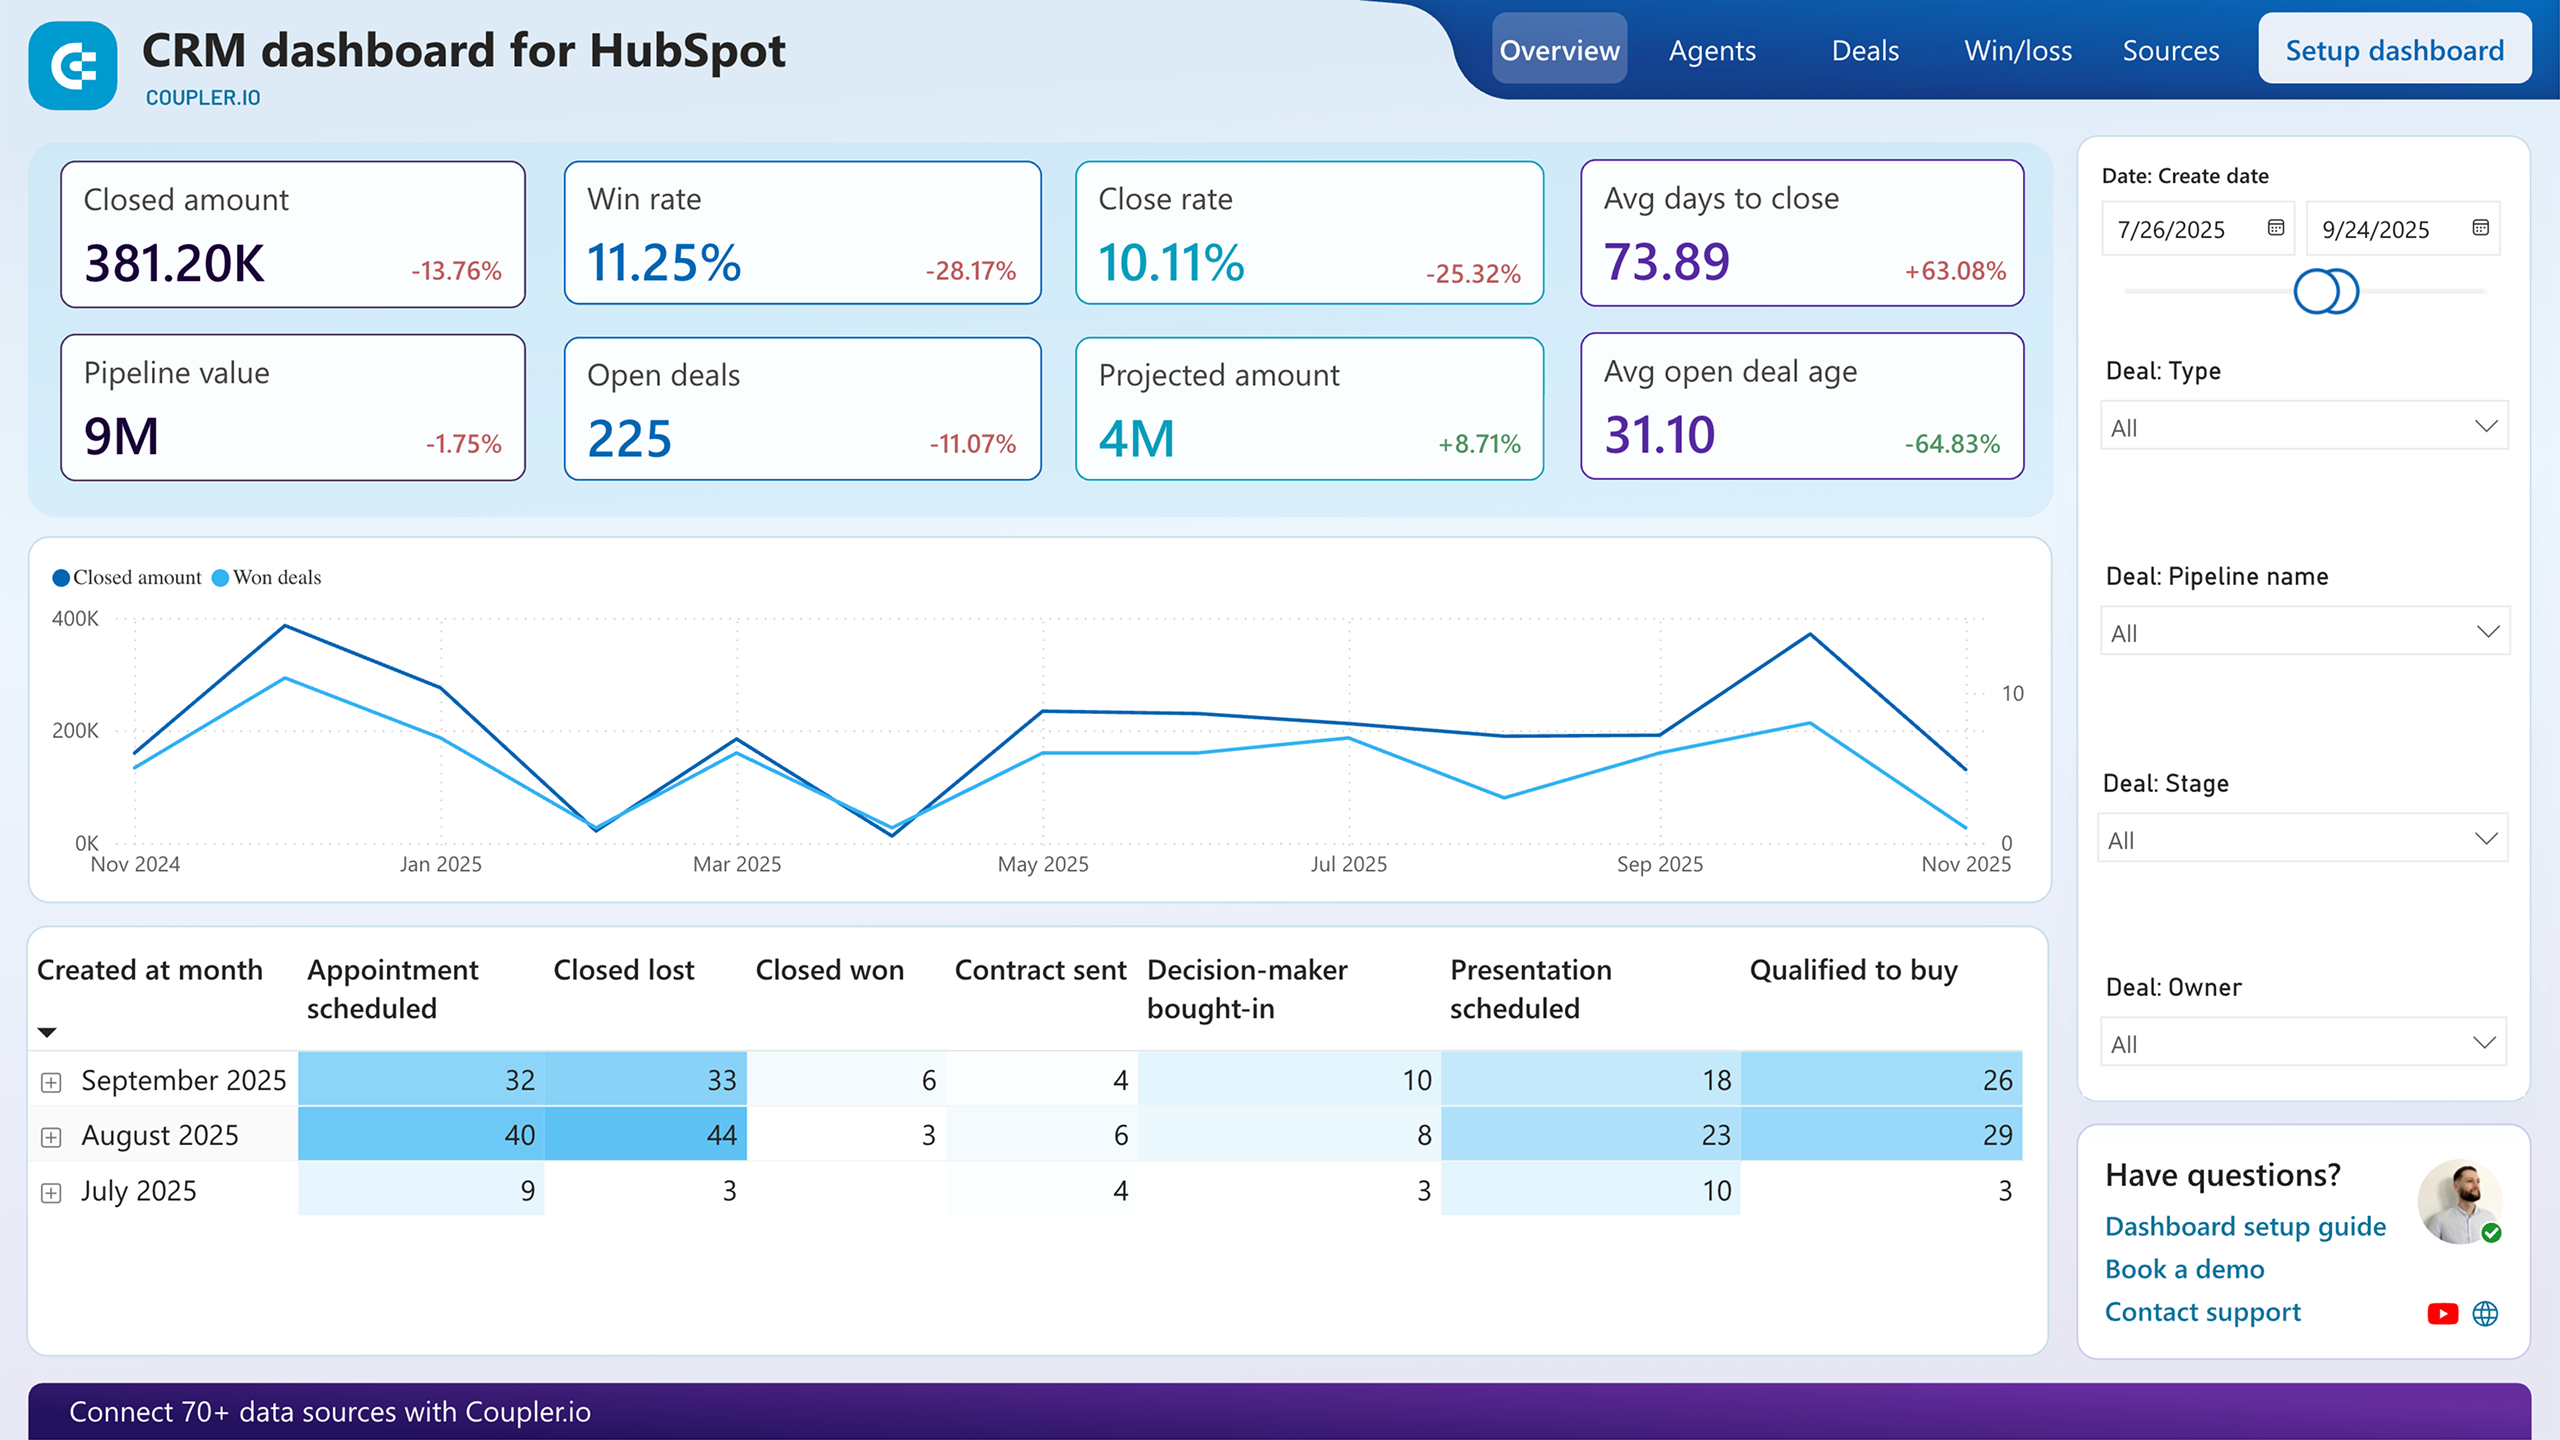
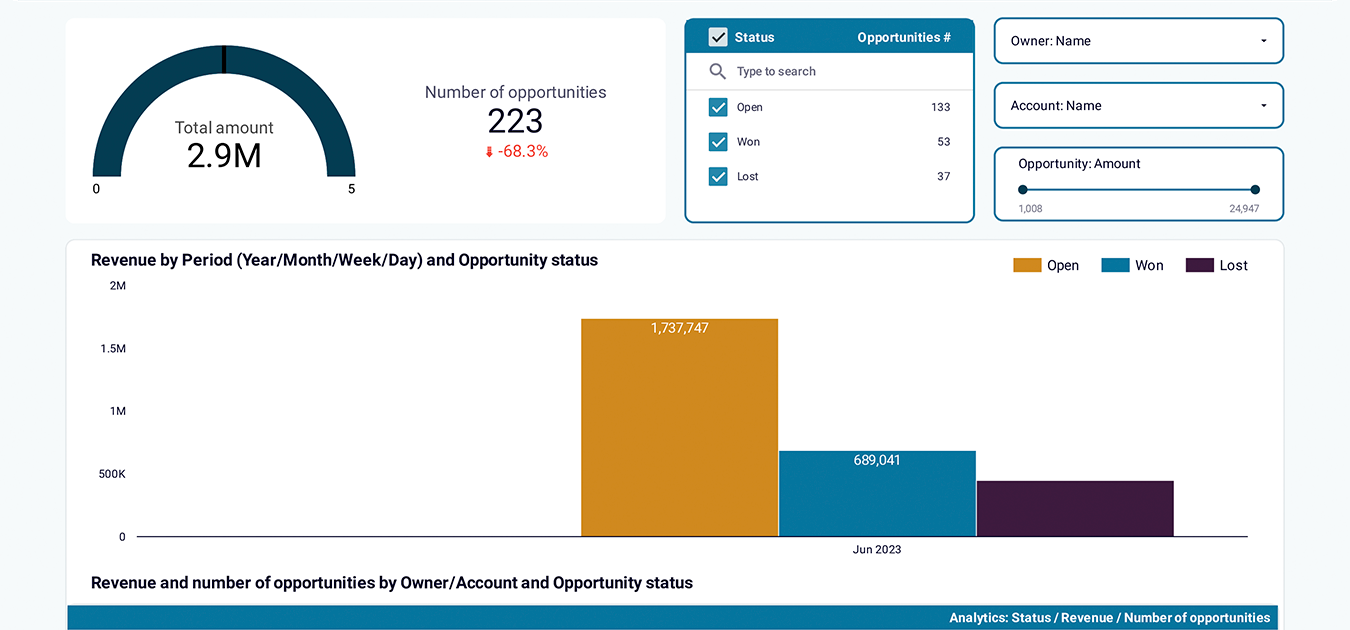
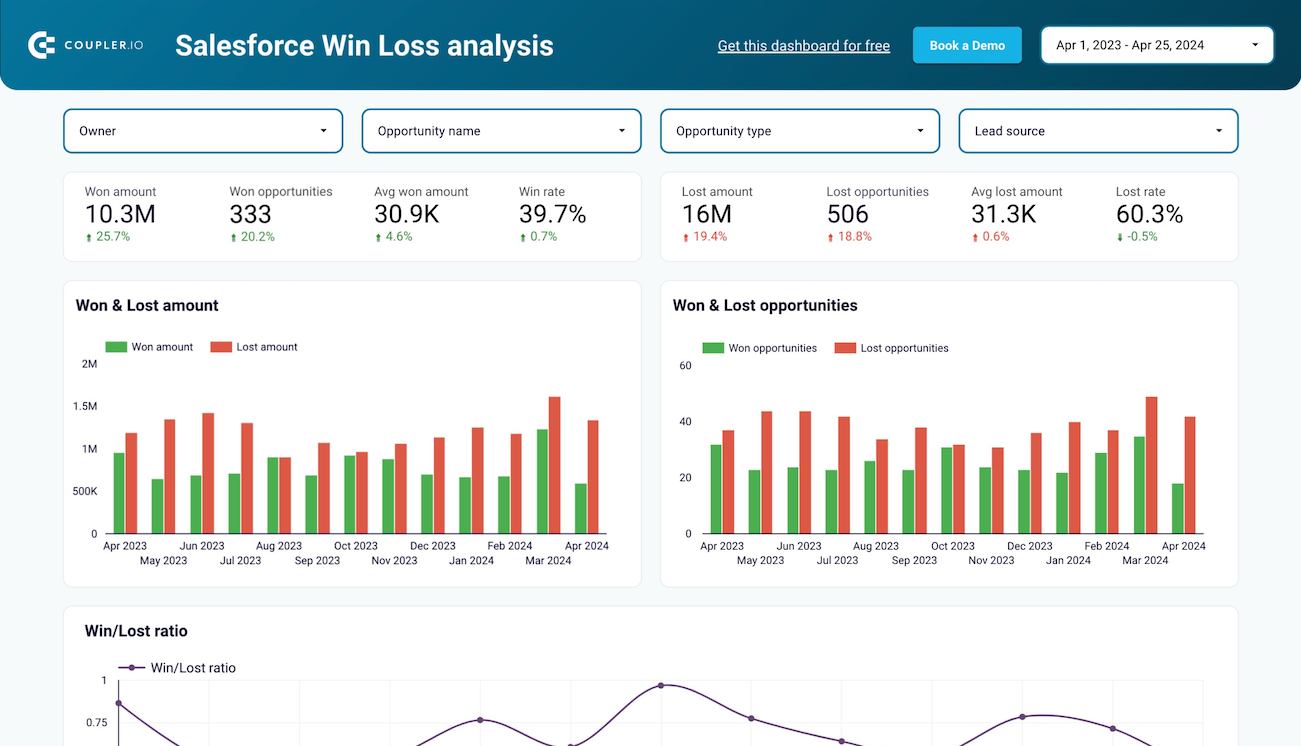
Understanding why deals fail provides crucial intelligence for improving future sales outcomes. This report categorizes lost opportunities by reason, deal stage, competitor, industry, and sales representative to identify recurring patterns in deal failure. The analysis helps sales teams address specific objections, refine pricing strategies, and improve competitive positioning. By tracking lost deal trends over time, organizations can implement process improvements, adjust product offerings, and develop better qualification criteria to reduce future losses and increase overall win rates.
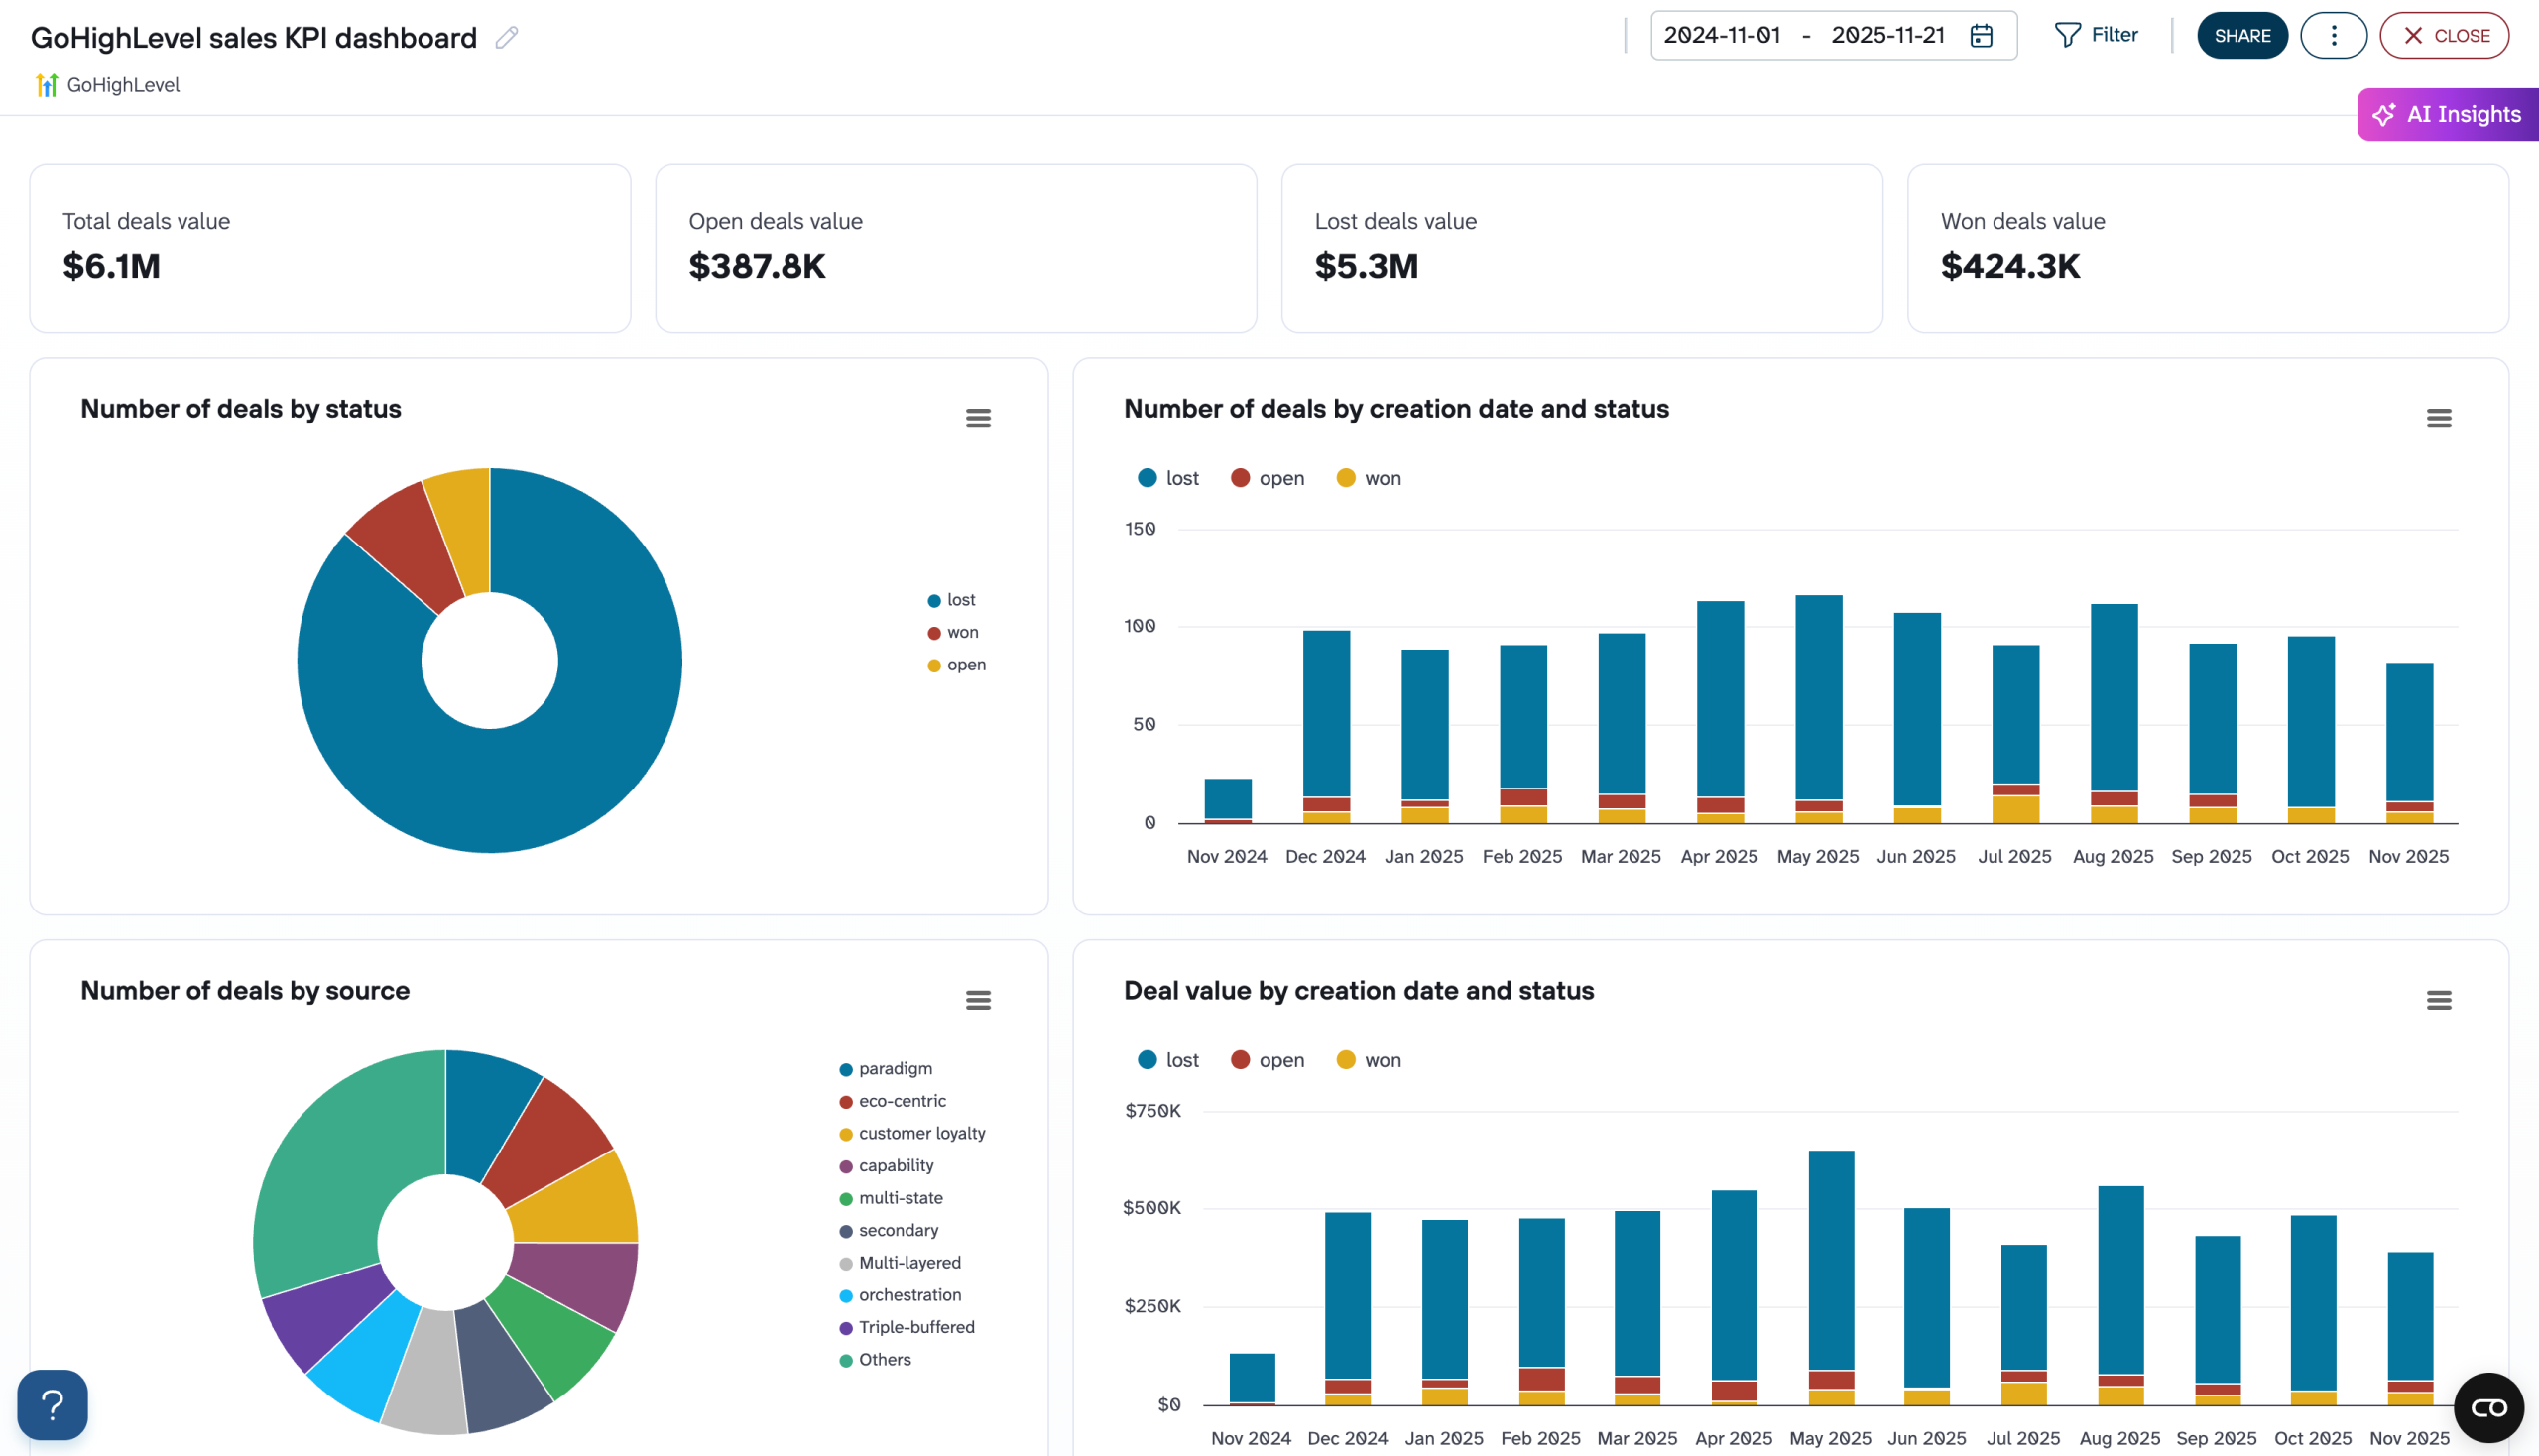
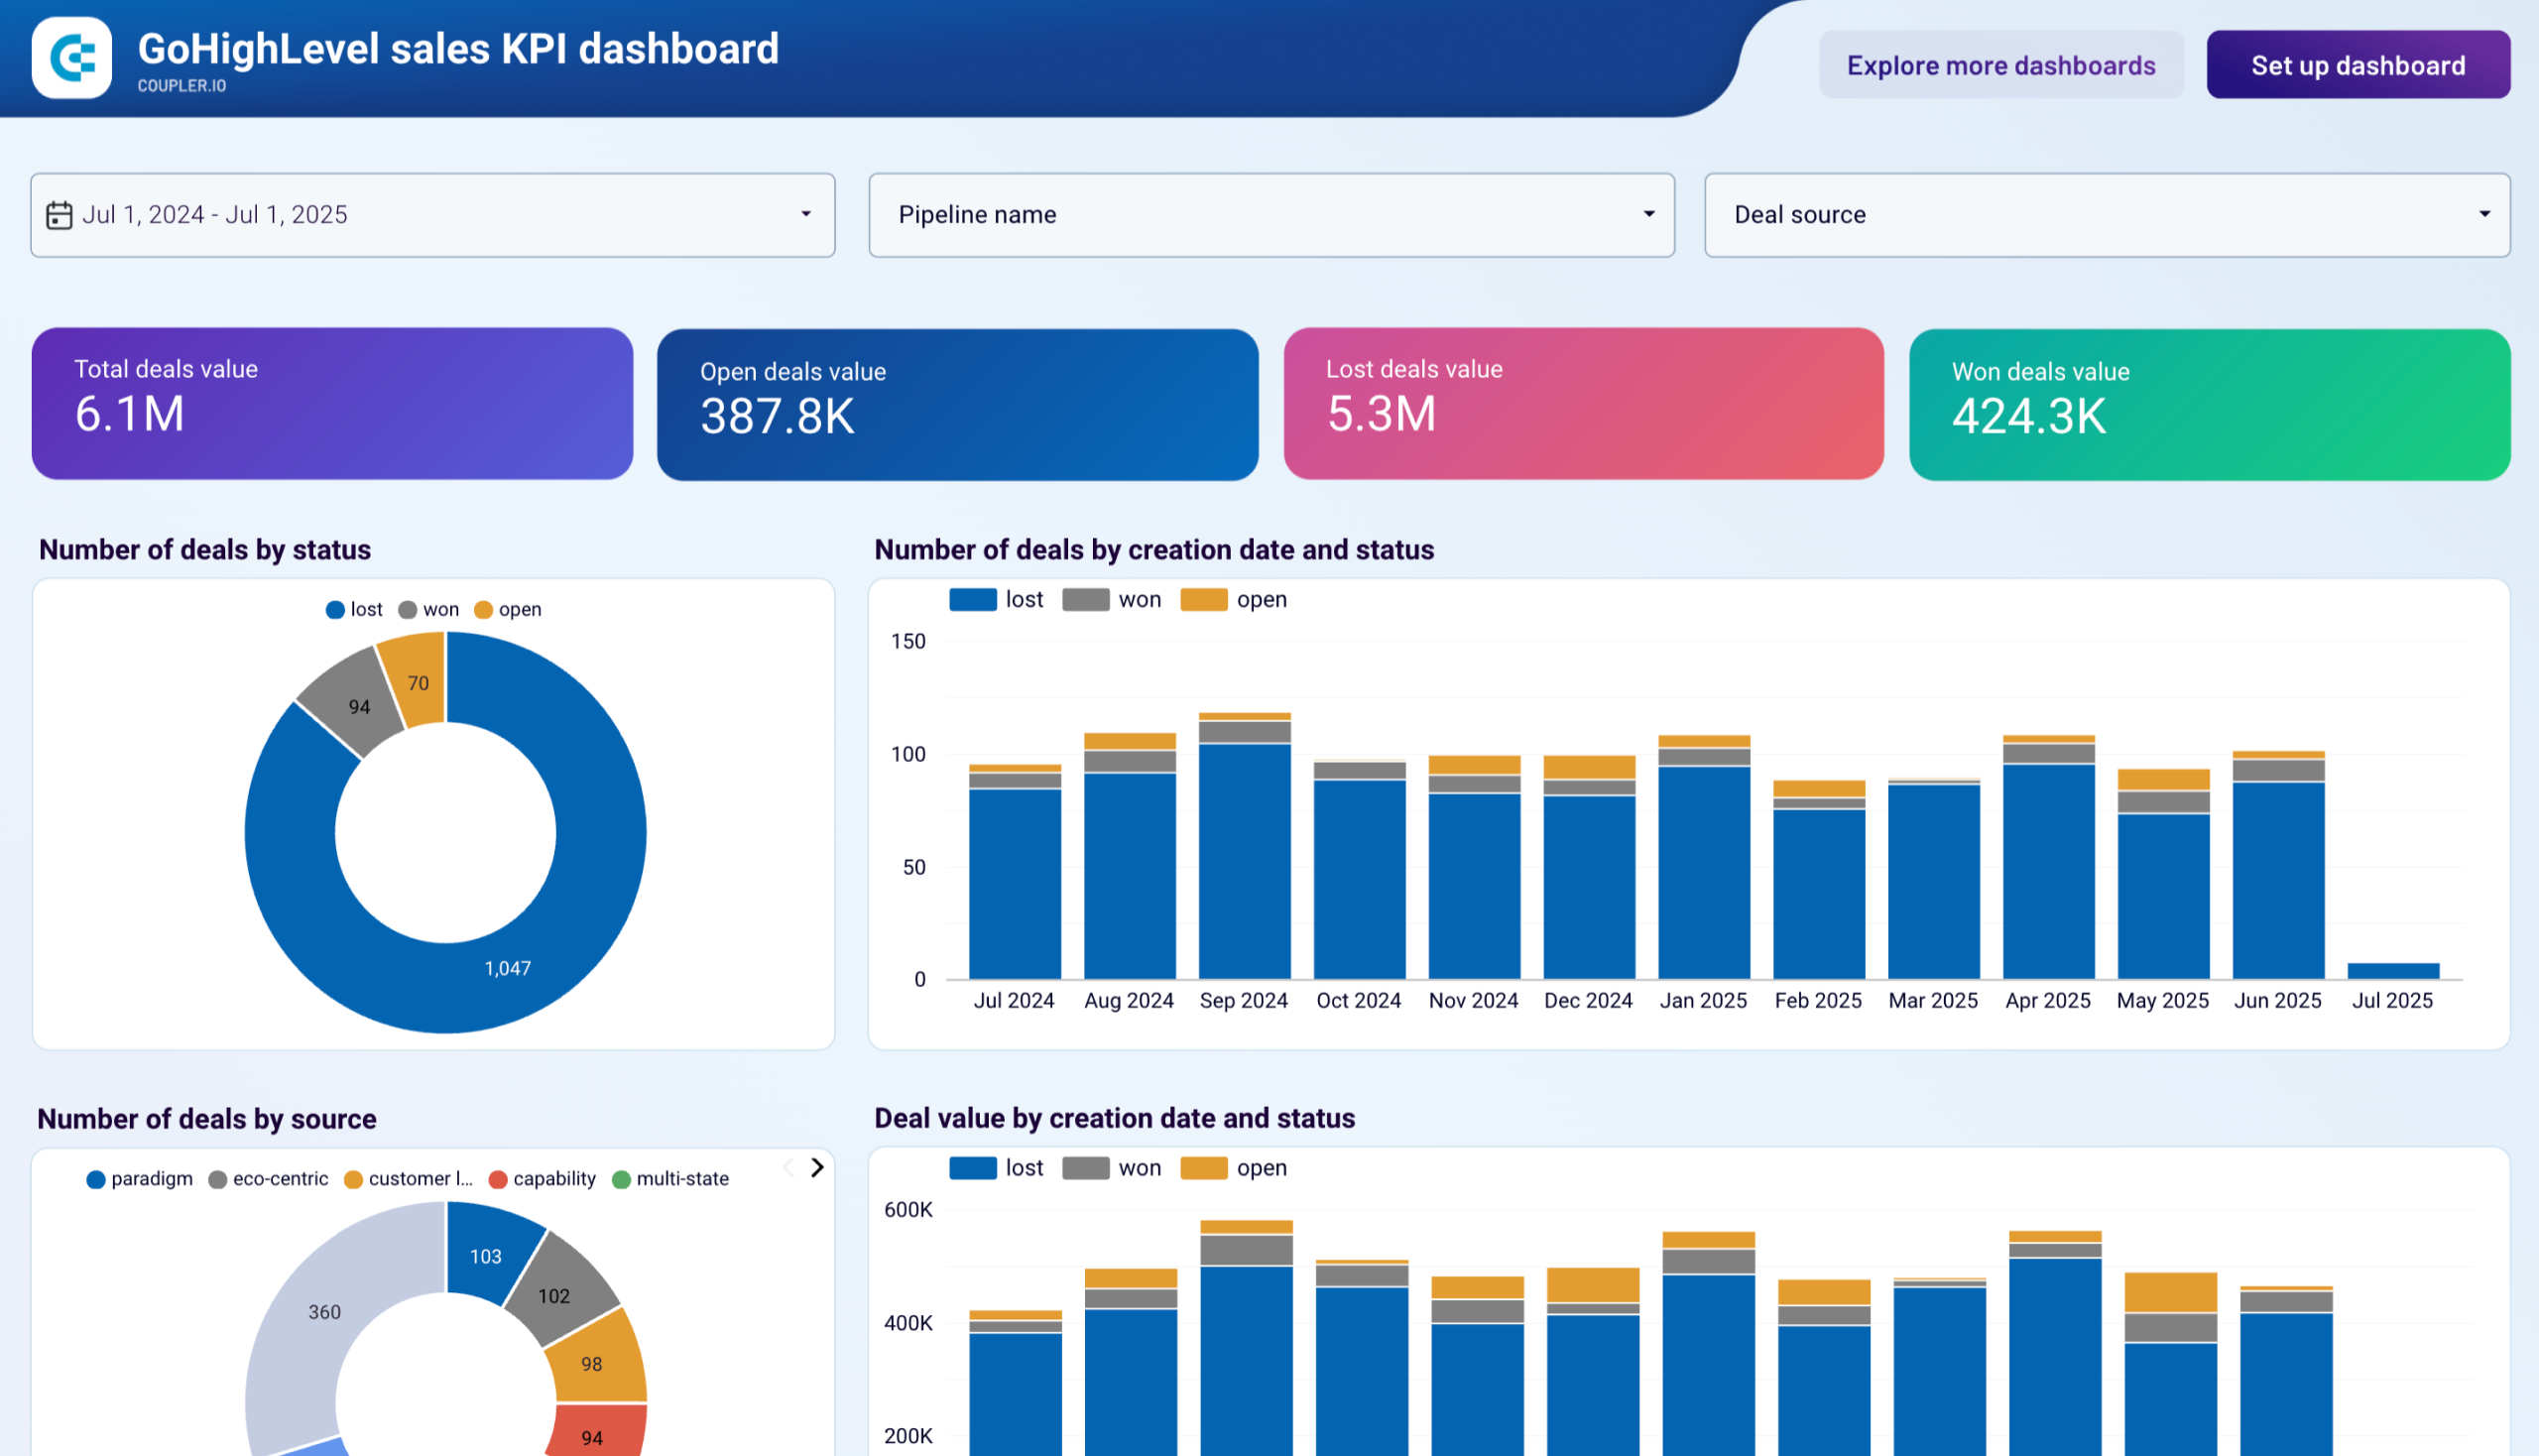
Pipeline analysis and revenue forecasting combine current deal data with historical conversion patterns to predict future sales performance. This report tracks deal progression through pipeline stages, identifies stalled opportunities, and calculates weighted revenue projections based on deal probability and stage velocity. Sales leaders can use these insights to adjust resource allocation, prioritize high-value opportunities, and provide accurate revenue guidance to executive teams while ensuring adequate pipeline coverage for future quarters.
What insights you can get with the sales analytics dashboard
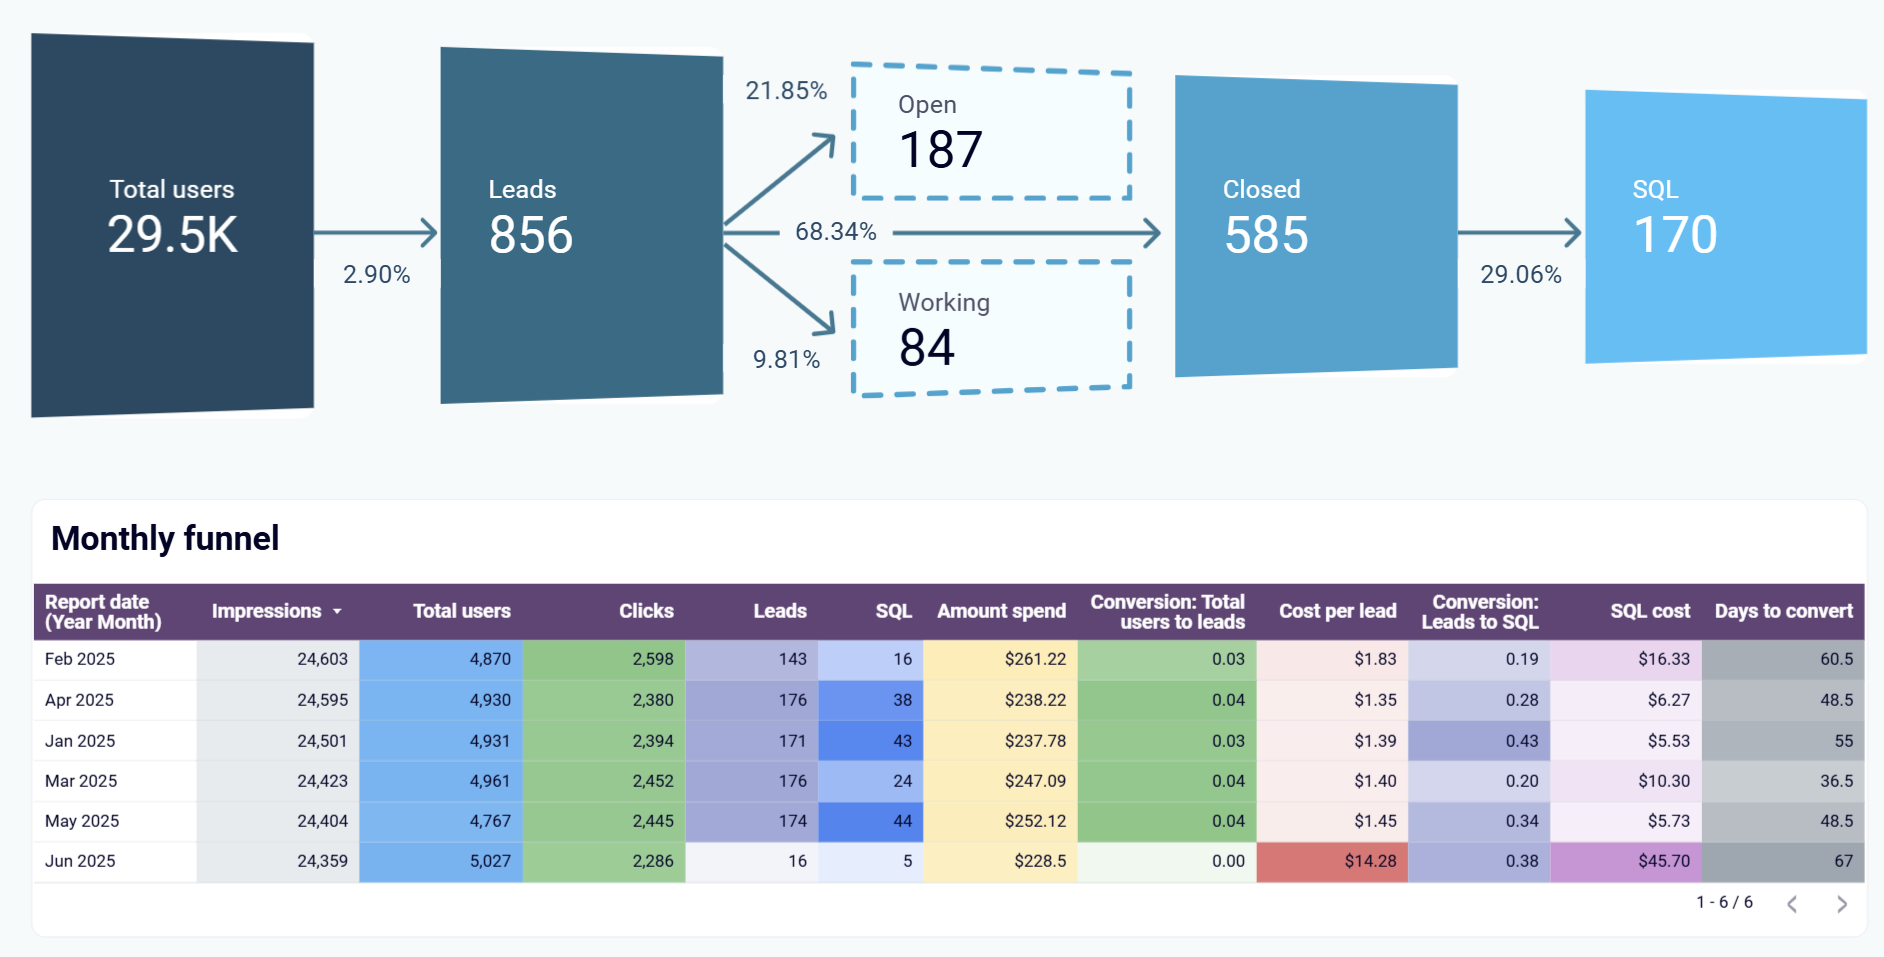
Track your complete customer acquisition journey from website visitors to closed deals through integrated GA4 and CRM data. The sales analytics dashboard displays conversion rates at each funnel stage, helping you identify where prospects drop off and optimize both marketing campaigns and sales processes. This visualization enables data-driven decisions about budget allocation and process improvements by showing exactly how website traffic translates into revenue.
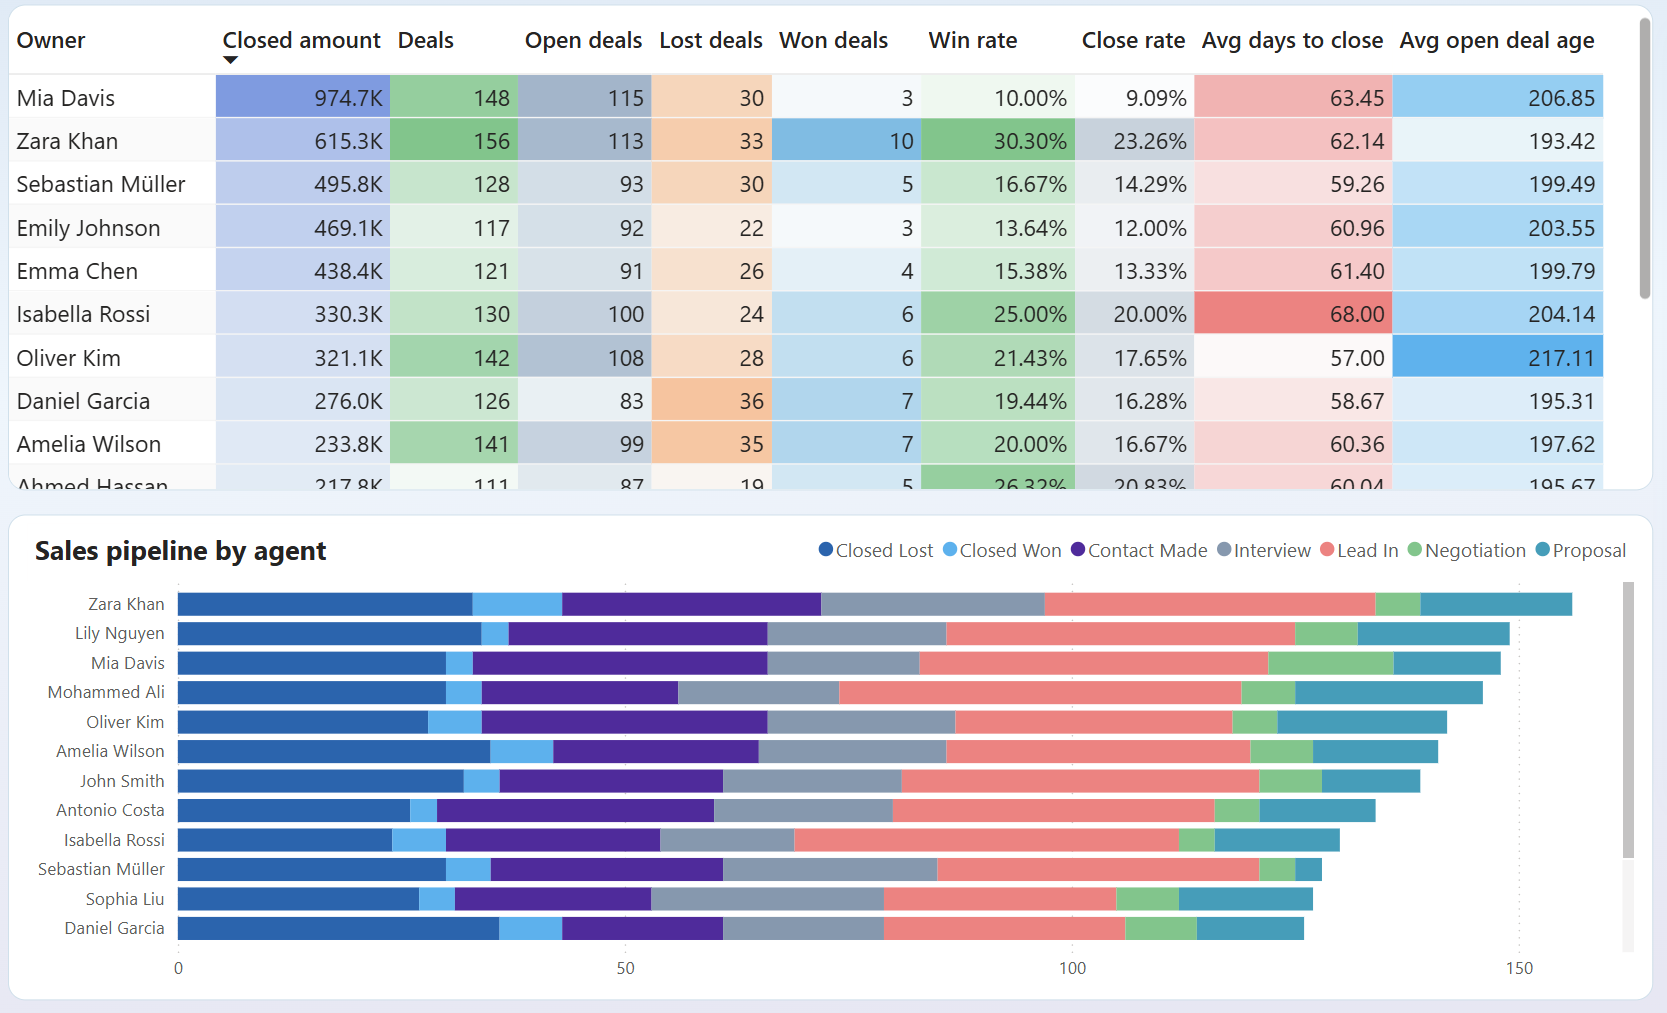
Analyze individual and team sales performance through comprehensive metrics including win rates, deal velocity, and revenue contribution. Your sales KPI dashboard reveals productivity patterns and coaching opportunities by comparing performance across team members, deal types, and pipeline stages. Sales managers can identify top performers for high-value opportunities while providing targeted support for team members who need additional training or resources.
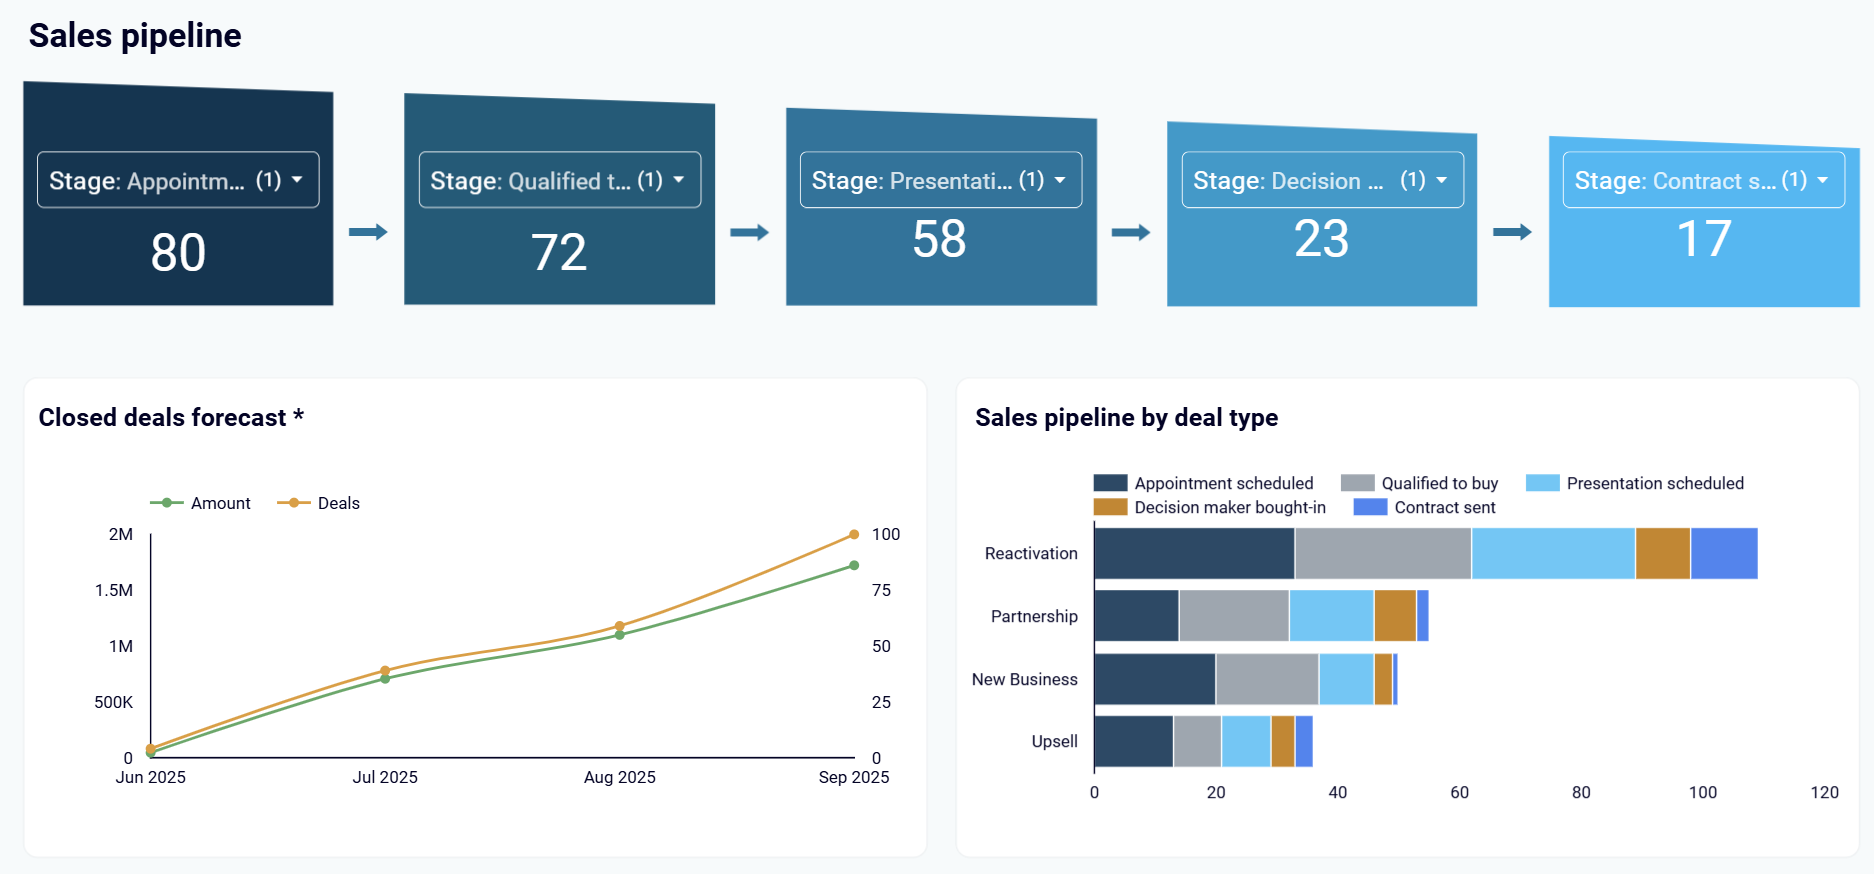
Monitor pipeline stages to identify where deals consistently drop off and optimize progression through targeted process improvements. Your sales analytics & KPI dashboard reveals conversion rates between stages and highlights areas where opportunities accumulate without advancing. This insight enables sales managers to implement stage-specific coaching, adjust qualification criteria, and redesign processes that create unnecessary friction in deal advancement.
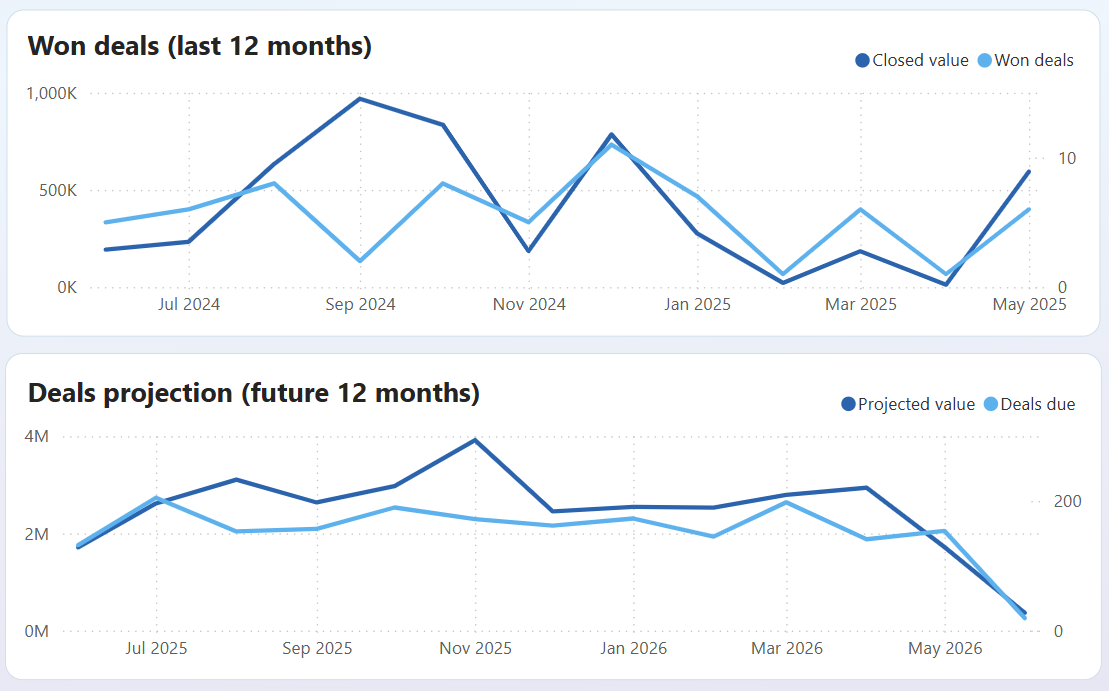
Evaluate pipeline health and forecast future revenue through weighted deal analysis and stage progression tracking. Your sales analytics dashboard calculates revenue projections based on deal probability, identifies stalled opportunities requiring attention, and provides visibility into pipeline coverage for future quarters. This assessment enables proactive pipeline management and accurate revenue guidance for strategic planning and resource allocation decisions.
How to create a sales KPI dashboard?

Metrics you can track with a sales analytics & KPI dashboard template
More Sales Analytics & KPI Dashboards
Request custom dashboard
From building custom dashboards to setting up data analytics from scratch, we're here to help you succeed. Contact us to discuss your case and possible solutions
Contact us