Sales leaderboard examples and reporting templates
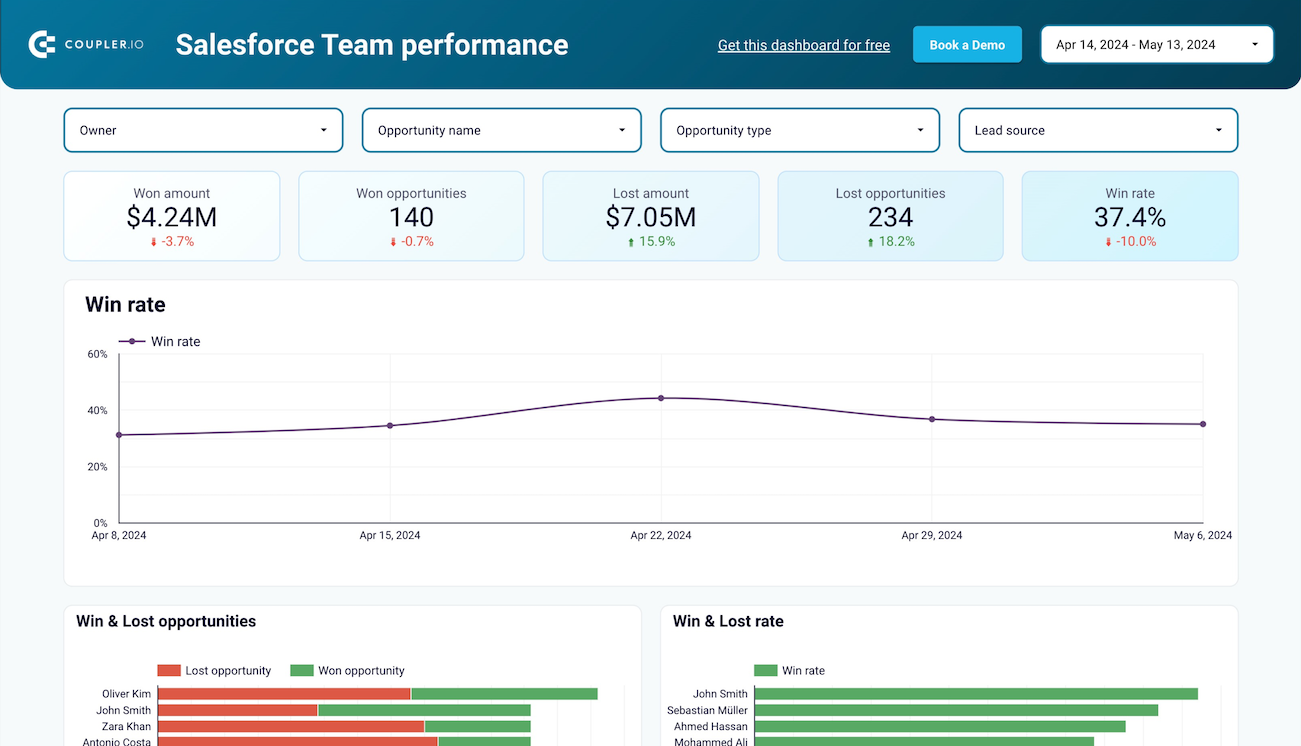
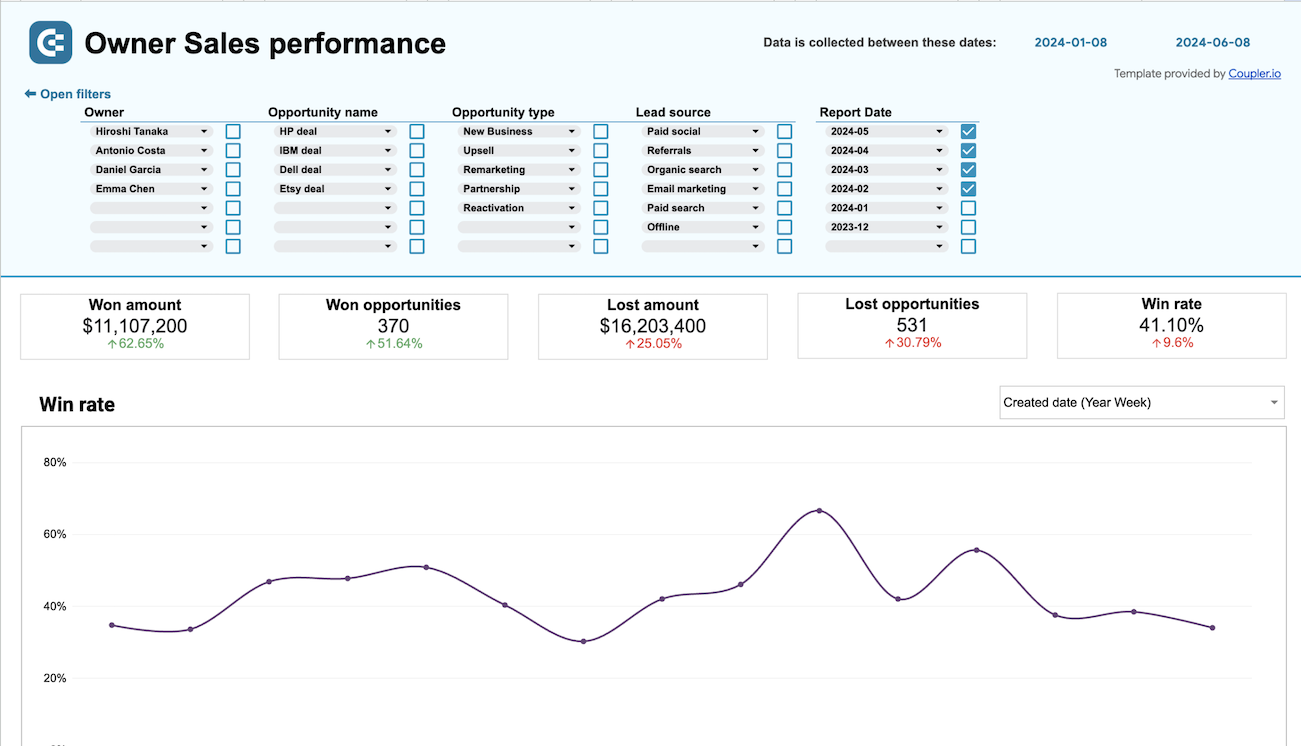
A sales leaderboard equipped with the built-in Salesforce connector to track and rank team performance automatically. Transform your Salesforce data into competitive sales leaderboards that motivate teams and identify top performers through real-time performance metrics and revenue tracking.
Three reasons to use this sales leaderboard template
- Real-time performance visibility: Track sales team rankings and individual metrics automatically updated from Salesforce without manual data entry or calculations.
- Competitive team motivation: Foster healthy competition through transparent performance comparisons that encourage reps to exceed their targets consistently.
- Strategic resource allocation: Make informed decisions about coaching, territory assignments, and deal prioritization based on individual performance data.
What you will learn from the sales leaderboard dashboard
You can use our sales leaderboard templates to measure individual sales rep performance and create competitive rankings that drive team motivation. Simply connect your Salesforce account, and you'll discover:"
- Which sales rep has the highest win rate? Track conversion rates across your entire sales team to identify your most effective closers. Understanding win rate variations helps you replicate successful strategies and provide targeted coaching to underperforming team members.
- How do deal types affect individual performance? Analyze which sales reps excel with specific deal categories like partnerships, upsells, or new business. This insight allows you to optimize territory assignments and match reps with opportunities that align with their strengths.
- What revenue patterns drive top performers? Compare revenue generation across team members to understand what separates high achievers from average performers. Track monthly revenue trends, deal sizes, and closing velocity to identify scalable success factors.
- Where are deals getting stuck in each rep's pipeline? Monitor funnel progression by individual sales rep to spot bottlenecks and coaching opportunities. Understanding stage-specific challenges helps managers provide targeted support and improve overall team conversion rates.
What reports you get with our sales leaderboards
A sales team leaderboard requires specific reports that reveal individual performance patterns, competitive rankings, and actionable insights for sales management. These reports should combine quantitative metrics with qualitative analysis to create a complete picture of team dynamics and individual contributions.
Win rate comparison by sales rep
Track conversion rates across all team members to identify your most effective closers and understand performance variations. This report from the Salesforce team performance dashboard shows win rates alongside deal volumes, helping you distinguish between reps who close frequently versus those who handle higher deal loads.
Revenue performance by deal type and owner
Compare how different sales reps perform with specific opportunity categories like partnerships, upsells, or new business acquisitions. The Salesforce team performance dashboard breaks down revenue by deal type per rep, allowing you to optimize assignments and match representatives with opportunities that align with their proven strengths.
Sales funnel analysis by individual rep
Monitor how deals progress through pipeline stages for each team member to identify bottlenecks and coaching opportunities. This insight from the Salesforce team performance dashboard reveals where specific reps excel or struggle in the sales process, enabling targeted development and support strategies.
How to create a sales leaderboard dashboard?
Step 1
1
Go to the Readme tab where you can see instructions on how to set up the sales leaderboard template.
Step 2
2
Click the button to set up the Coupler.io connector for your Salesforce account.
Step 3
3
Follow the instructions to prepare and load data to the dashboard.
Step 4
4
Go back to Coupler.io to configure the schedule for the data refresh of your sales leaderboard reporting dashboard.


 Salesforce
