Optimize your ad spends with automated reporting
Understand how your campaigns perform by consolidating data from multiple channels. Remove manual data exporting with Coupler.io integrations.

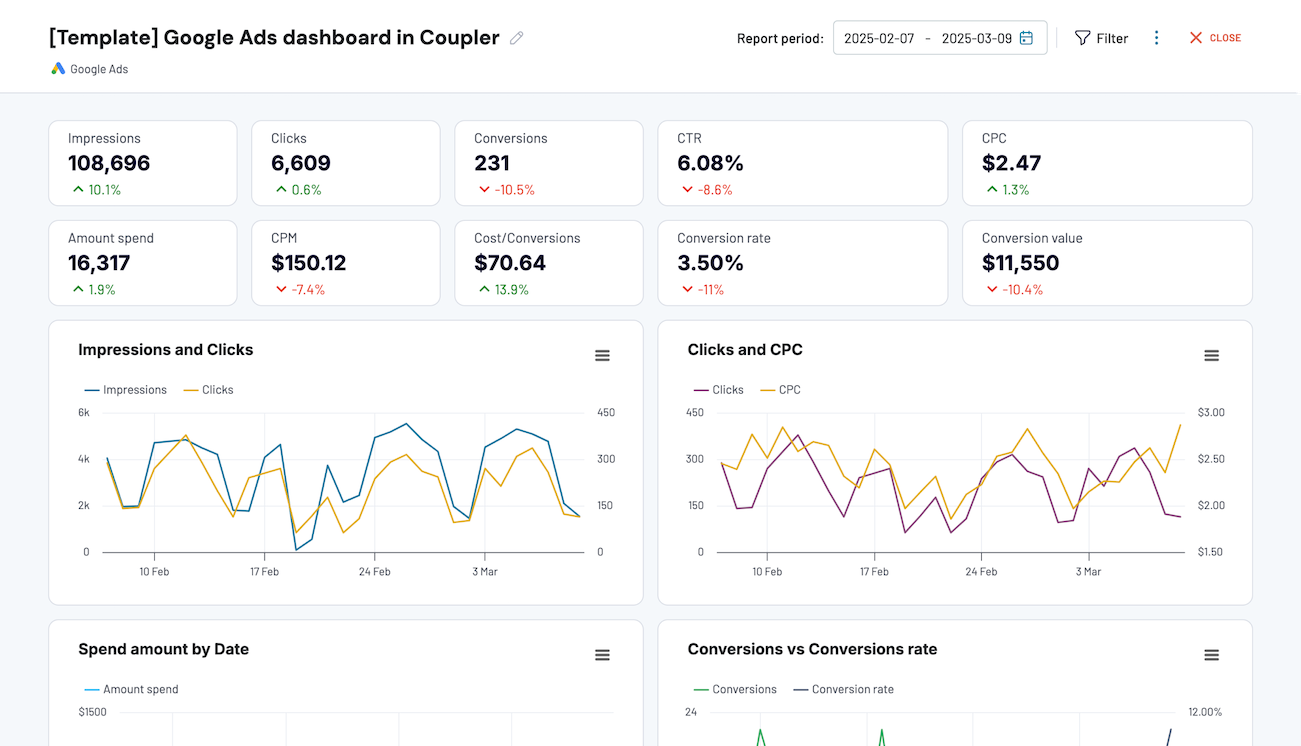
Get multichannel PPC dashboard
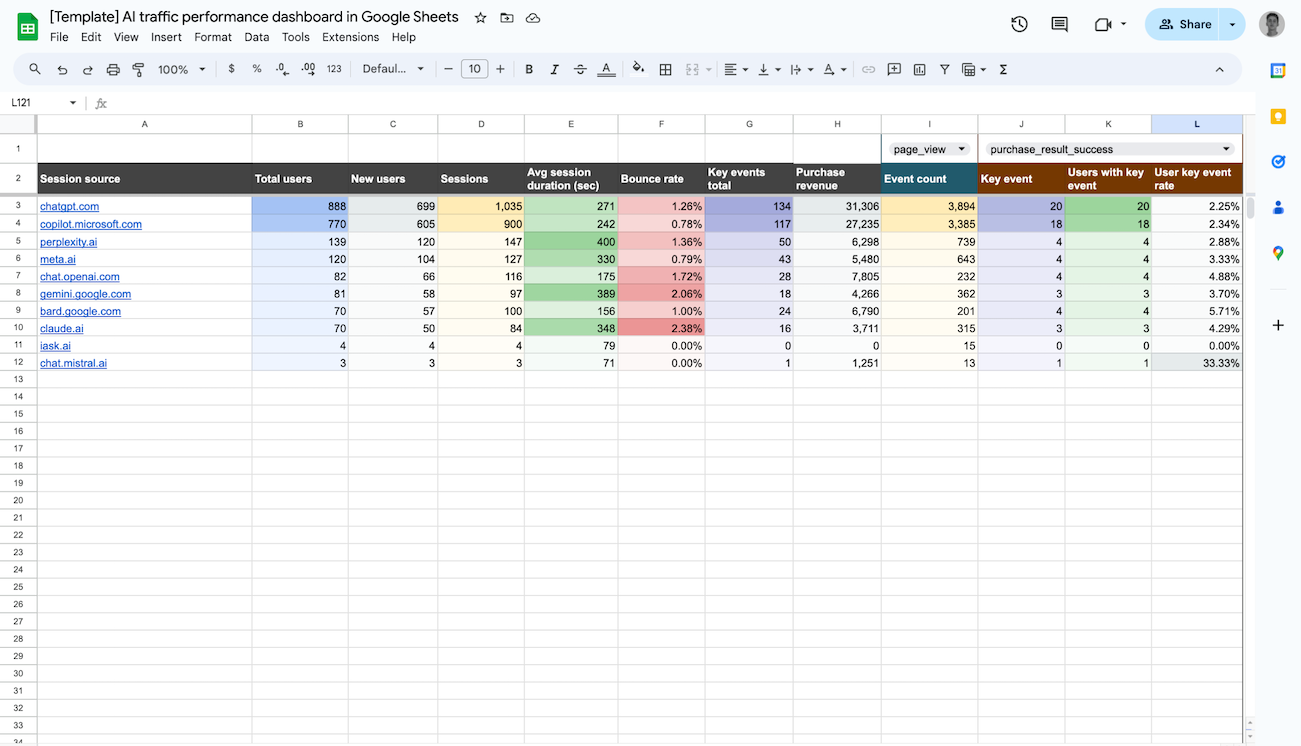
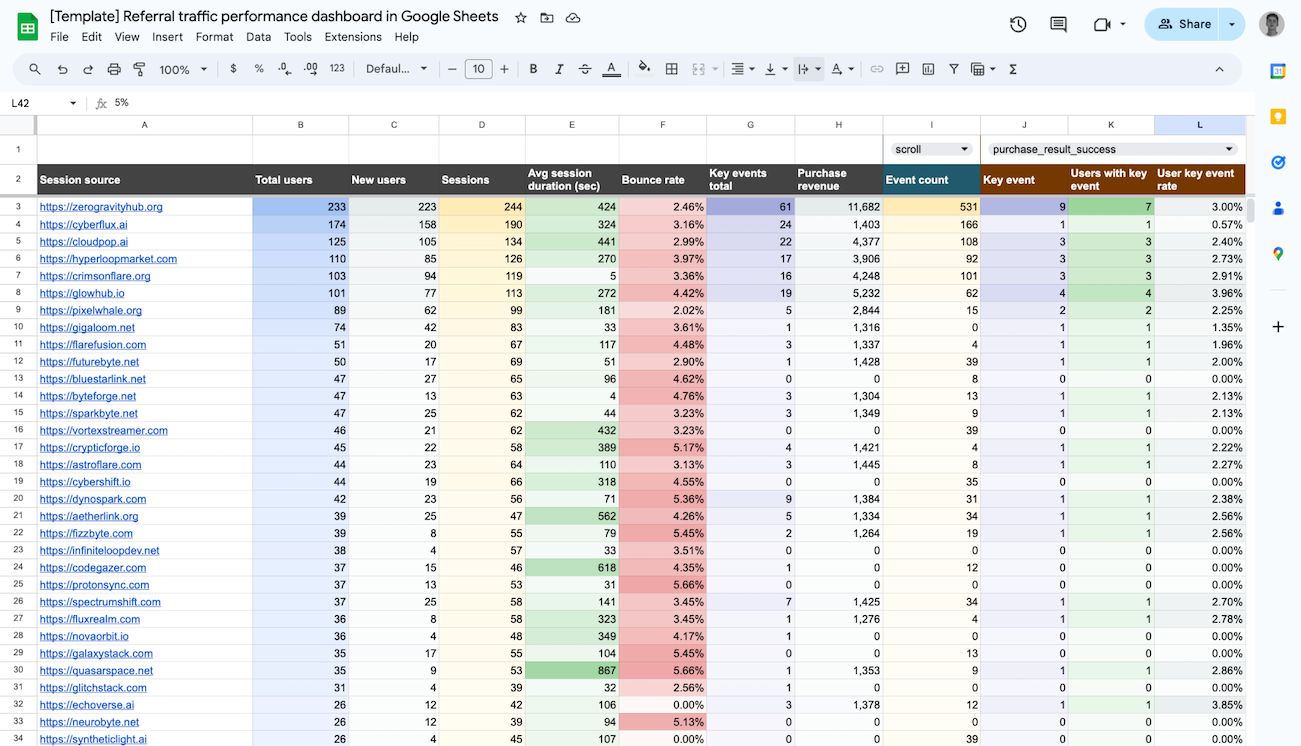
Stop hopping between interfaces to export data for your ad reports. You don’t have to rely on data analysts or BI experts to handle integrations. Coupler.io automatically collects data from all your advertizing platforms so you can focus on performamce. Use tools like Looker Studio, Power BI, or Tableau to visualize your report. Use one of our dashboard templates to answer the questions of key stakeholders or clients – even at short notice.

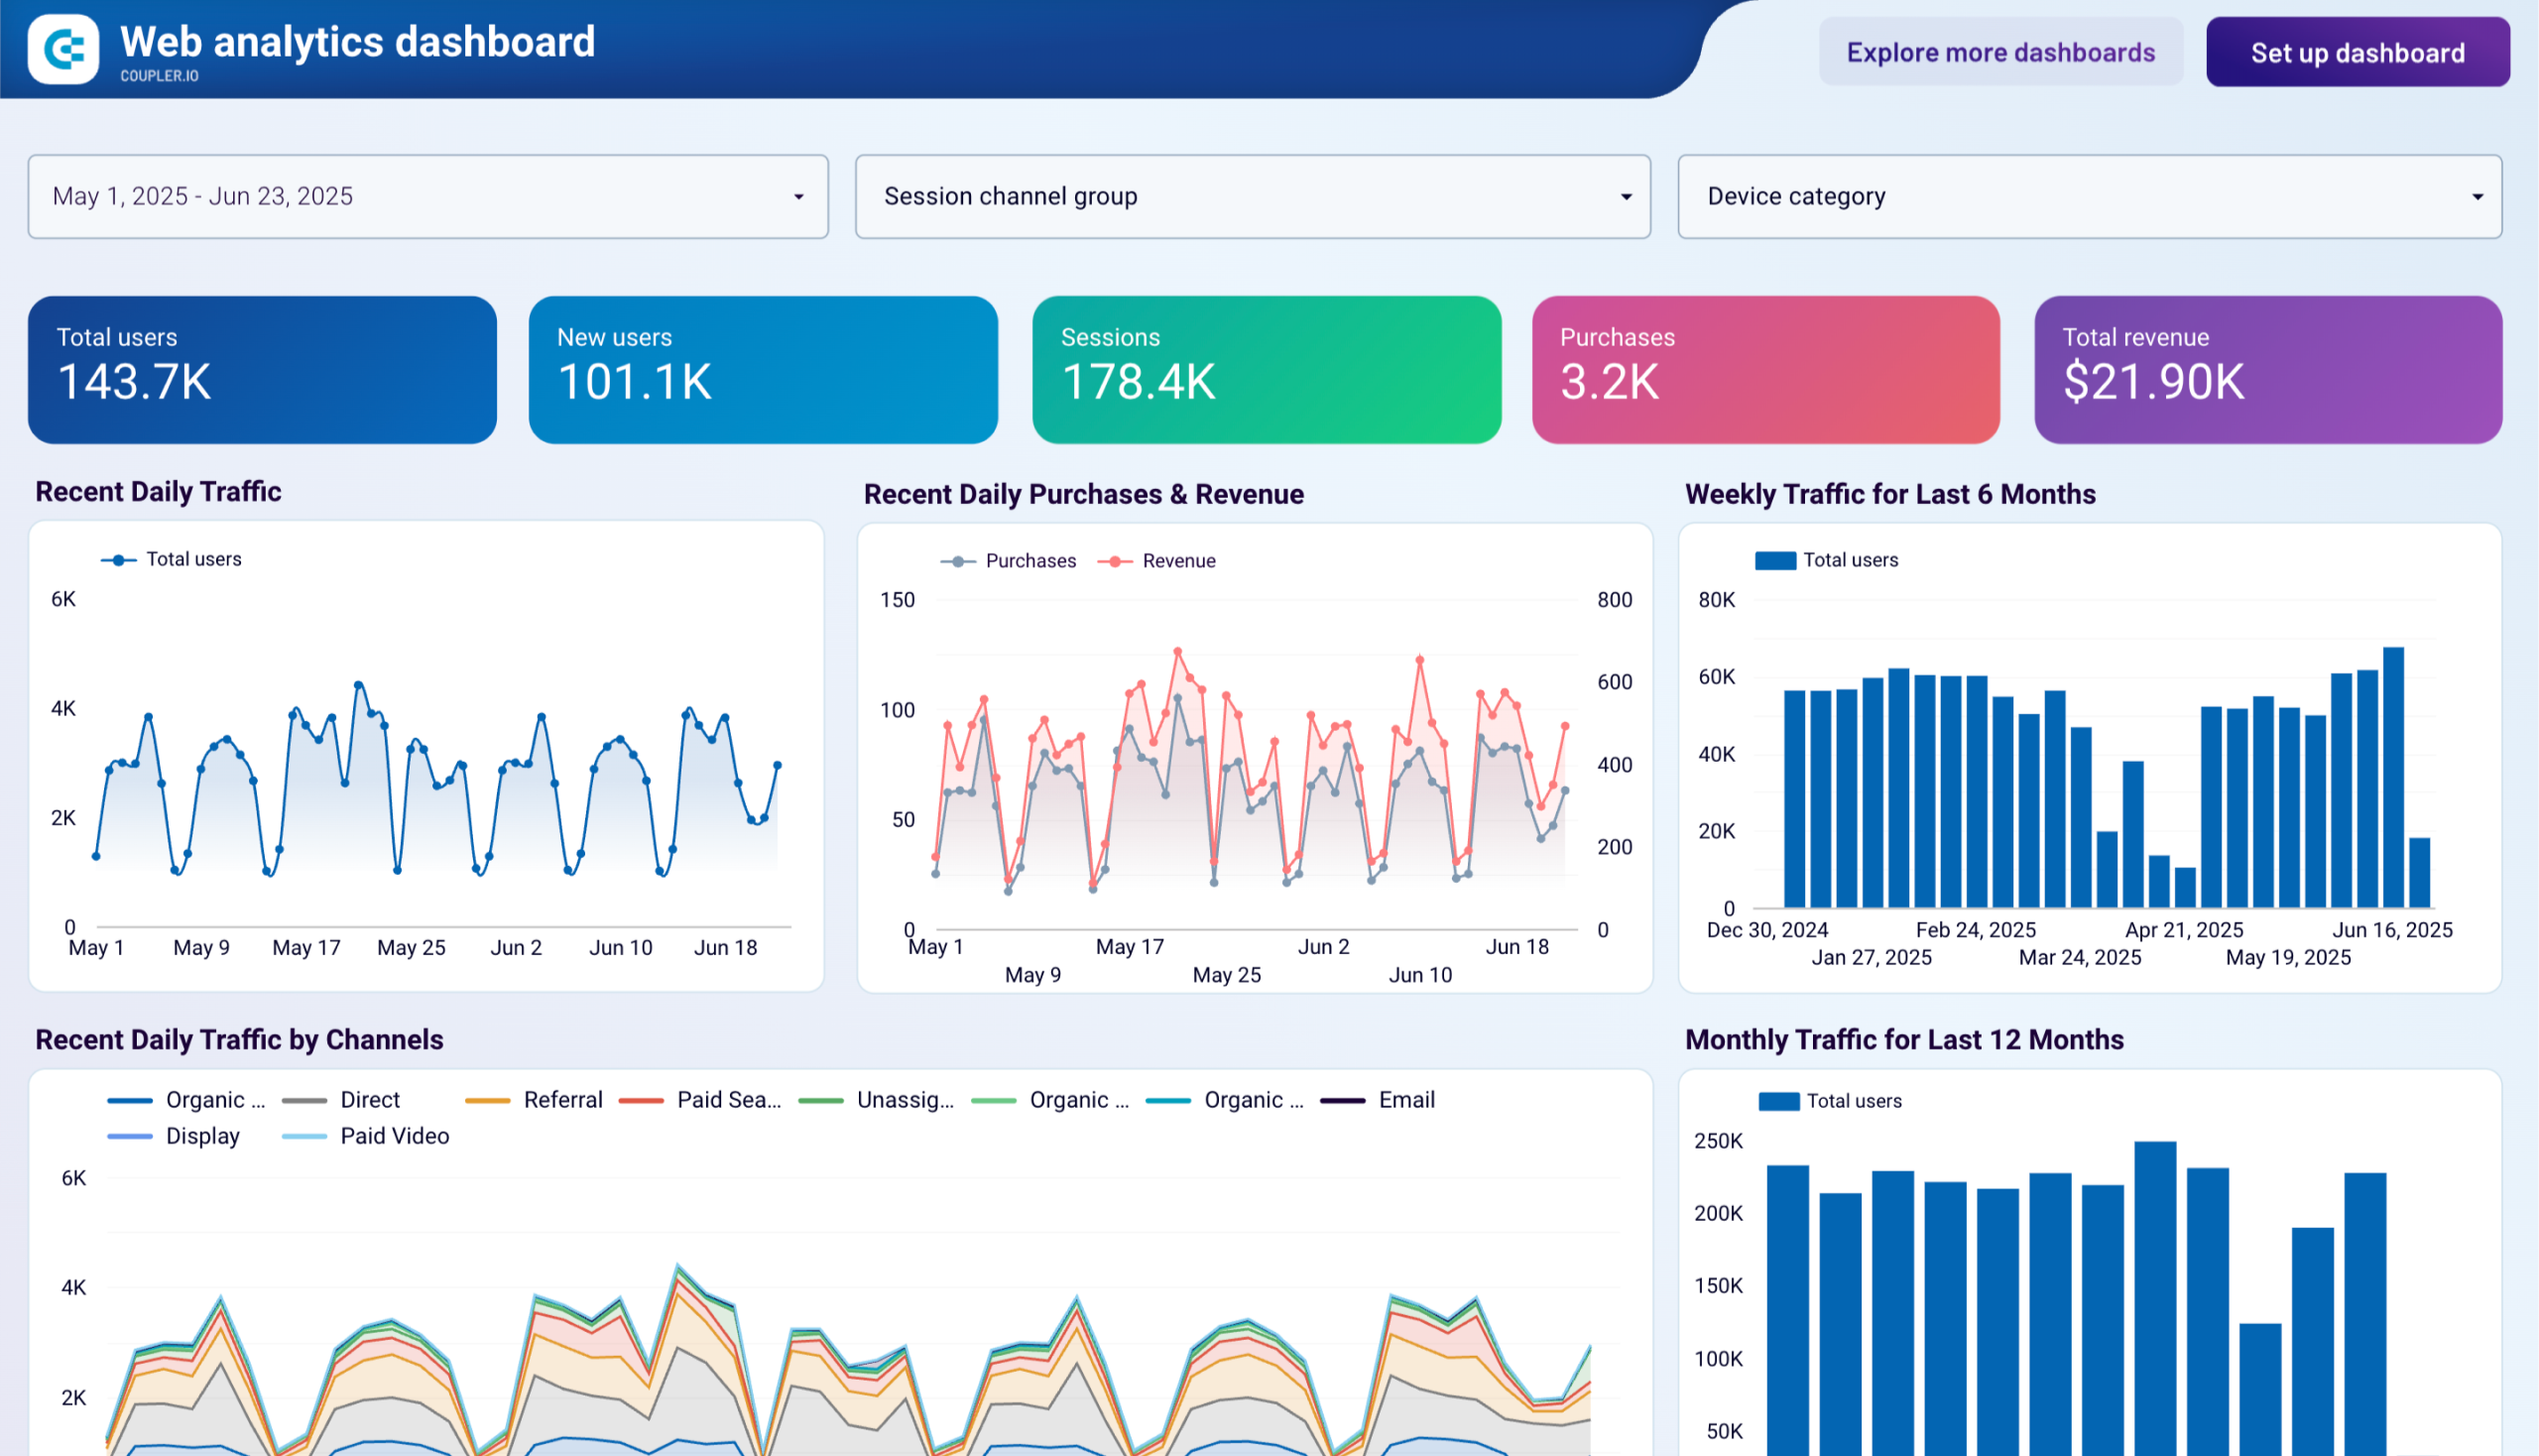
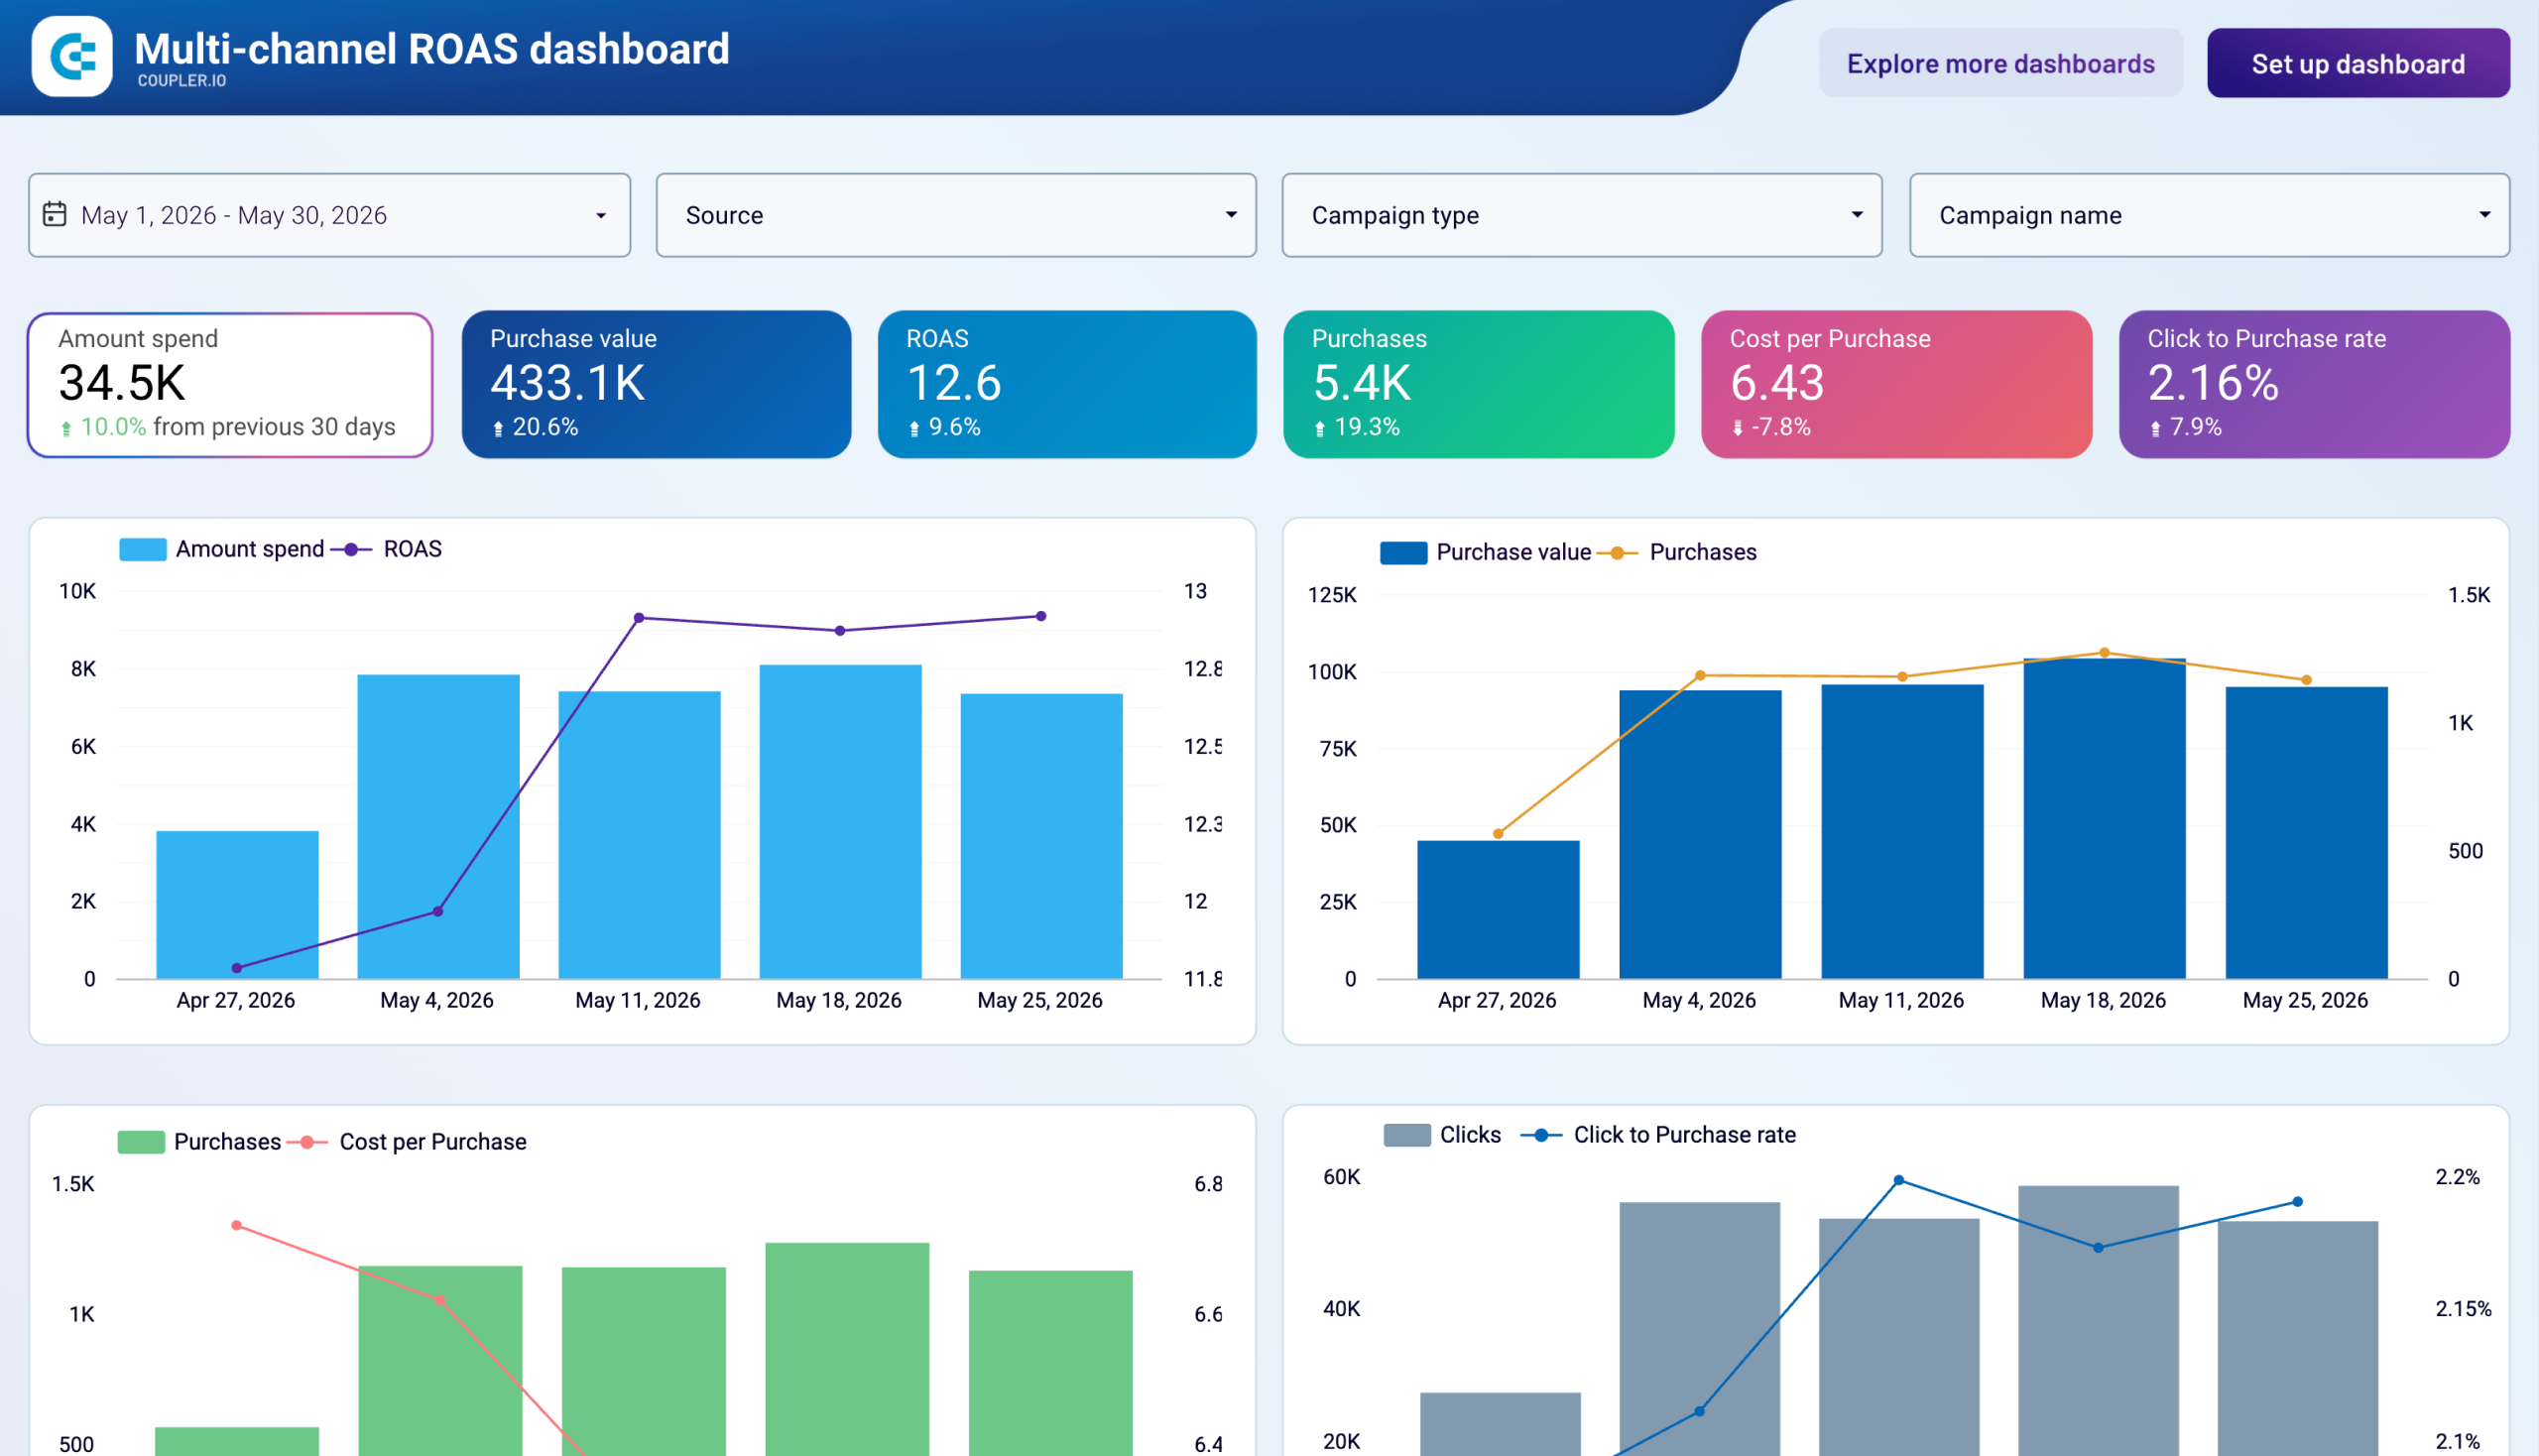
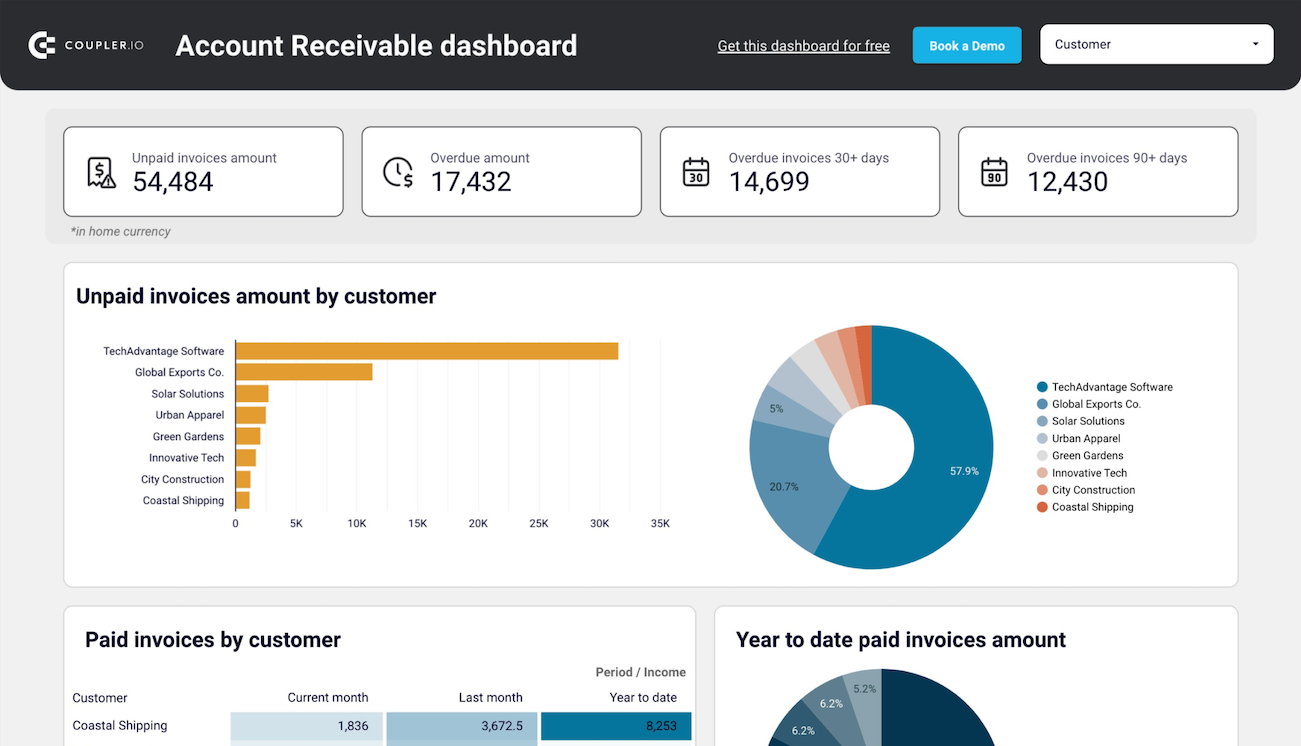
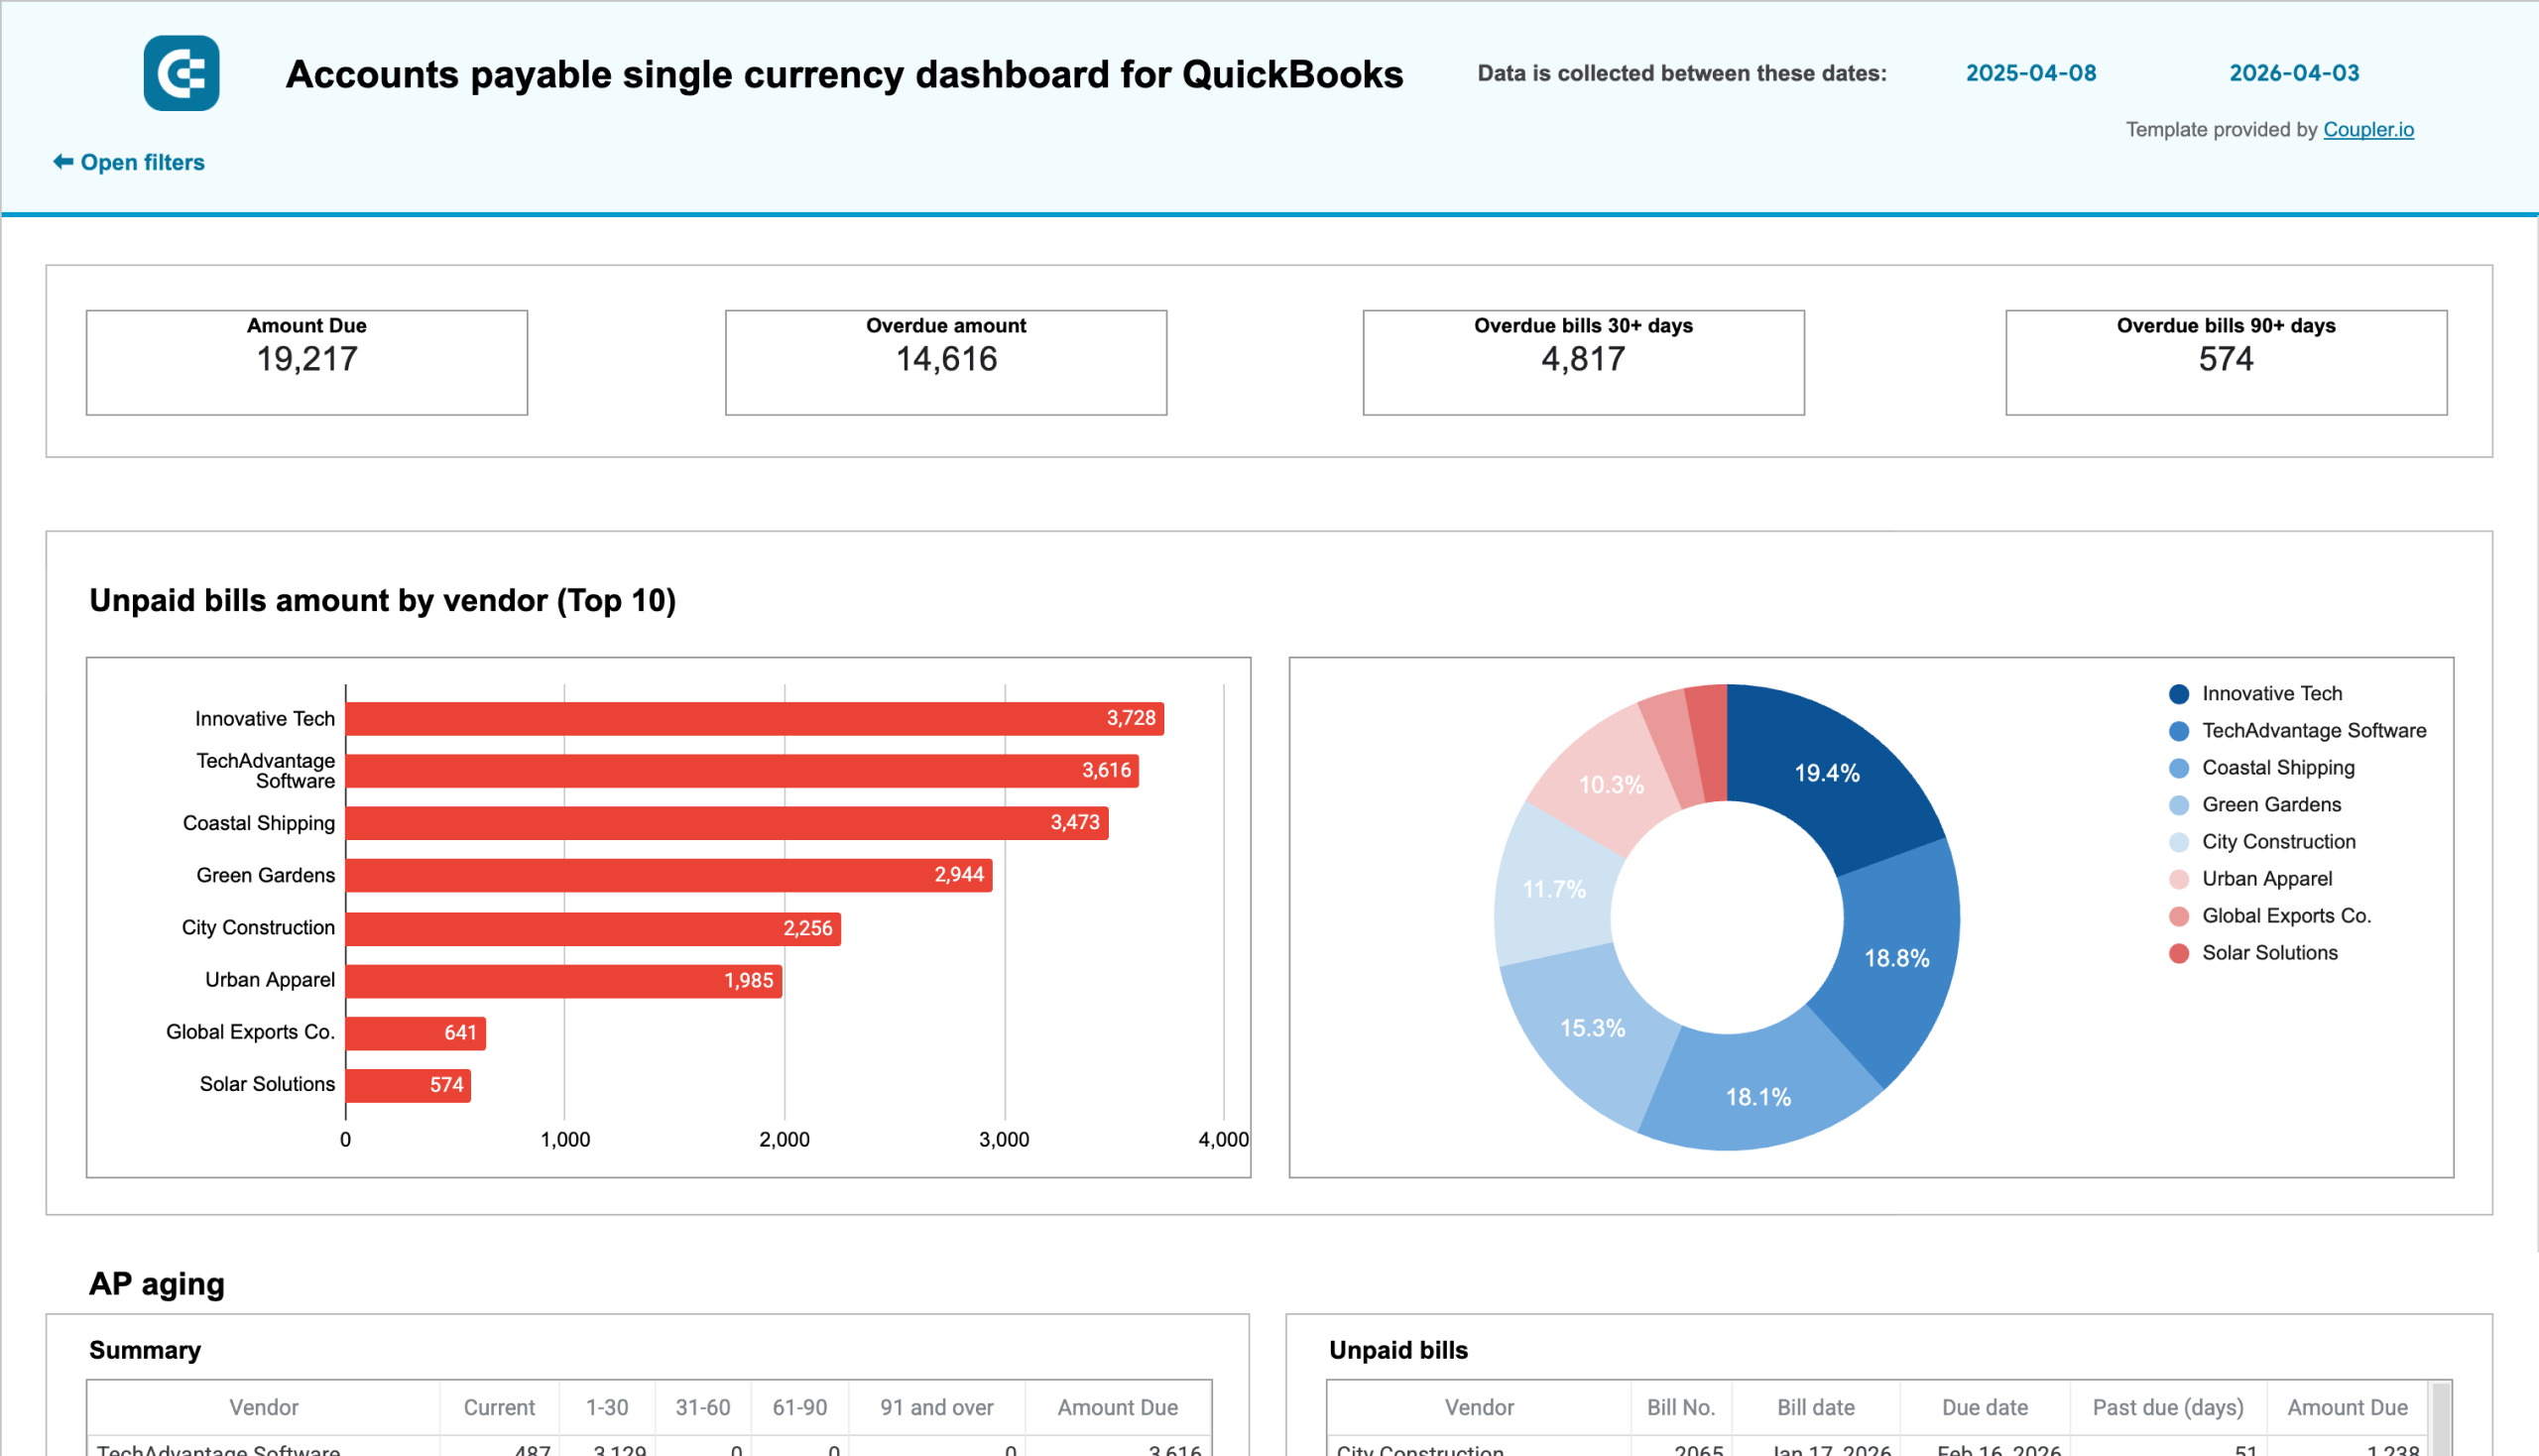
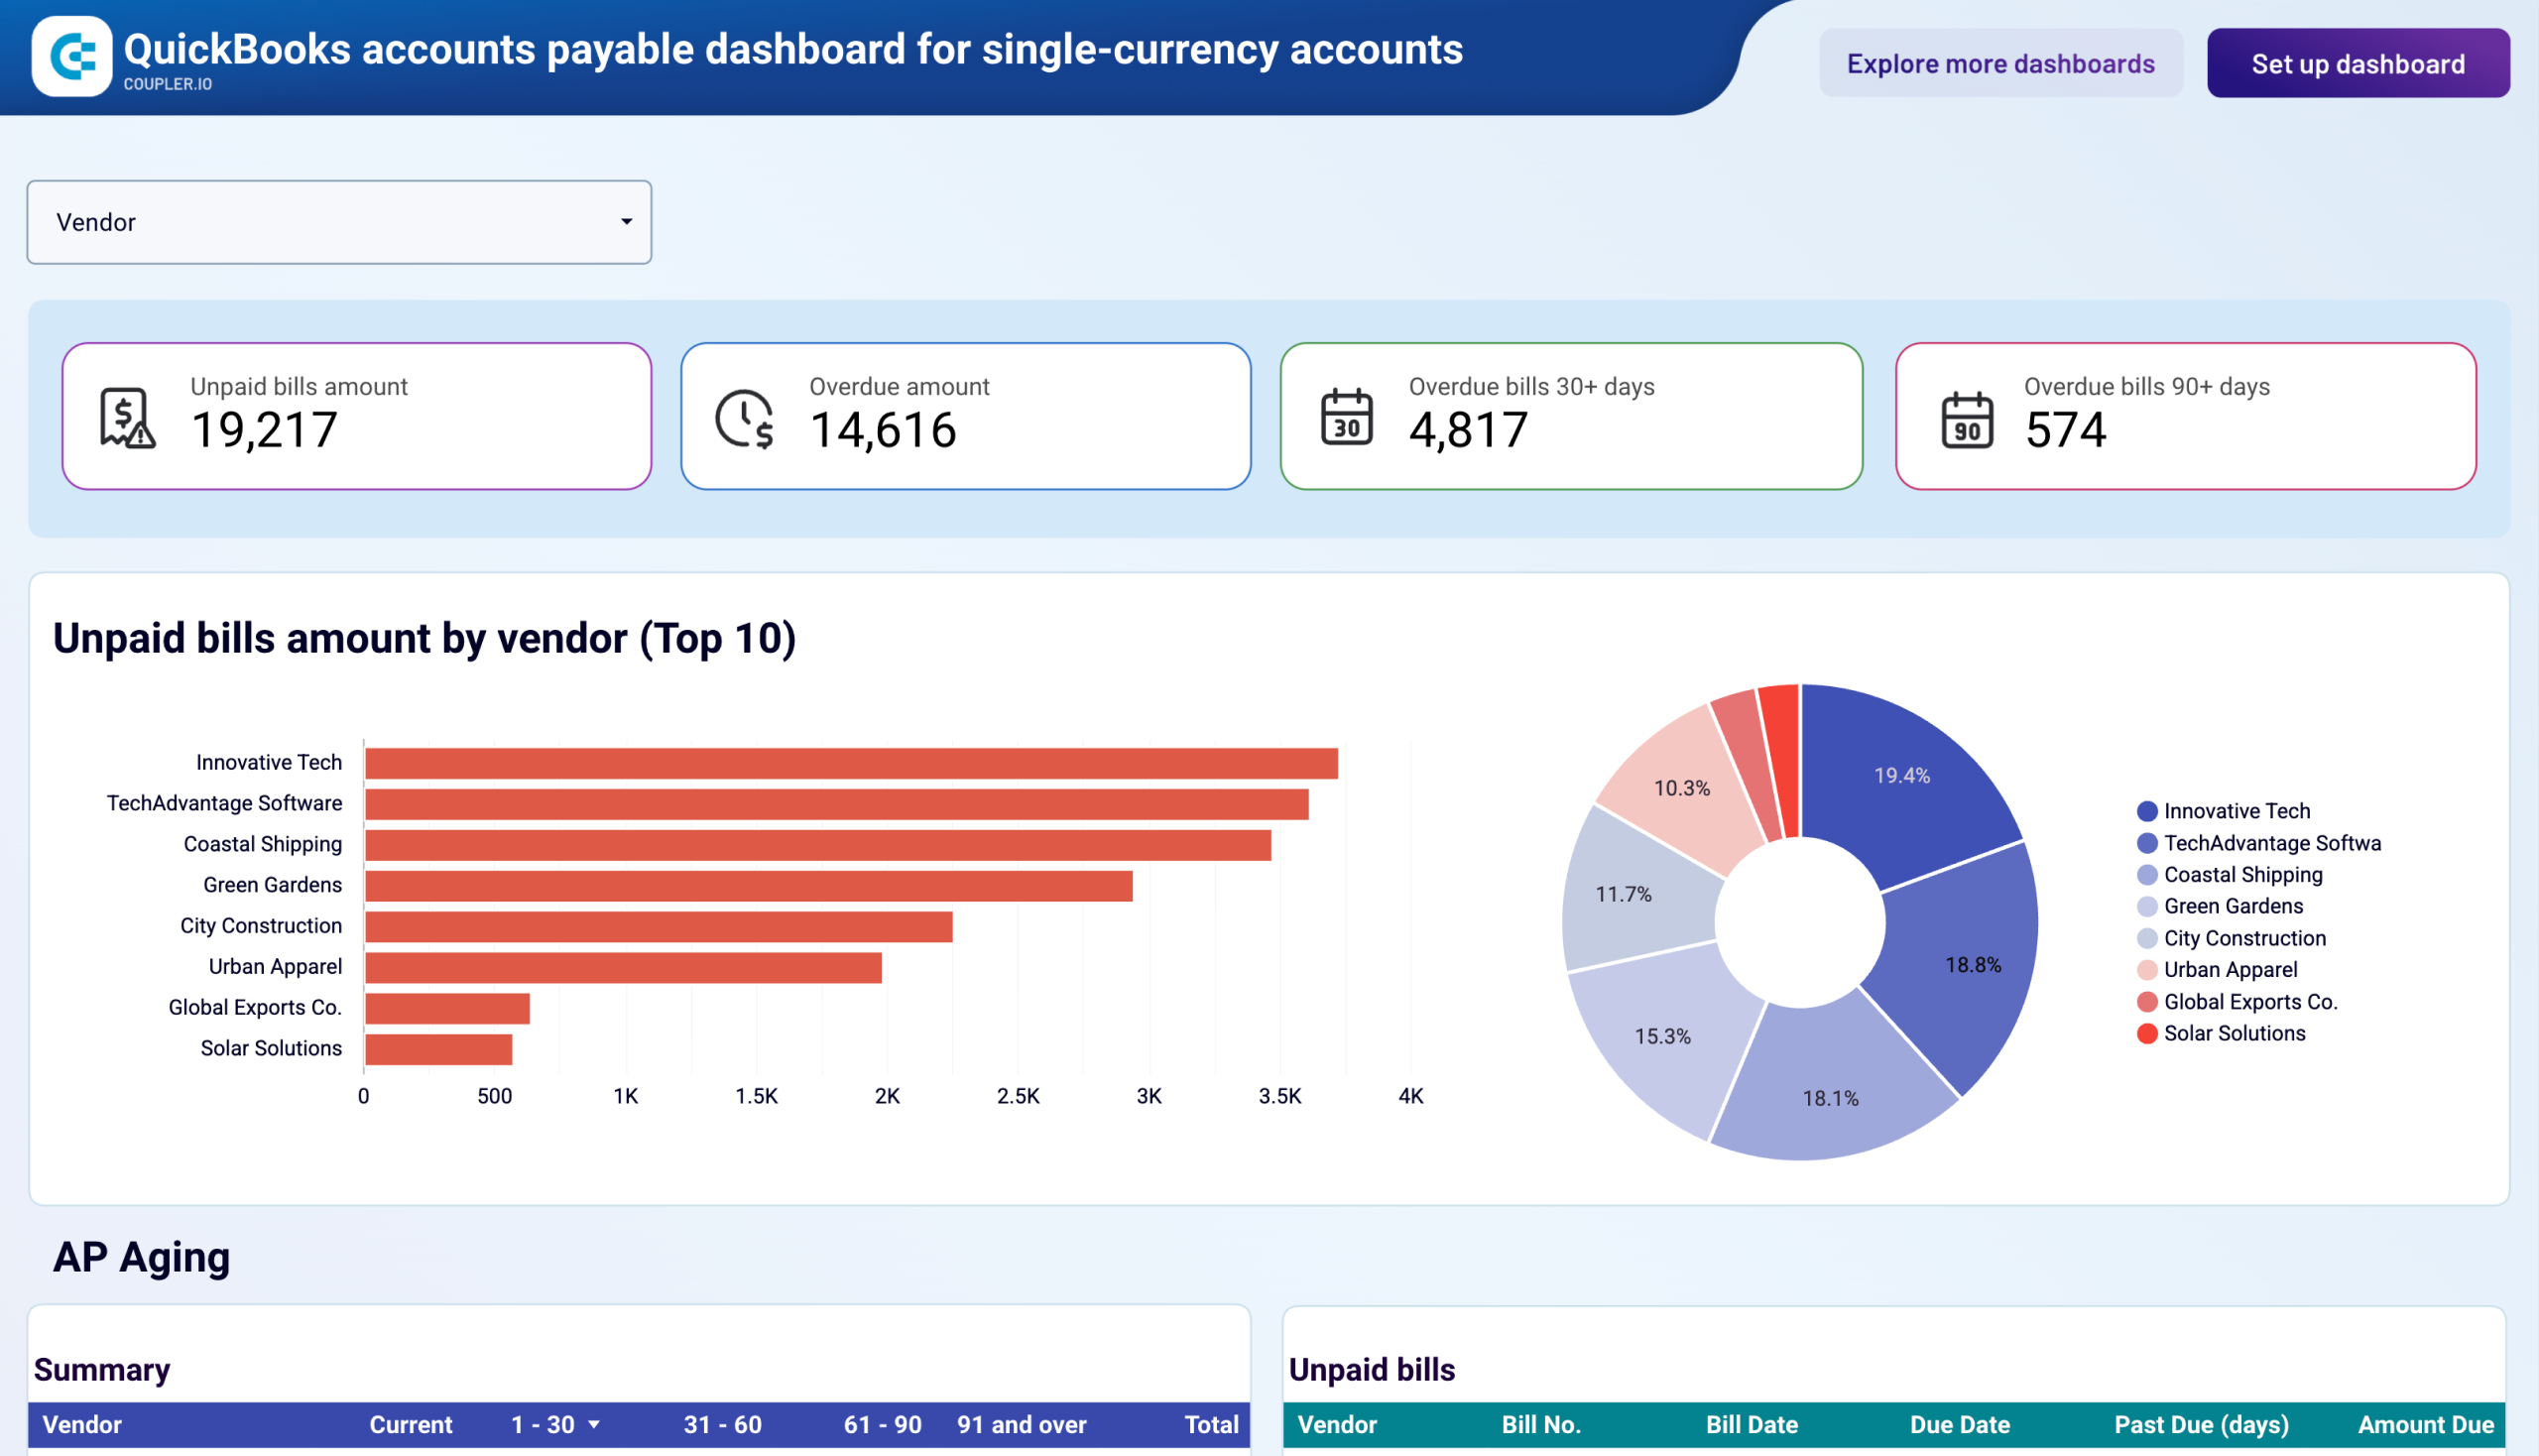
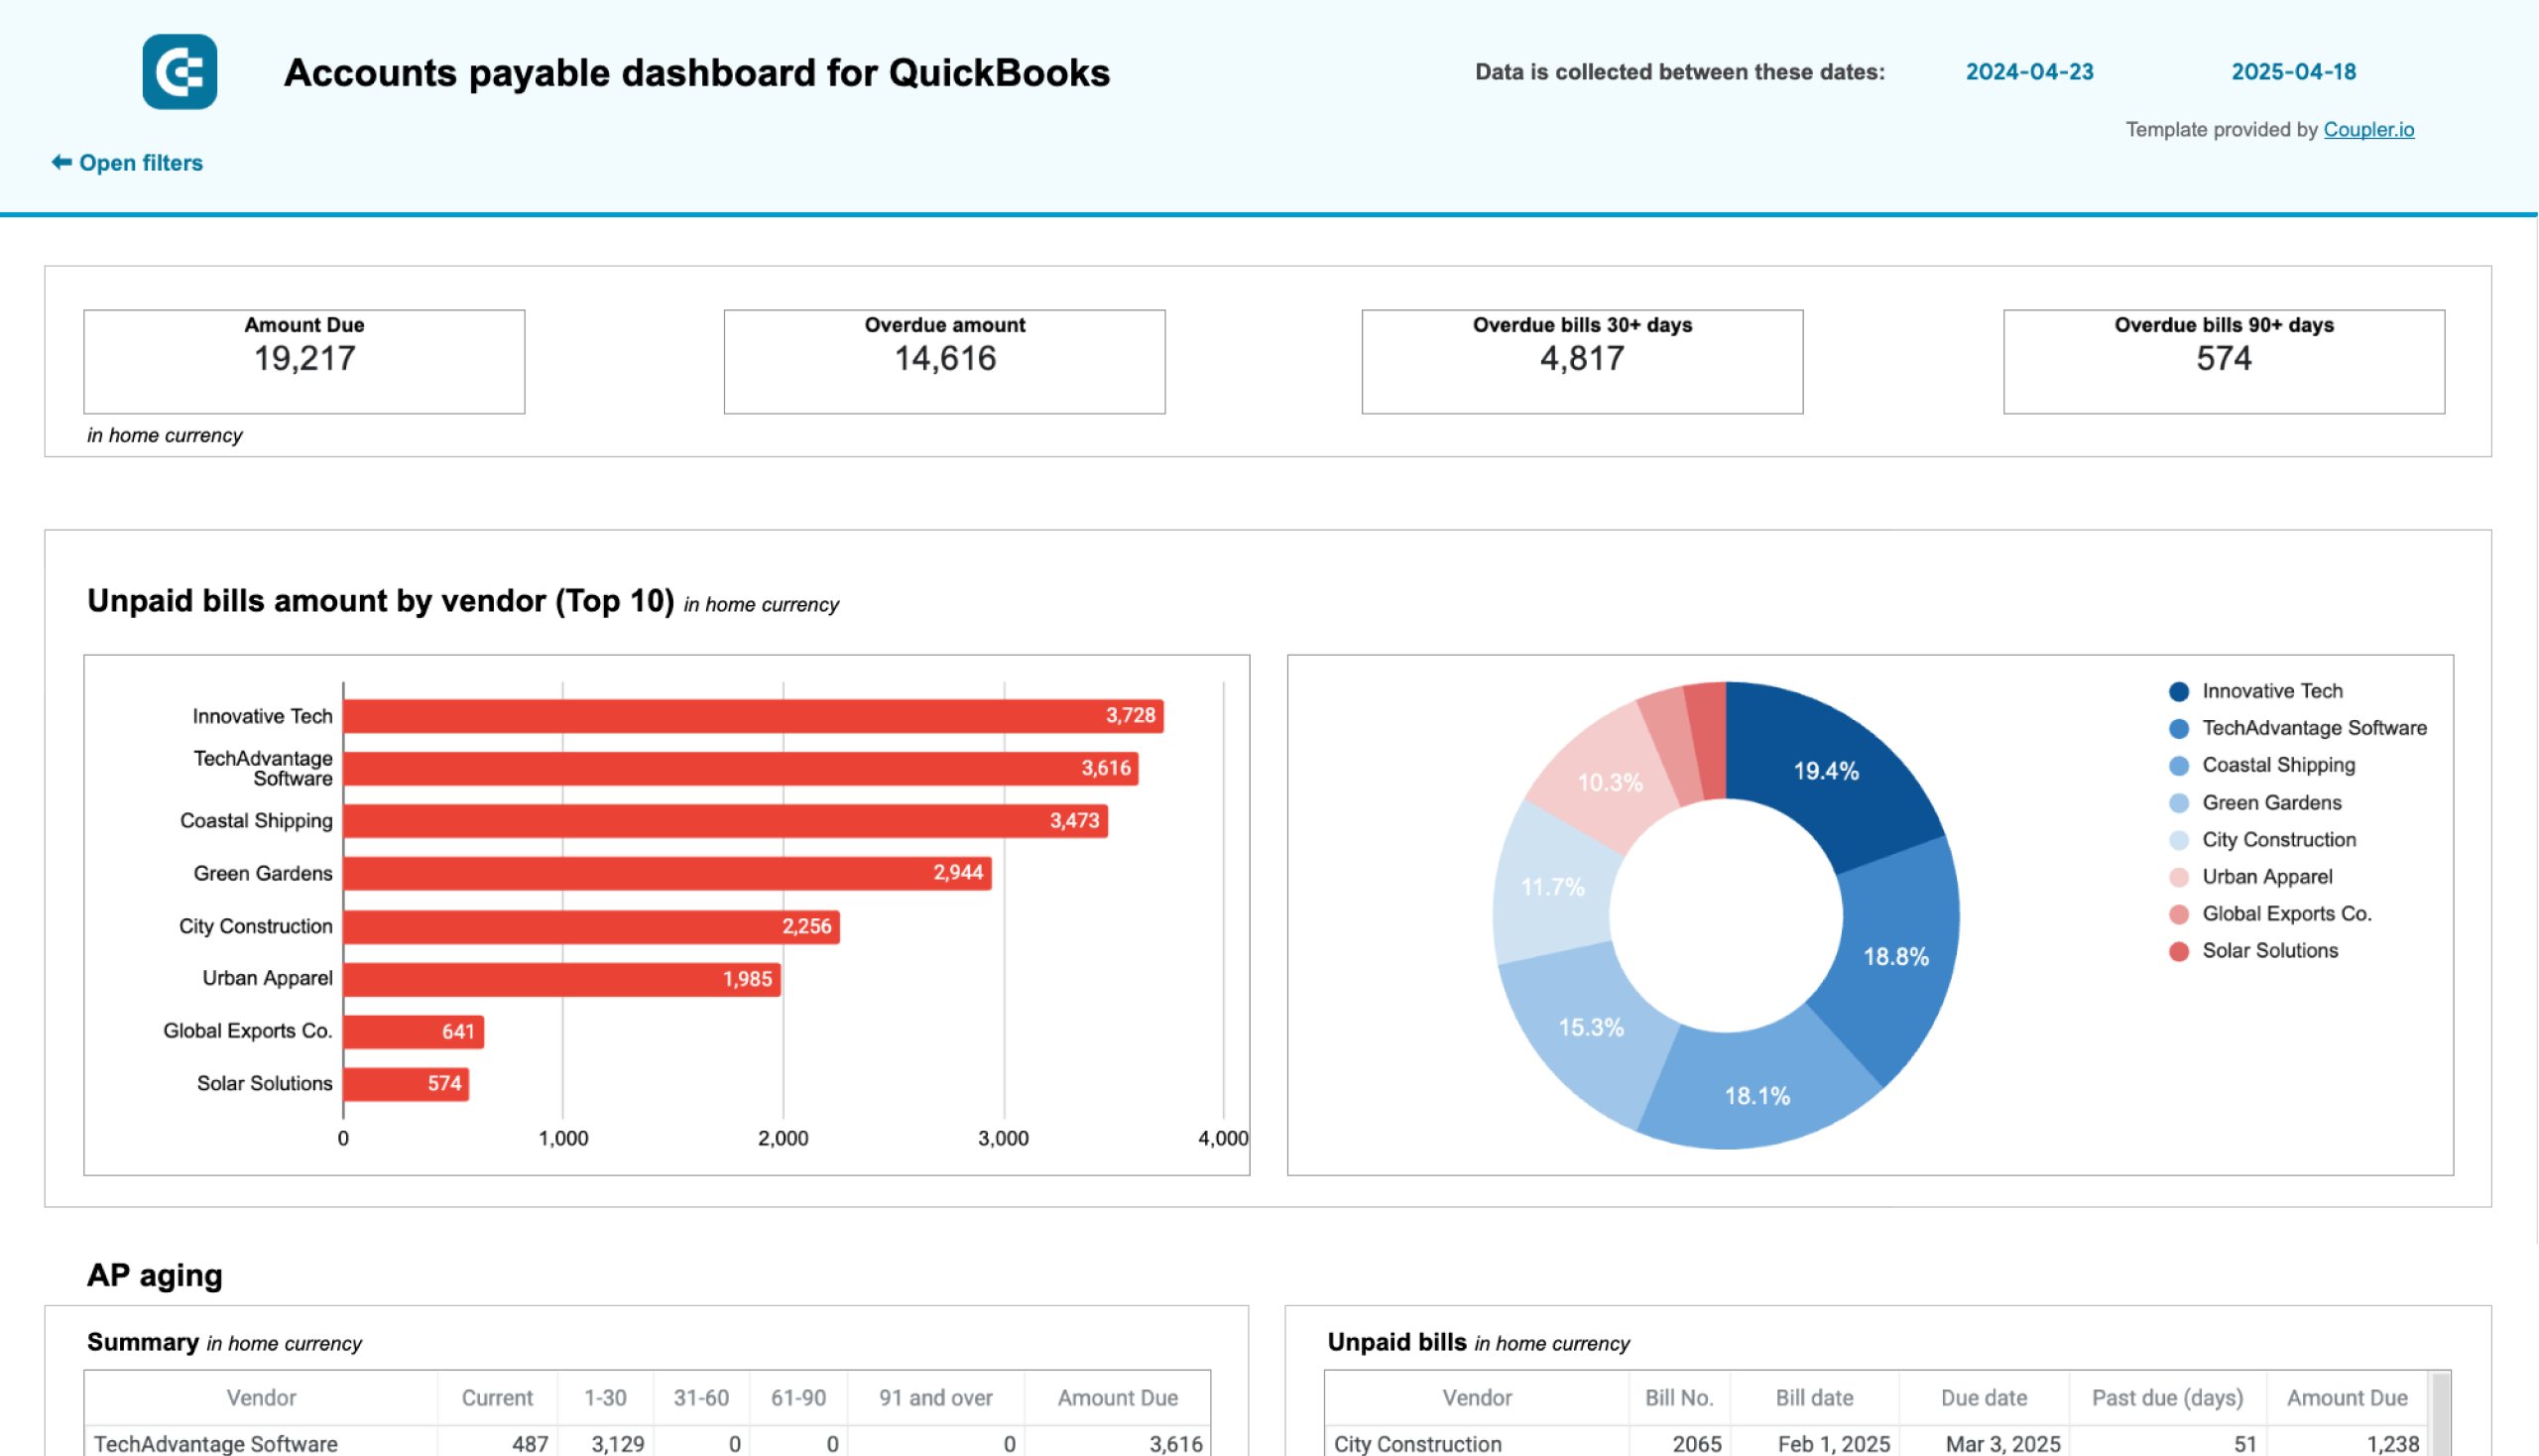
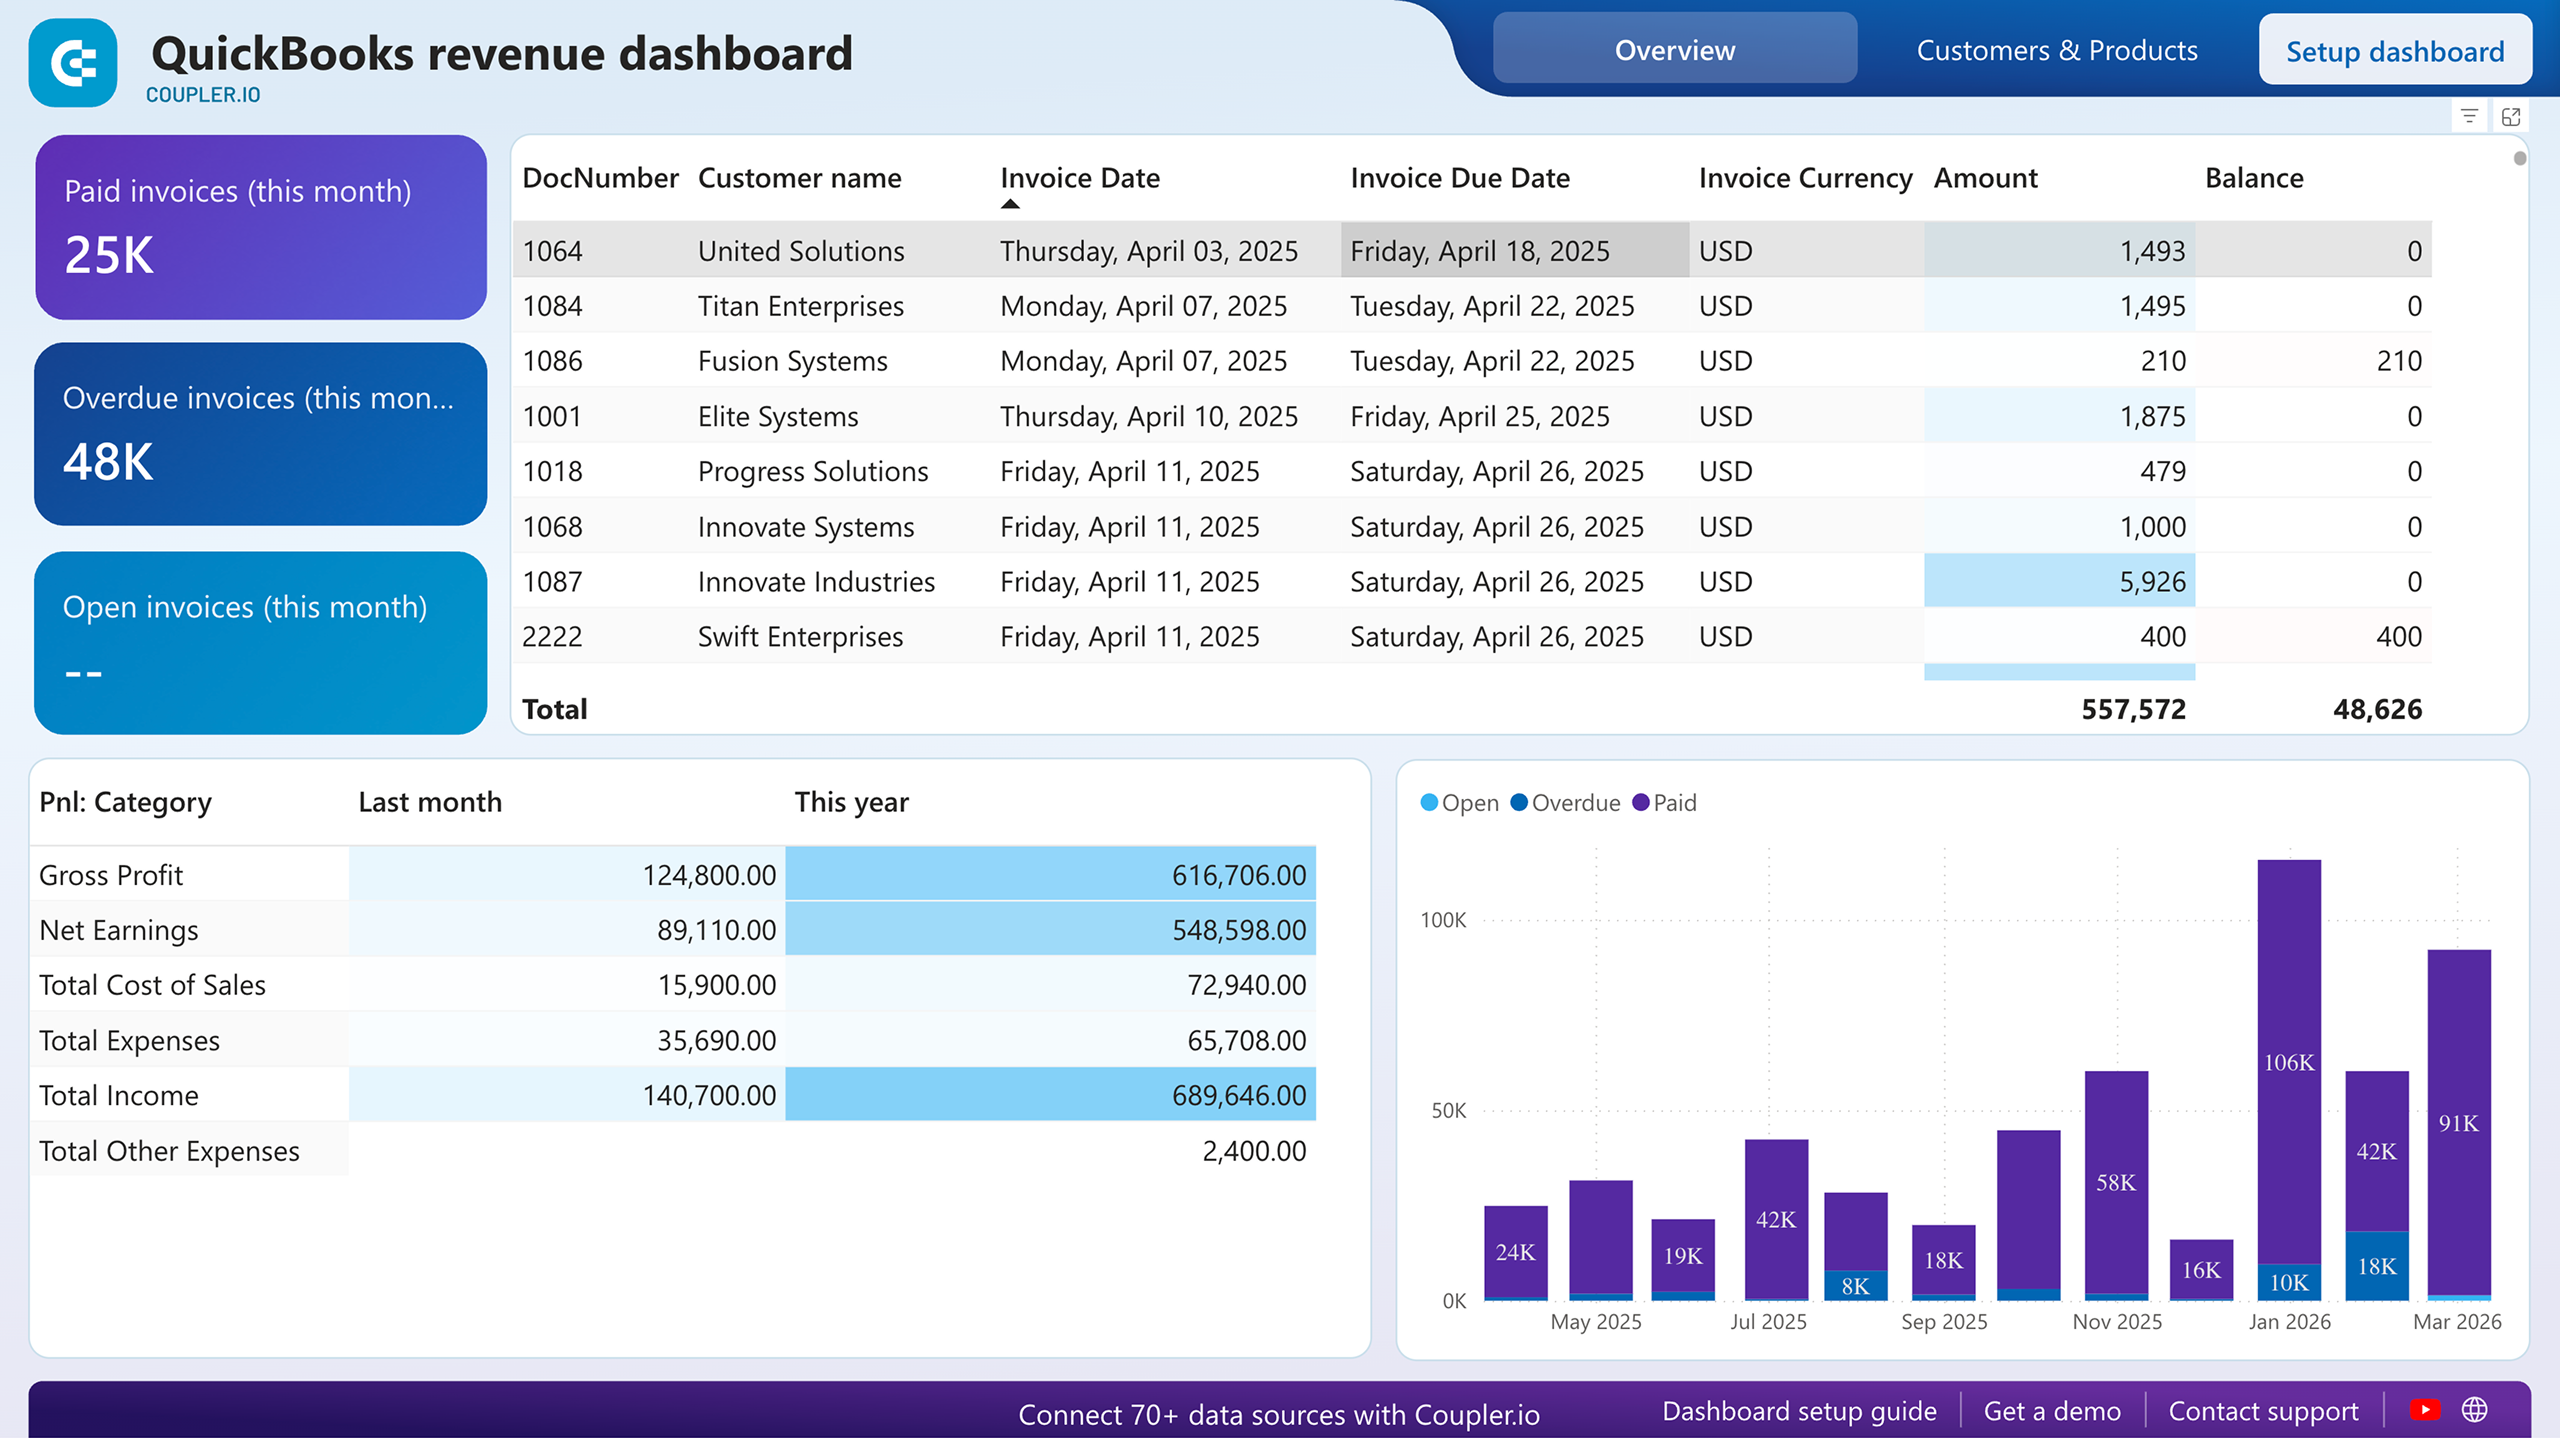
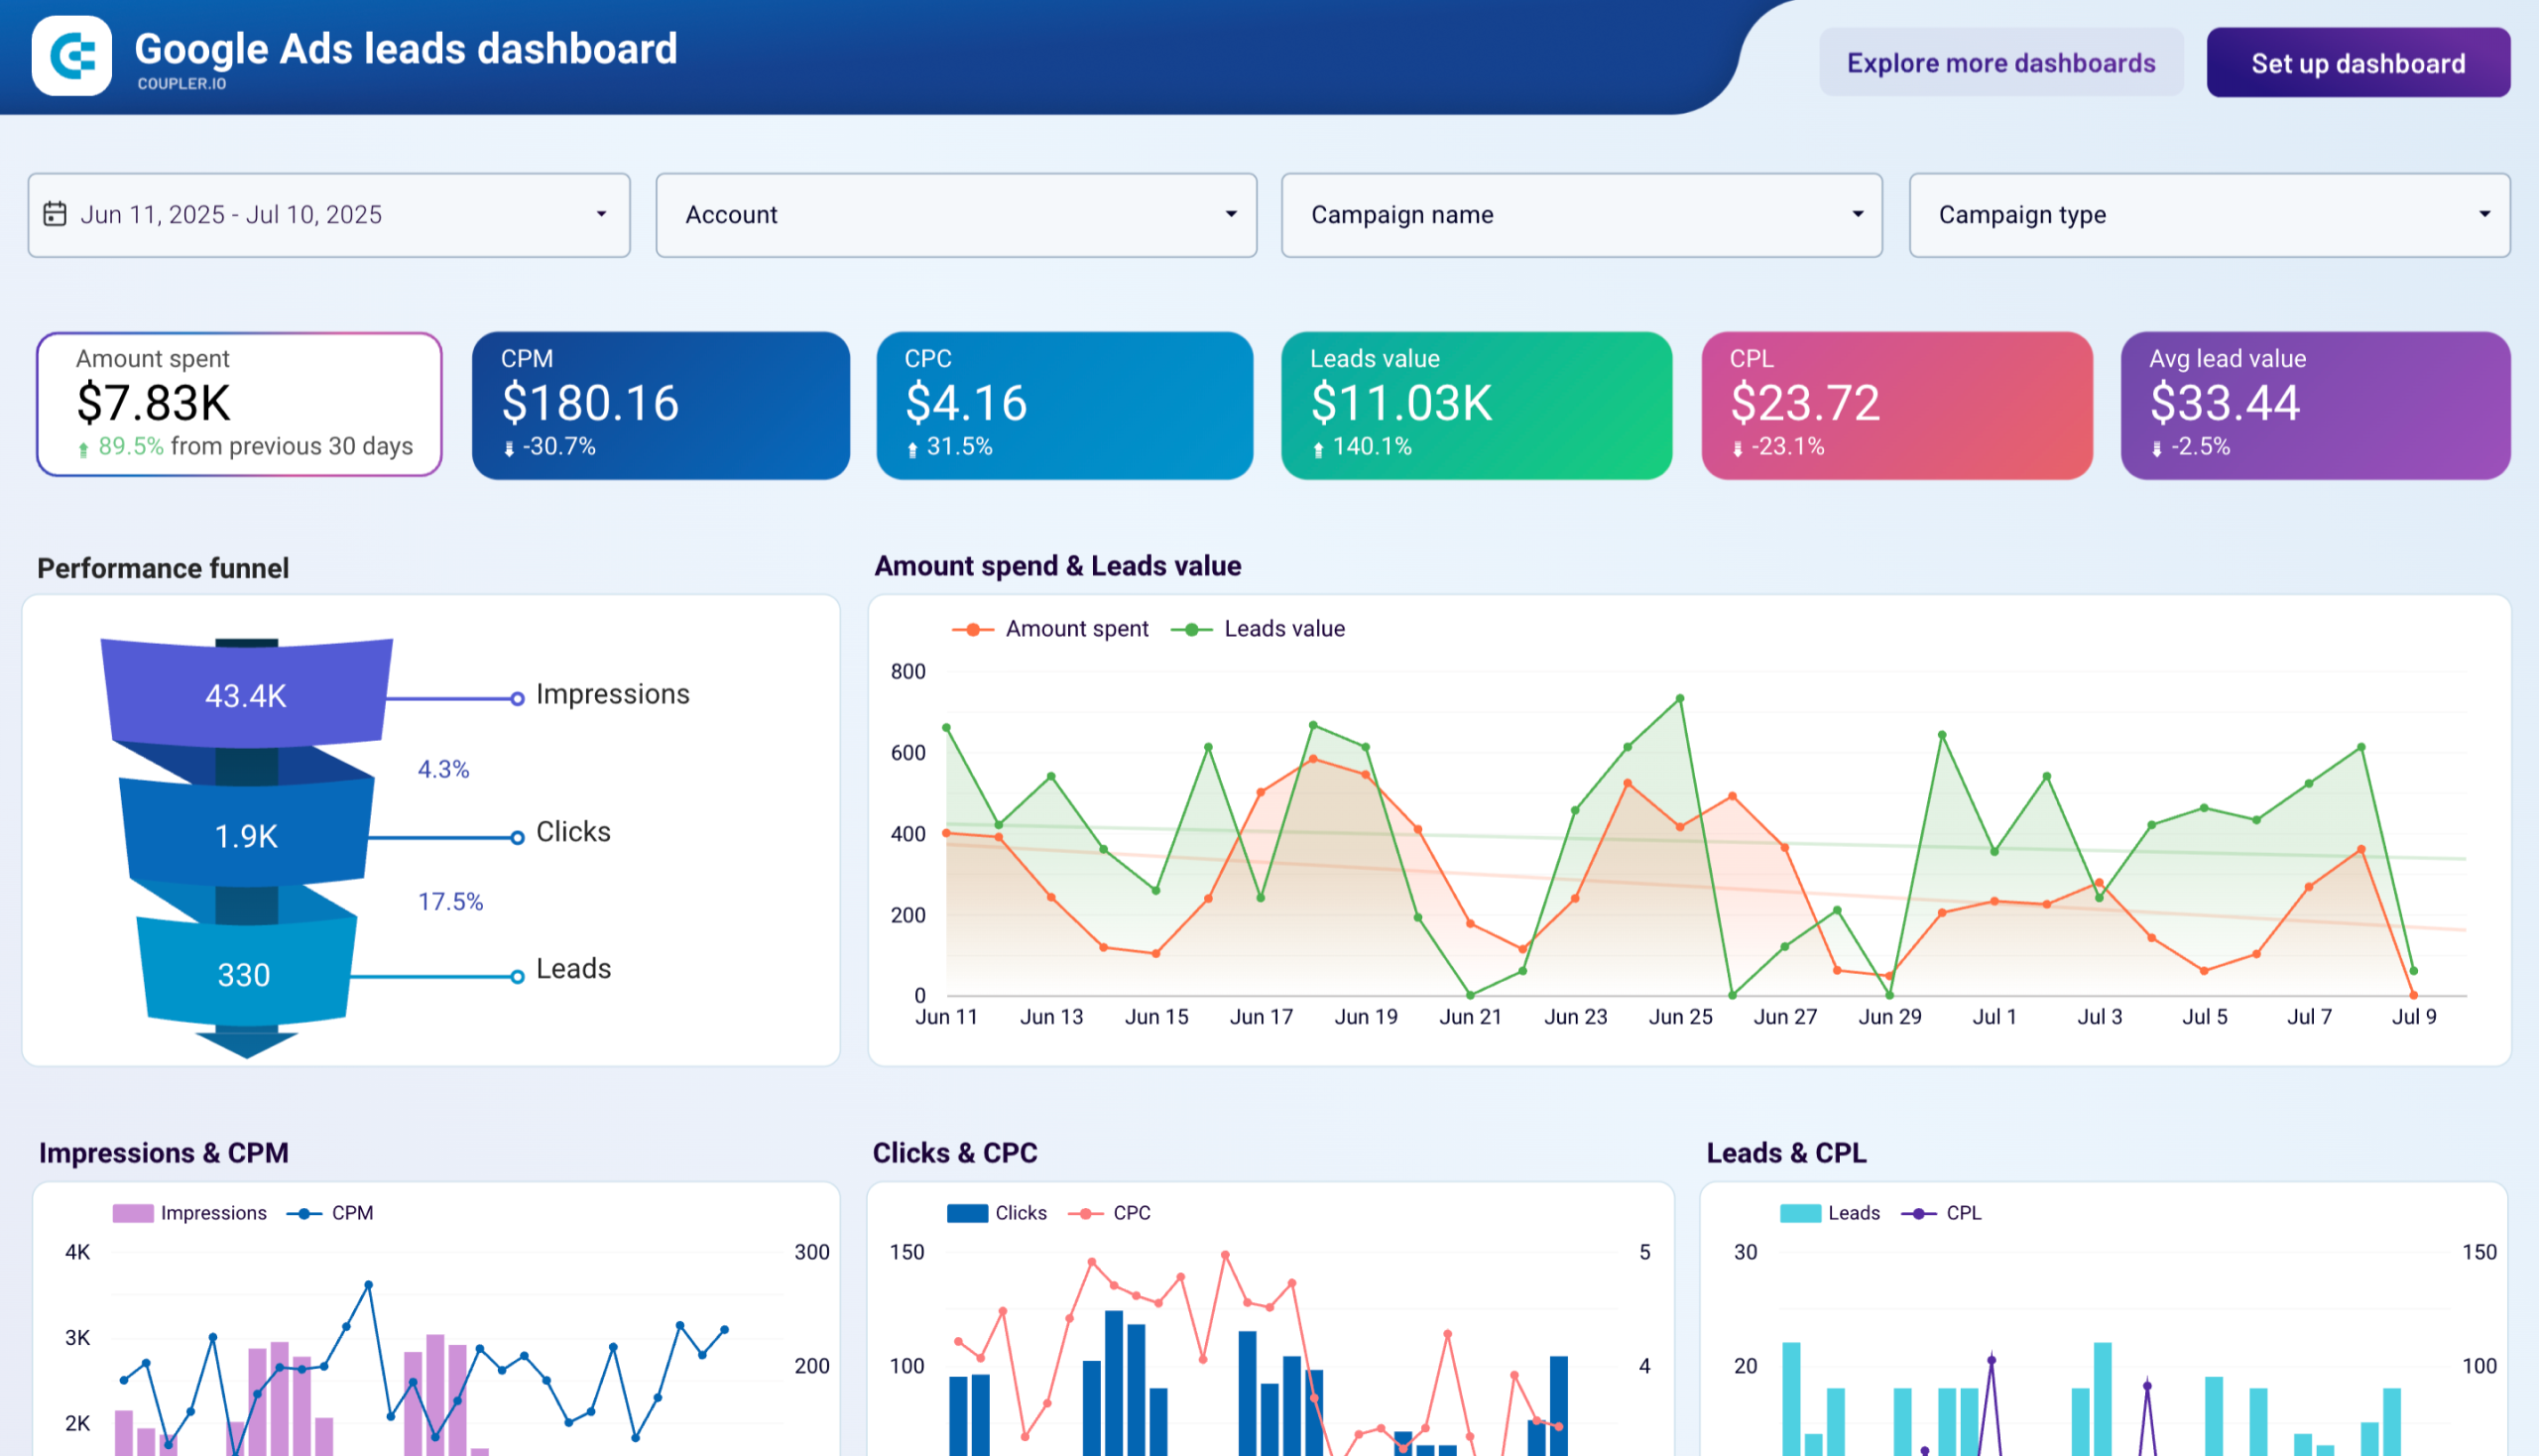
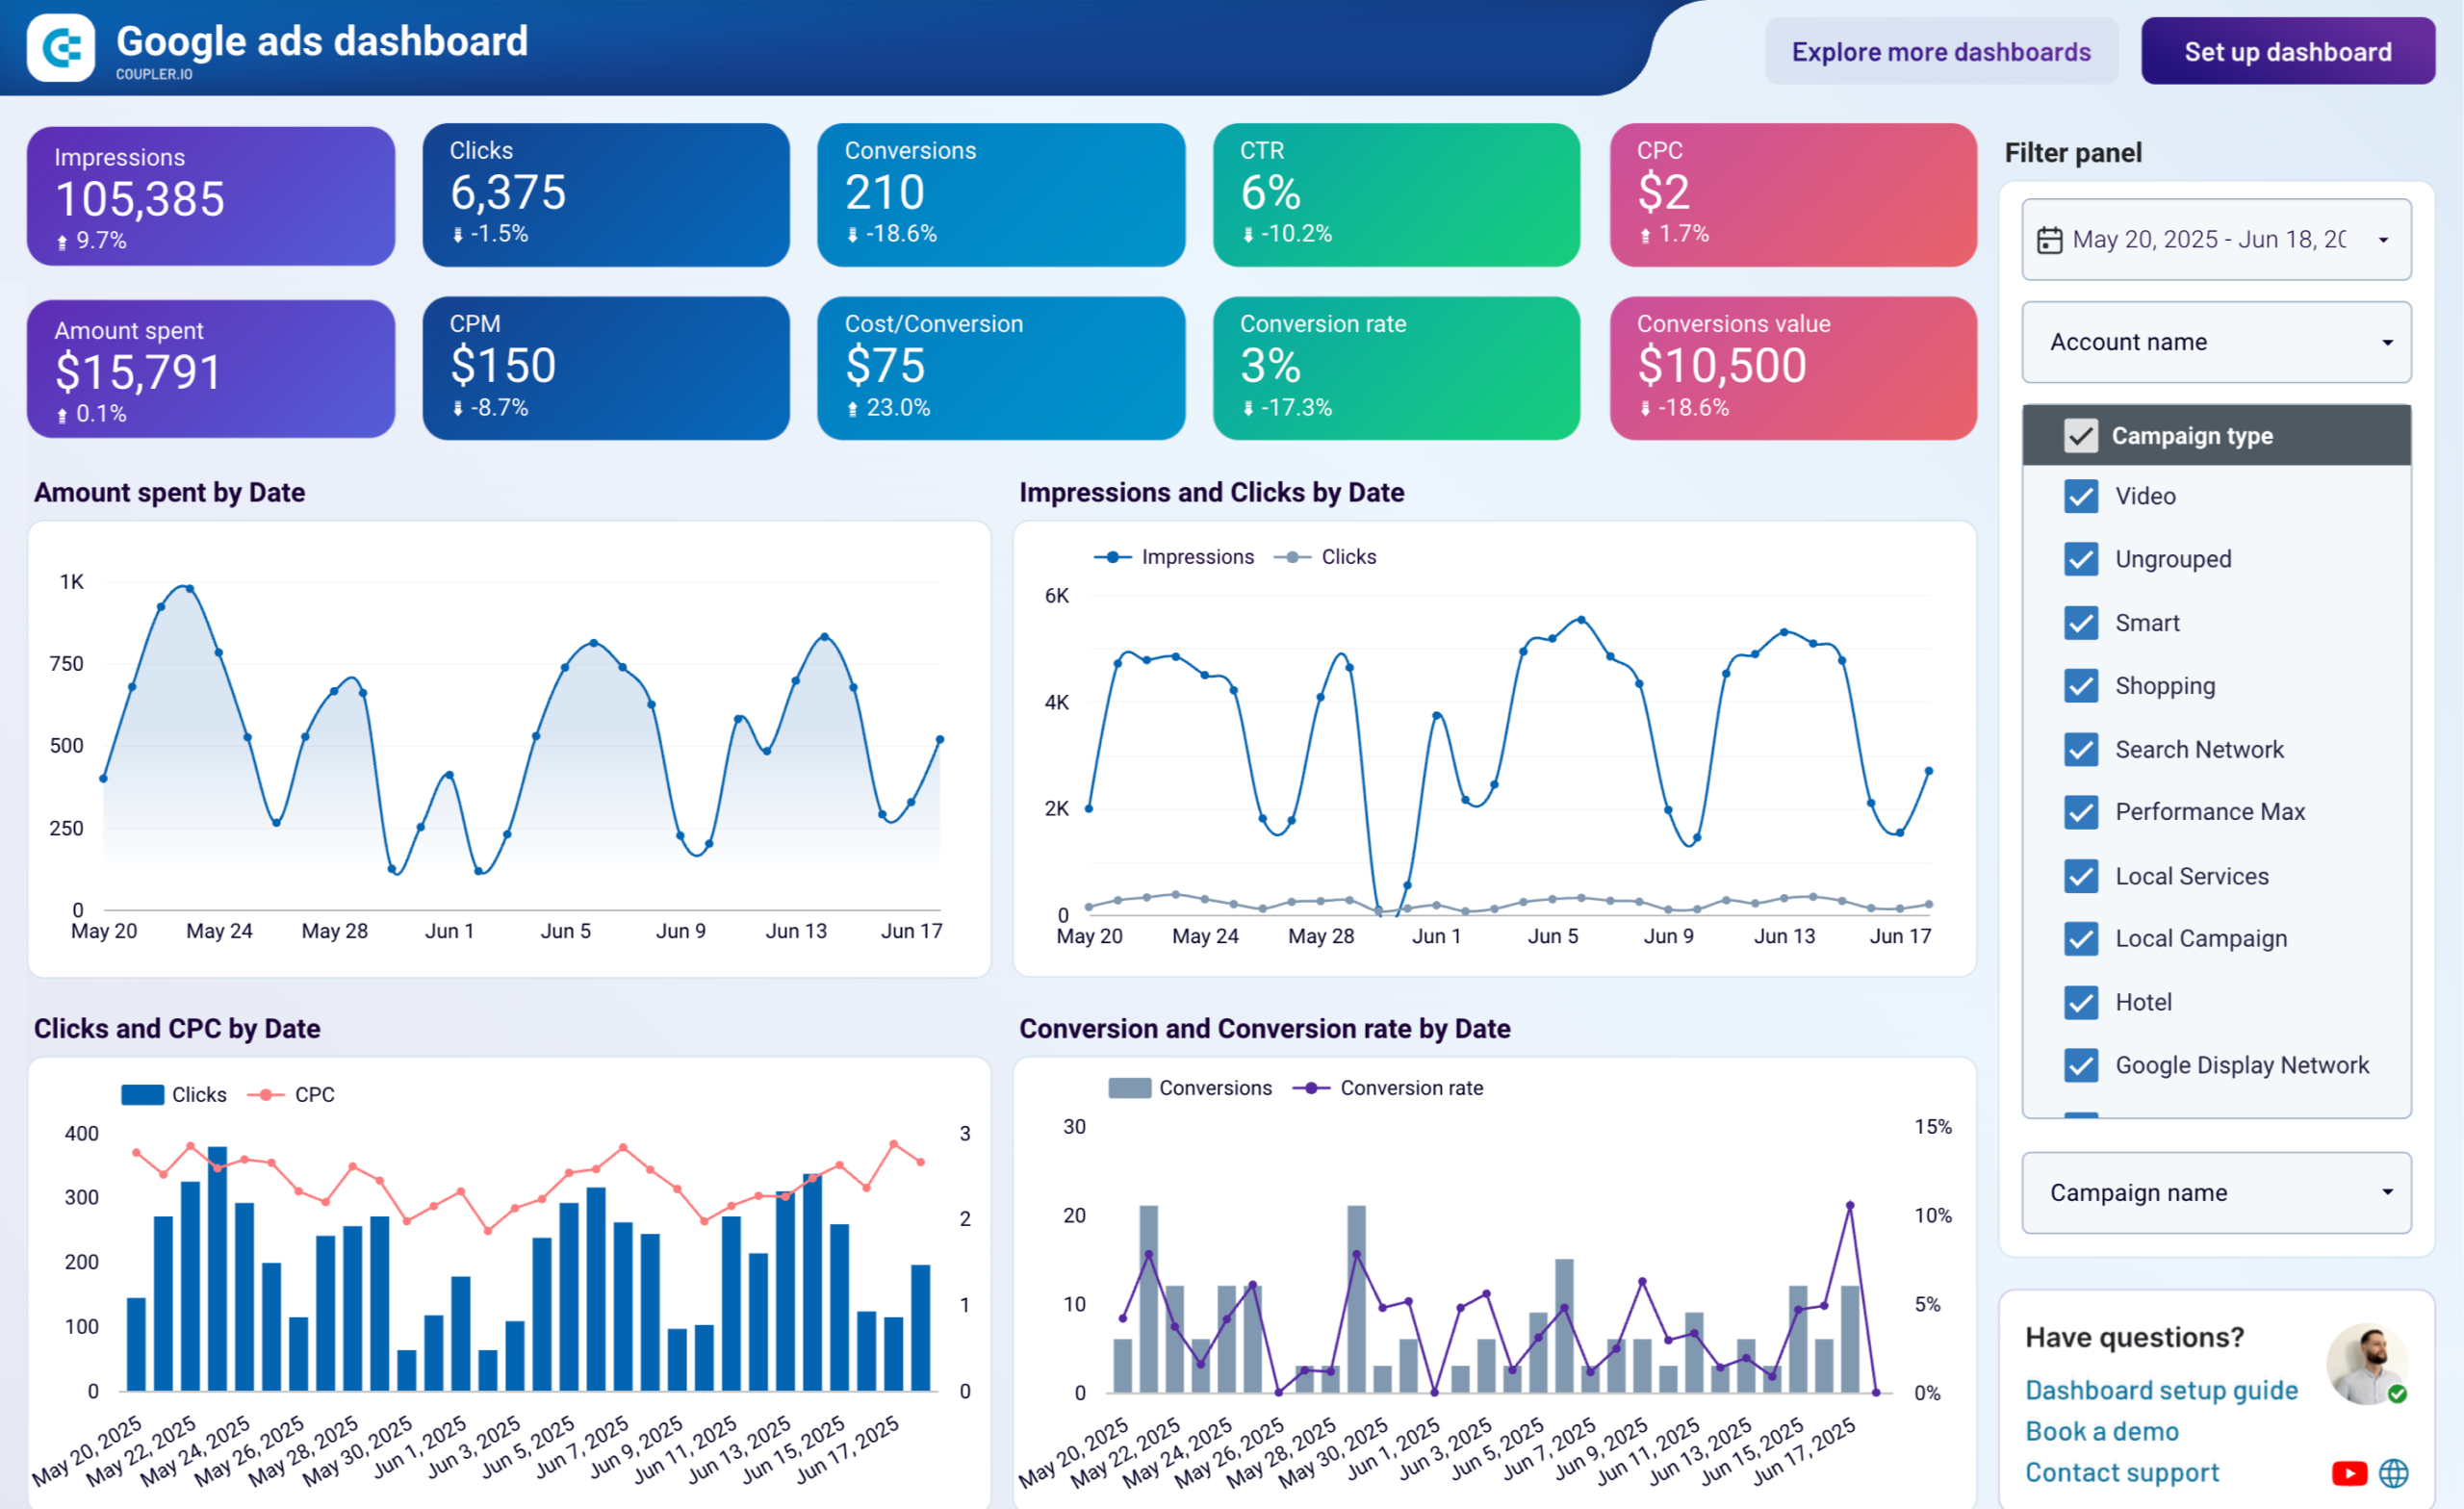
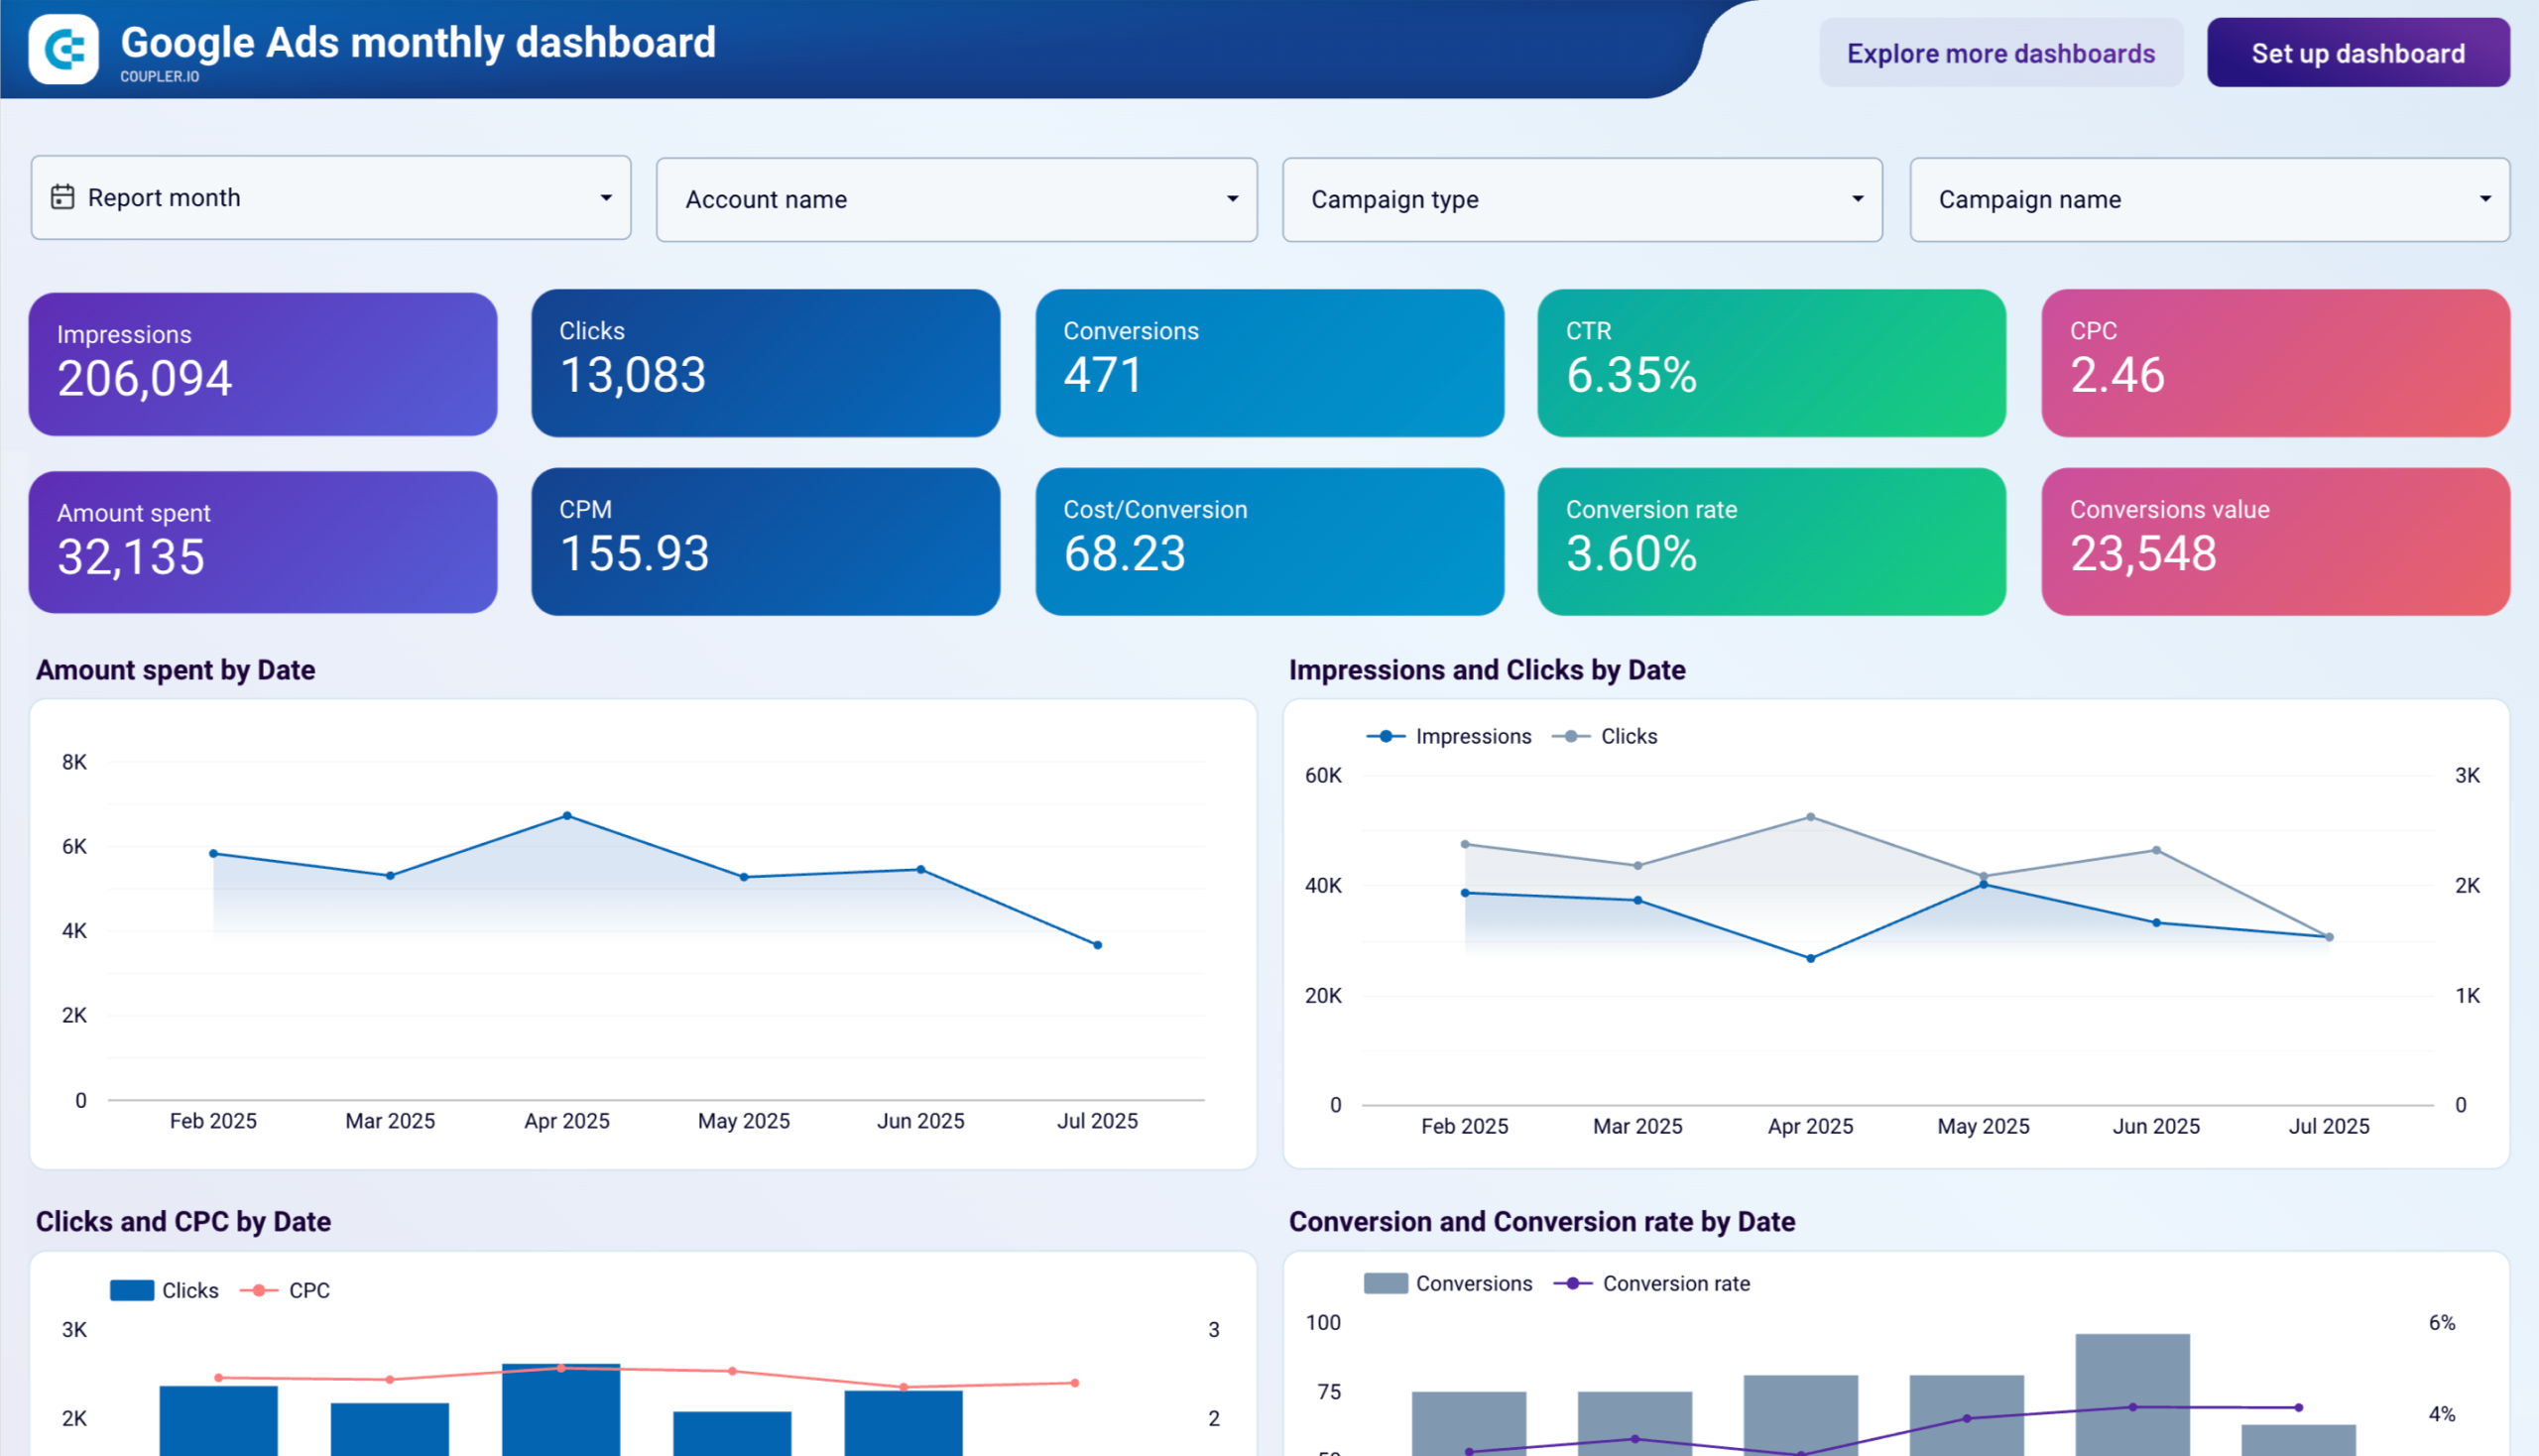
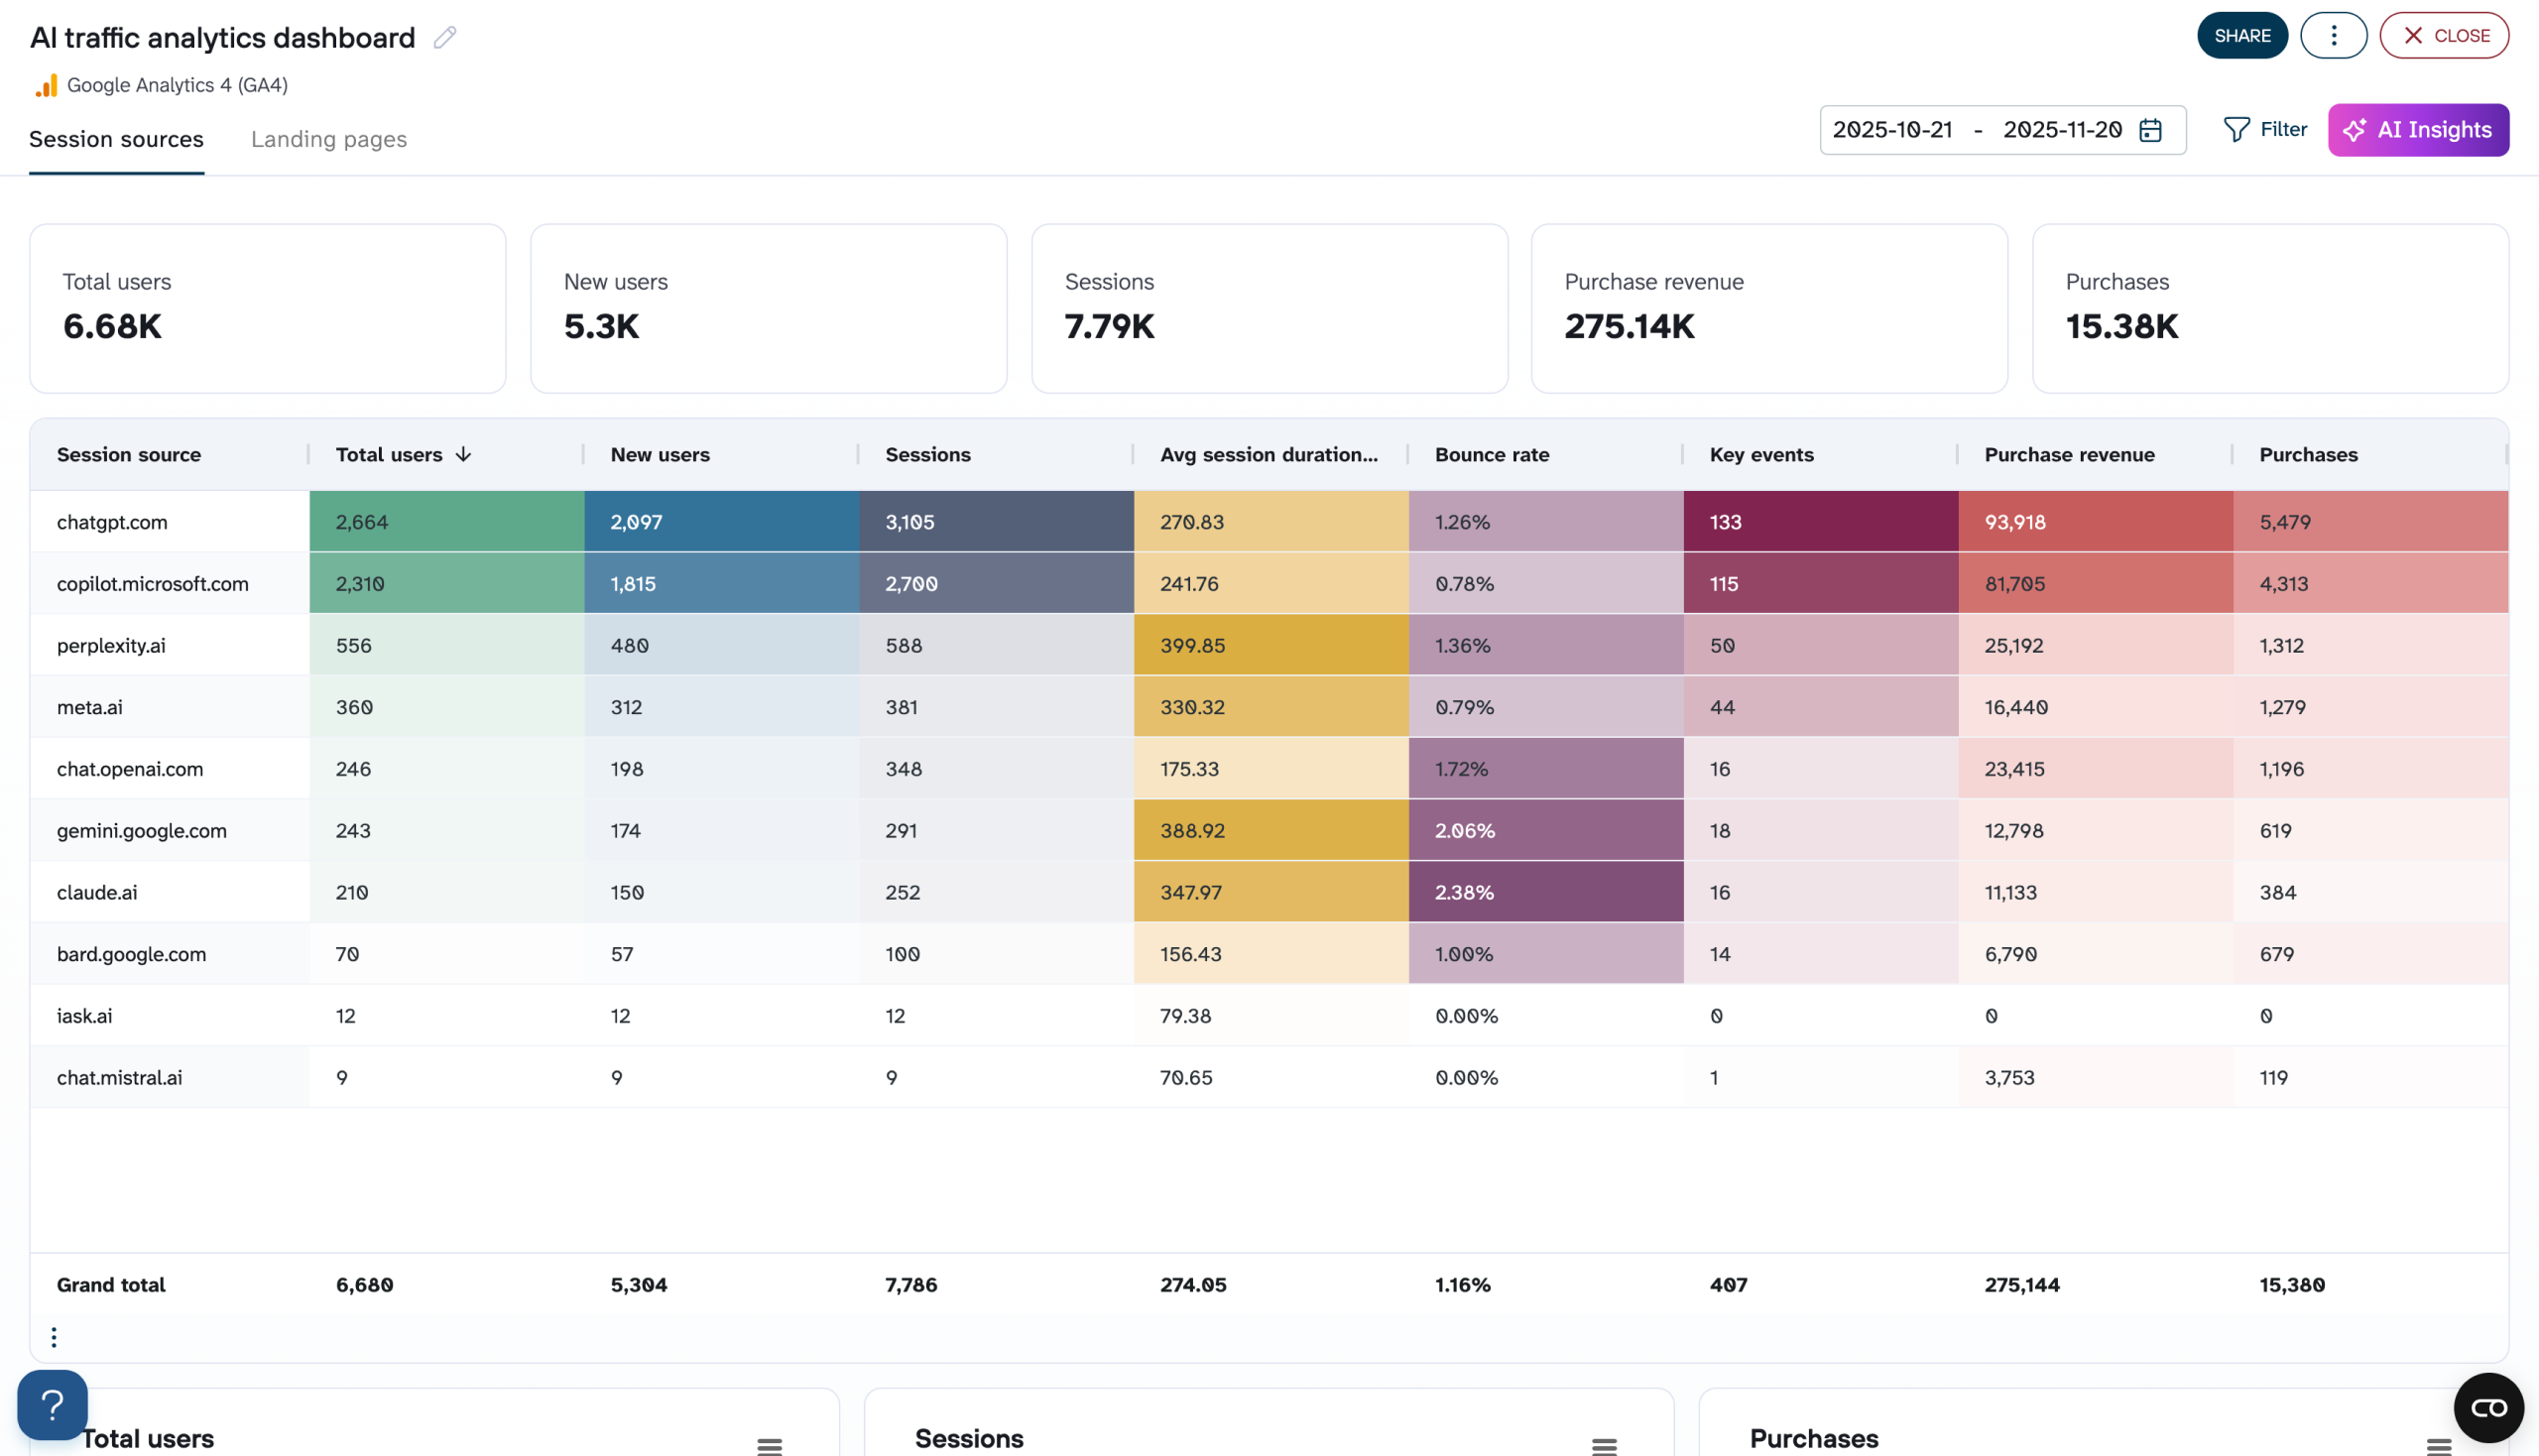
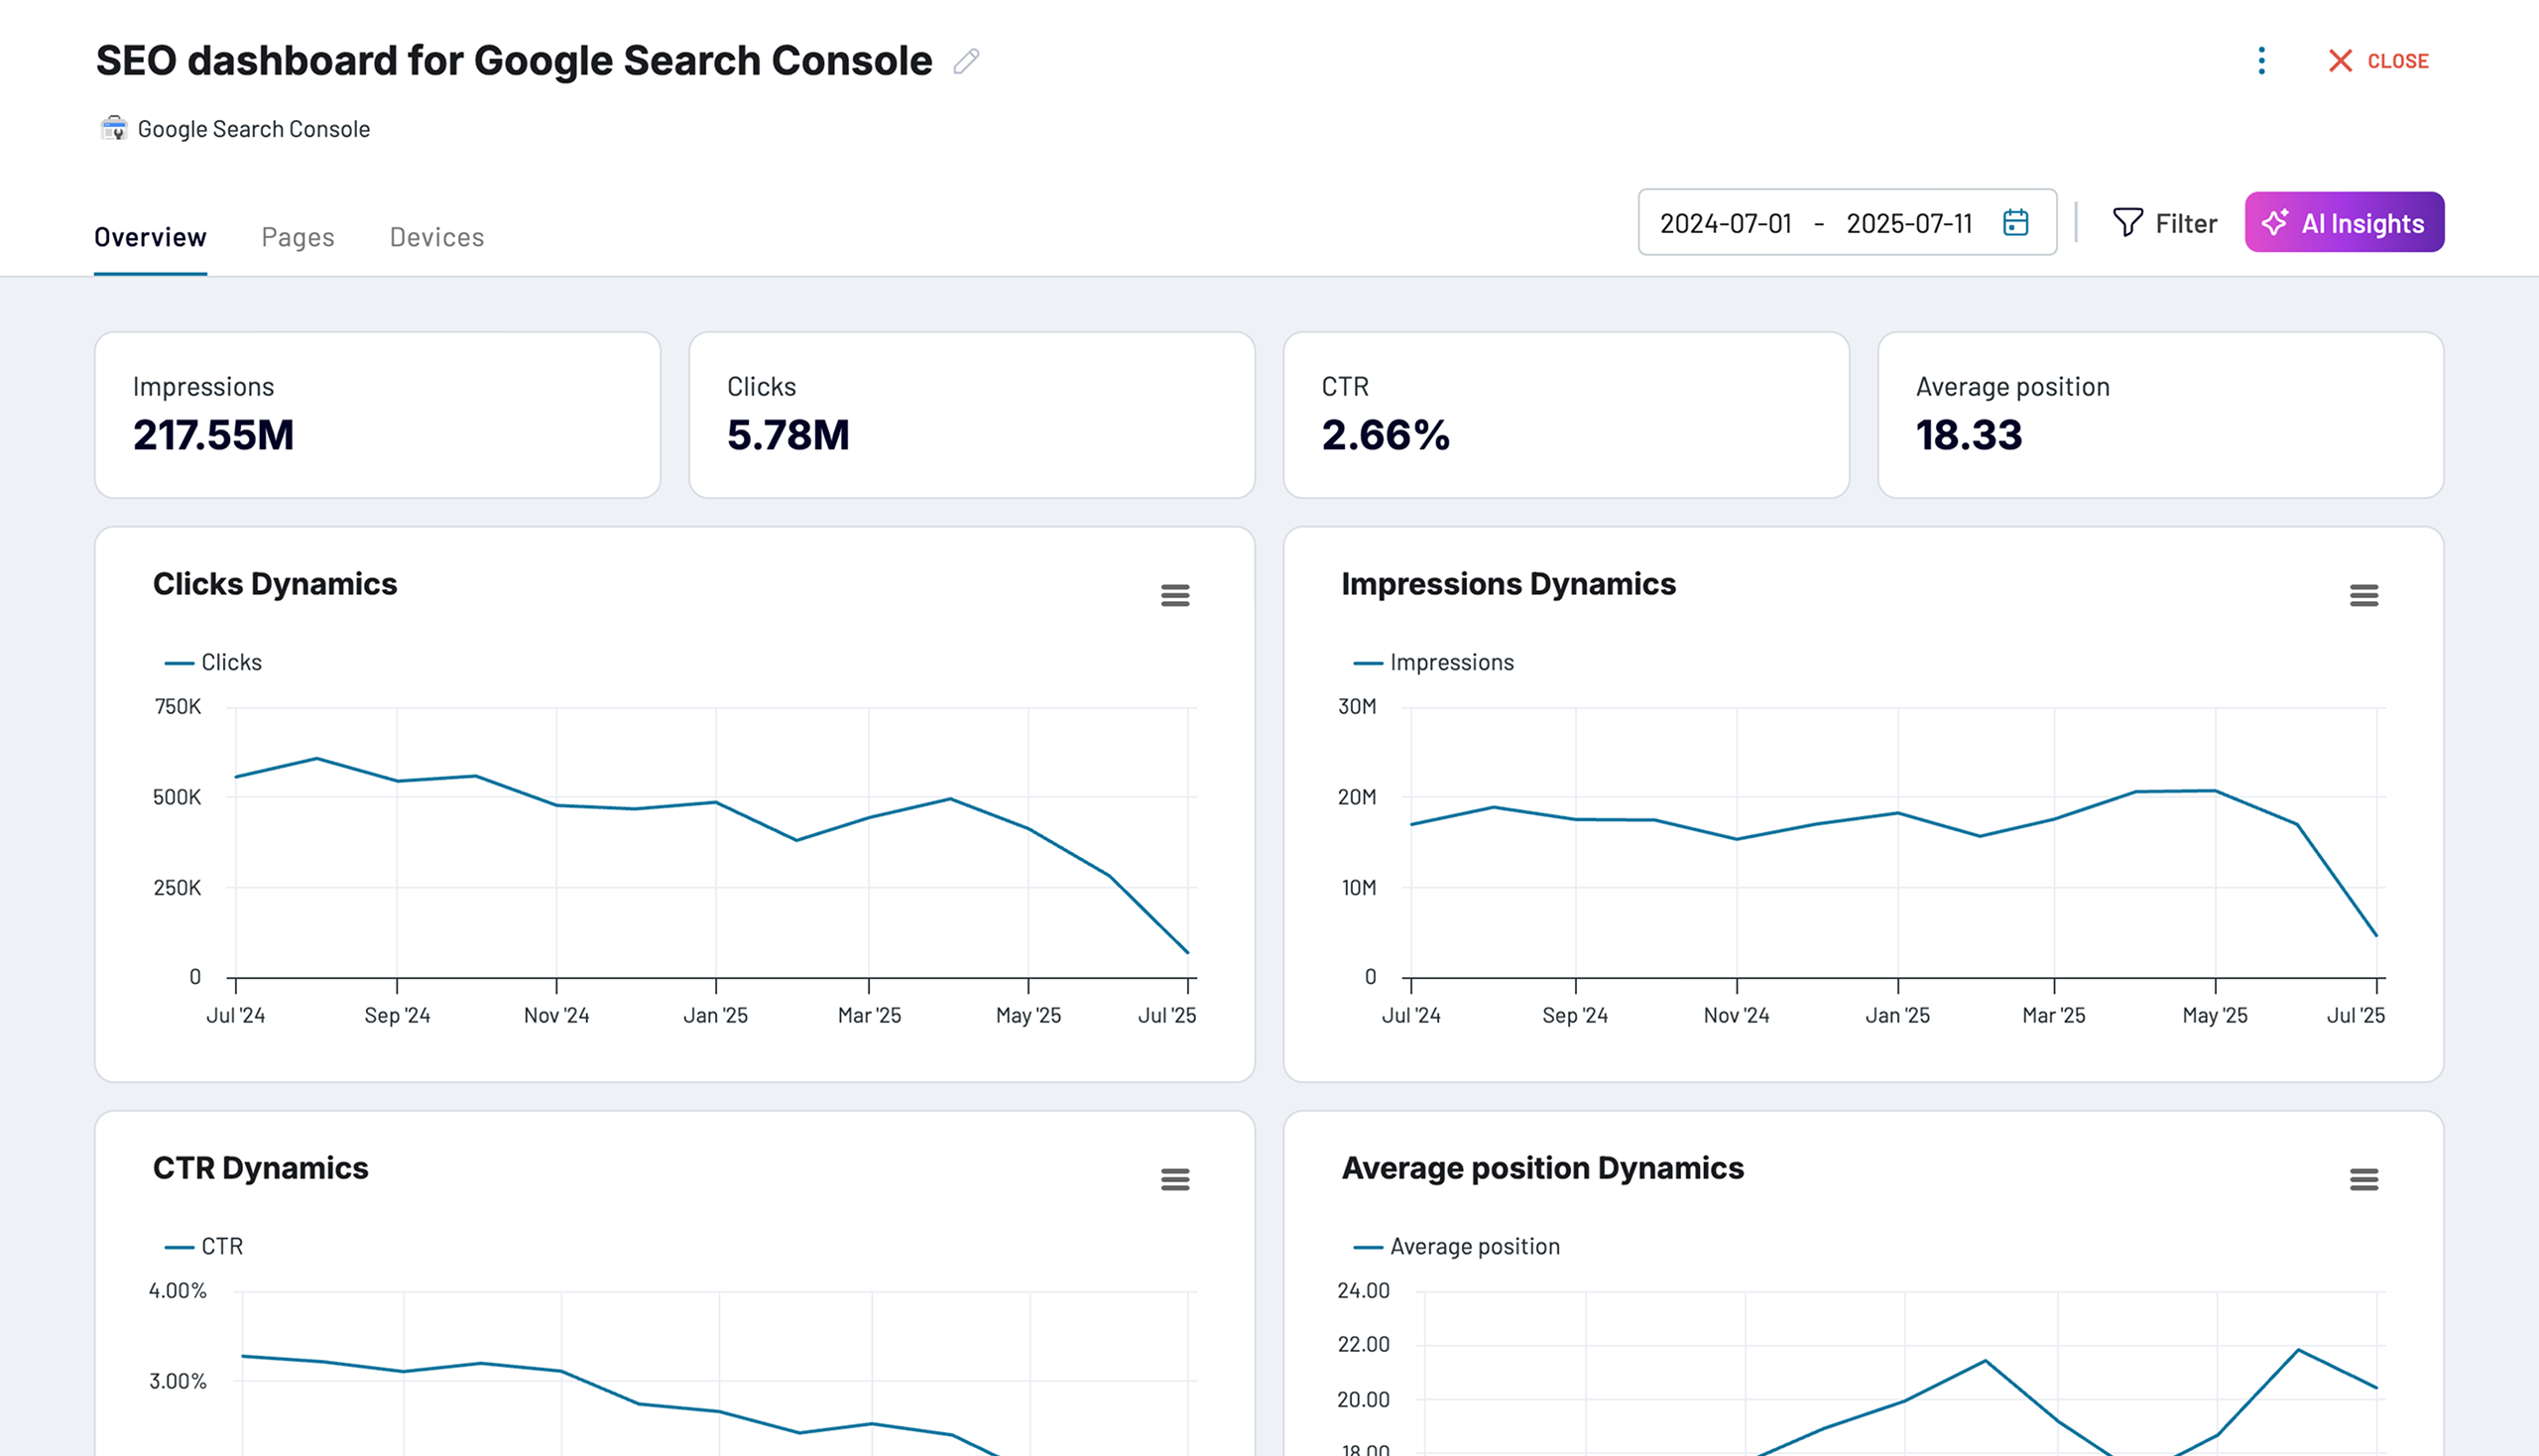
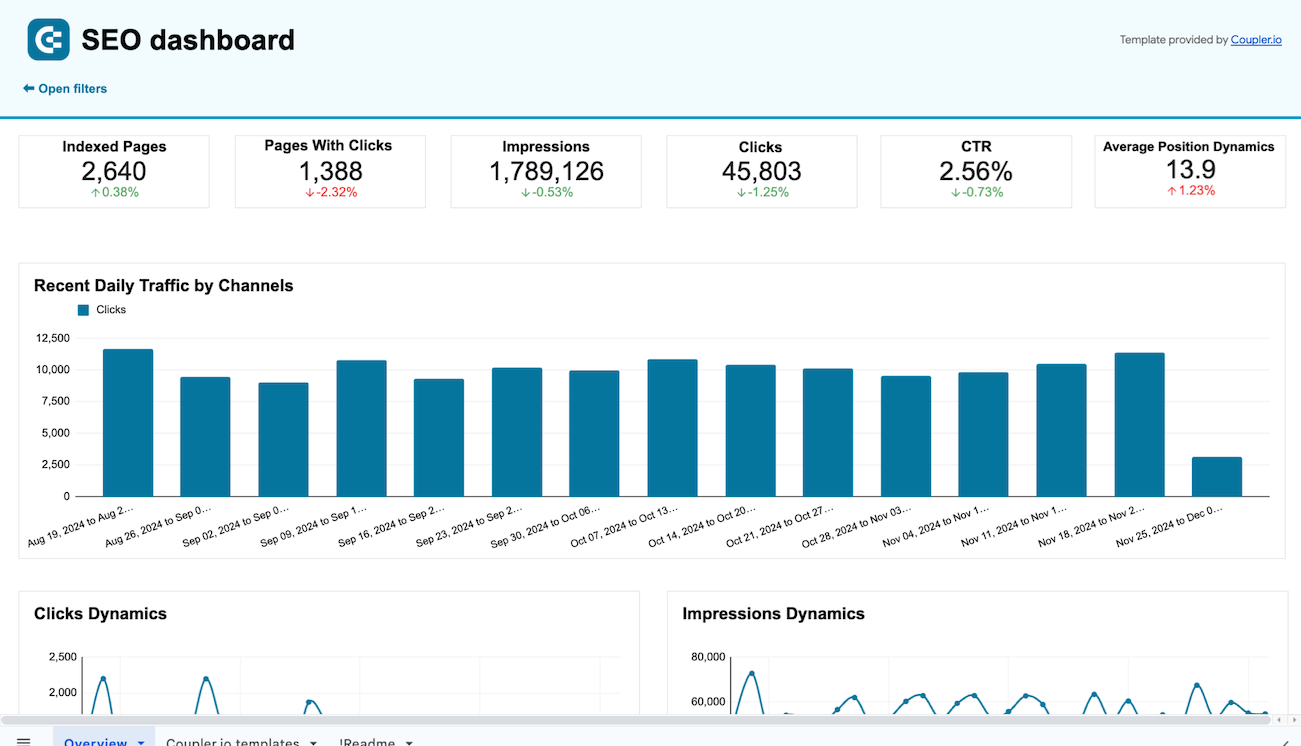
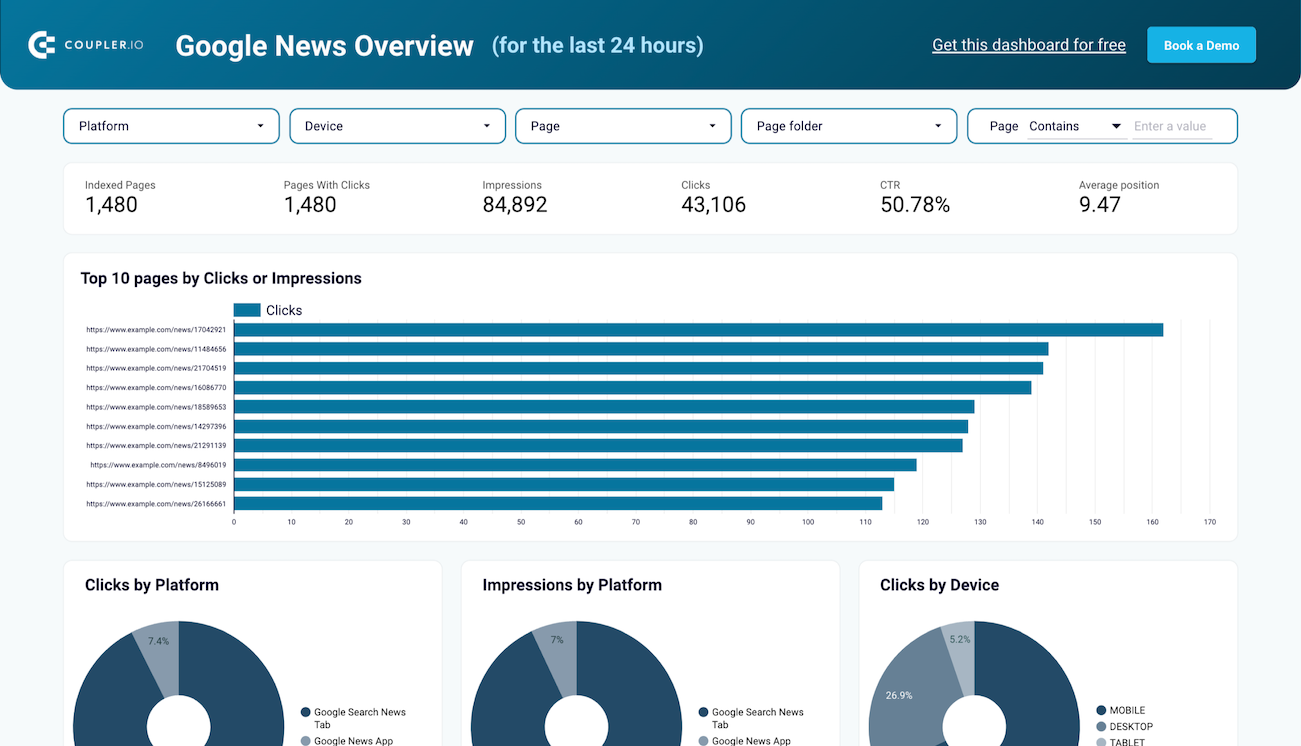
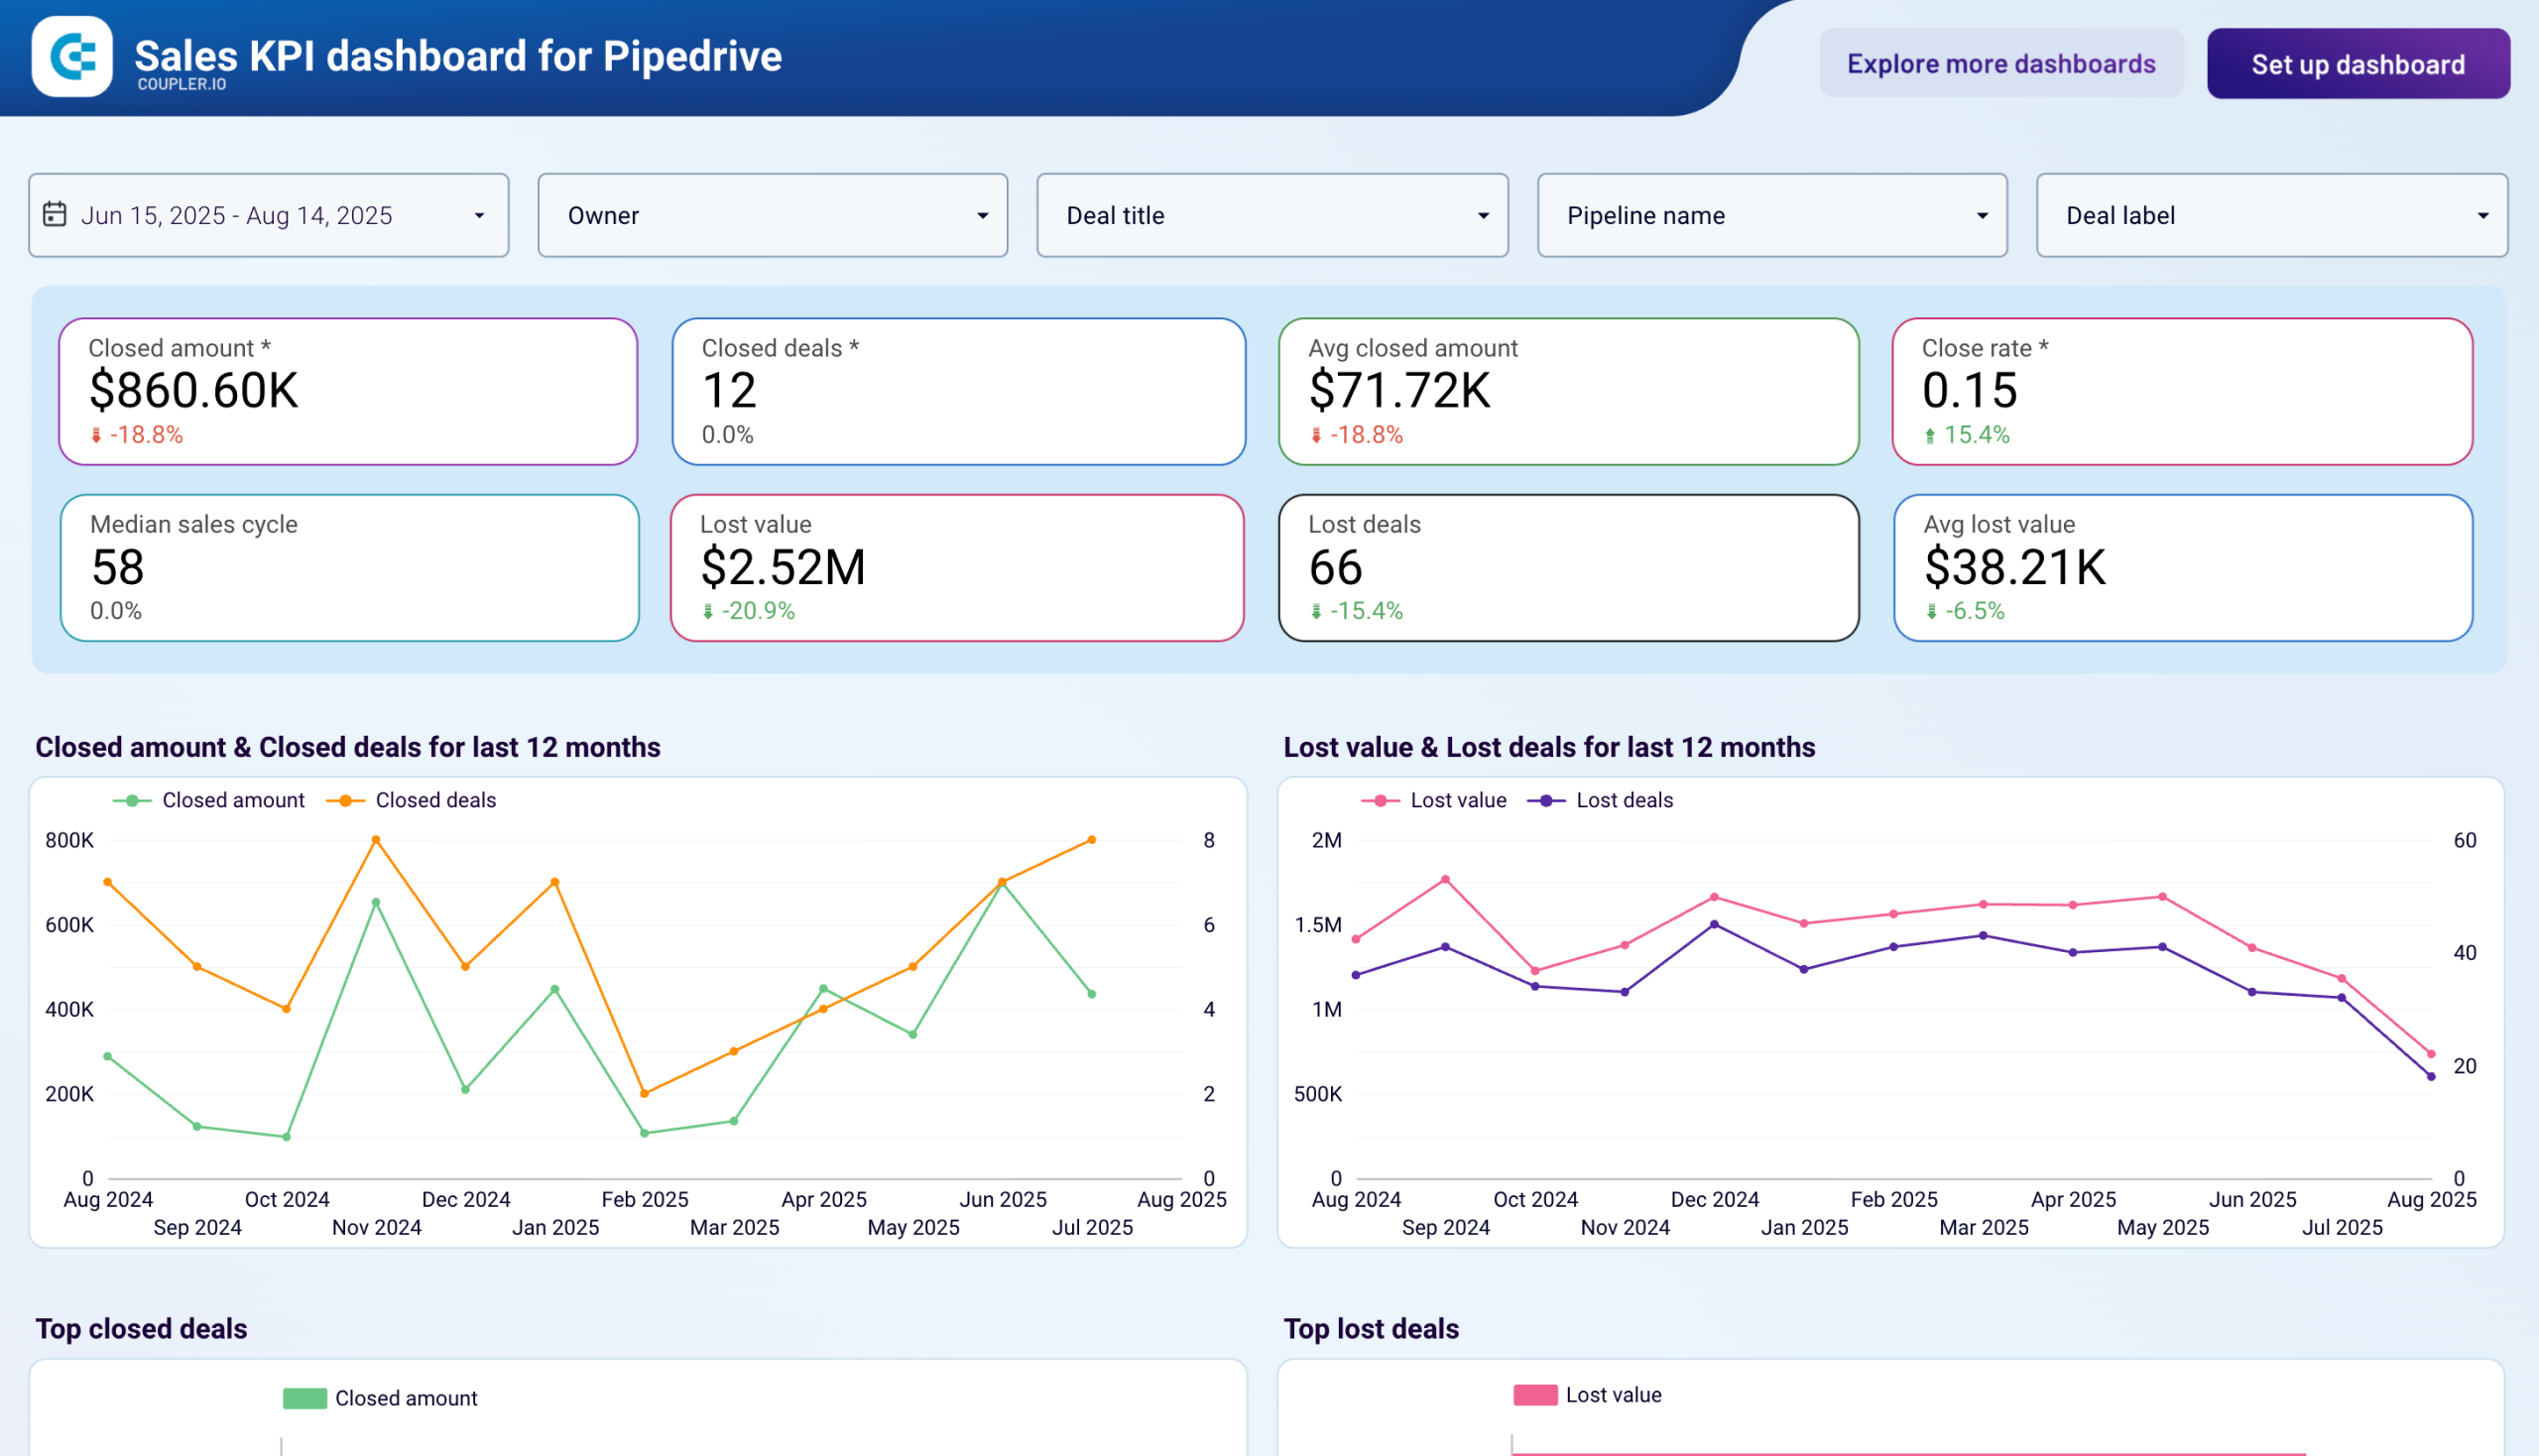
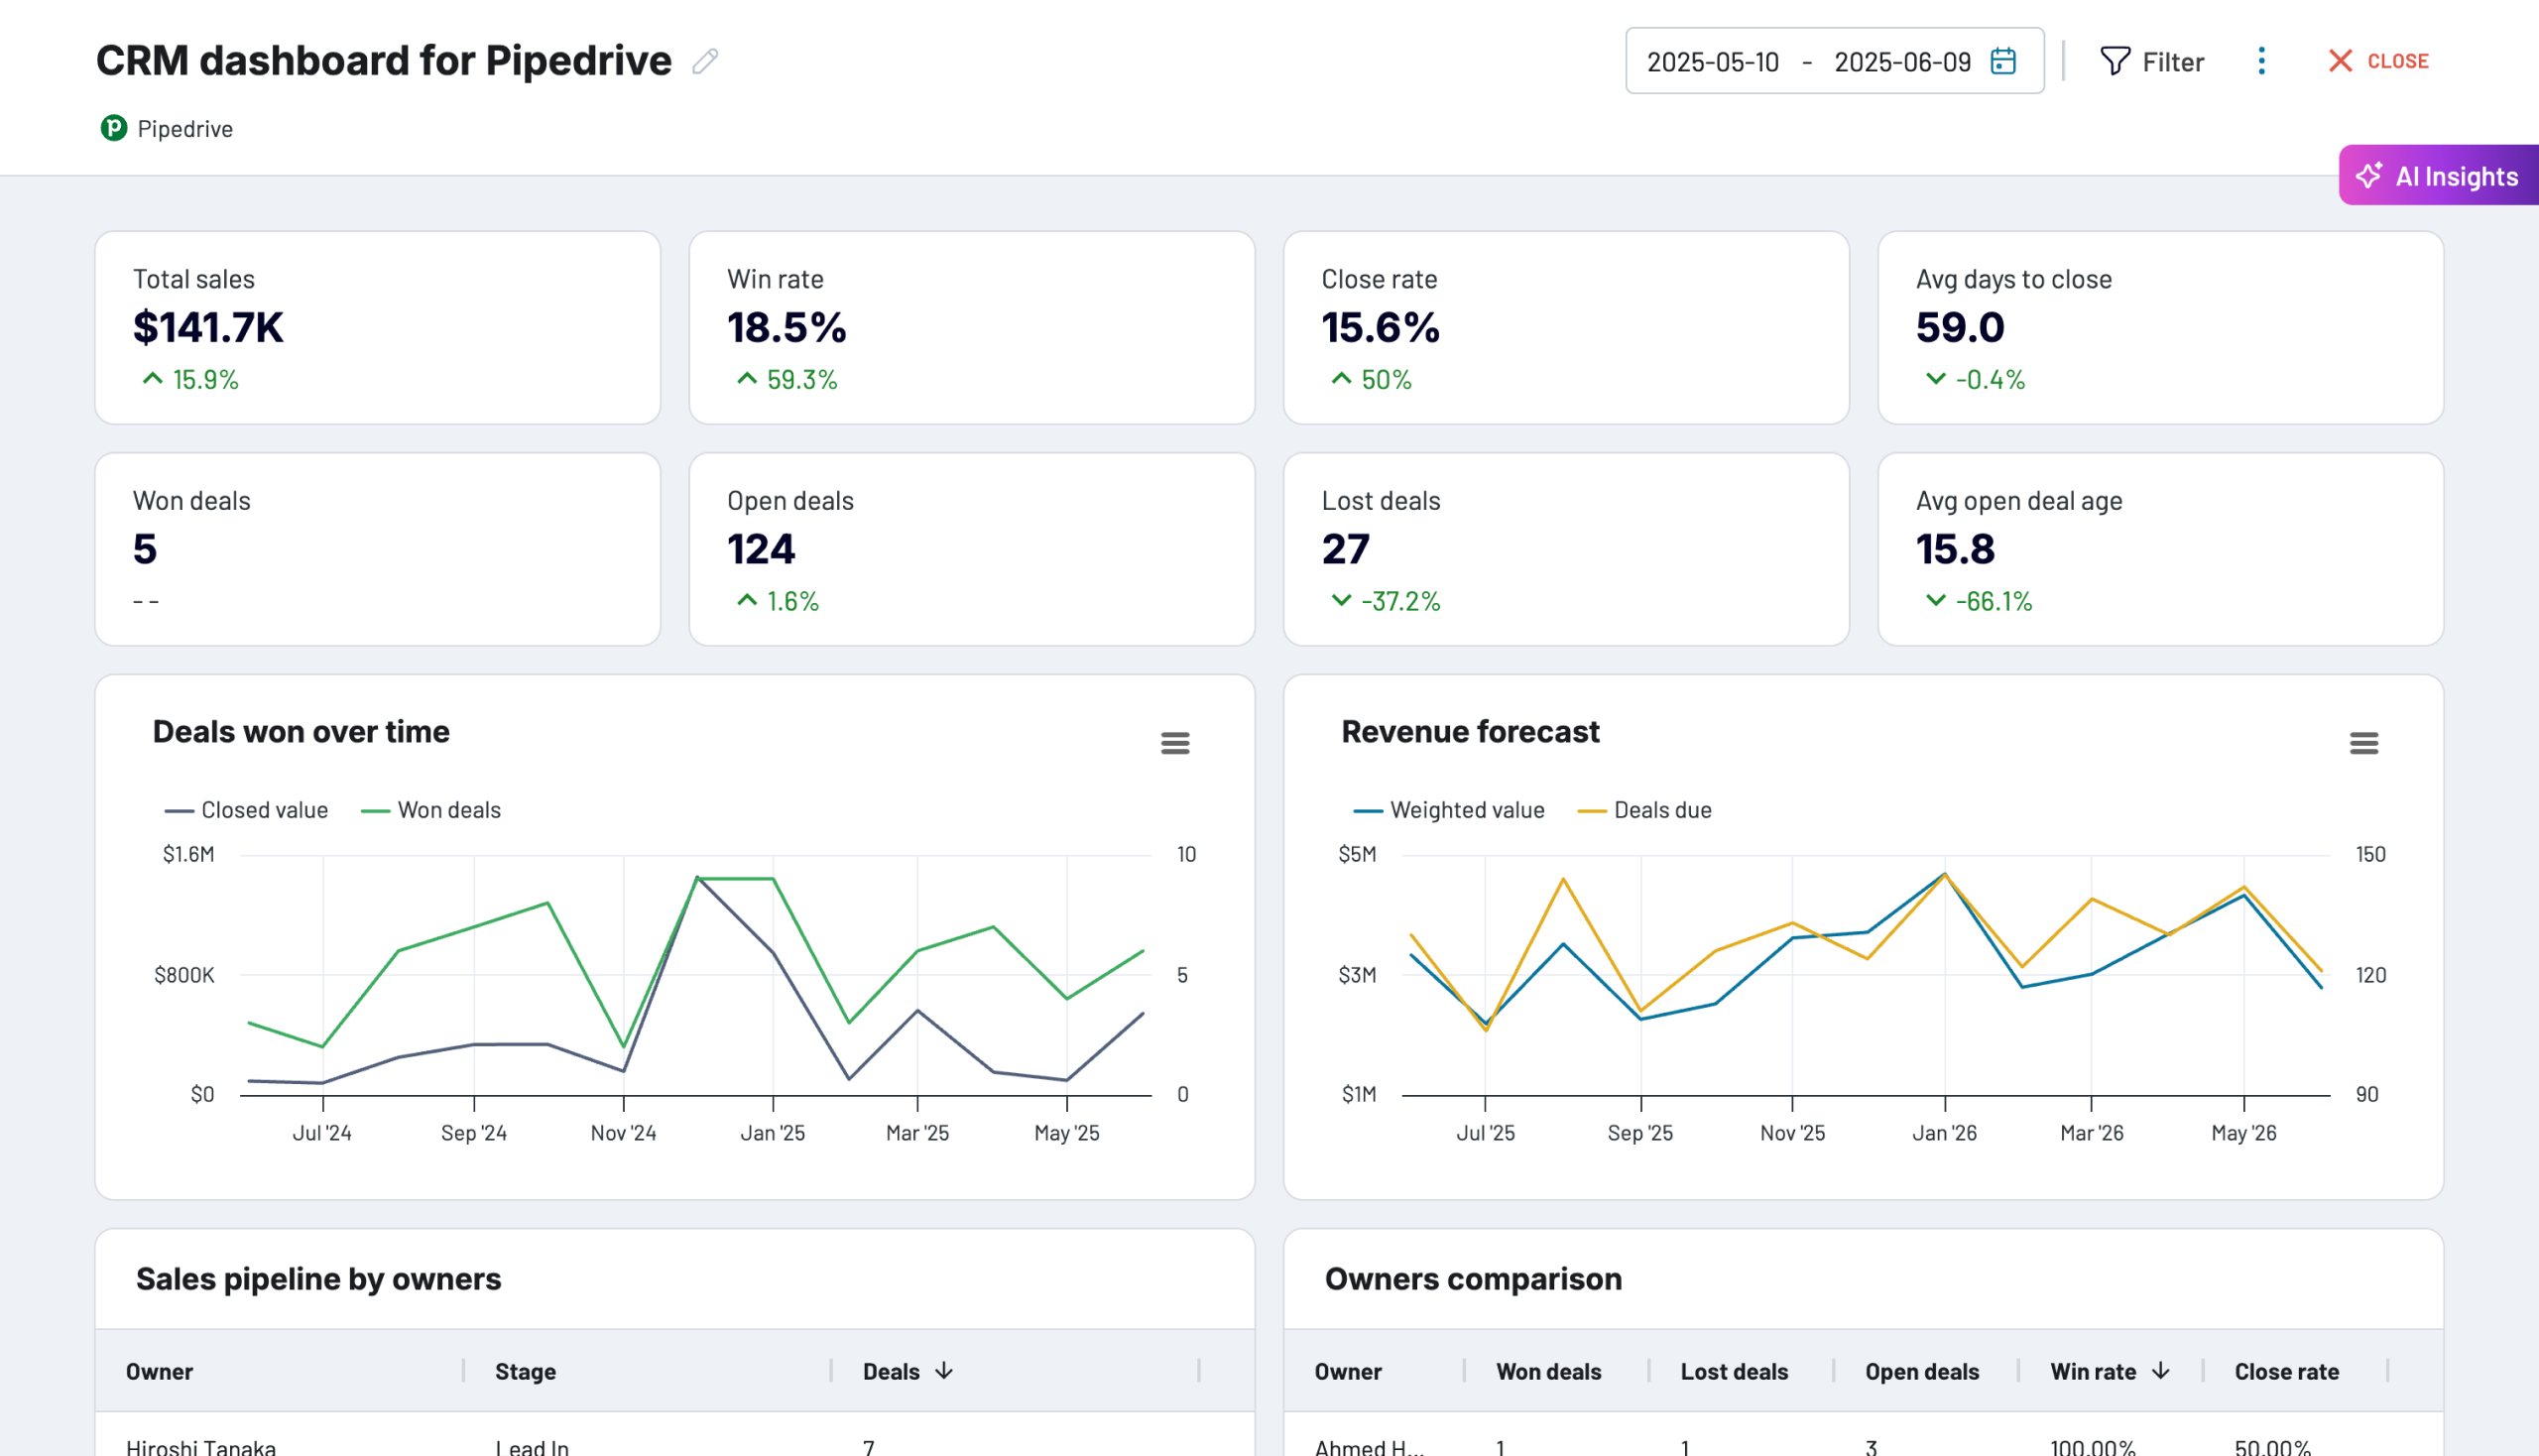
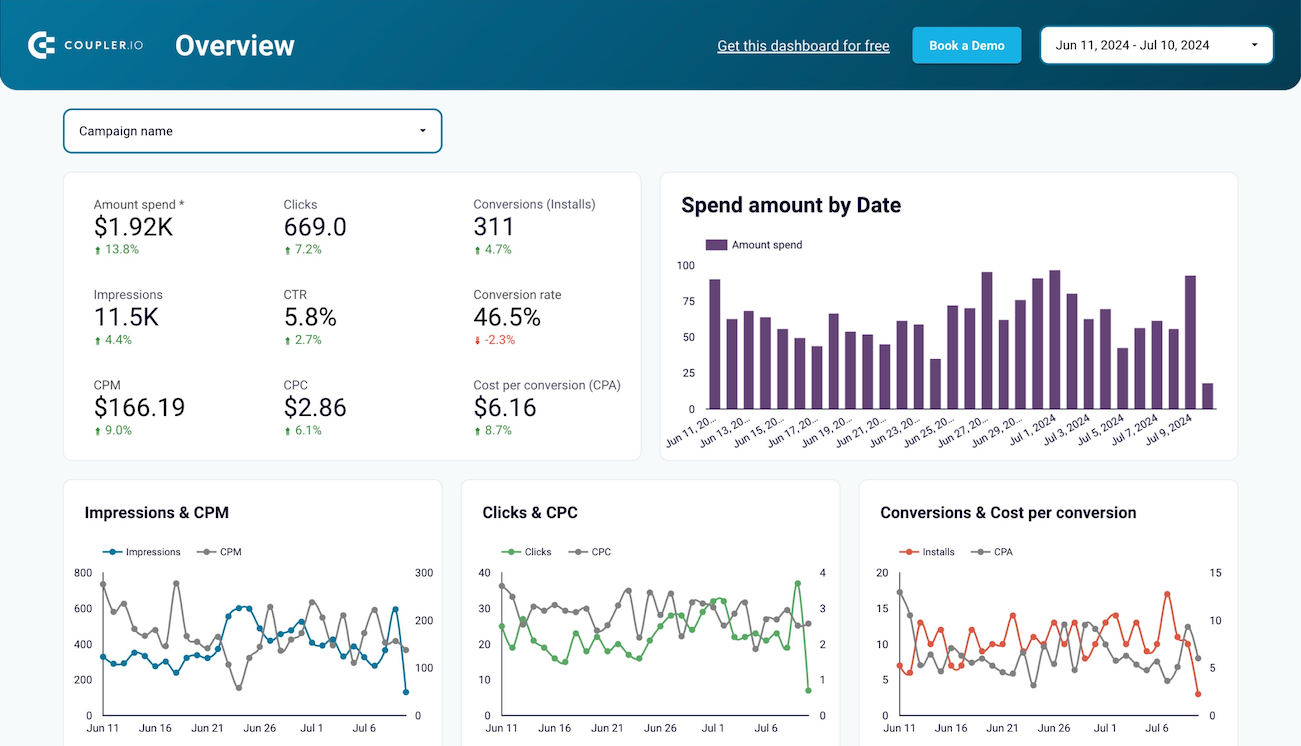
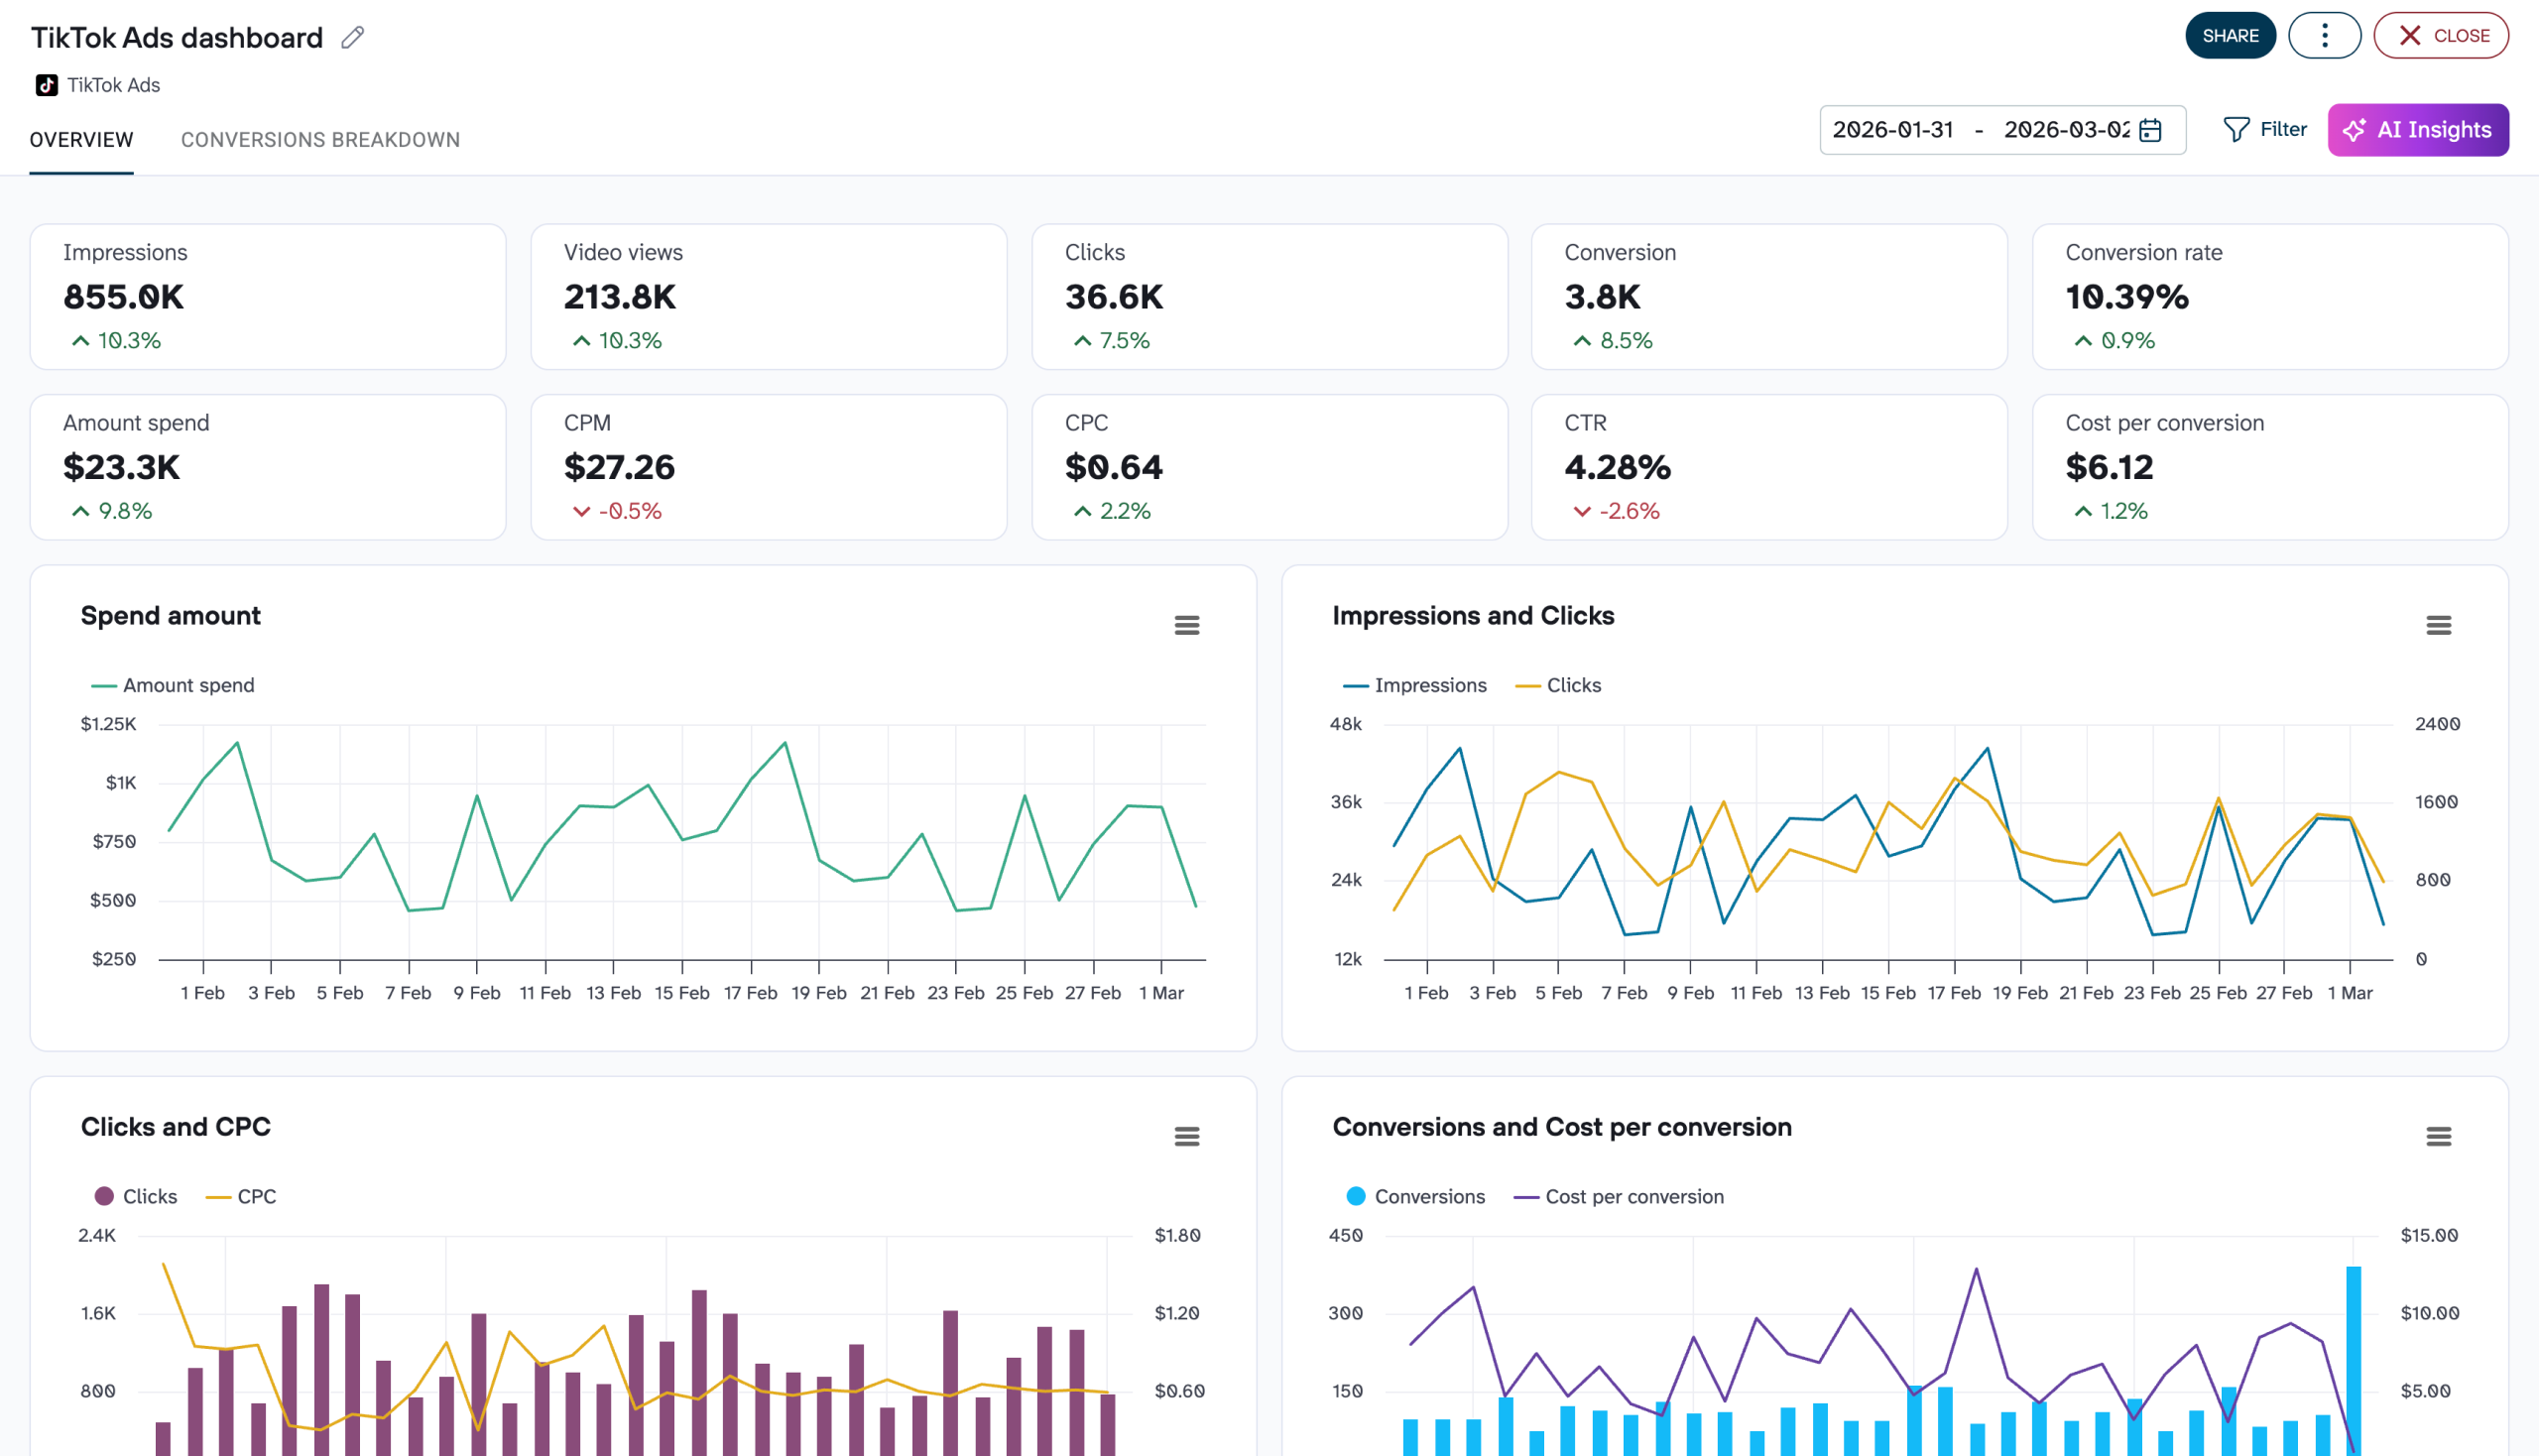
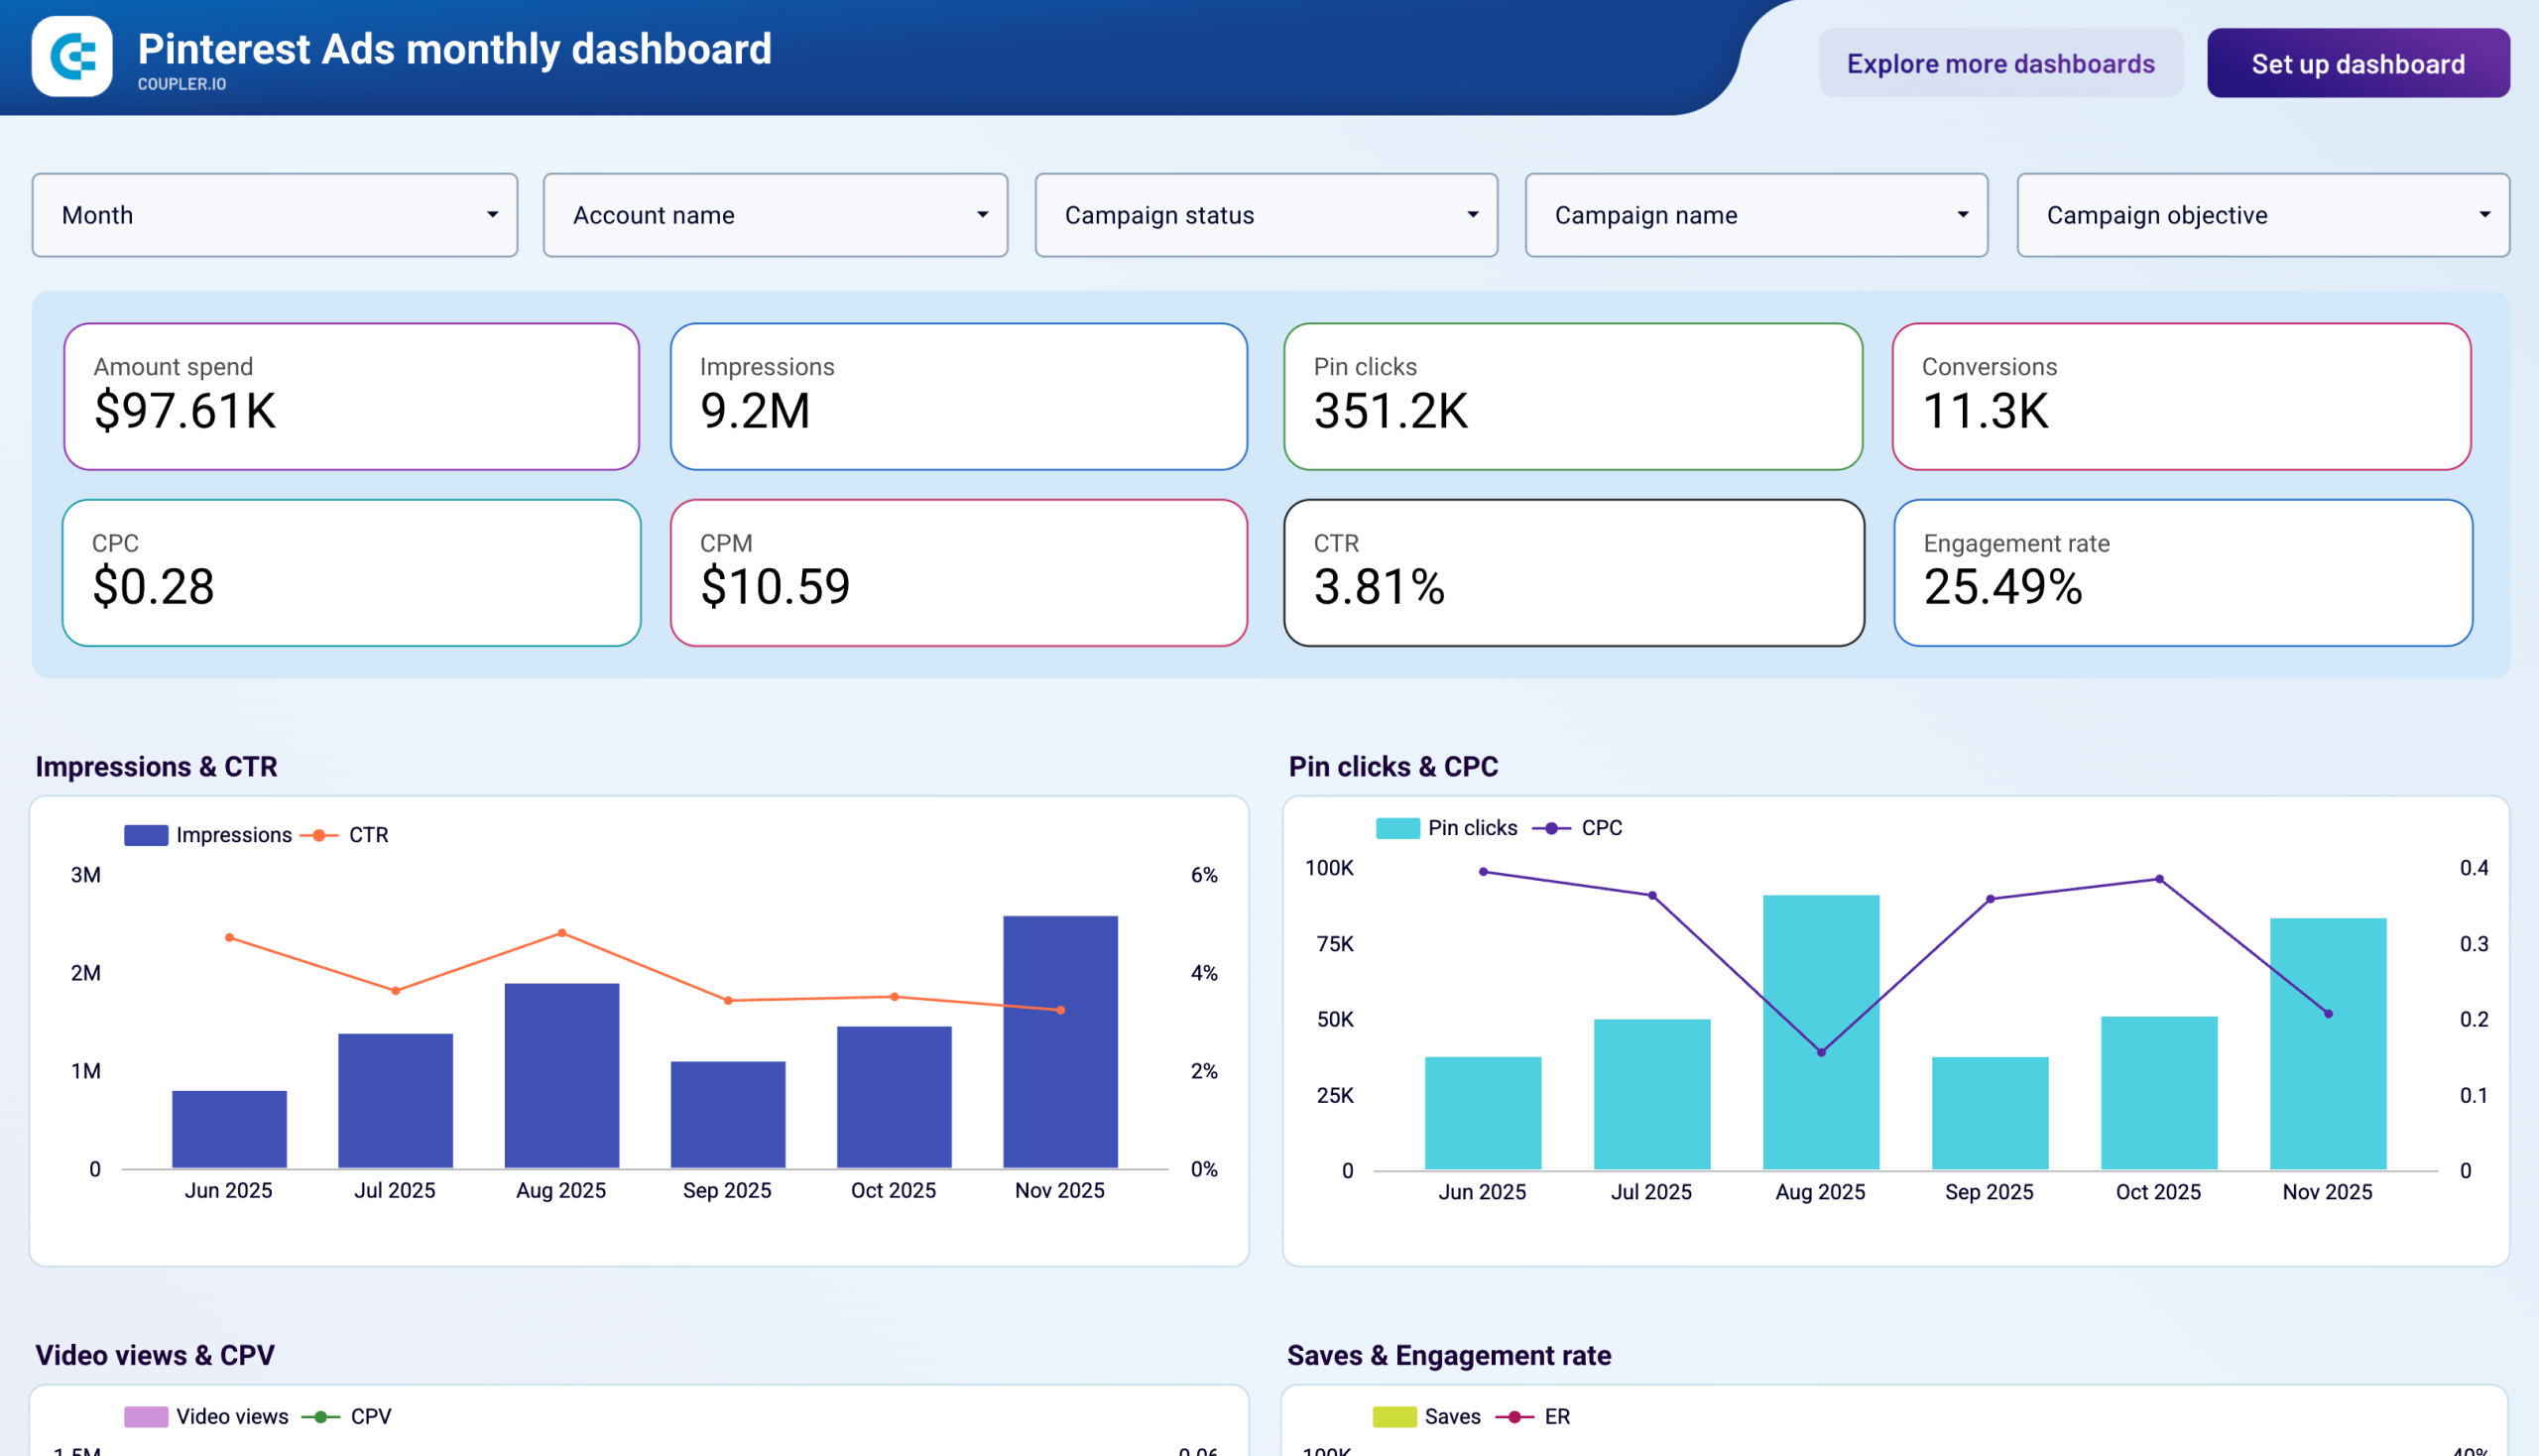
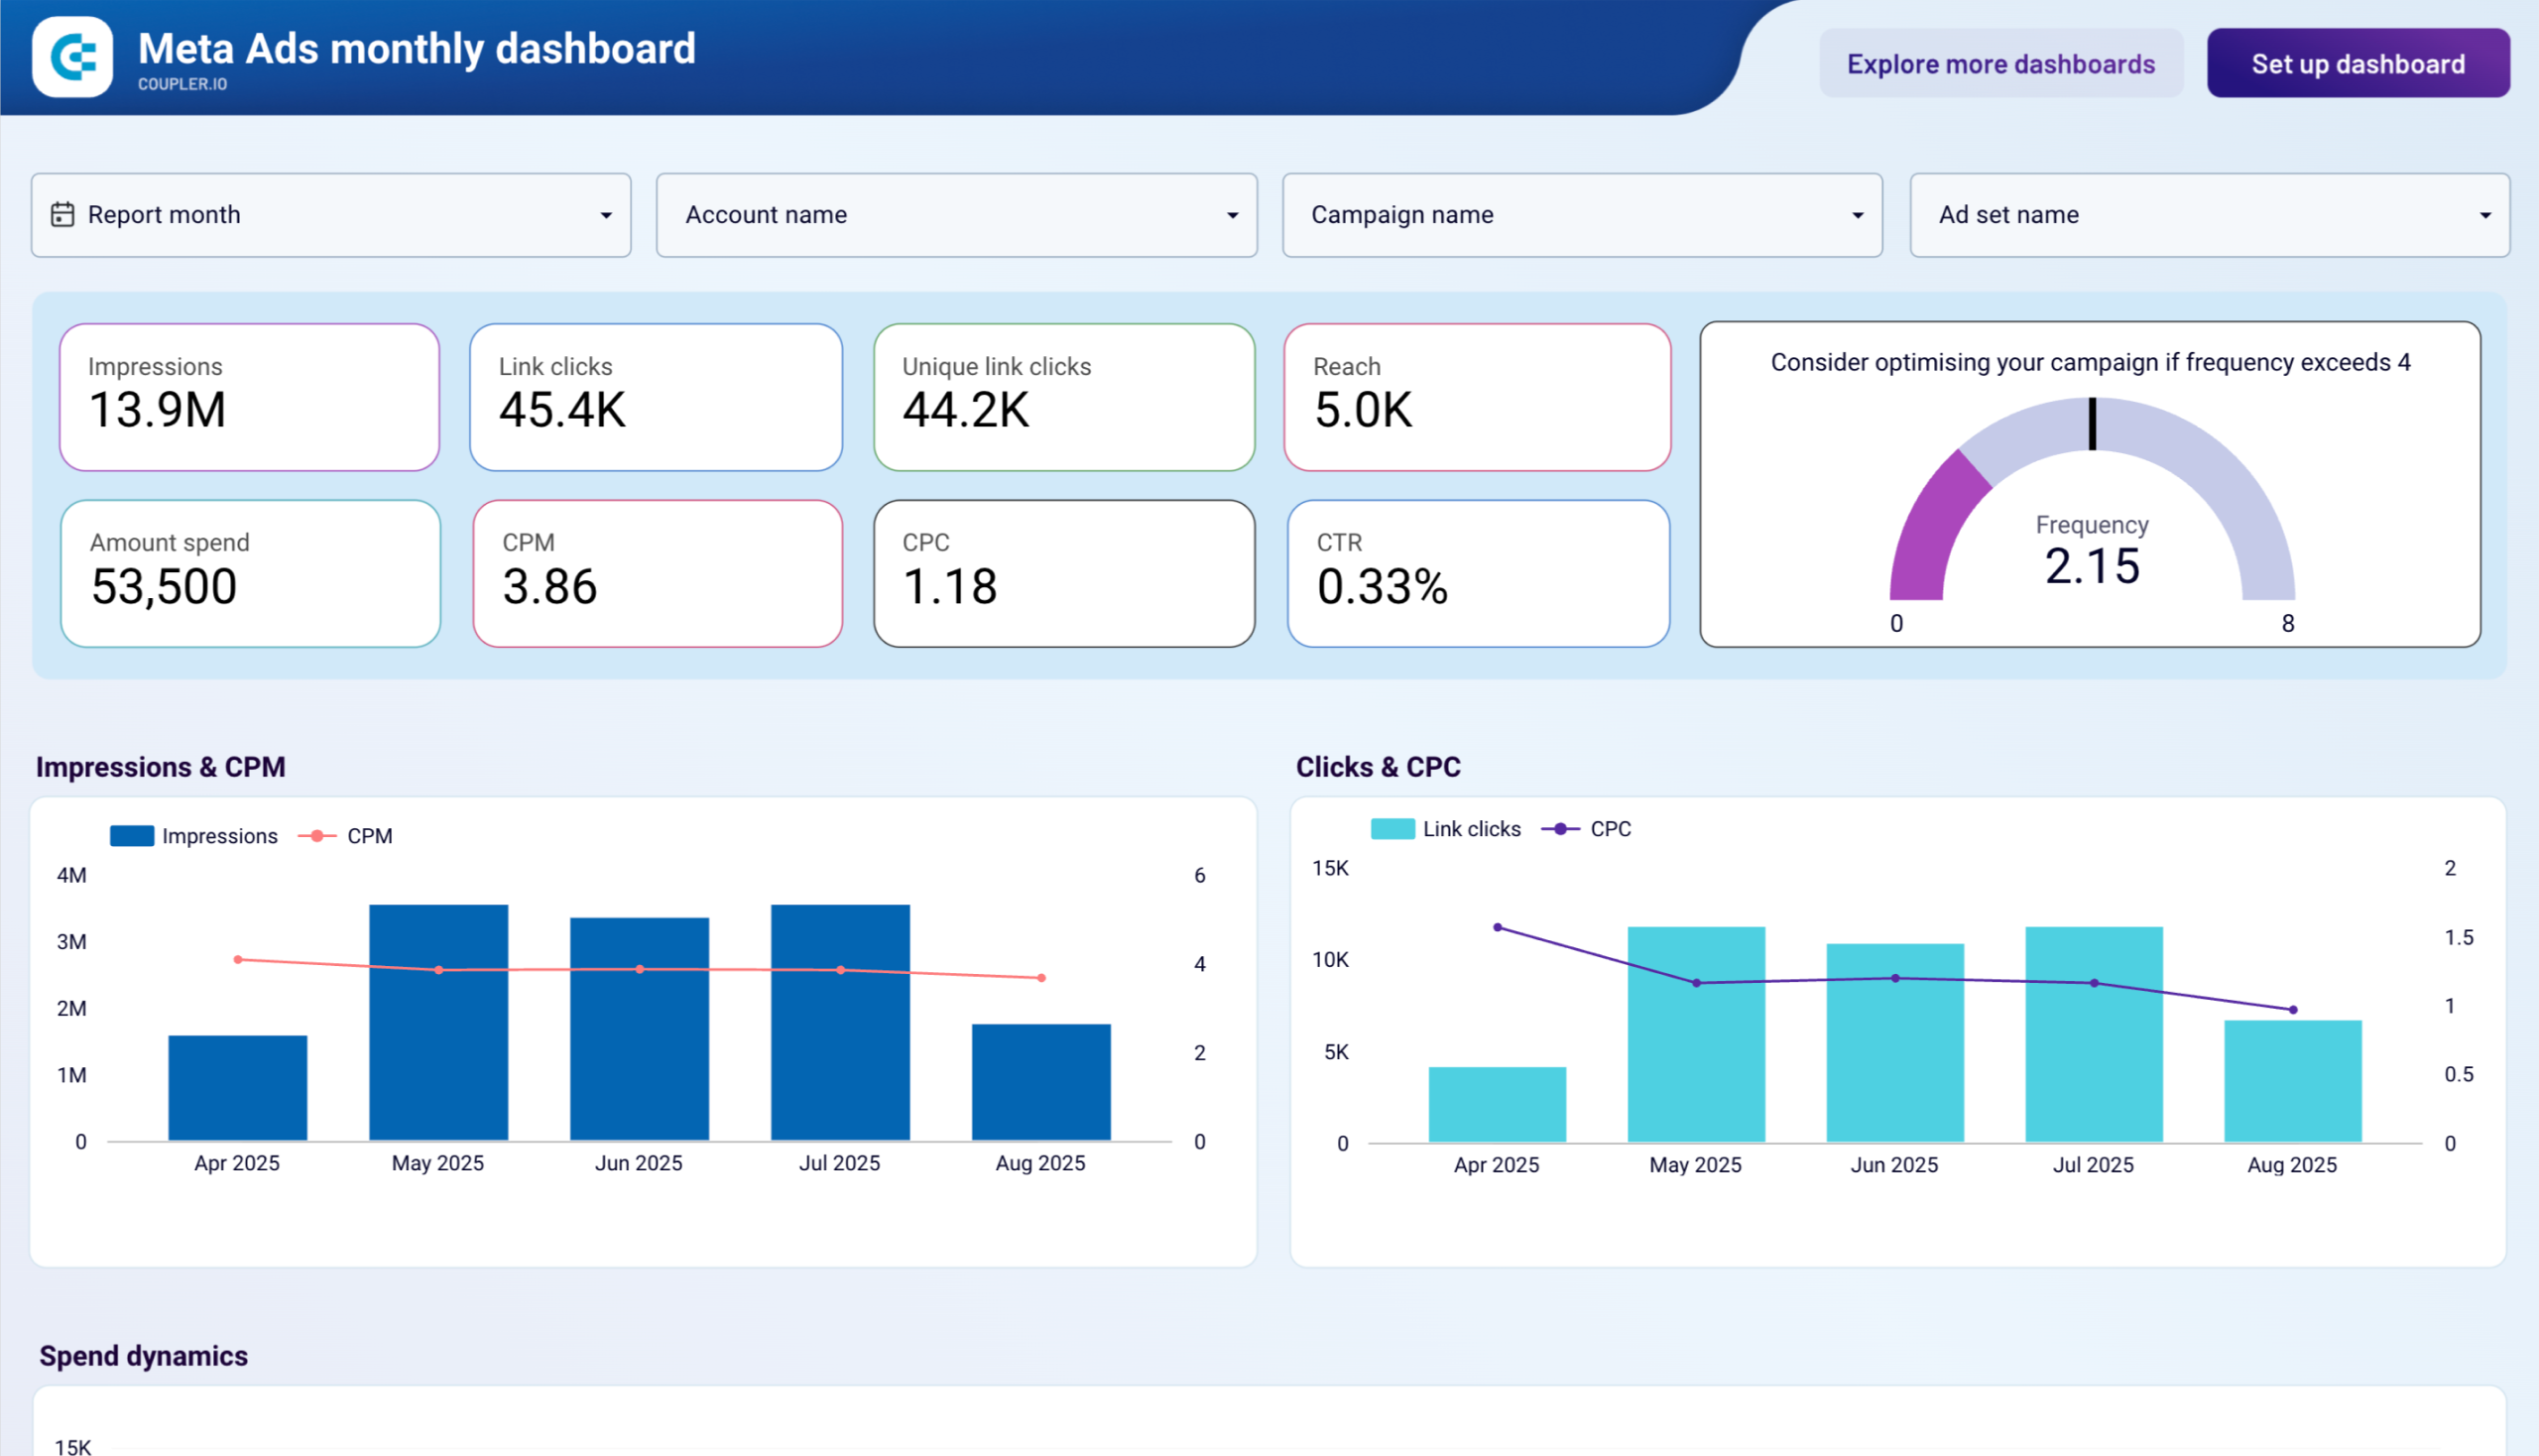
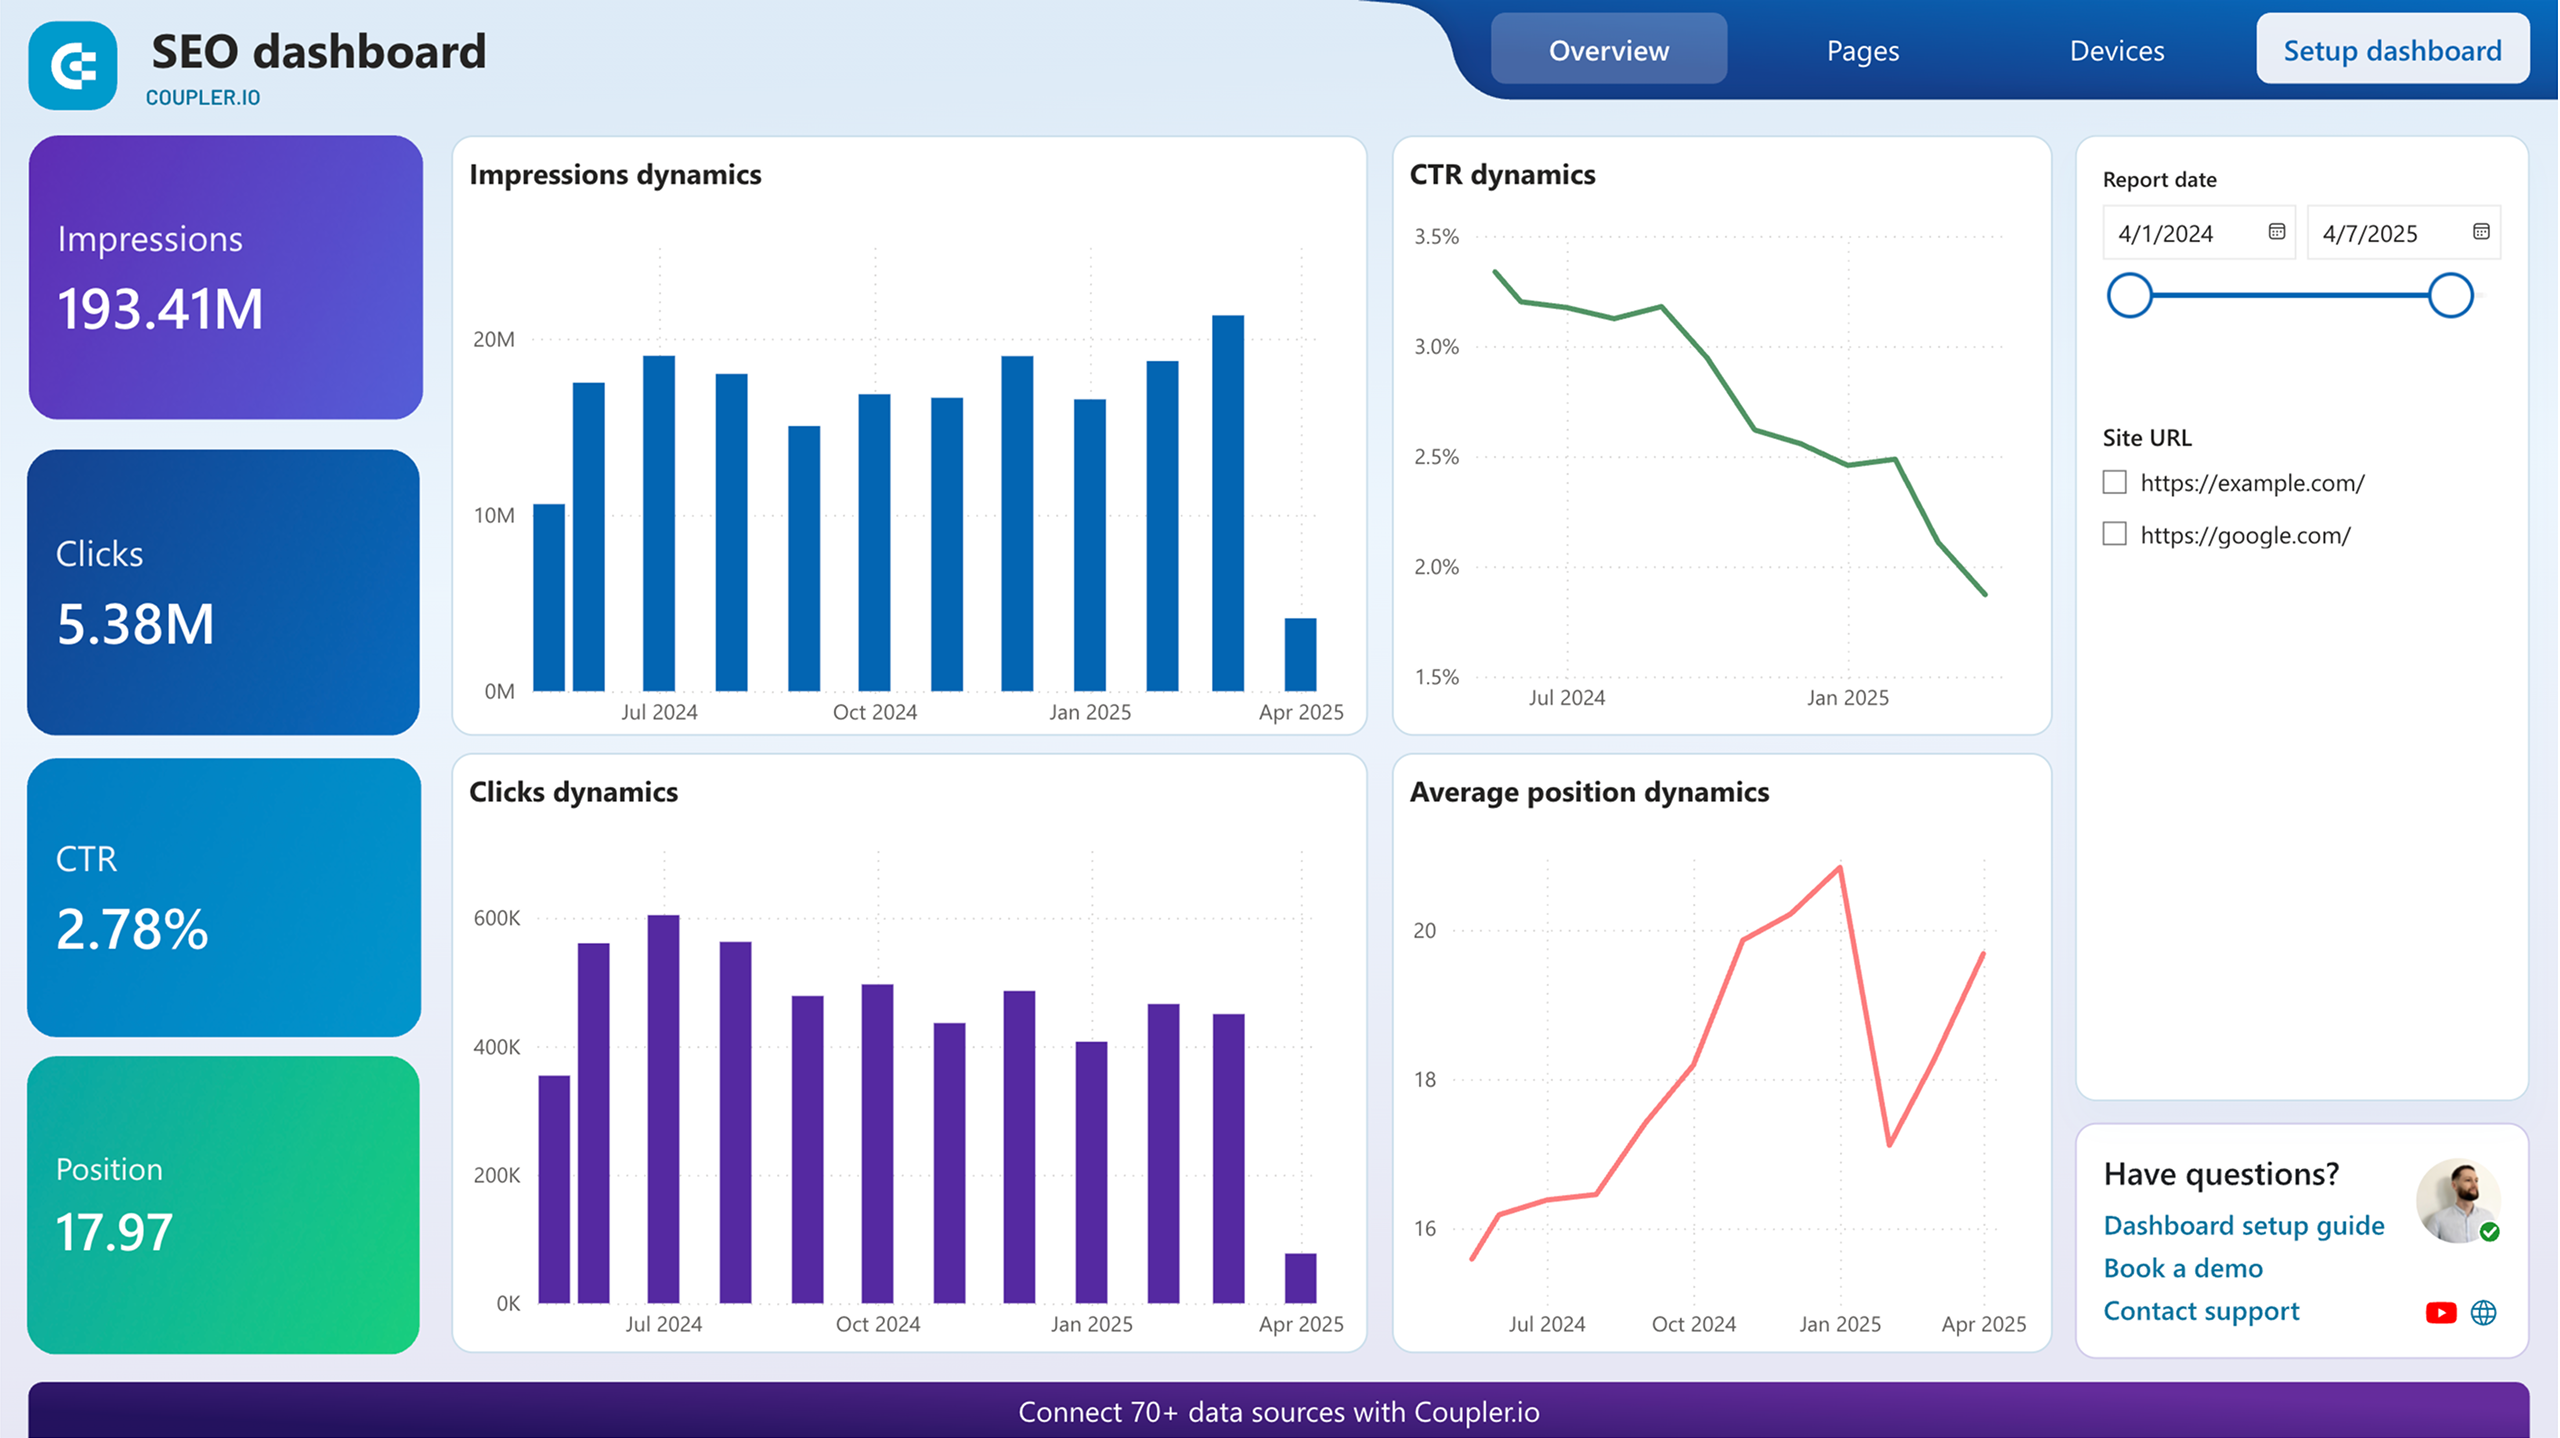
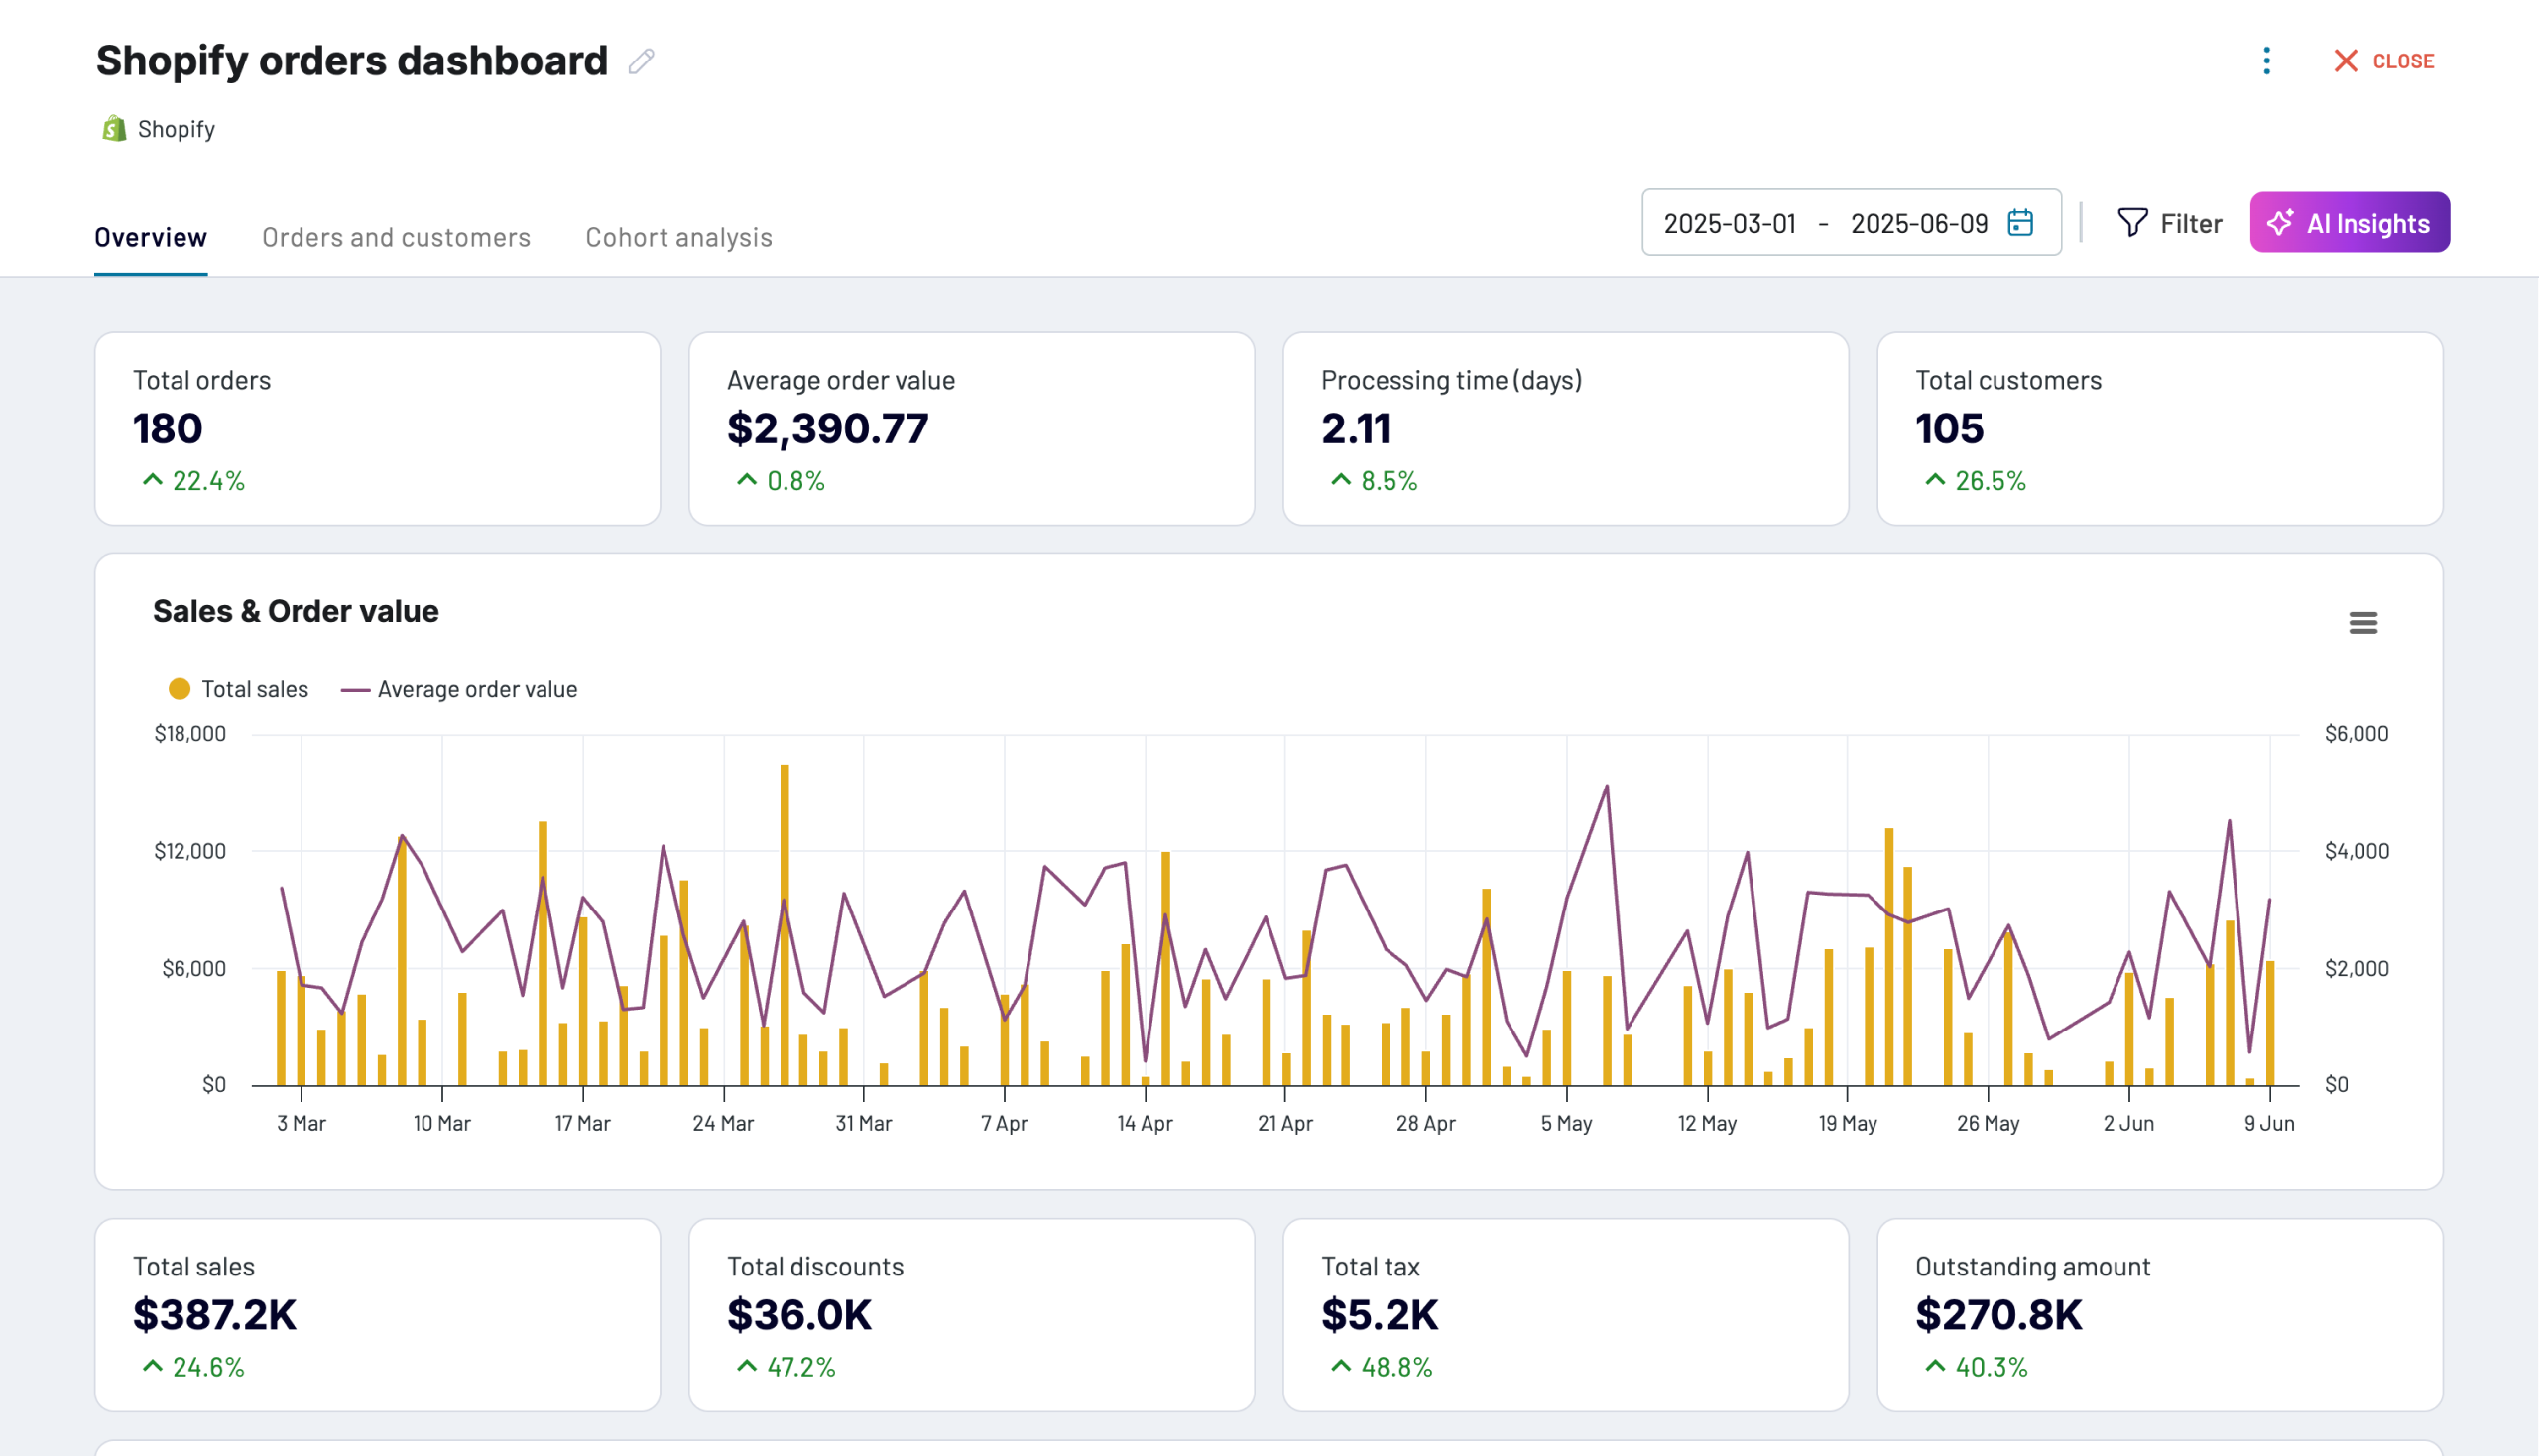
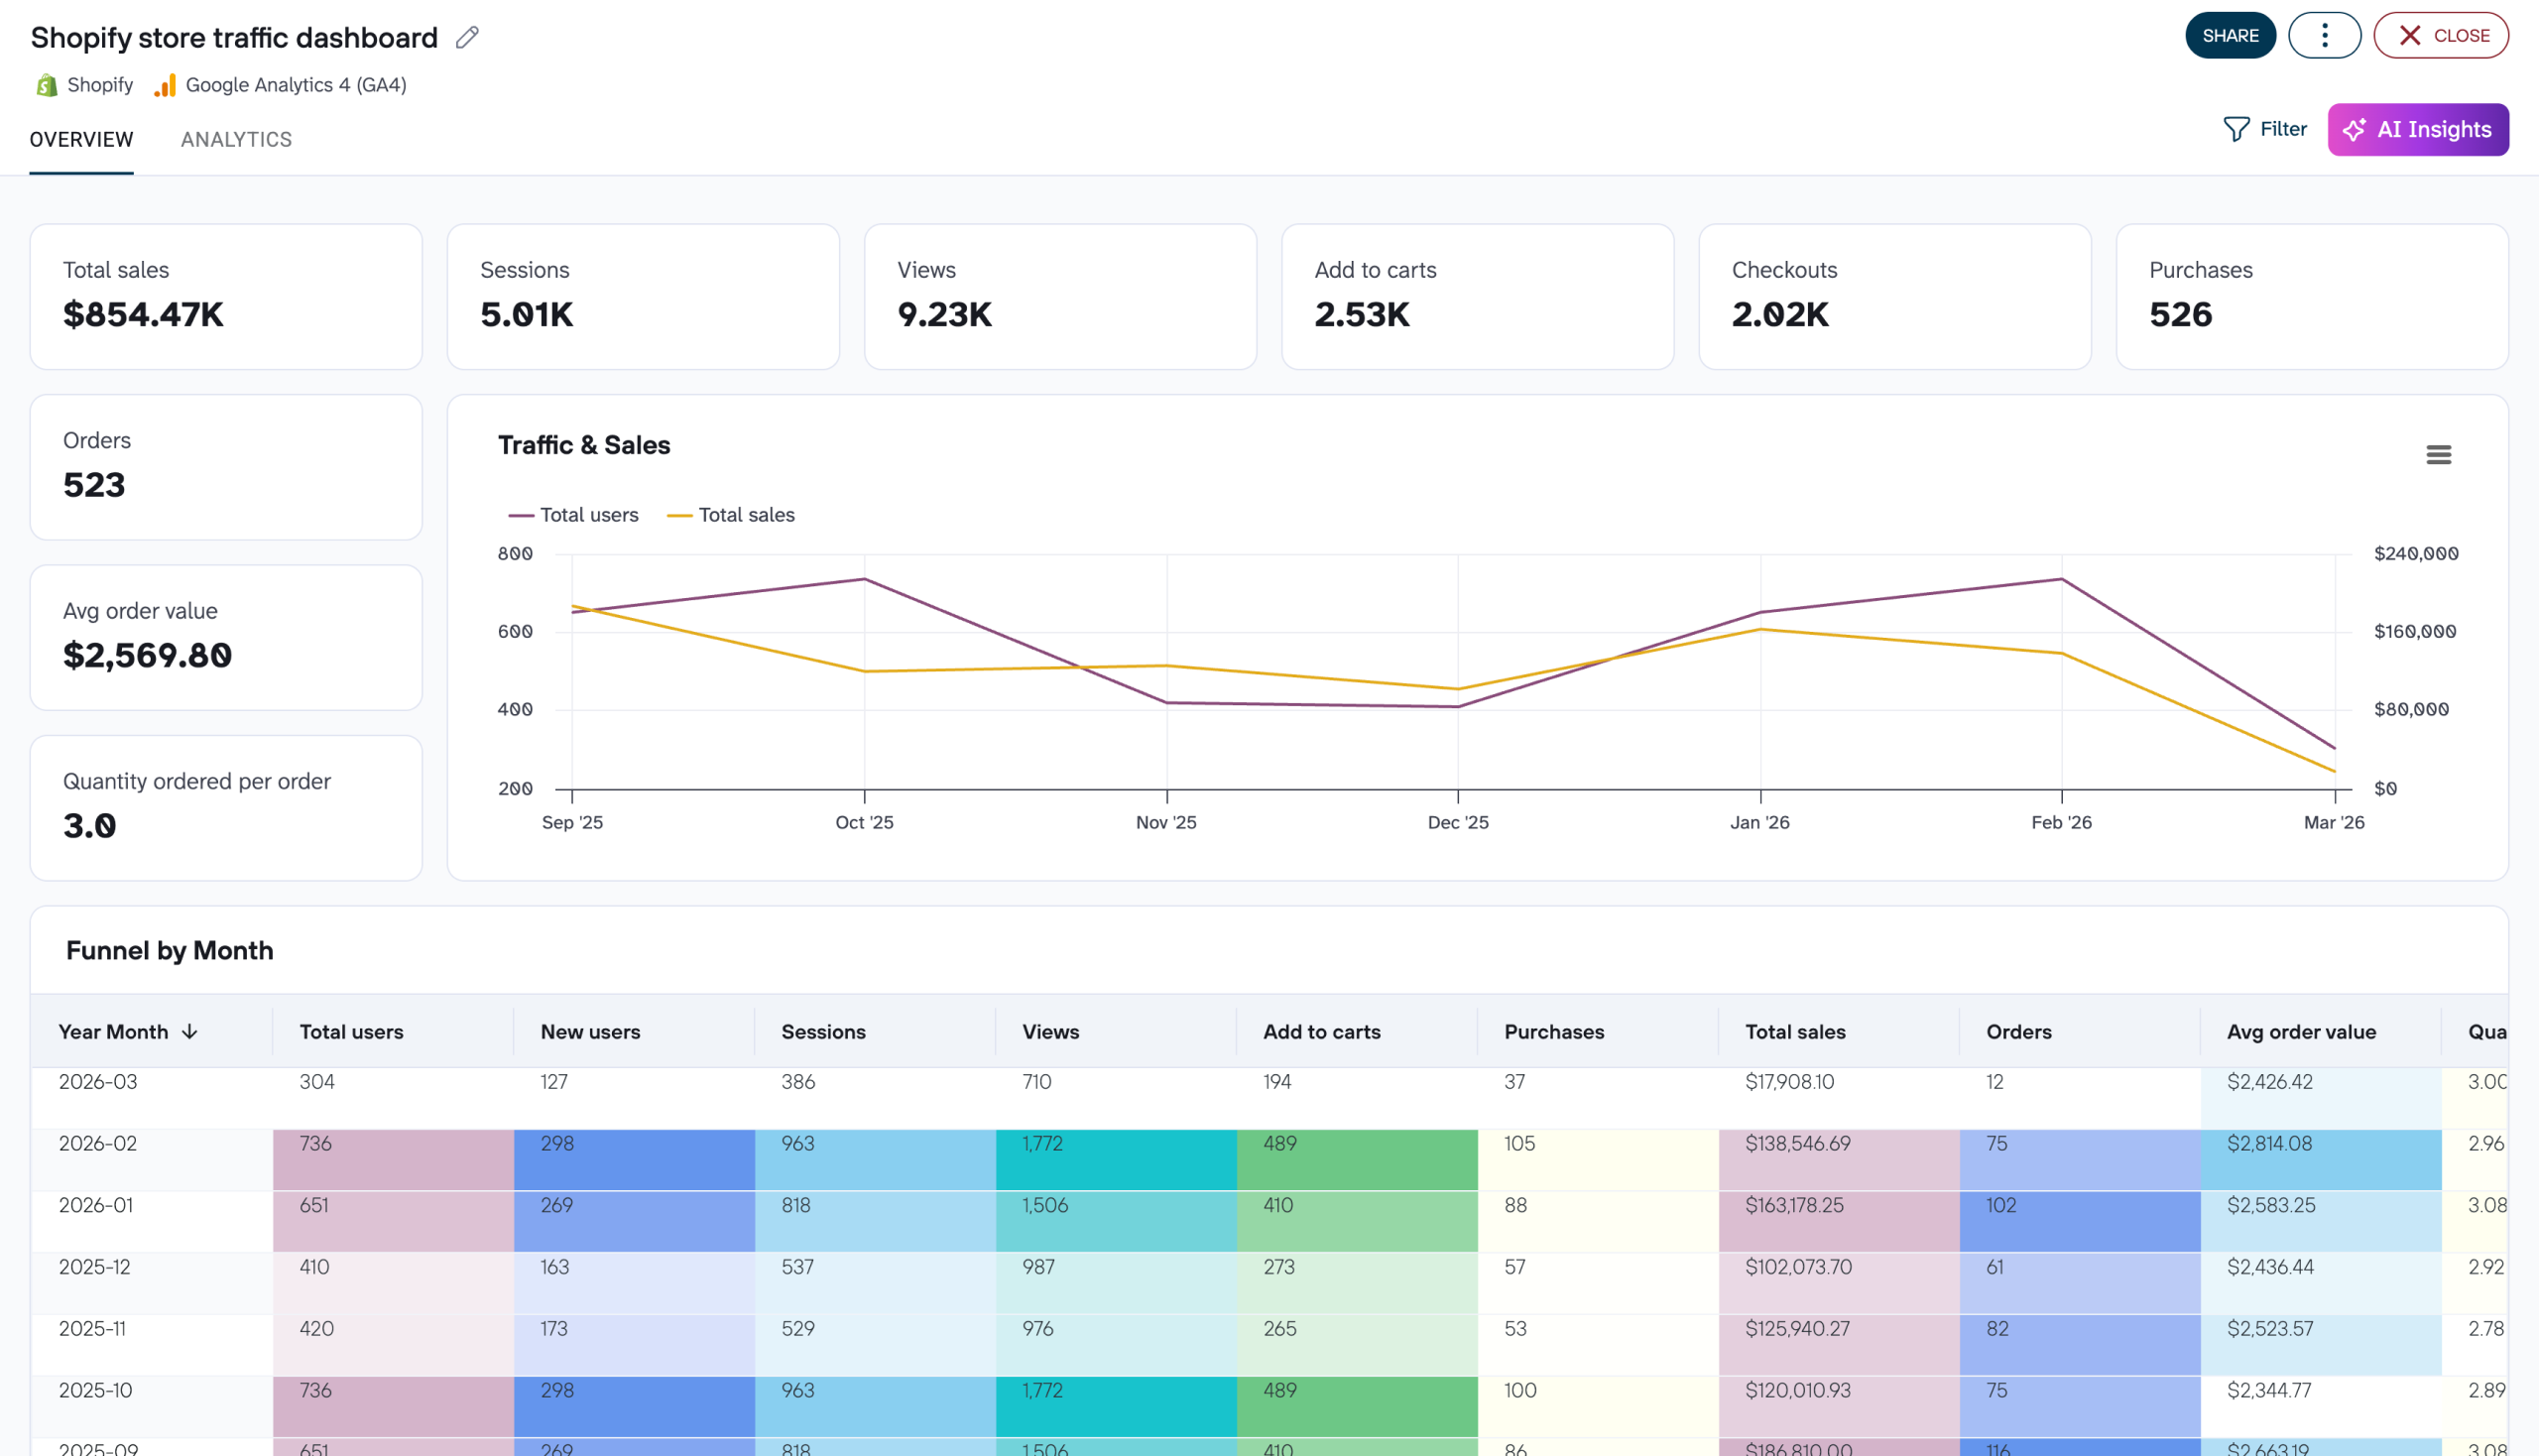
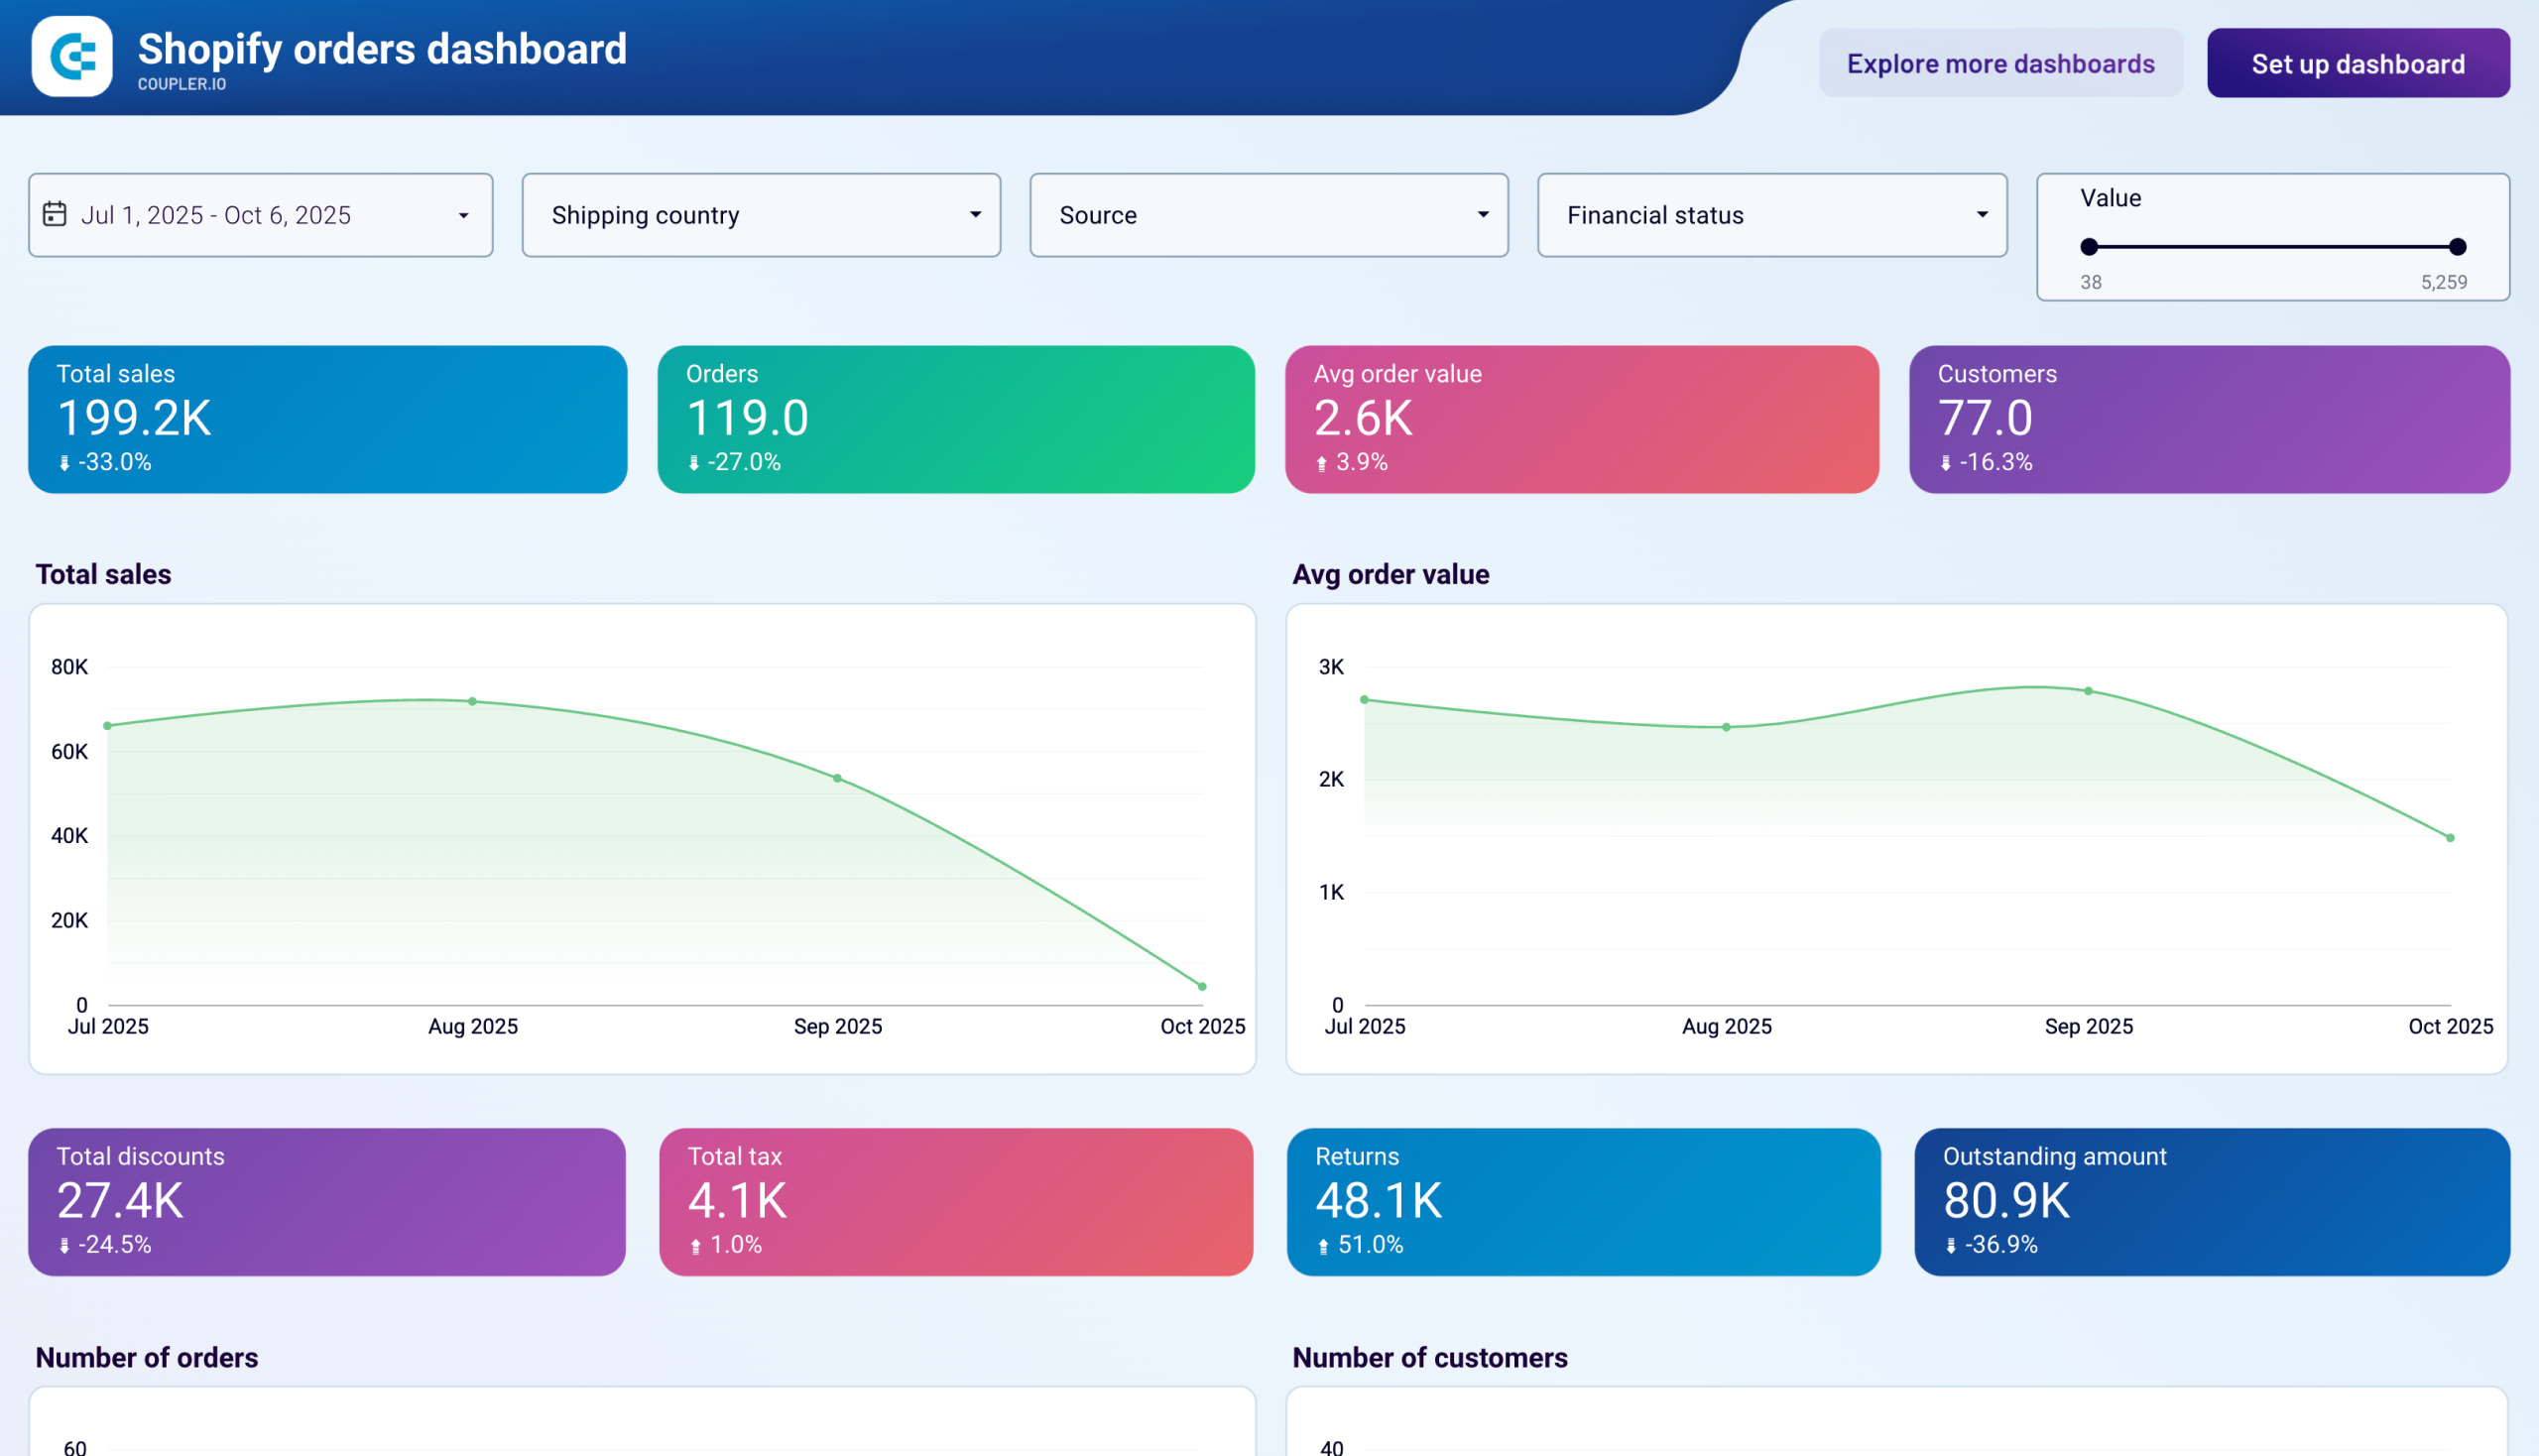
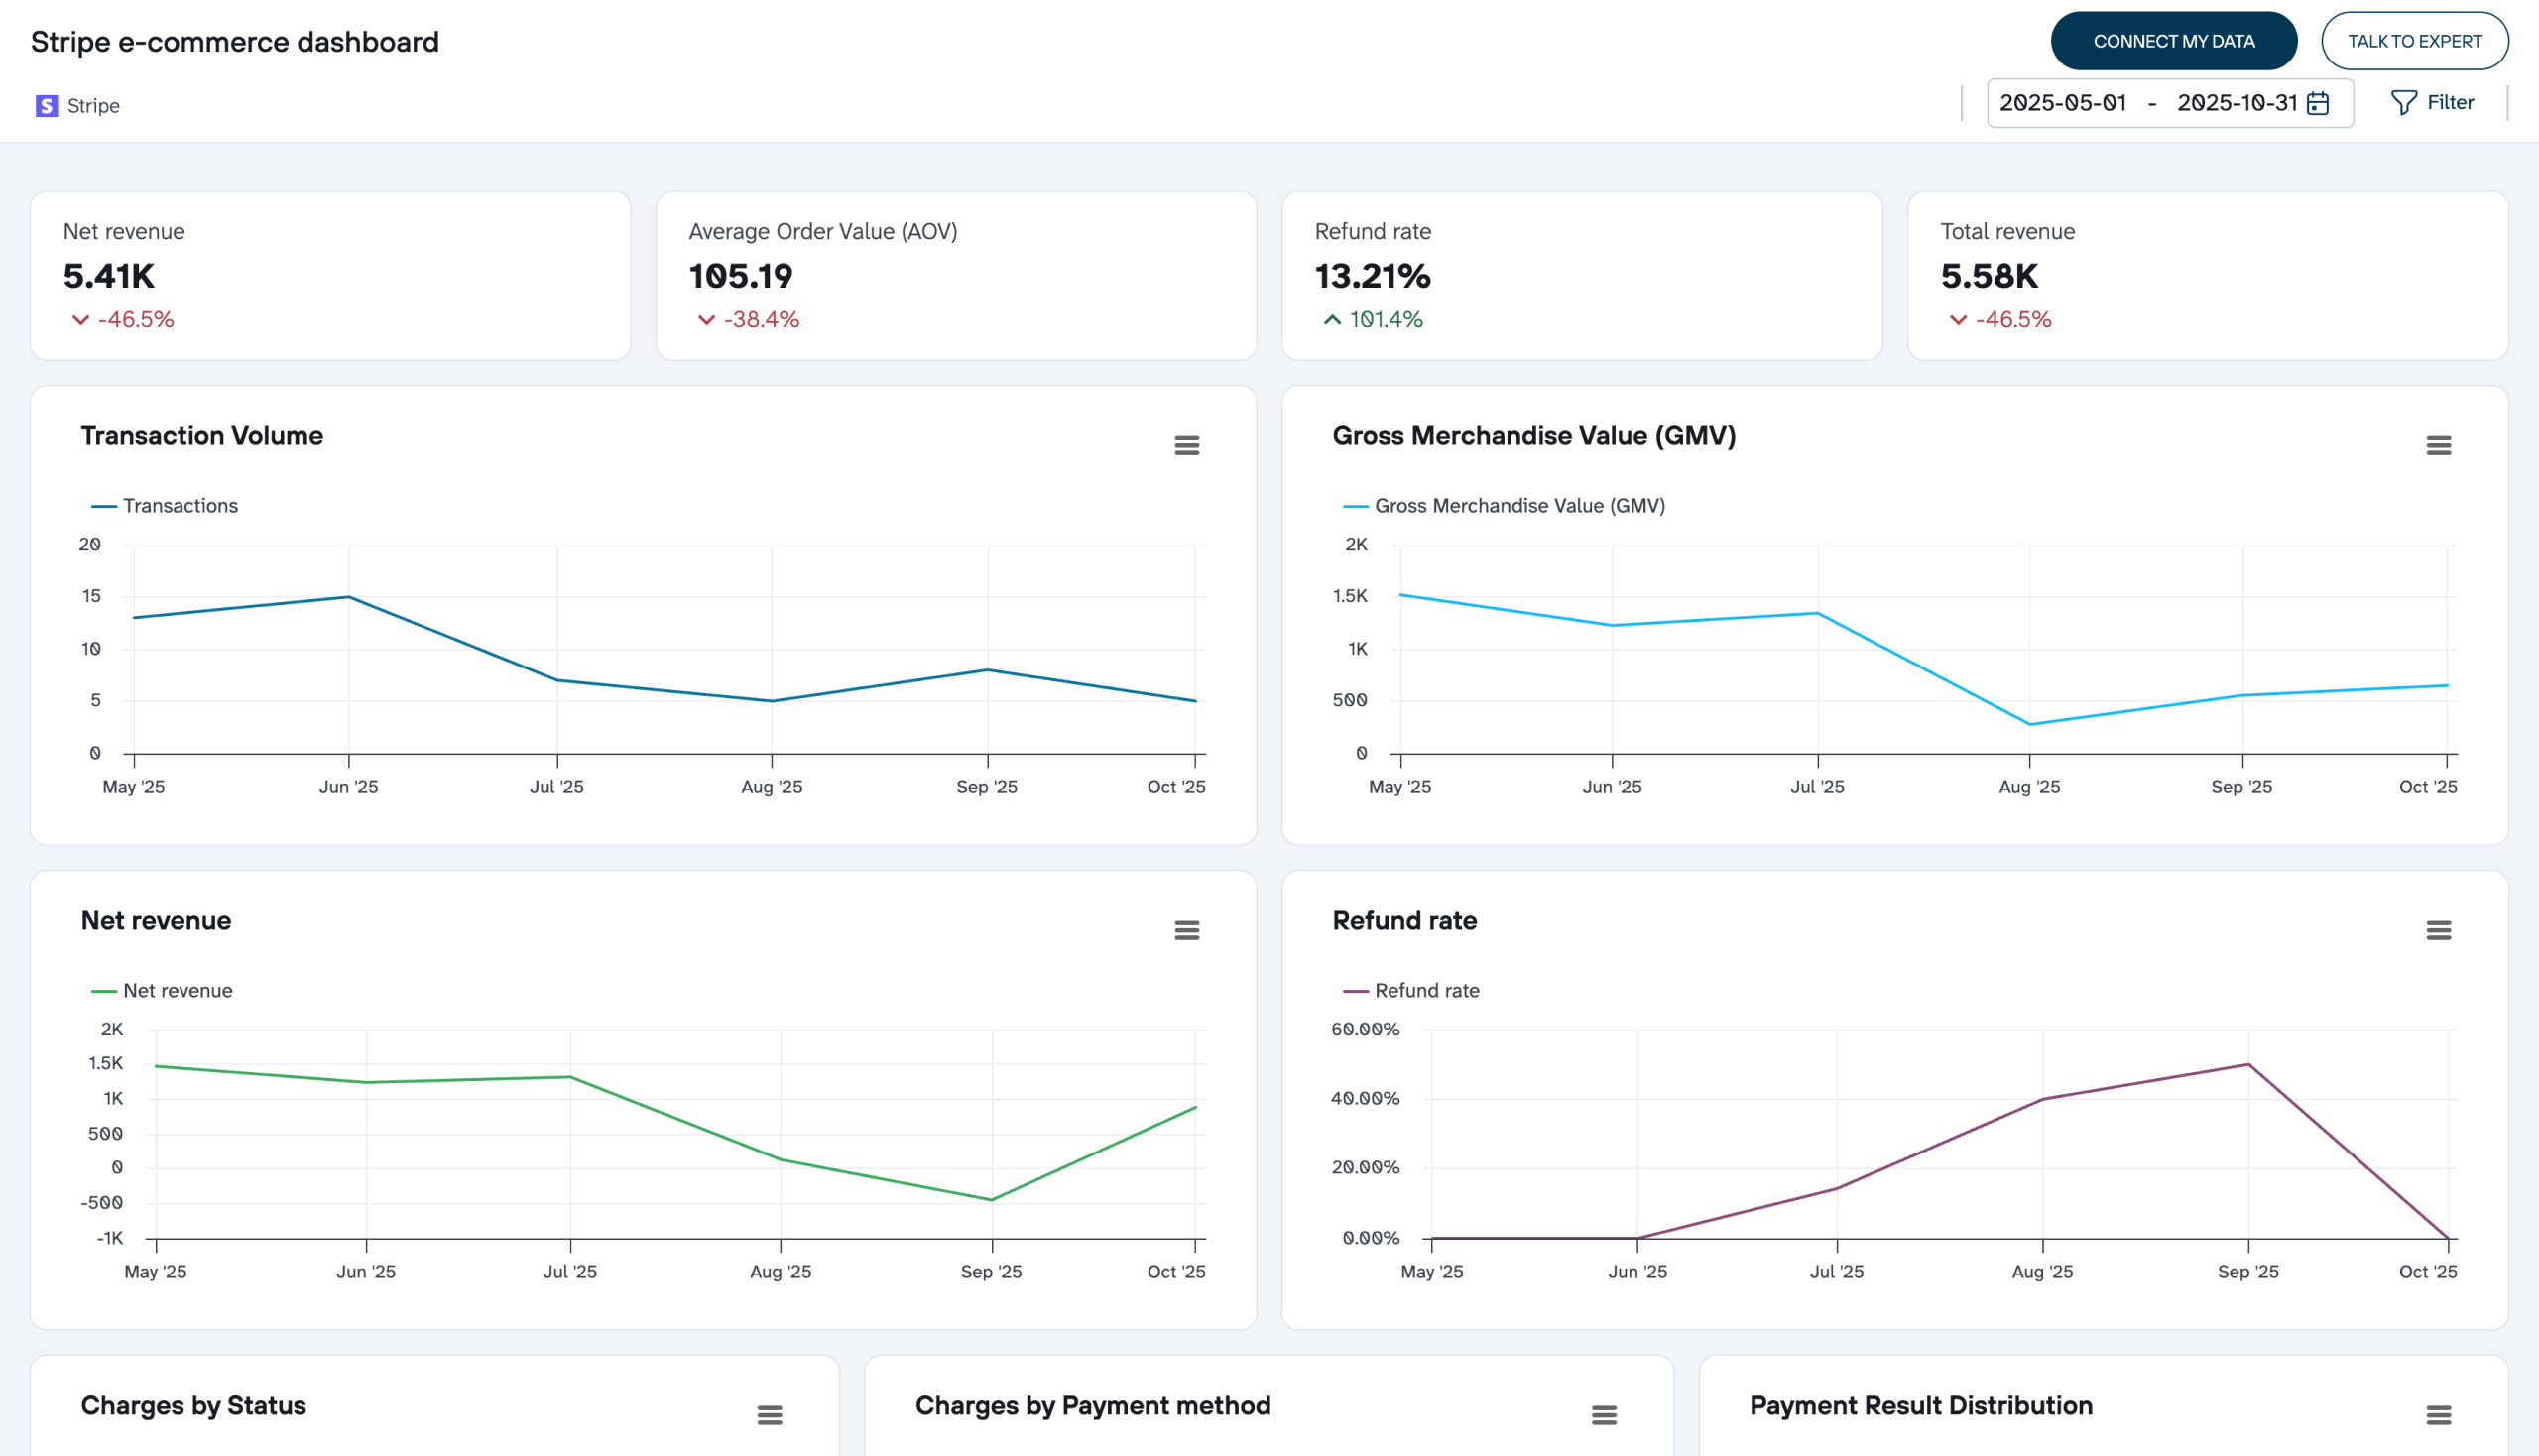
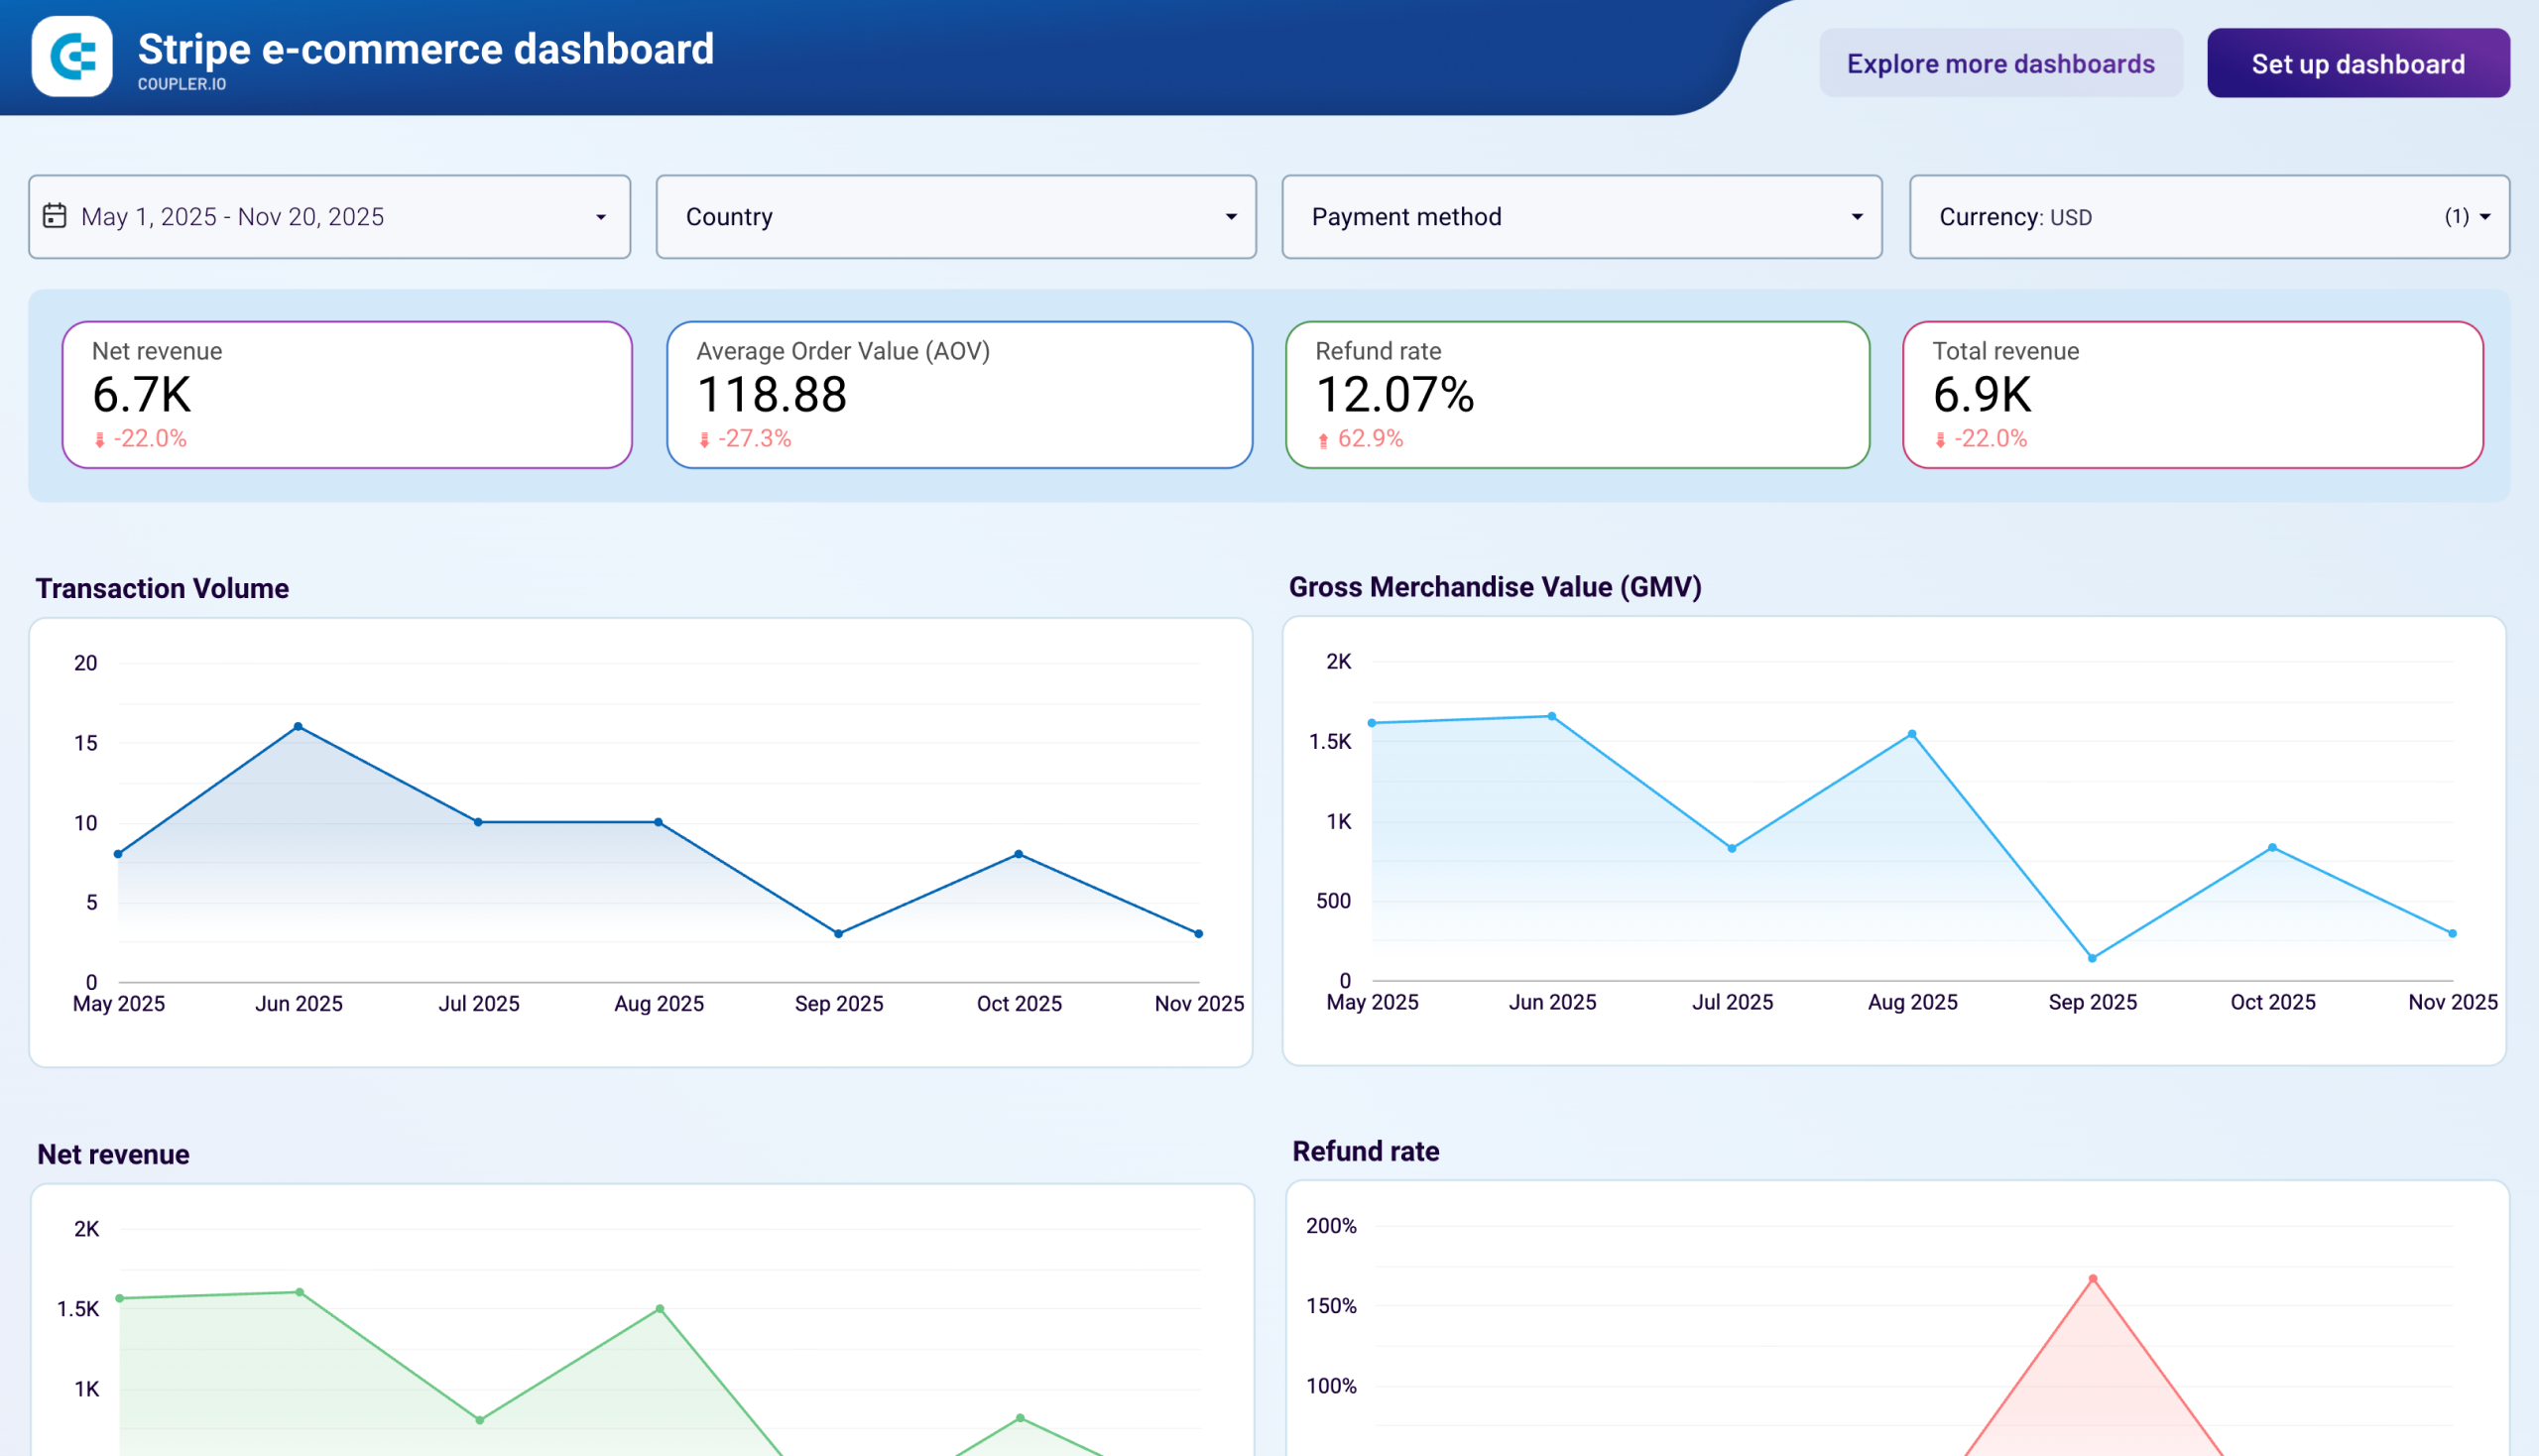
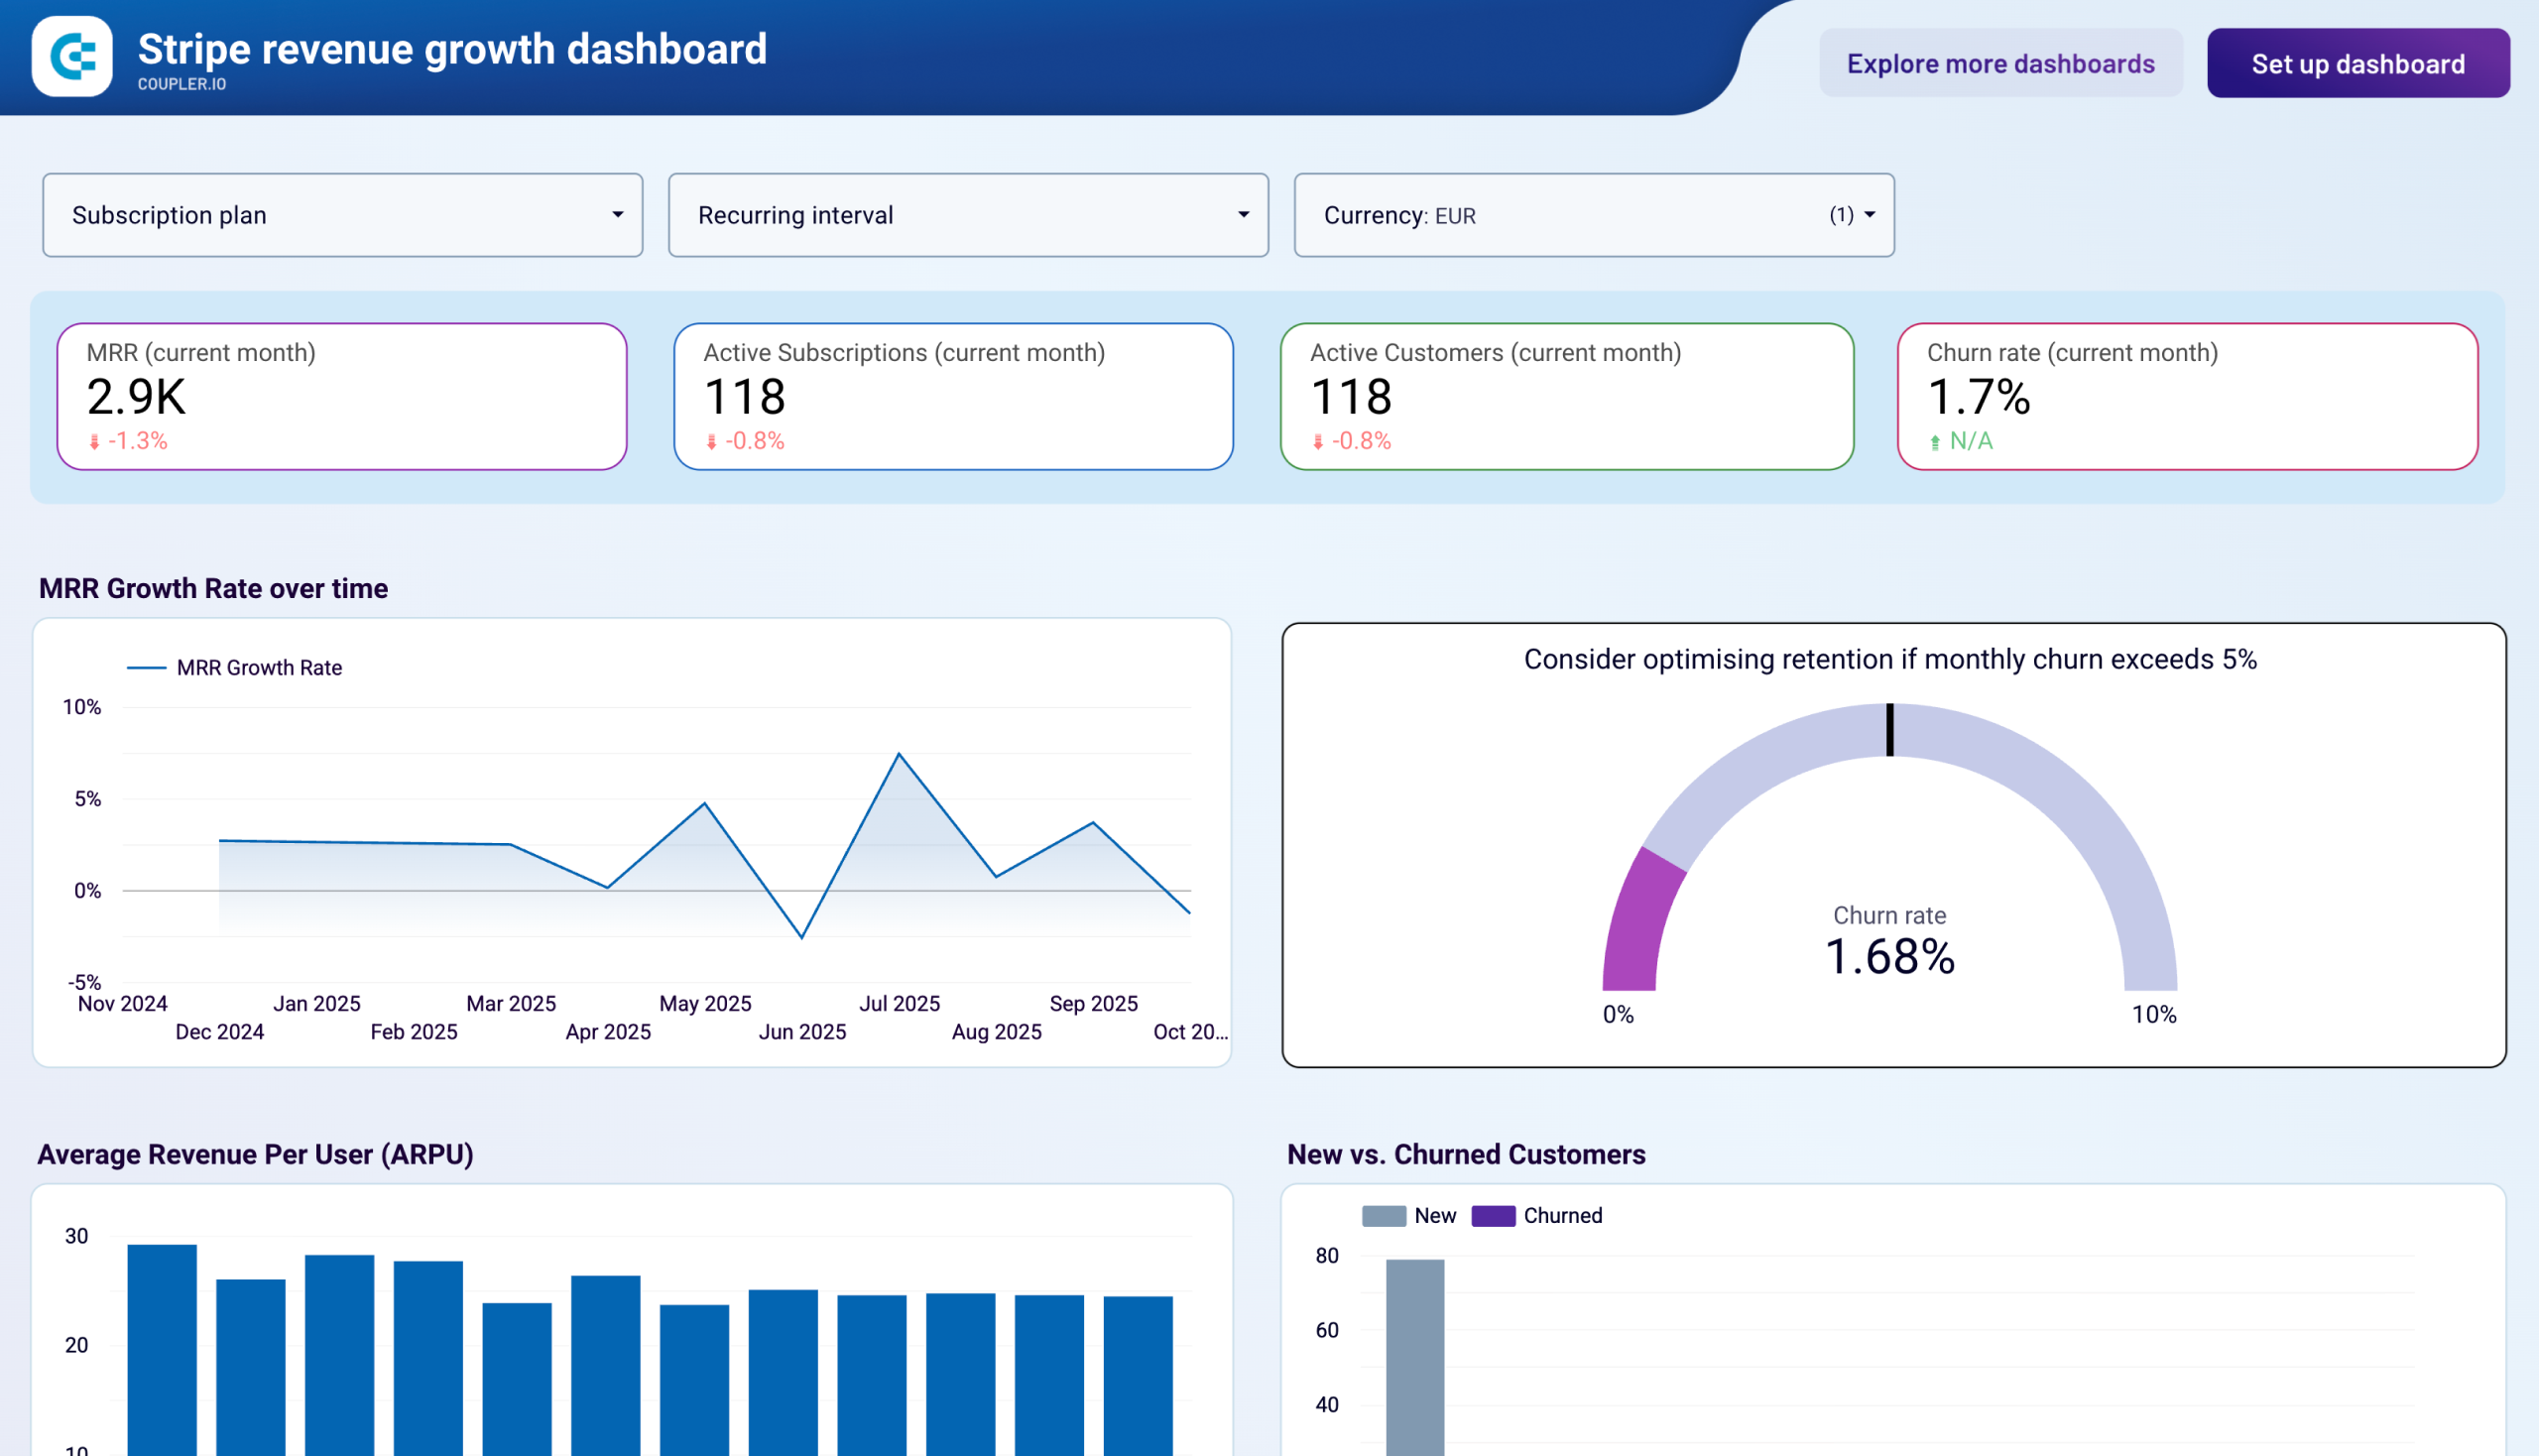
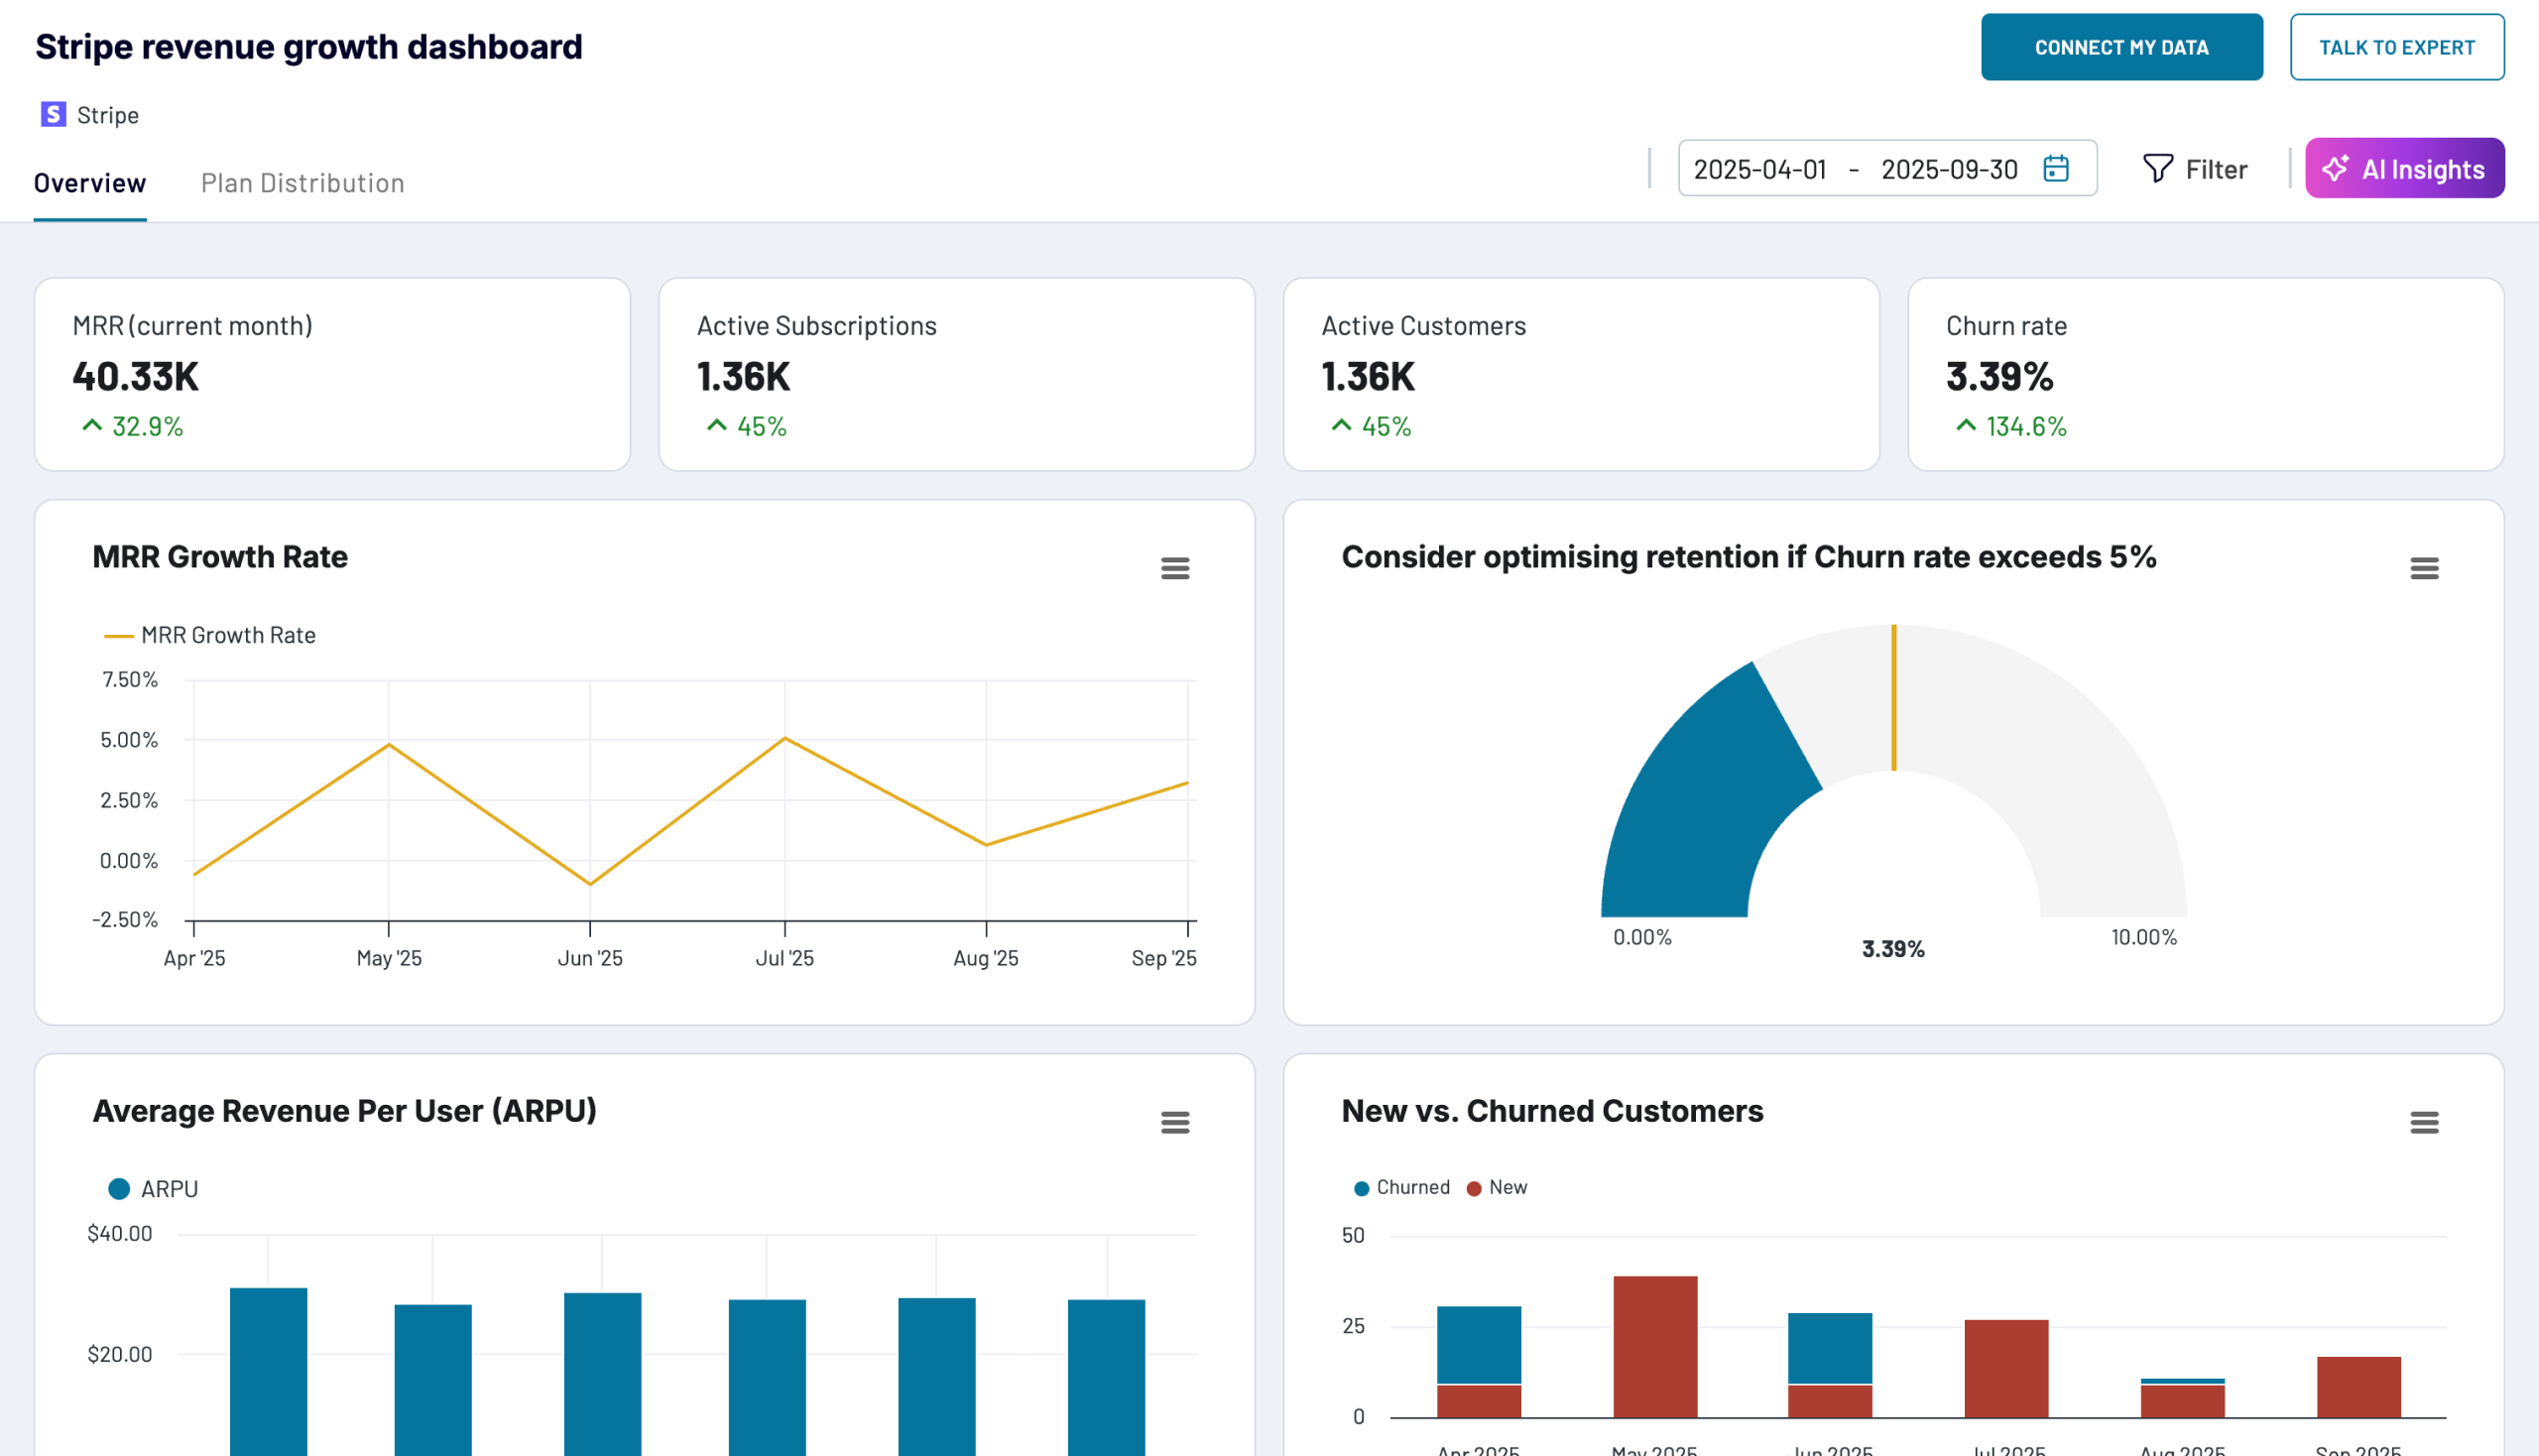
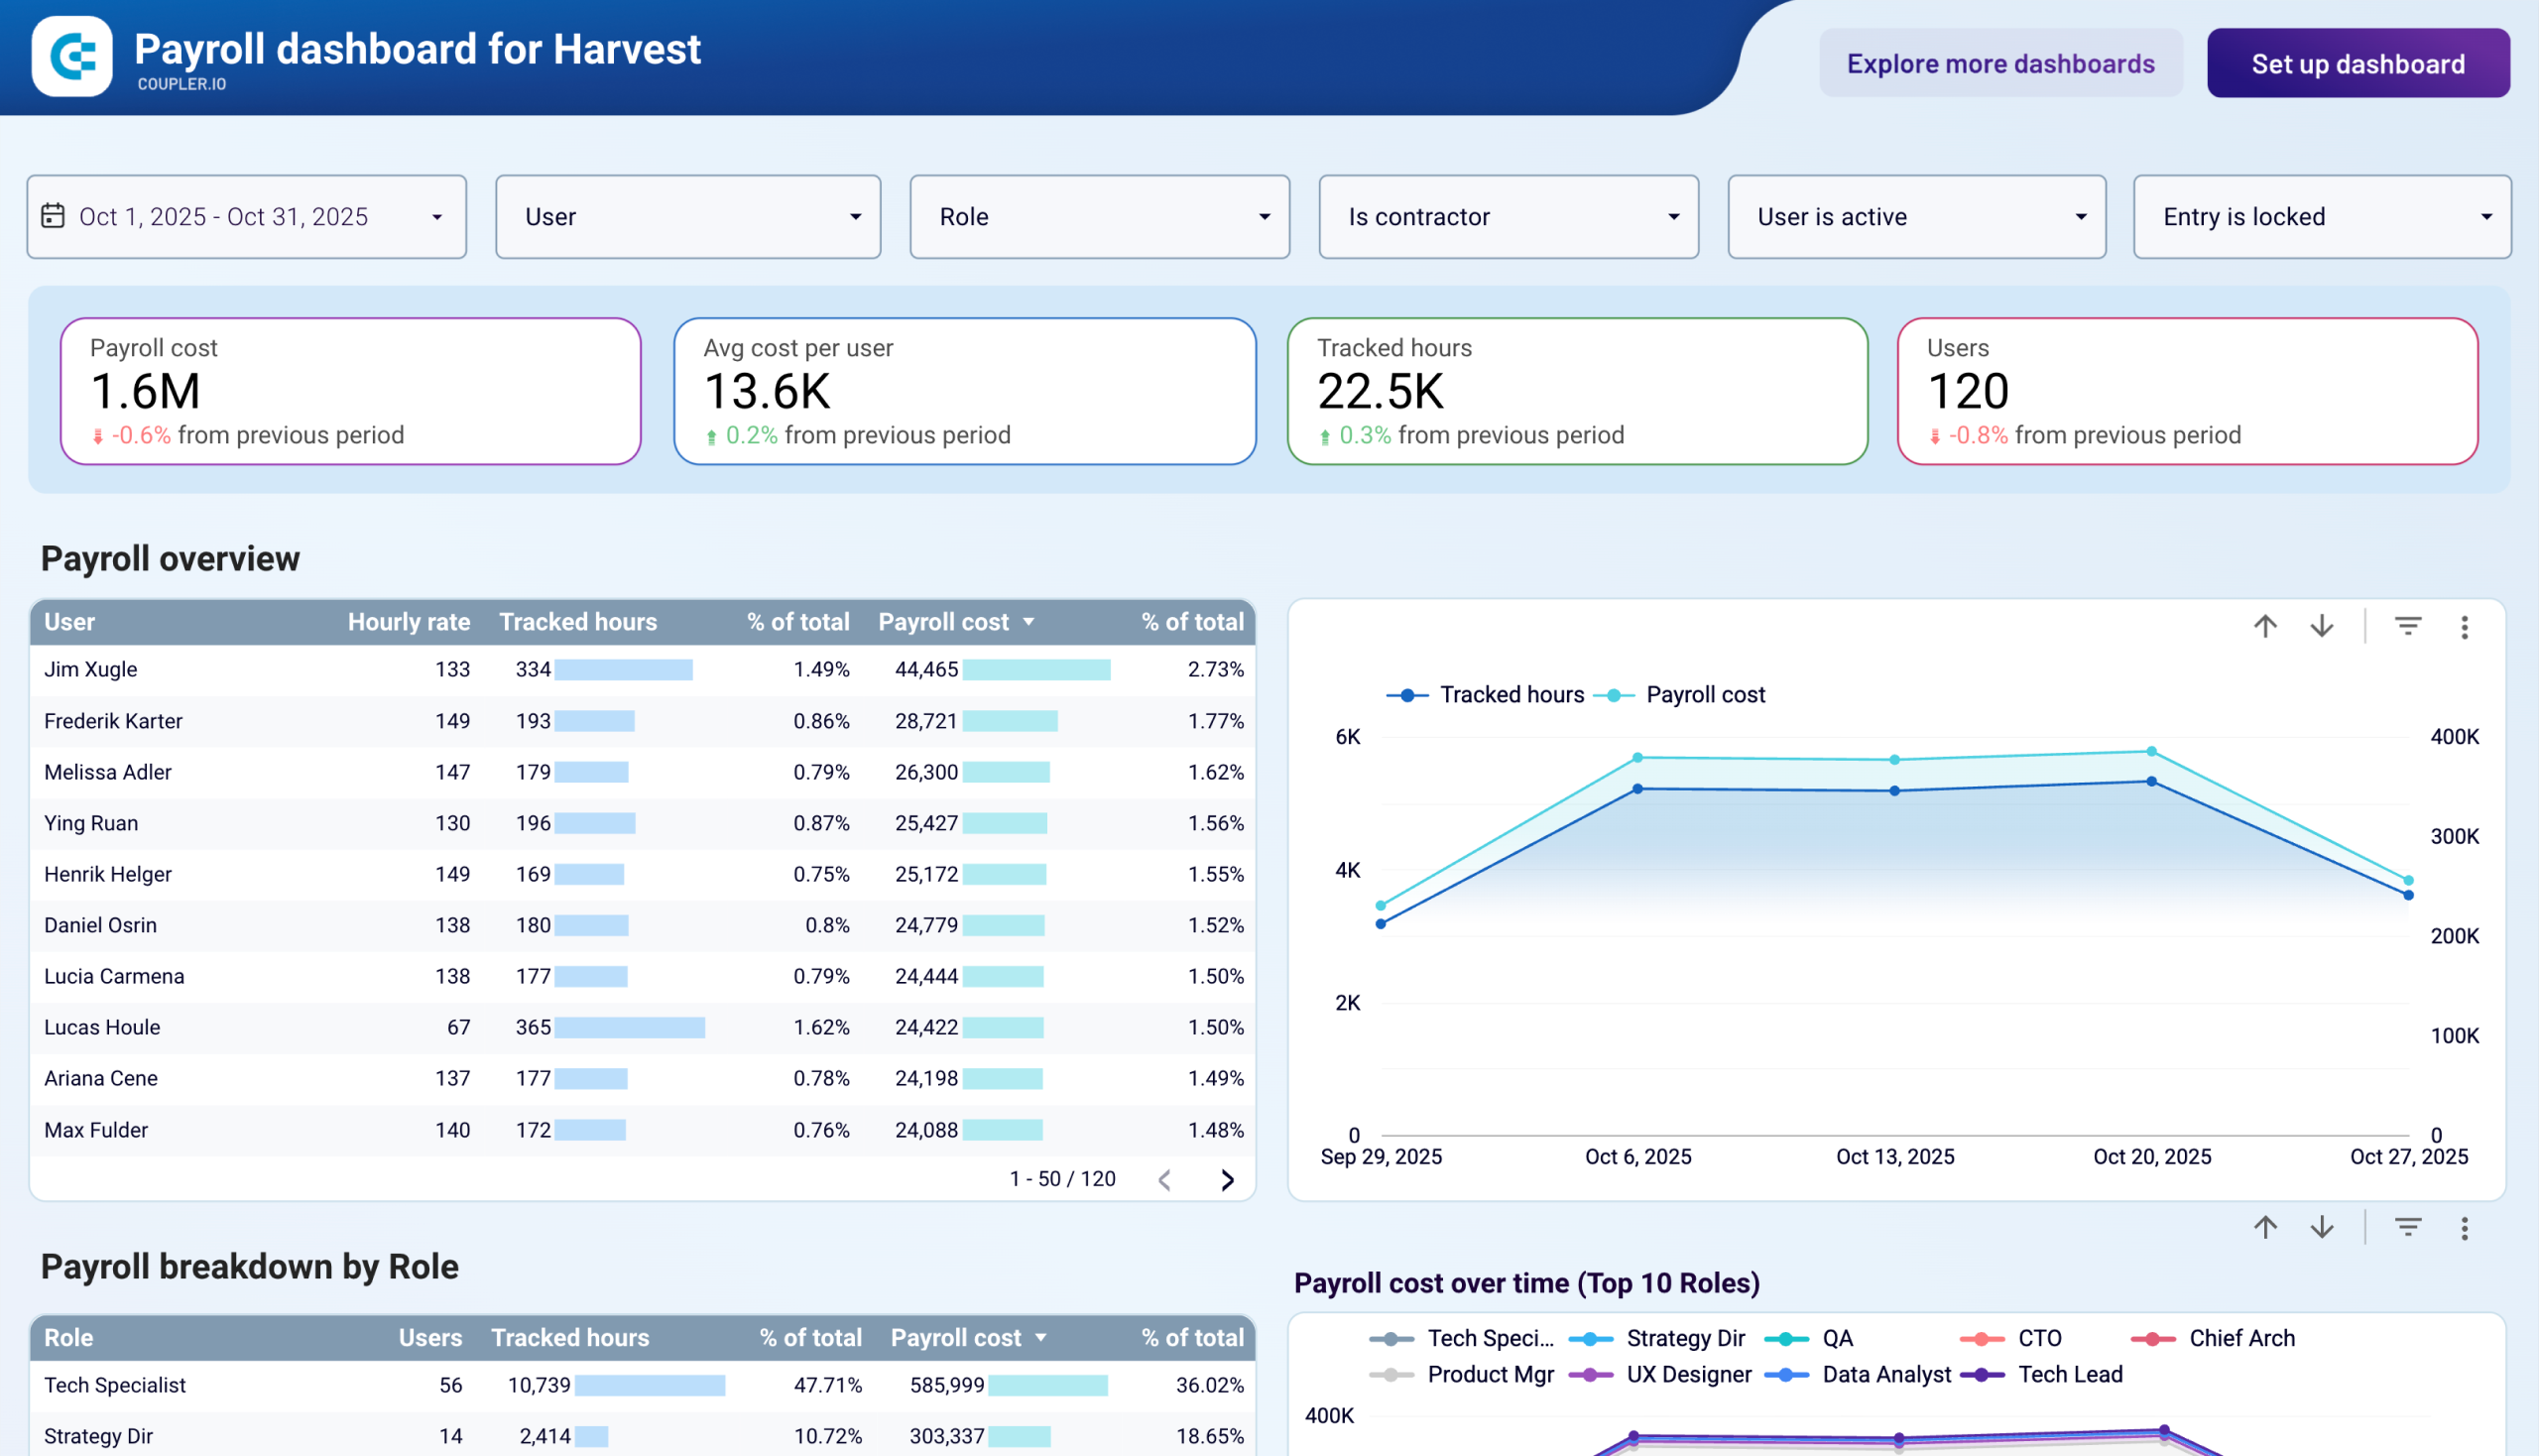
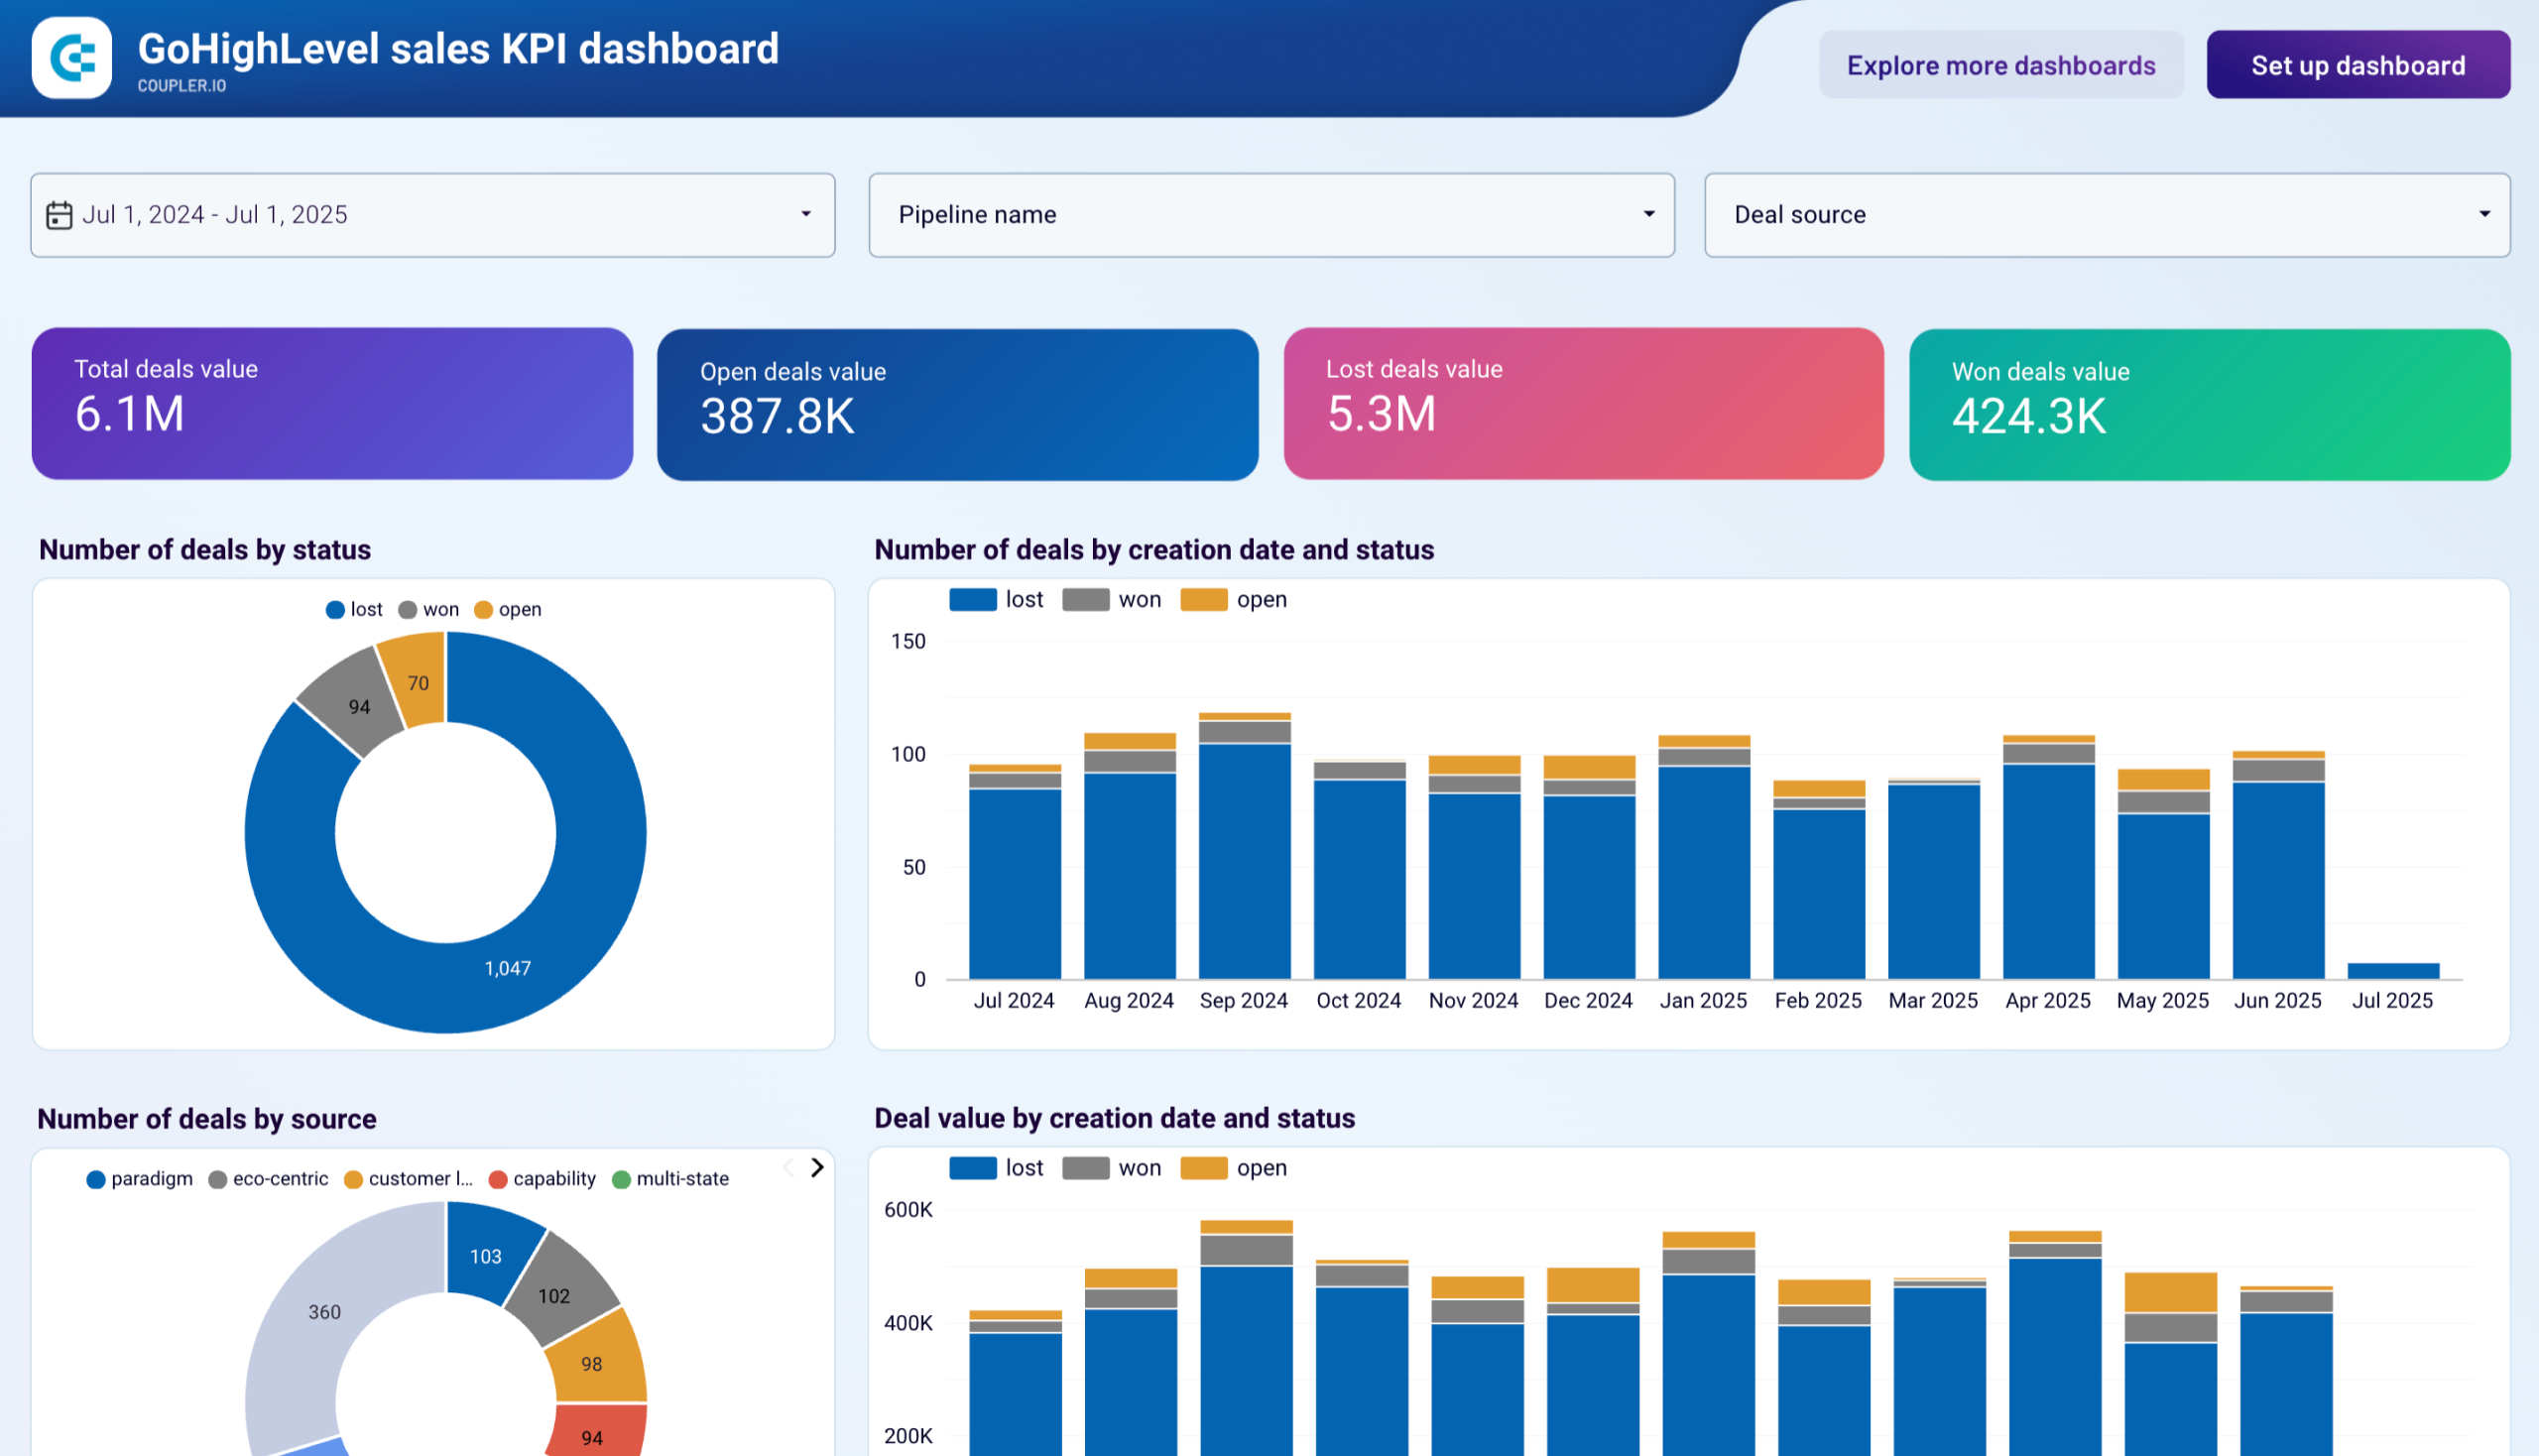
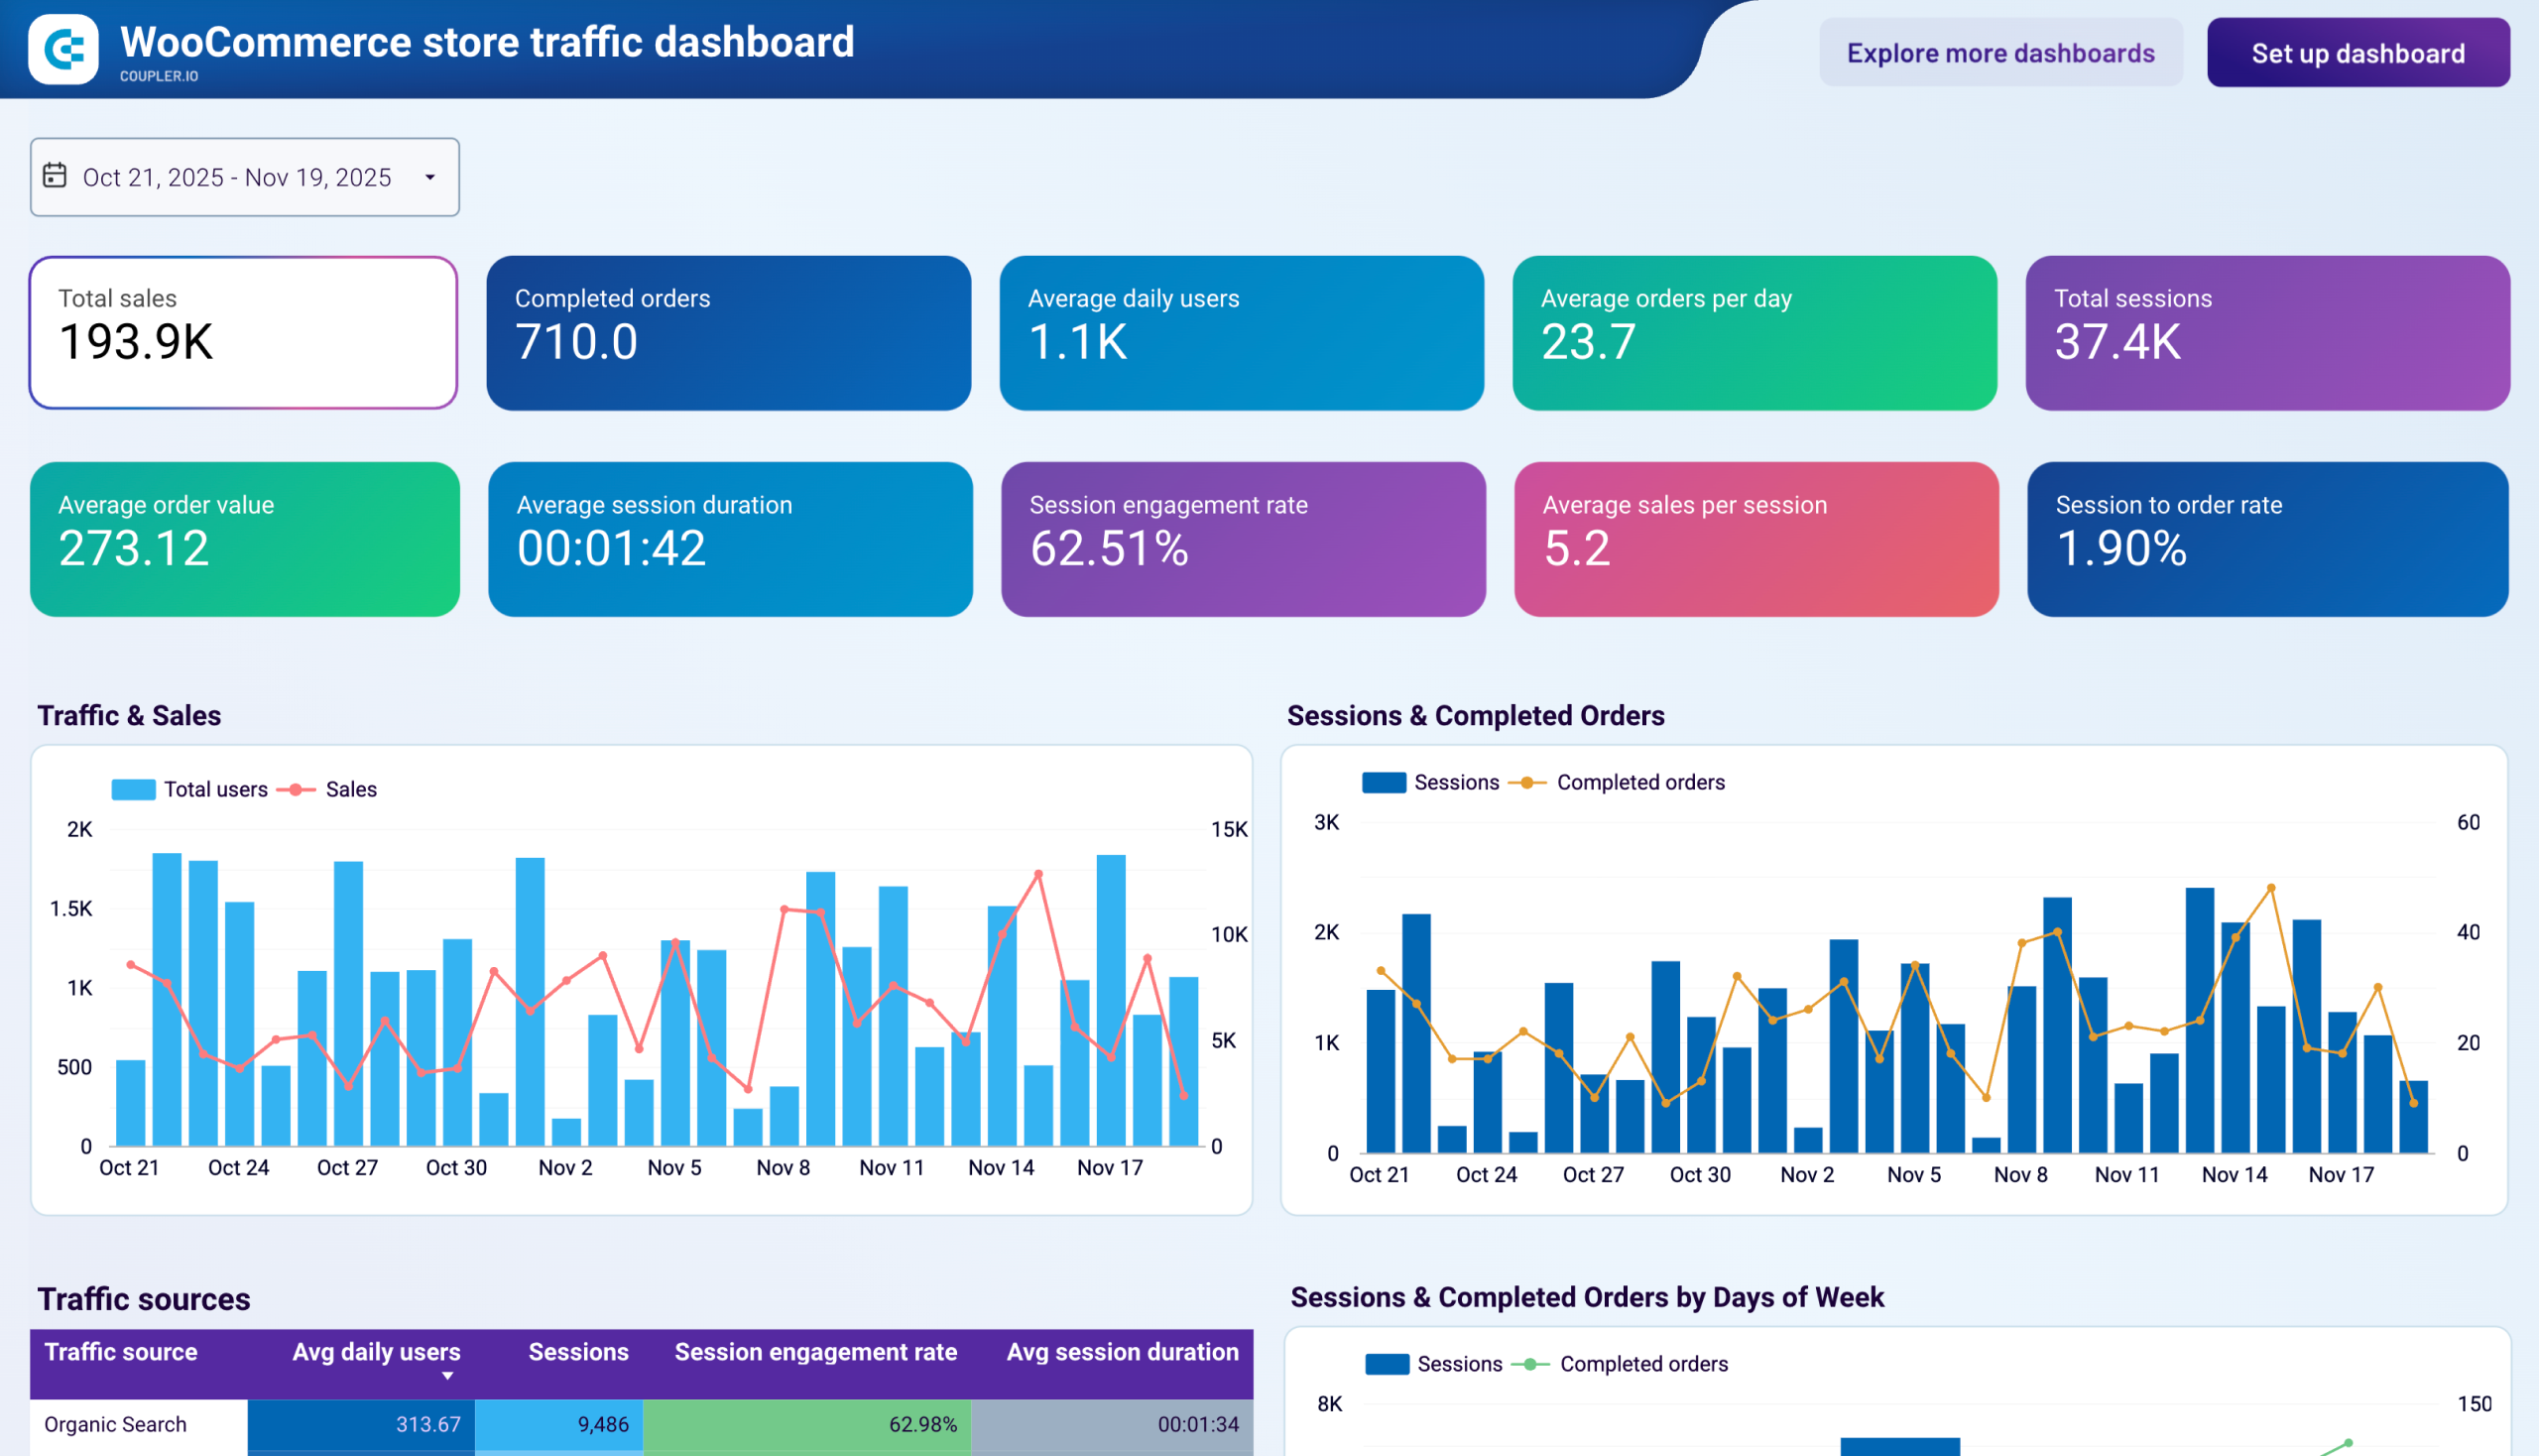
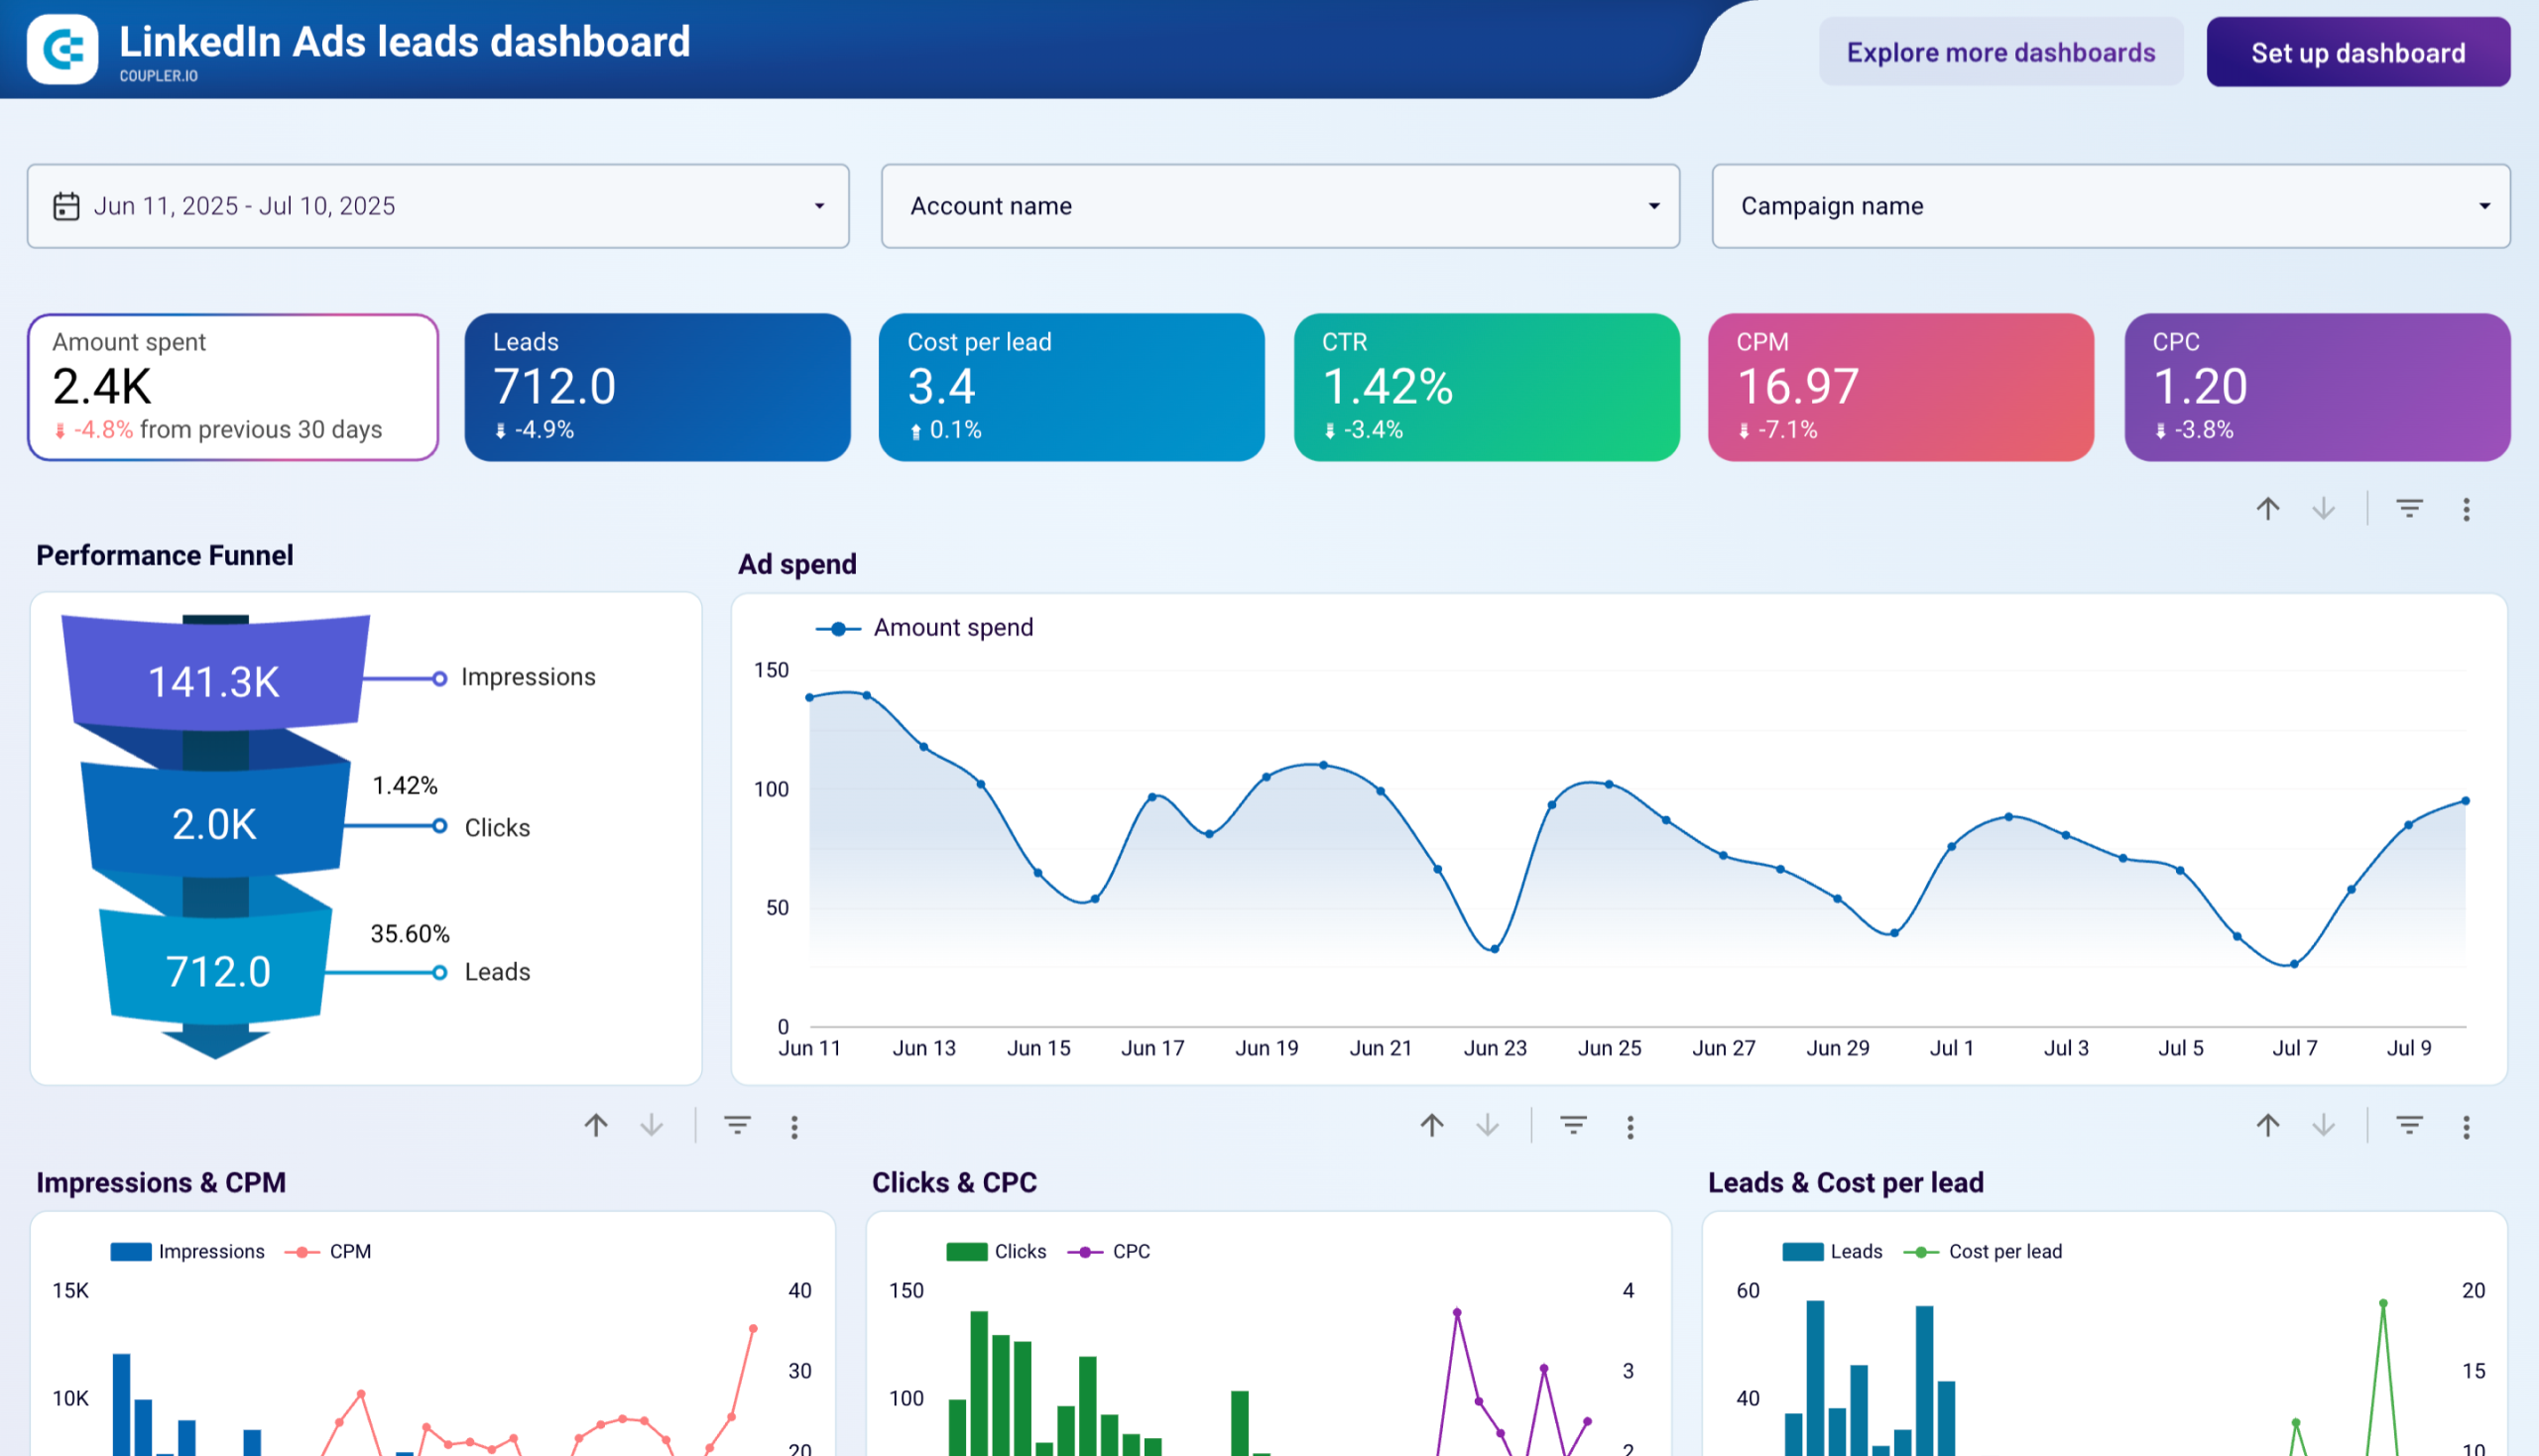
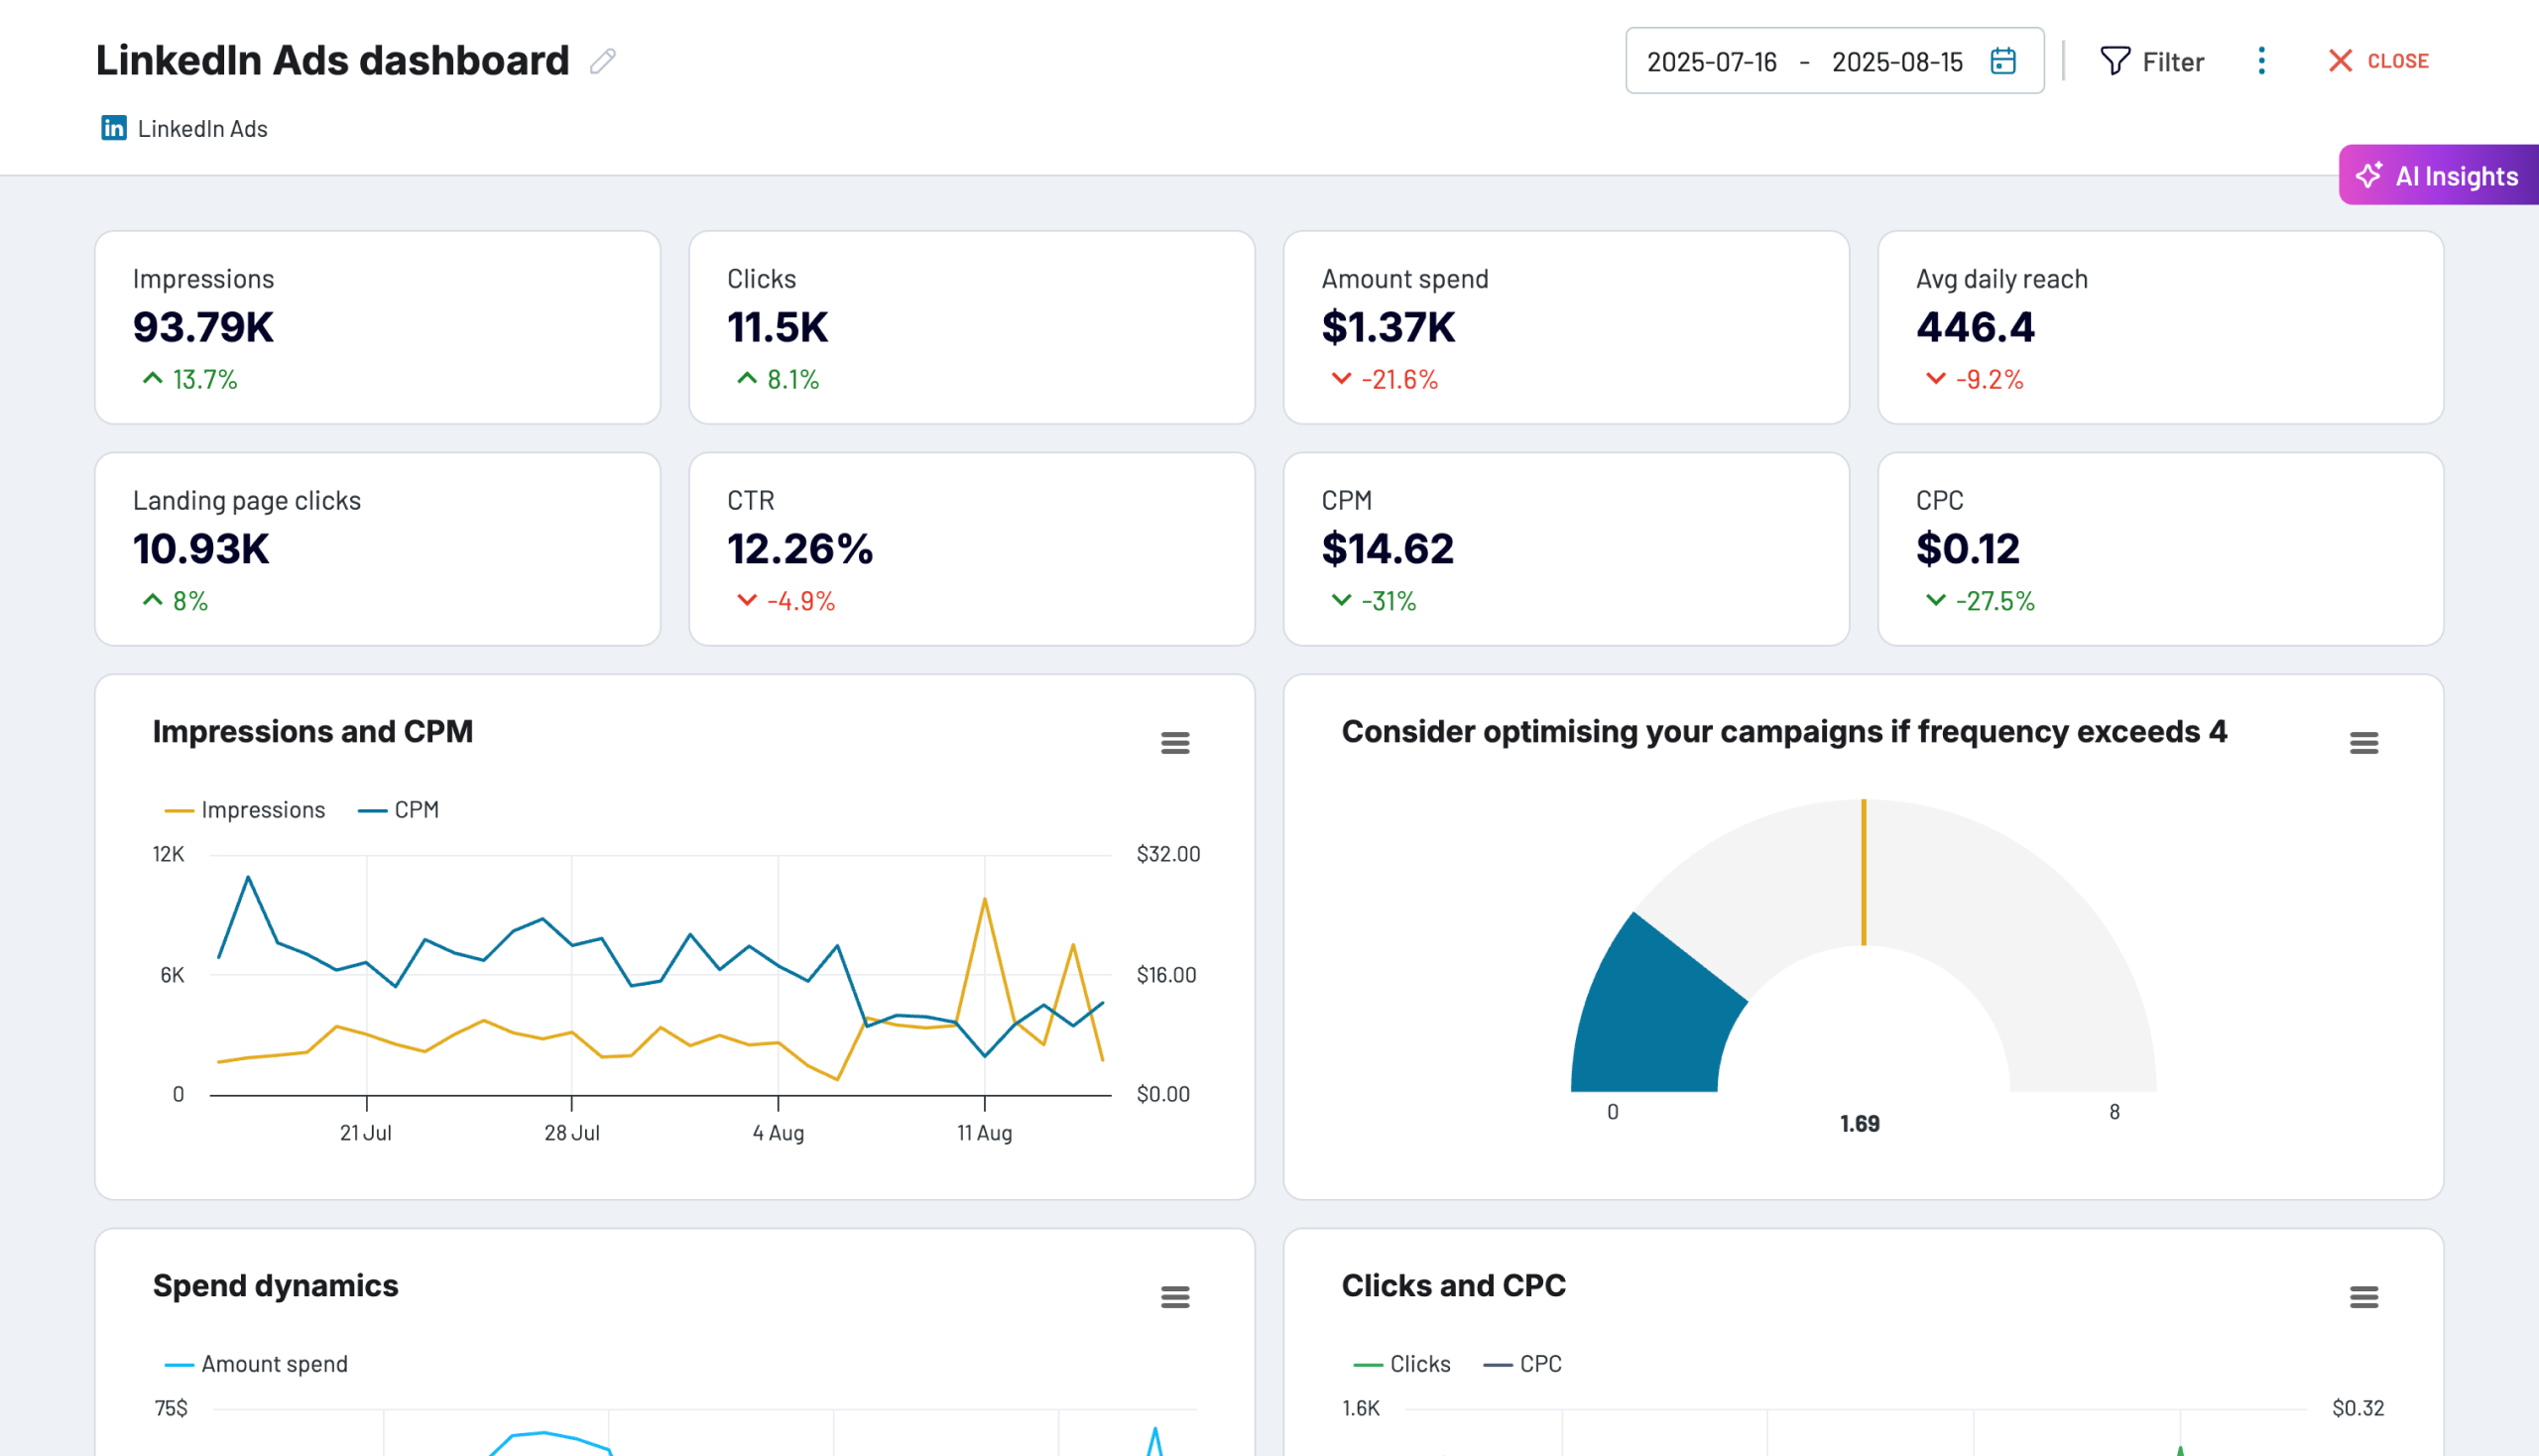
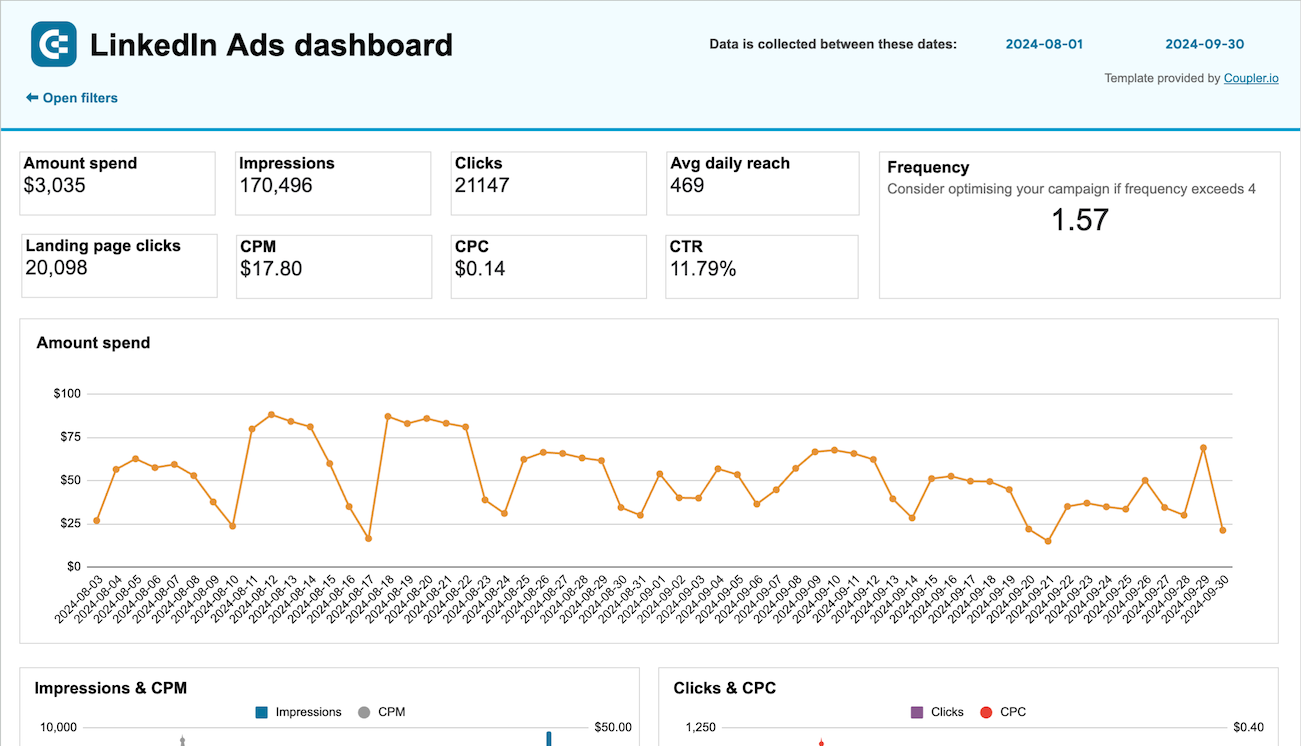
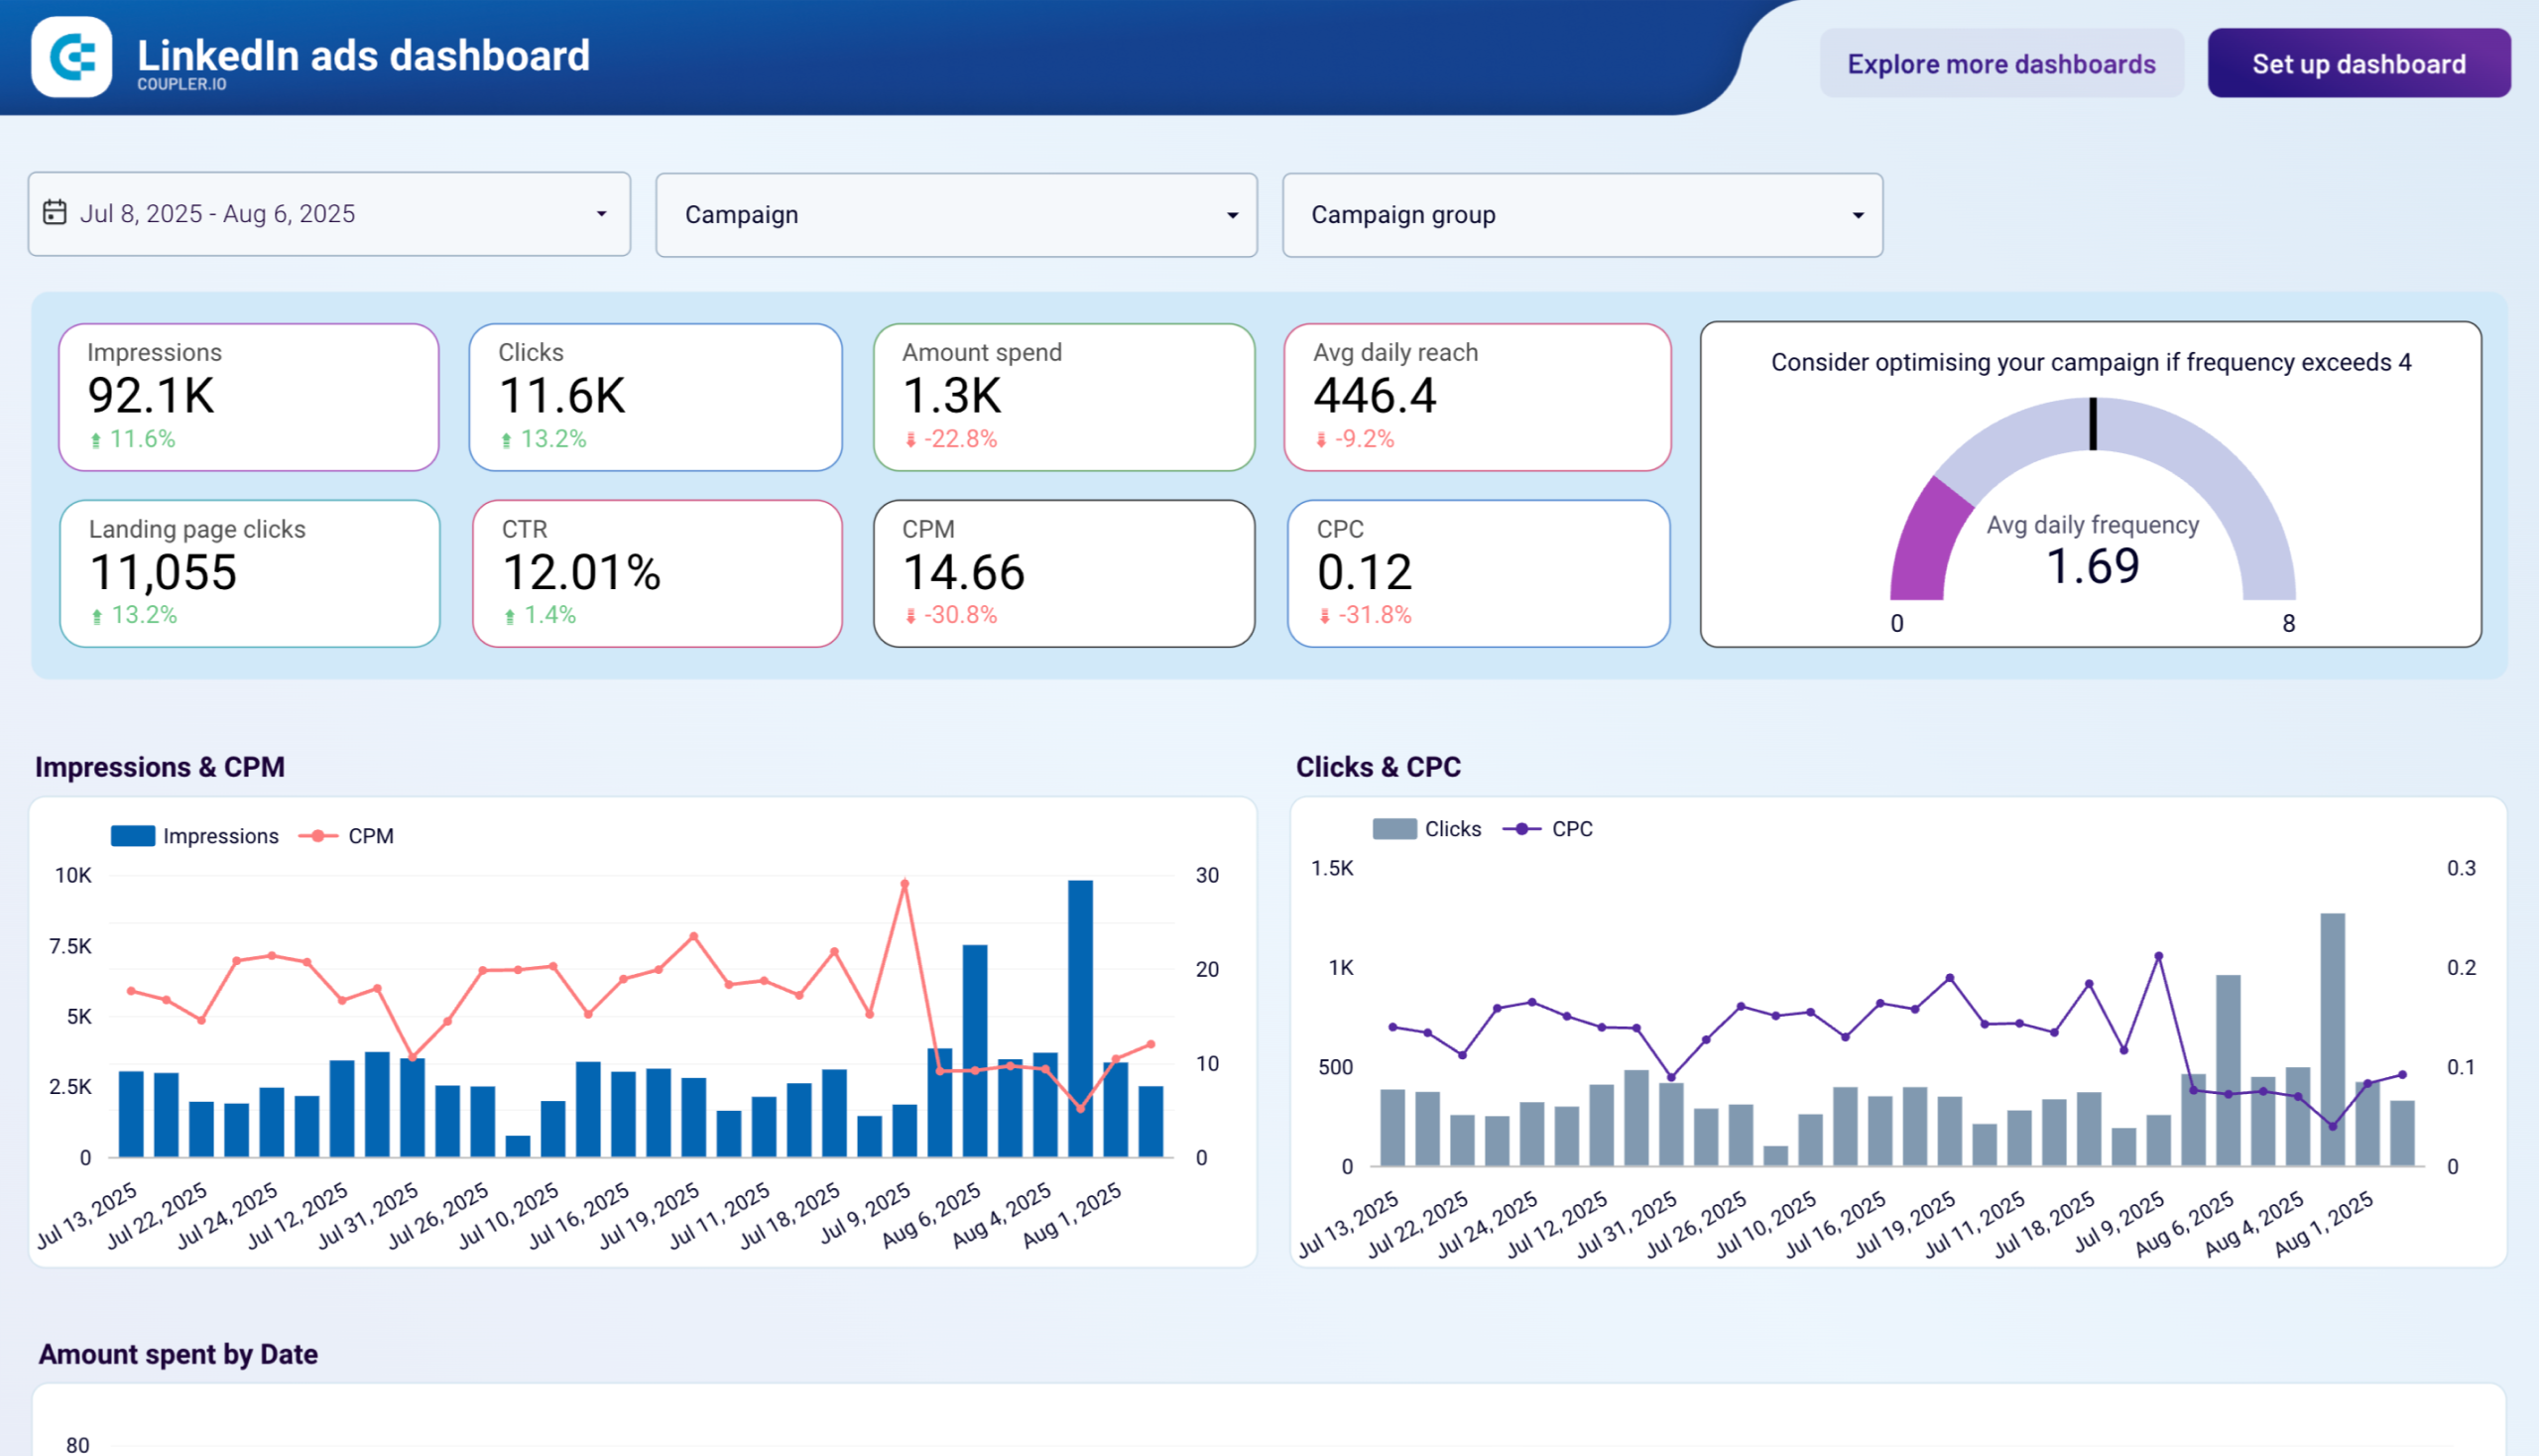
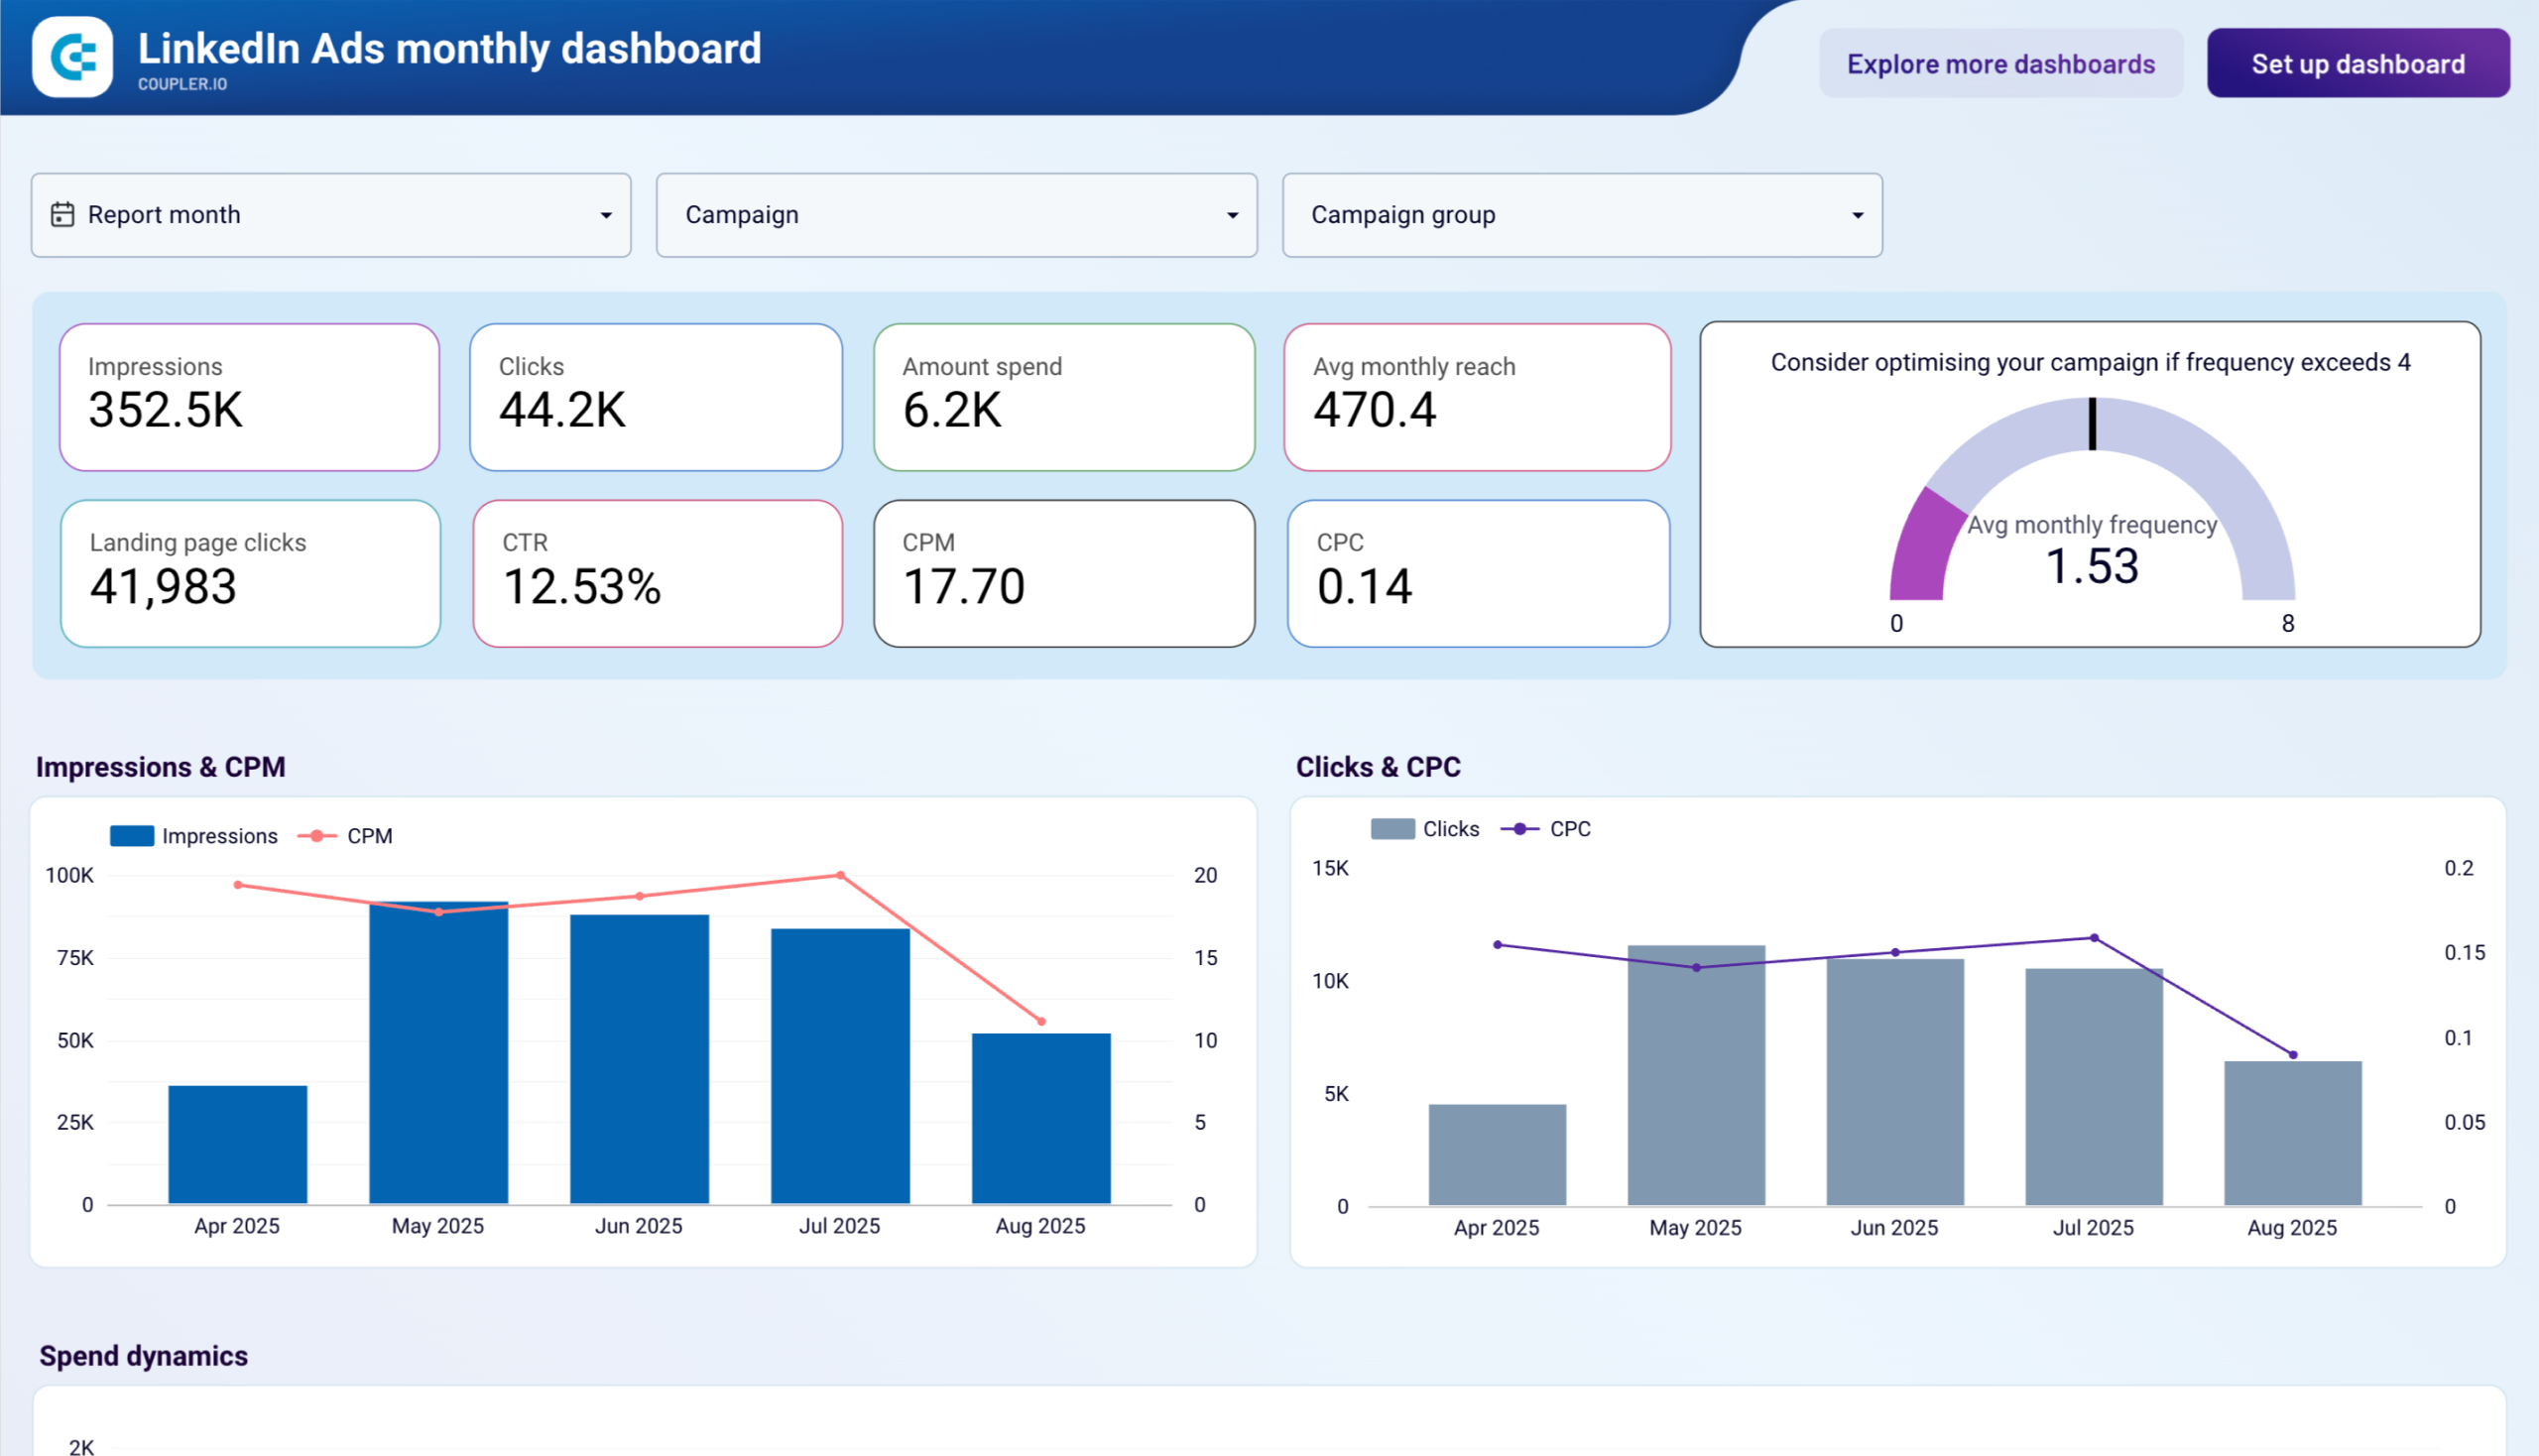
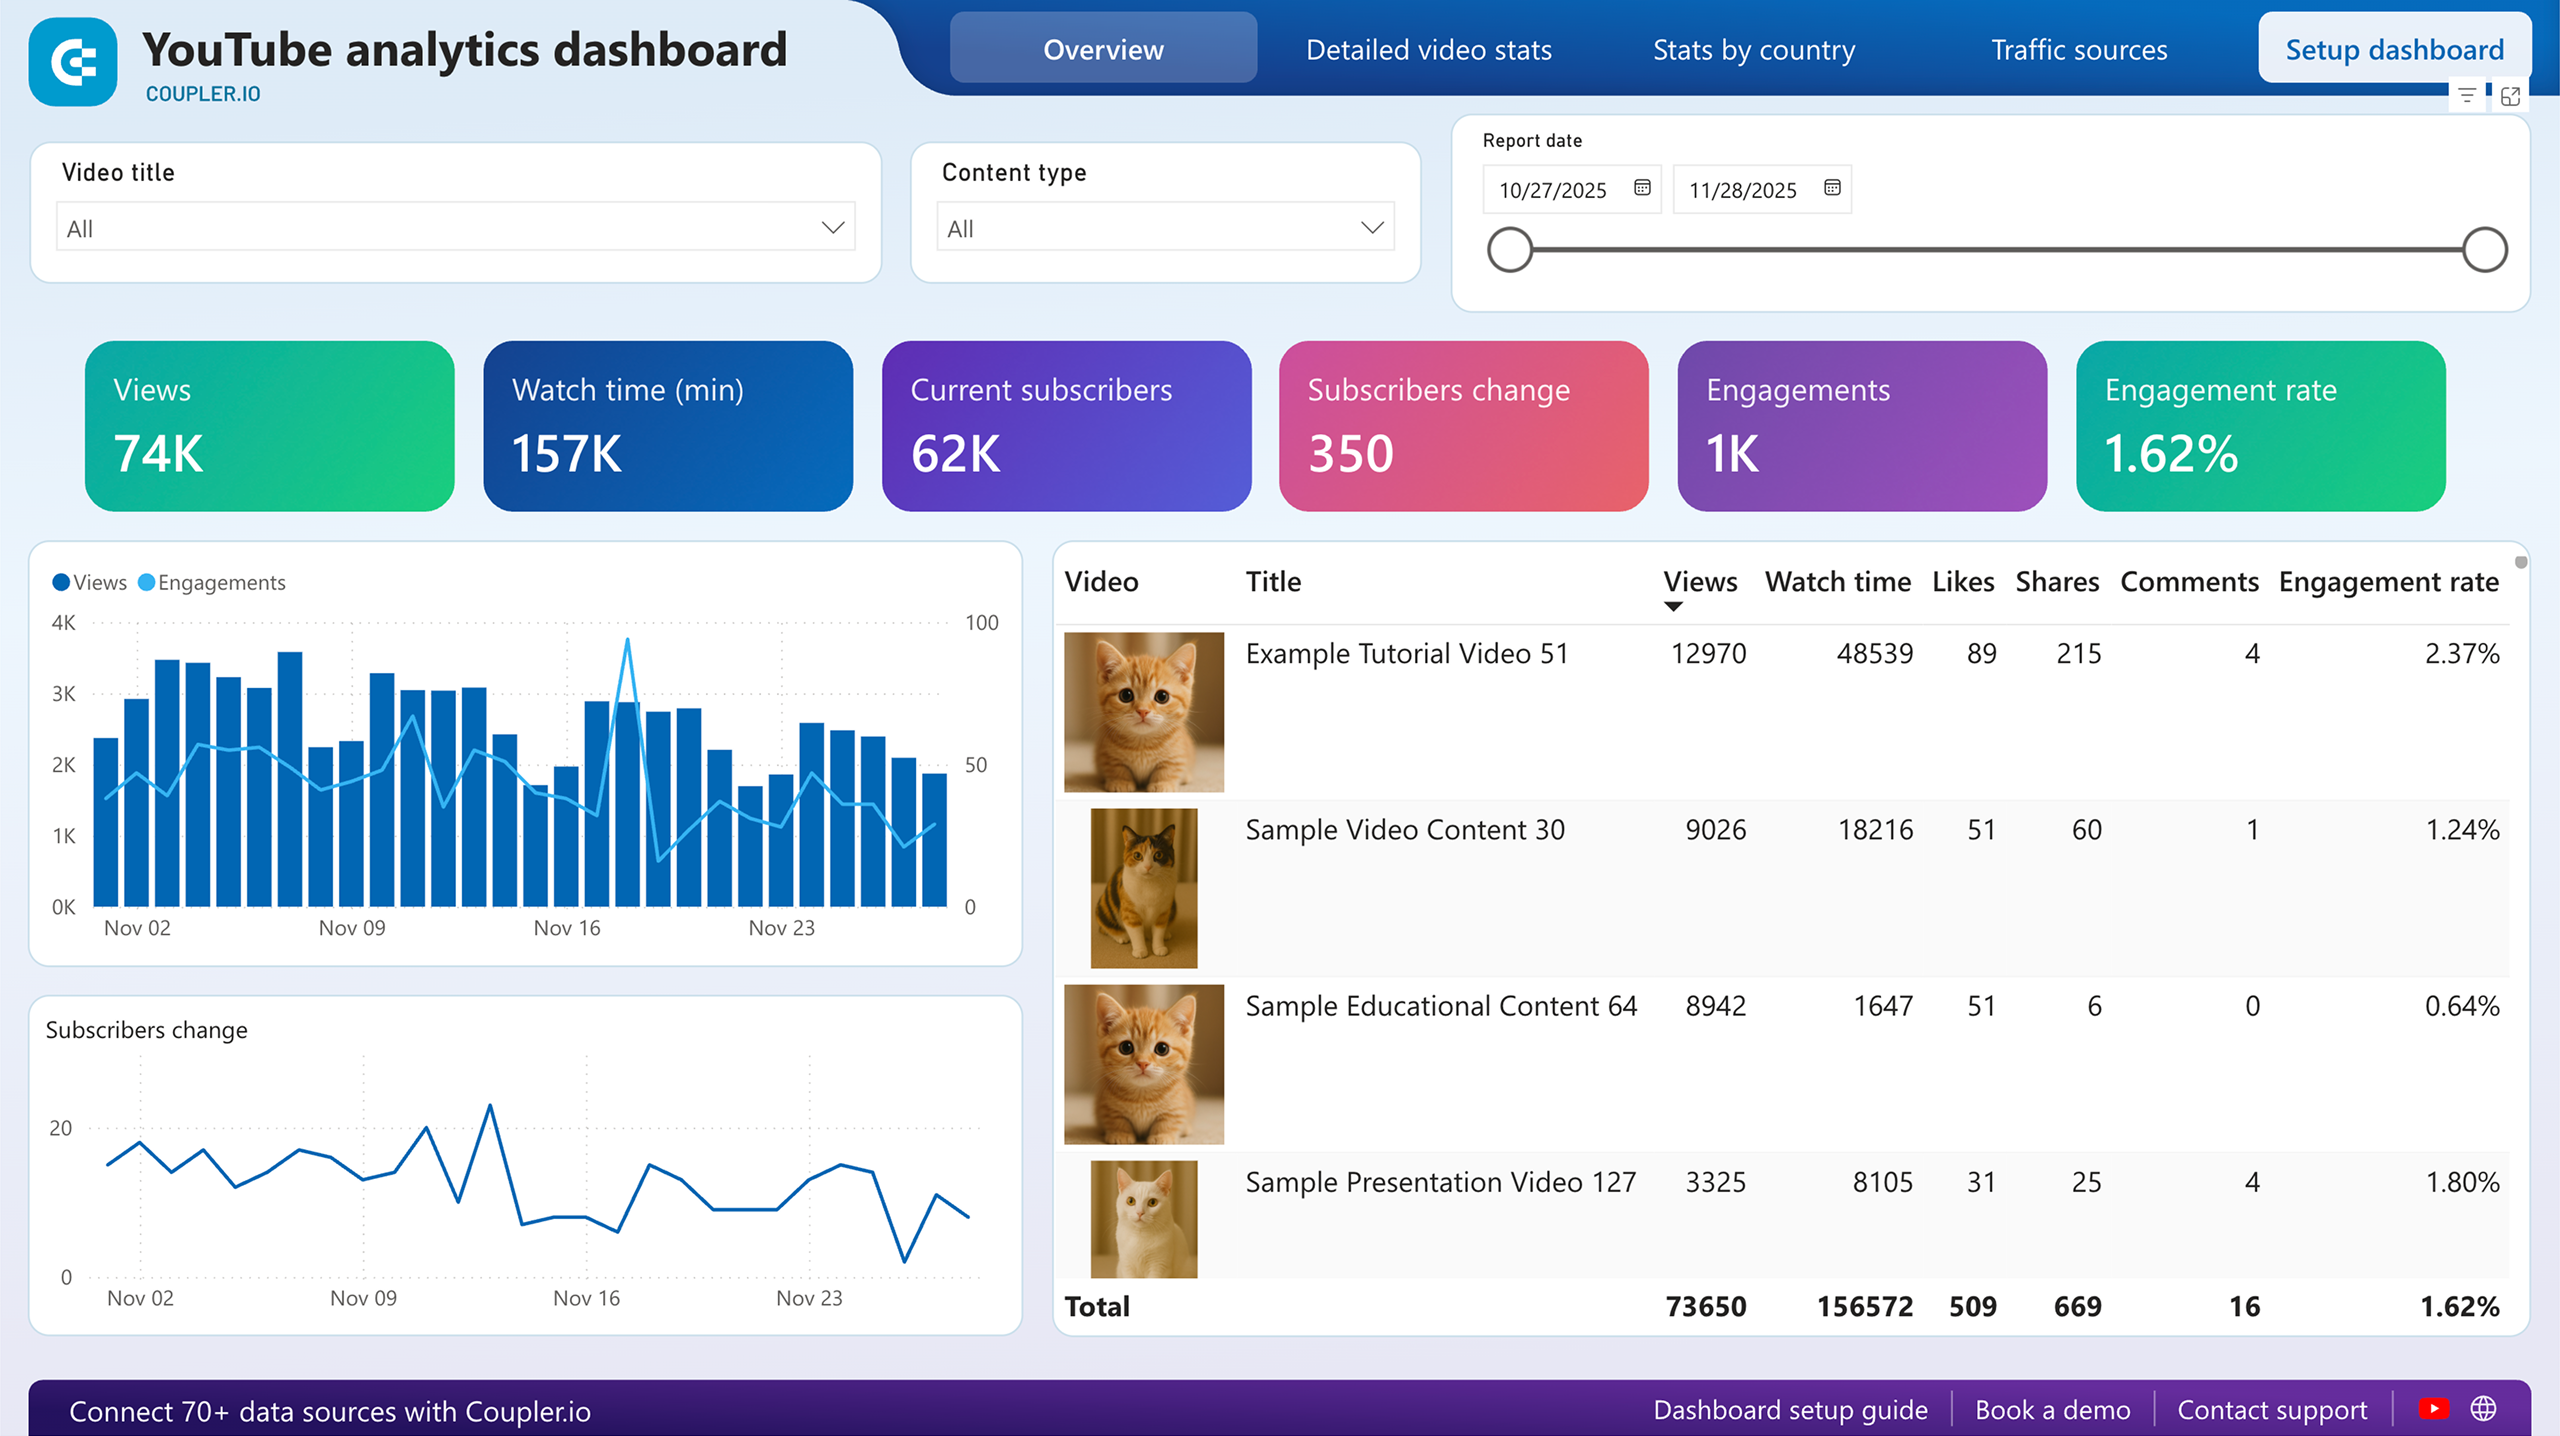
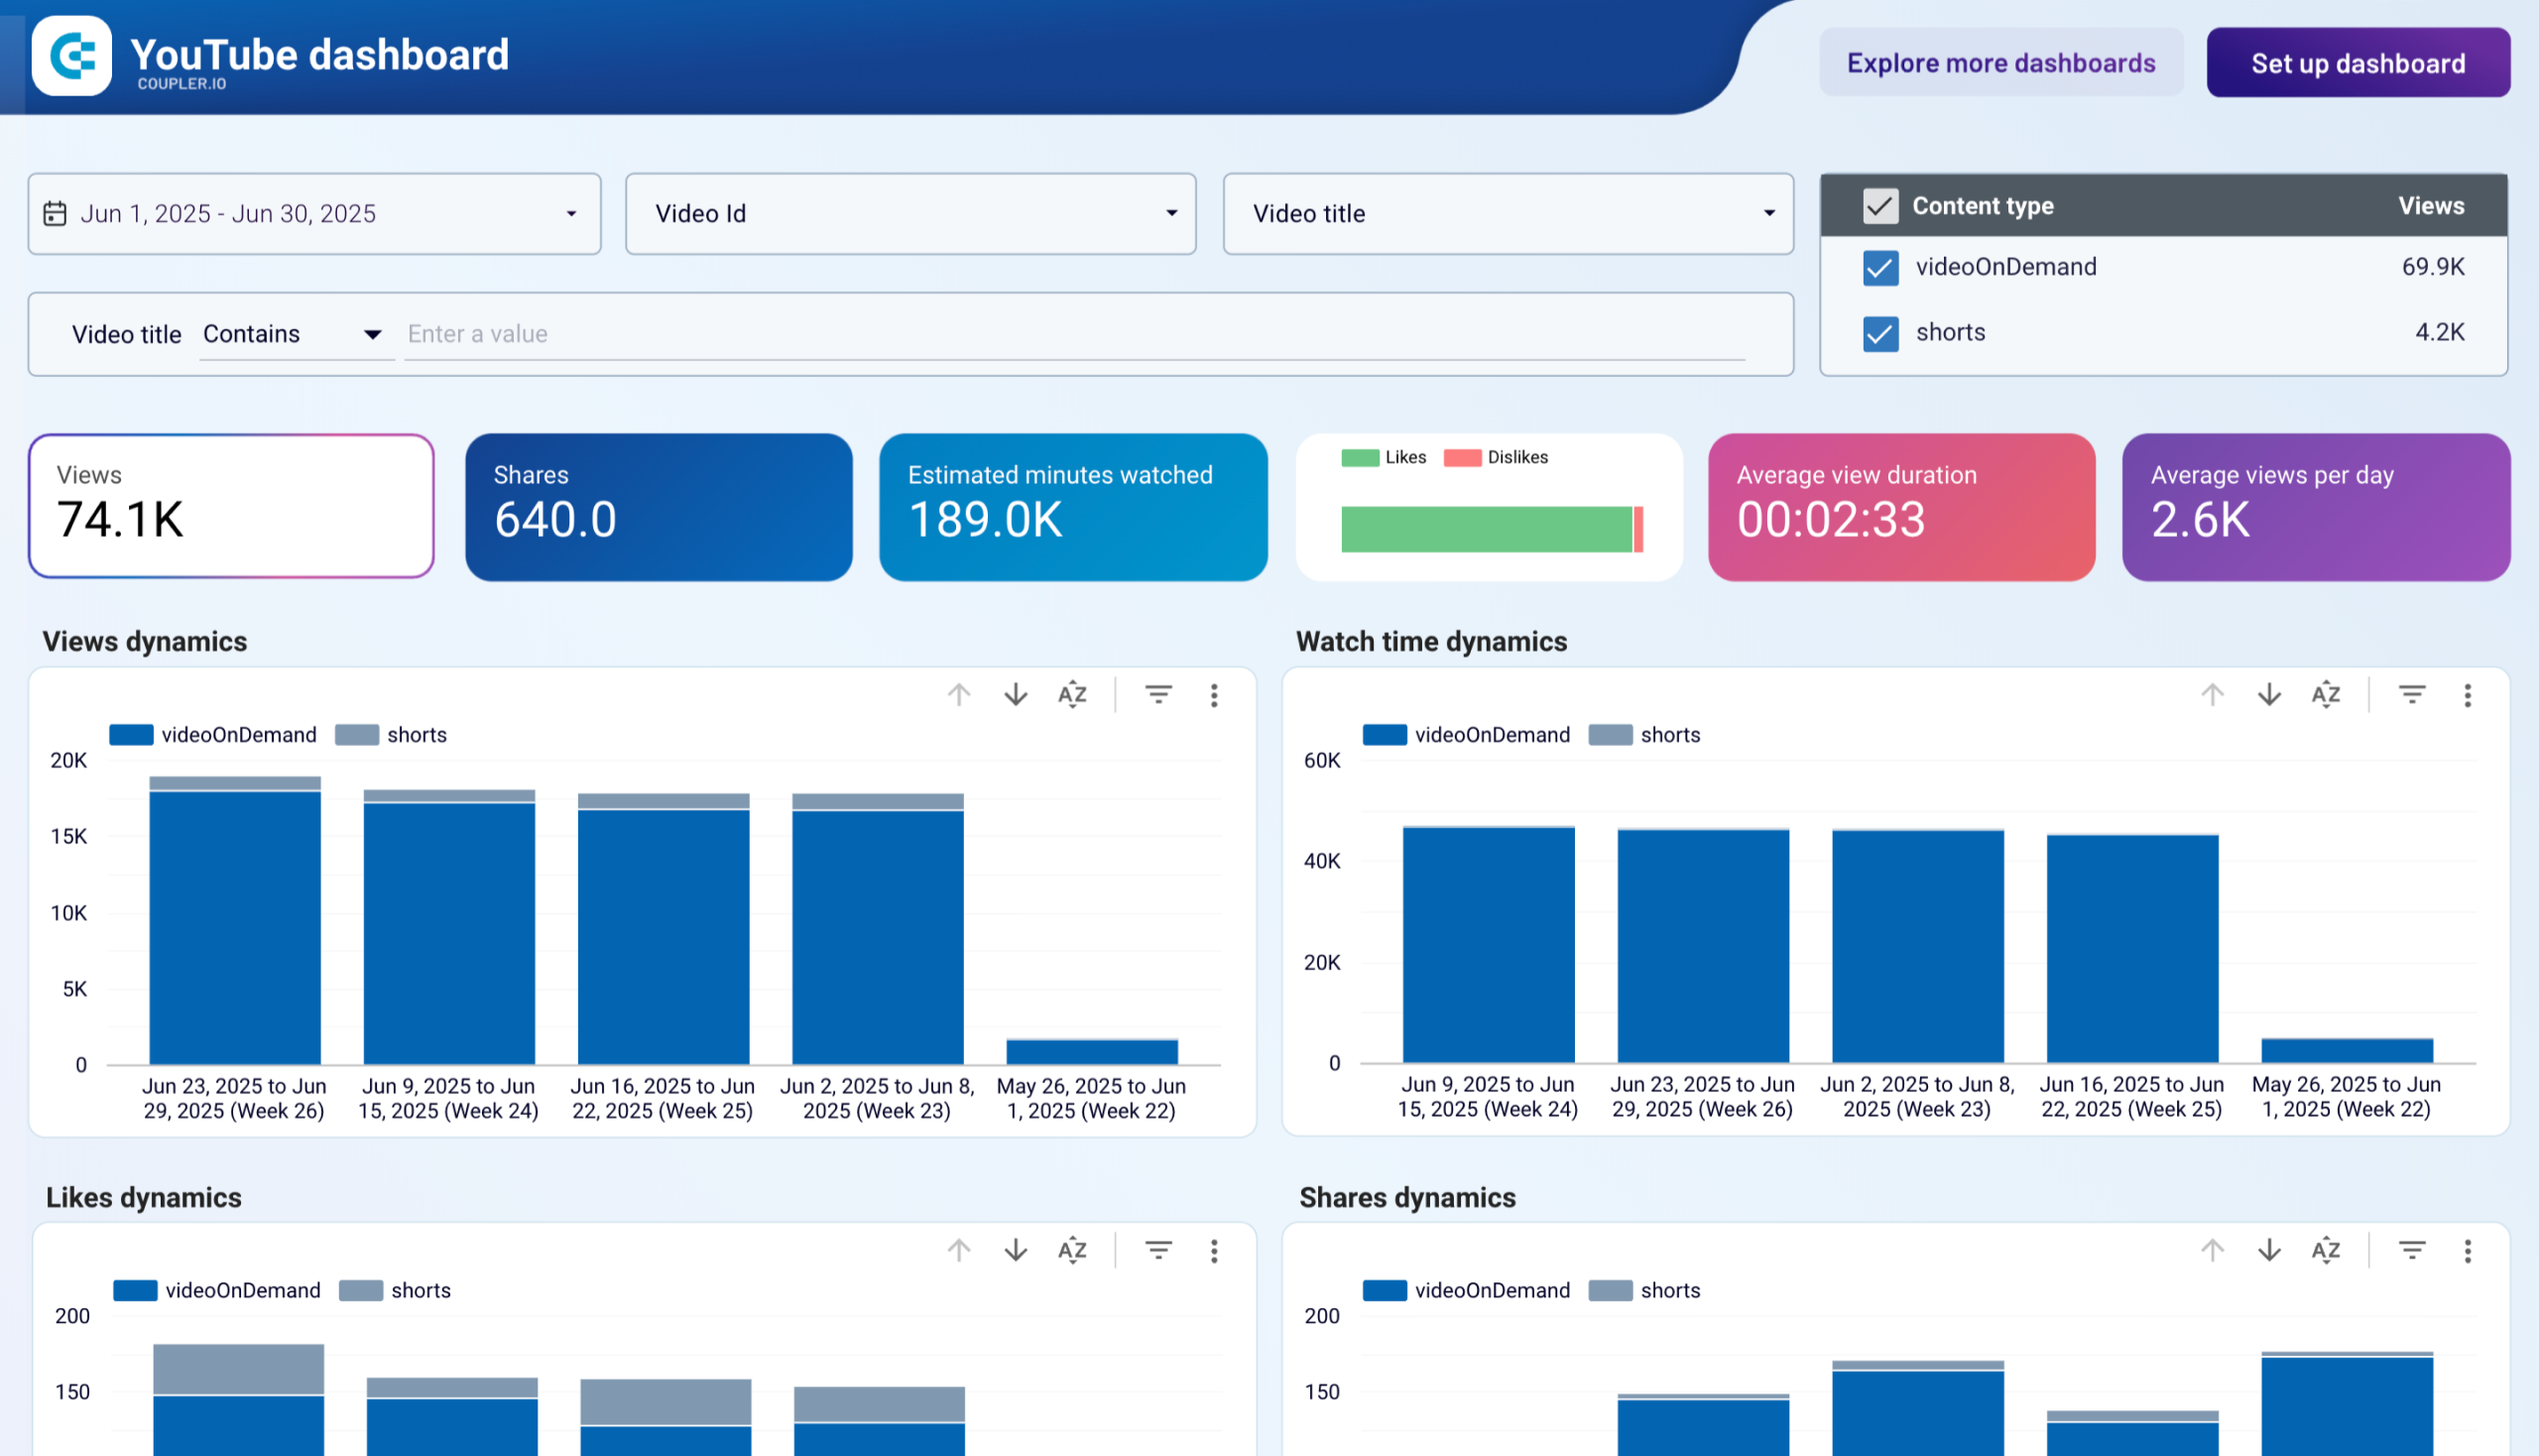
Filter by date: see today’s numbers or examine annual trends

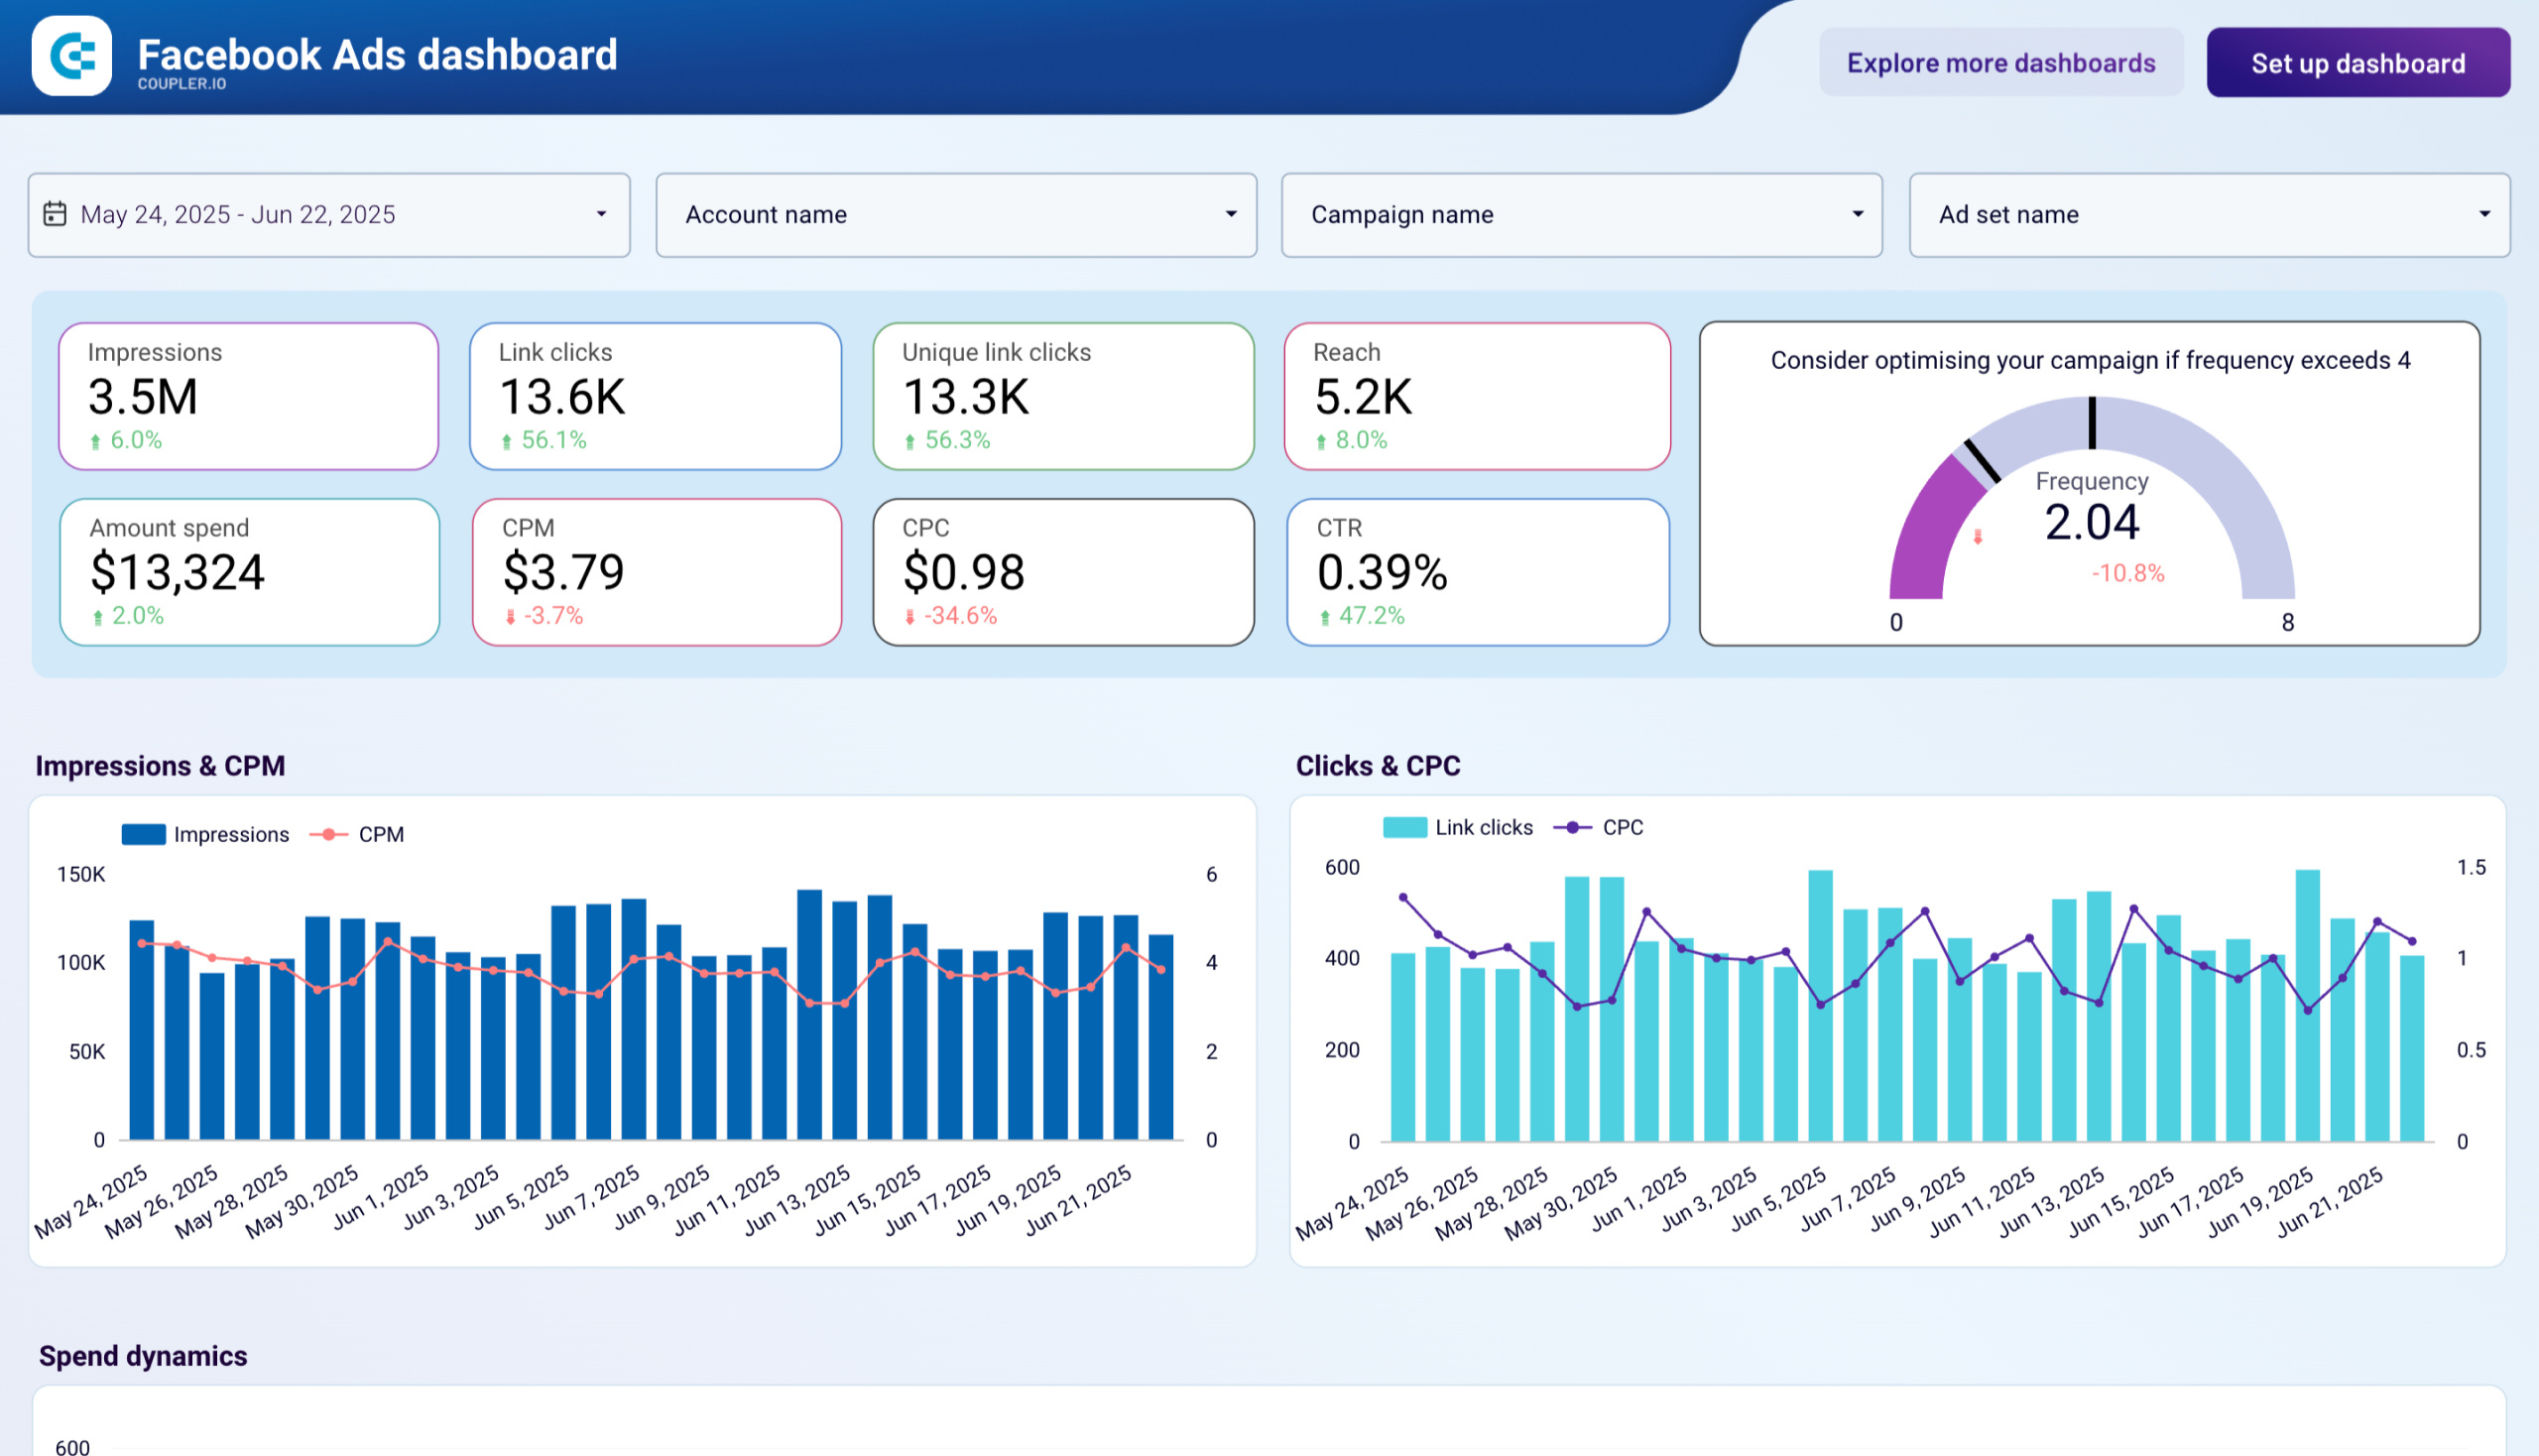
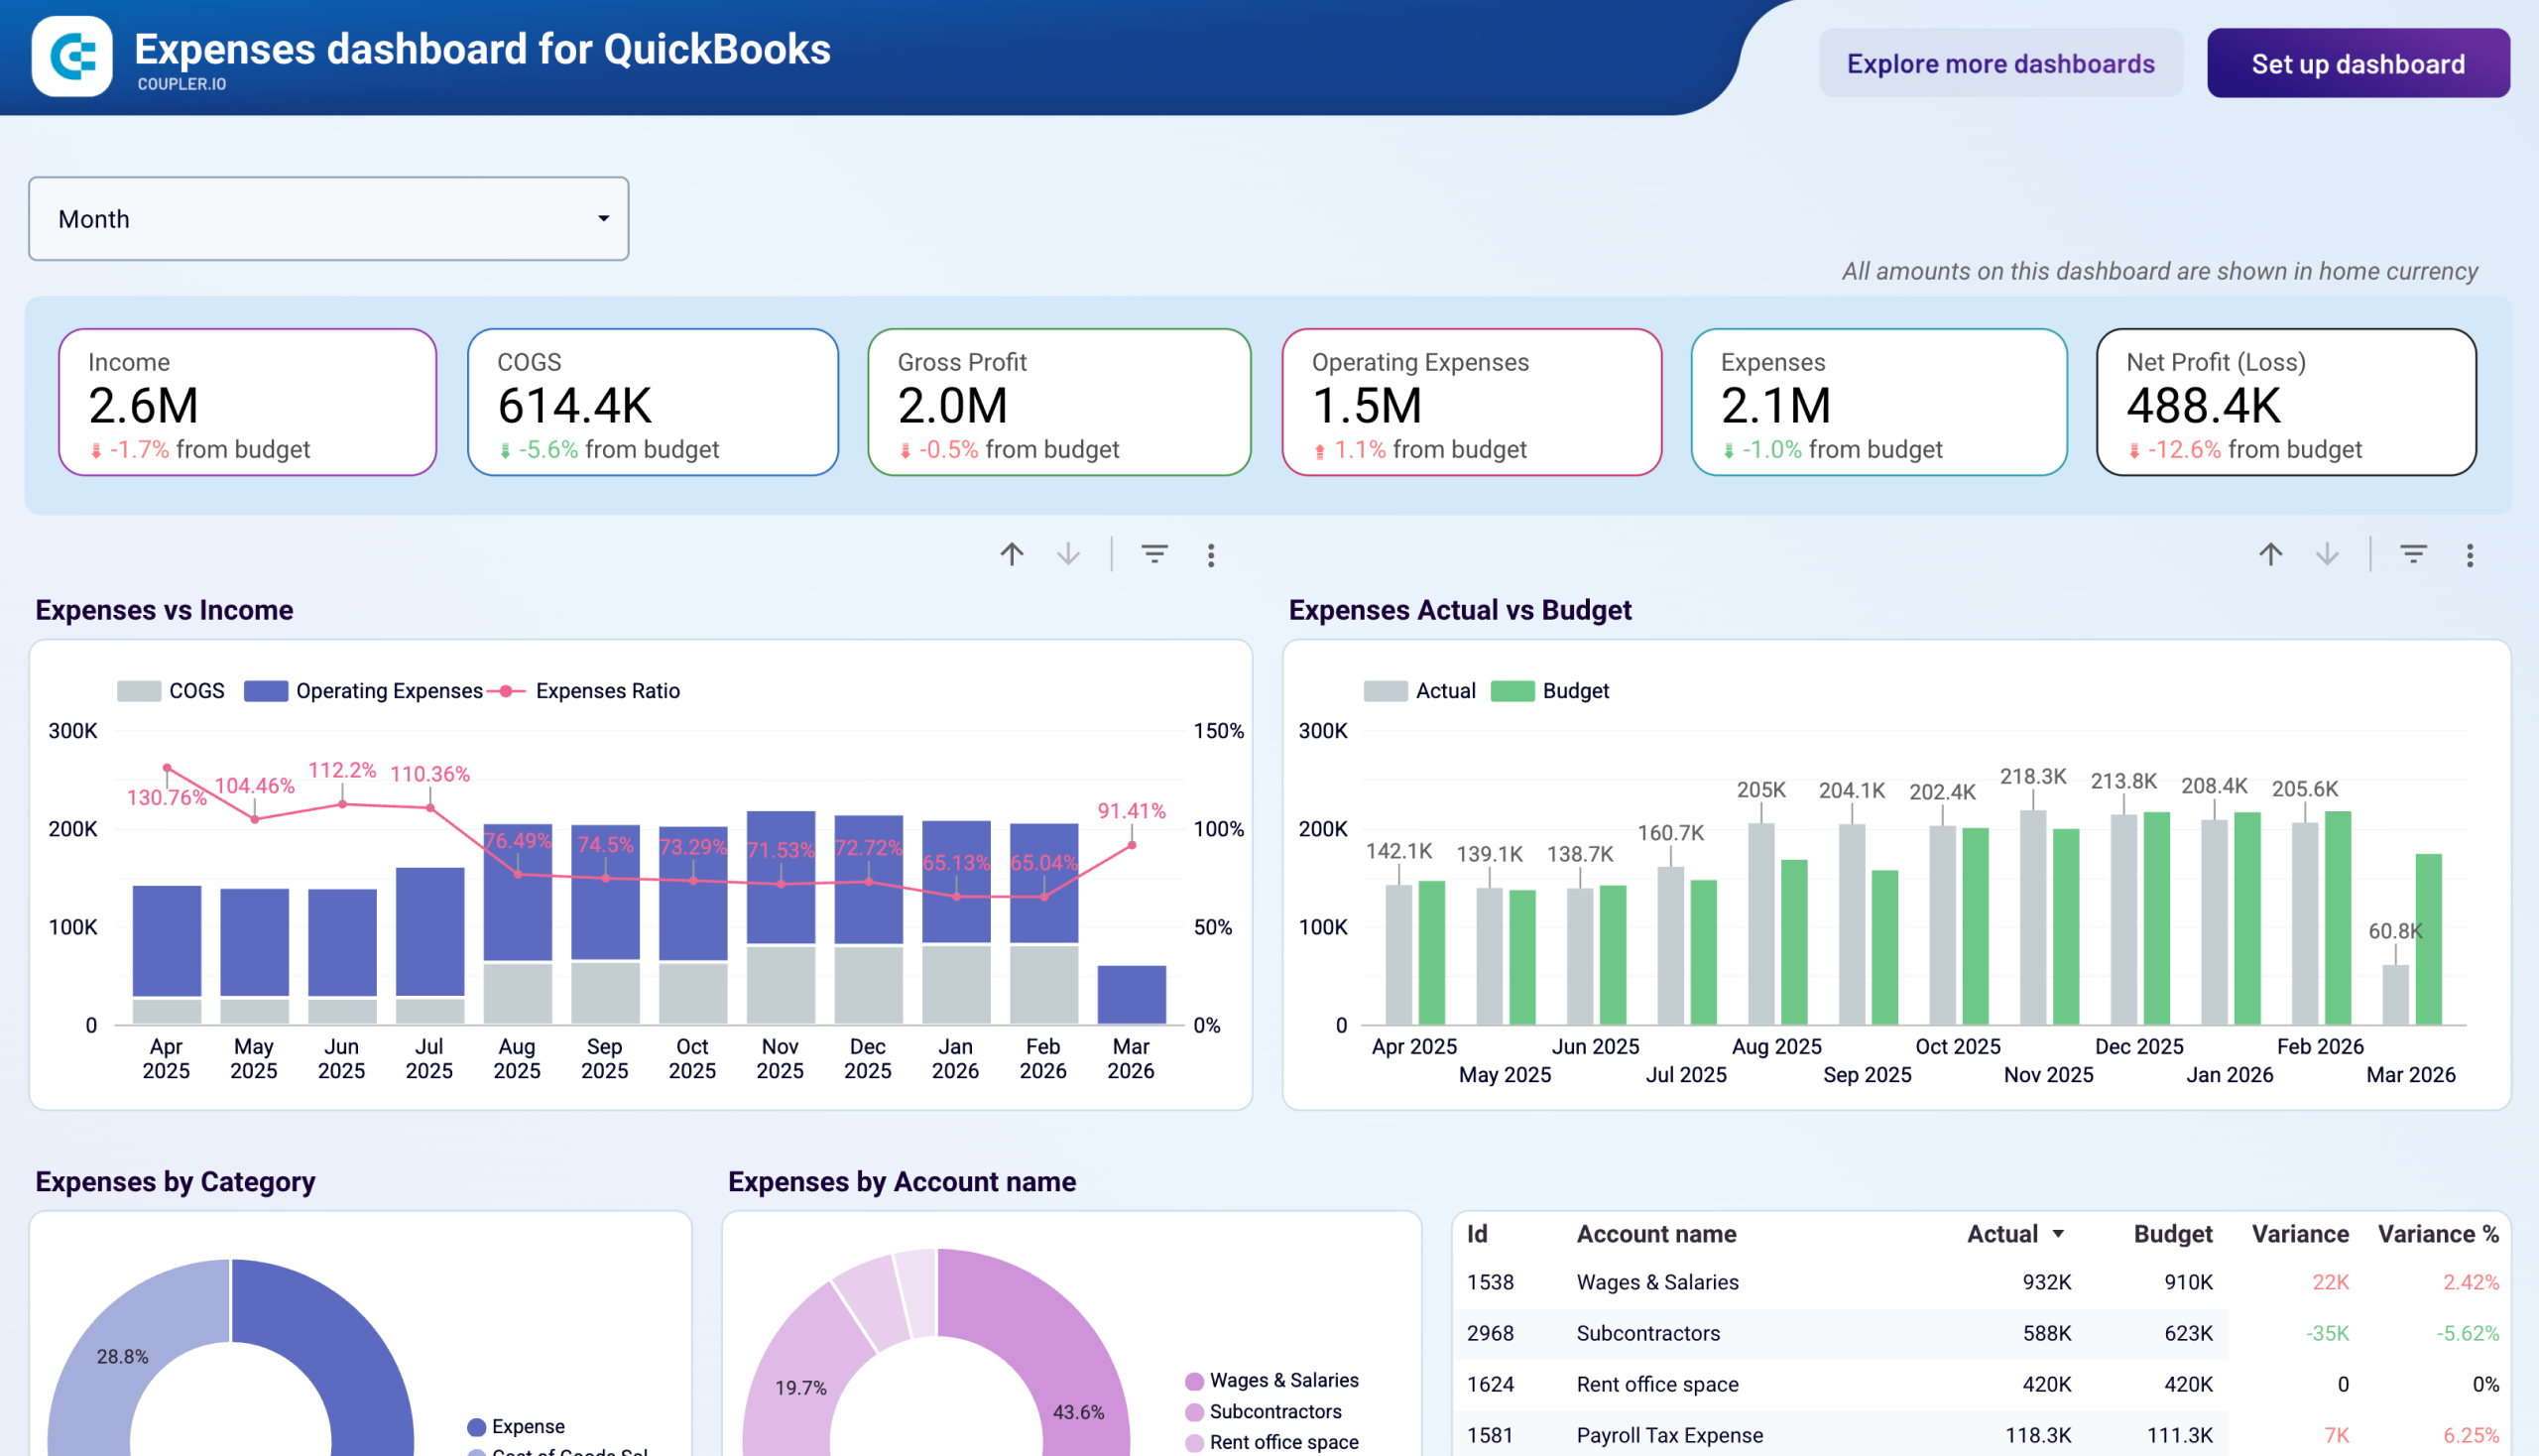
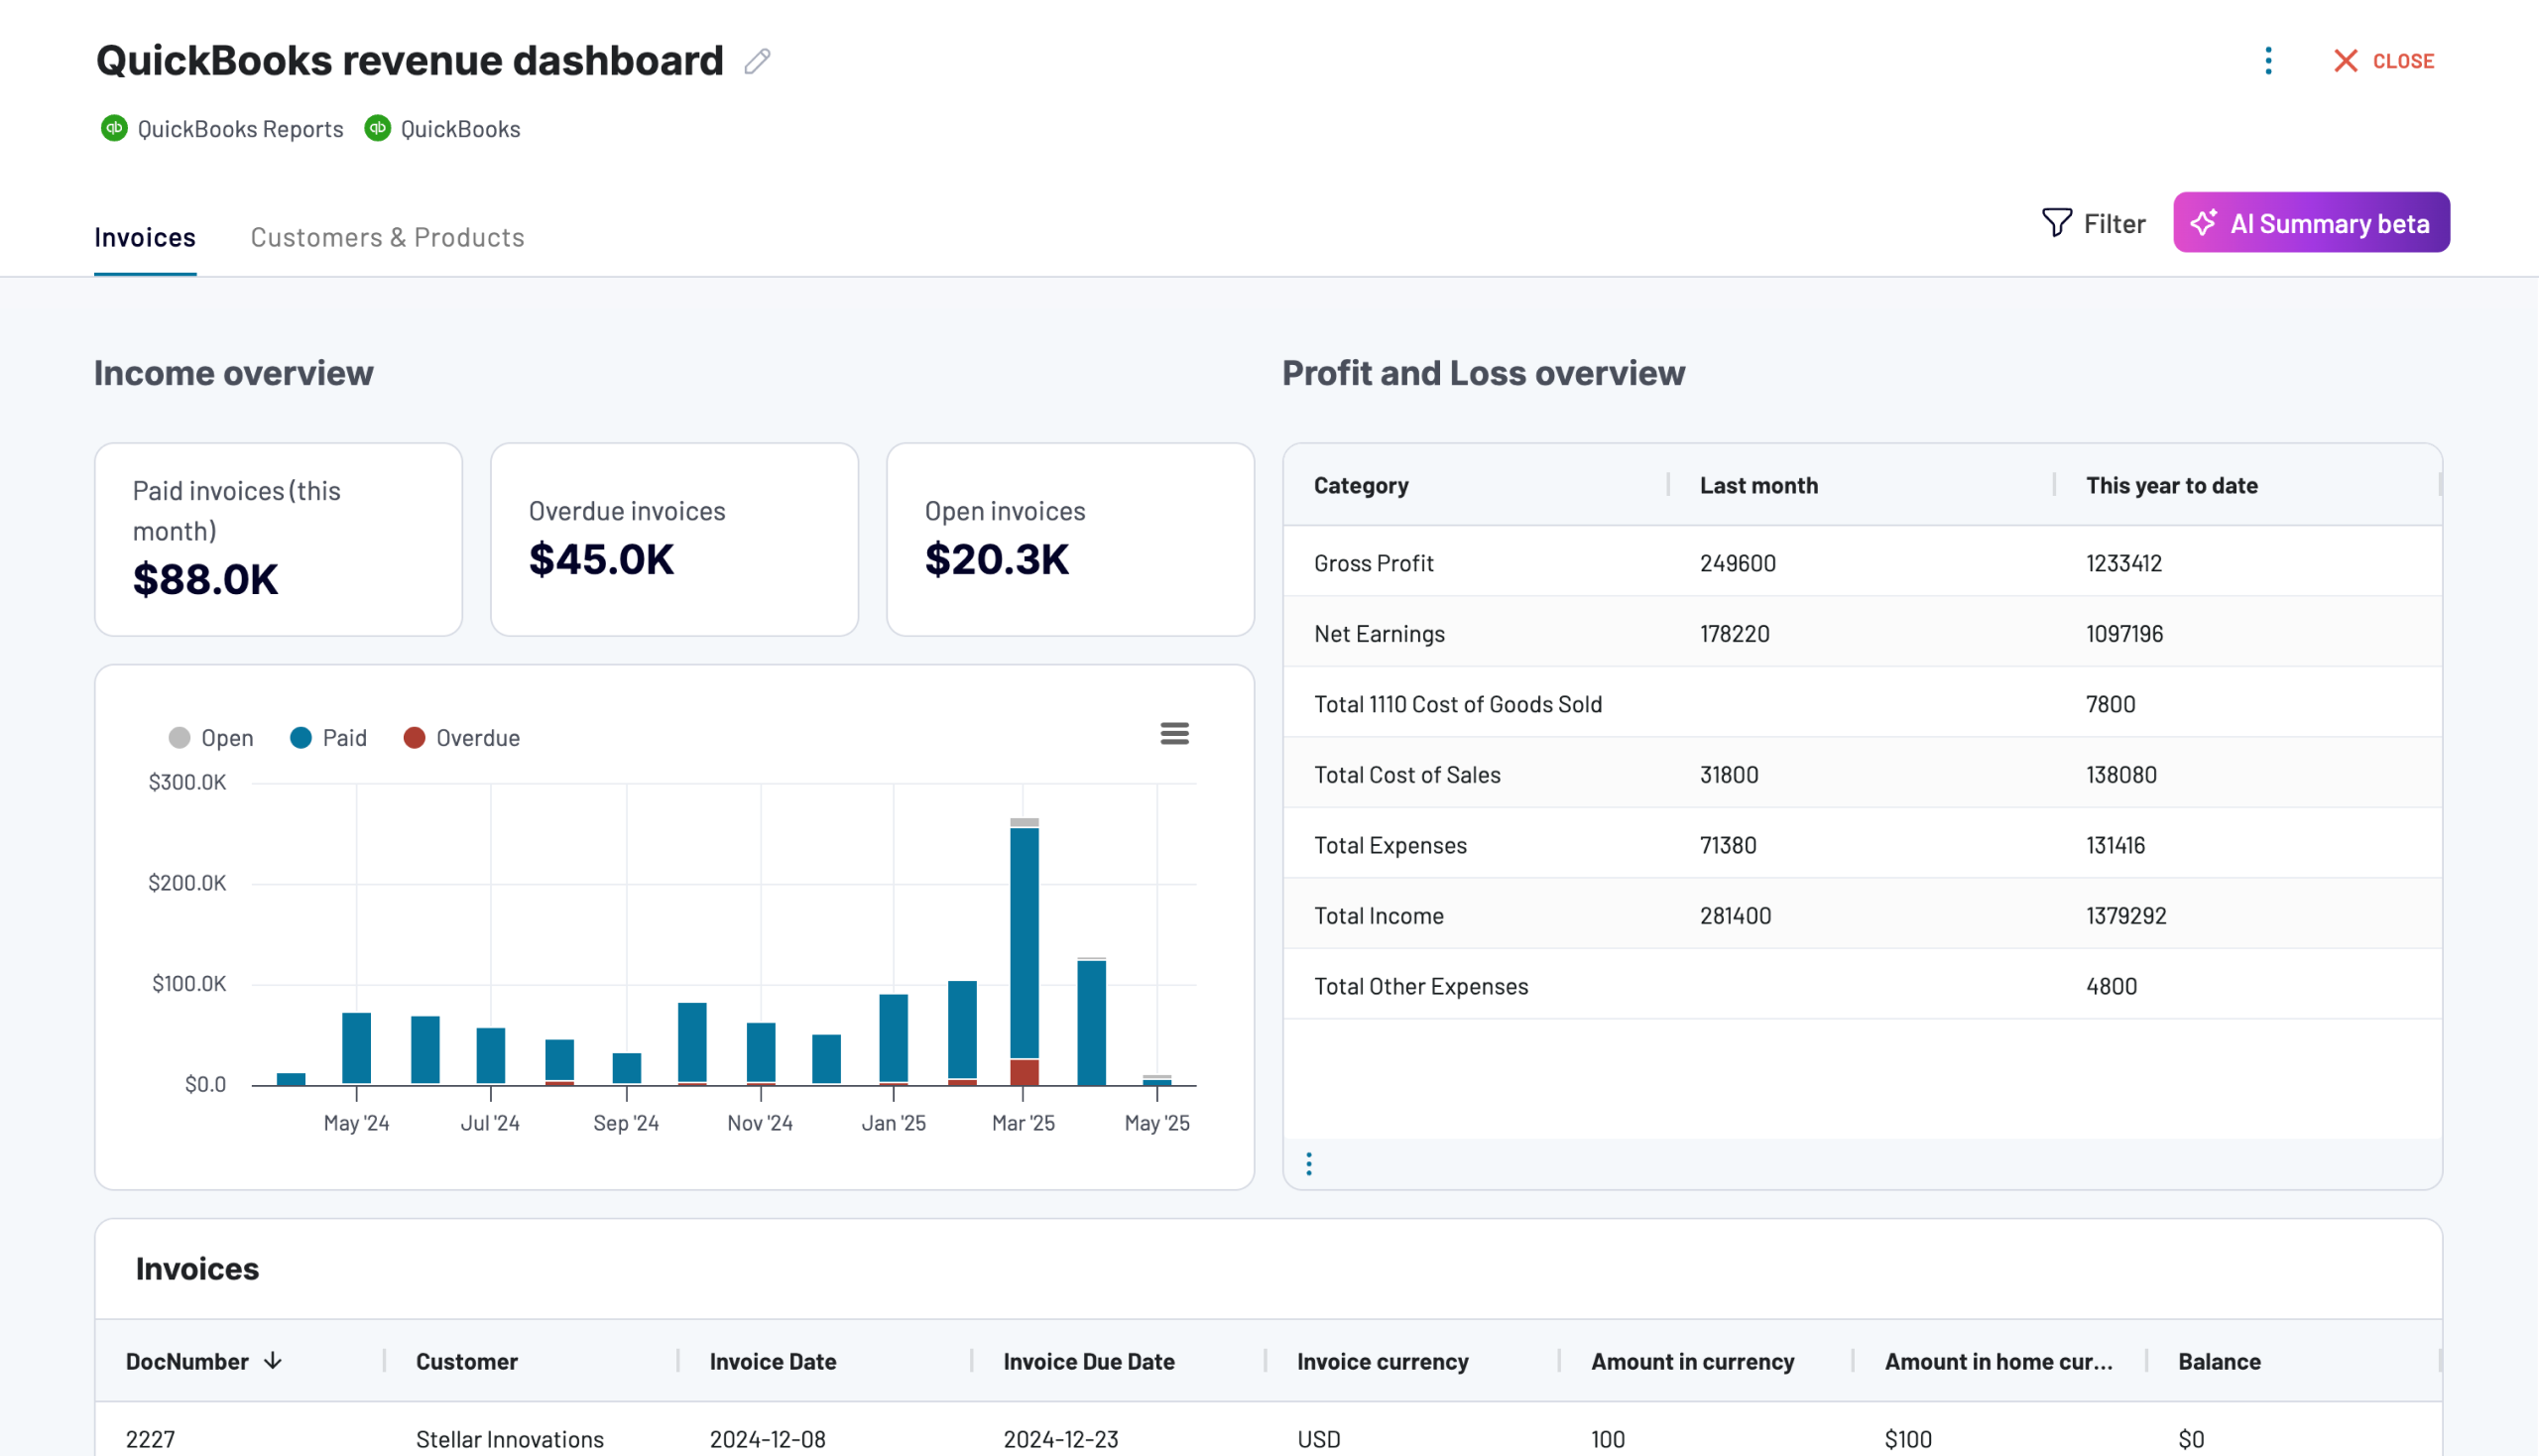
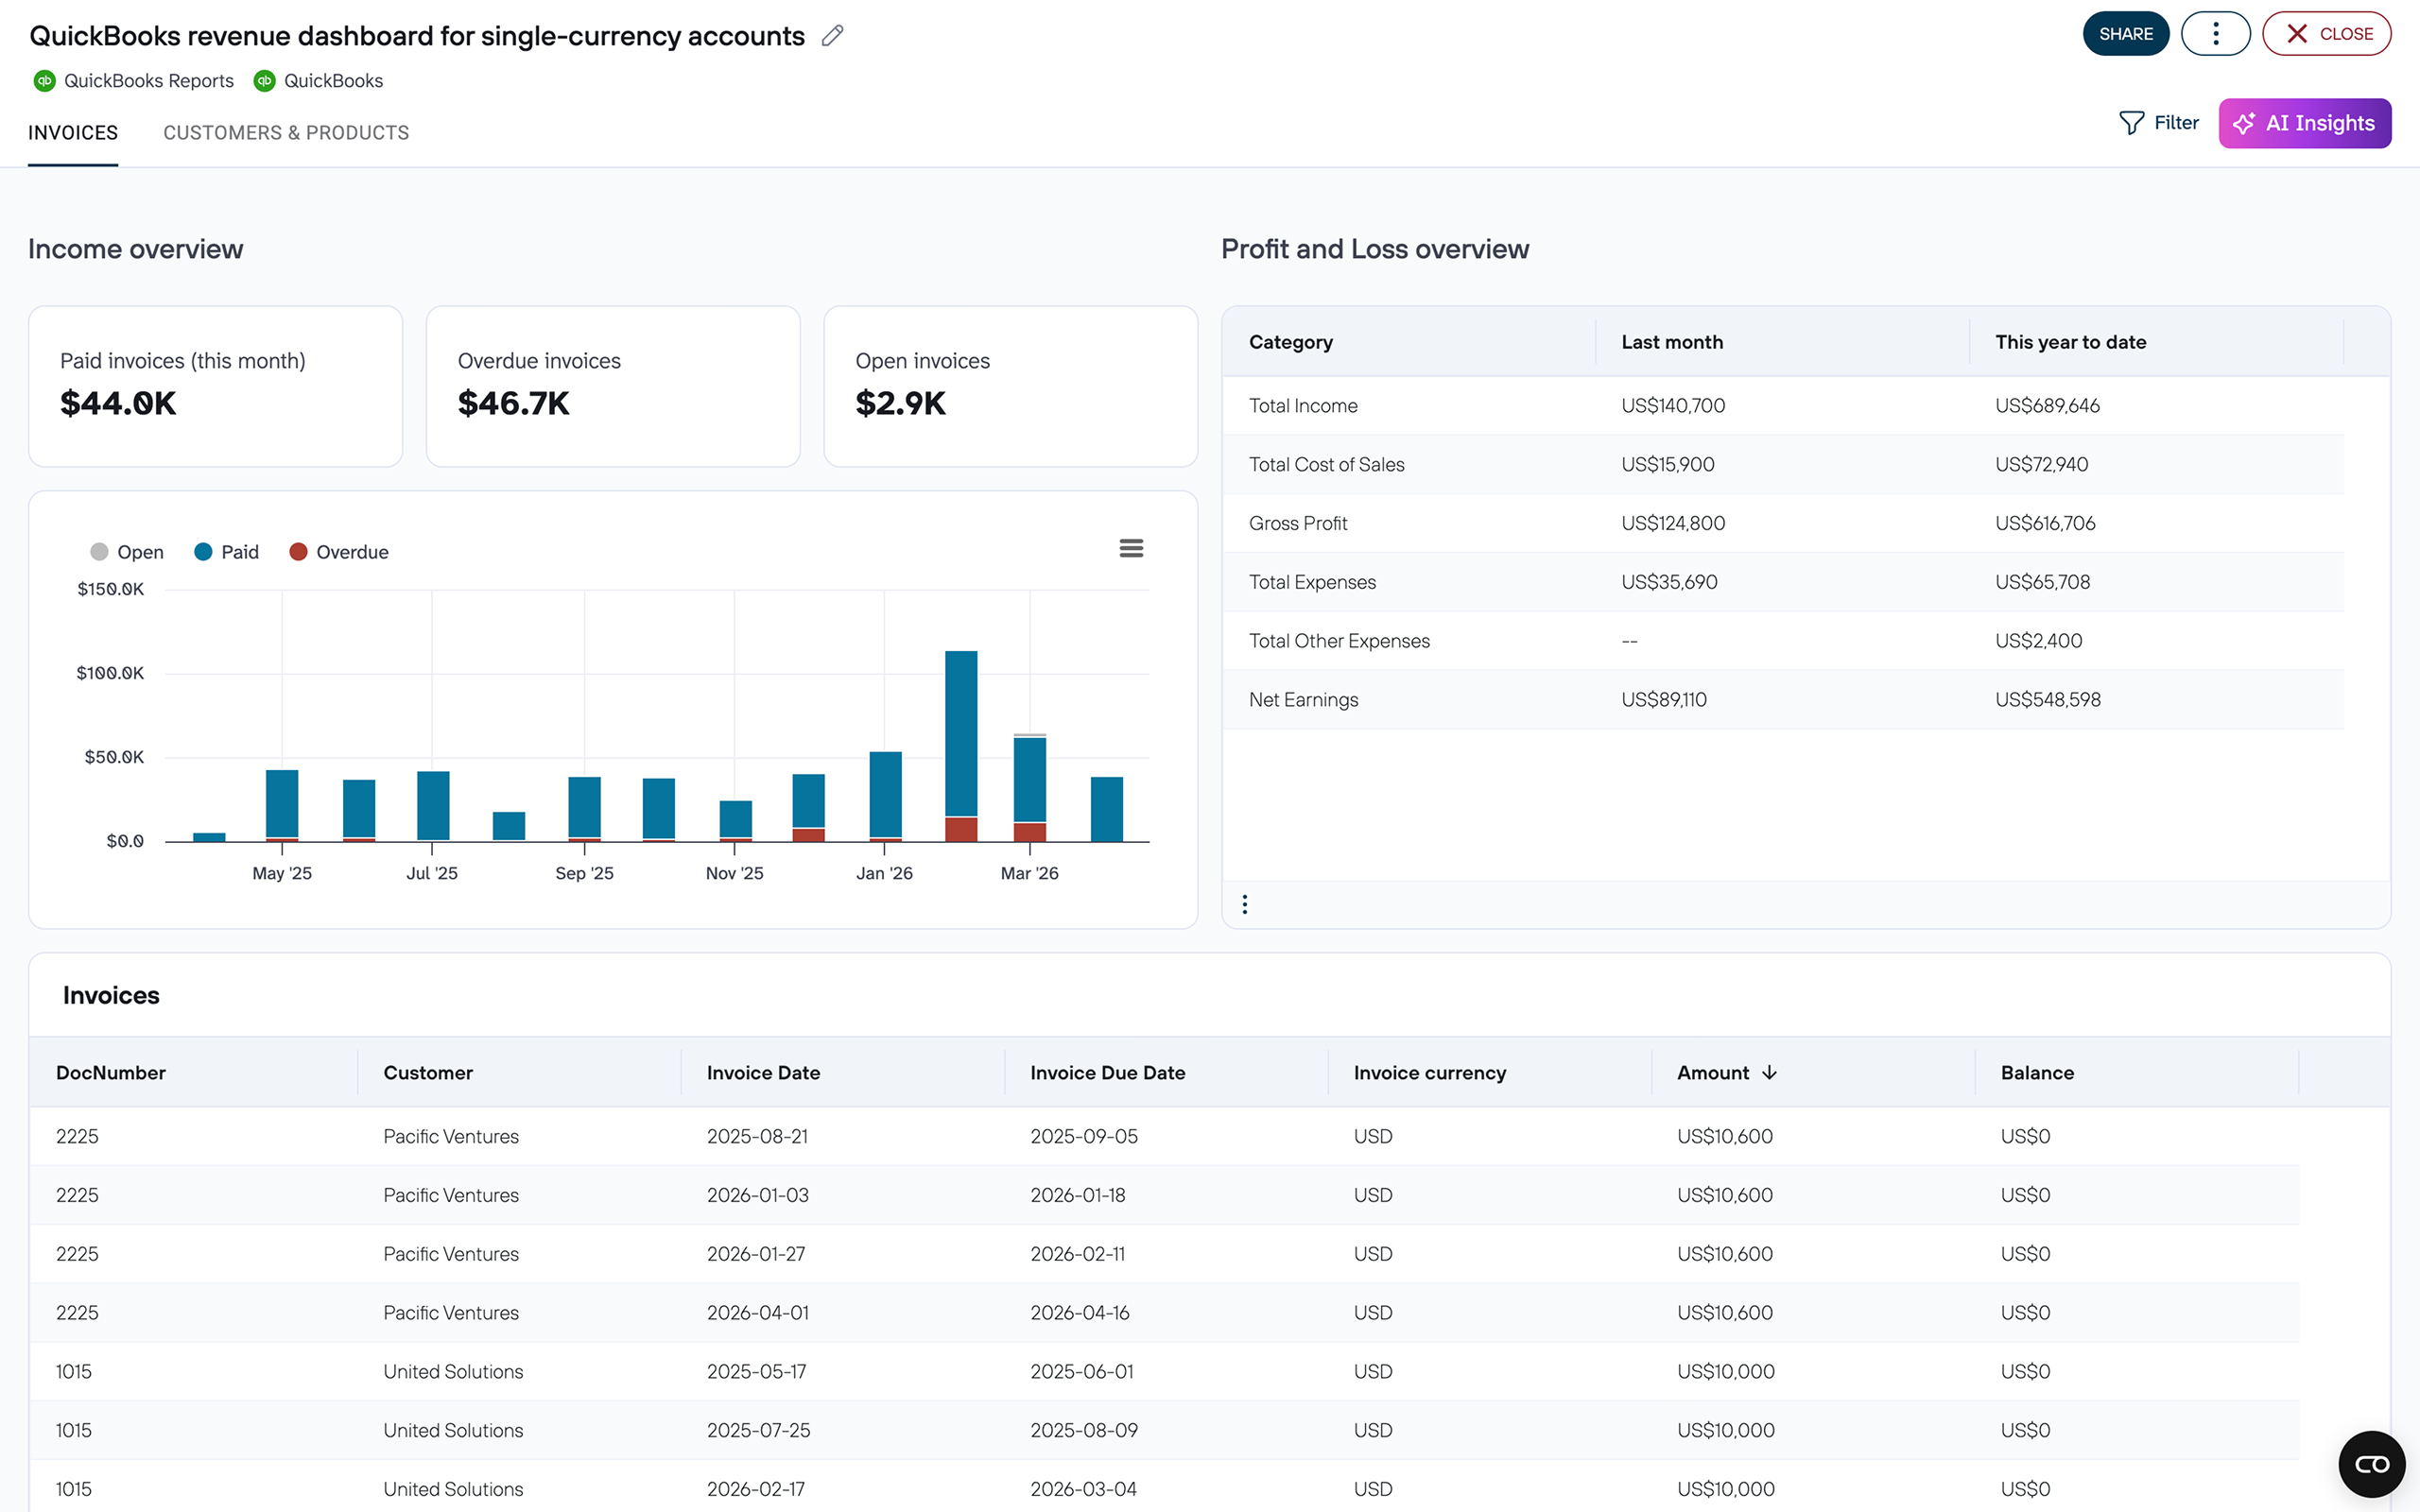
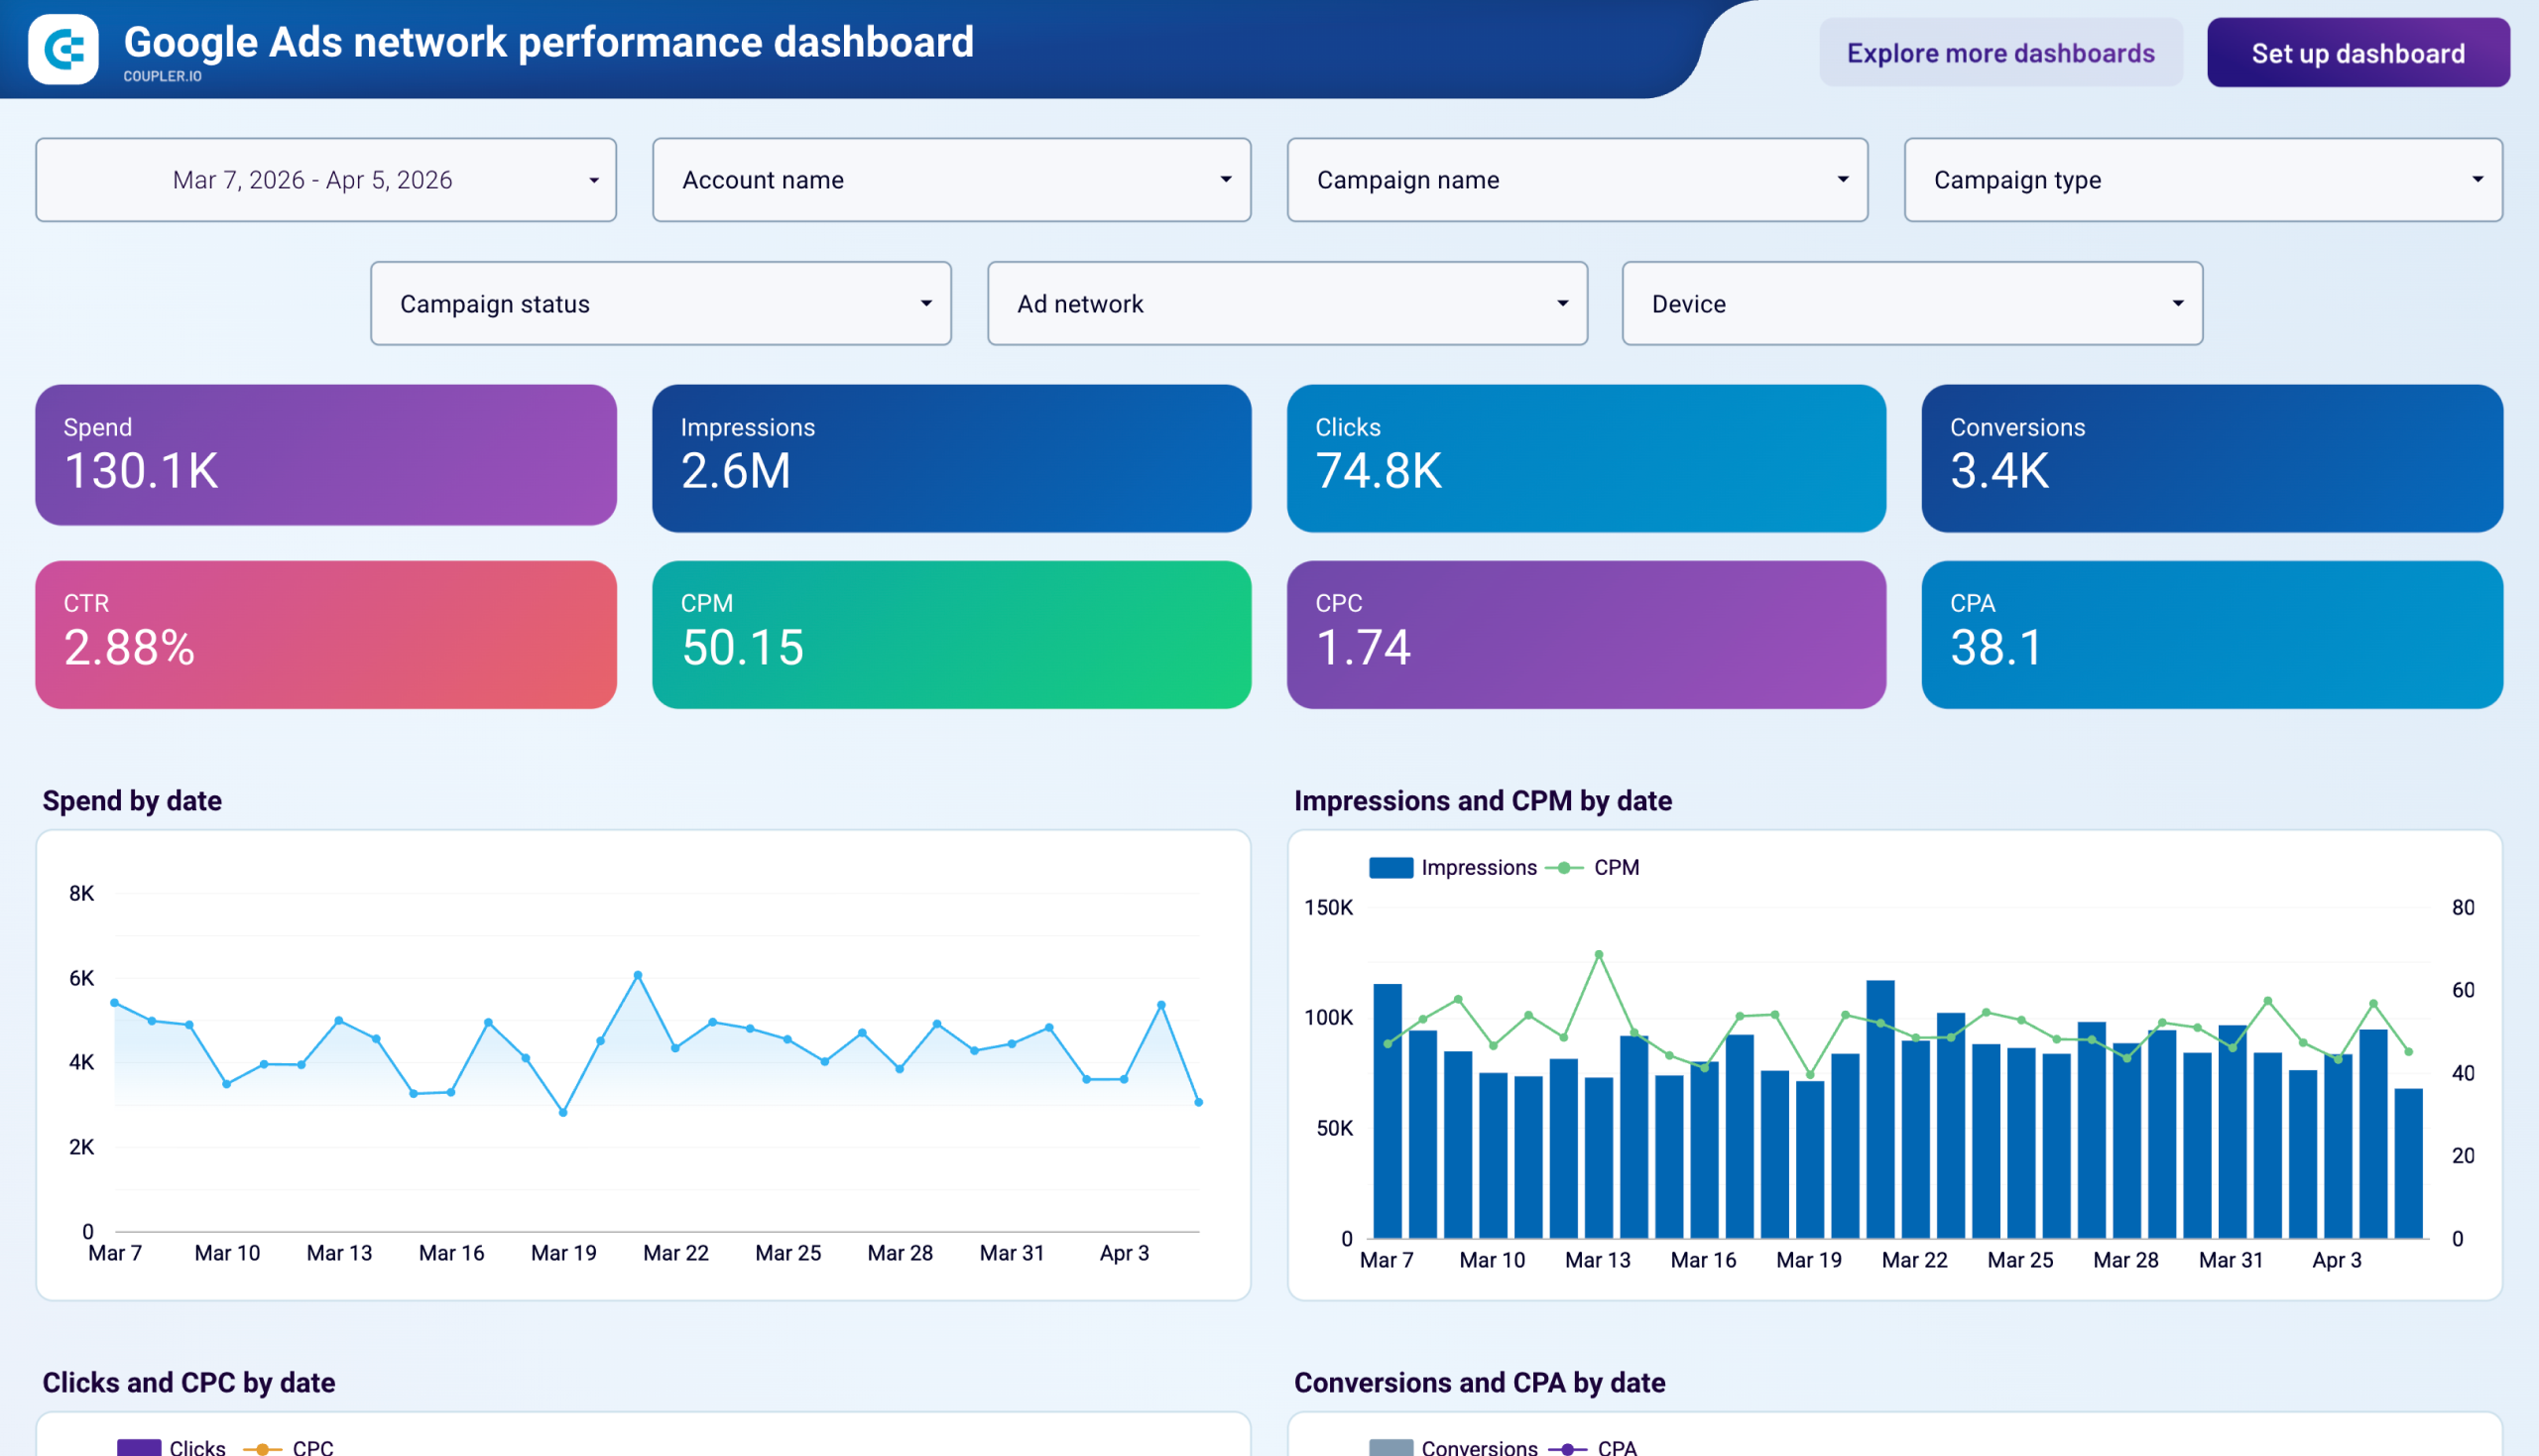
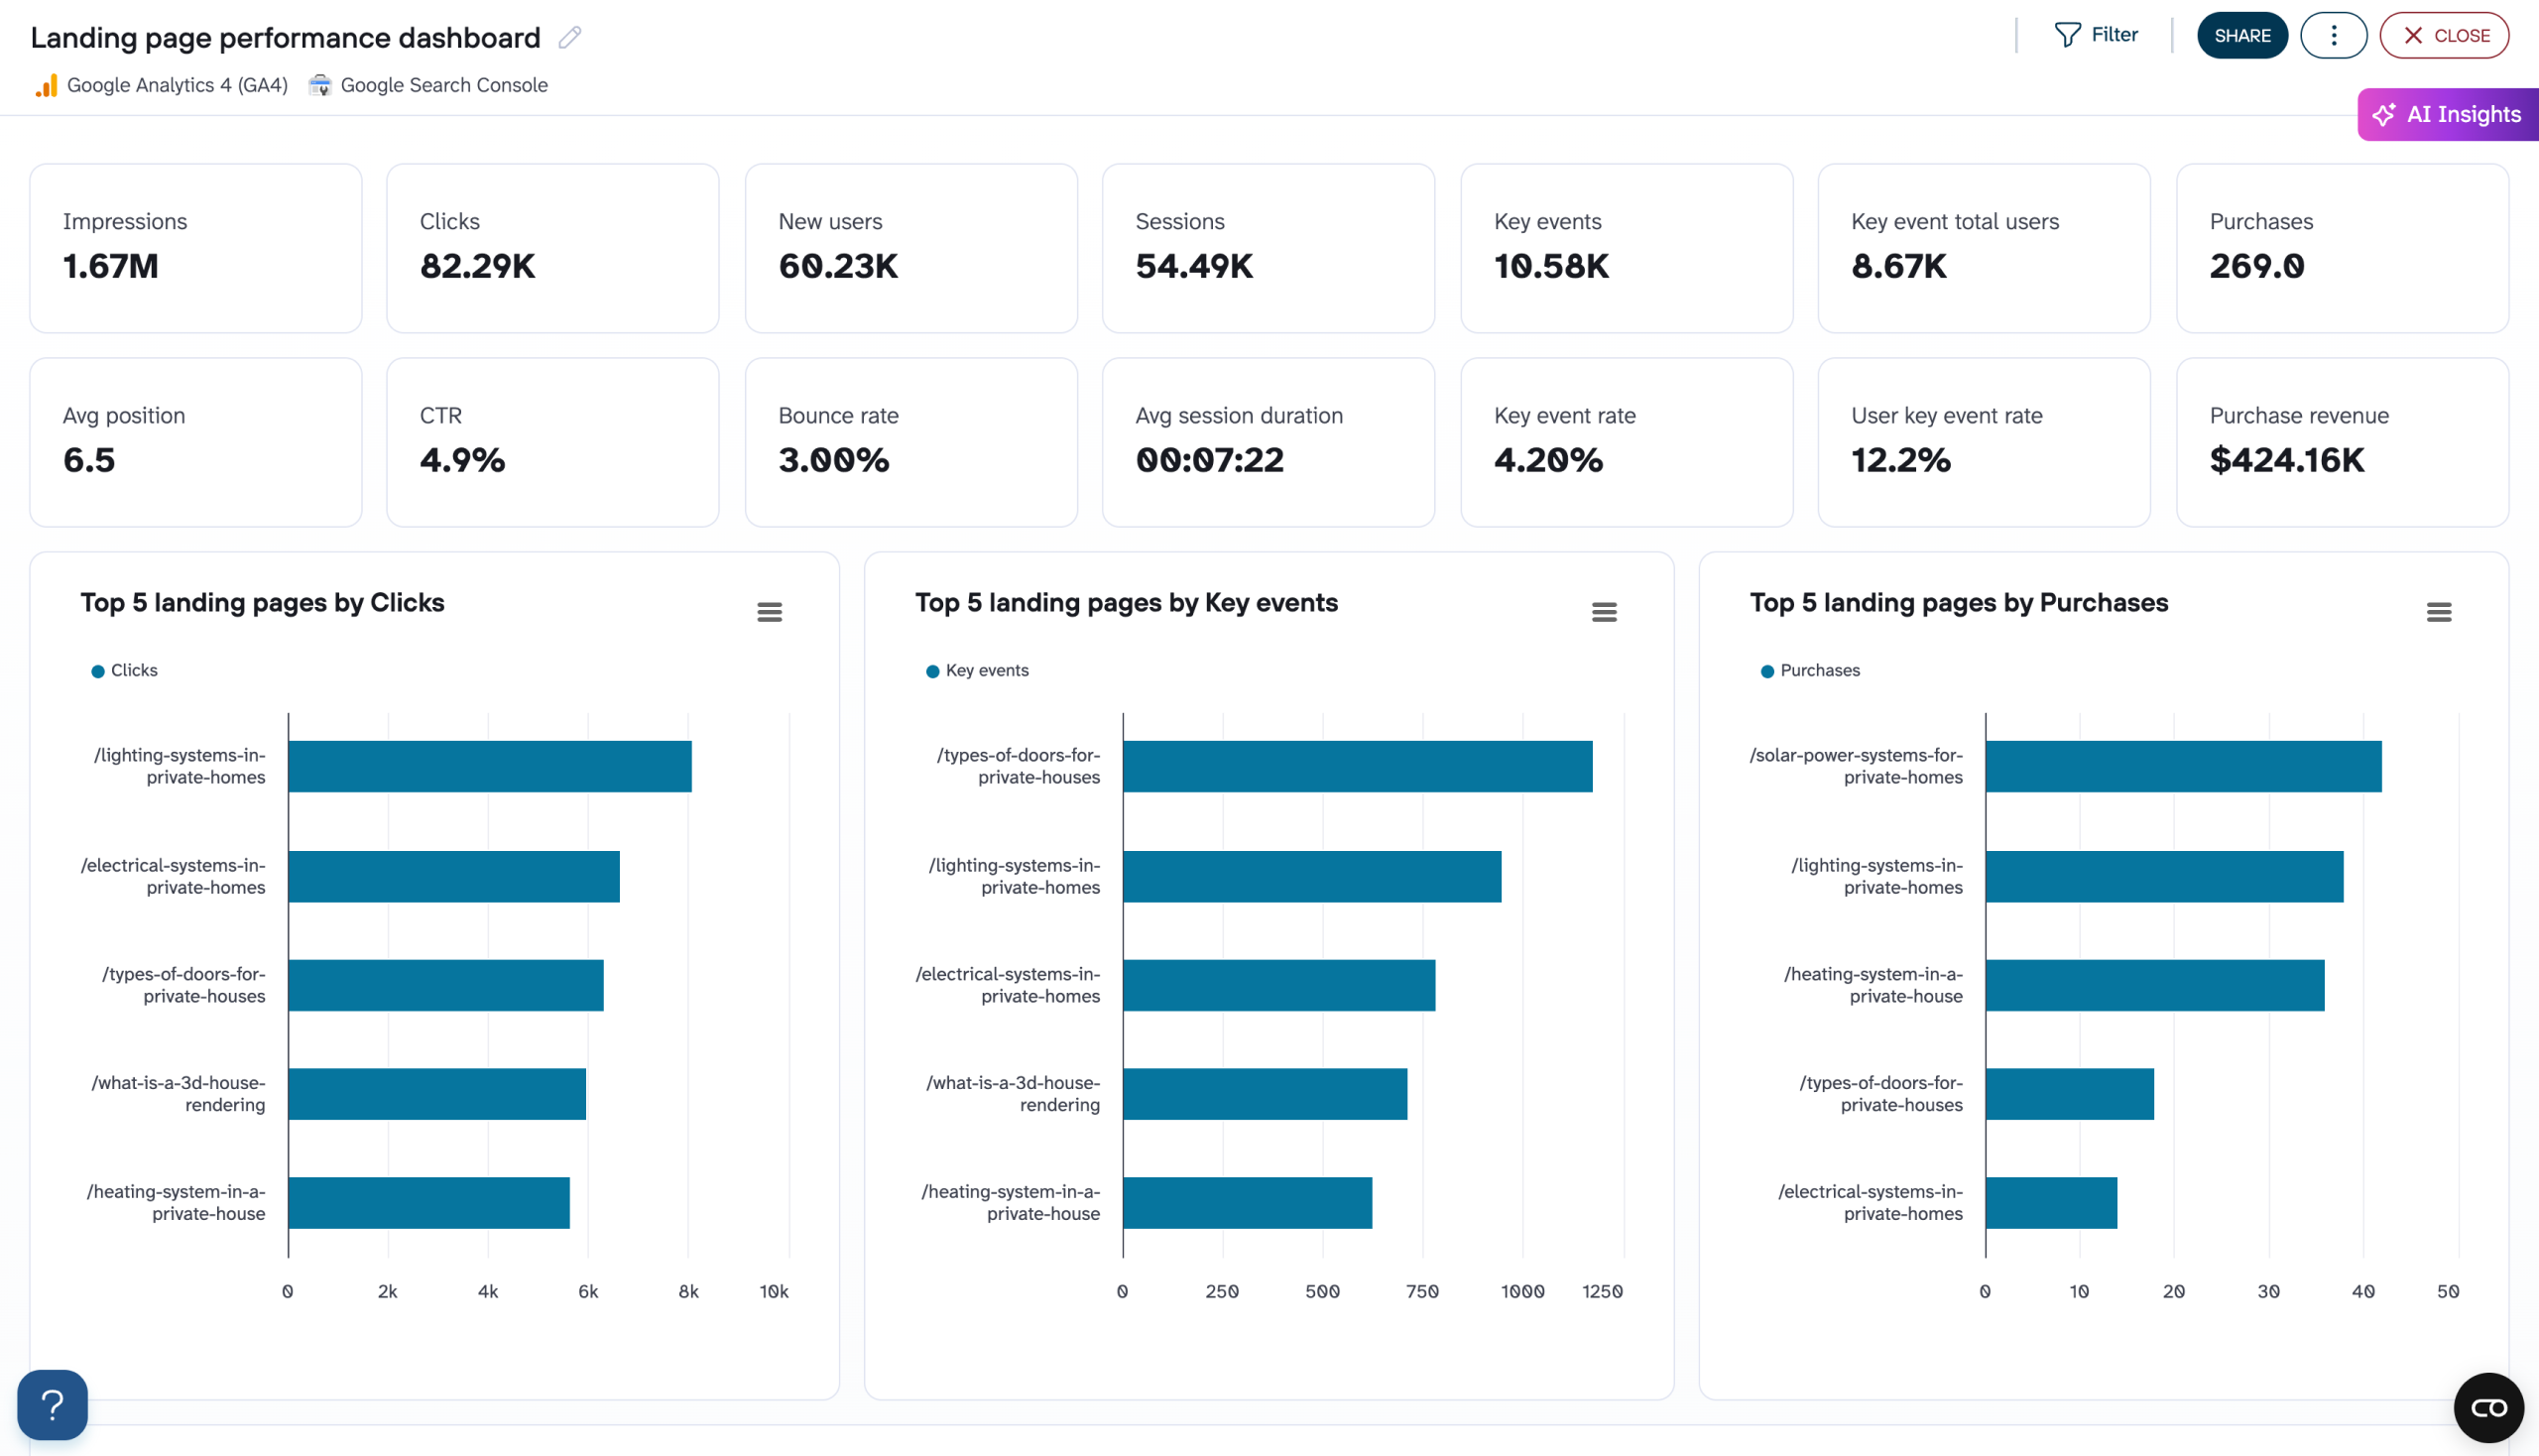
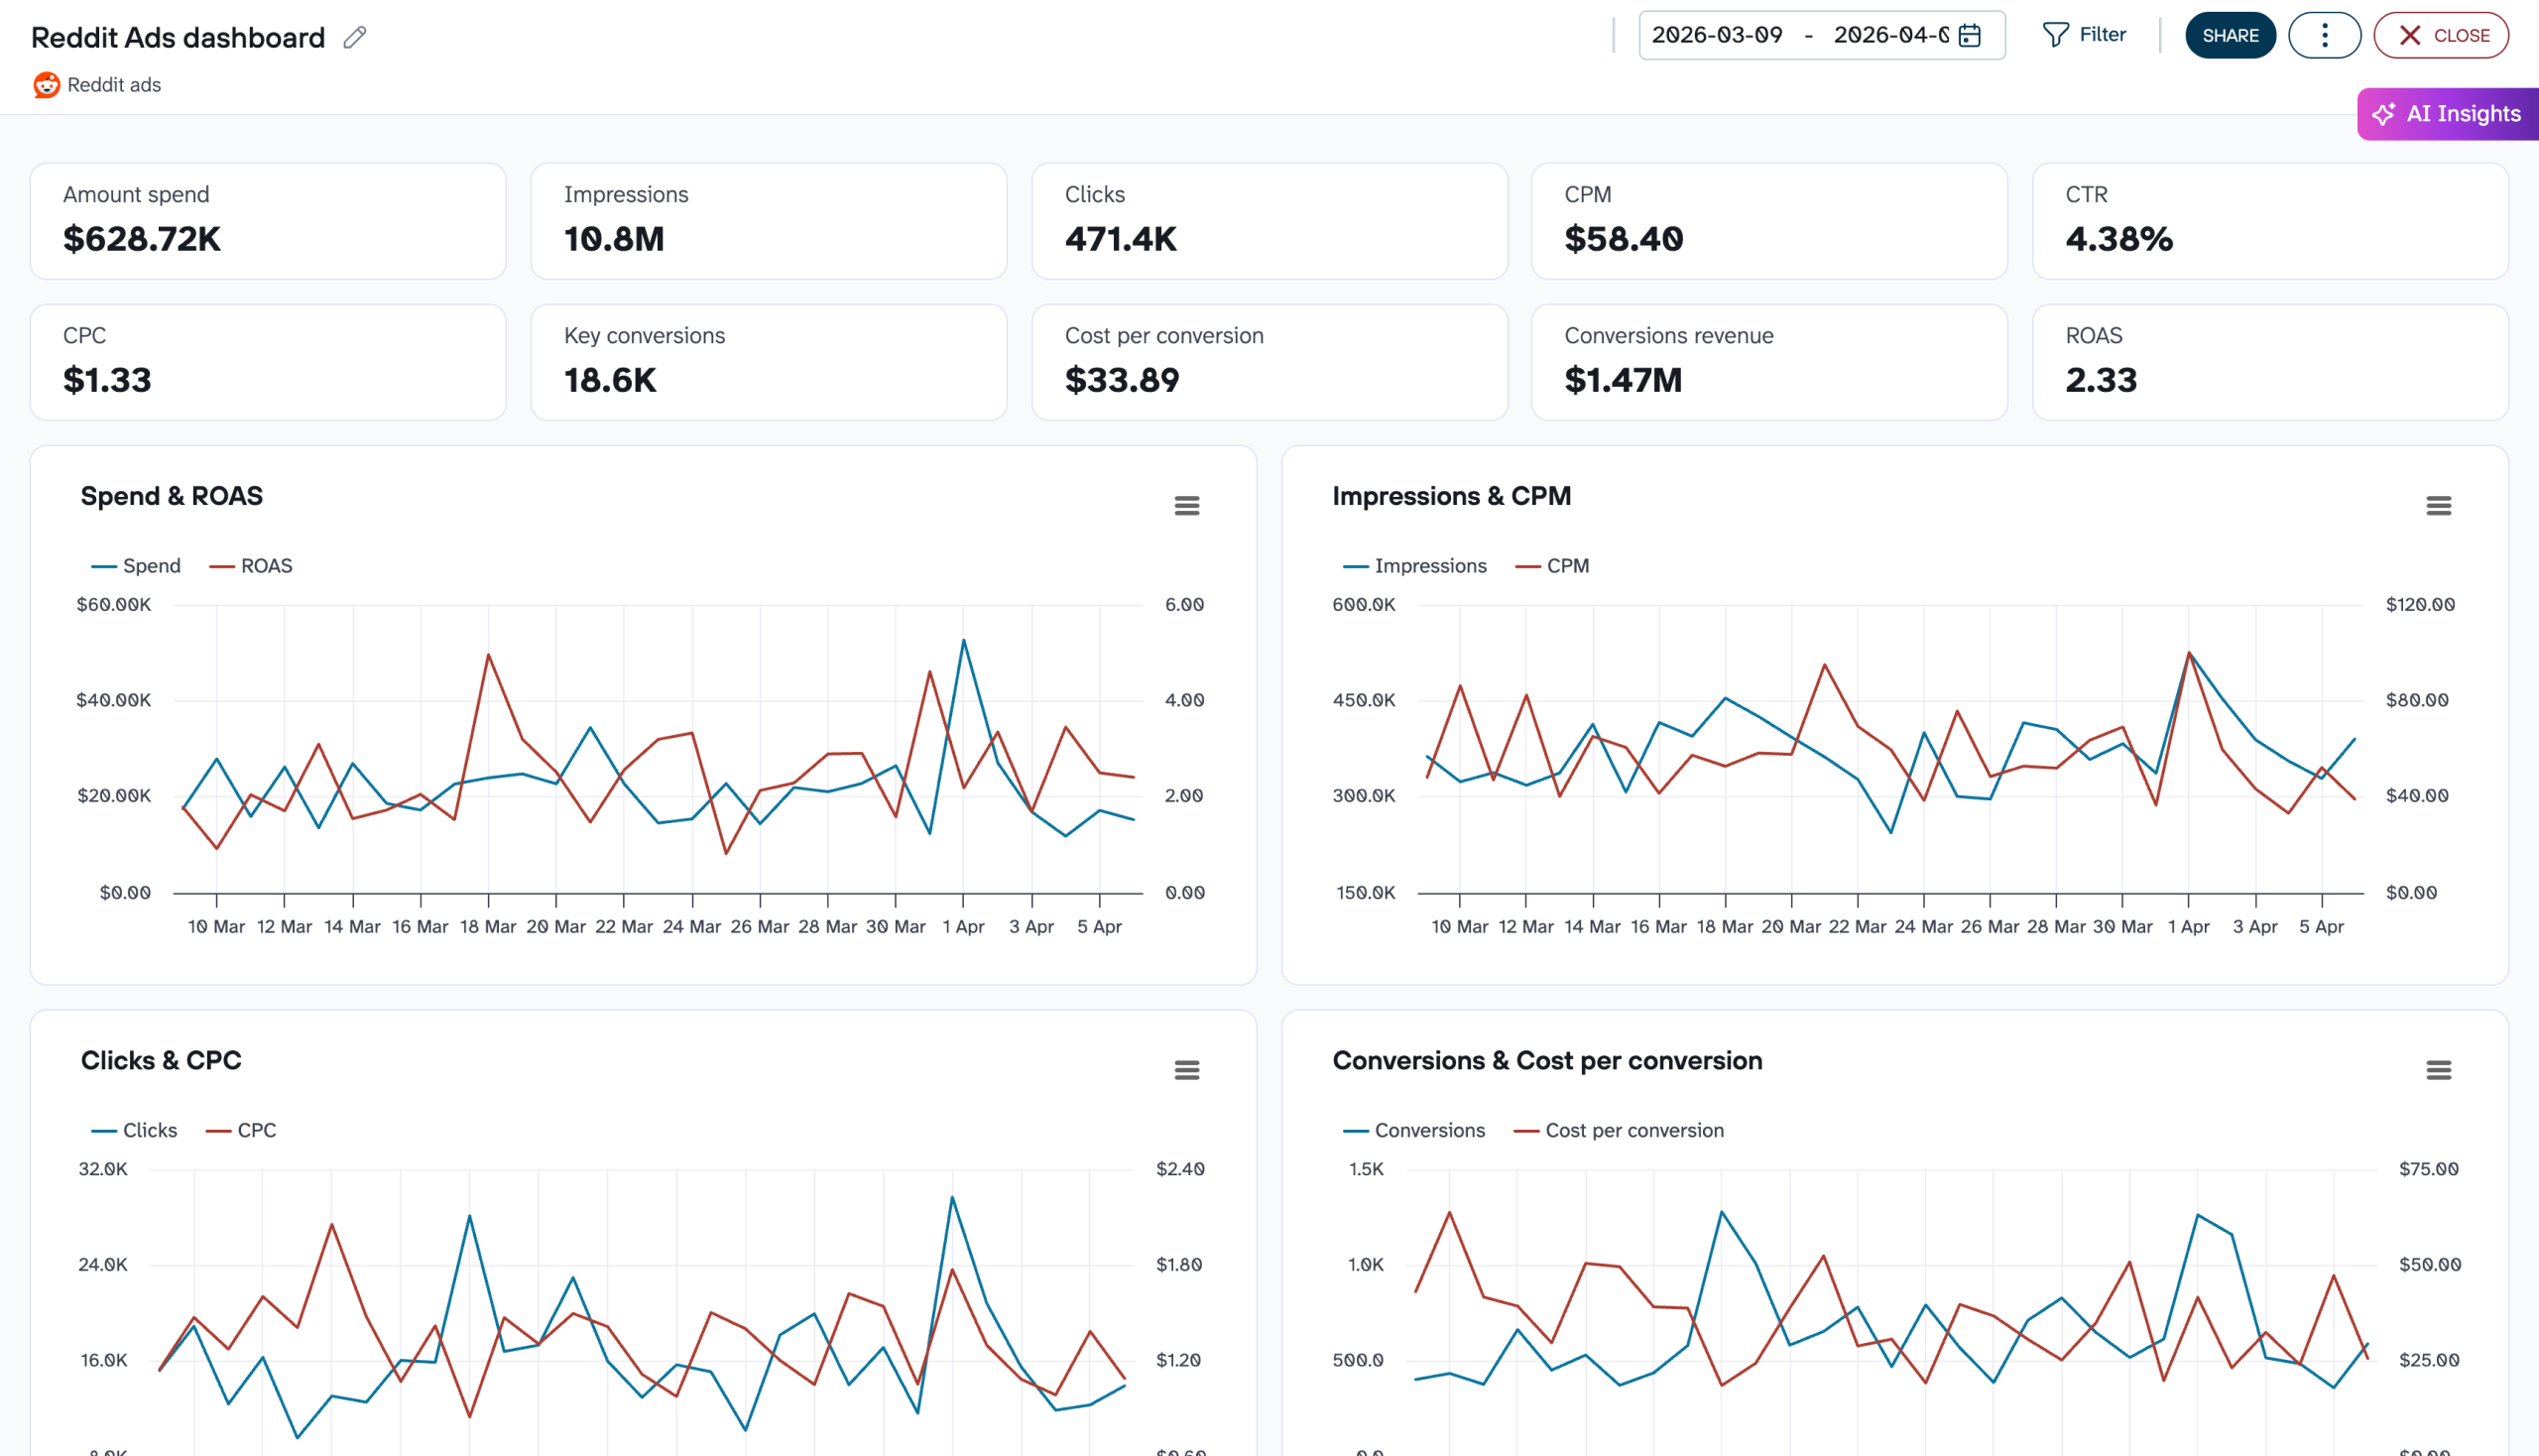
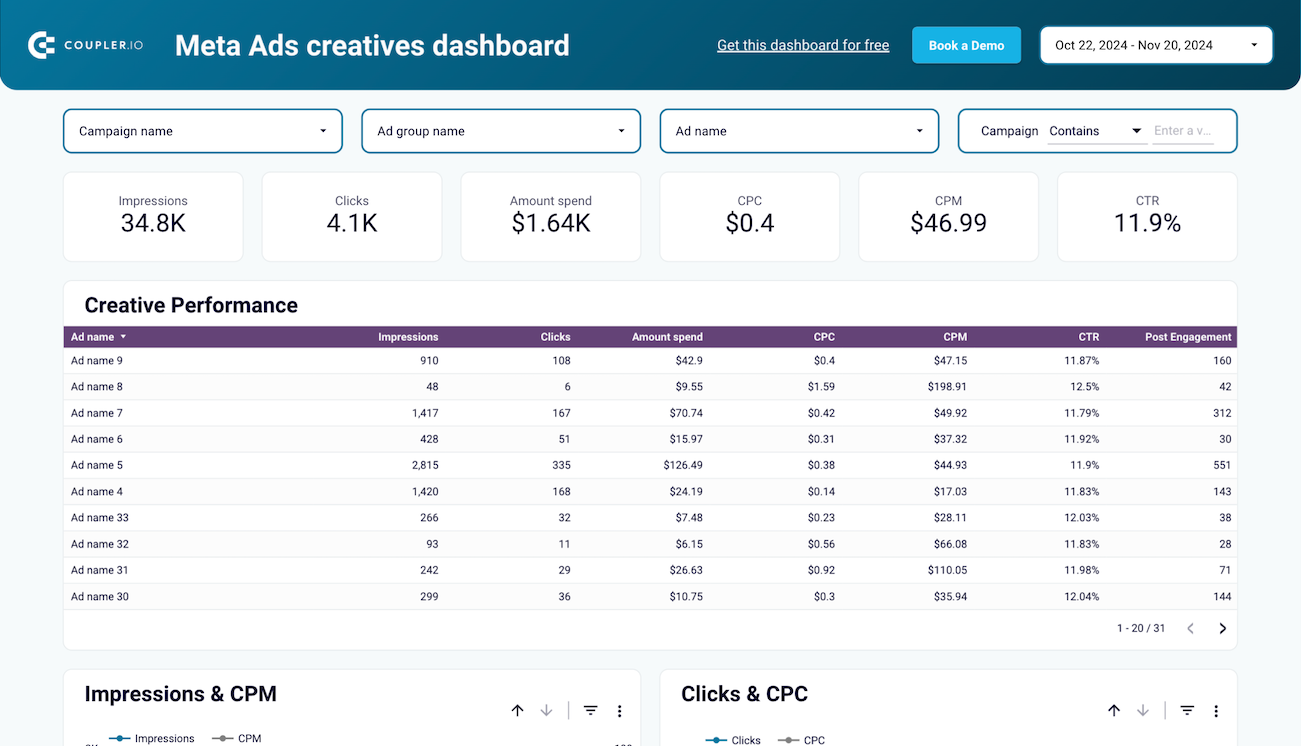
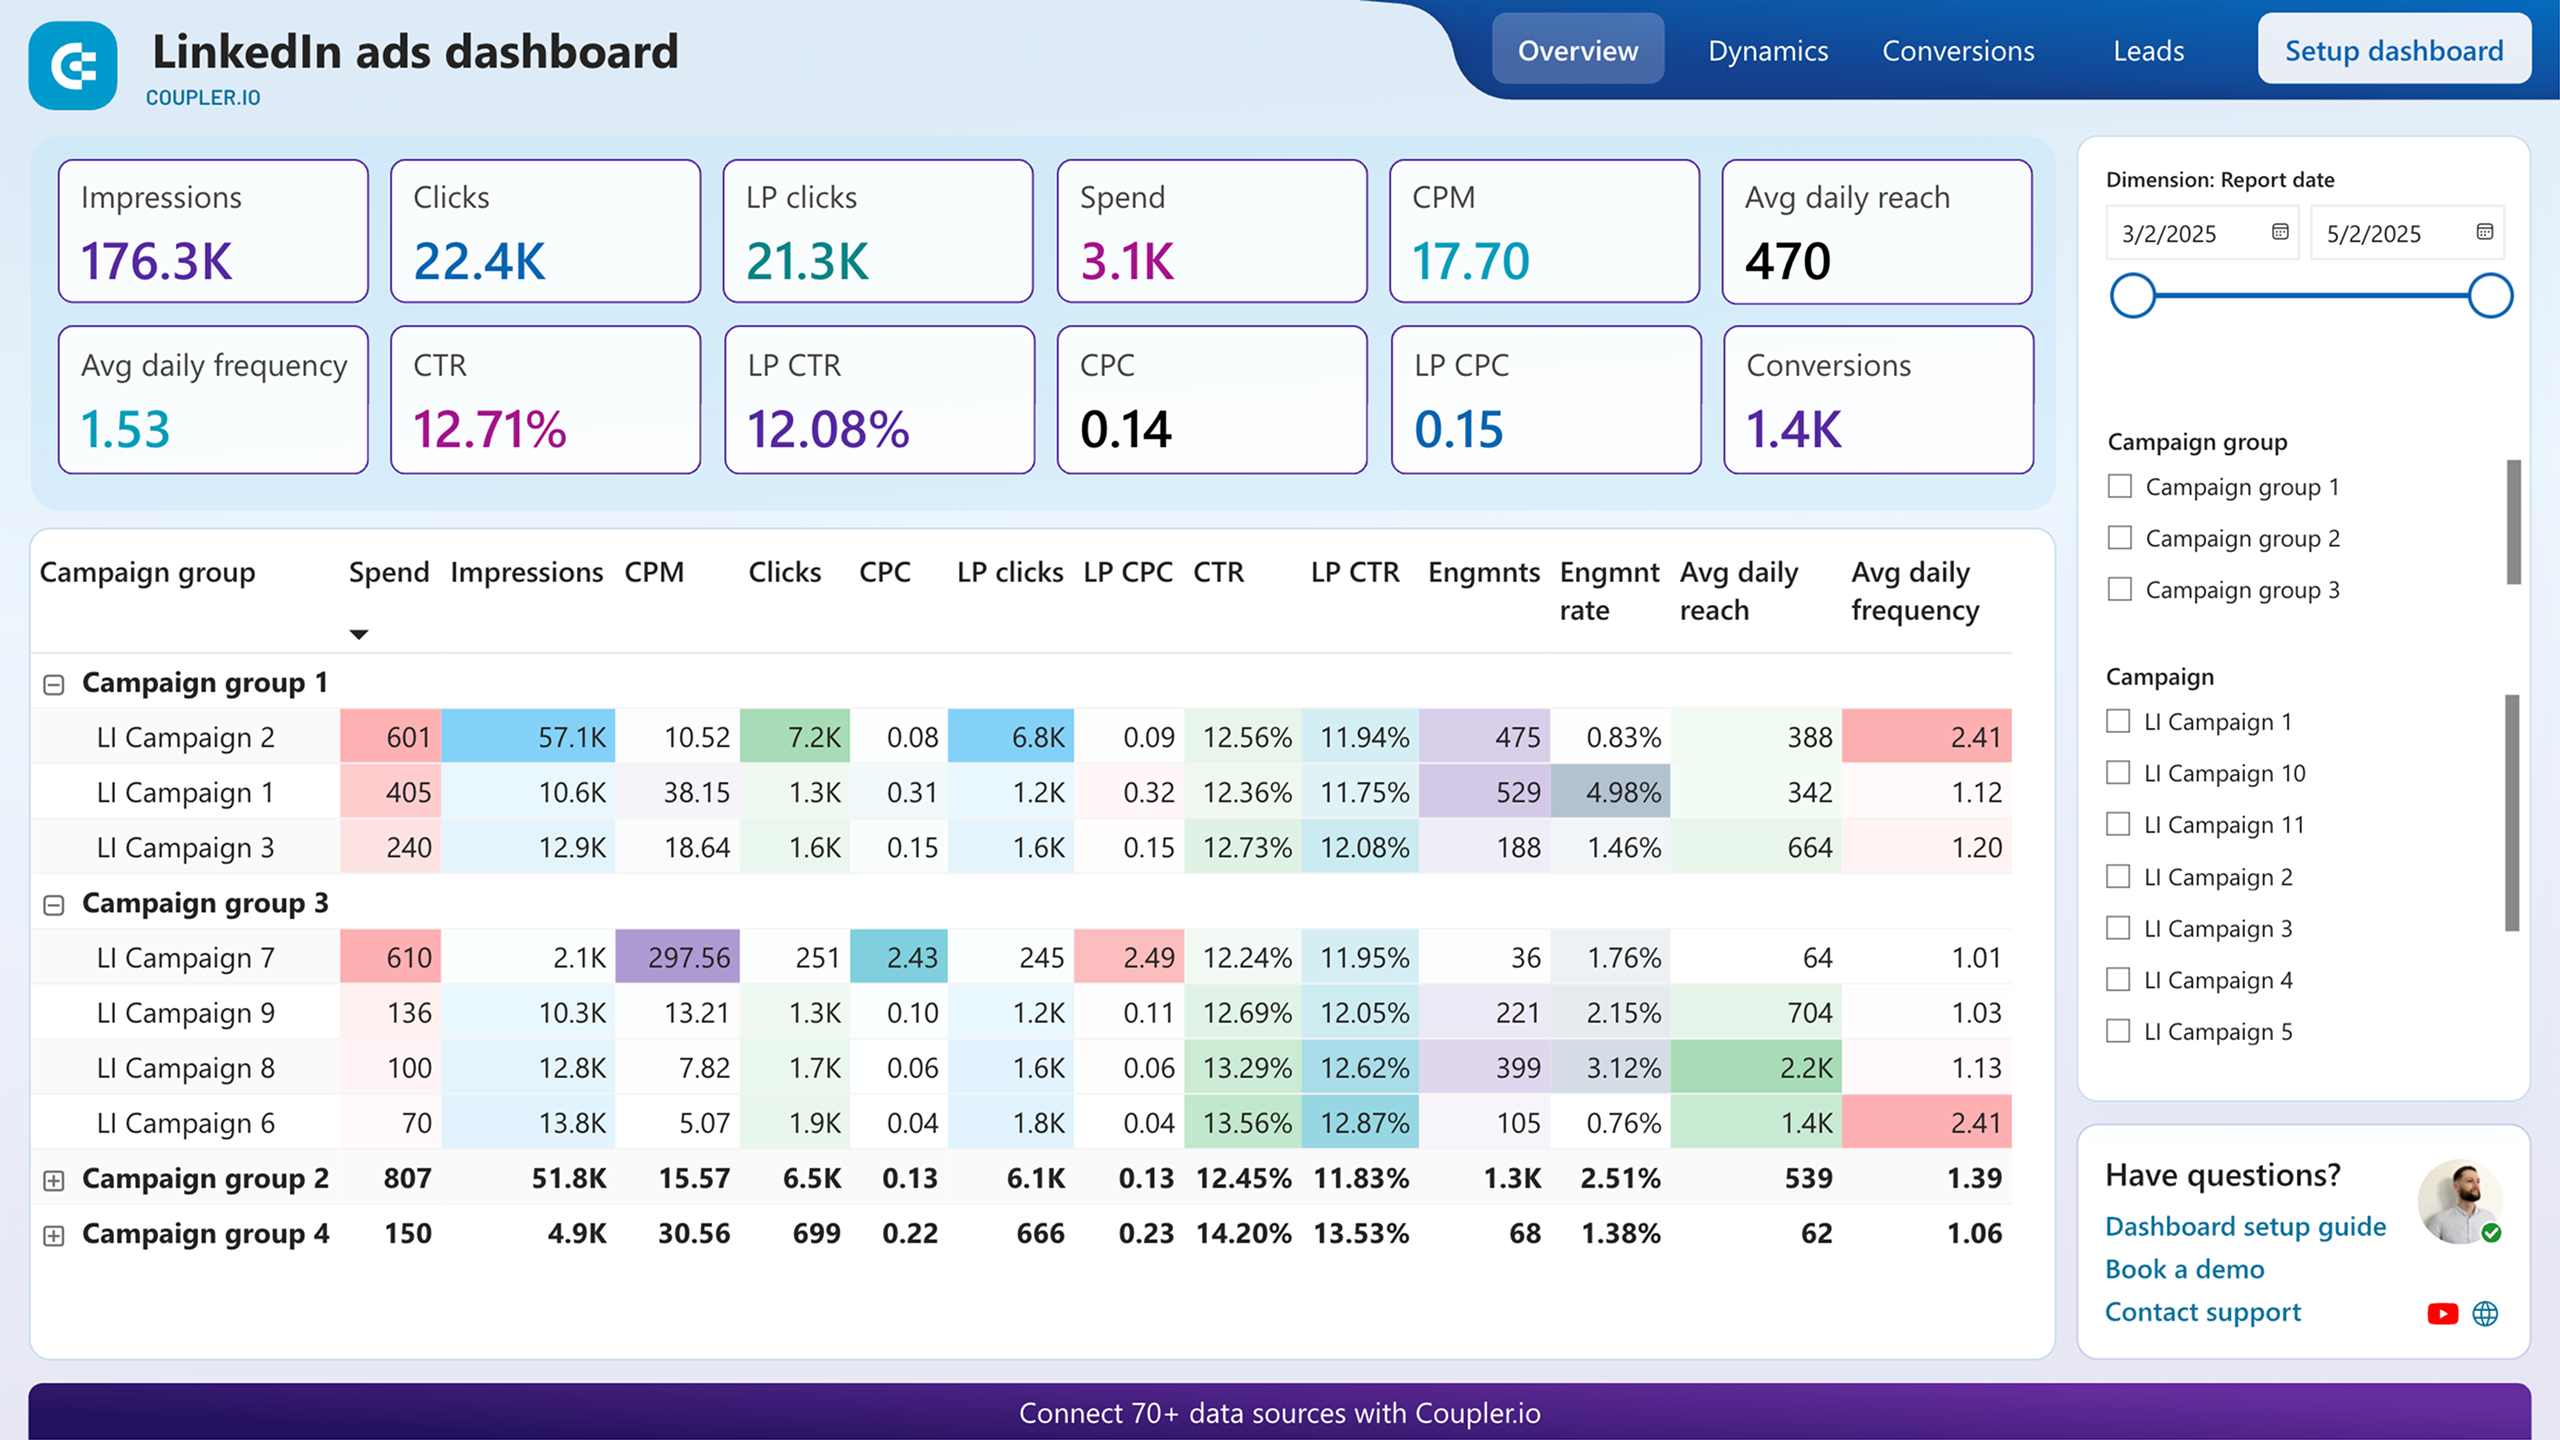
Control key spend metrics: cost per click, cost per impression, cost per action

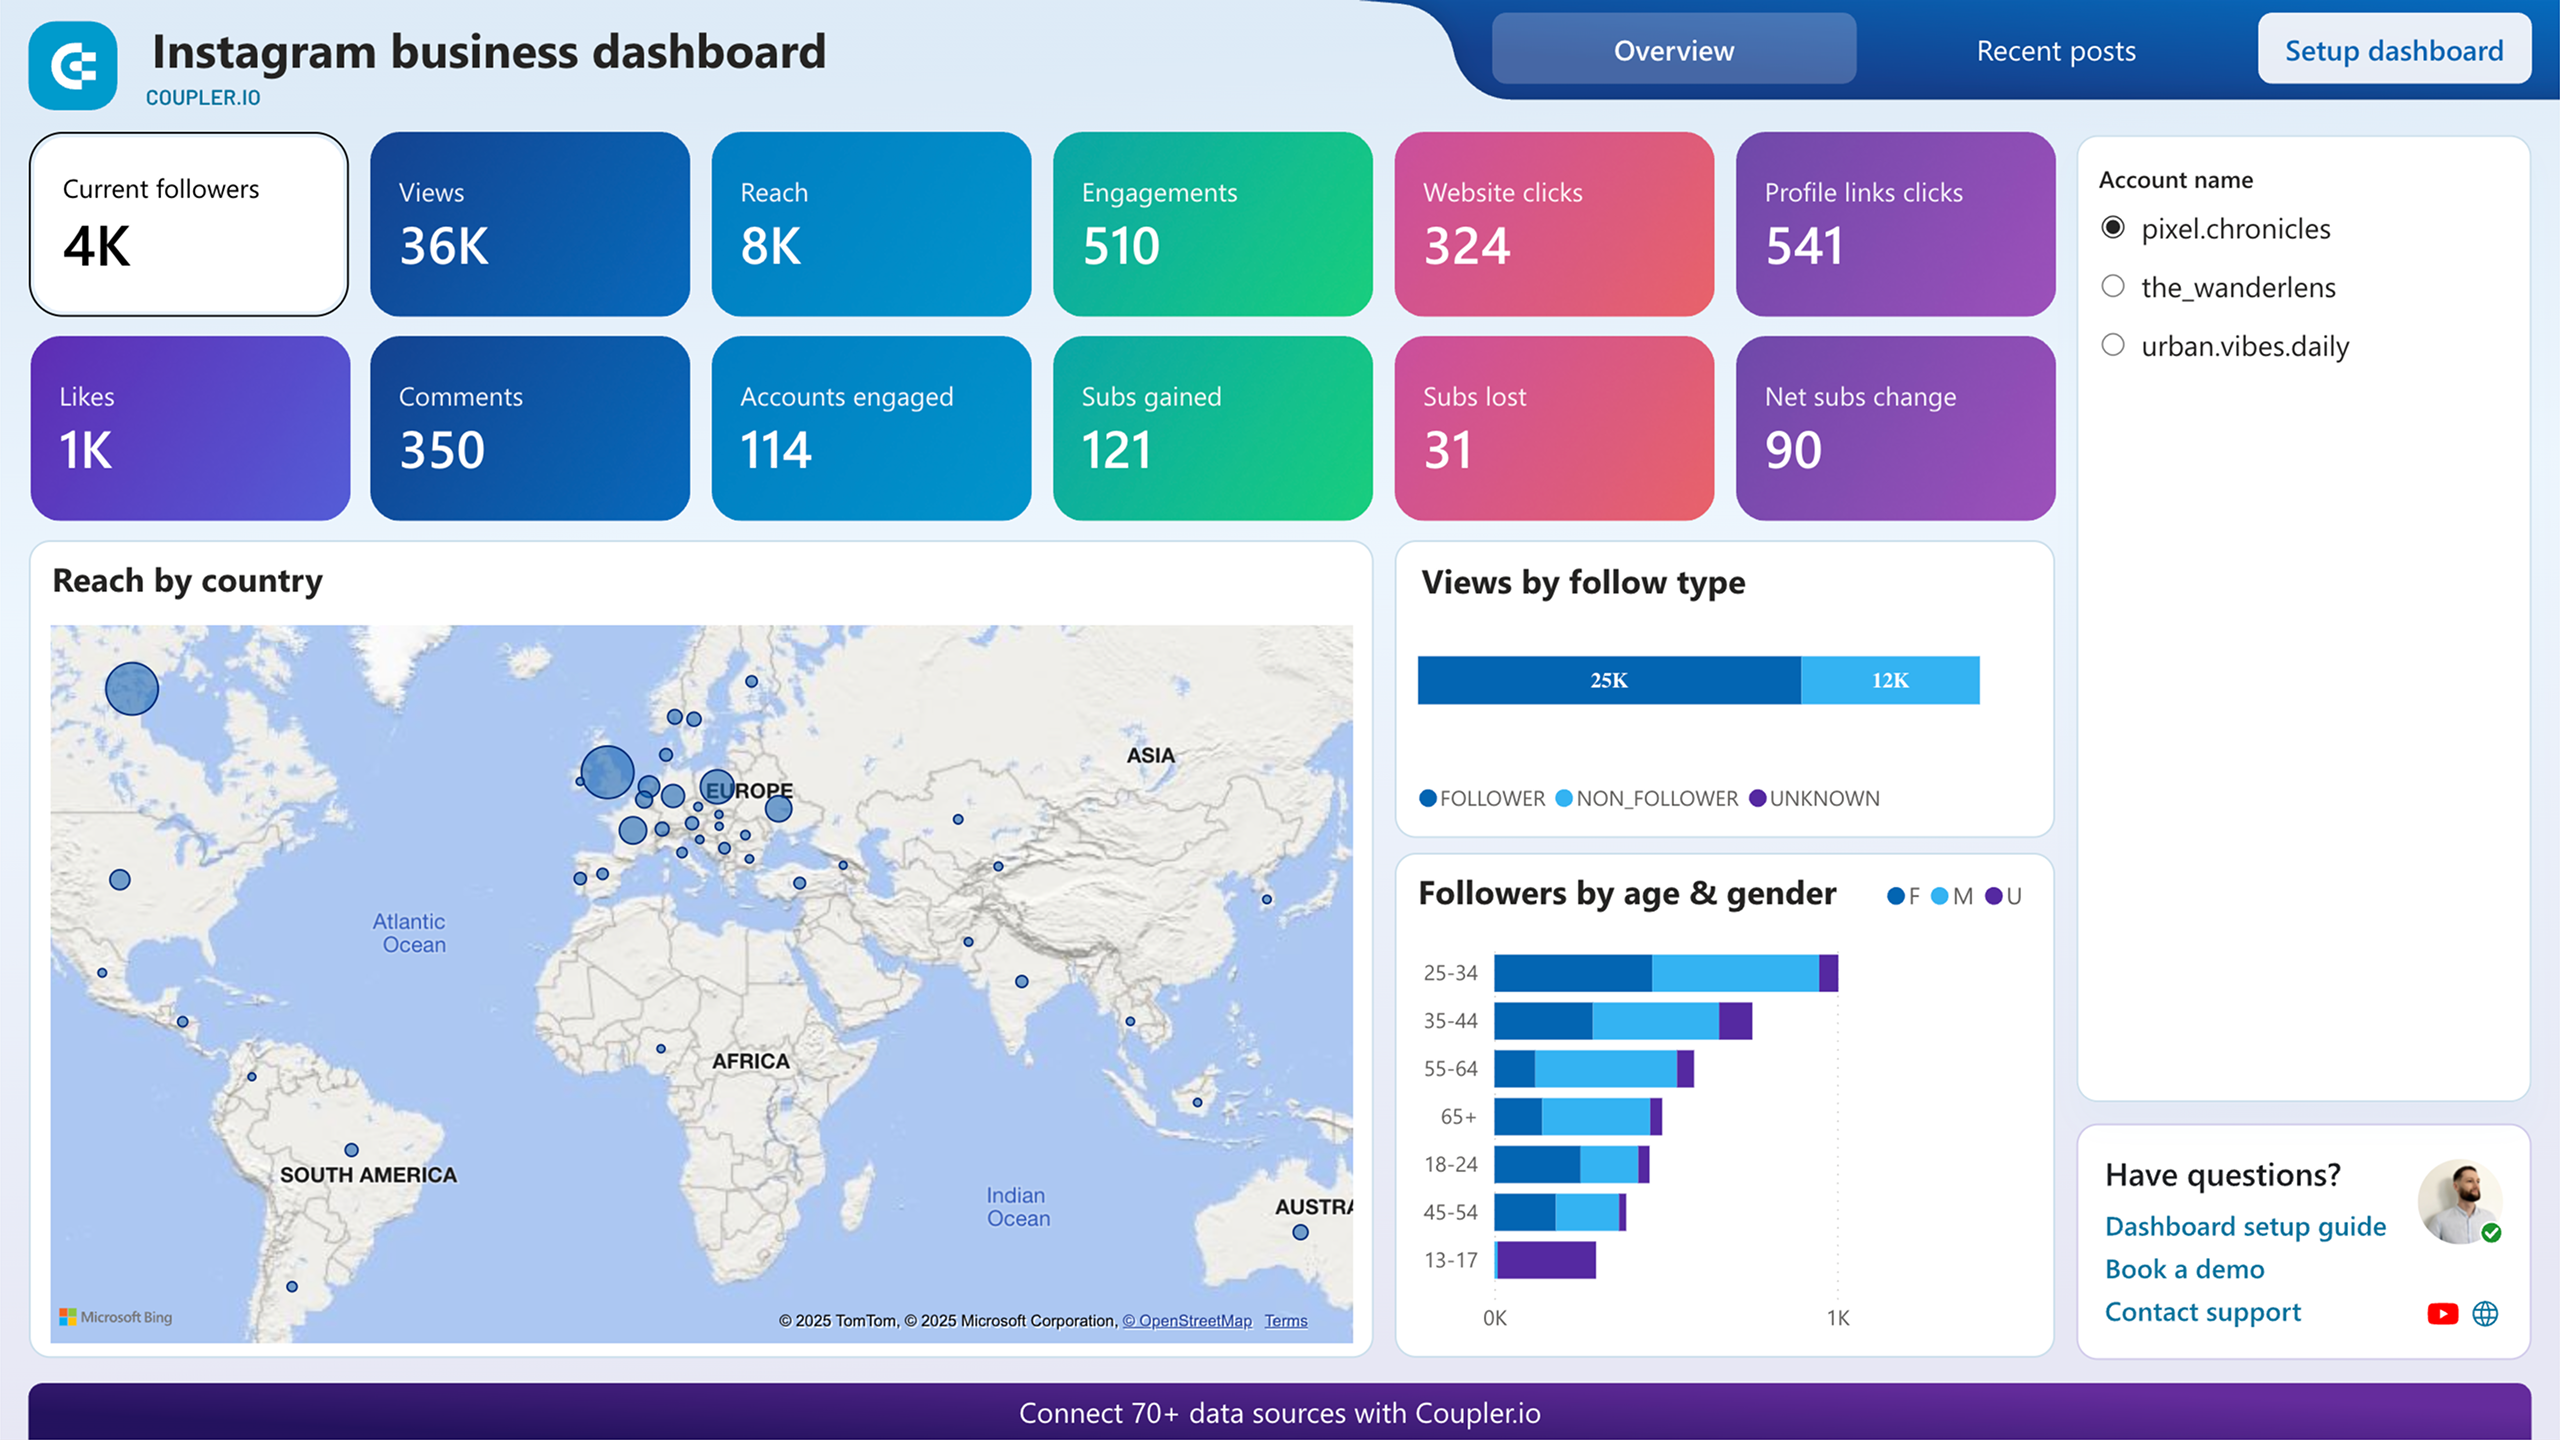
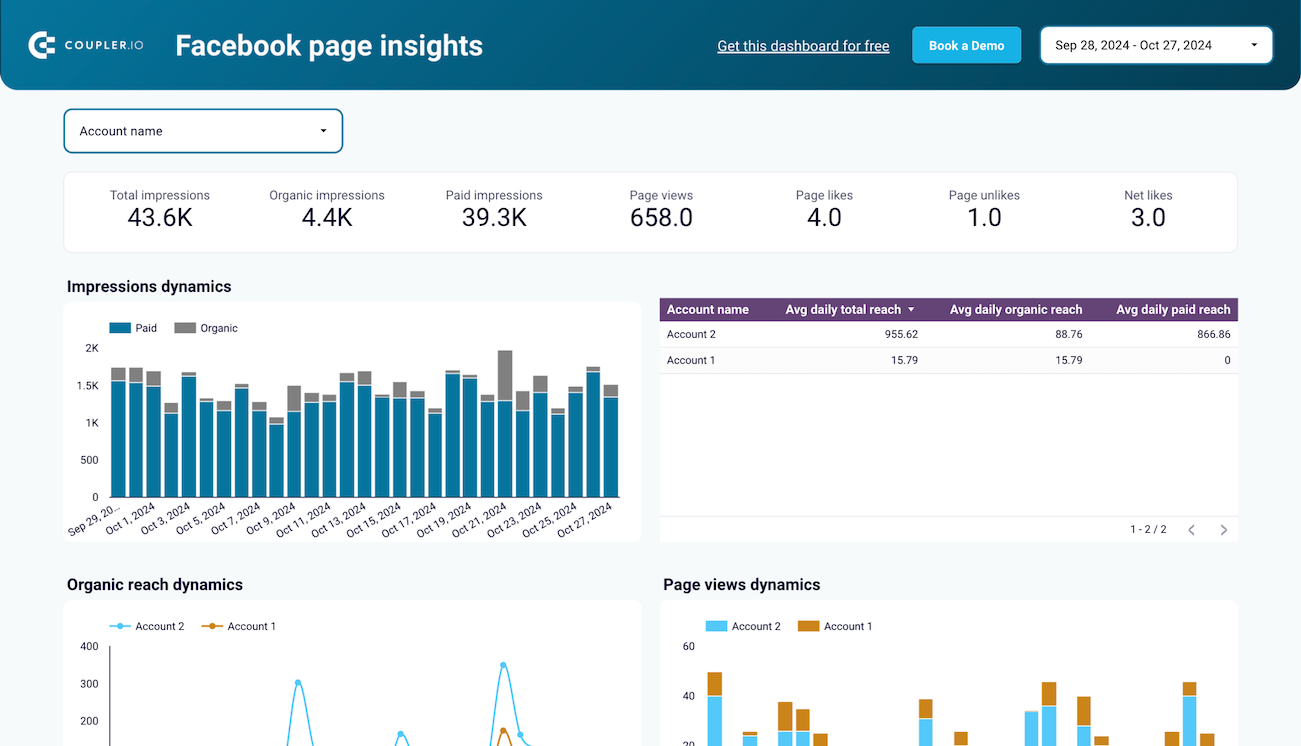
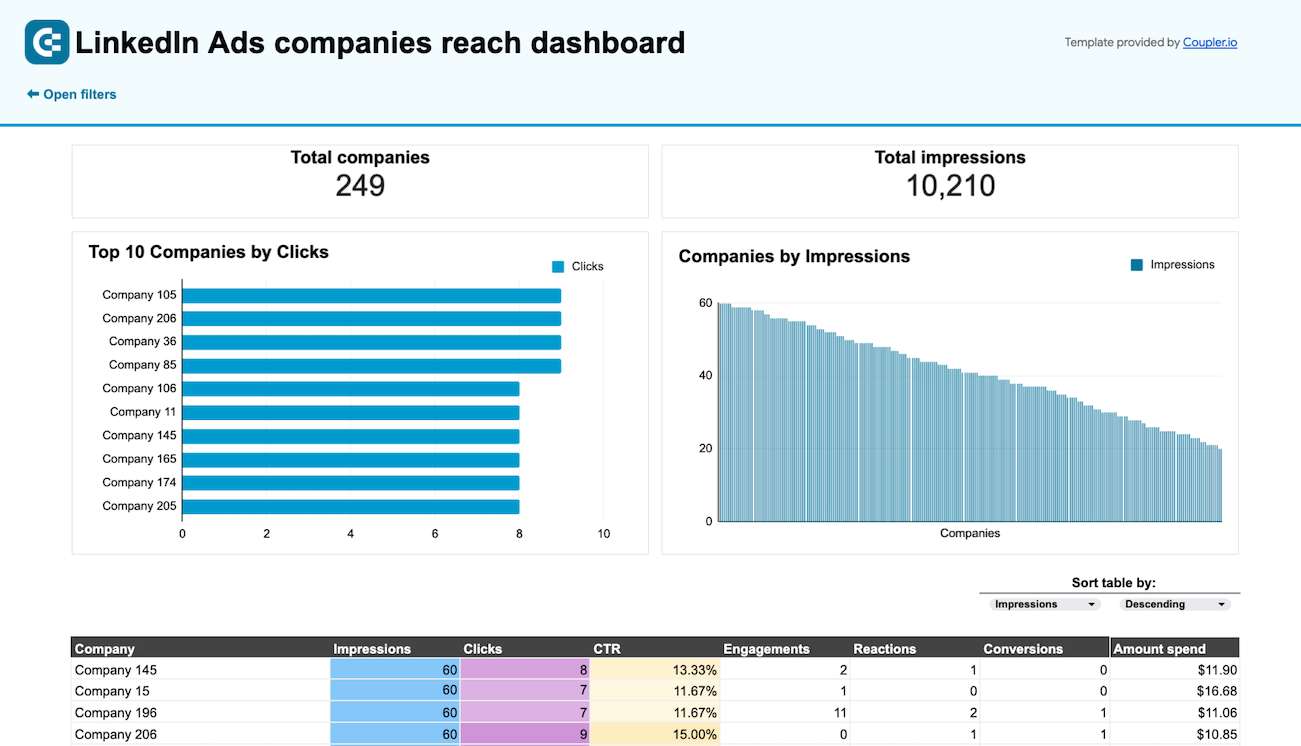
View global data or get a regional breakdown

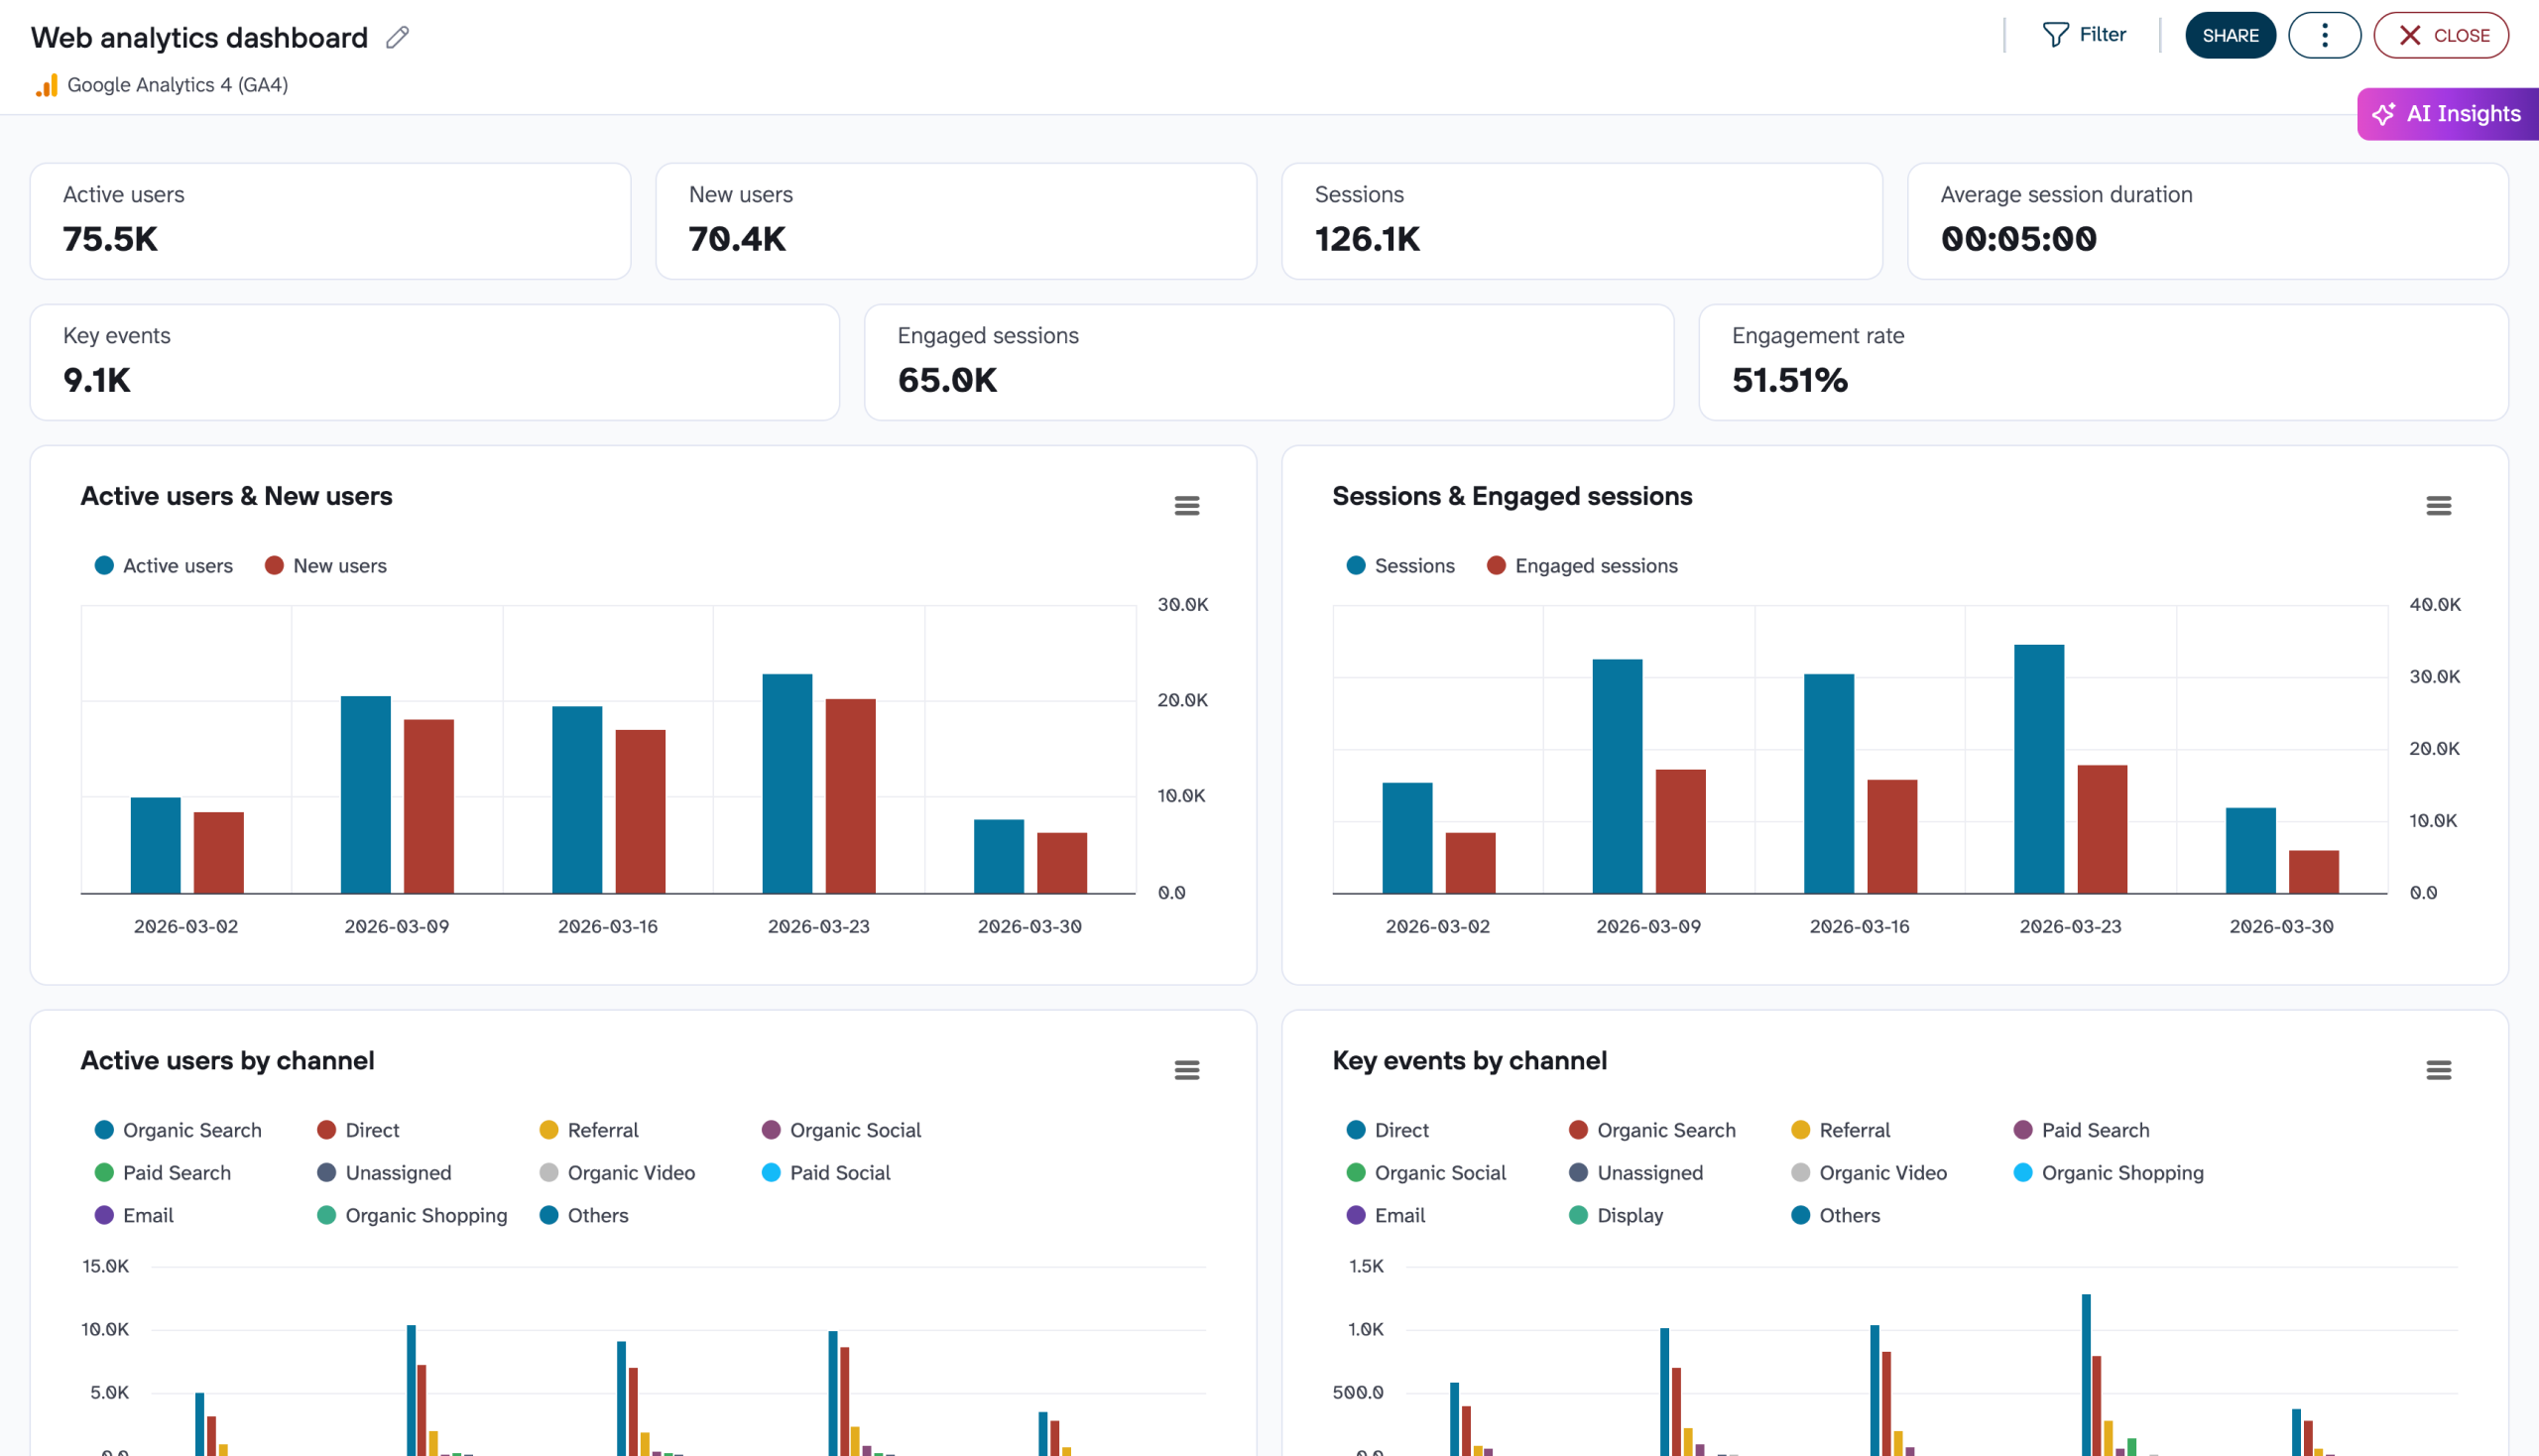
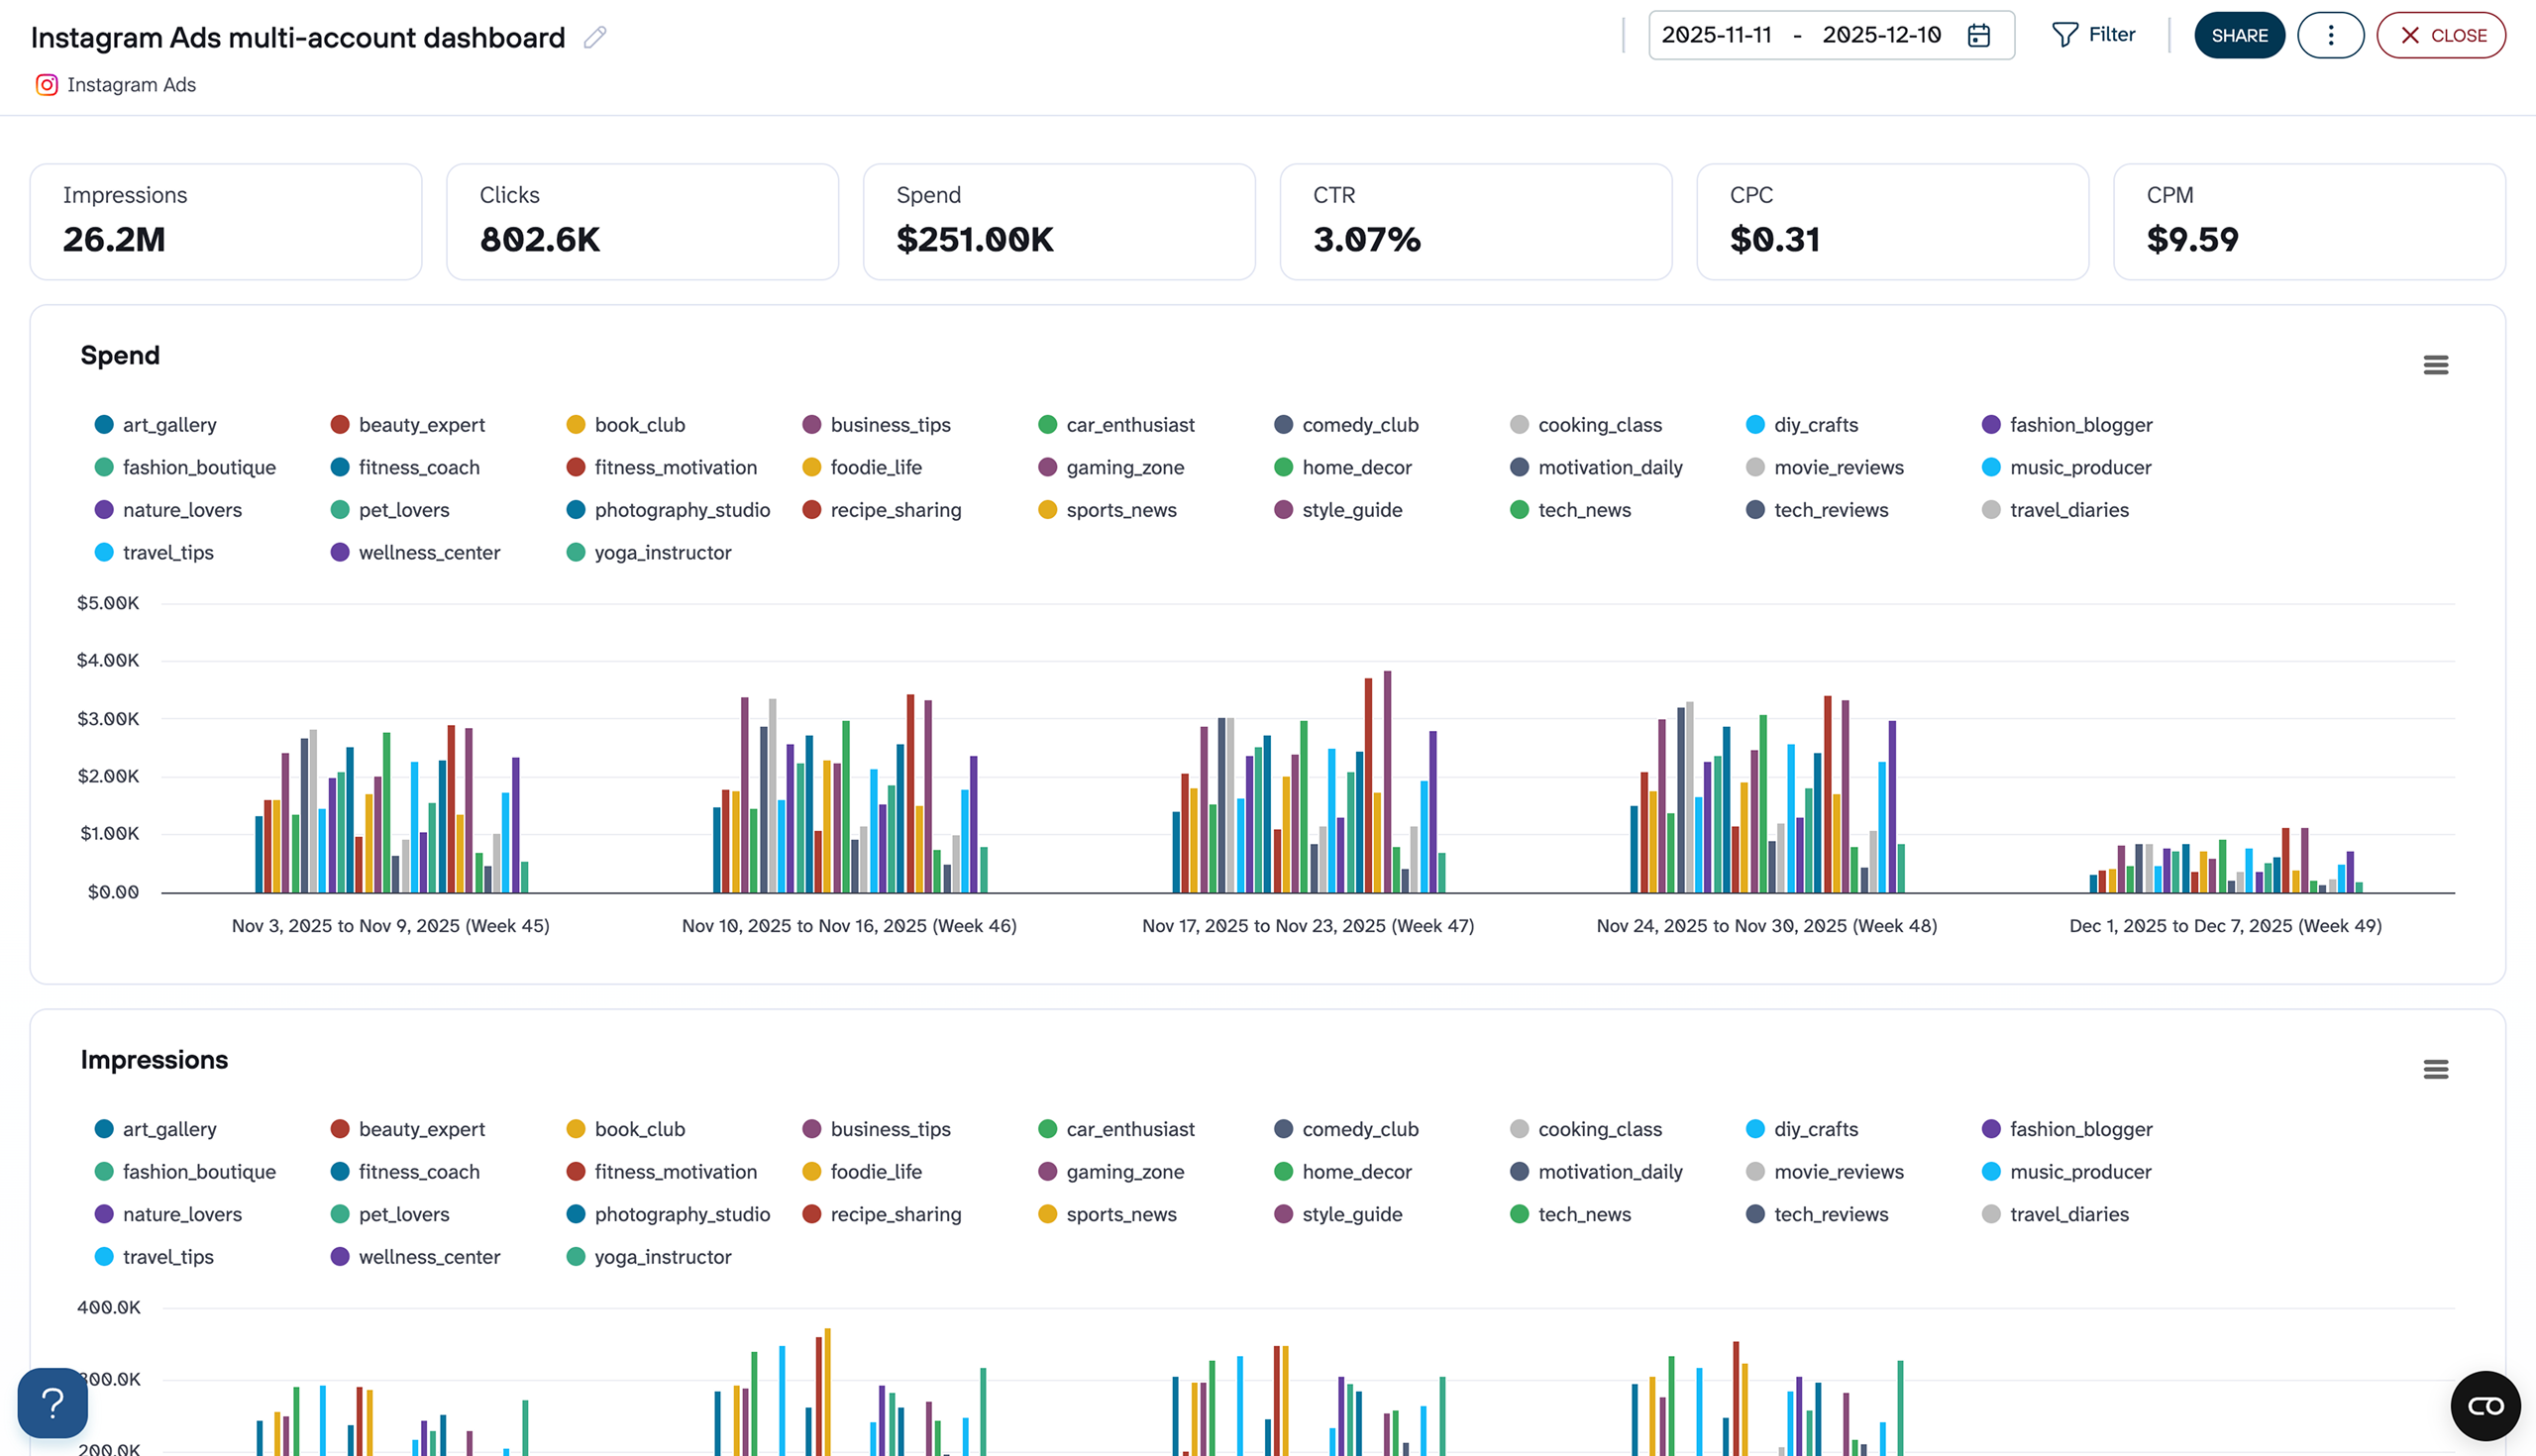
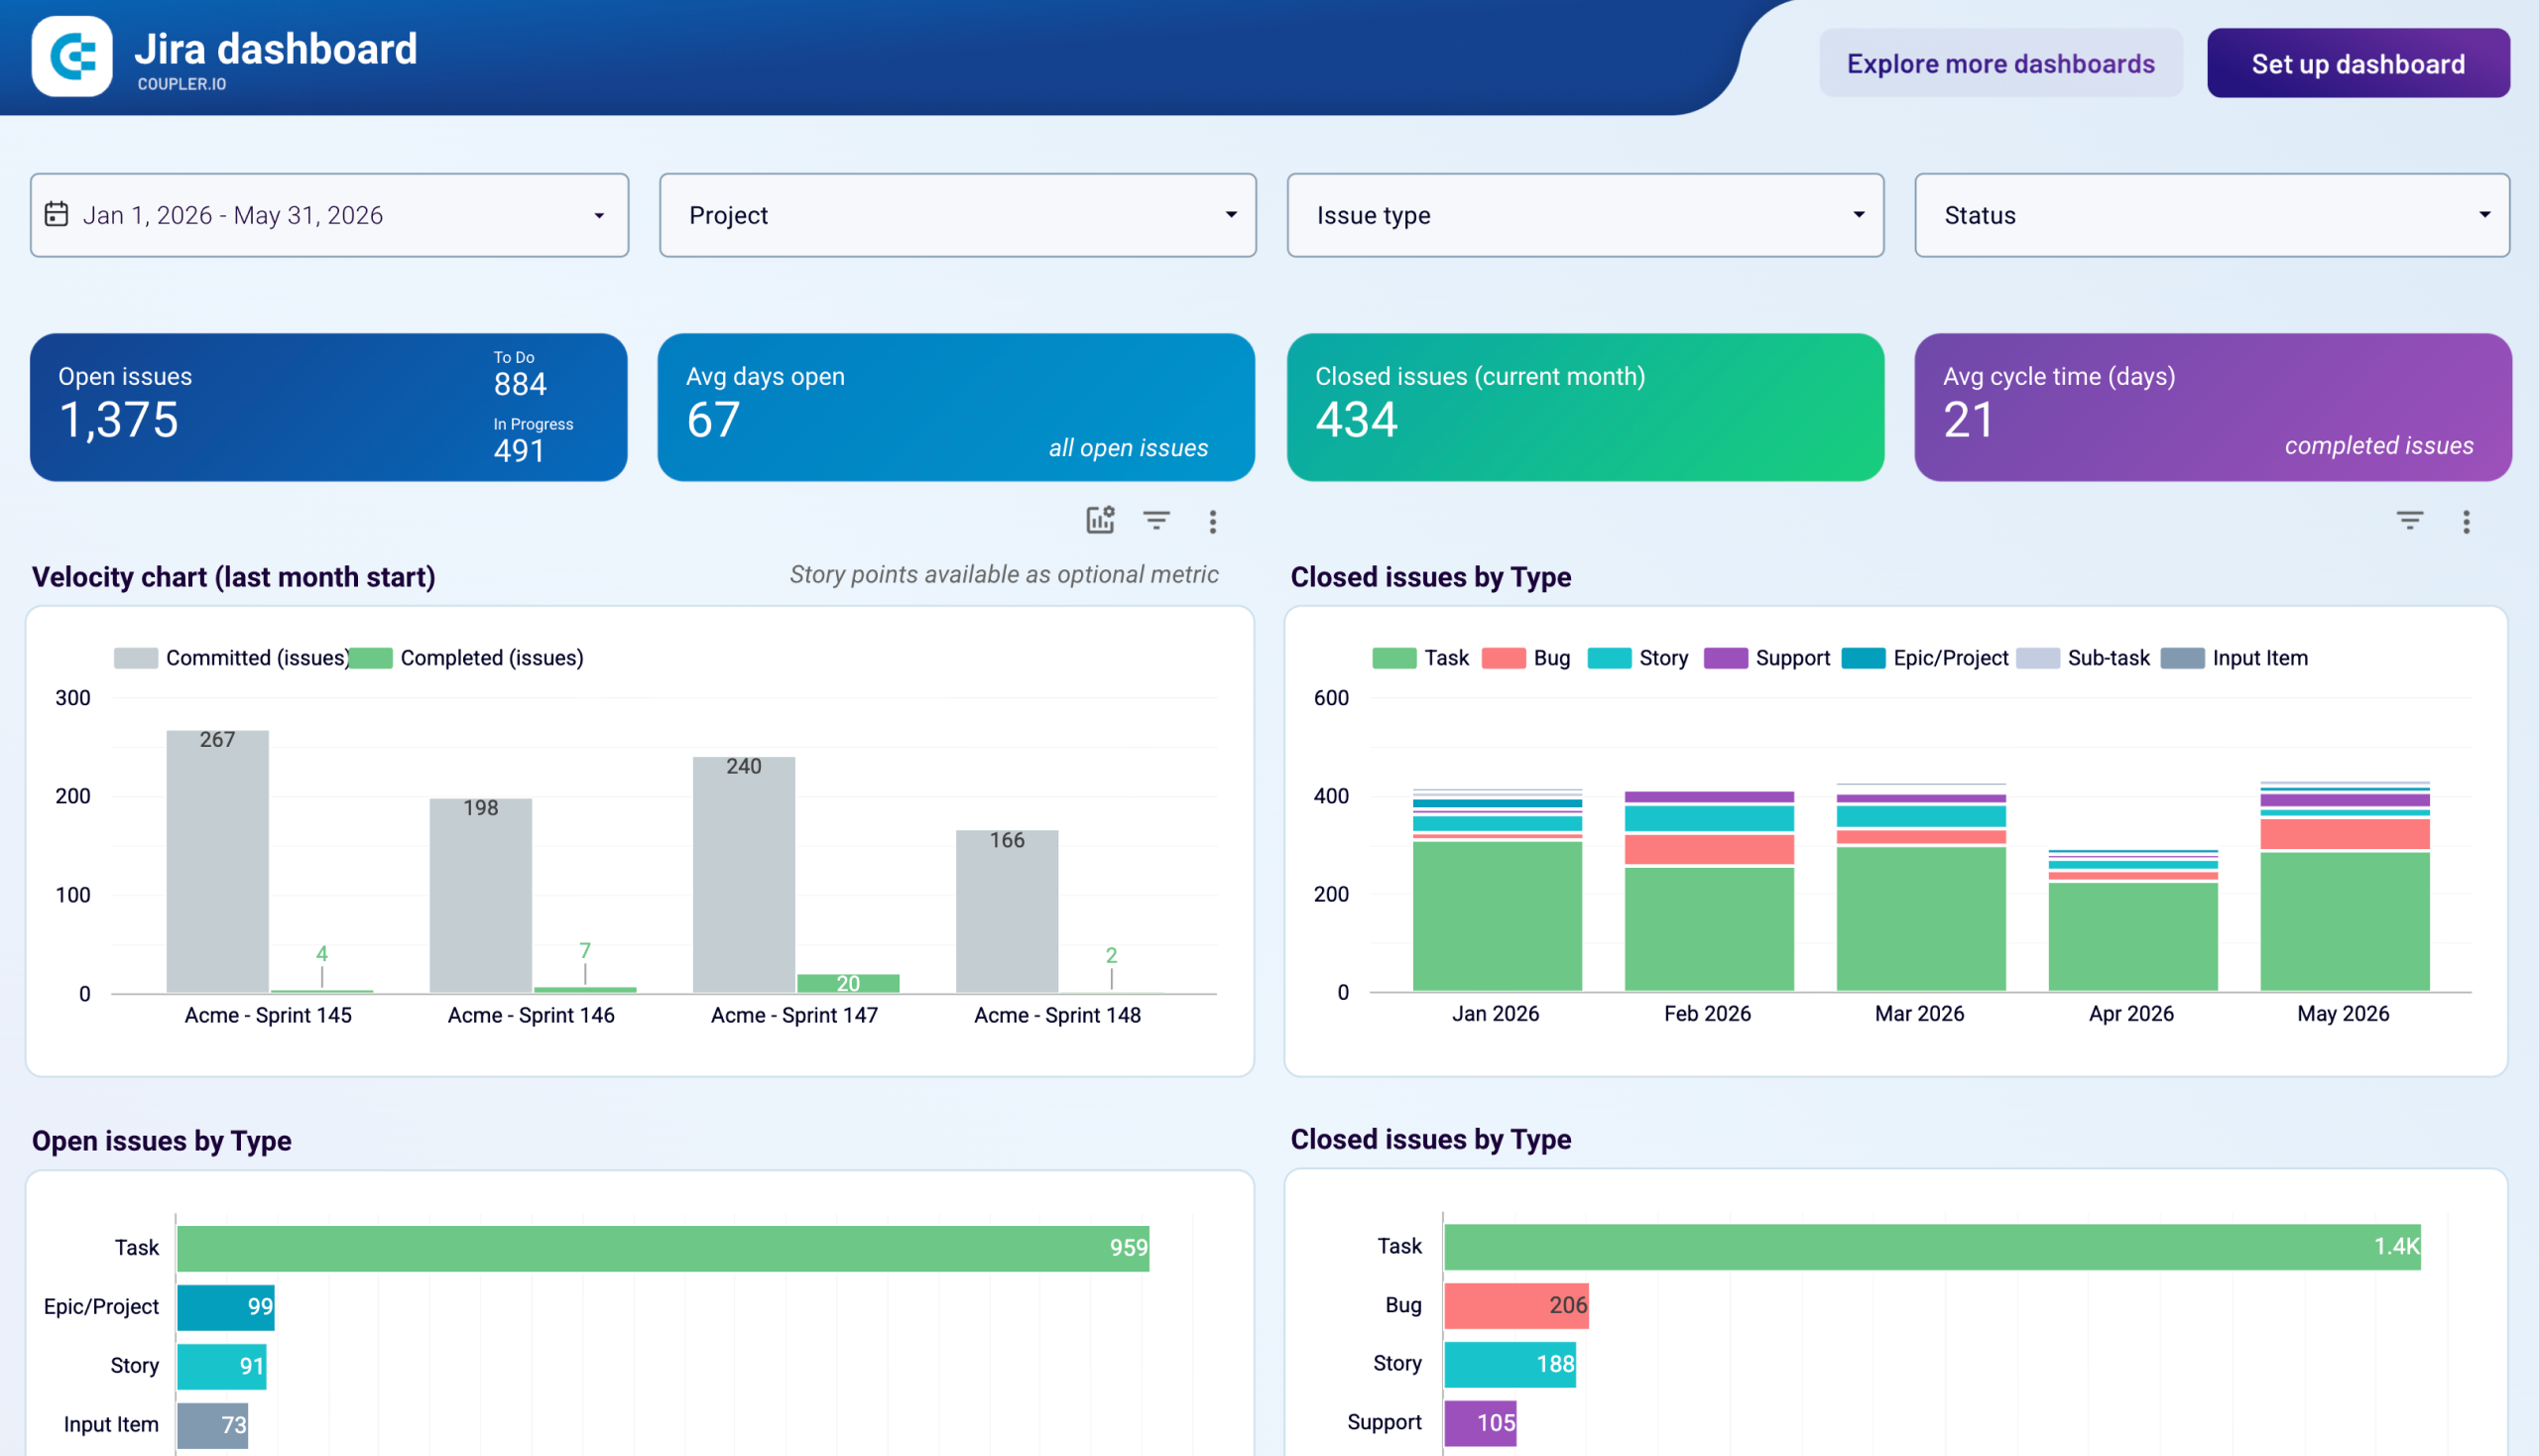
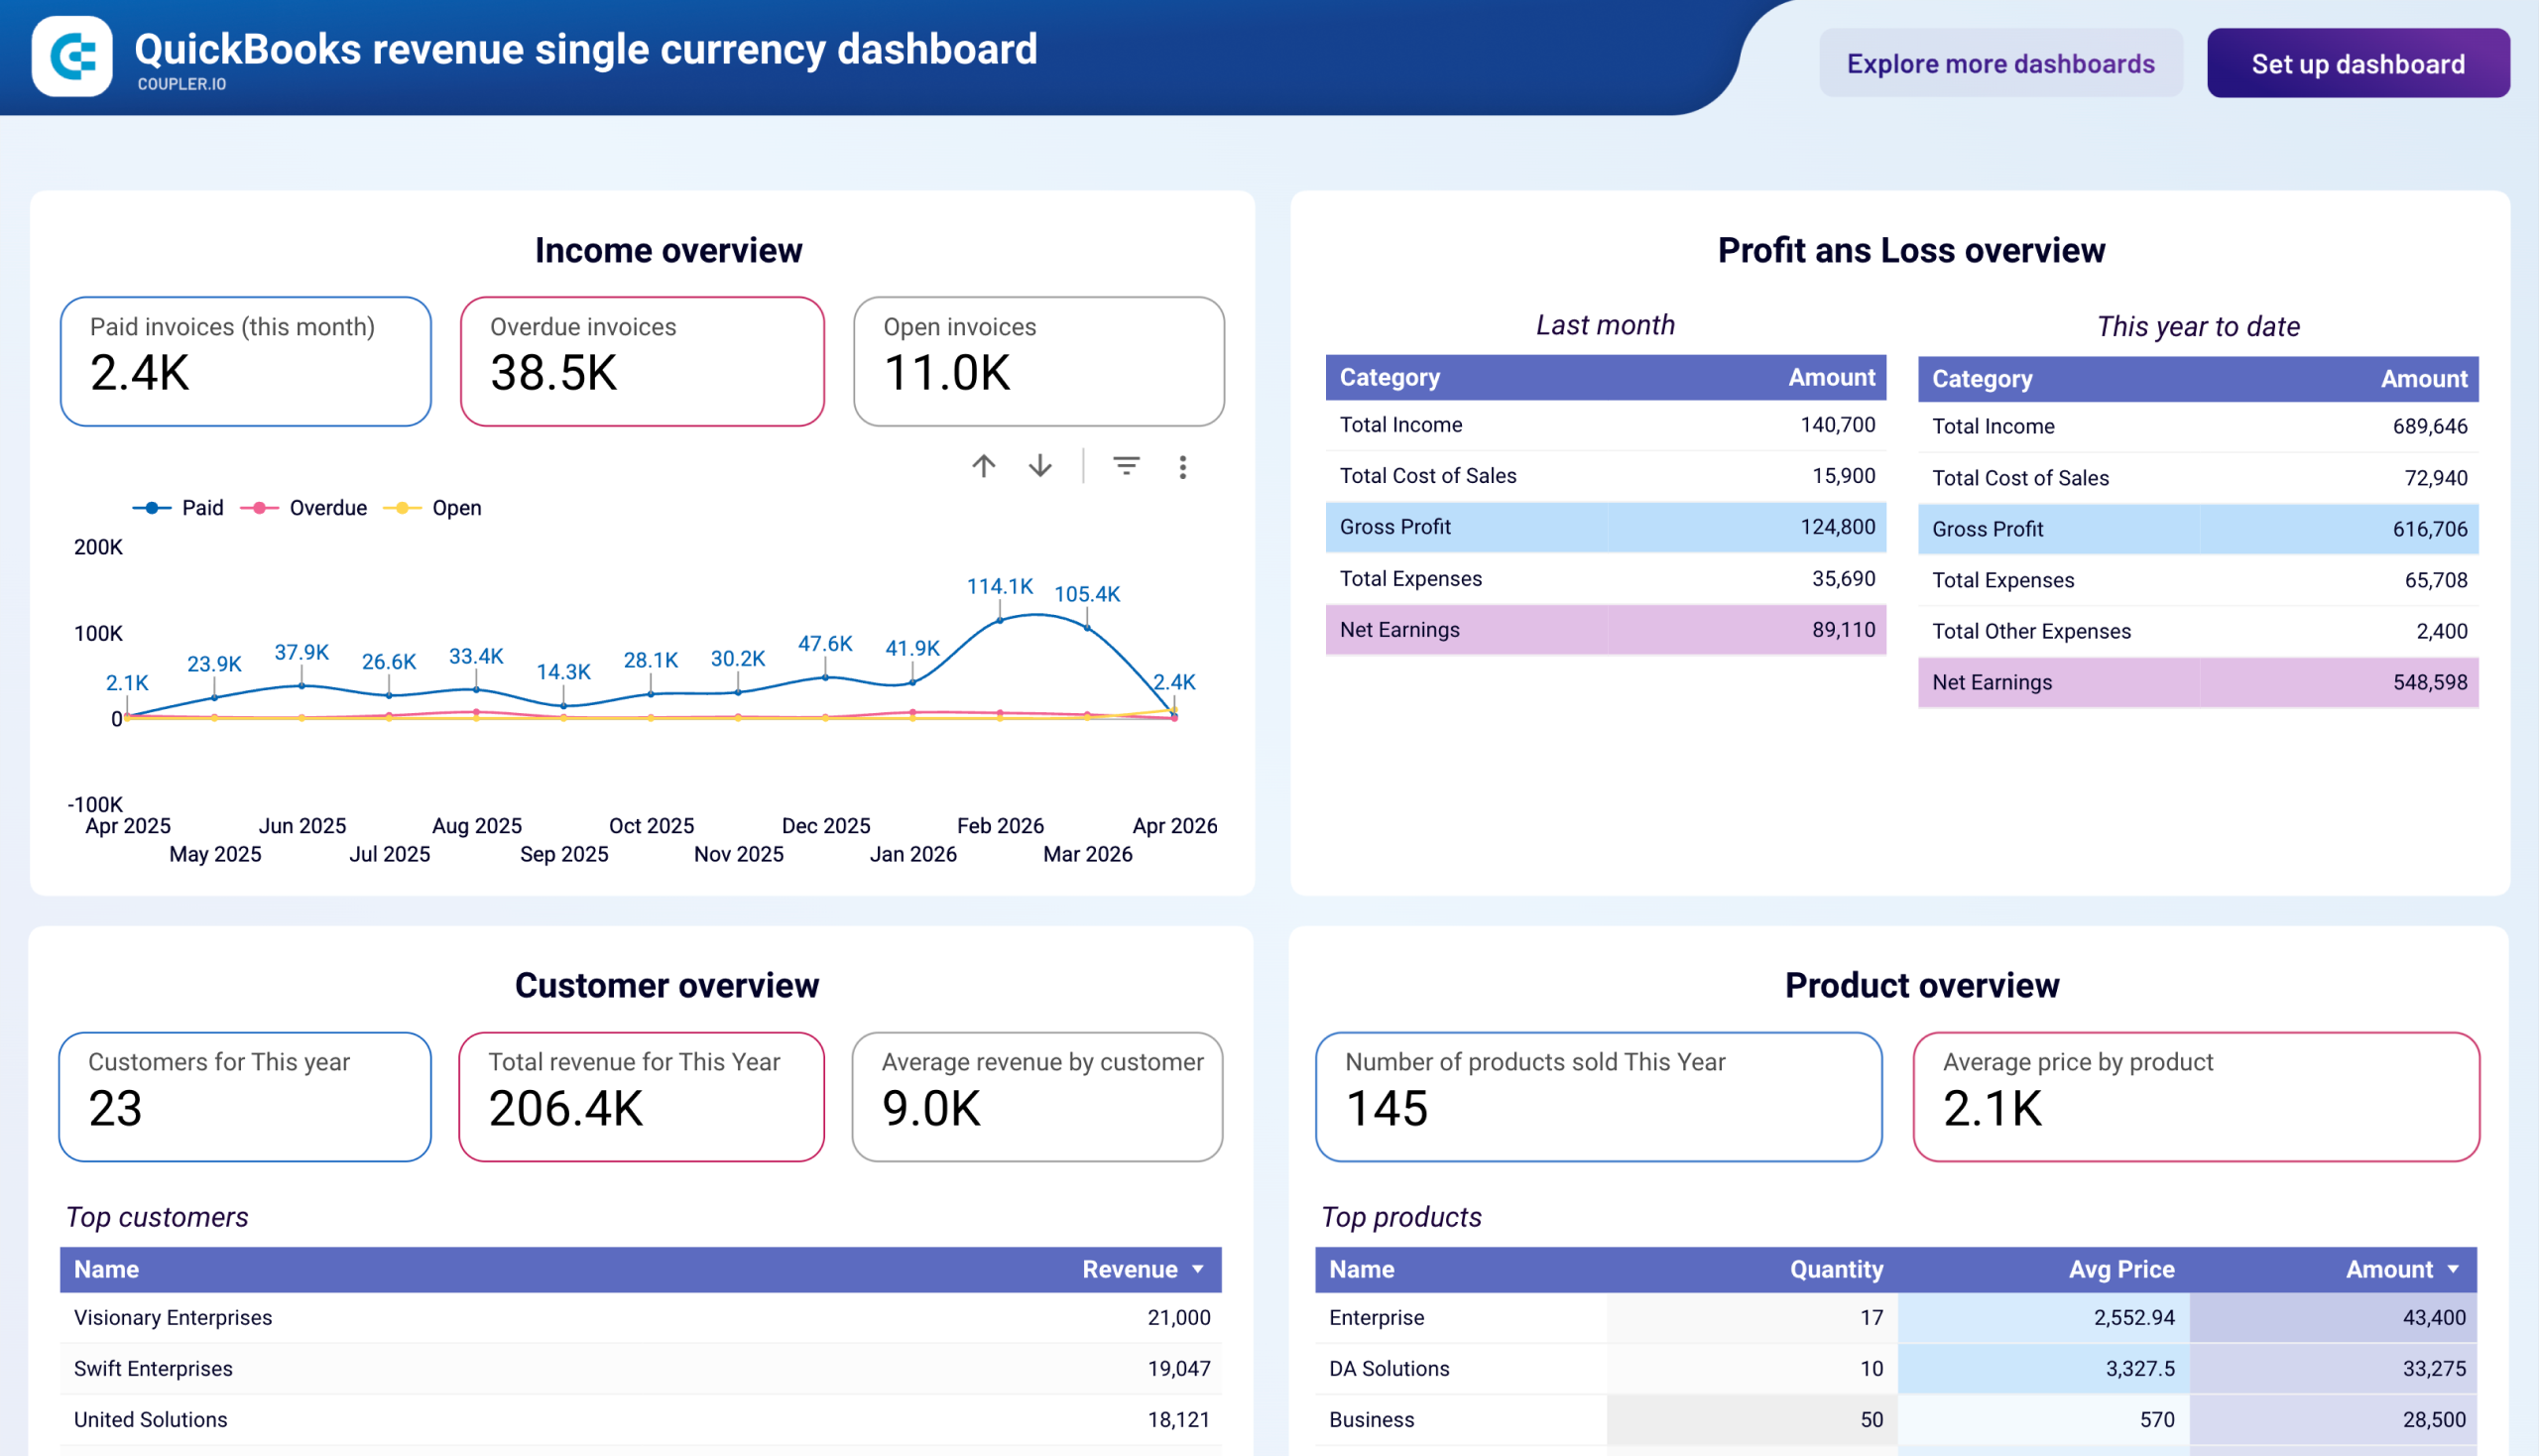
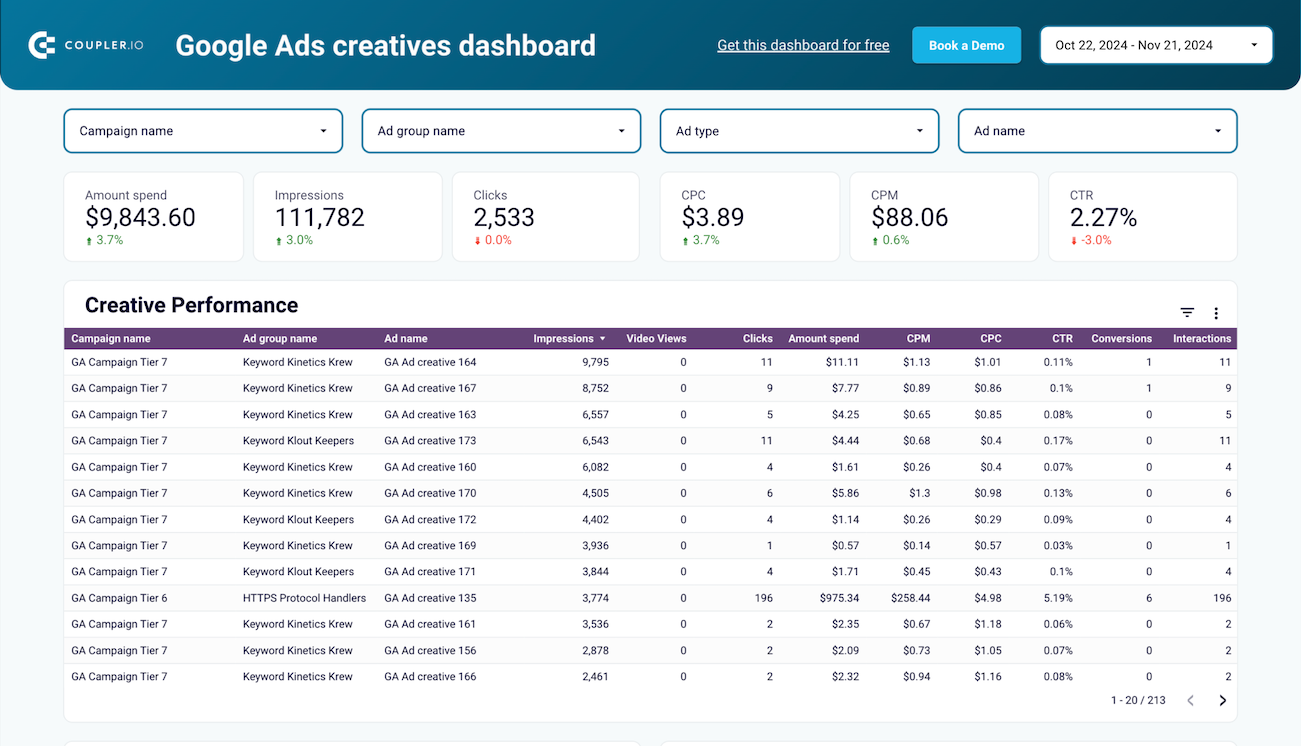
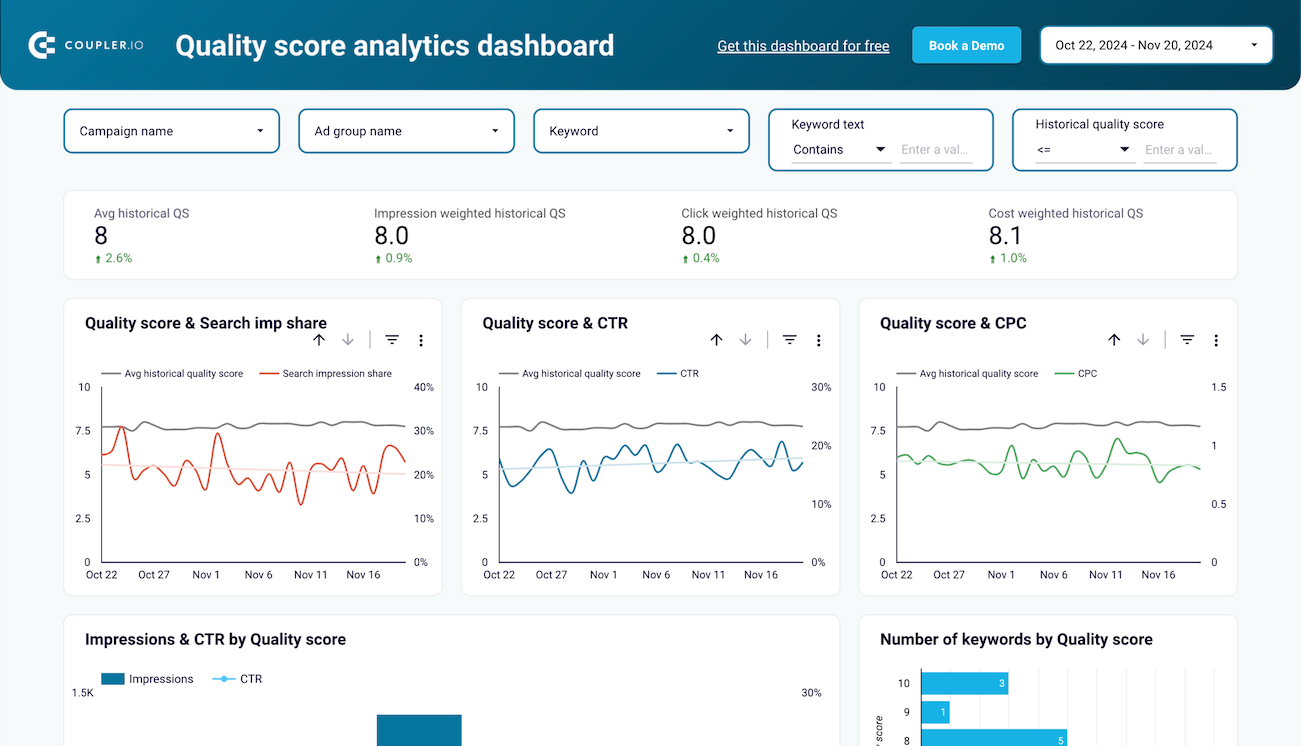
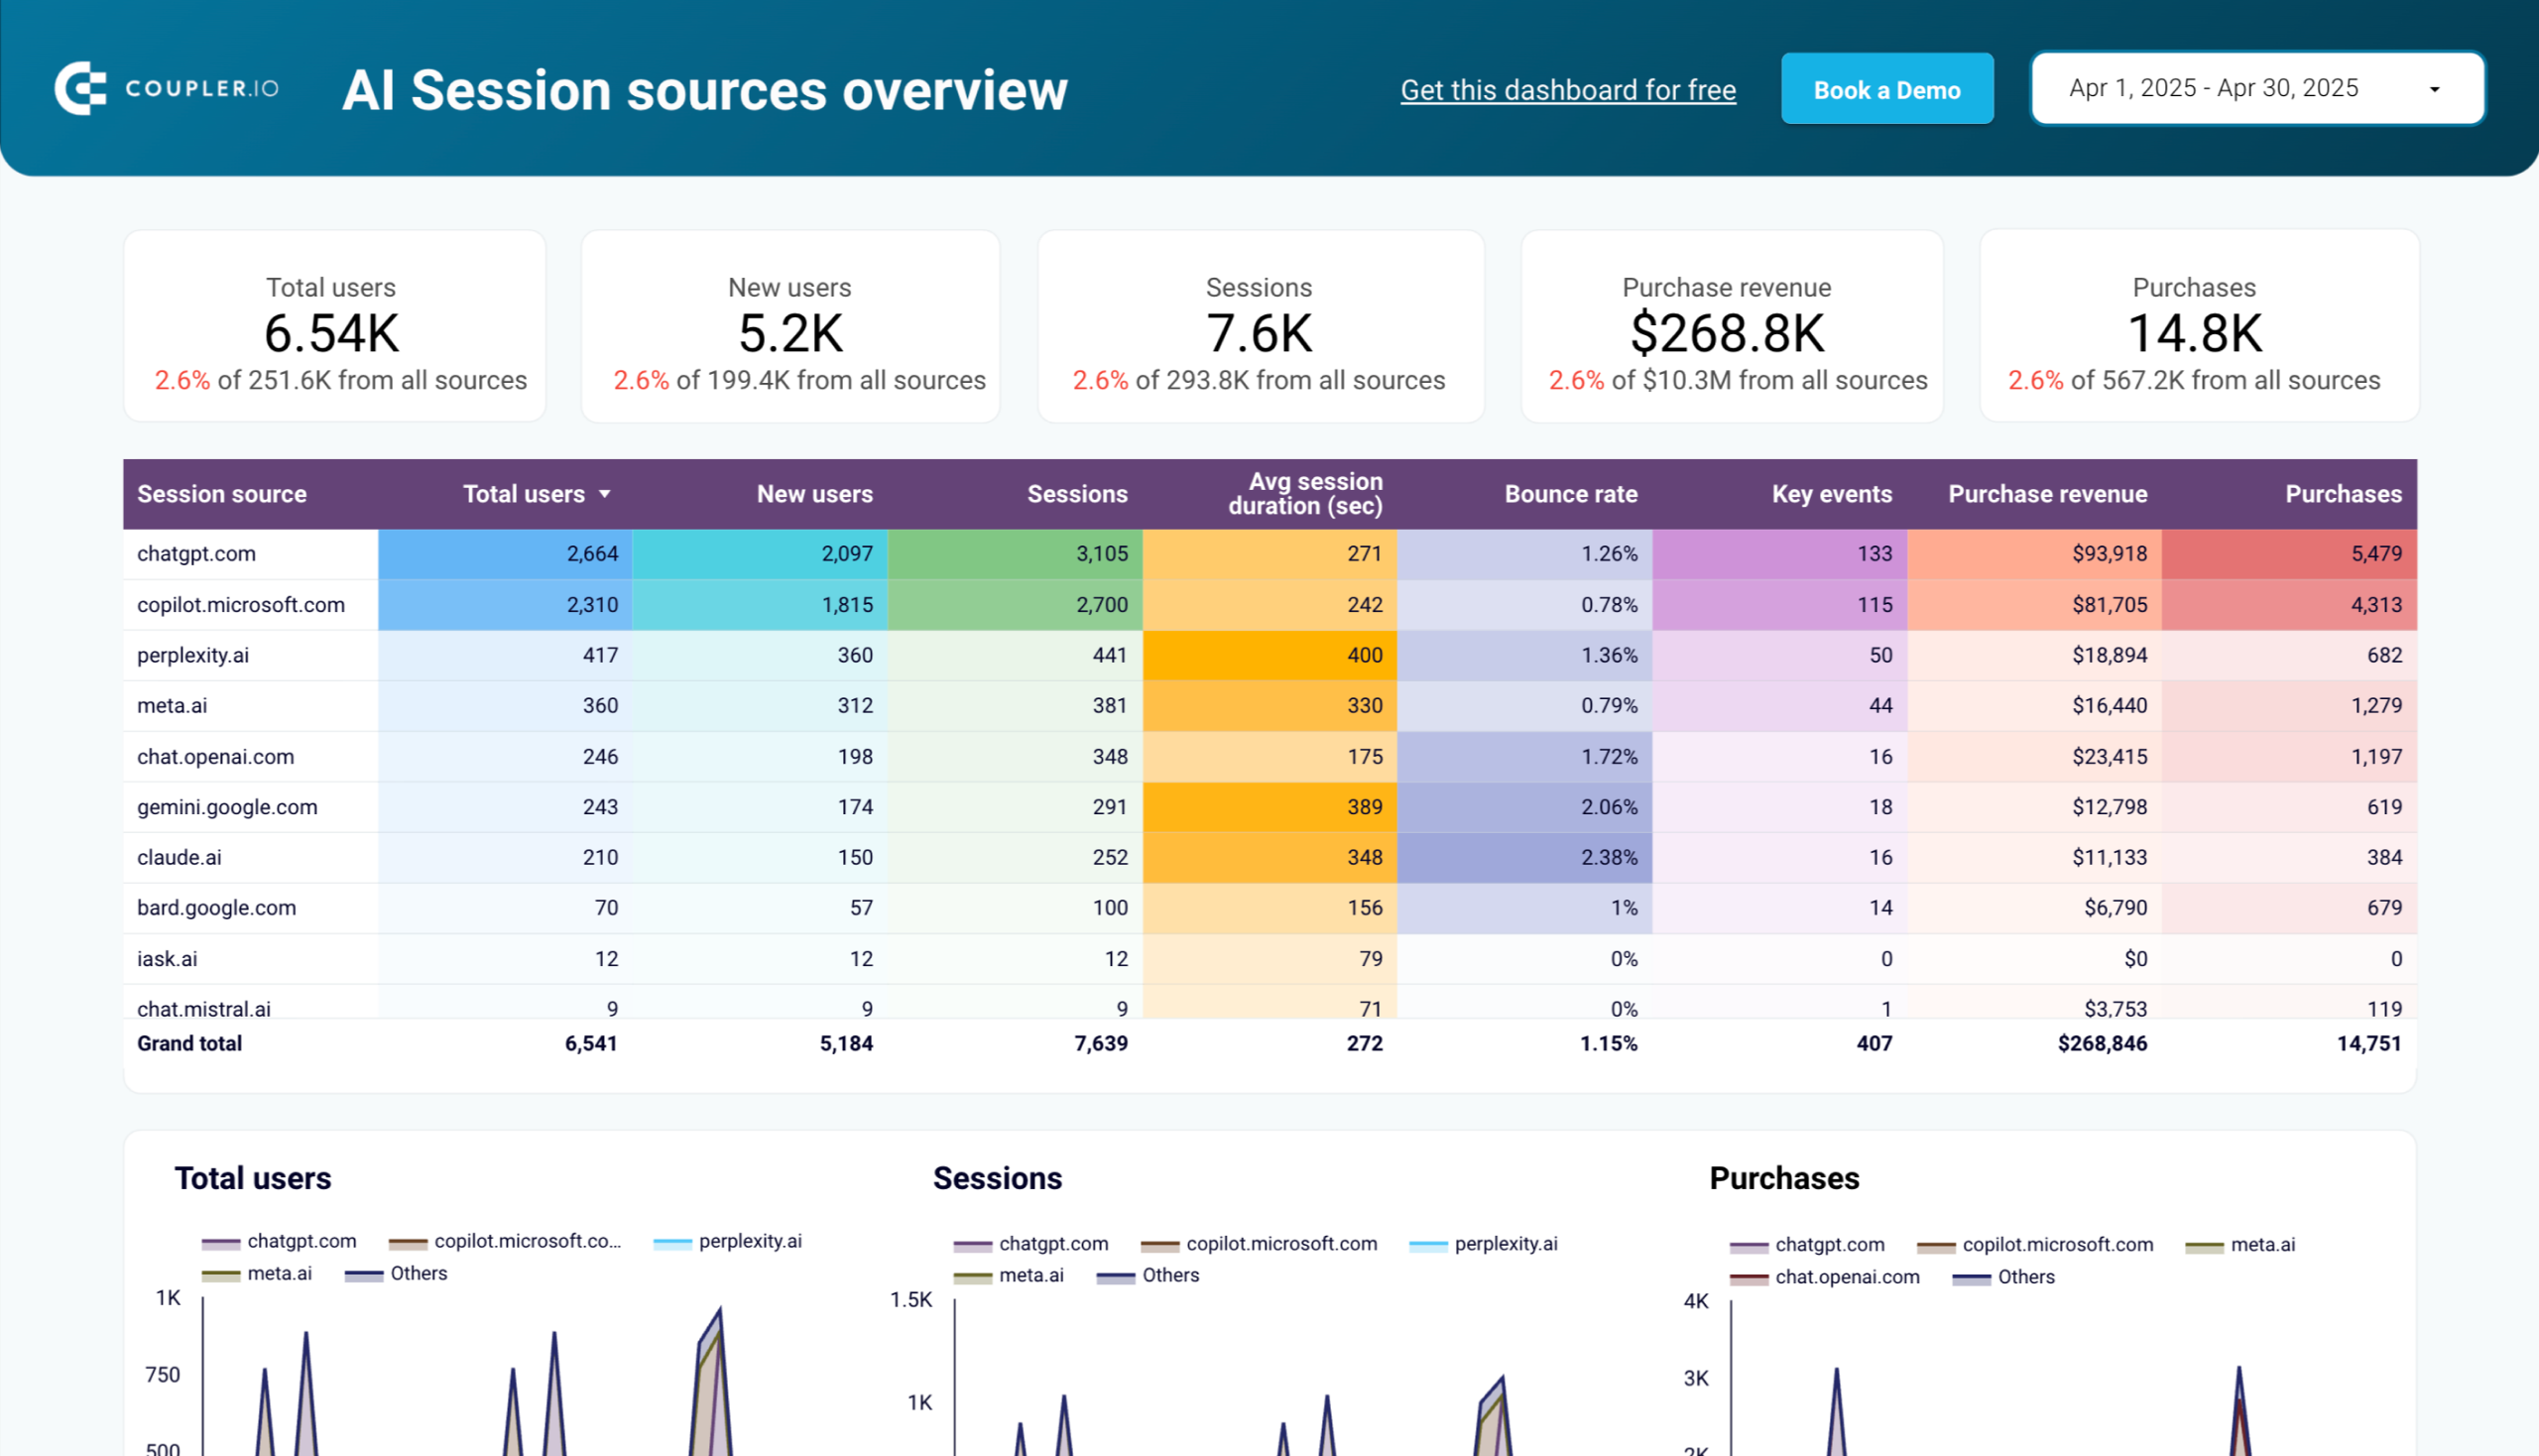
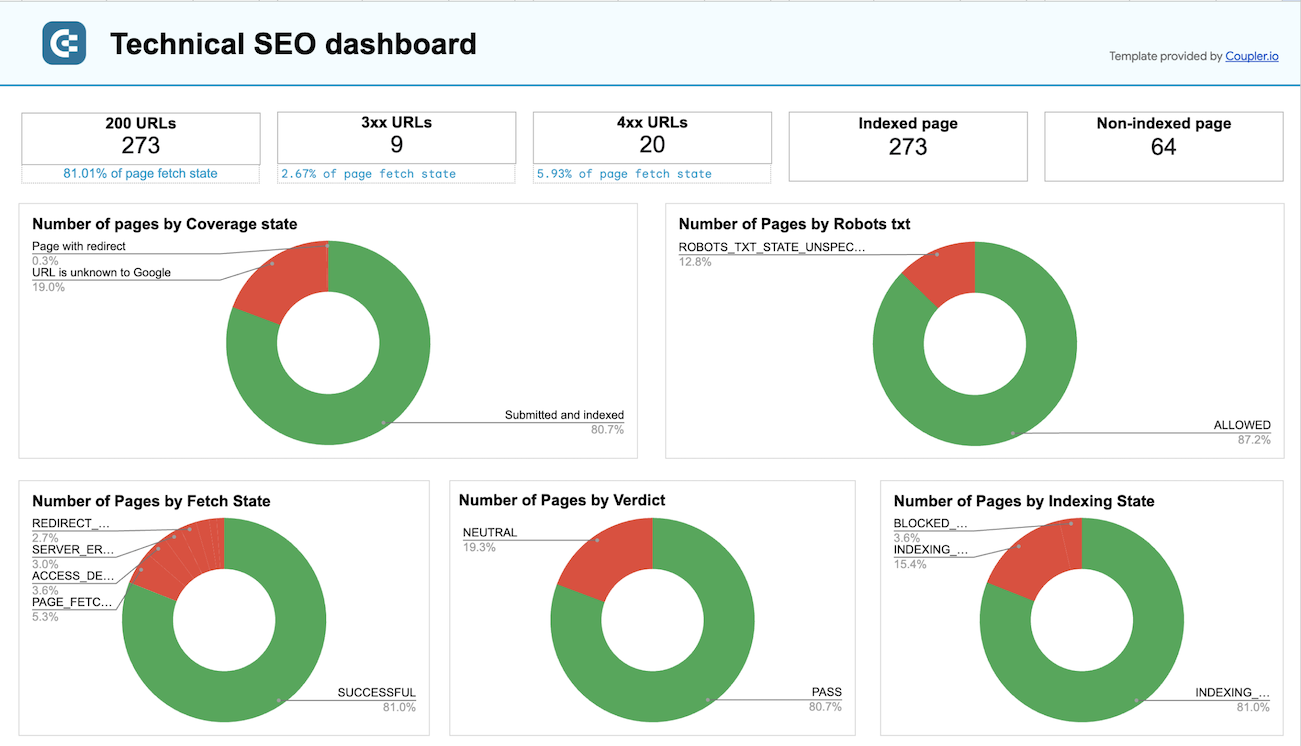
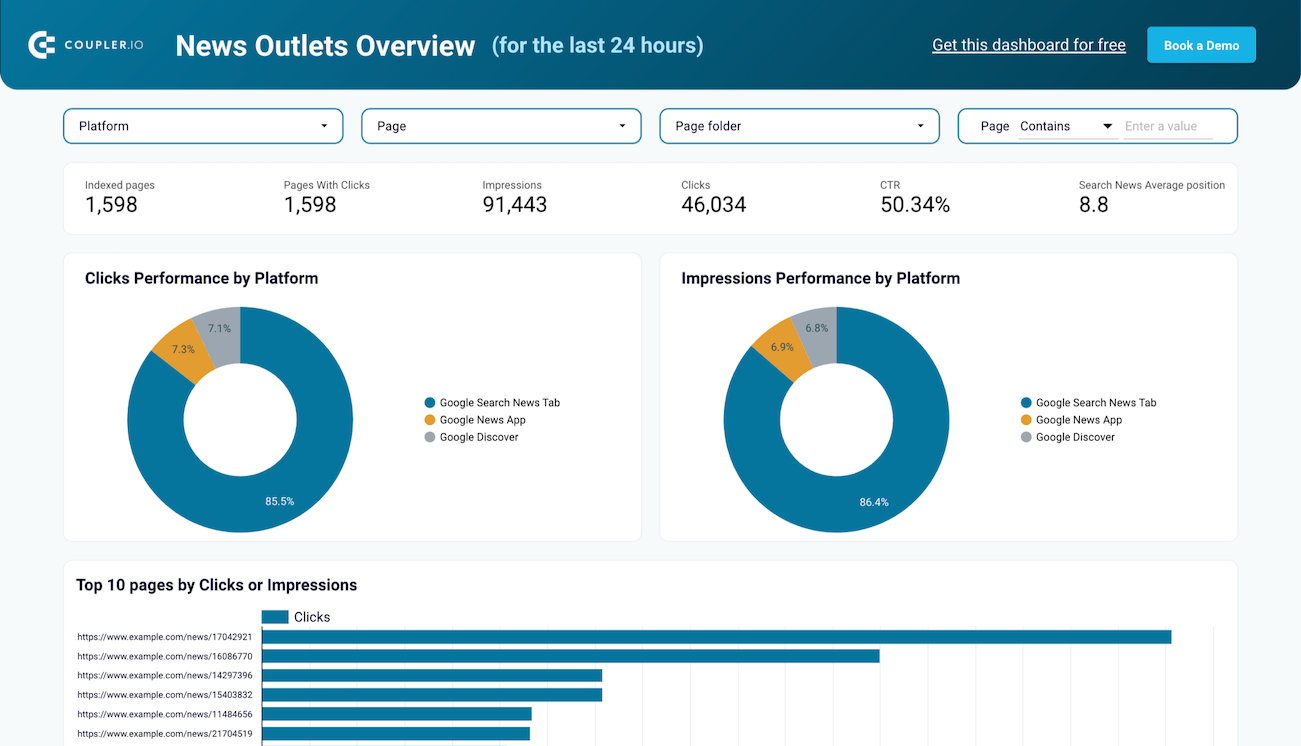
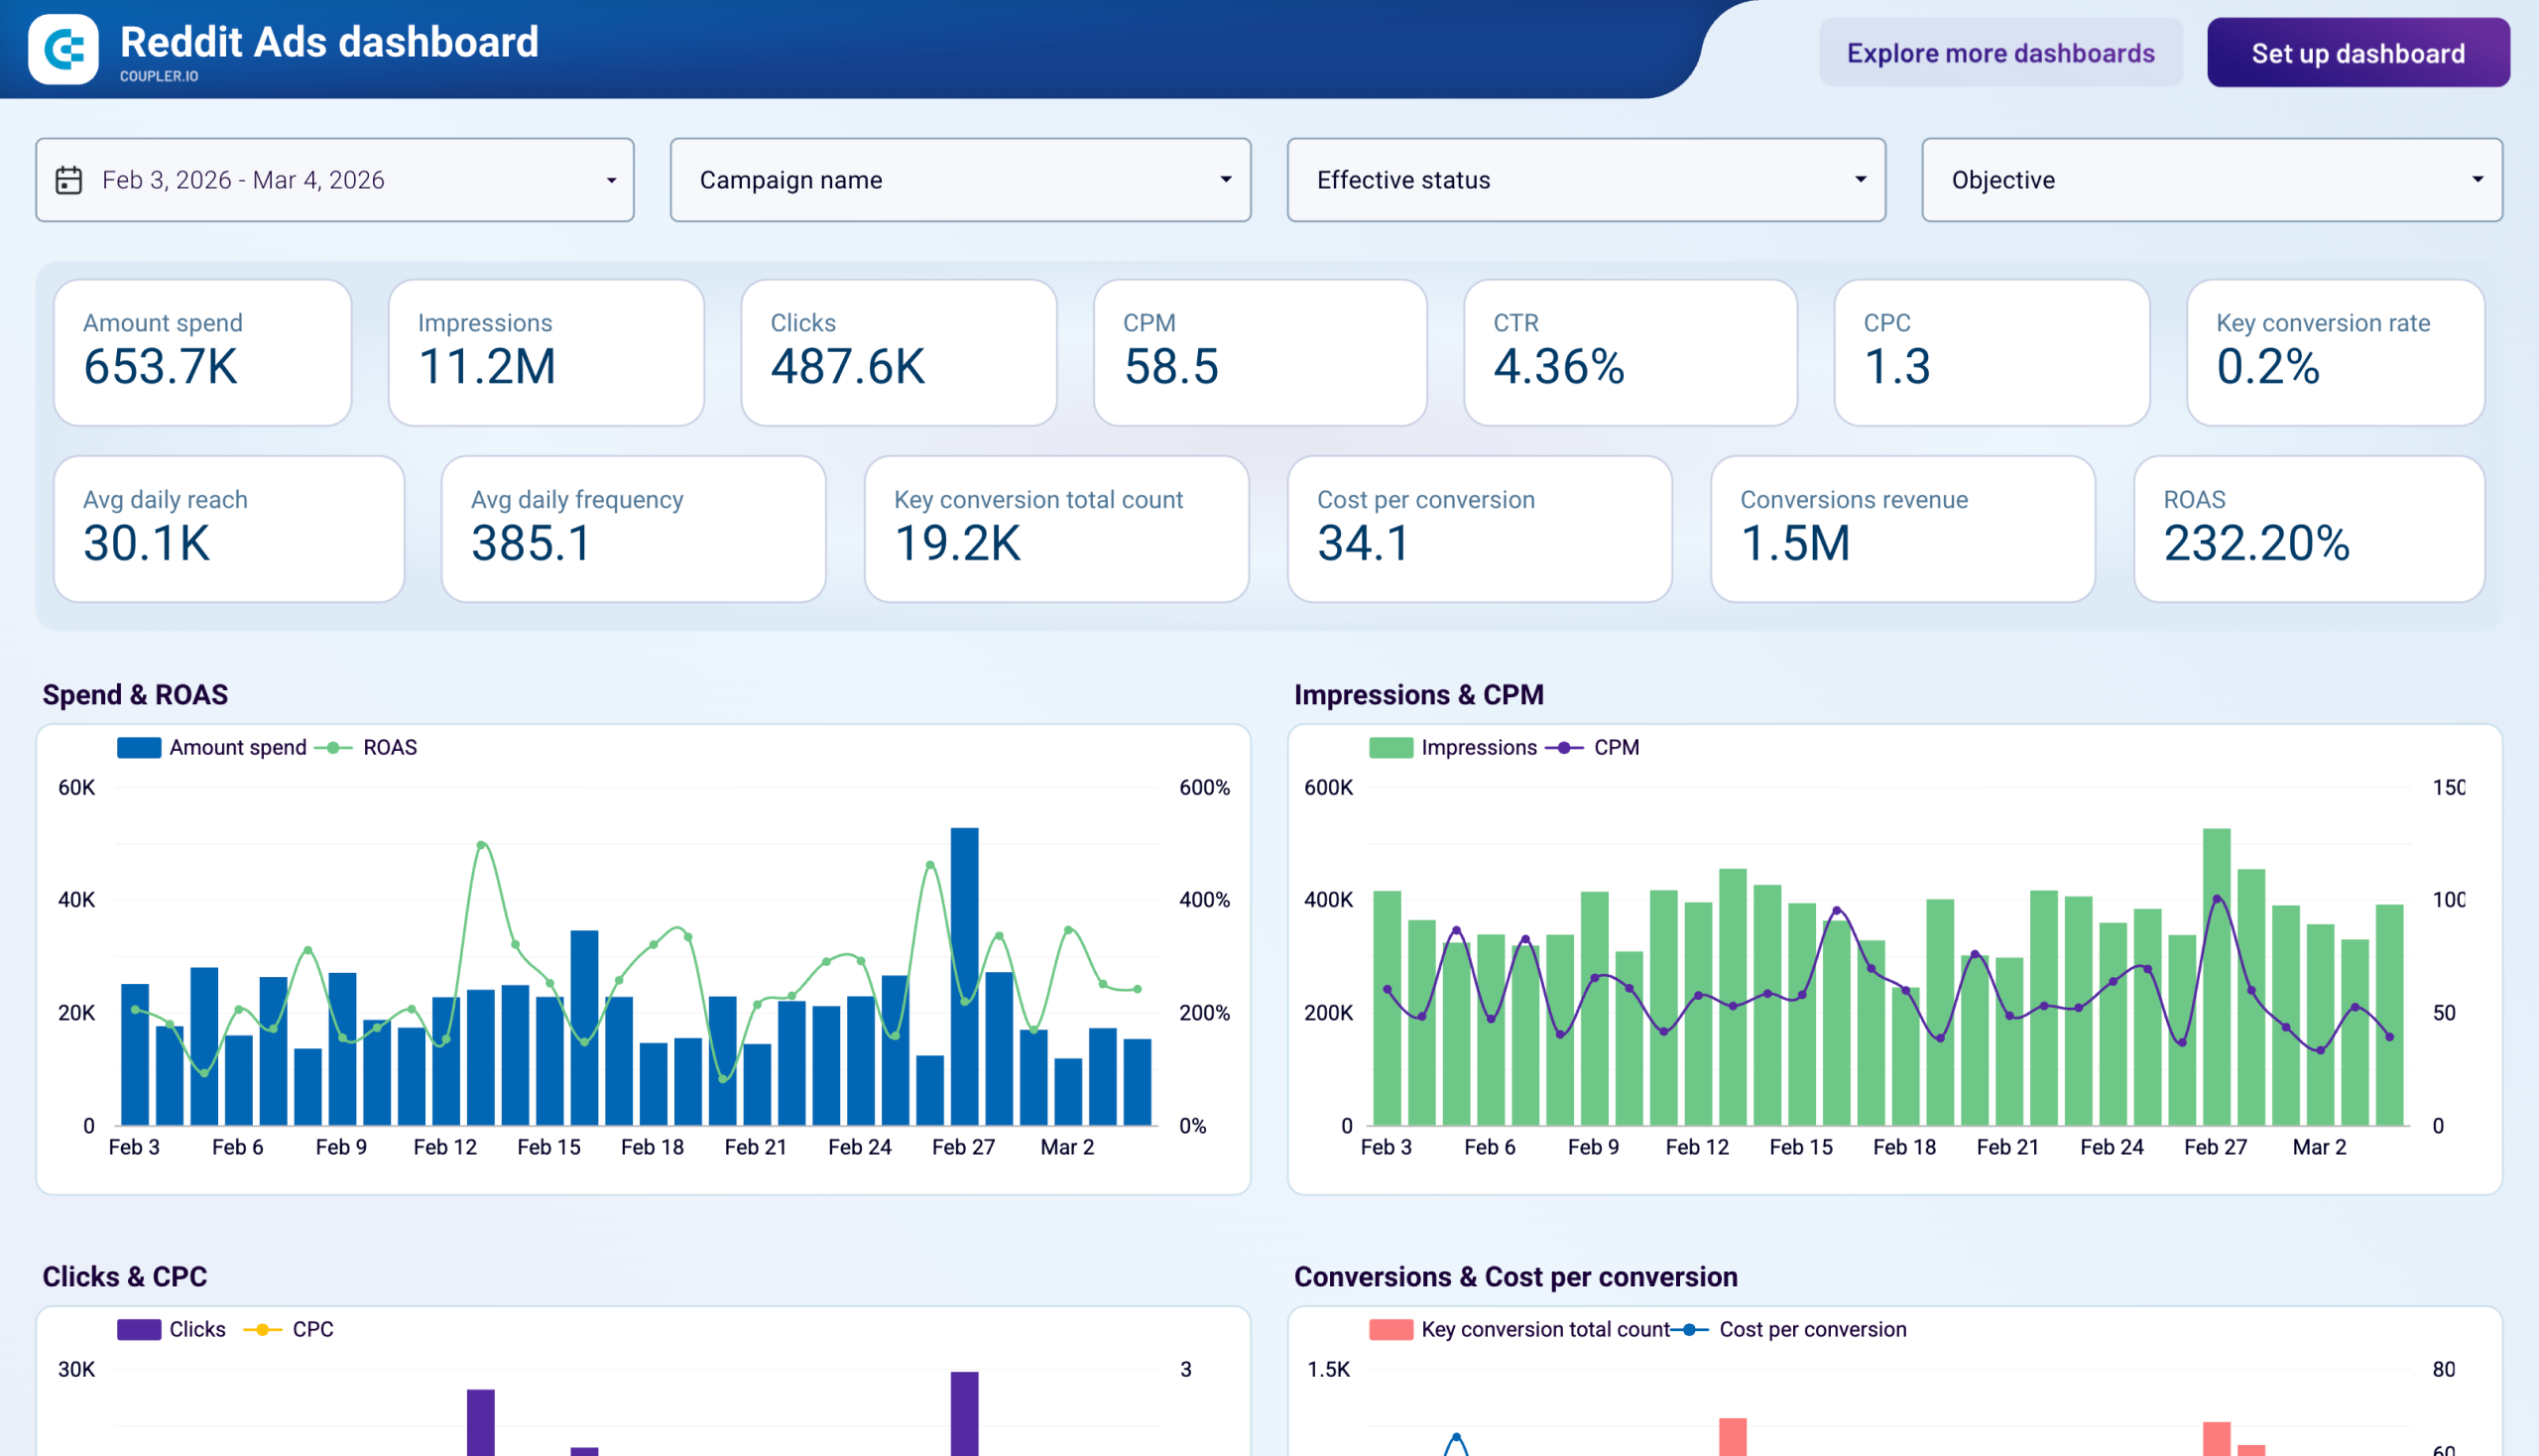
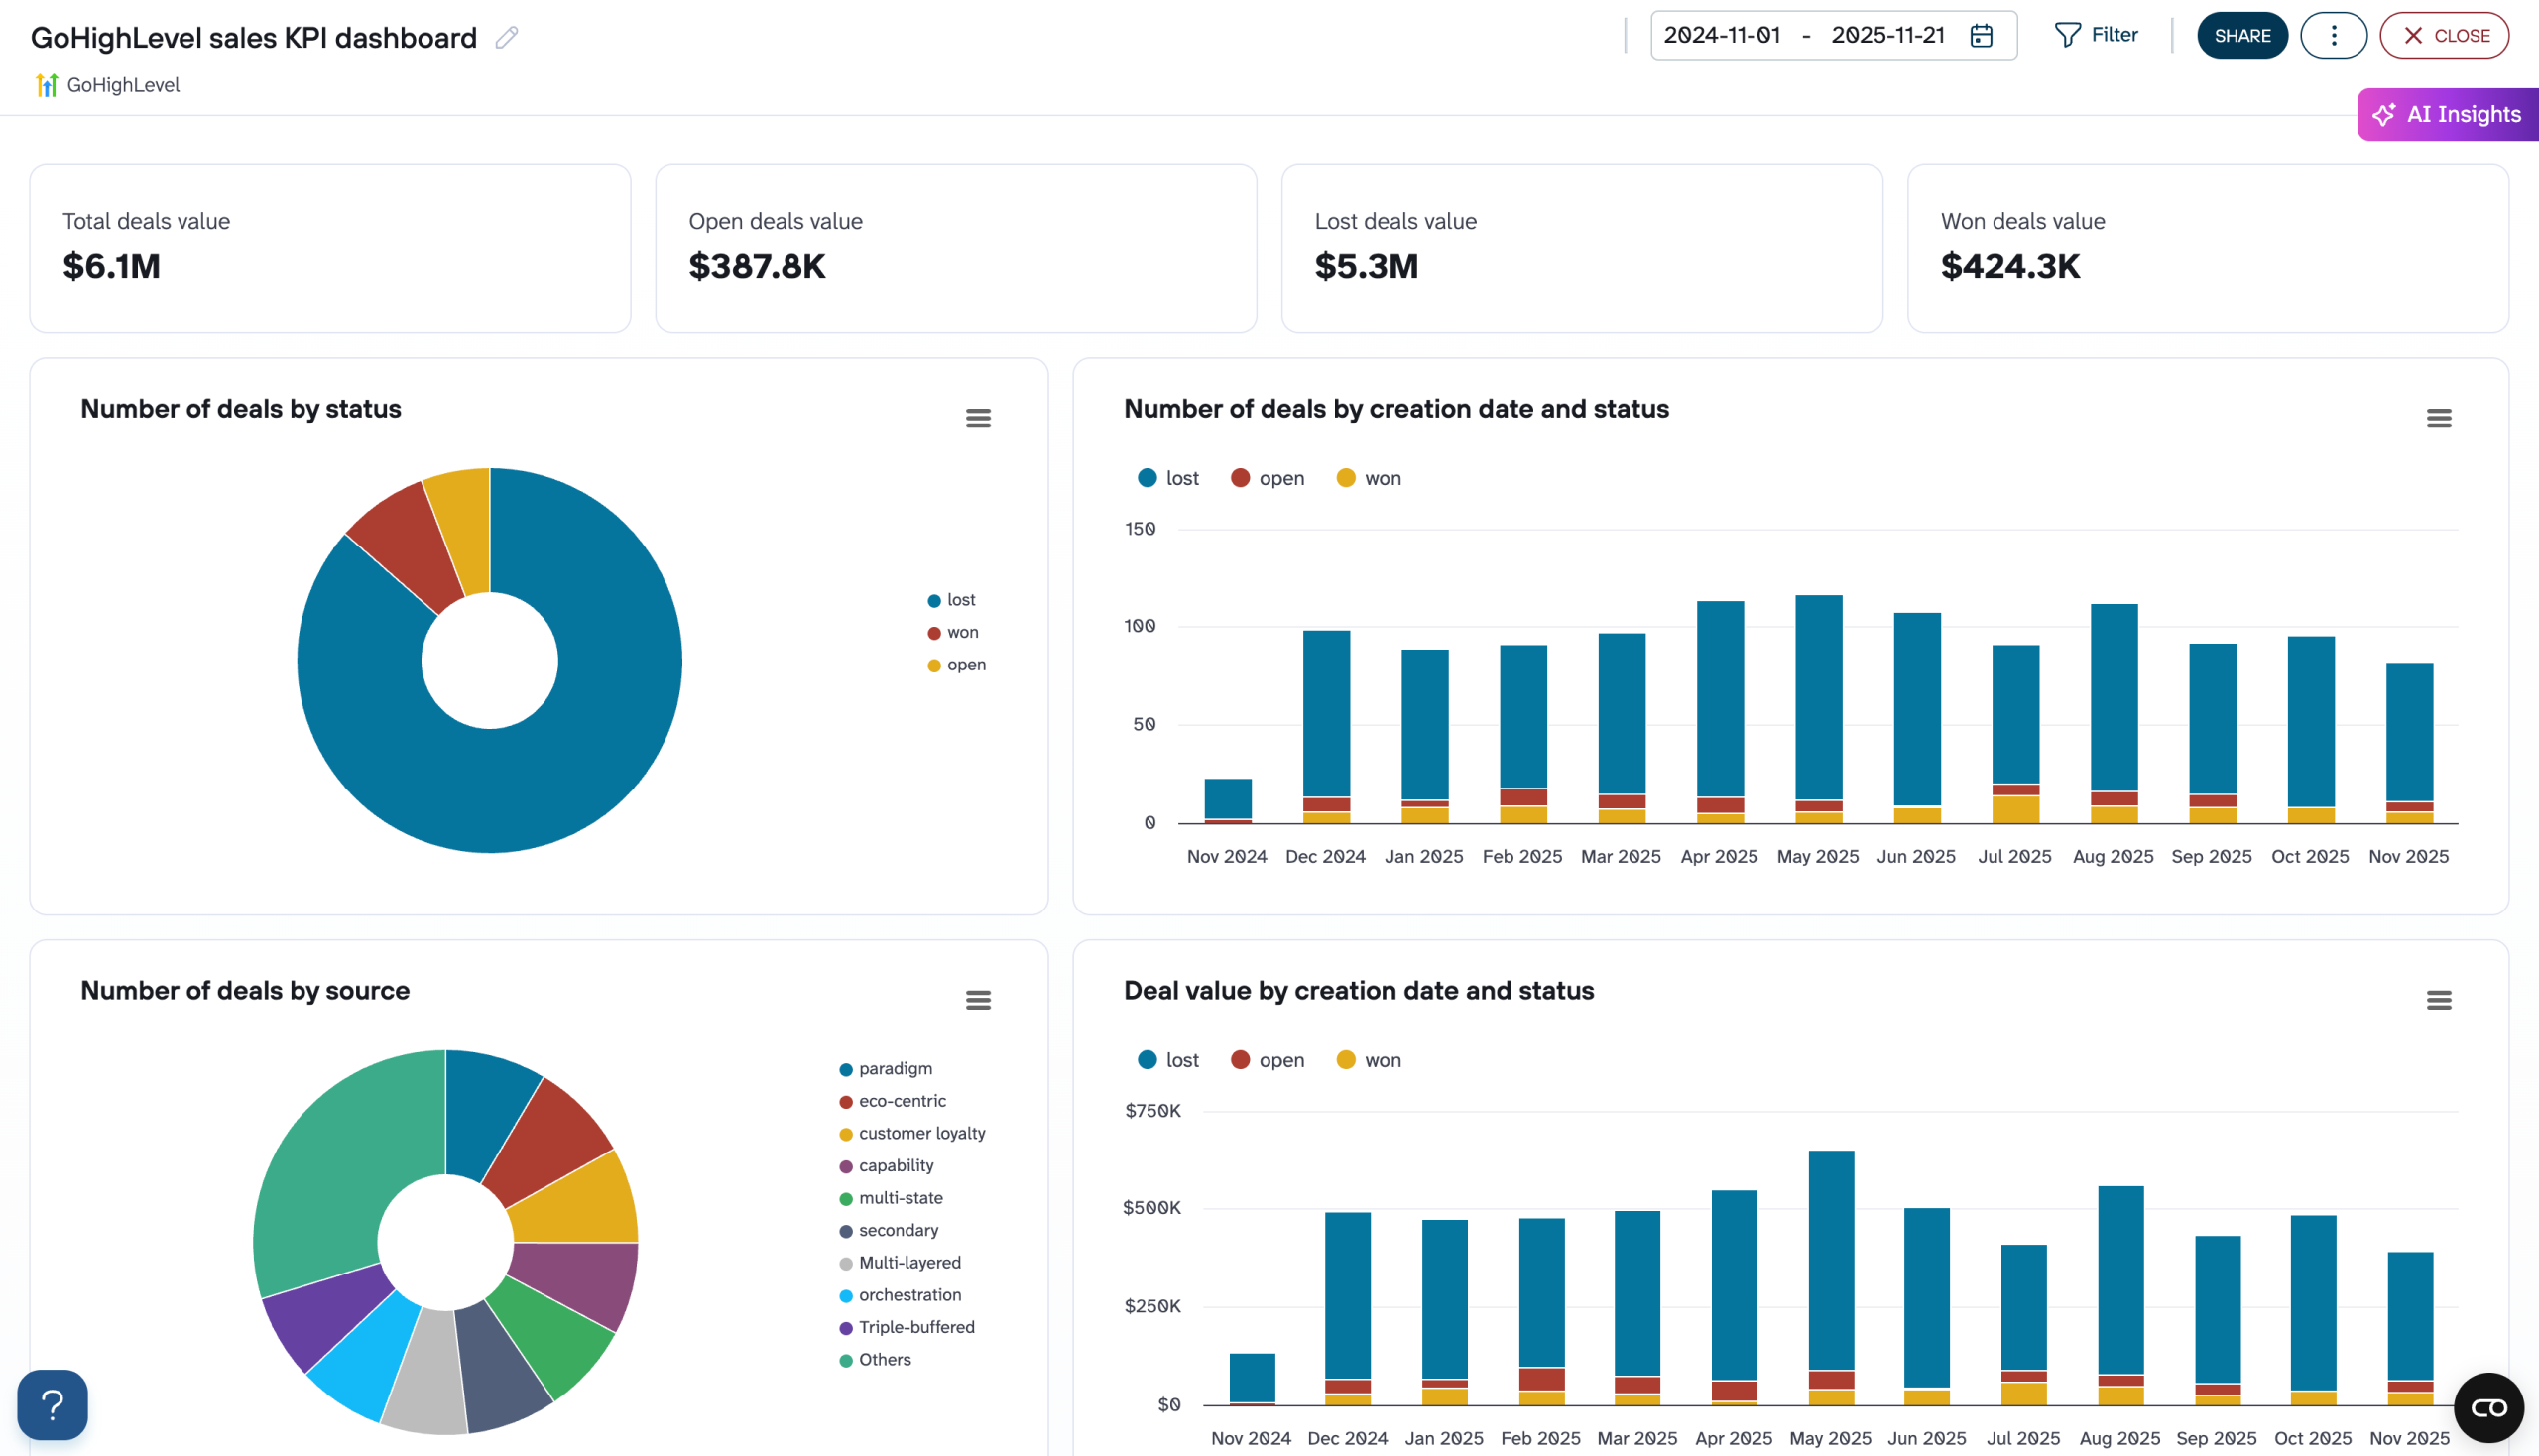
Analyze the performance of each channel in a single interface

Combine campaigns from different channels to compare the cost and impact
Stand out as a data-driven PPC Expert
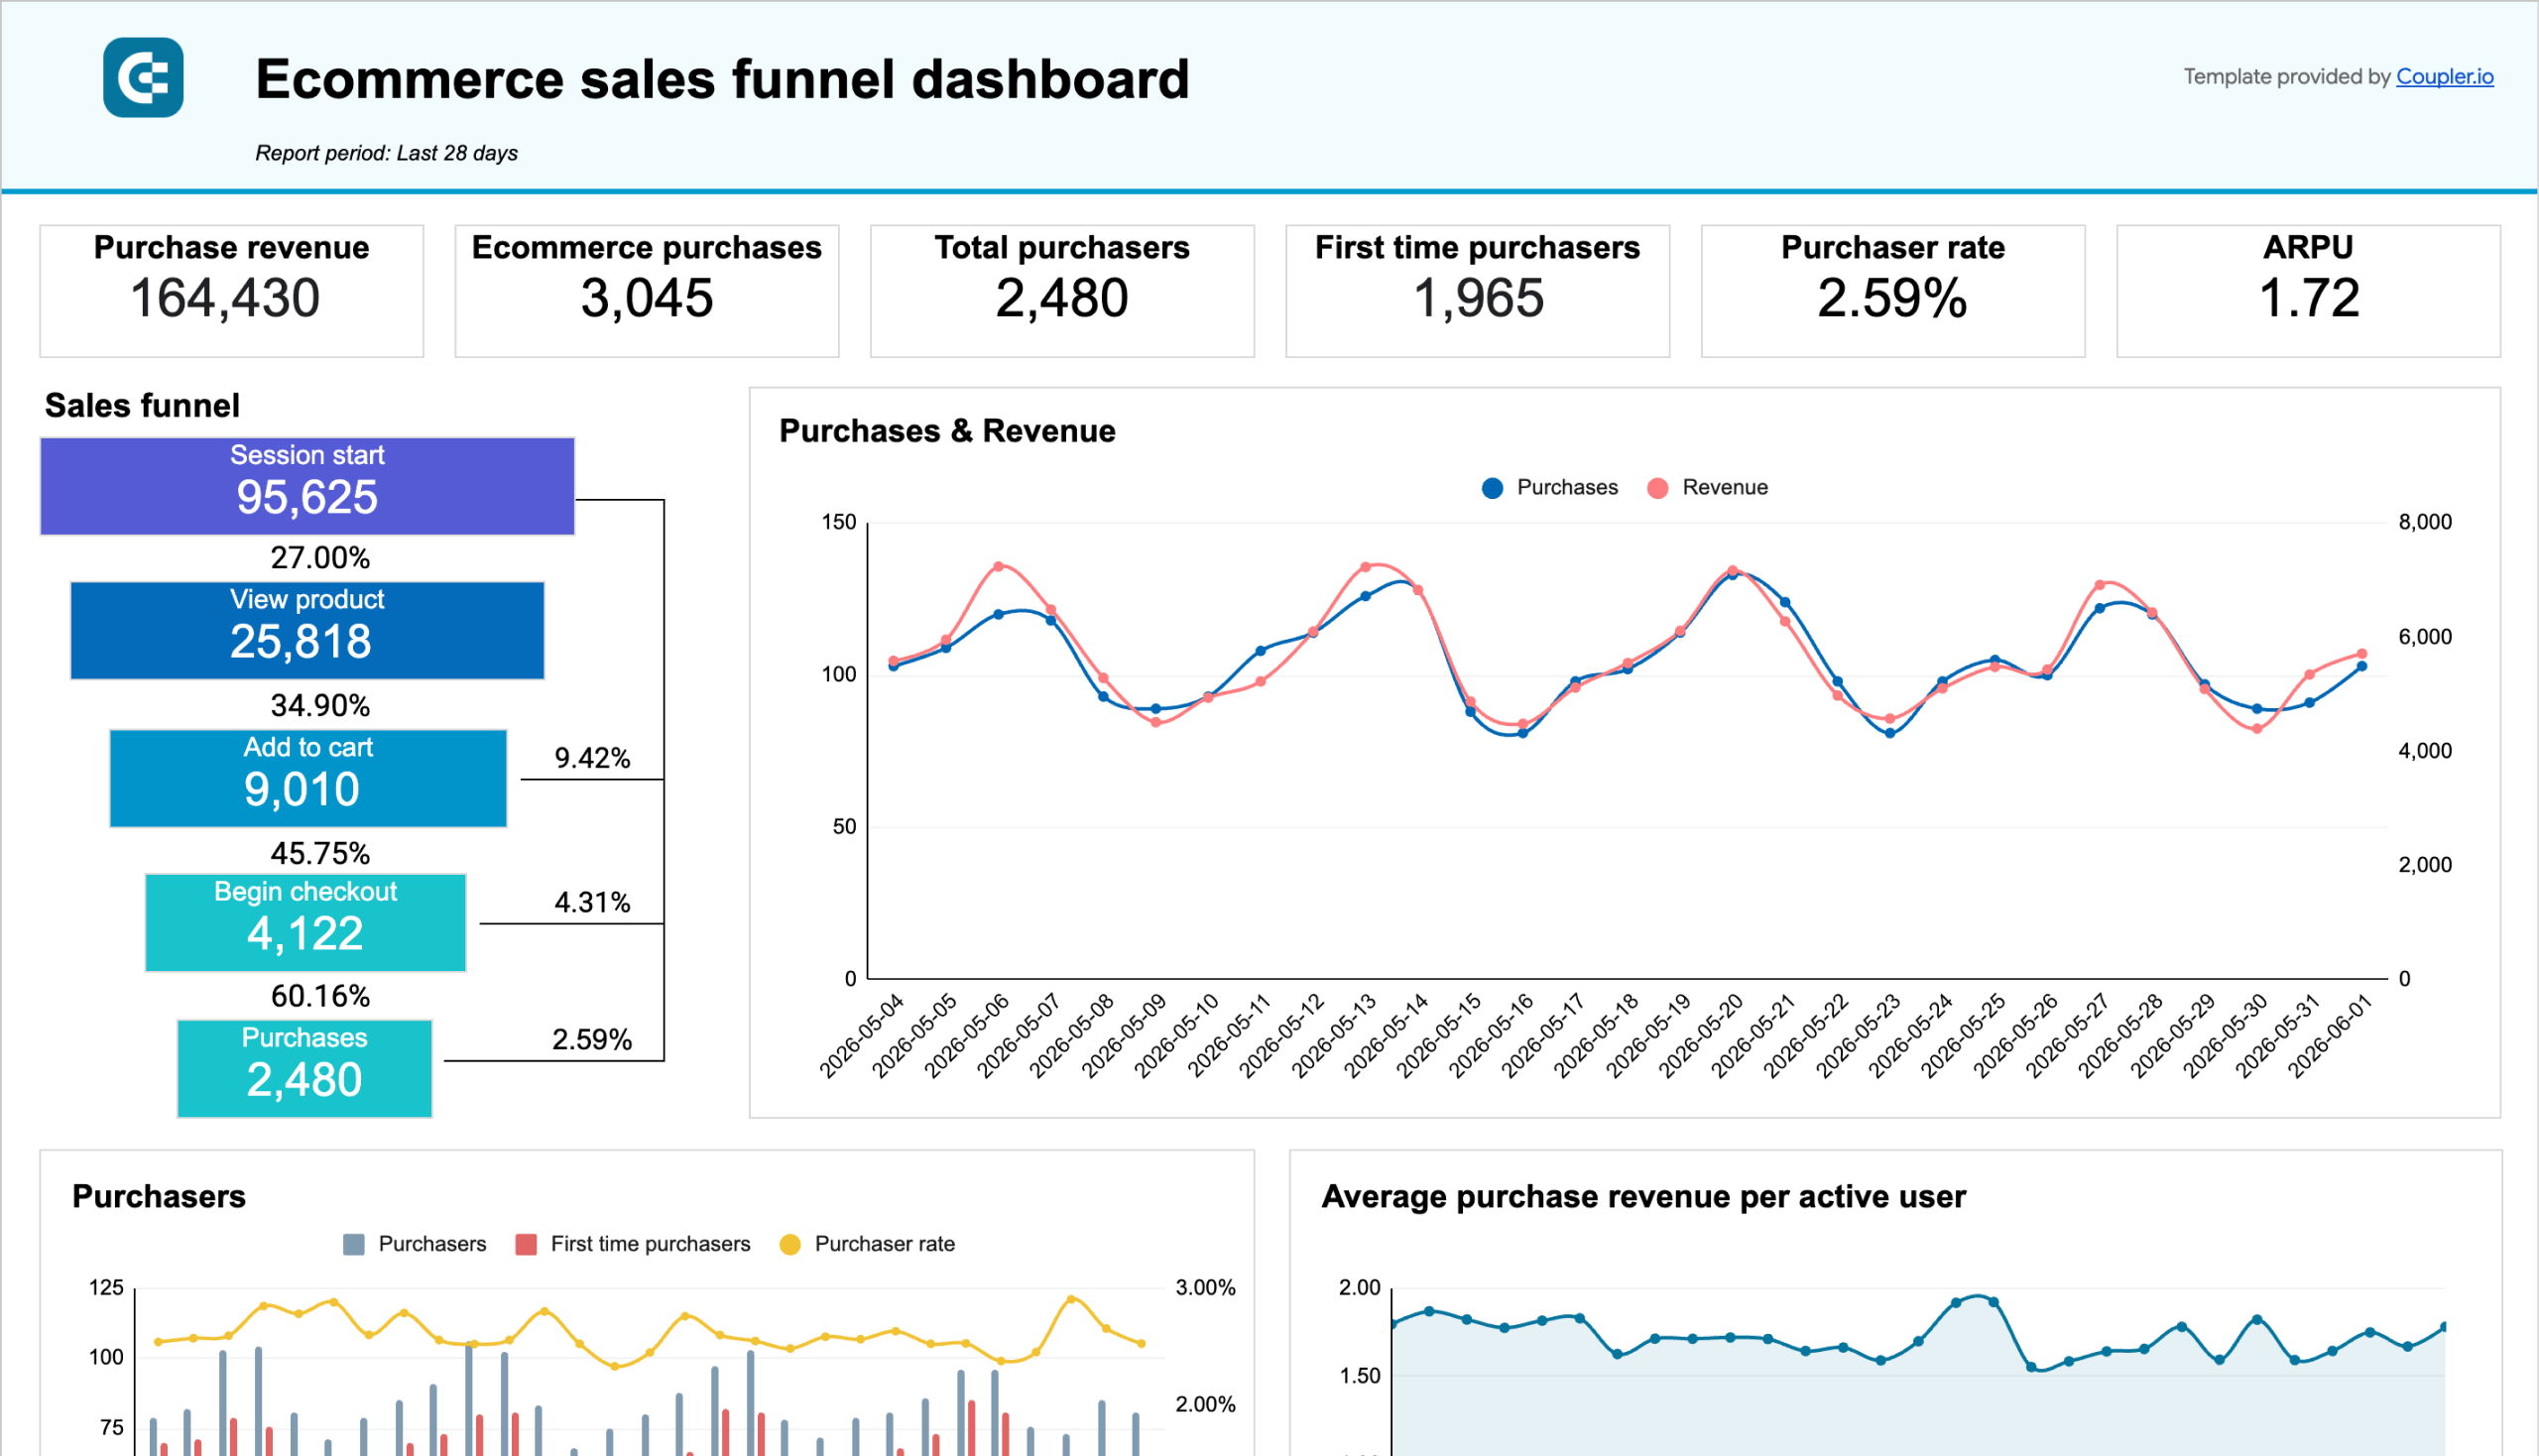
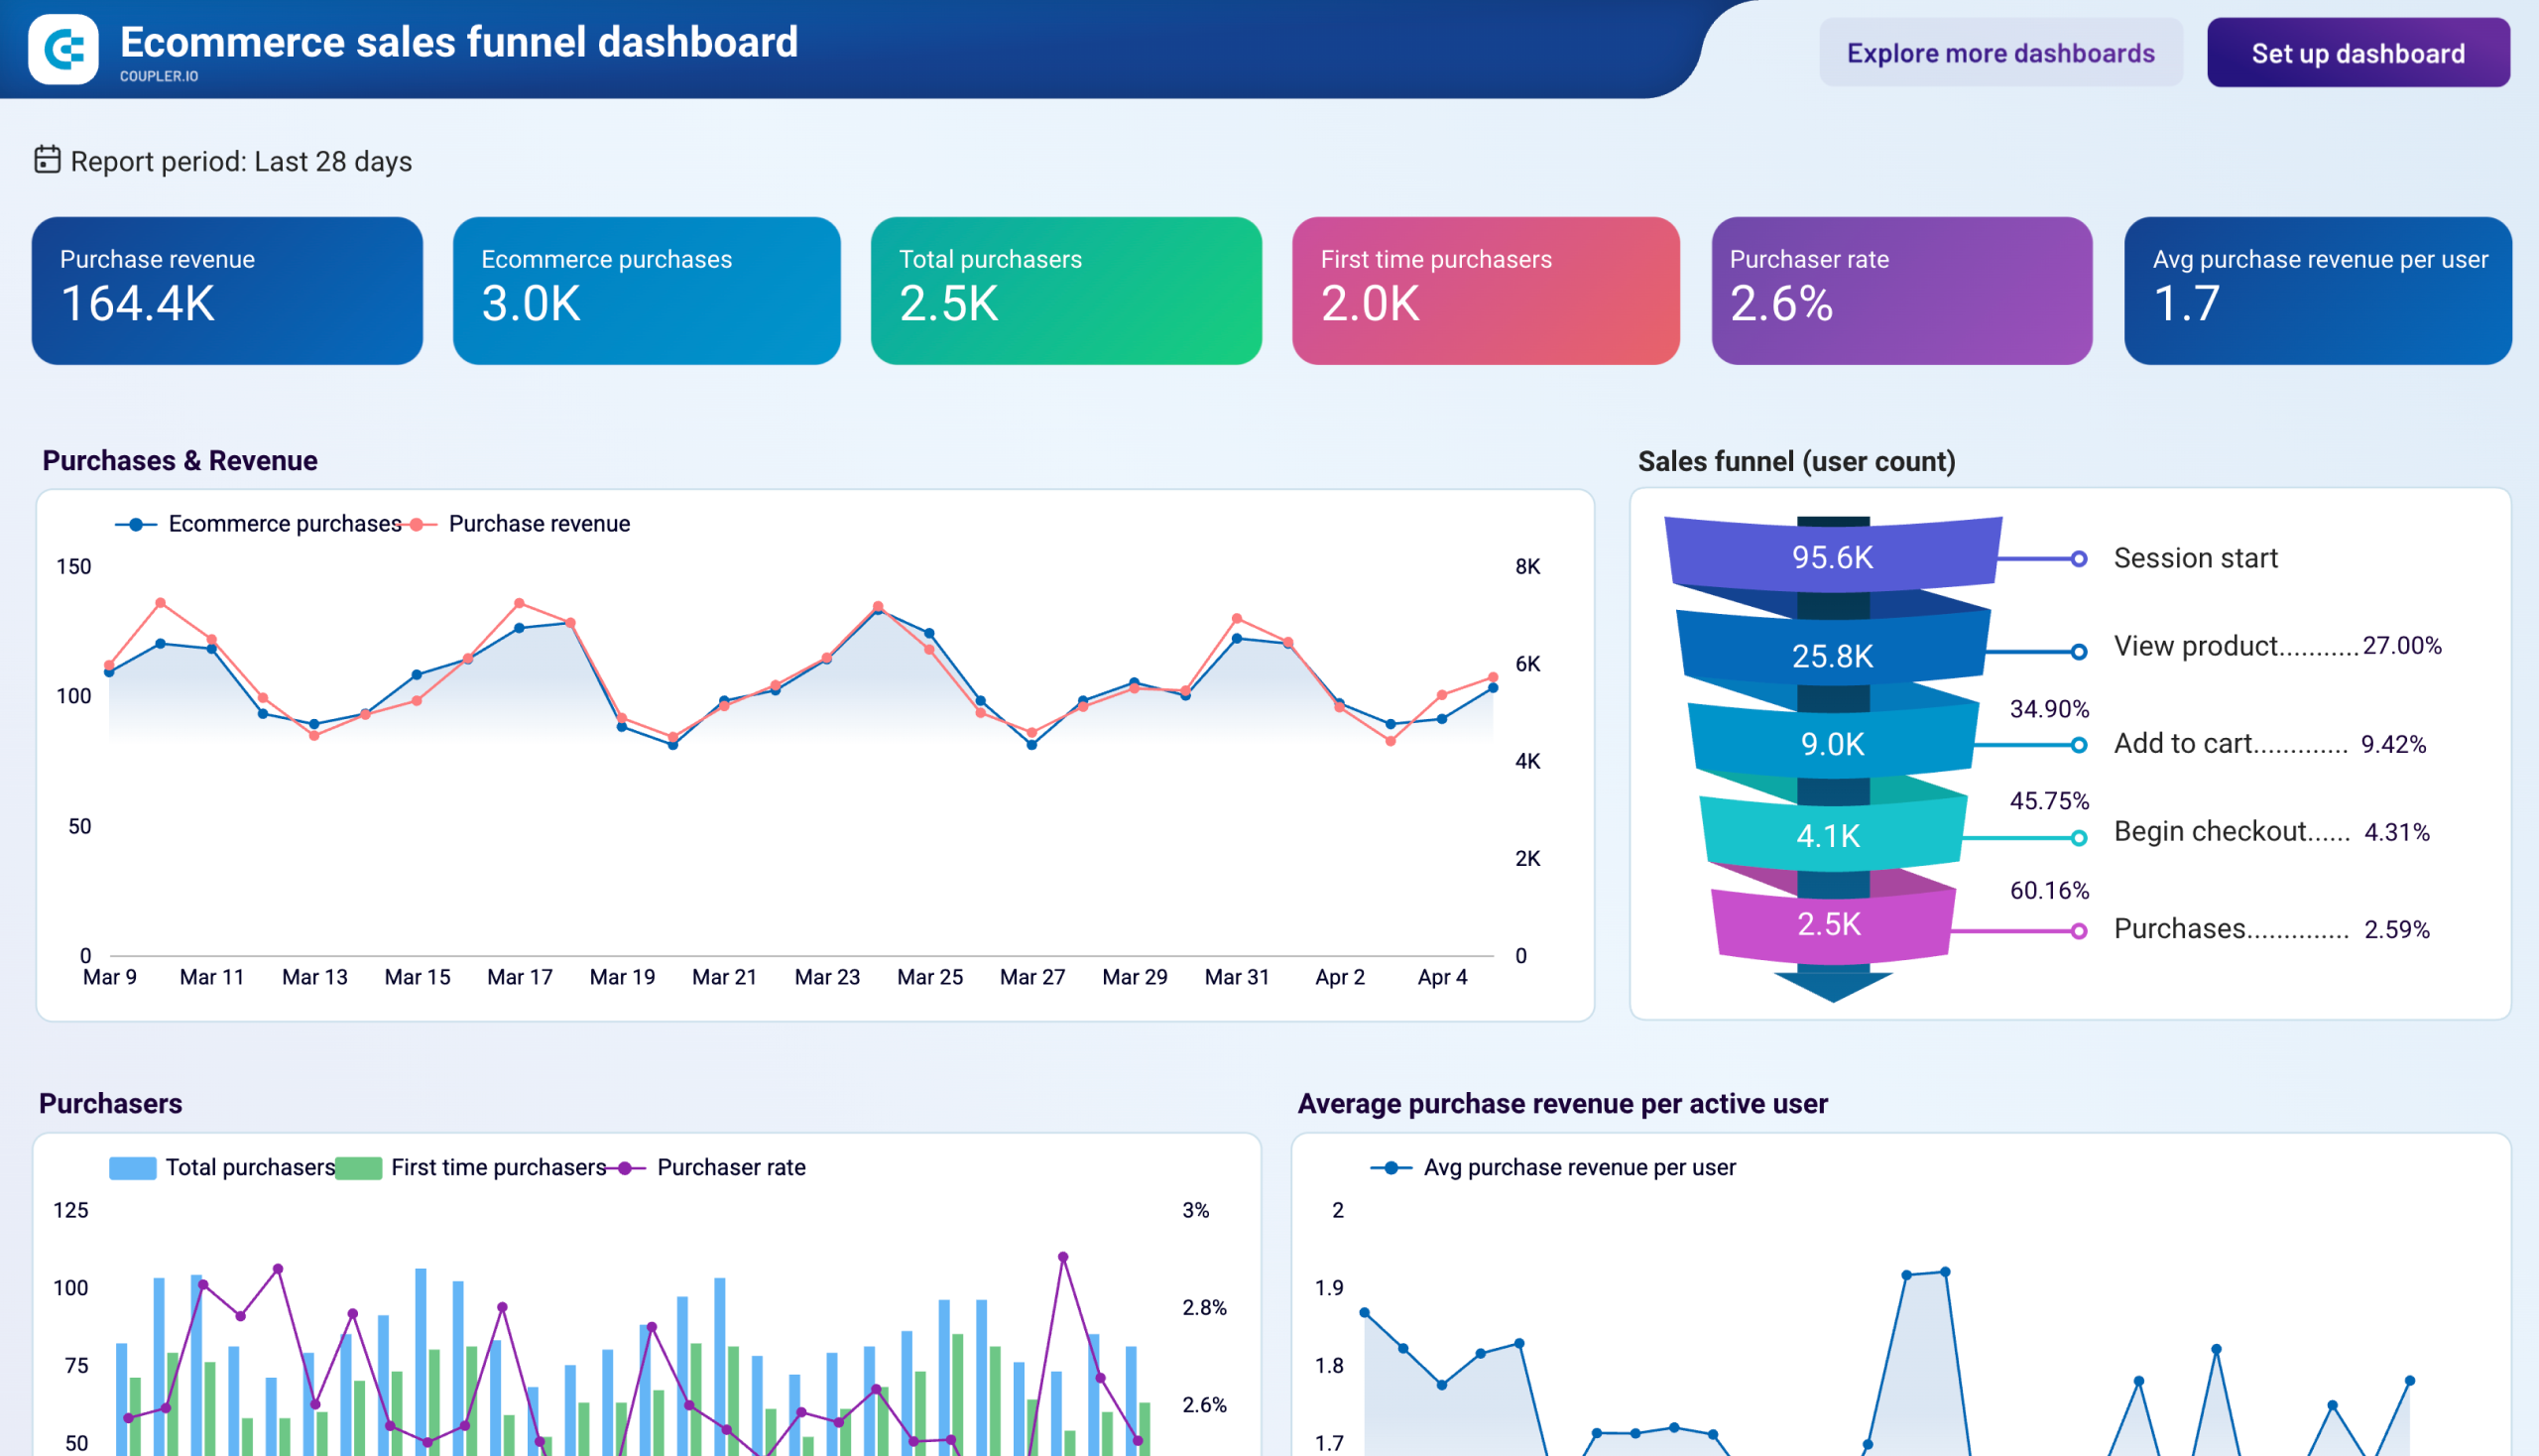
Improve conversion rates
Increase ROAS
Remove manual reporting
Choose what to scale
Avoid overspending
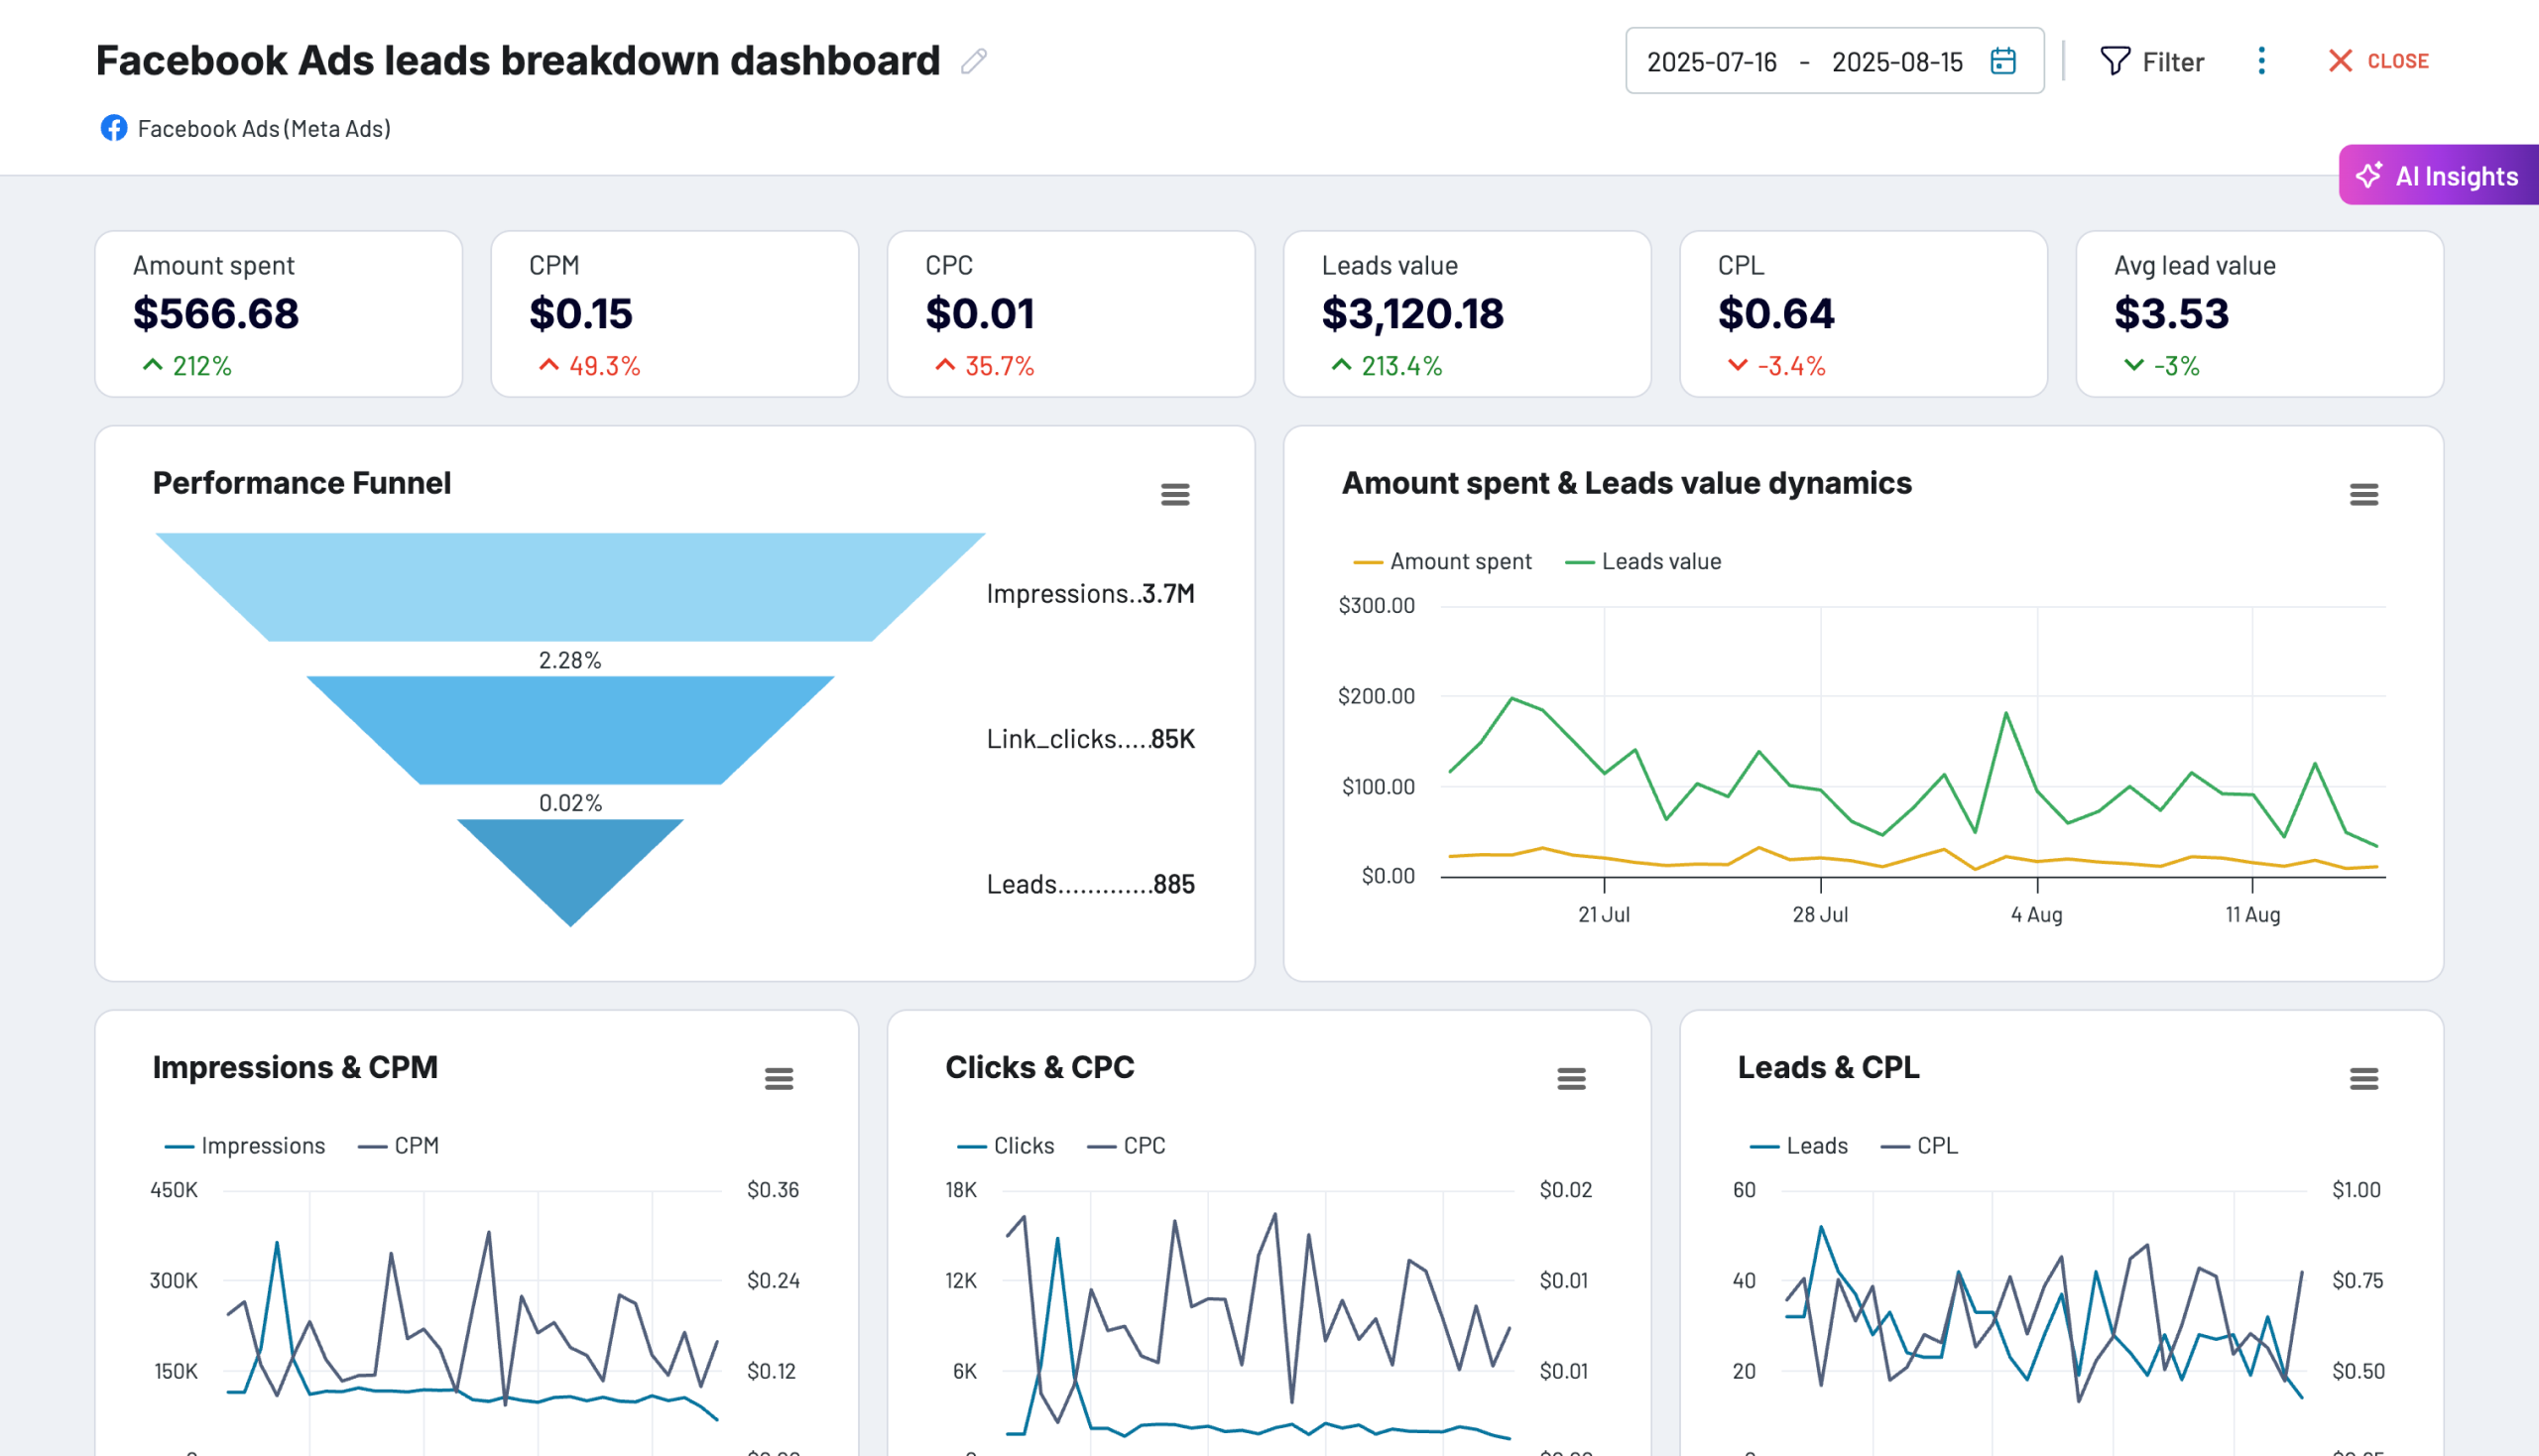
Visualise the ads funnel
Connect your ad channels and get data in minutes


Automate your data preparation with Coupler.io

Collect data from multiple marketing sources

Organize to focus on what matters most

Build awesome dashboards to impress
Become a data evangelist at your organization!
Take your reporting to the next level
 Sign Up with Google
 Sign Up with MICROSOFT
 SIGN UP WITH EMAIL
By signing up to Coupler.io, you agree to our Privacy Policy and Terms of Use.
Don’t just take our word for it


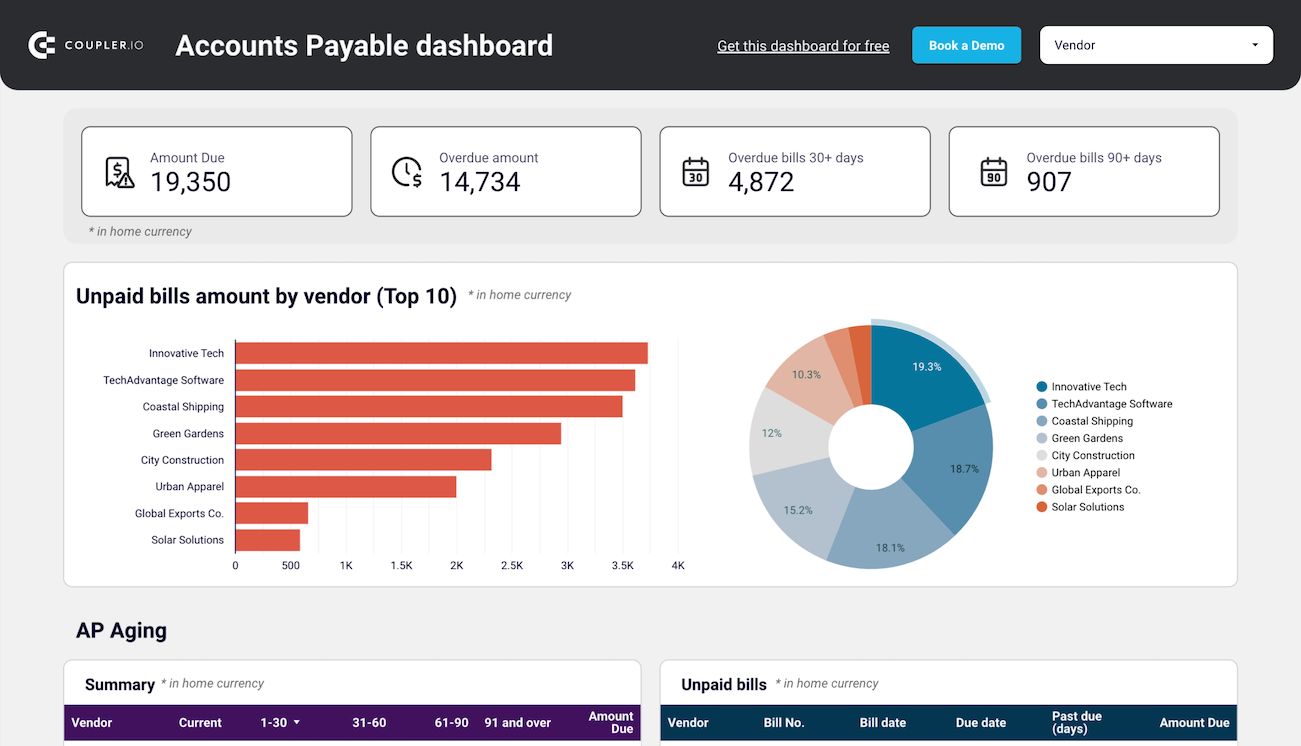
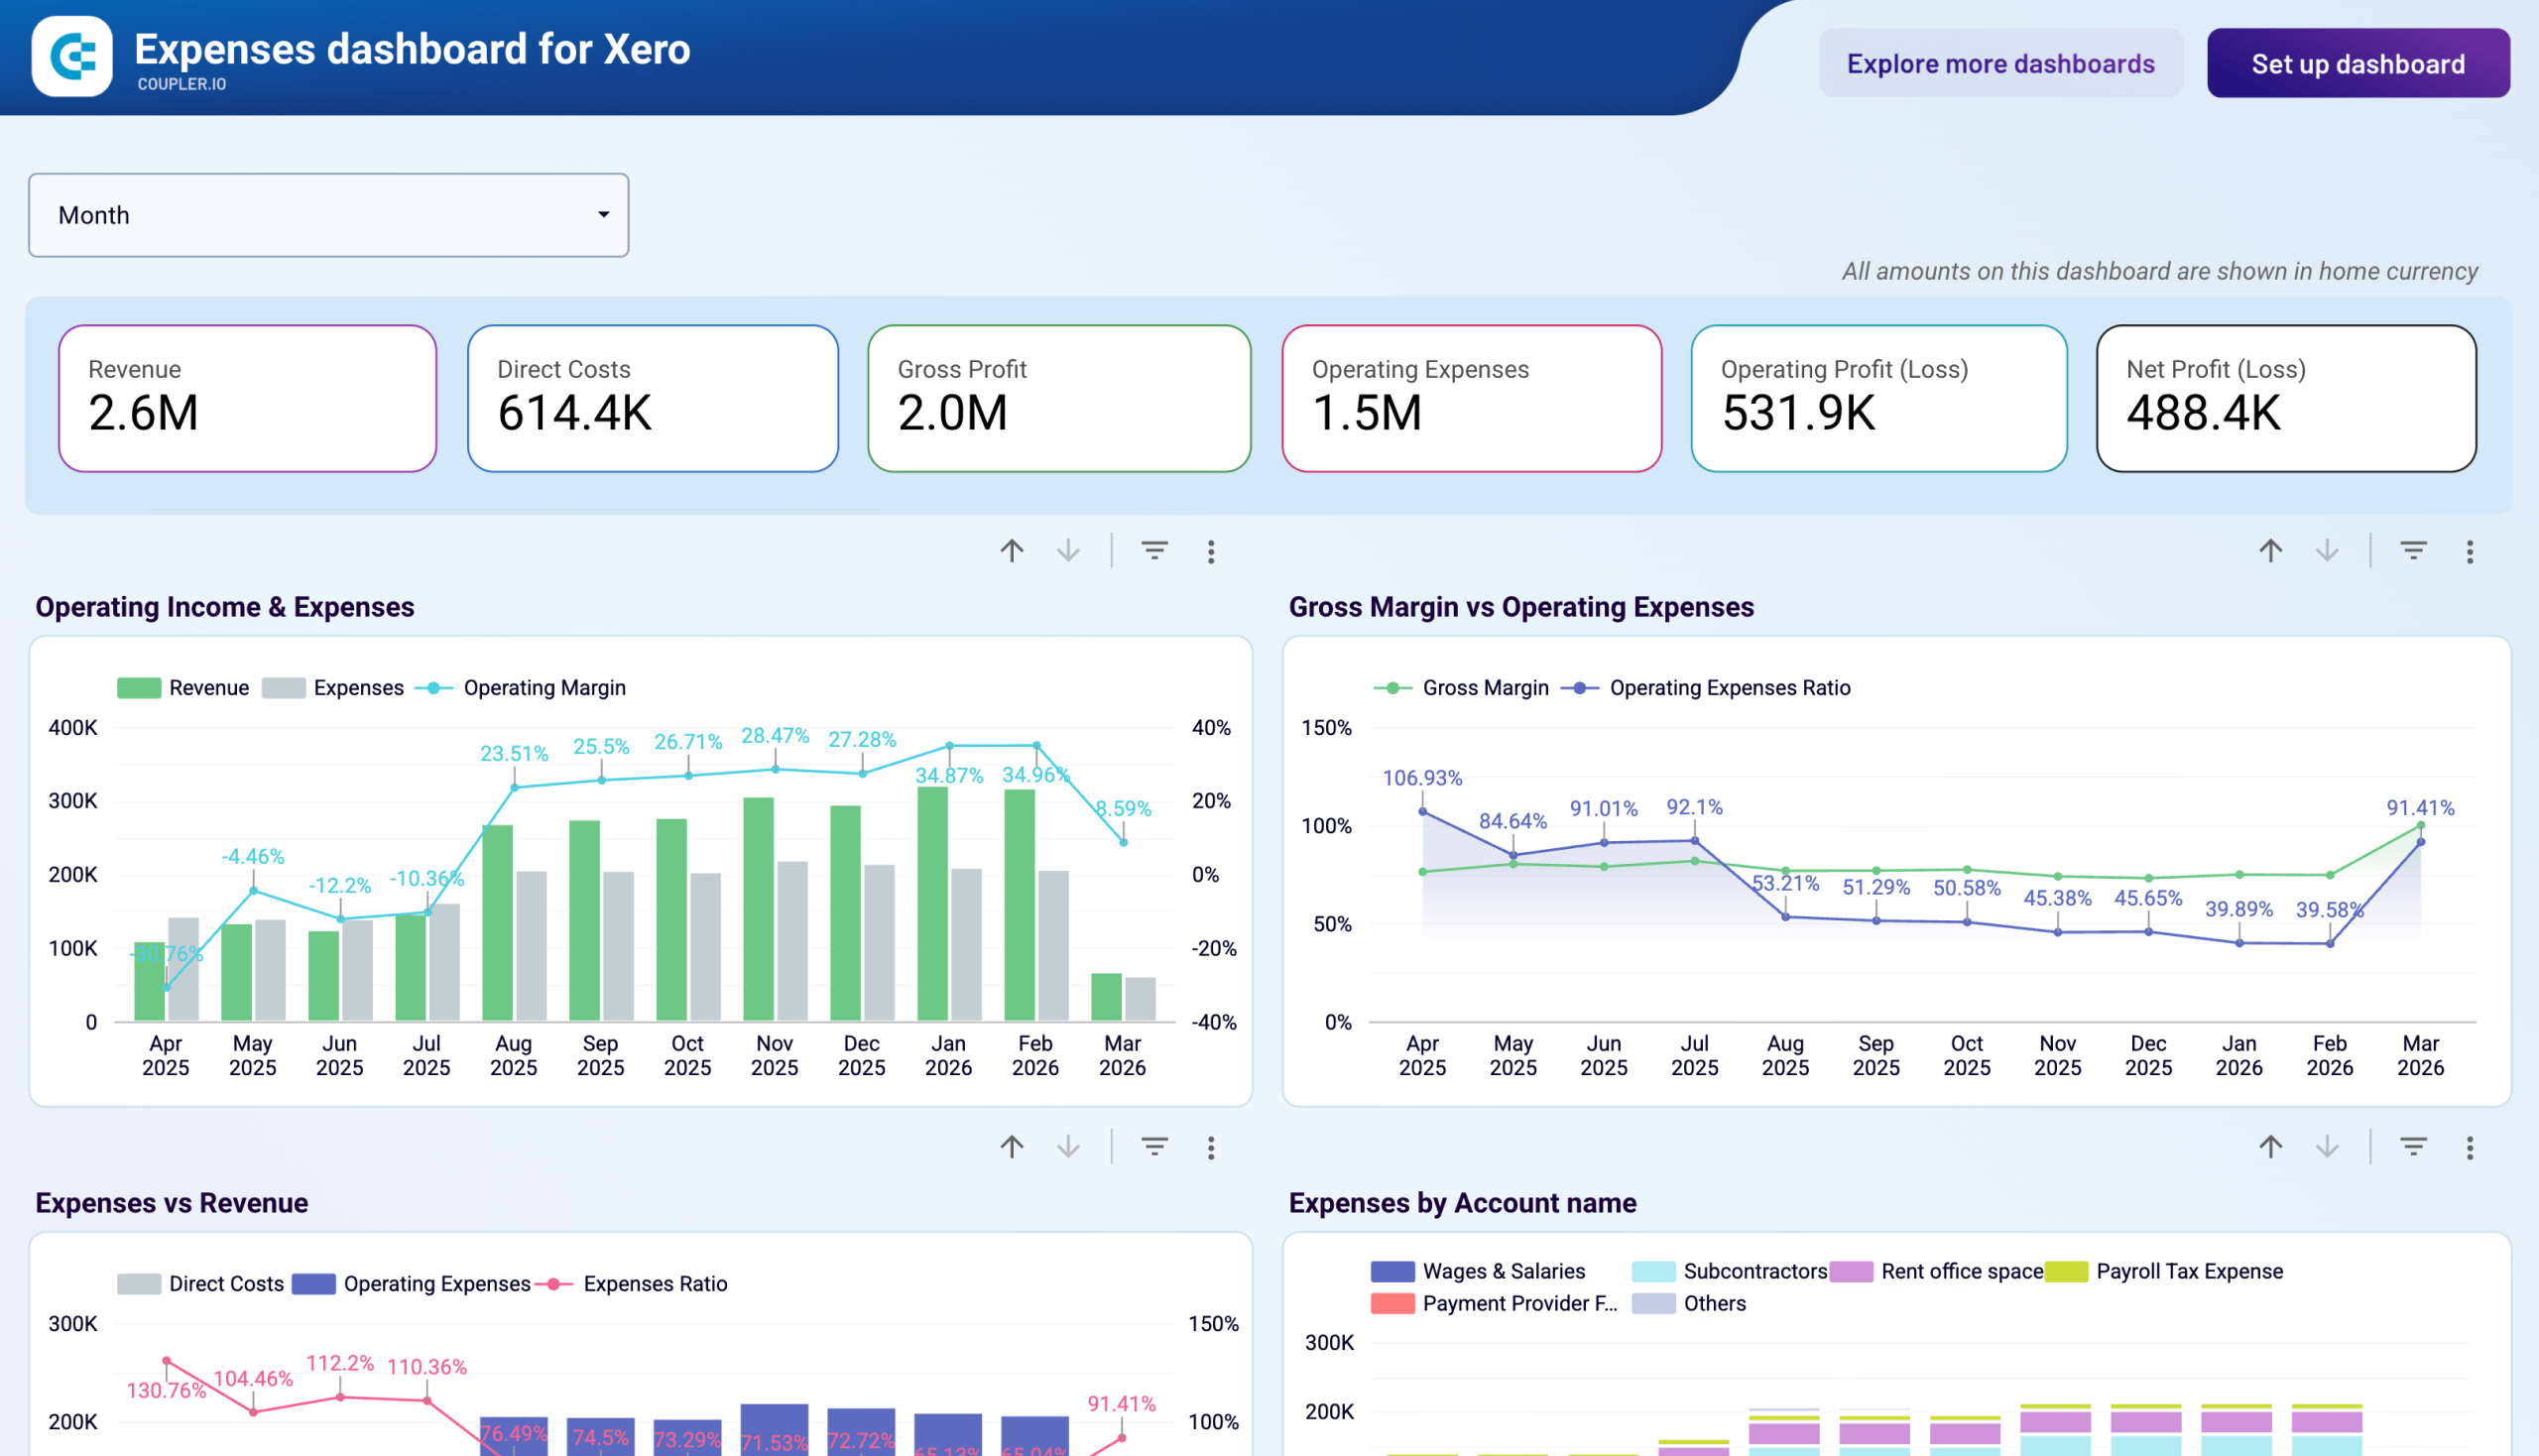
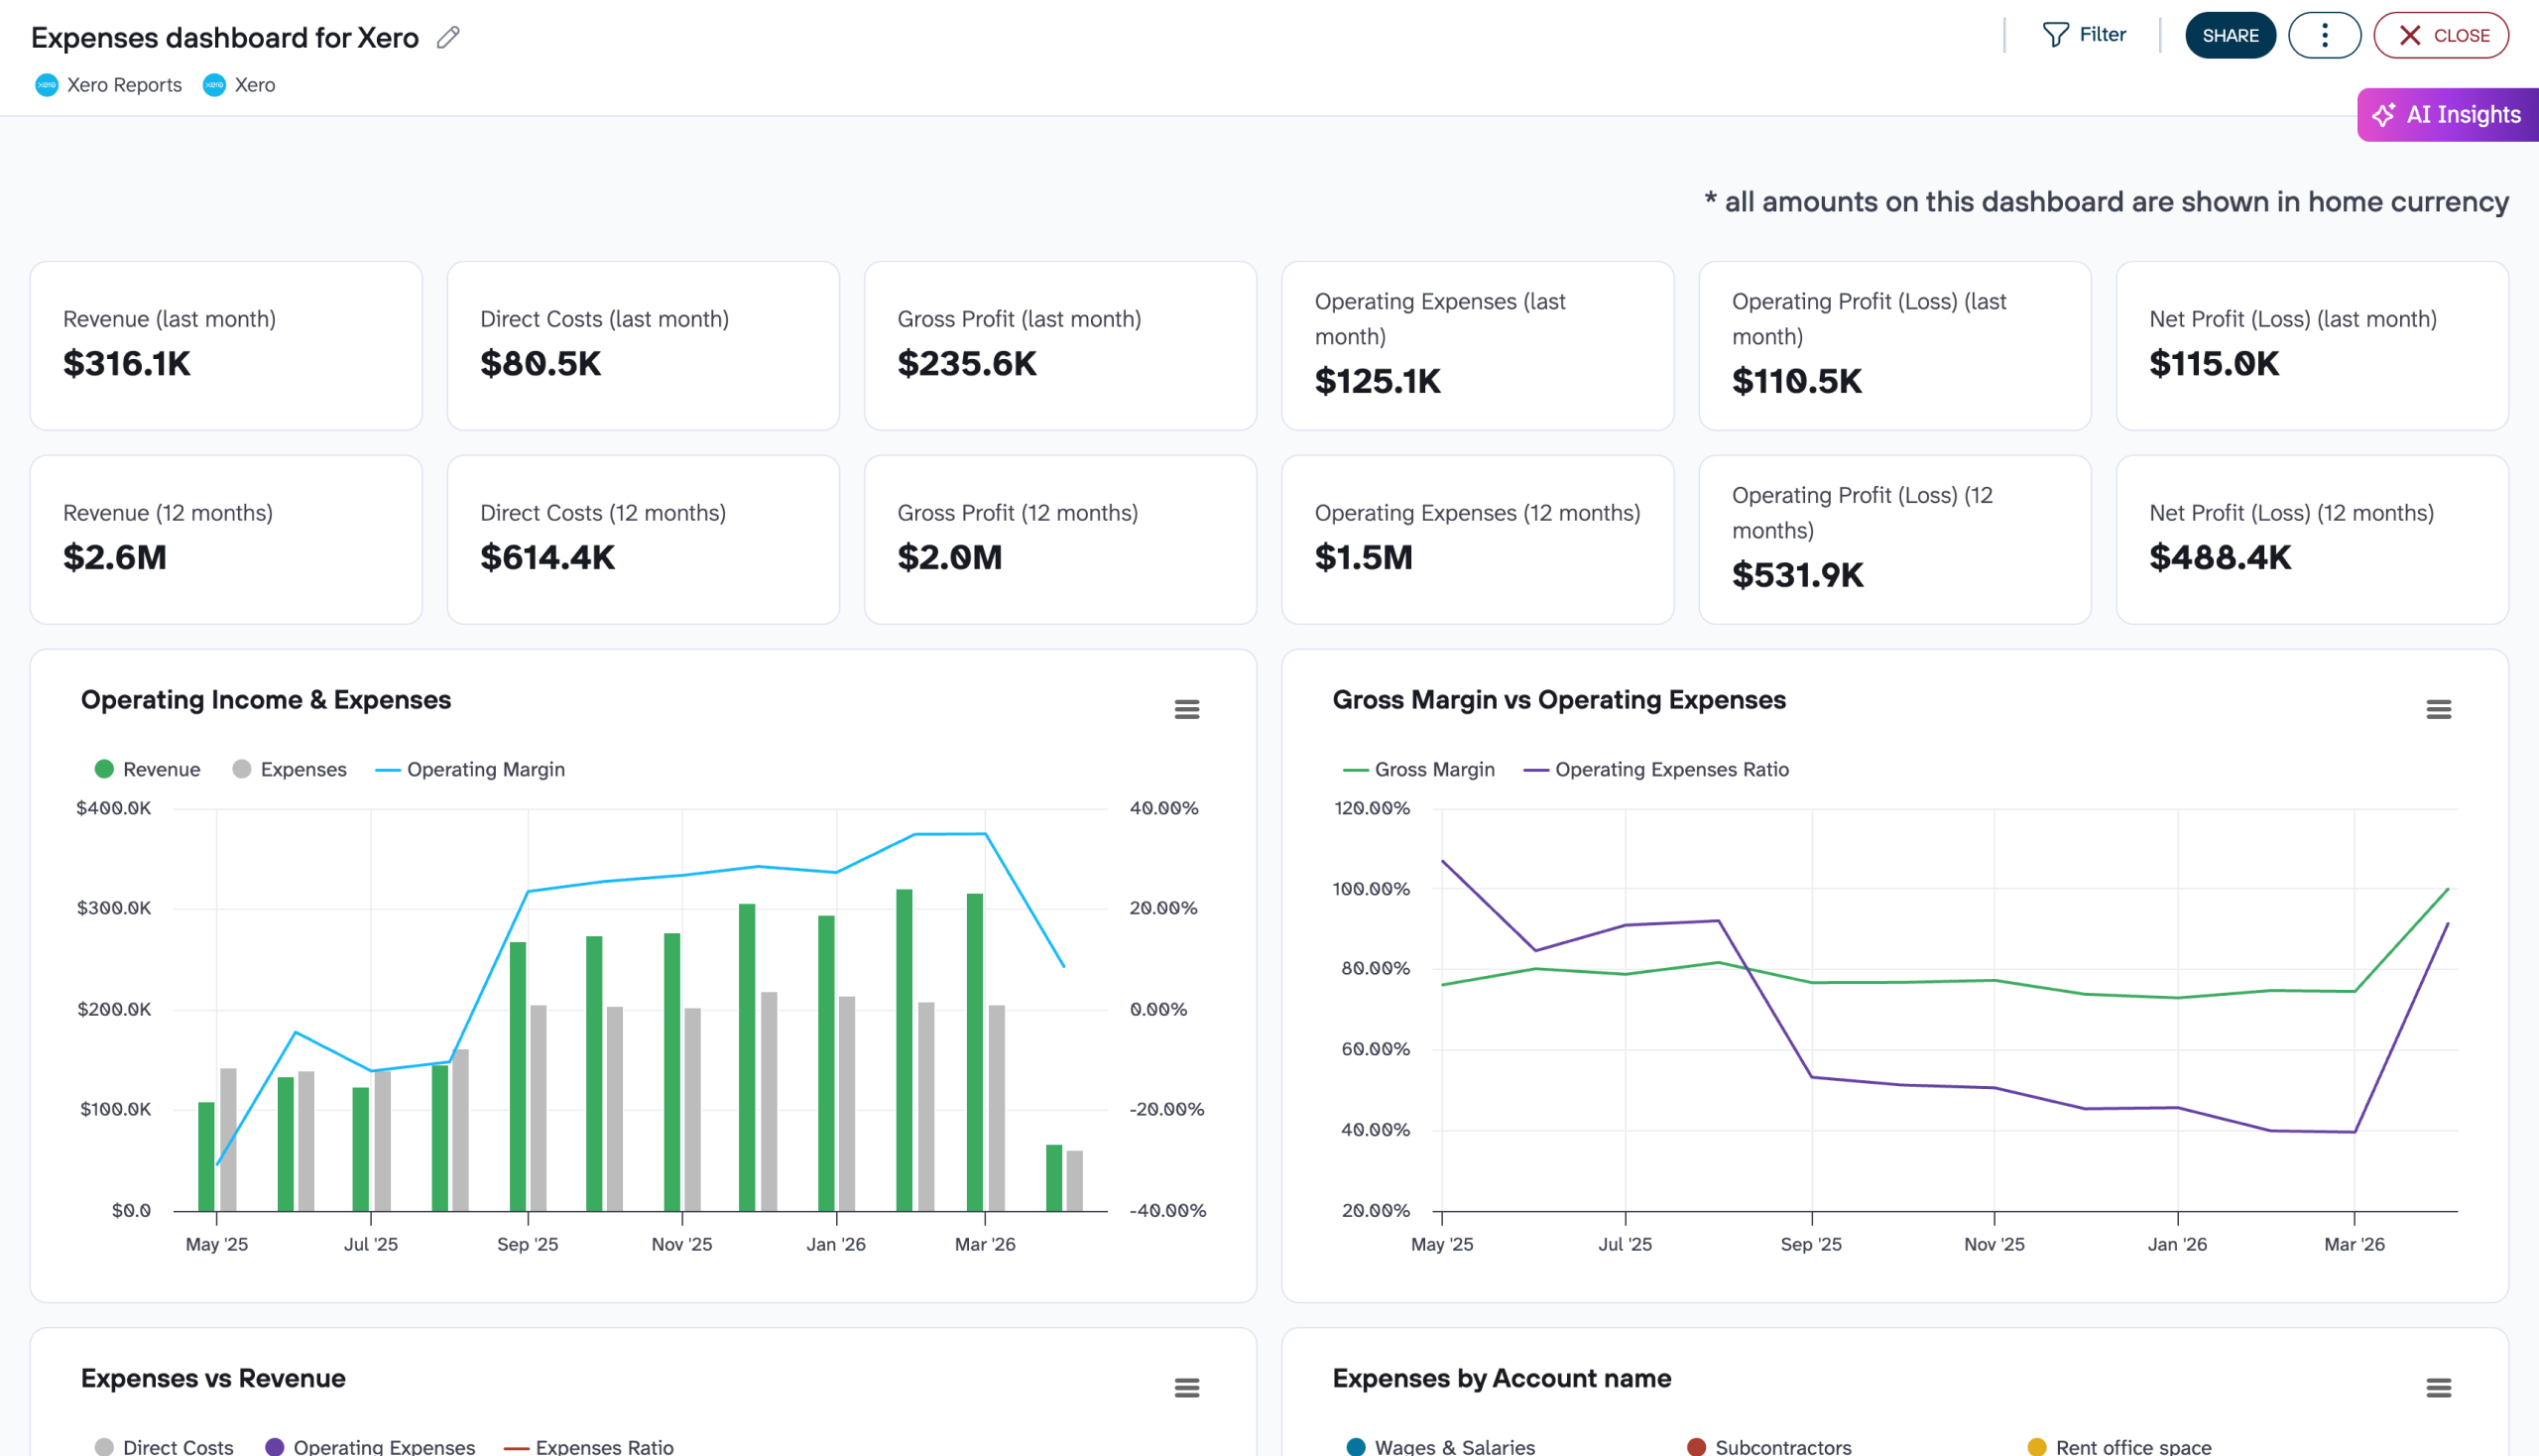
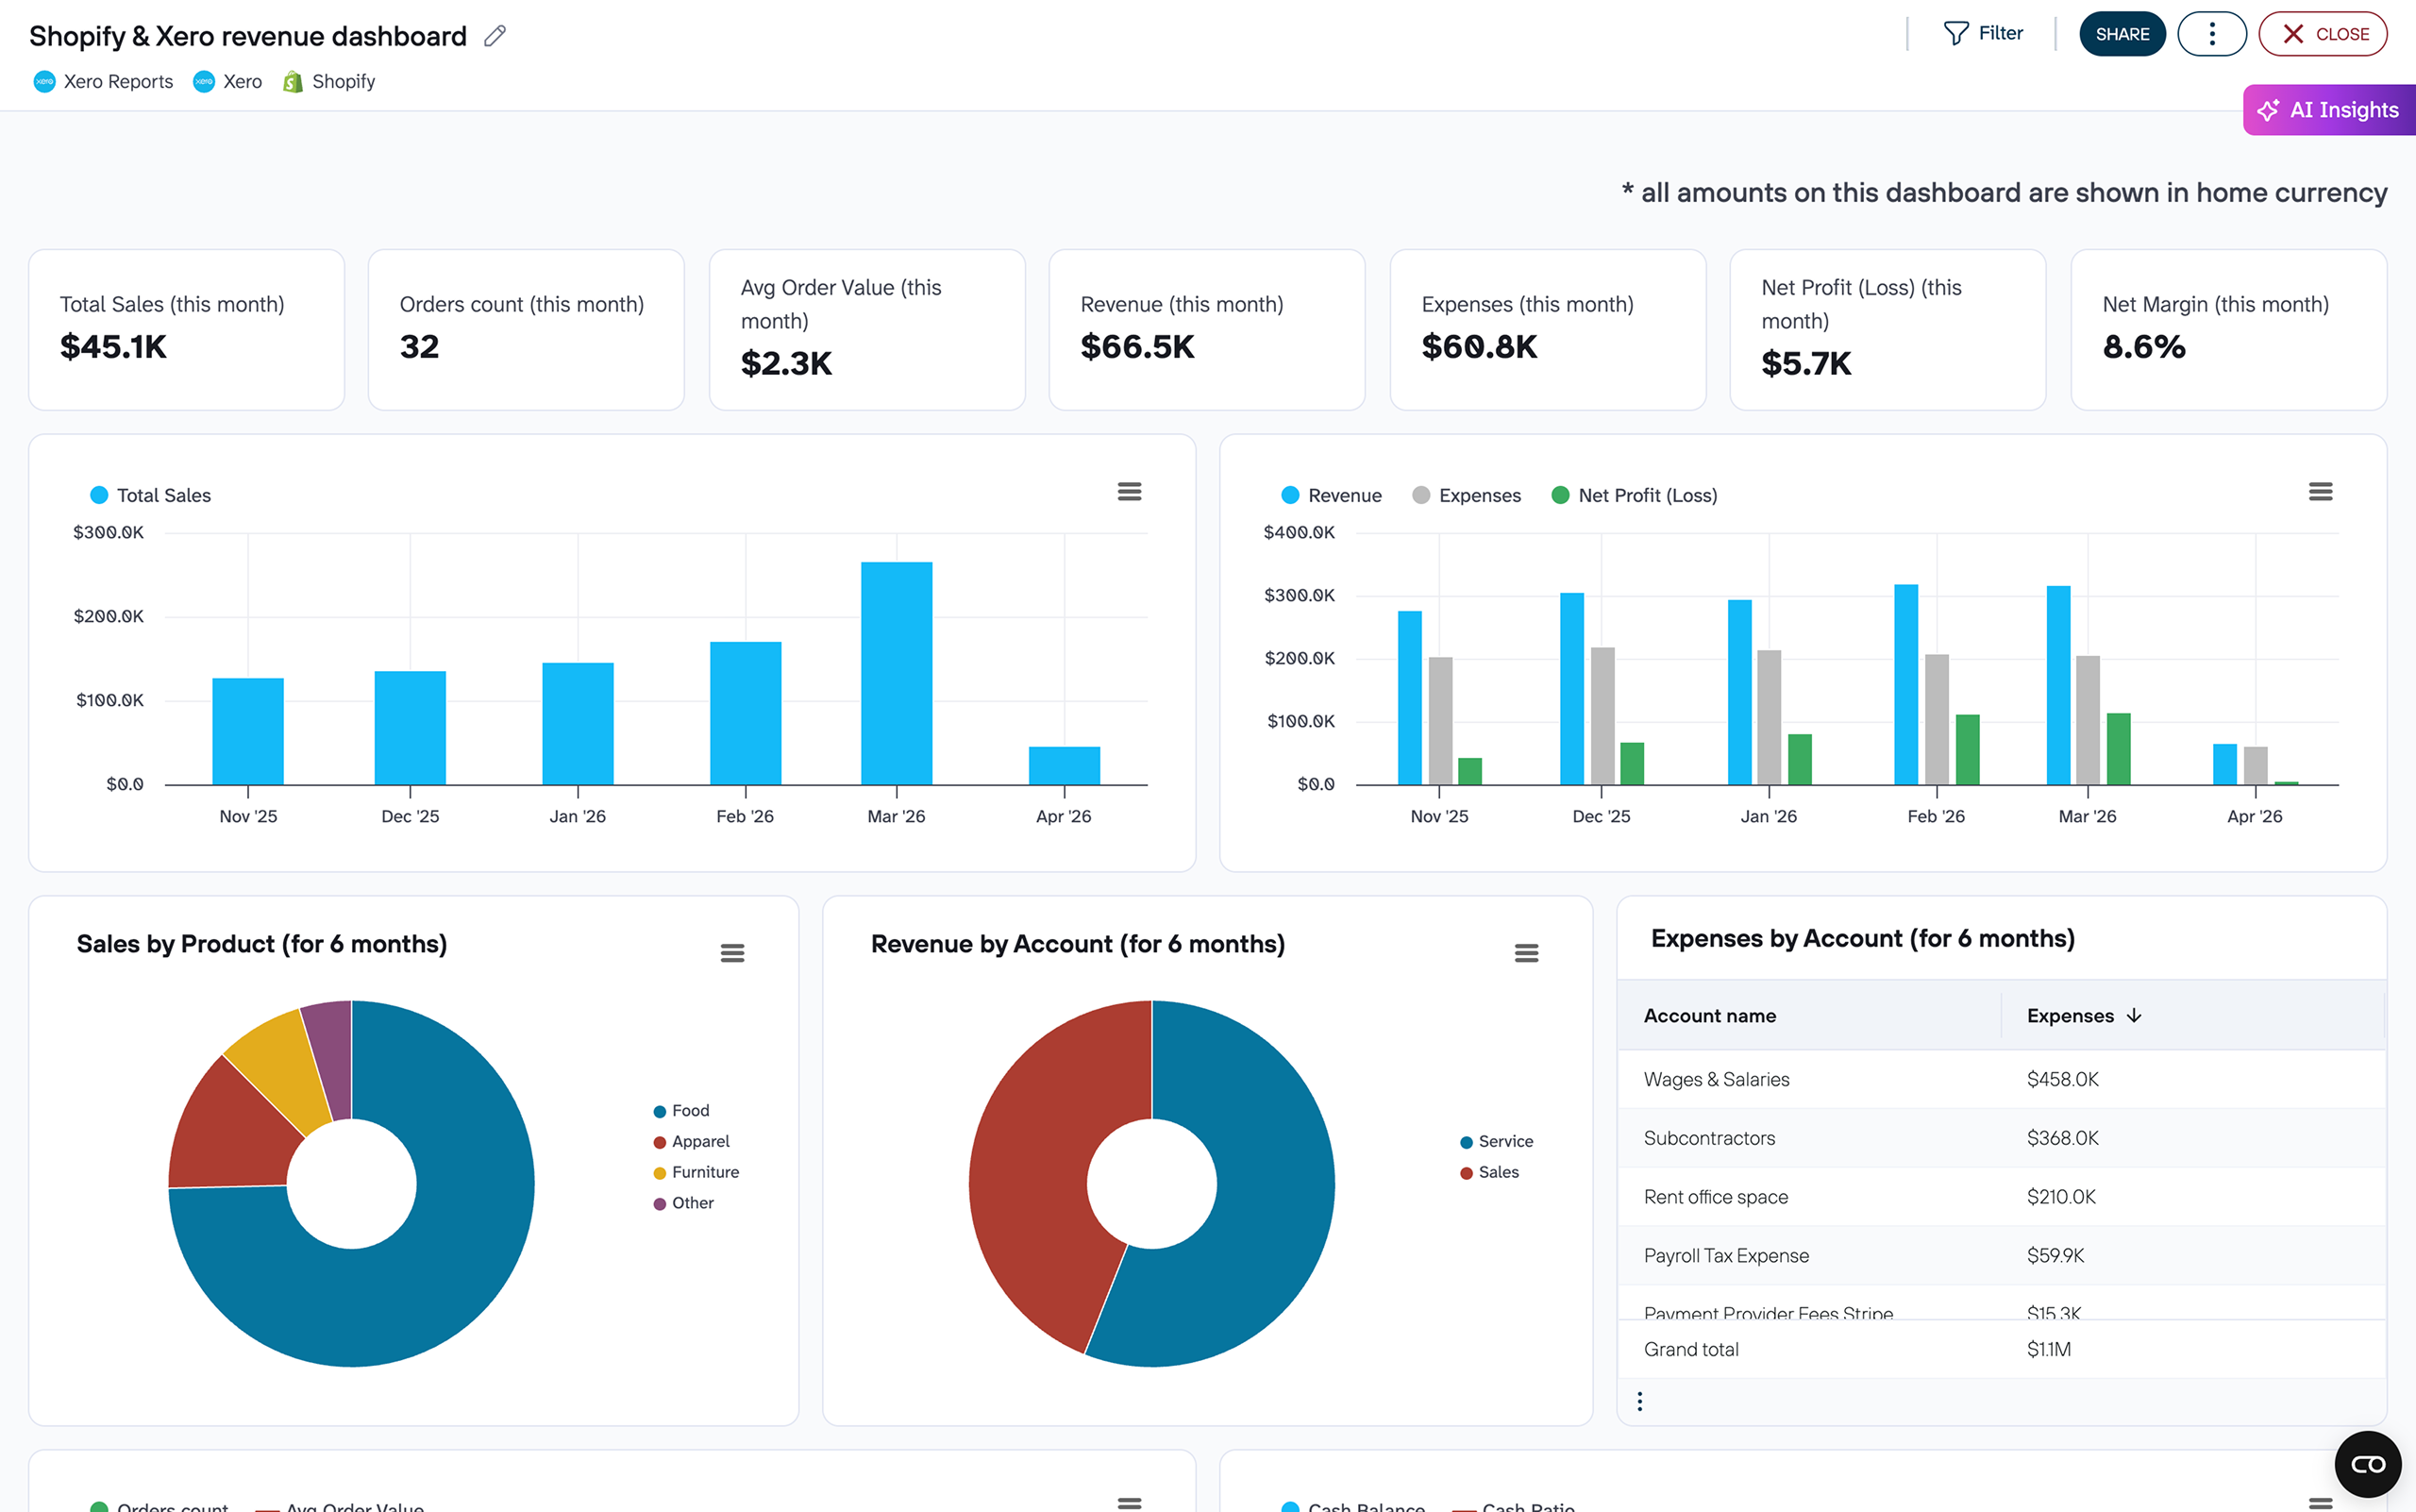
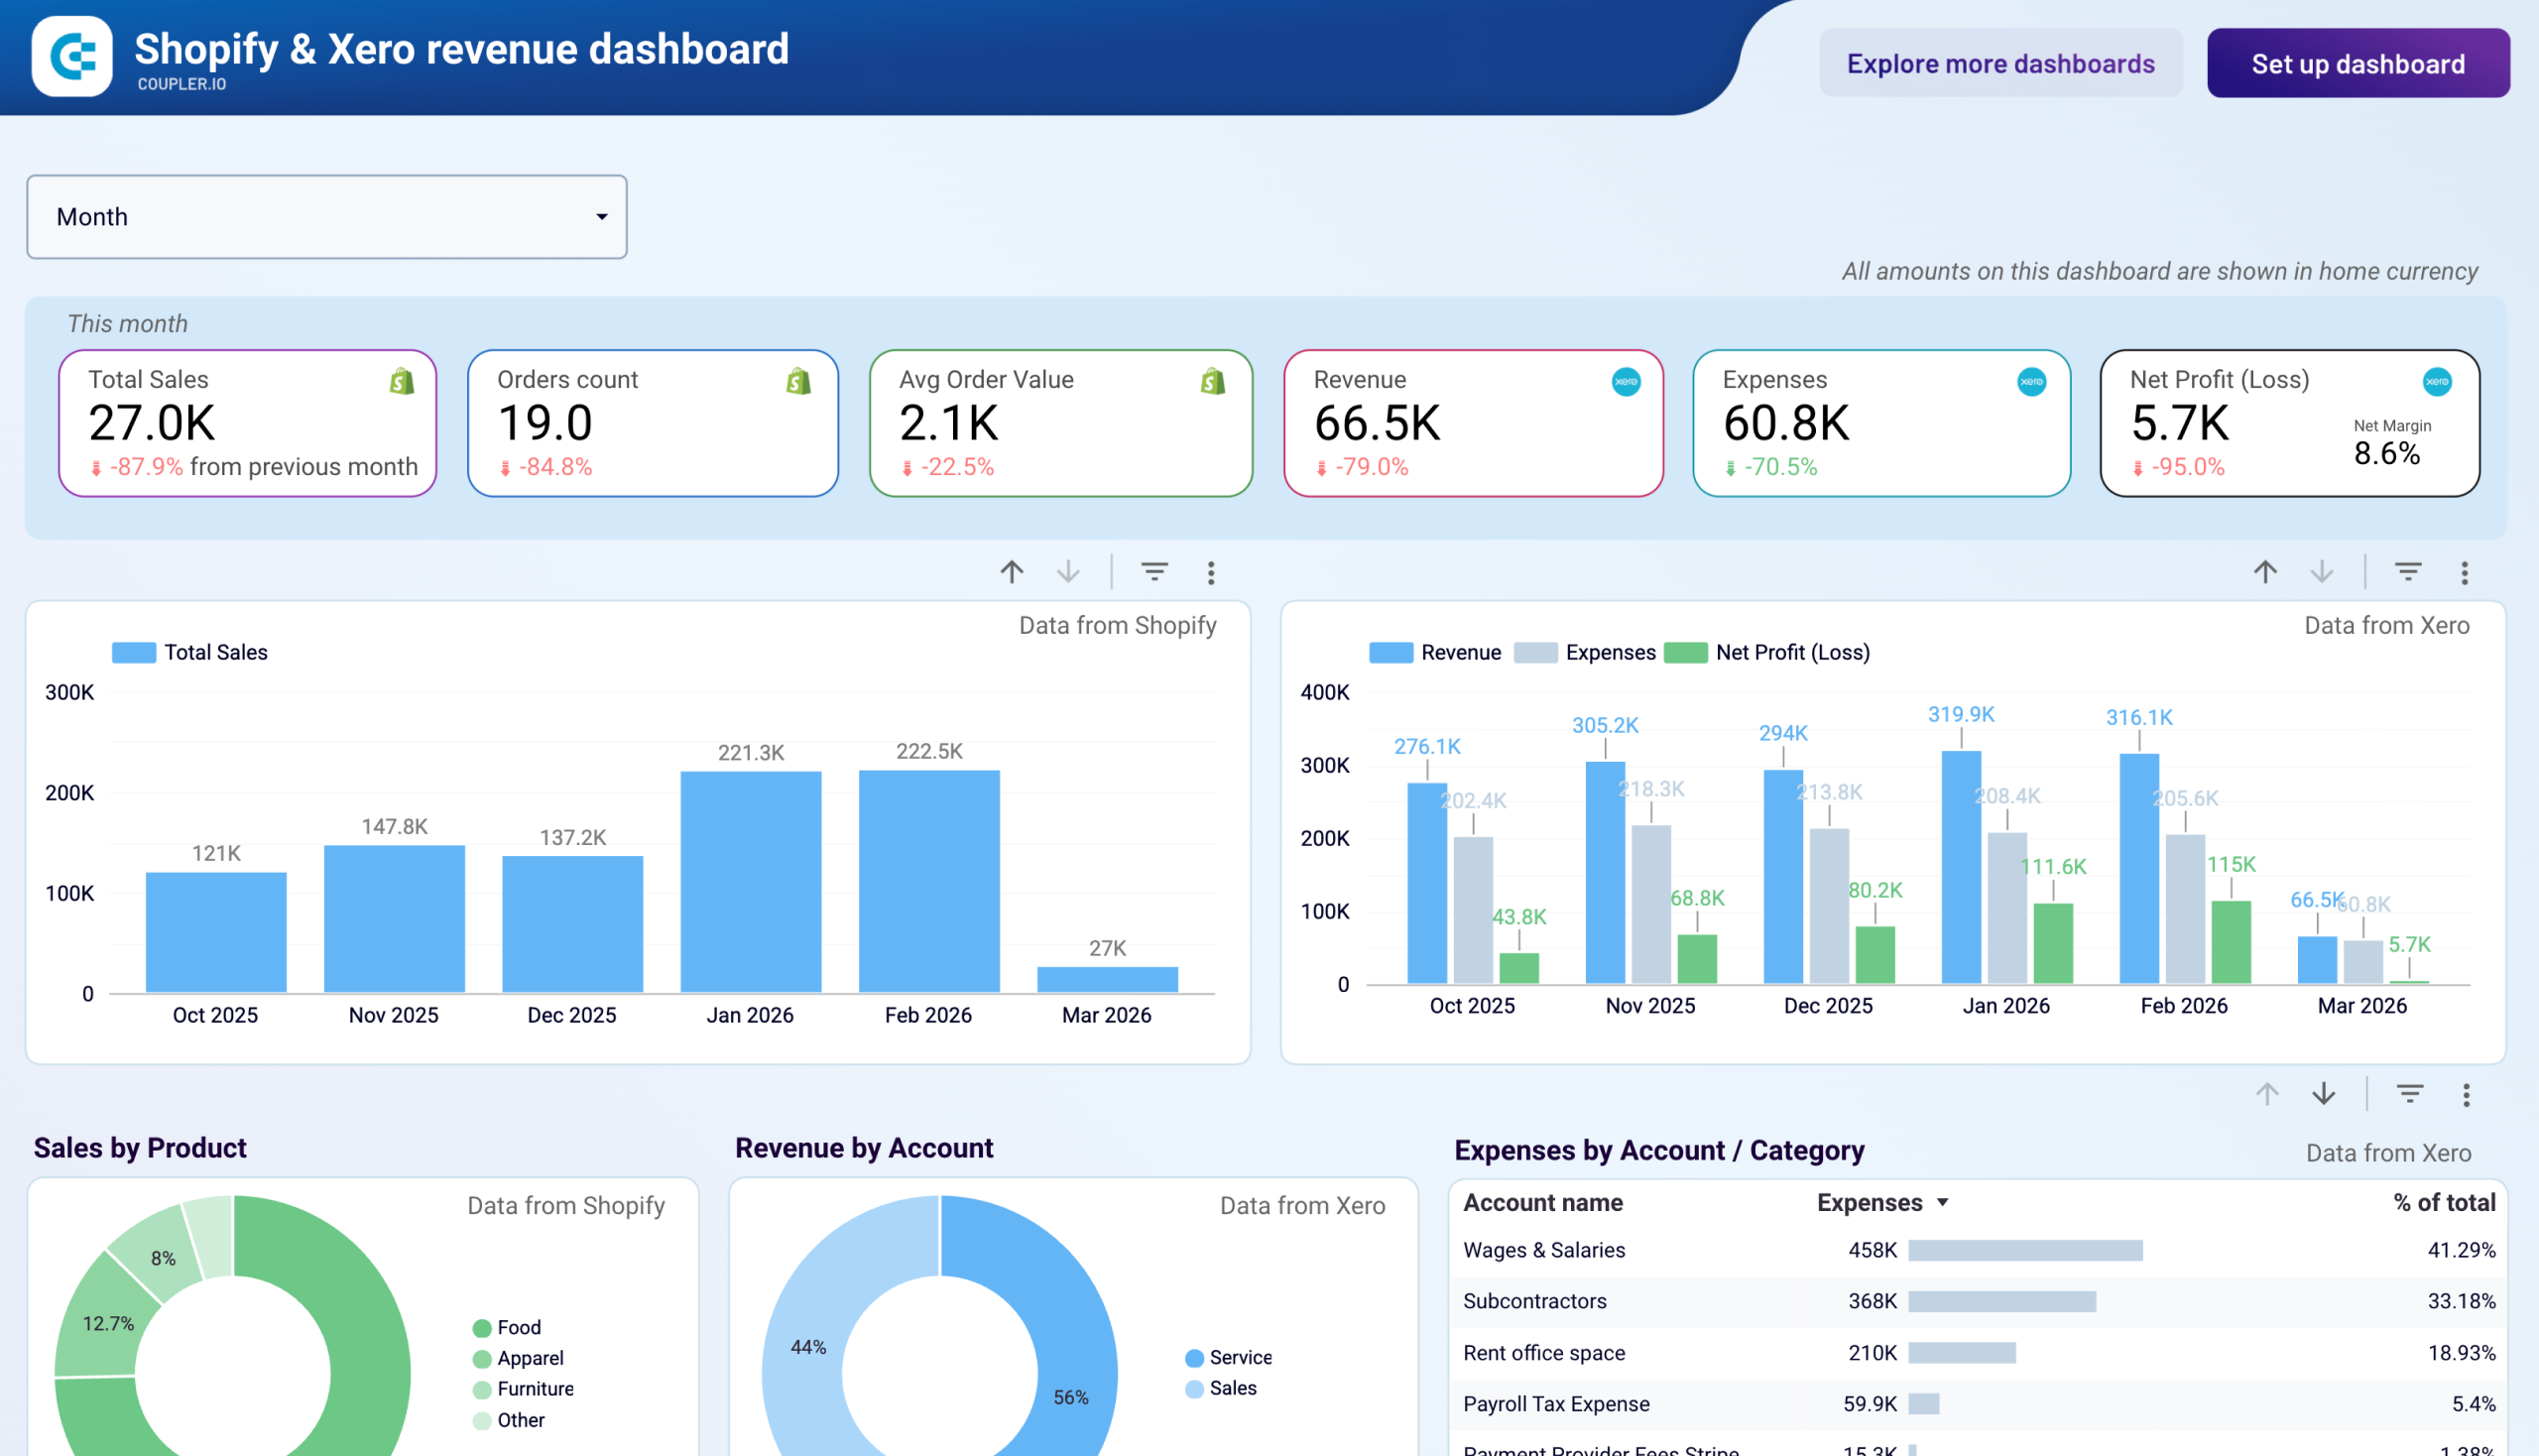
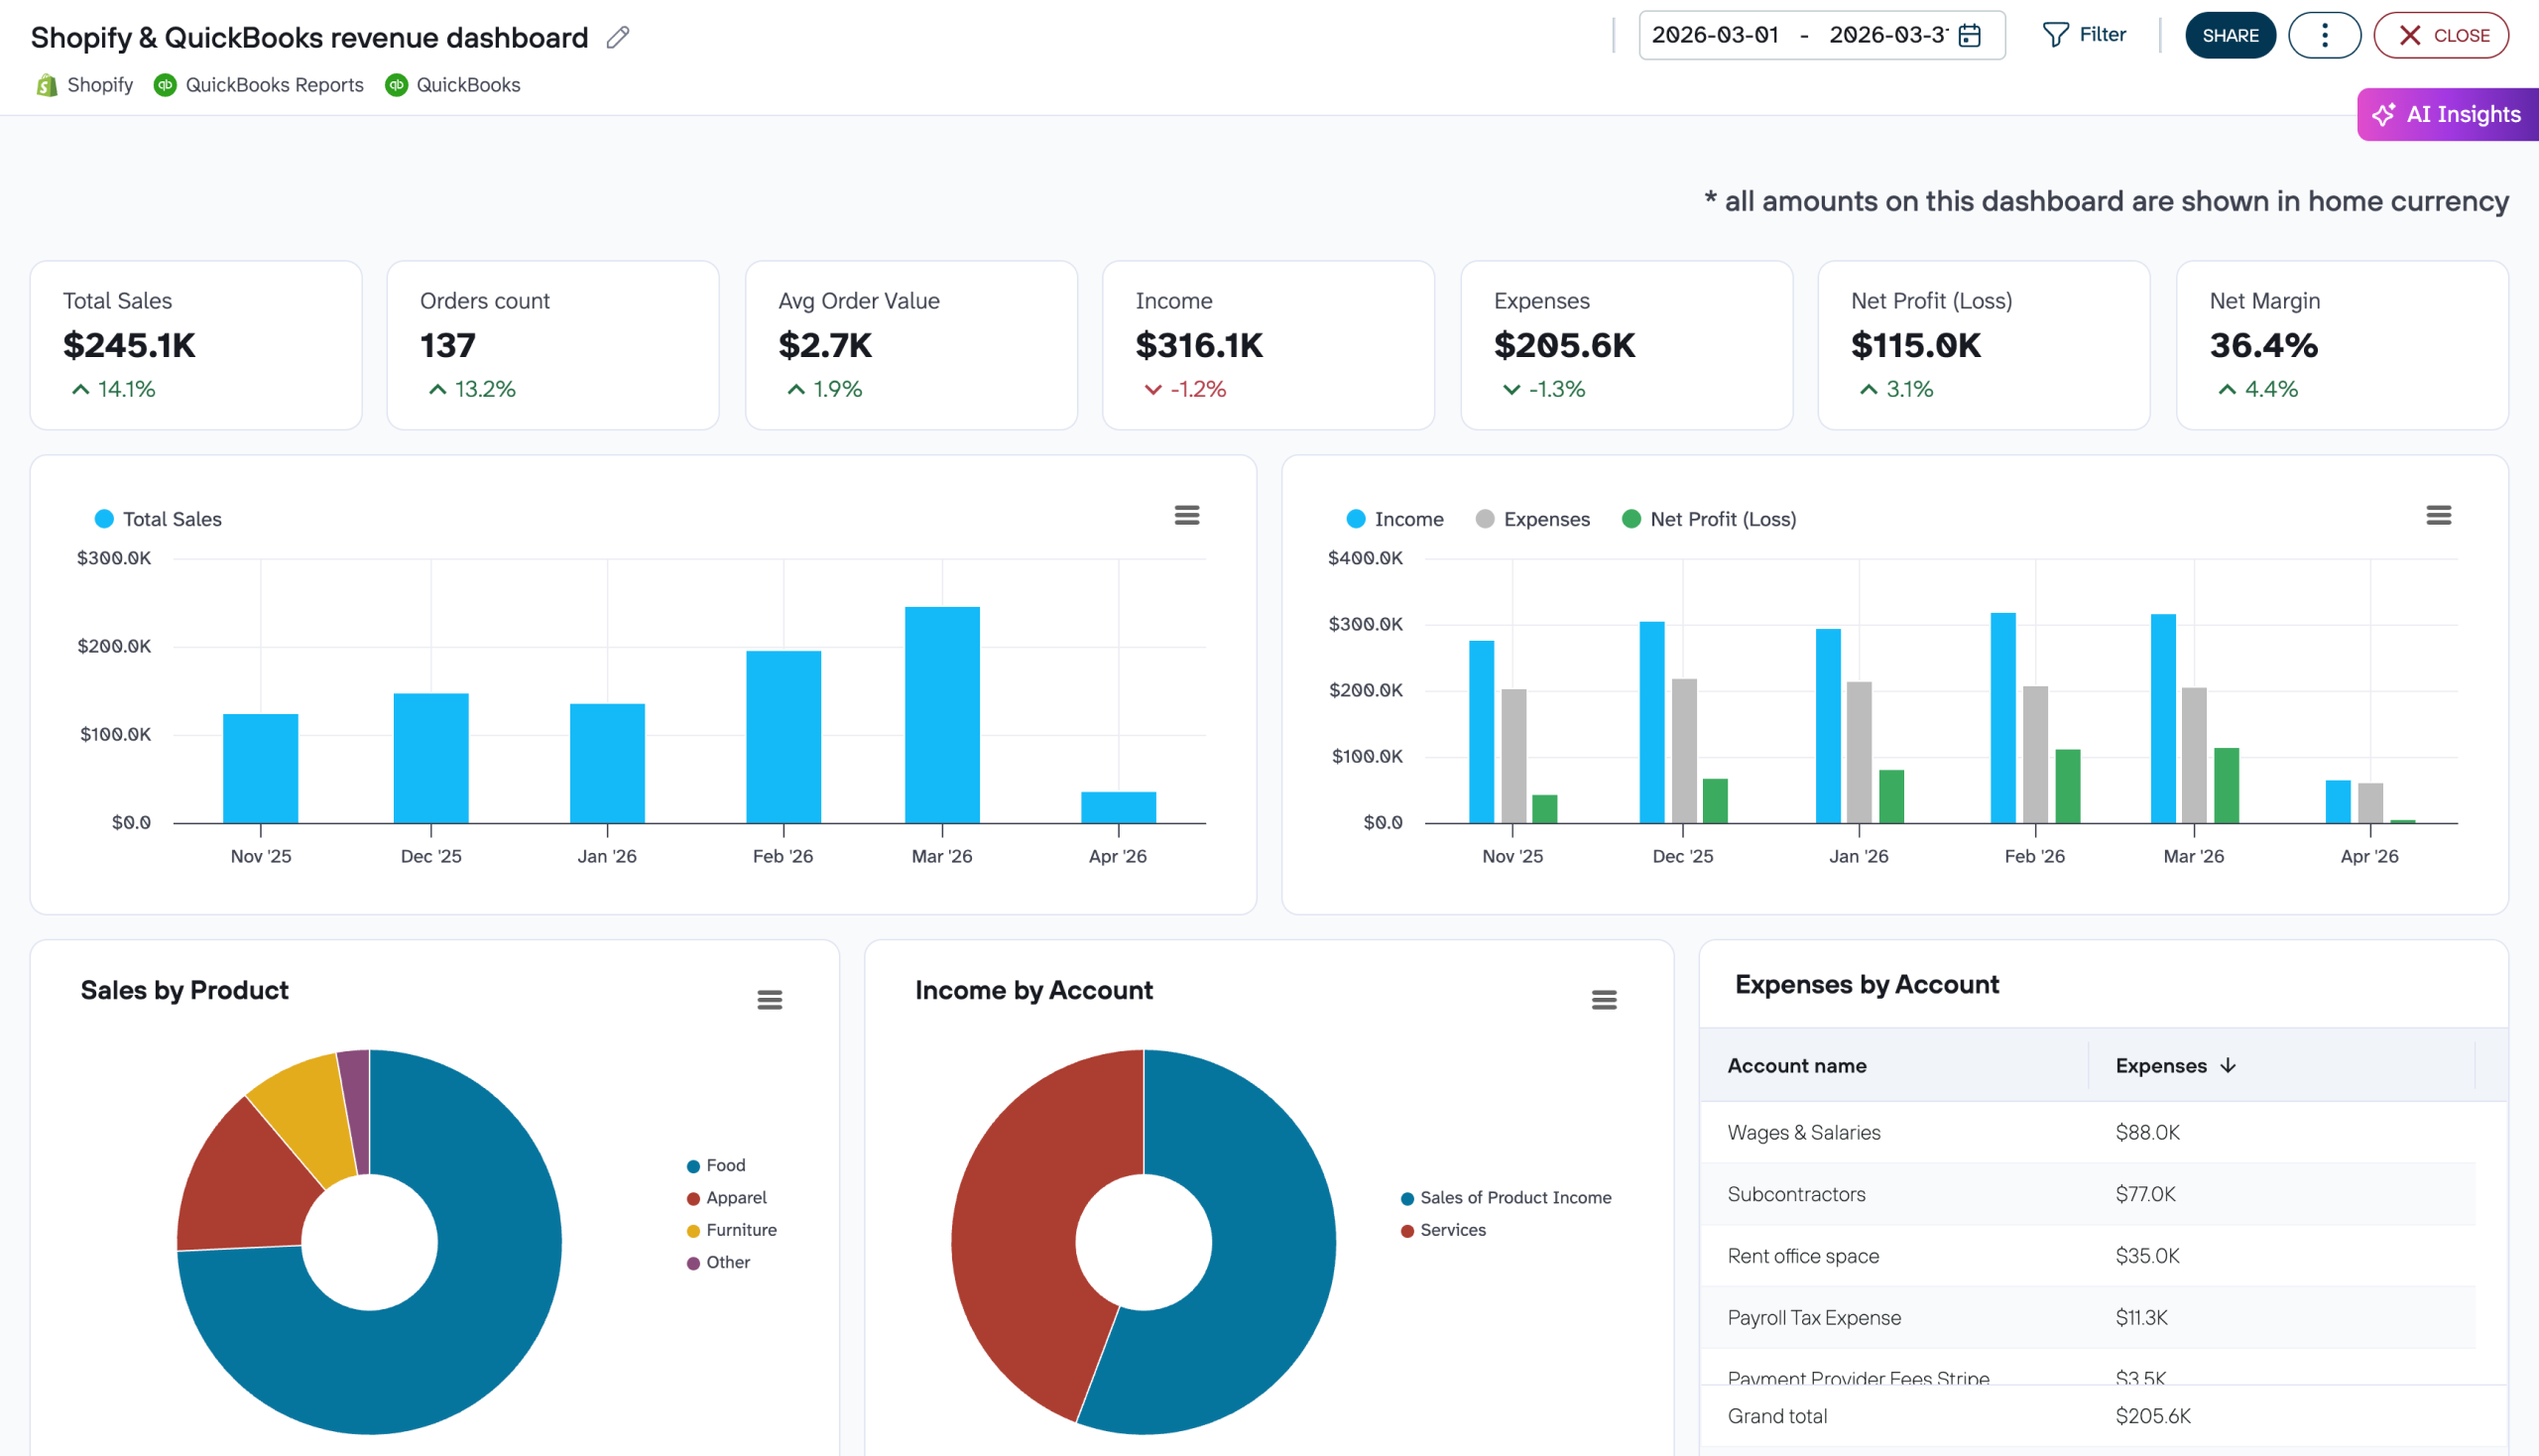
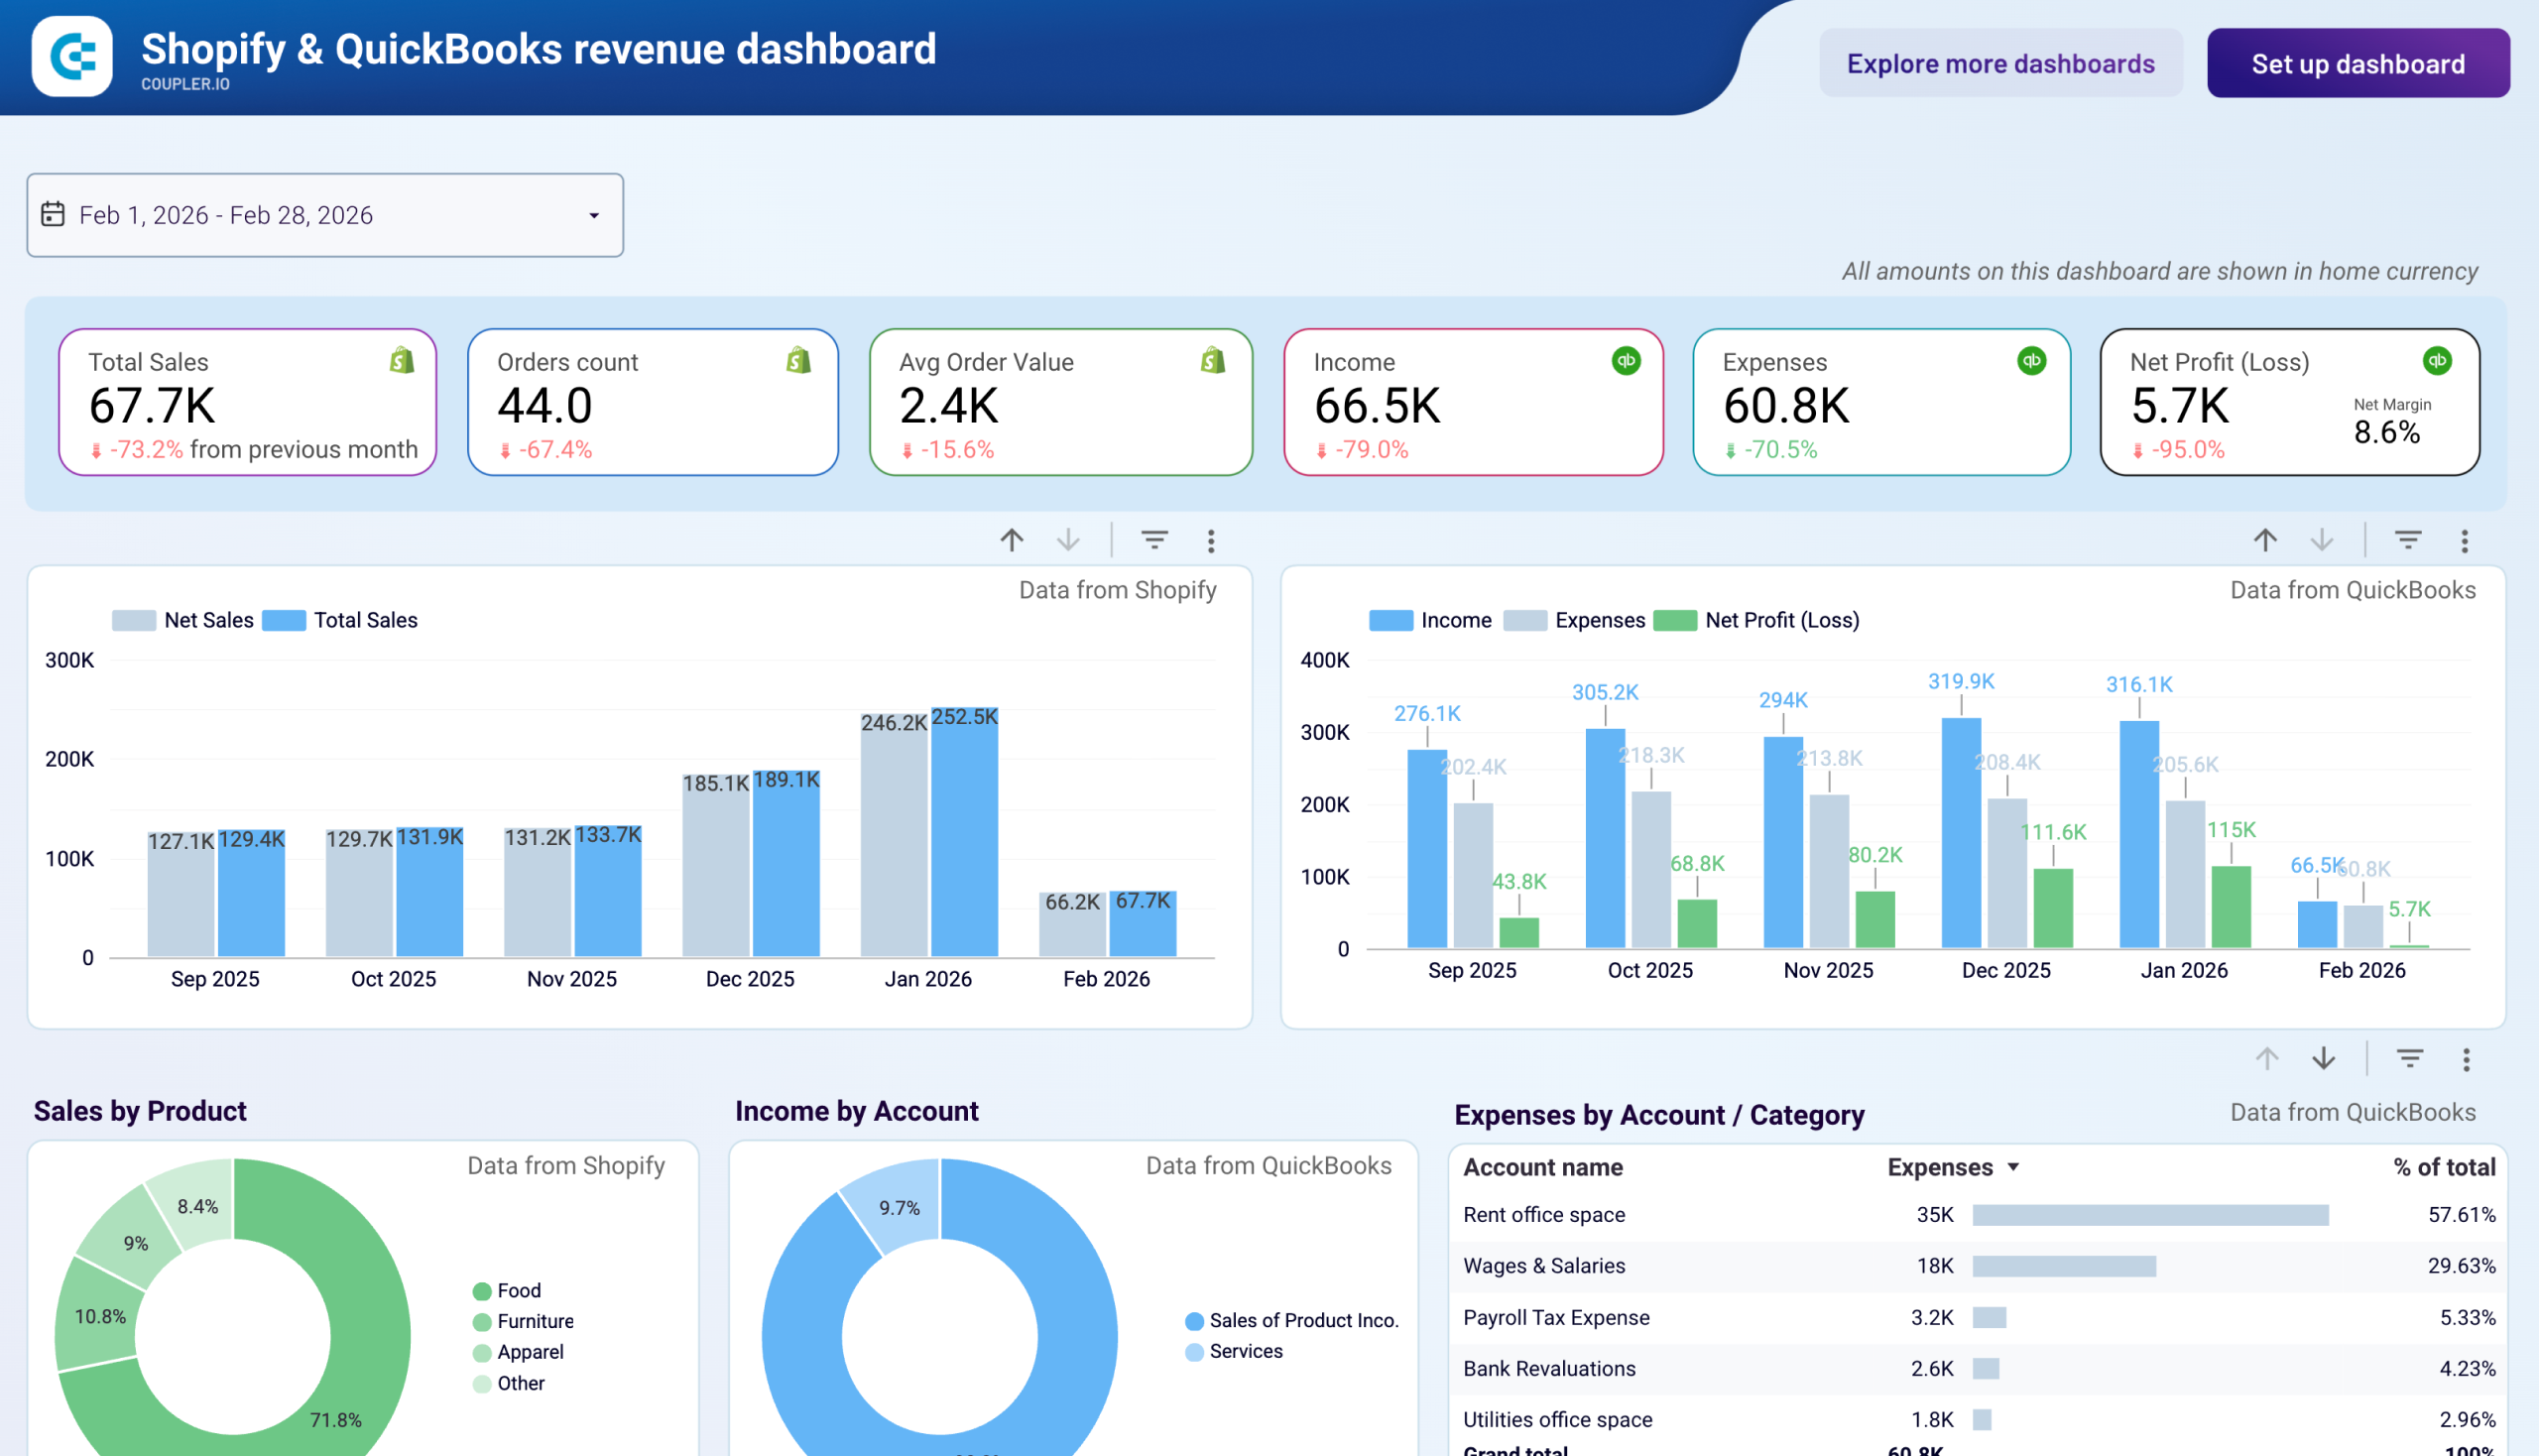
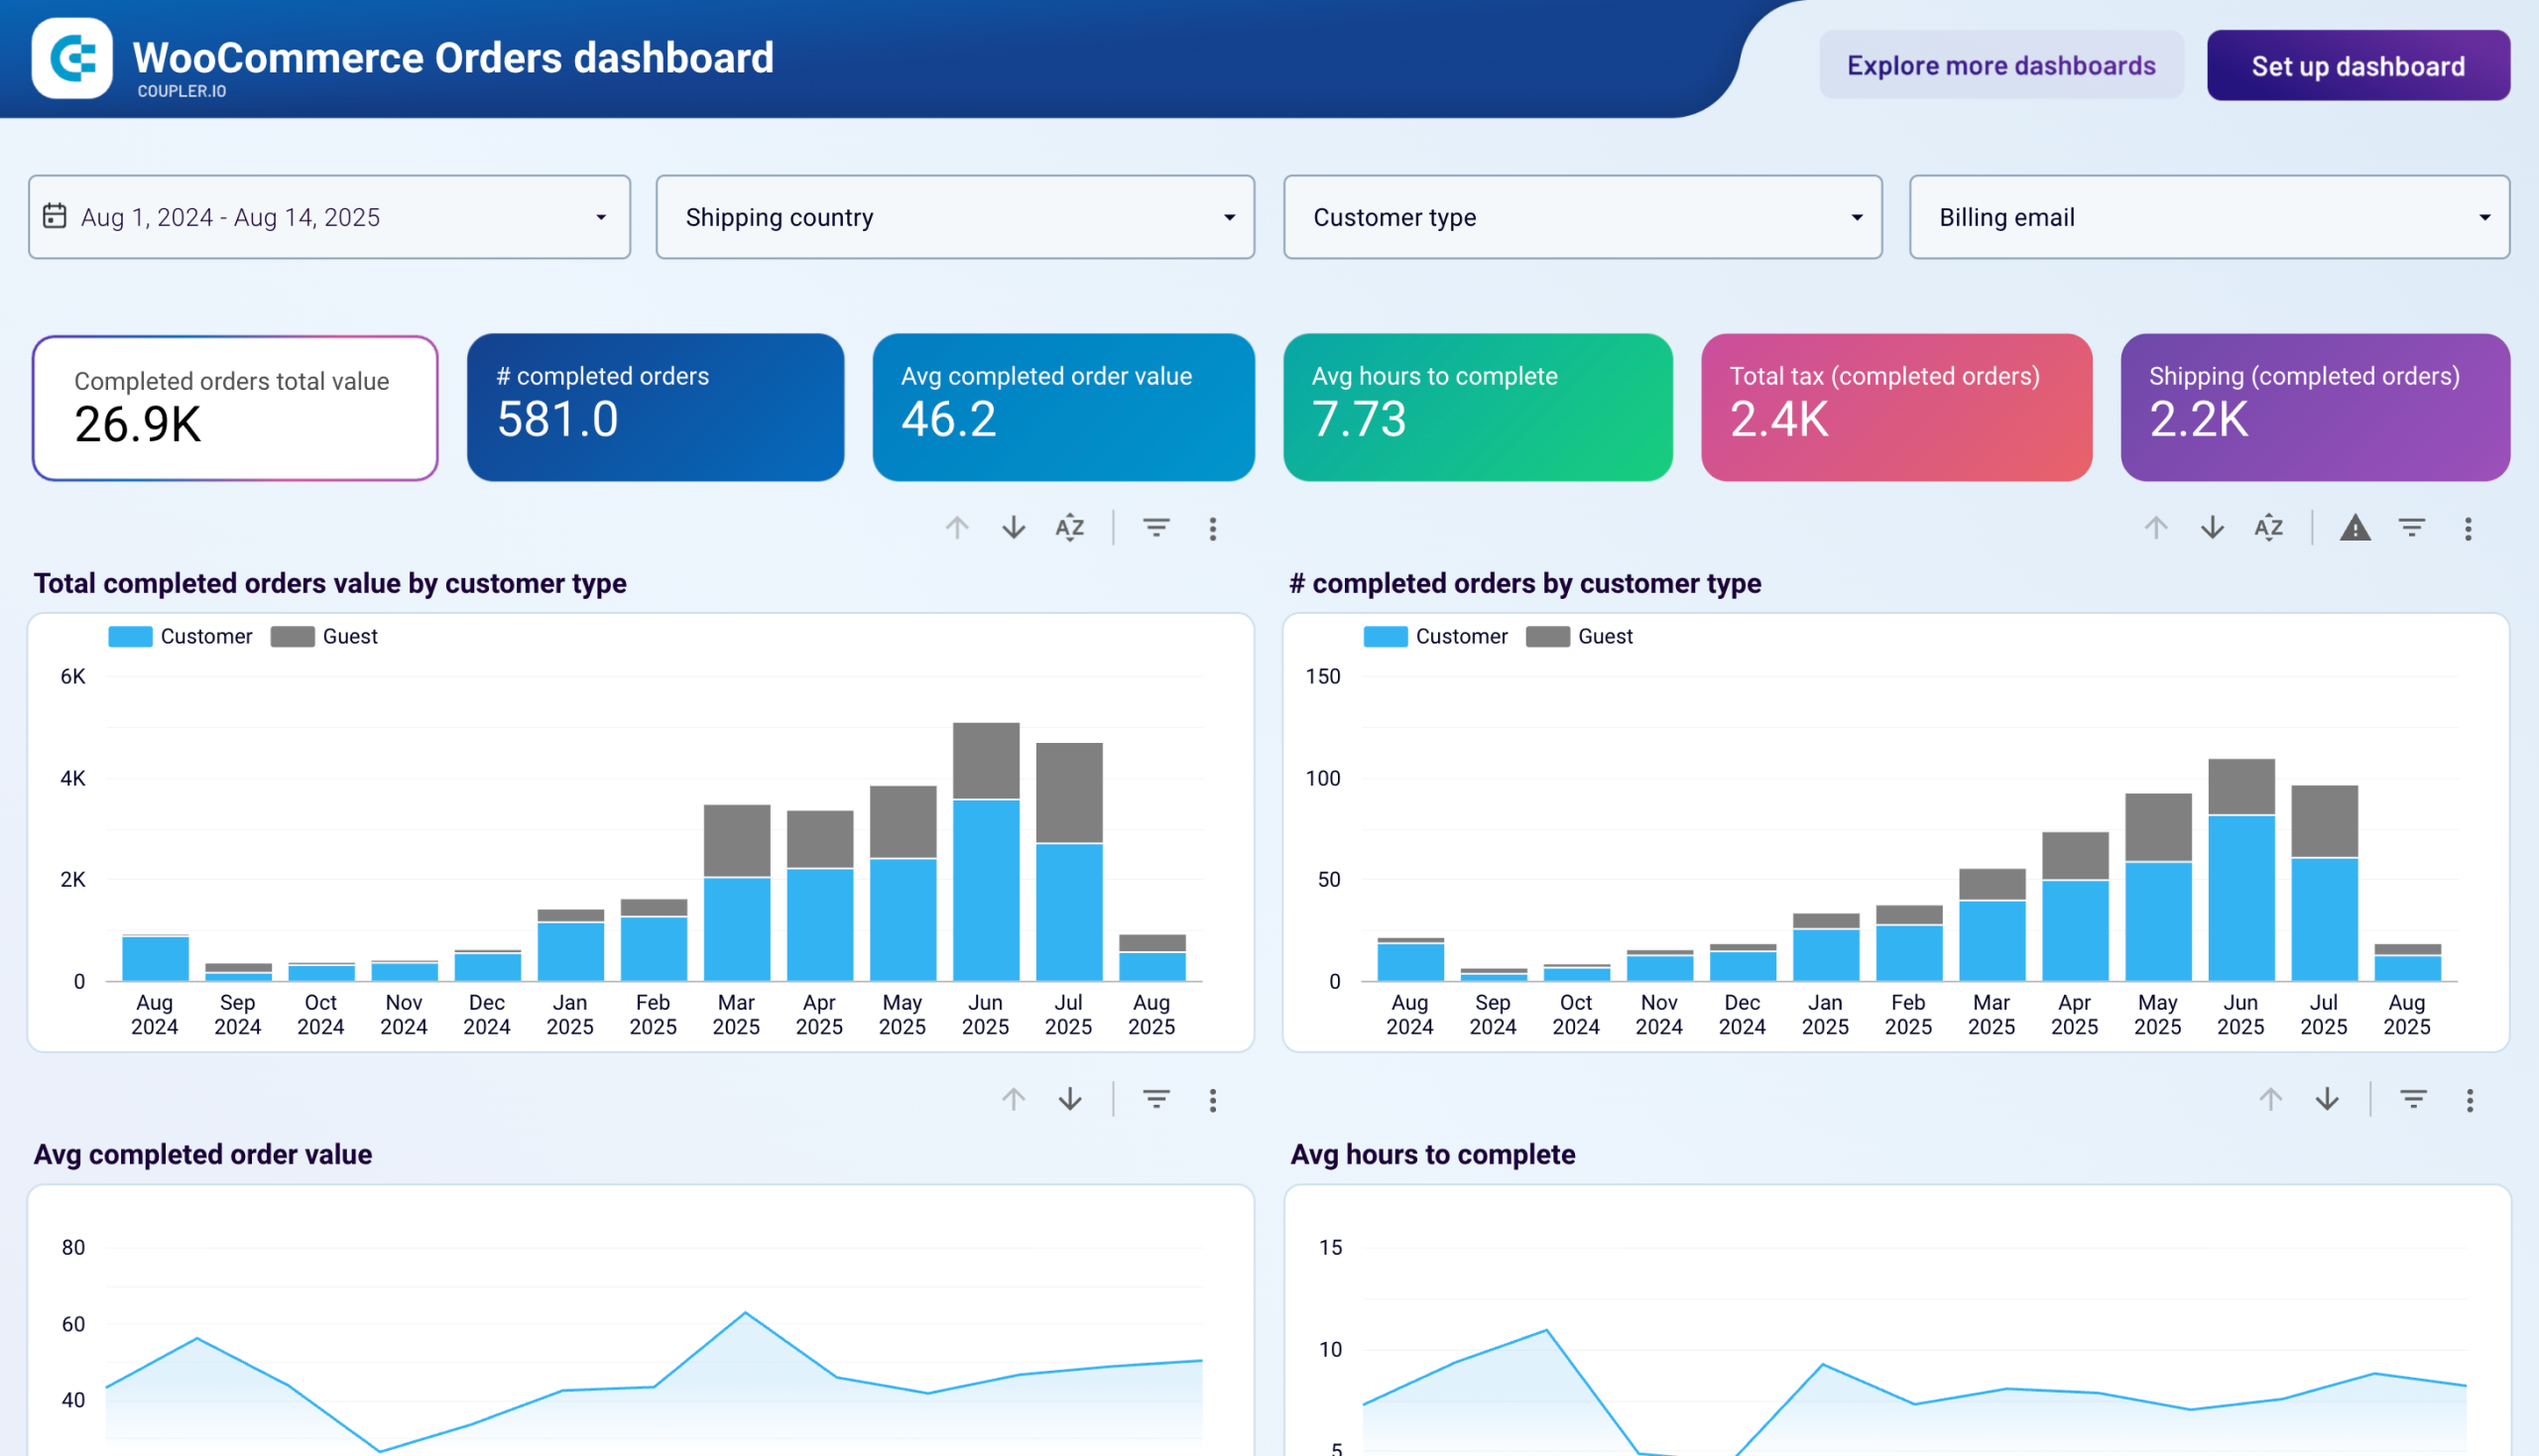
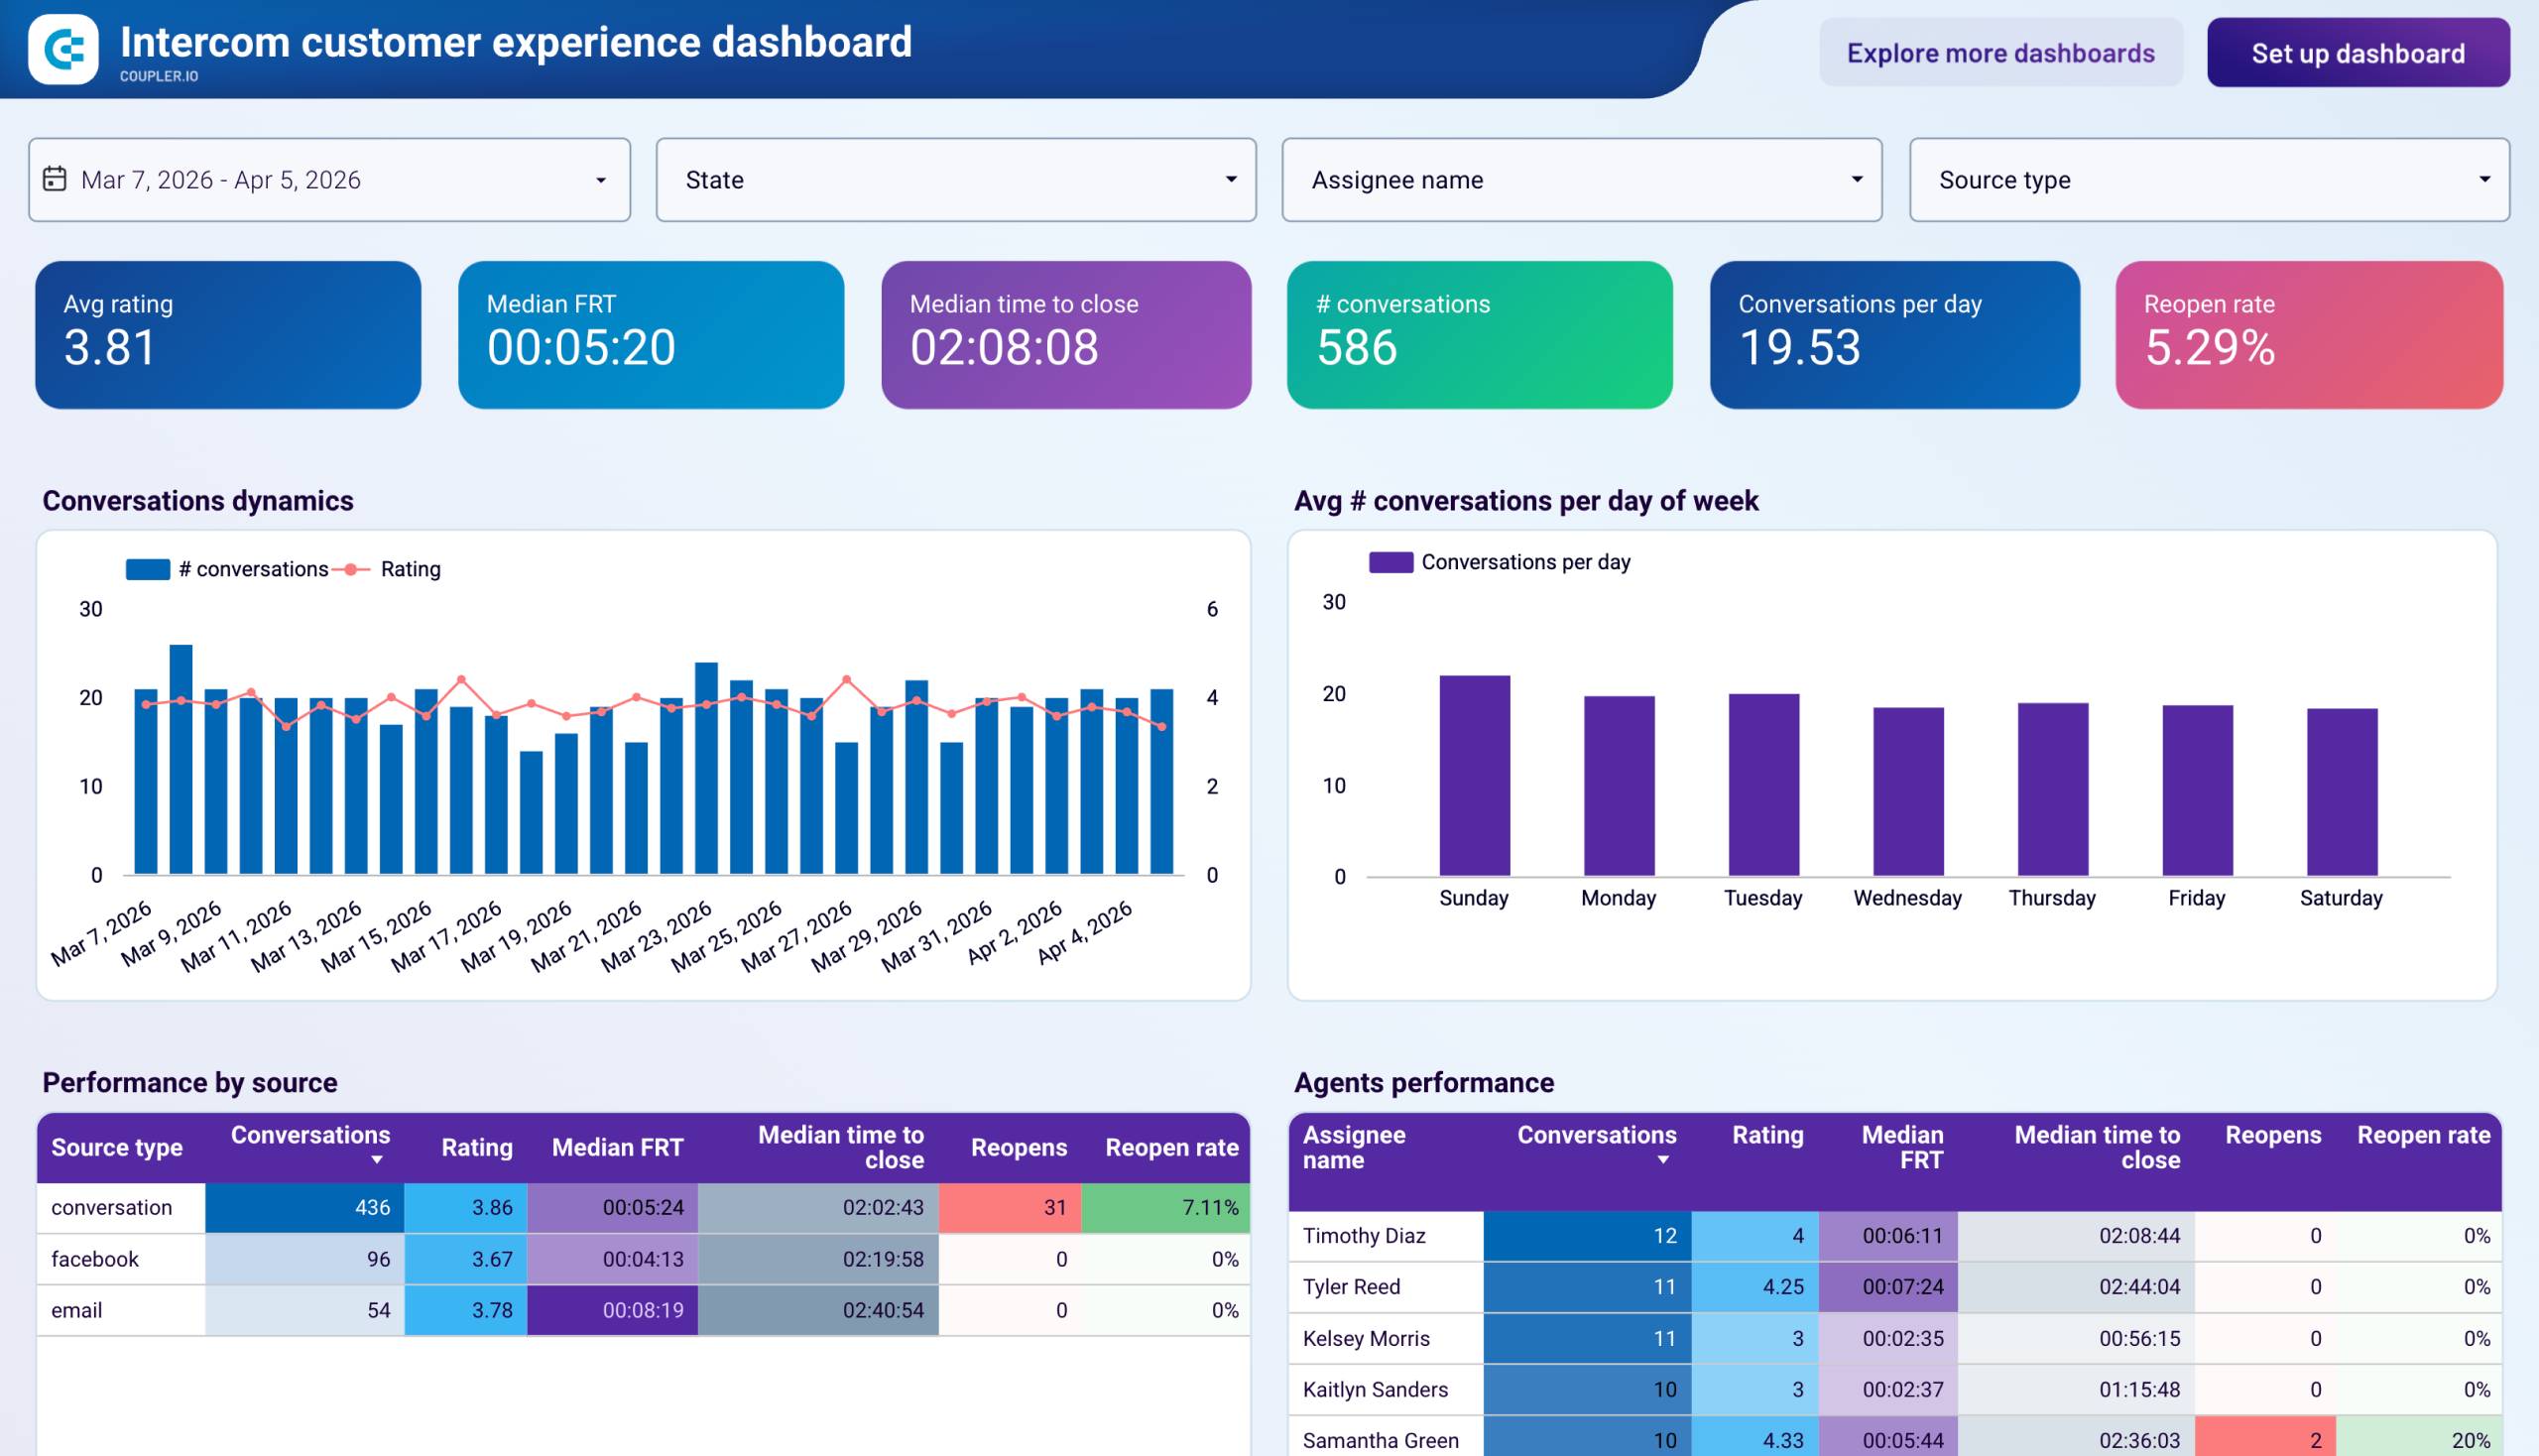
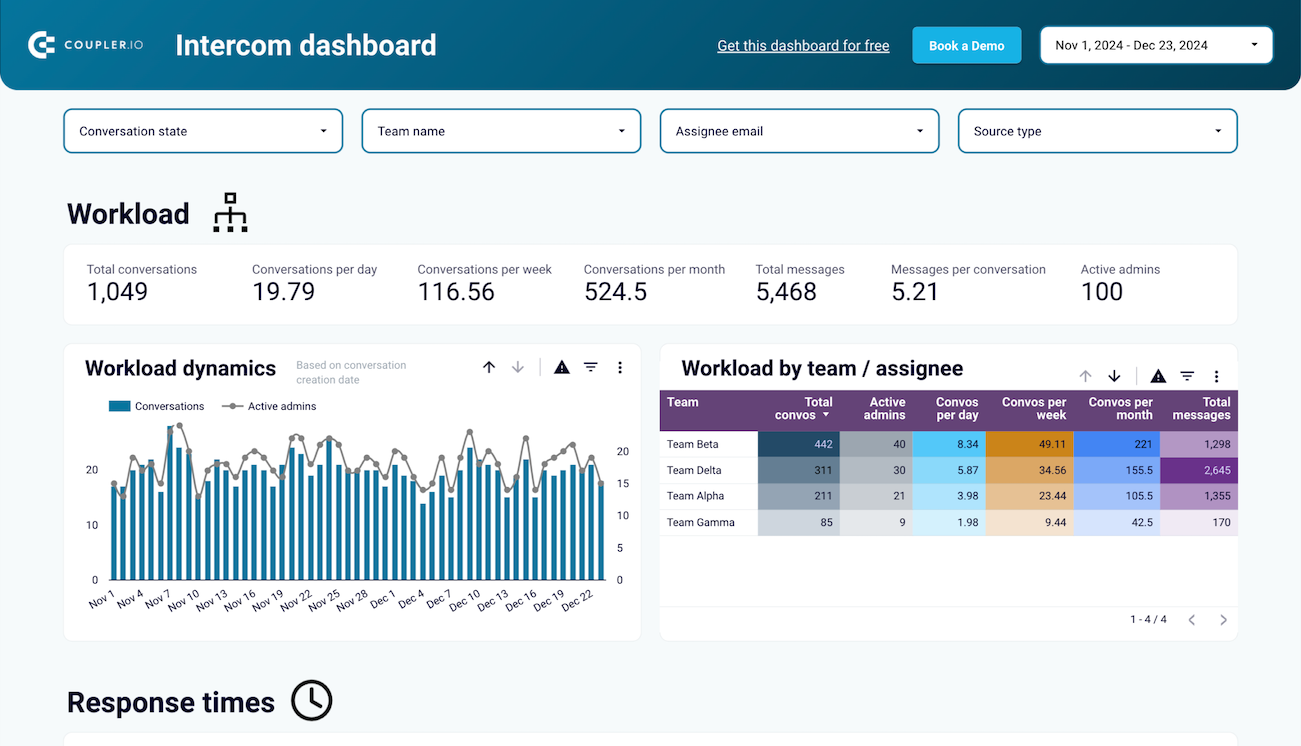
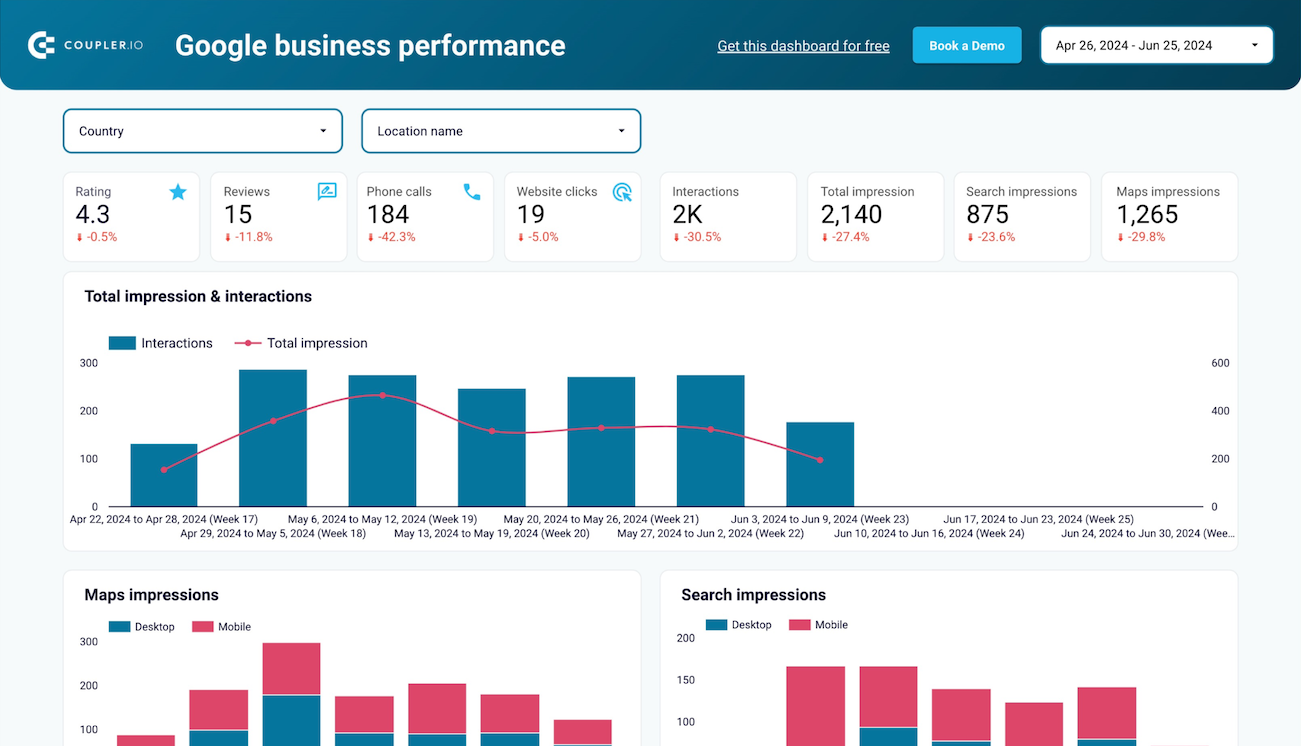
Quick start with our dashboards


 +3
+3


 +6
+6


 +5
+5
 +6
+6
 +3
+3

 +1
+1


 +4
+4
 +4
+4
 +2
+2
 +2
+2


 +5
+5
 +4
+4
 +5
+5
 +5
+5


 +3
+3

 +1
+1
 +3
+3


 +1
+1
 +3
+3
 +3
+3


 +2
+2


 +1
+1


 +1
+1


 +2
+2
 +3
+3
 +4
+4


about your case. It doesn't cost you a penny 😉