TikTok Ads dashboard examples and reporting templates
Track your TikTok advertising campaign metrics with automated reporting dashboards. Monitor impressions, clicks, conversions, average video play time, and spend across multiple accounts to optimize ROI. Make data-driven decisions with real-time insights to refine targeting strategies and maximize ad performance on one of the fastest-growing social media platforms.
TikTok ads dashboard examples for every need


 +3
+3


 +3
+3
 +1
+1
 +4
+4
 +4
+4

 +2
+2

 +2
+2

 +5
+5

 +4
+4
 +5
+5
 +5
+5
 +3
+3

 +1
+1
 +3
+3
 +2
+2

 +4
+4


about your case. It doesn't cost you a penny 😉
Choose your TikTok Ads dashboard template to kick off
What is a TikTok Ads dashboard?
Modern TikTok Ads dashboards go beyond native platform analytics by integrating performance data across multiple campaign objectives and account structures. With automated data refreshing through Coupler.io, these dashboards ensure you're working with the most up-to-date information without manual exports or data processing. By consolidating metrics from various campaigns and ad groups, the dashboard creates a single source of truth for your TikTok advertising efforts, enabling more efficient budget allocation and strategy refinement.

What reports should be included on a meaningful TikTok Ads reporting dashboard?
A comprehensive TikTok Ads dashboard should include several essential reports that provide complete visibility into your advertising performance. Based on our analysis of effective TikTok campaign monitoring, we recommend incorporating these four core report types:
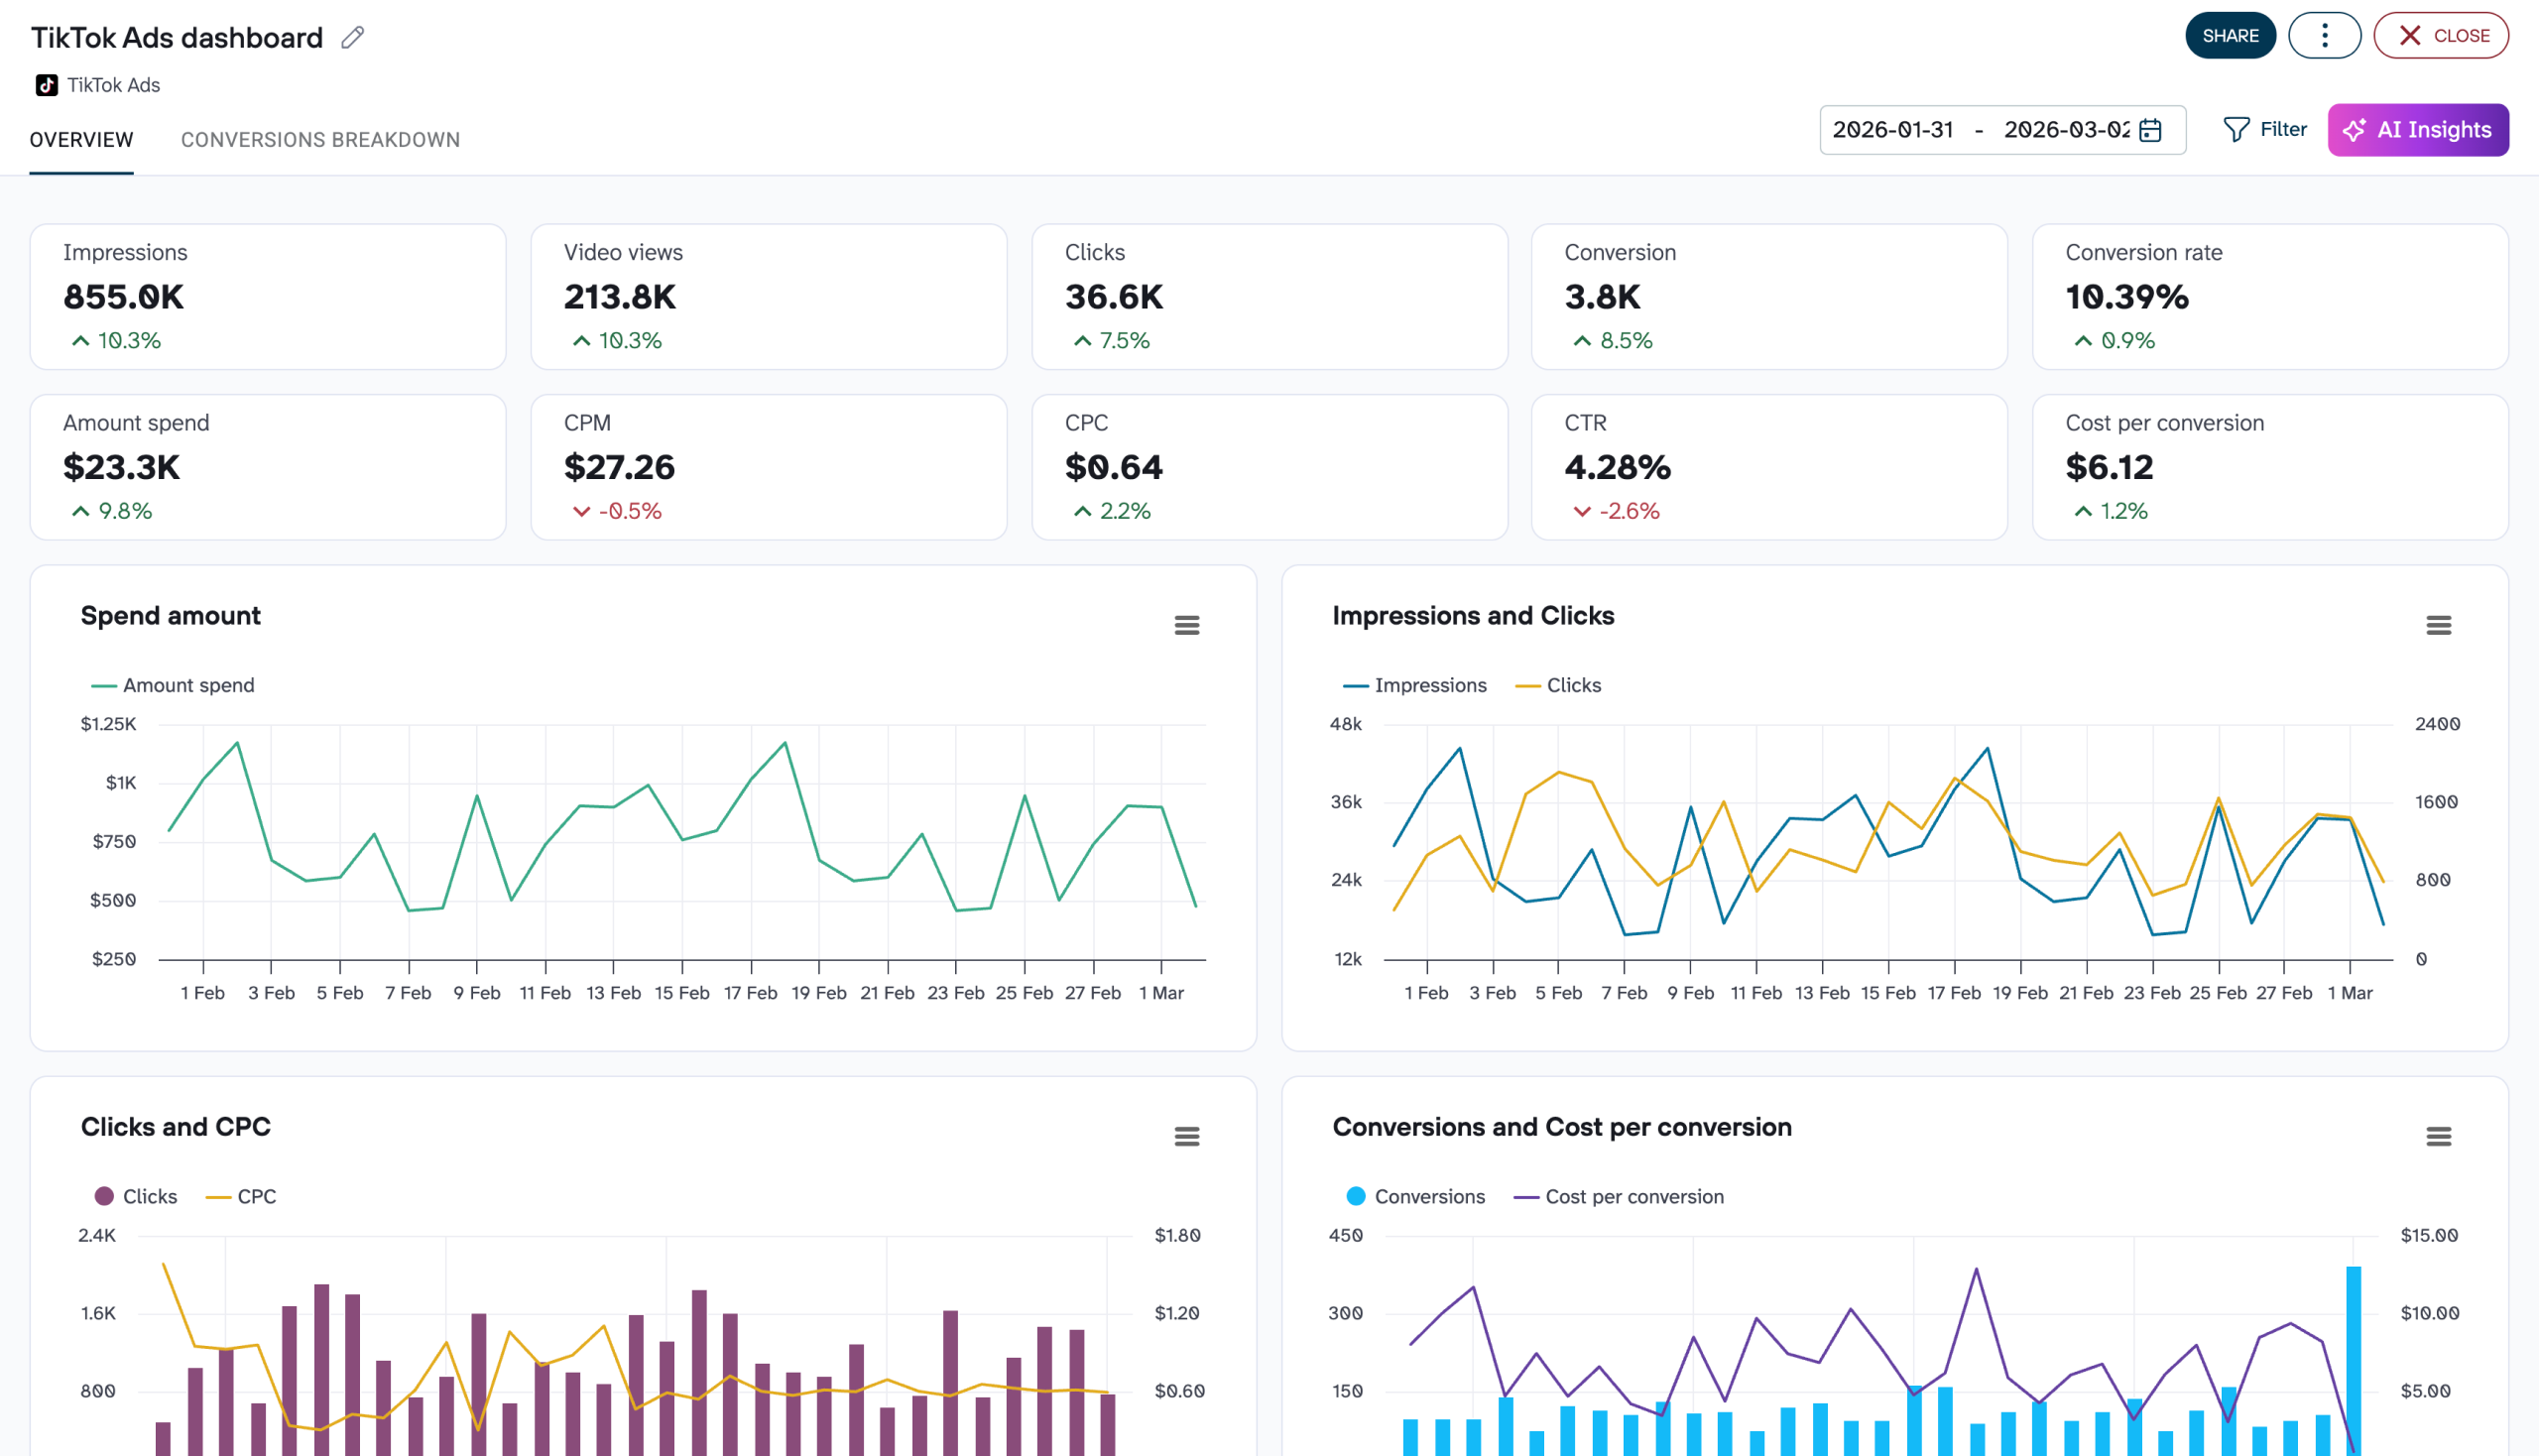
The performance overview report provides a high-level summary of your advertising effectiveness across all connected TikTok ad accounts. It displays aggregated data for essential metrics such as impressions, clicks, amount spent, and conversions, with comparison indicators showing performance changes compared to previous periods. This report includes filtering capabilities by account, campaign, or campaign objective, allowing you to assess performance quickly at various levels of granularity. The performance overview serves as your campaign command center, providing immediate insights into overall advertising effectiveness.
The campaign performance dynamics report tracks how your key metrics fluctuate over time, with visualization of daily or weekly trends for impressions, clicks, conversions, and spend. This report highlights correlations between metrics, such as how increasing impressions impacts click-through rates or how spend patterns affect conversion volumes. Line charts display performance fluctuations that might be missed in aggregate data, helping you identify seasonal patterns, detect anomalies, or measure the impact of campaign adjustments. These time-based insights are crucial for understanding performance evolution and informing future campaign optimization.
The audience insights report breaks down your campaign performance by demographic and geographic factors, including conversions by gender, platform/device, and age range. It features an interactive geo map showing performance by country, allowing you to filter by different metrics such as conversions, impressions, or clicks. This report helps you understand which audience segments are most responsive to your ads, enabling more precise targeting adjustments. By identifying high-performing audience segments, you can refine your targeting strategy, customize creative elements, and allocate your budget more effectively to maximize campaign impact.
The budget and campaign comparison report provides a detailed breakdown of all campaign metrics in a comprehensive table format, allowing side-by-side evaluation of performance across different campaigns and ad groups. It includes metrics like amount spent, impressions, clicks, CTR, CPC, and conversions, enabling you to identify your most and least efficient campaigns. This report helps you understand where your advertising budget is being allocated and which campaigns deliver the best return on investment. With this information, you can make data-driven decisions about budget reallocation, campaign scaling, or optimization priorities.
What insights you can get with the TikTok Ads dashboard
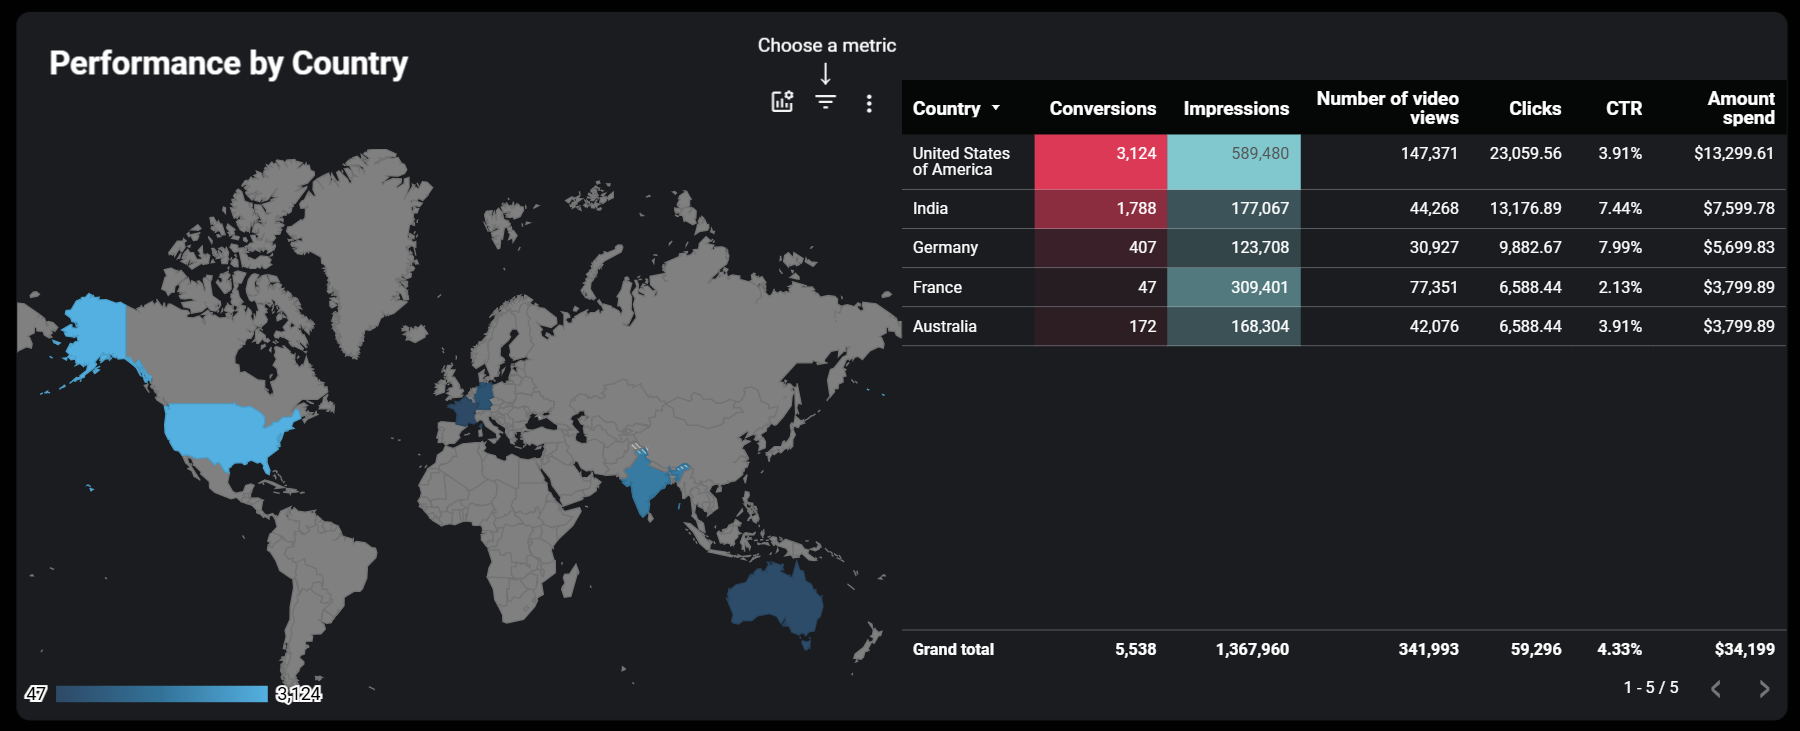
The TikTok Ads reporting dashboard provides a visualized performance breakdown by country that reveals which regions drive the strongest results for your campaigns. You can select different metrics like conversions, impressions, or clicks to display on the map, obtaining a clear picture of geographic performance variations. This insight helps you identify high-performing markets where you should increase investment, as well as underperforming regions that may require strategy adjustments. With this geographic intelligence, you can create more targeted campaigns that address regional preferences and behaviors.
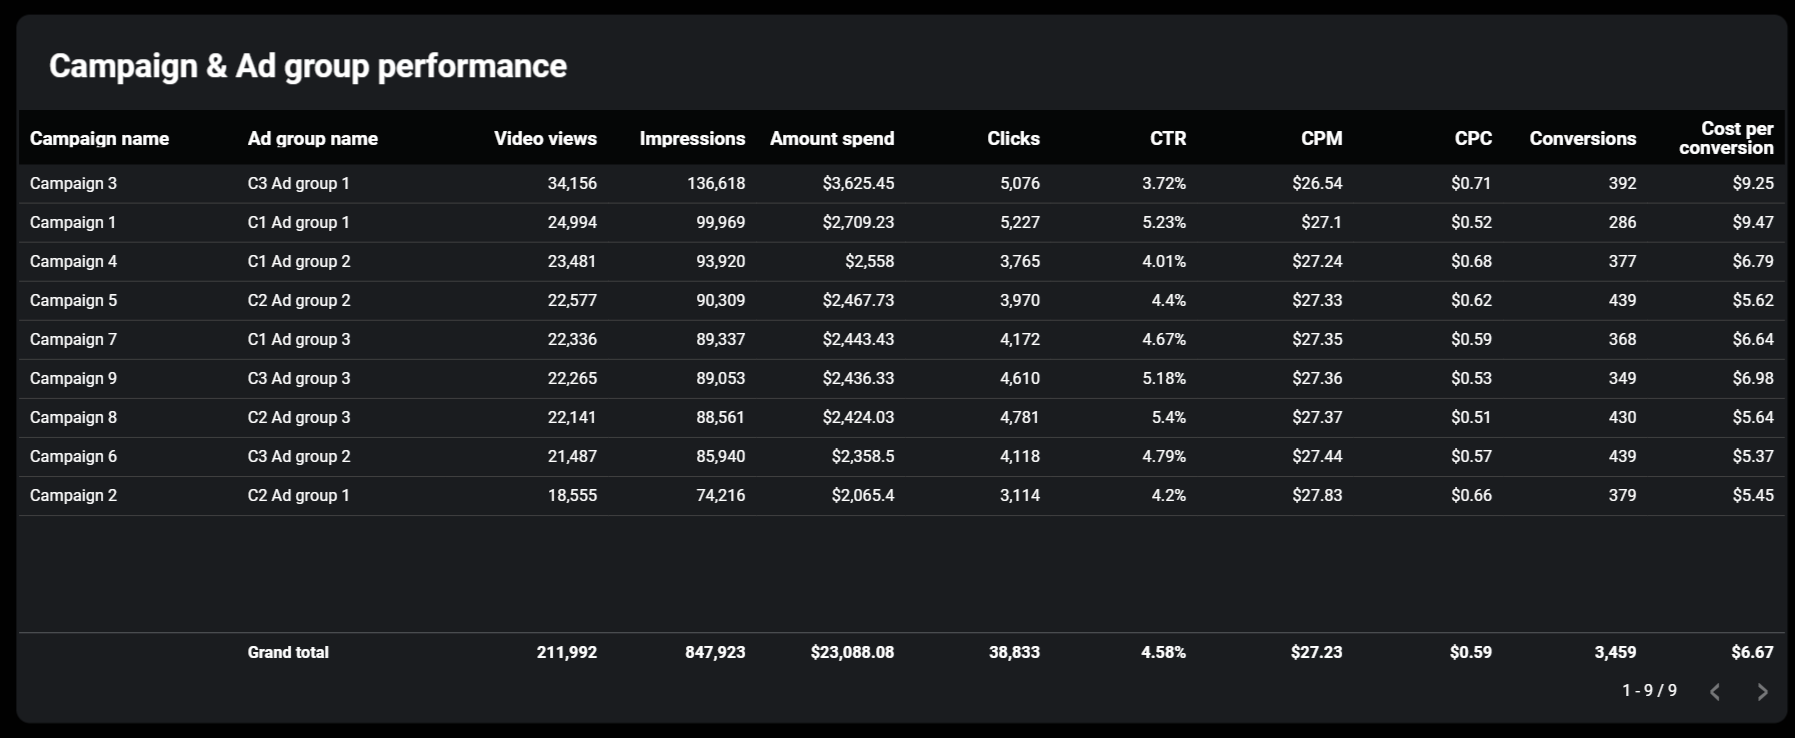
The dashboard features a comprehensive comparison table displaying all campaign metrics in one consolidated view. You can quickly analyze critical performance indicators like impressions, clicks, spend, CTR, and conversions across all your campaigns and ad groups. This detailed breakdown enables you to identify which campaigns are generating the strongest results and which may need optimization or reconsideration. The comparative format makes it simple to spot performance patterns that might be missed when viewing campaigns in isolation.
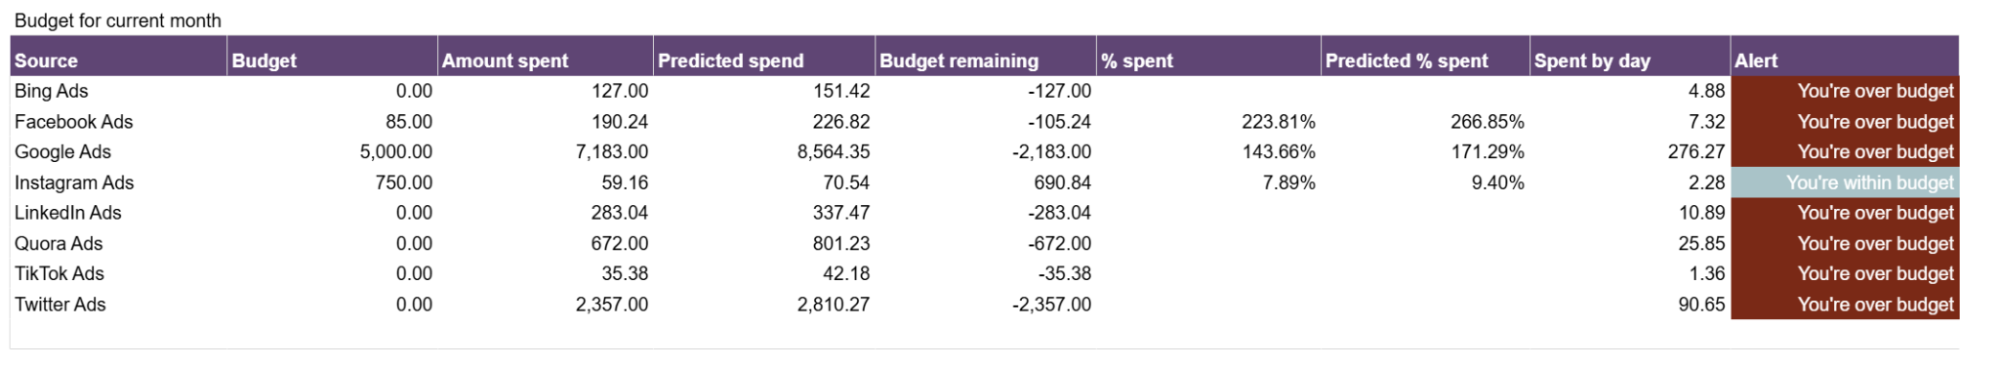
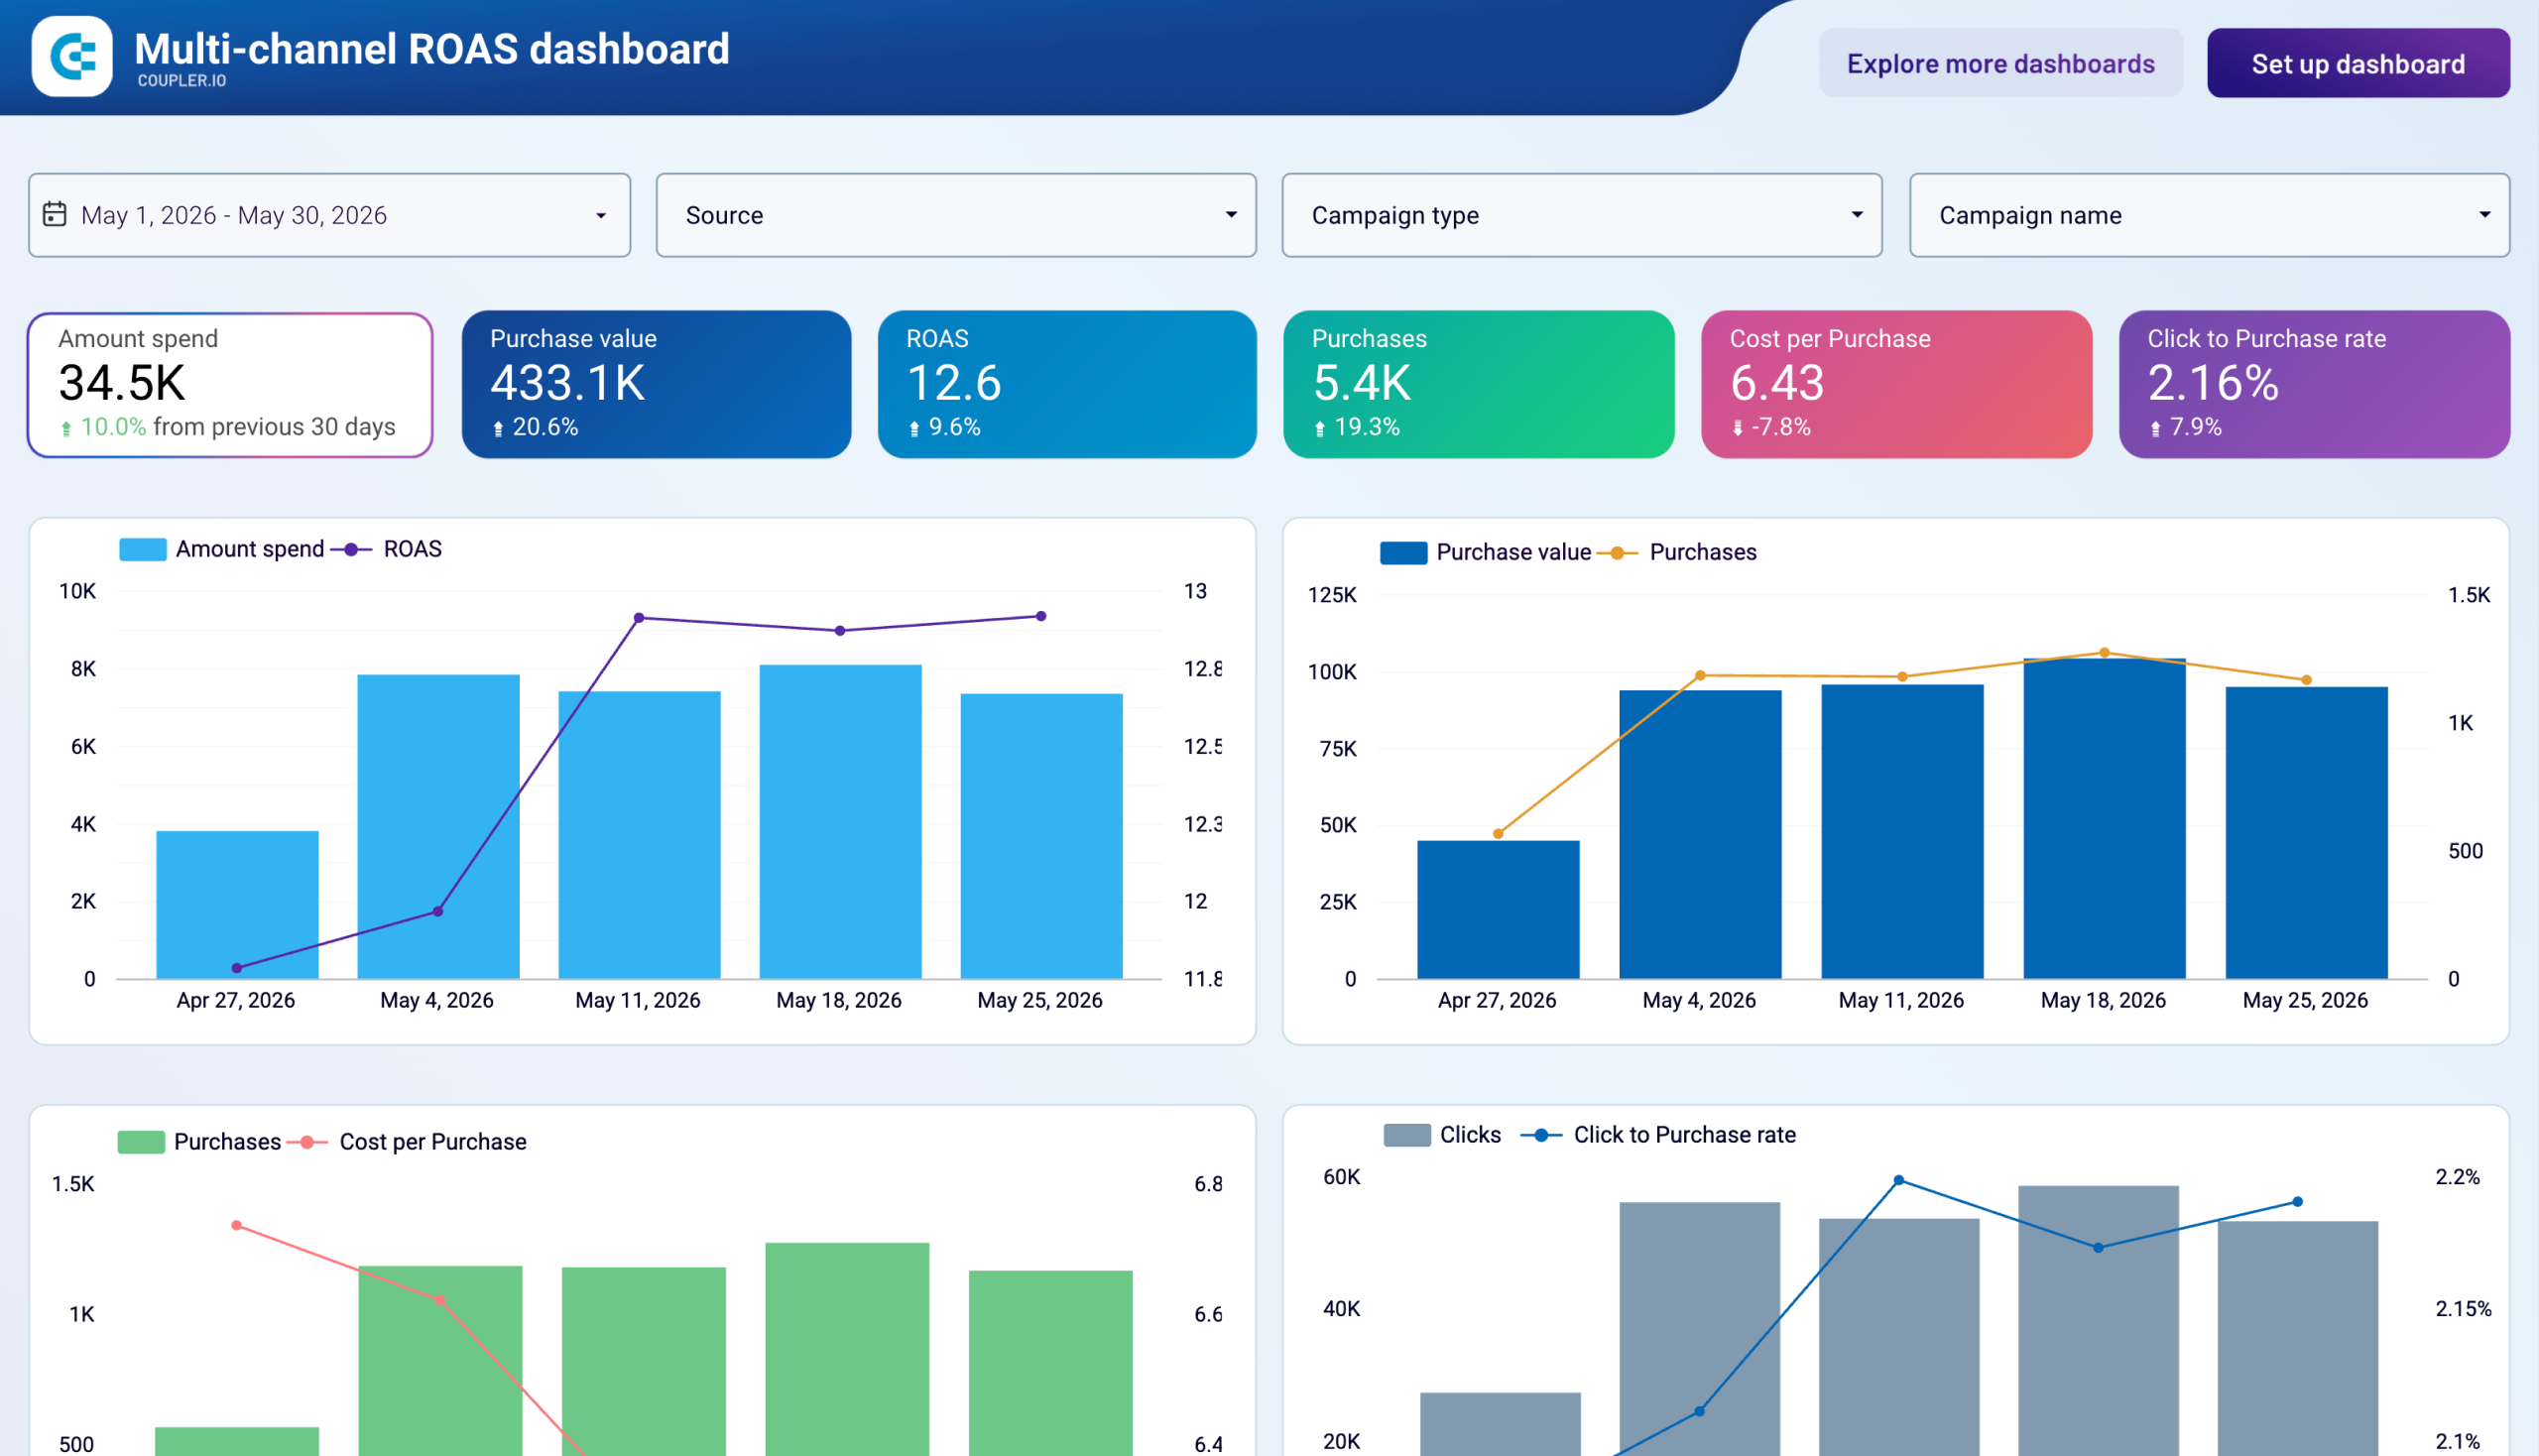
The PPC multi-channel dashboard with budget tracking allows you to monitor your TikTok Ads spending against allocated budgets with precision. You can track monthly spending dynamics, visualize performance against budget targets, and identify trends in your advertising investment. This insight helps prevent overspending and ensures efficient budget utilization across campaigns. By understanding how your actual spend compares to planned budgets over time, you can make timely adjustments to campaign parameters and maintain financial control.
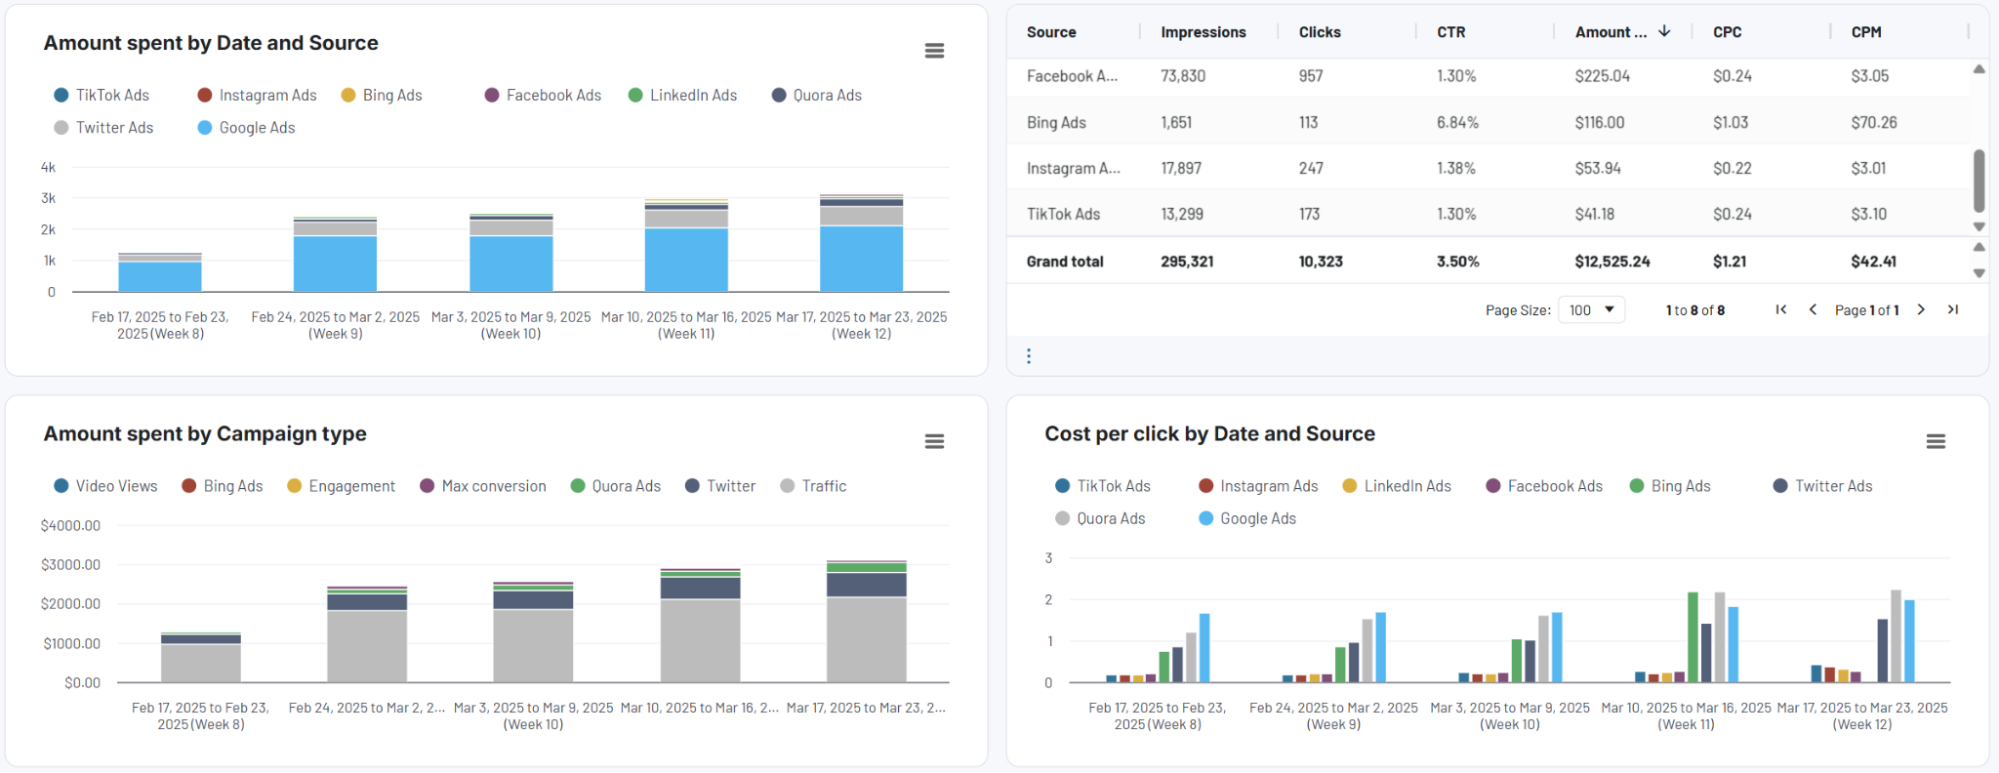
The multi-channel dashboard enables you to compare TikTok Ads performance directly against other advertising platforms like Facebook, Google, or LinkedIn. You can analyze metrics like CPC, CPM, CTR, and amount spend rates across platforms to understand where your advertising dollars generate the best returns. This comprehensive view helps you optimize your overall digital advertising strategy by identifying which platforms deserve more investment for specific campaign objectives. The ability to evaluate performance across channels provides a strategic advantage in budget allocation.
How to create a TikTok reporting dashboard?

Metrics you can track with a TikTok Ads dashboard template
Monitor how often your TikTok Ads appear in users' feeds with the impressions metric. This visibility indicator helps you understand your brand's reach on the platform and how changes in targeting or bid strategies impact ad exposure. By analyzing impression trends over time, you can identify performance patterns, measure campaign scalability, and determine how effectively your ads compete for attention in TikTok's algorithm.
Track the number of times users interact with your ads by tapping on them. The clicks metric provides a direct measure of audience interest and ad relevance, serving as a key indicator of creative effectiveness. Analyzing click volume alongside impressions helps you calculate click-through rates and evaluate whether your content successfully captures attention in TikTok's fast-paced environment, informing decisions about creative optimization.
Monitor the number of users who complete desired actions after viewing or clicking on your ads. The conversions metric tracks valuable activities like app installations, form submissions, or purchases, providing a direct measure of campaign effectiveness. This insight allows you to evaluate return on investment and identify which campaigns, audiences, and creatives drive the most meaningful business results.
Measure the percentage of users who click on your ad after seeing it. CTR serves as a key indicator of ad relevance and creative effectiveness, with higher rates suggesting stronger audience resonance. Monitoring CTR trends helps you evaluate whether your creative approach, messaging, and call-to-action are compelling enough to inspire action from TikTok users, guiding improvements to ad design and targeting.
Track how much you pay, on average, for each click on your TikTok Ads. This efficiency metric helps you evaluate the cost-effectiveness of your campaigns and determine whether you're getting value for your advertising investment. By comparing CPC across different campaigns and time periods, you can identify optimization opportunities and make informed decisions about budget allocation.
Monitor the cost you pay for every thousand impressions your ads receive. CPM provides insight into how efficiently your budget generates visibility, helping you understand market competition and audience targeting costs. By tracking CPM alongside other metrics, you can evaluate whether your impressions are delivering subsequent engagement at a reasonable cost, informing adjustments to bidding strategies and audience targeting.
Measure how long users watch your video ads on average. This engagement metric helps you understand content effectiveness and audience interest levels, with longer view times generally indicating more compelling creative. By analyzing which videos maintain attention and which lose viewers quickly, you can refine content strategies to better match TikTok's unique viewing patterns and audience preferences.
Break down conversion performance by age, gender, and device type to identify your most responsive audience segments. This demographic insight helps you understand which user groups deliver the best return on investment, enabling more precise targeting and custom creative approaches. By recognizing performance patterns across different demographic segments, you can refine audience targeting and develop more resonant messaging for specific user groups.
Track how your advertising budget is distributed across different TikTok campaigns or in comparison to other advertising platforms. This allocation metric helps you understand where your resources are concentrated and whether the distribution aligns with performance outcomes. By analyzing spend patterns alongside results, you can identify opportunities to shift budget toward more effective campaigns or platforms, maximizing overall advertising efficiency.