TikTok dashboard examples and reporting templates
Gain complete visibility into your TikTok performance with an automated dashboard template that tracks your organic content effectiveness. Monitor engagement metrics, analyze top-performing videos, understand audience demographics, and track profile growth through intuitive visualizations that update automatically. Use our TikTok dashboards to make data-driven decisions to optimize your TikTok strategy without manual reporting.
TikTok dashboard examples for every need


about your case. It doesn't cost you a penny 😉
Choose your TikTok dashboard template to kick off
What is a TikTok dashboard?
The TikTok analytics dashboard addresses specific challenges by capturing the platform's rapid content cycles and algorithm changes that often make manual tracking ineffective. For creators and marketers, it reveals which content elements drive virality, how sound choices impact engagement, and which hashtag challenges generate participation. With Coupler.io's automated data refreshing, you maintain continuous visibility into TikTok's fast-evolving trends without time-consuming exports. This enables you to quickly adapt content strategies, identify emerging audience interests, and optimize your videos based on TikTok's unique performance indicators and audience behaviors.

What reports should be included on a meaningful TikTok analytics dashboard?
A comprehensive TikTok analytics dashboard should include several key reports that provide complete visibility into your organic content performance. Based on our analysis of effective TikTok analytics, we recommend incorporating these essential report types:
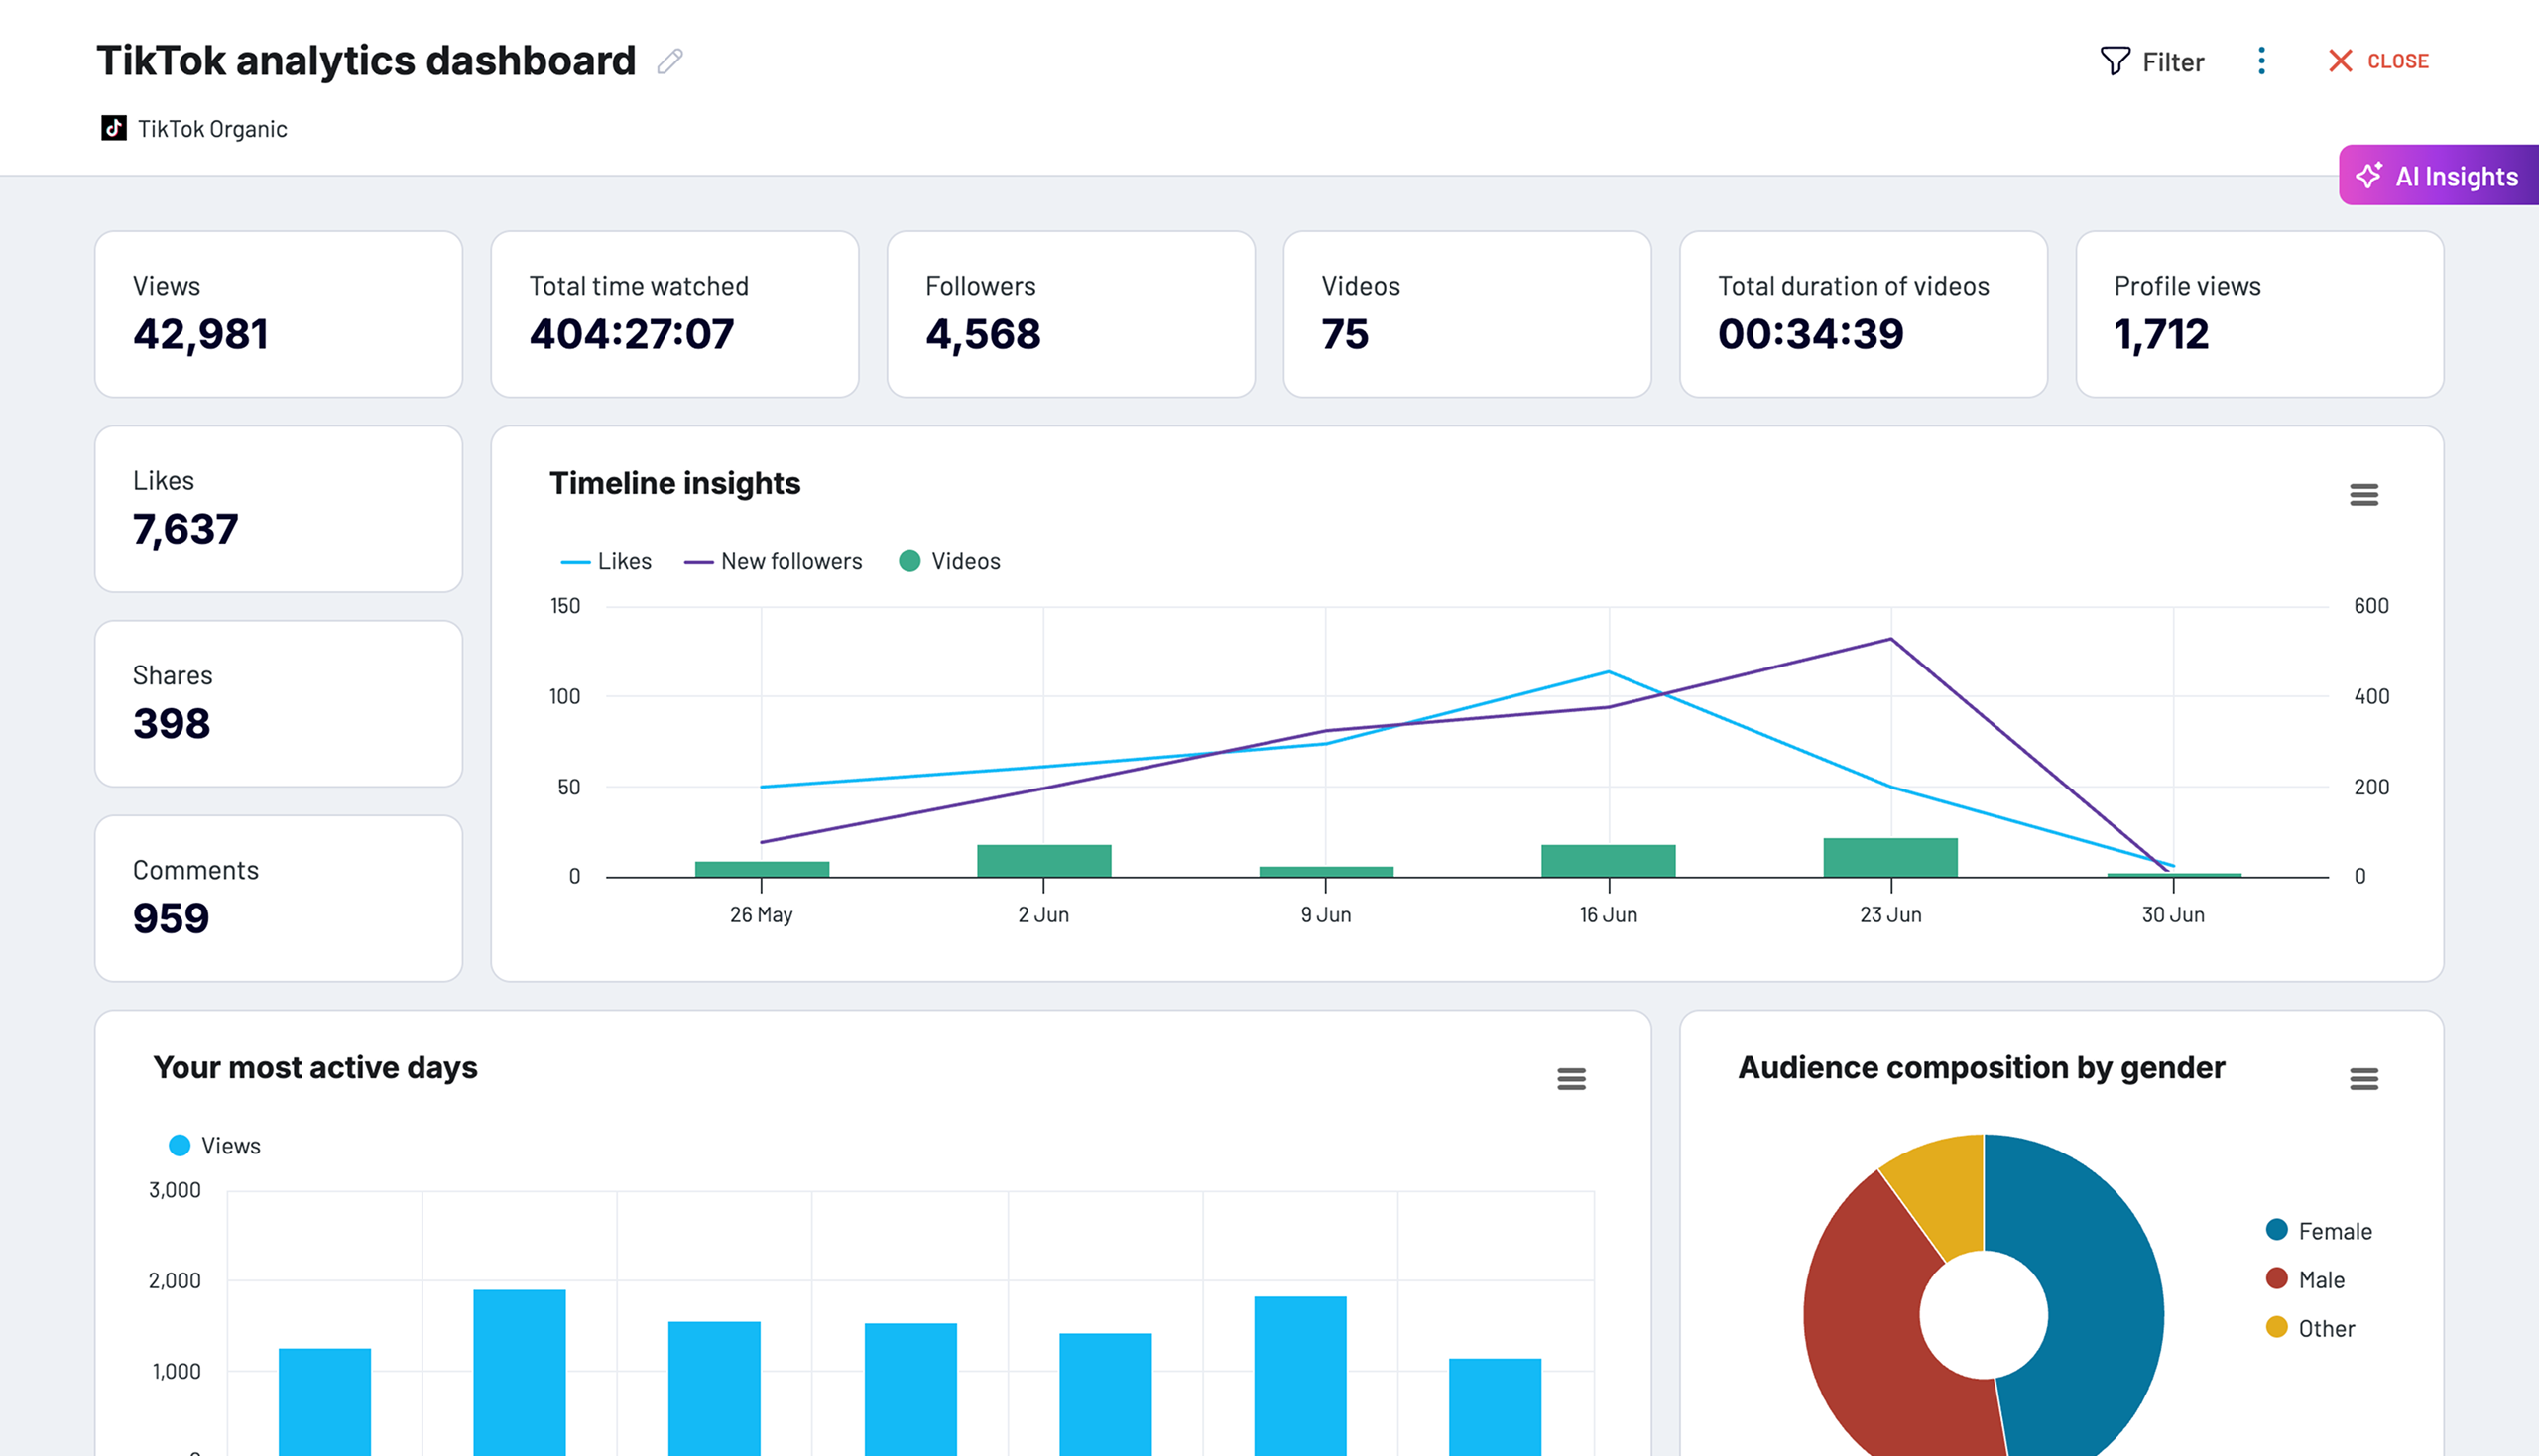
The organic engagement report provides a clear visualization of your content's performance funnel, tracking how users interact with your videos from views to more active forms of engagement. This report shows the progression from views to likes, shares, and comments, helping you understand how effectively your content resonates with viewers. It includes metrics like total time watched, profile views, and follower growth to give you a complete picture of audience interest and channel growth. These insights are crucial for understanding content effectiveness and optimizing future video strategies.
The content performance report identifies your most successful TikTok videos based on engagement metrics and audience response. It provides a ranked list of videos with detailed metrics on views, likes, shares, and comments, allowing you to identify common elements in high-performing content. The report helps you recognize patterns in successful videos, whether it's content themes, video length, hashtag usage, or posting times. This analysis is vital for refining your content strategy and consistently creating videos that resonate with your audience.
The profile growth report tracks your TikTok account's development over time, monitoring follower counts, profile views, and overall account visibility. It visualizes growth trends and correlates them with content publishing and engagement metrics, helping you understand which factors drive channel expansion. The report shows how consistently your profile is growing and identifies potential plateaus or acceleration periods. These insights help you develop sustainable growth strategies and understand the long-term impact of your content approach.
The audience insights report provides detailed demographic information about your TikTok followers and viewers. It breaks down your audience by location, gender, and other available demographic data, giving you a comprehensive understanding of who engages with your content. The report highlights geographic regions where your content performs best and shows audience composition changes over time. These insights enable more targeted content creation, ensuring your TikTok strategy reaches and resonates with the right people.
What insights you can get with the TikTok dashboard
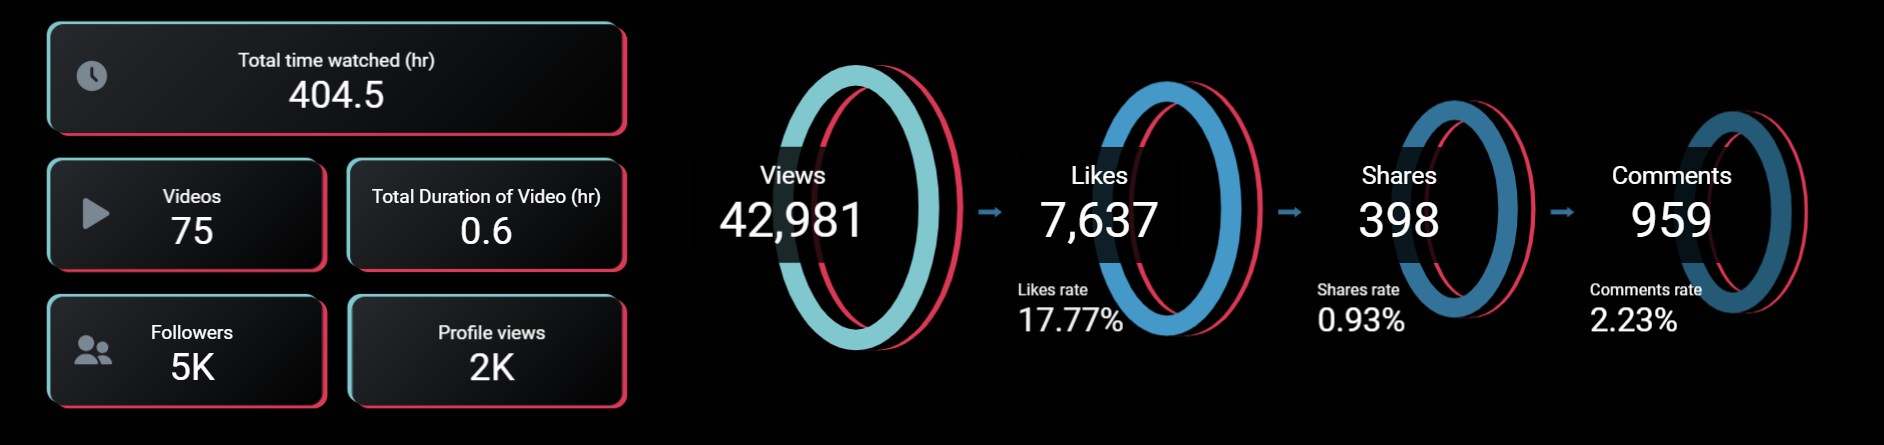
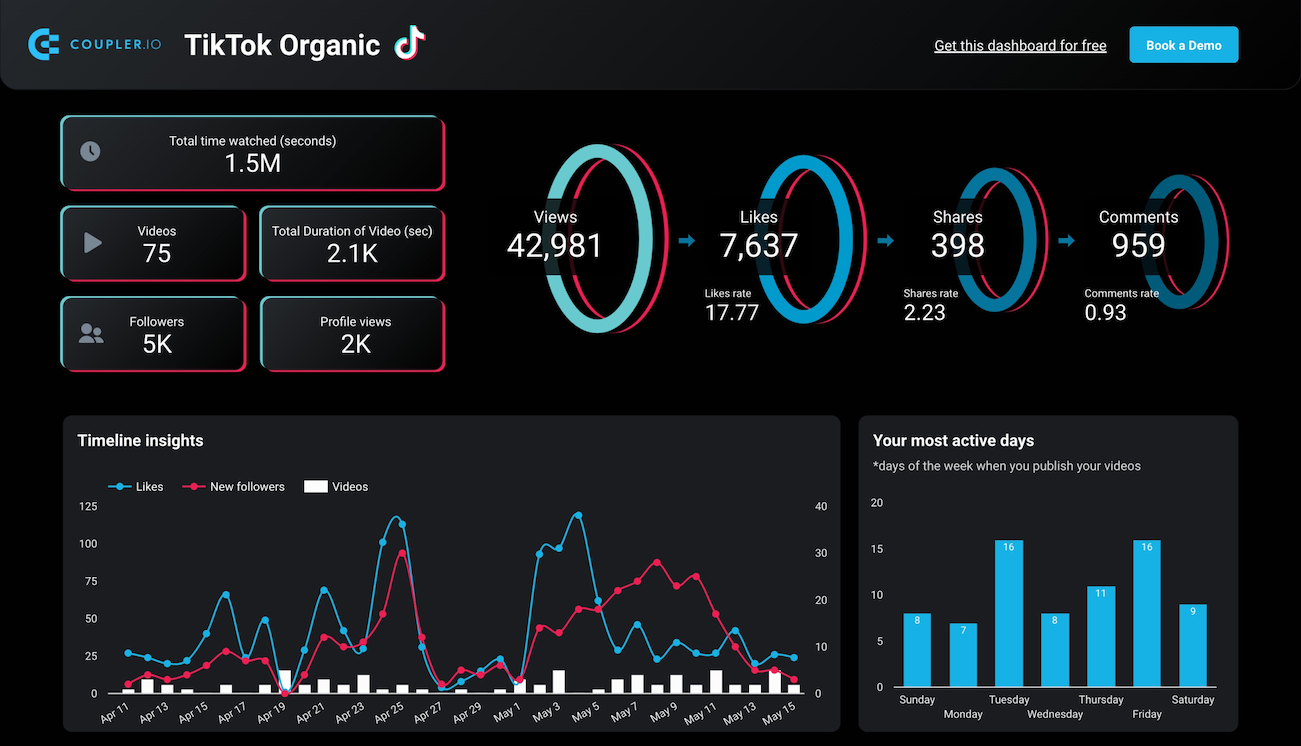
The dashboard provides a clear visualization of your TikTok engagement funnel, showing the progression from Views → Likes → Shares → Comments. This insight helps you identify where audience engagement drops off and which videos maintain interest throughout the funnel. By understanding these conversion rates, you can refine your content strategy to improve engagement at each stage and optimize video elements that drive deeper interaction with your audience.
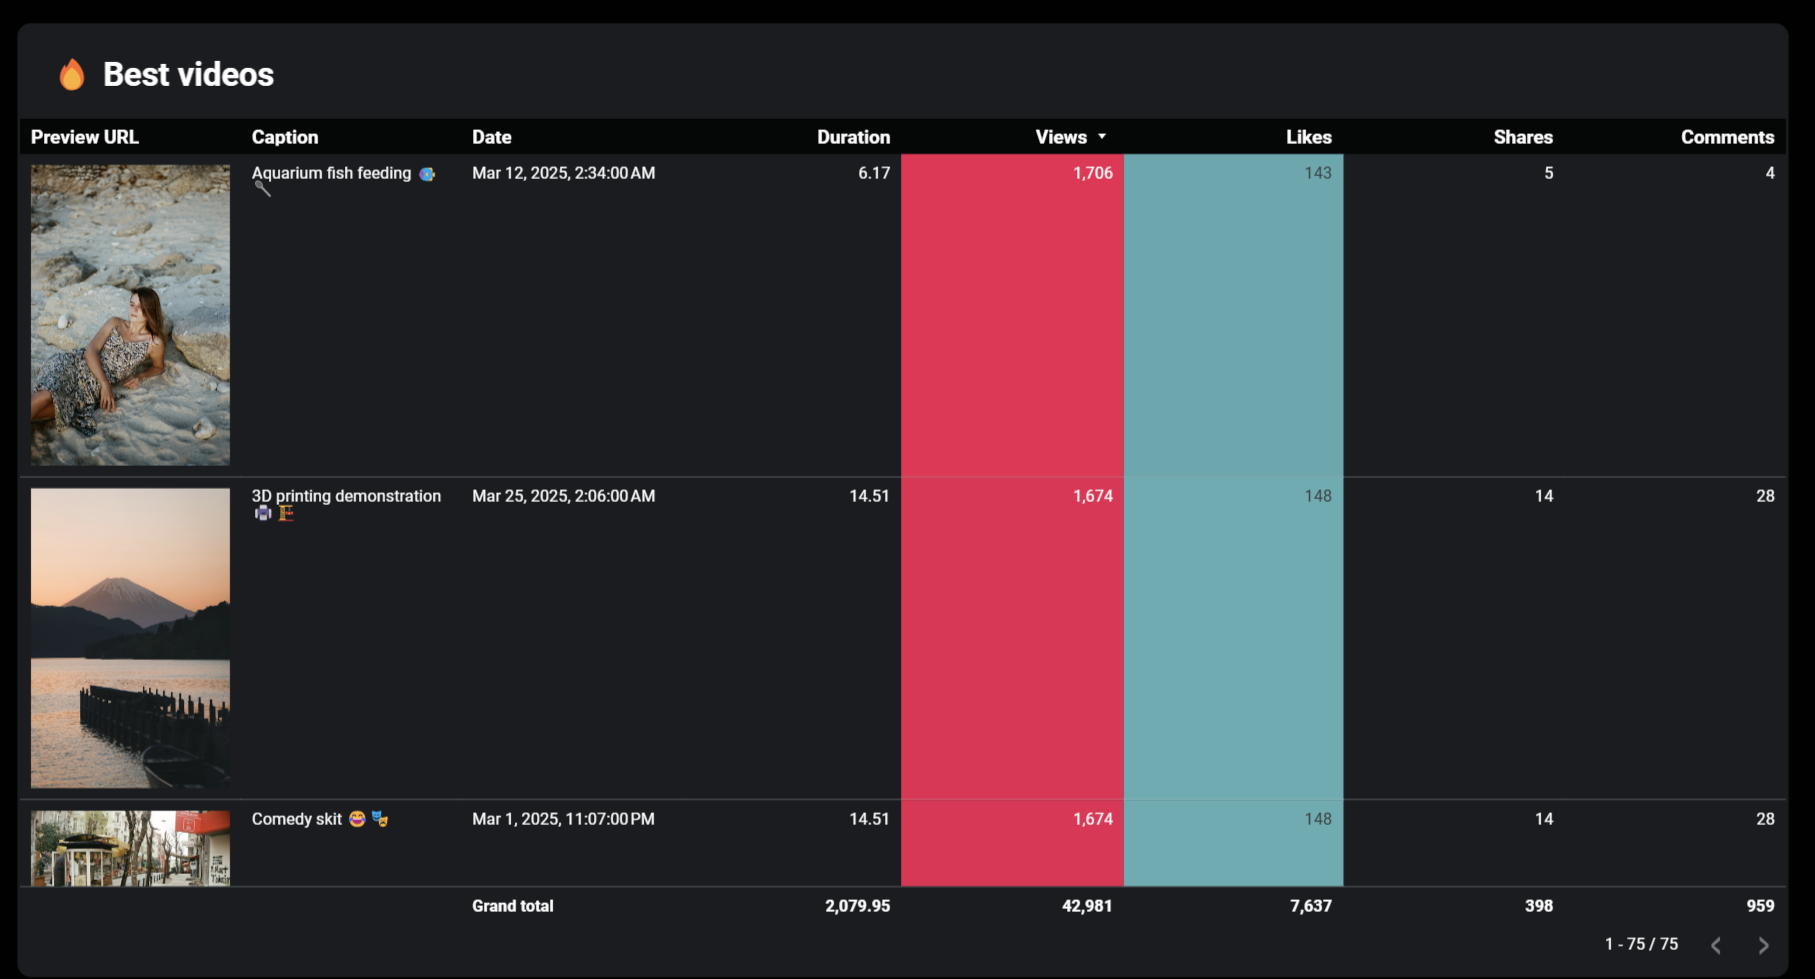
Track your top-performing TikTok content with a comprehensive list of videos ranked by engagement metrics. The dashboard displays key performance indicators for each video, allowing you to identify trends in successful content and understand what resonates most with your audience. This data-driven approach helps you replicate success by recognizing patterns in video topics, styles, or posting times that generate the strongest audience response.
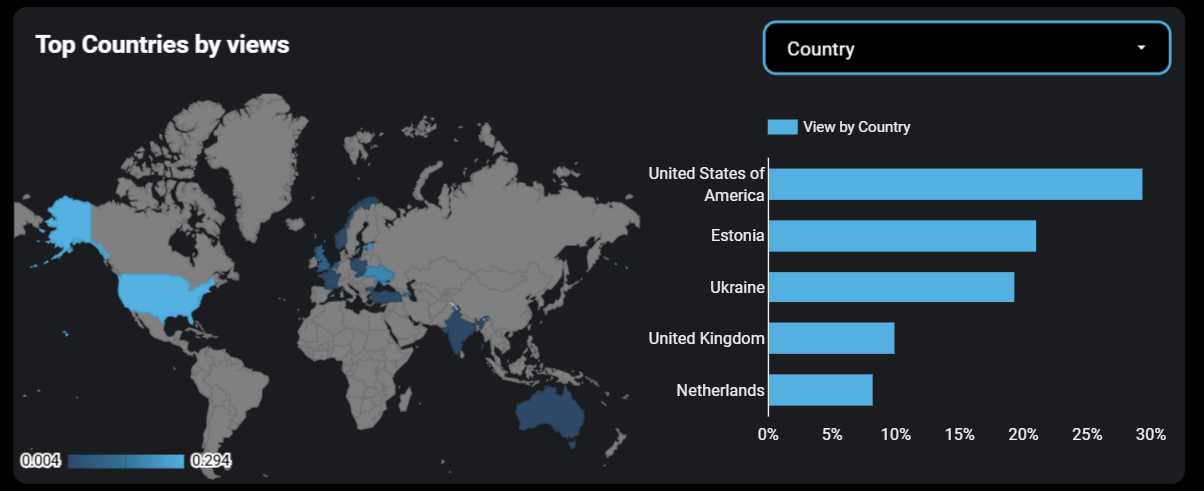
Gain insights into where your audience is located with geographical breakdown visualizations that show which countries and regions engage most with your content. This helps you understand cultural preferences and time zone considerations that might impact your content strategy. By identifying regions with high engagement, you can create more culturally relevant content or adjust posting schedules to maximize visibility when your audience is most active.
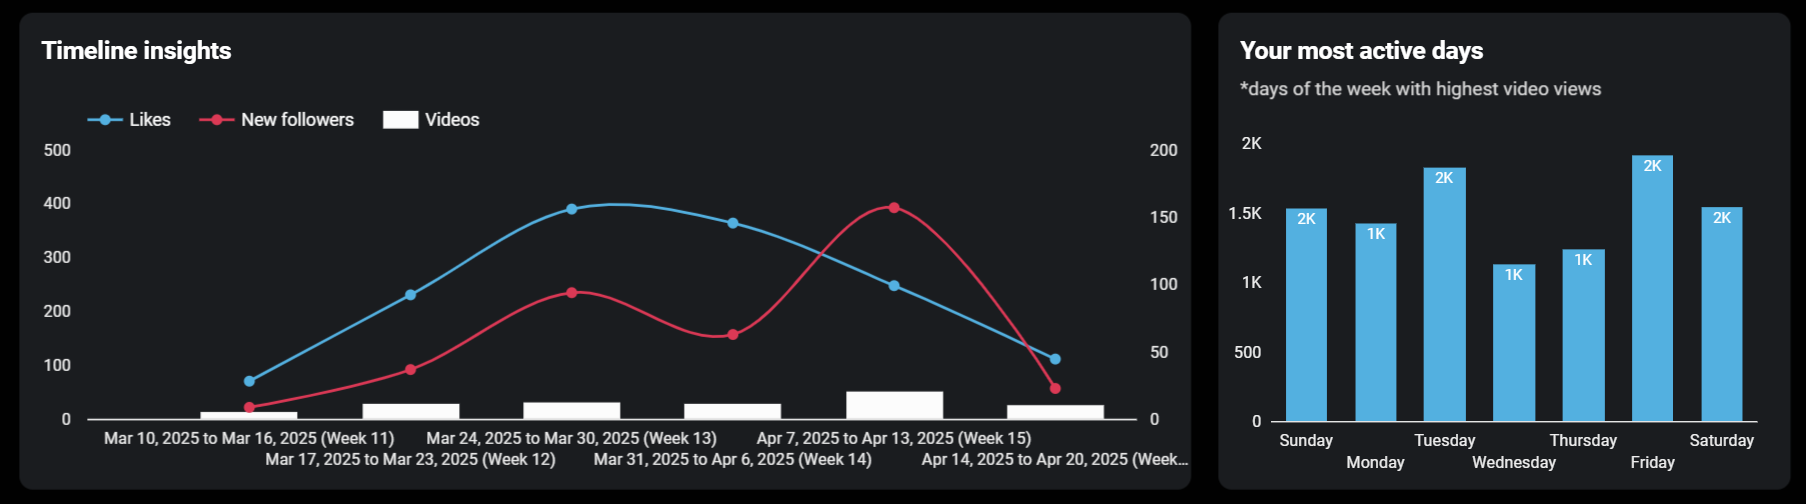
Analyze how your follower count and profile views change in relation to your content publishing schedule and video performance. The dashboard shows when significant growth occurred and which videos contributed to audience expansion. This insight helps you identify the content types that attract new followers most effectively, enabling you to develop a strategic content calendar that consistently builds your TikTok presence.
How to create a TikTok reporting dashboard?

Metrics you can track with a TikTok dashboard template
Monitor the total number of times your TikTok videos have been viewed, with breakdowns by individual video and time period. This foundational metric helps you understand your content's reach and serves as the starting point of the engagement funnel. By tracking views alongside other metrics, you can identify which videos initially capture audience attention and evaluate overall content visibility.
Measure the percentage of viewers who actively engage with your content through likes, comments, and shares. The dashboard calculates this key performance indicator to help you understand how compelling your videos are beyond simple views. A higher engagement rate indicates more resonant content, while declining rates may signal a need to refresh your approach or better align with audience interests.
Track the cumulative duration viewers spend watching your TikTok videos, providing deeper insight than view counts alone. This metric reveals how effectively your content holds audience attention and contributes to TikTok's algorithm preferences. Videos with higher watch times generally receive more favorable distribution, making this a critical metric for understanding both content performance and algorithmic reach.
Monitor changes in your follower count over time, with visualizations showing growth patterns and correlation with content publishing. This metric helps you evaluate your channel's long-term growth trajectory and identify which videos or campaigns most effectively attract new followers. Understanding these patterns allows you to refine strategies for building a sustainable and expanding TikTok audience.
Track how many times users visit your TikTok profile, indicating interest beyond individual videos. This metric helps identify when viewers want to learn more about you or your brand after seeing your content. Higher profile views often precede follower growth and signal strong content that encourages users to explore your entire channel rather than just consuming a single video.
Measure how often viewers share your content with others, one of the strongest indicators of video quality and resonance. The dashboard tracks shares over time and by video to identify content that viewers find valuable enough to distribute to their own followers. Content with high share rates has greater viral potential and often indicates you've created something truly compelling for your target audience.
Analyze the quantity of comments your videos receive, signaling deeper audience engagement and conversation-starting potential. The dashboard tracks comment trends across videos and time periods to help you understand which content prompts viewer discussion. This metric is especially important for community building and identifying topics that genuinely connect with your audience on a more meaningful level.
Visualize the composition of your TikTok audience with breakdowns by geographic location and available demographic information. The dashboard presents this data clearly to help you understand who engages most with your content. This insight is essential for creating more relevant videos, timing posts appropriately for different regions, and aligning your content strategy with your actual audience characteristics.