Salesforce dashboard examples and reporting templates
Unlock hidden sales potential with intelligent Salesforce reporting dashboards that connect team performance data, pipeline metrics, and revenue insights into unified visual reports. Eliminate manual CRM reporting and gain immediate visibility into deal progression patterns, individual contributor success rates, and market segment effectiveness through automated dashboard solutions powered by Coupler.io.
Salesforce dashboard examples for every need


 +1
+1
about your case. It doesn't cost you a penny 😉
Choose your white label Salesforce sales dashboard to kick off
What is a Salesforce dashboard?
Rather than relying on standard reports with limited customization, automated Salesforce dashboard templates provide advanced filtering mechanisms that reveal performance patterns across territories, deal types, and time periods. When integrated through Coupler.io, these dashboards maintain real-time data accuracy while offering drill-down capabilities that help sales leaders make informed decisions about resource allocation, territory management, and strategic planning initiatives.

What reports should be included in Salesforce dashboards?
Effective Salesforce analytics depends on selecting reports that illuminate both current performance and future opportunities across your sales organization. Through extensive analysis of high-performing sales teams, we've identified four fundamental report types to include in the Salesforce dashboard template.
Performance tracking reports analyze each sales representative's contribution through revenue generation, opportunity conversion, and activity engagement metrics. These reports enable sales managers to recognize high achievers, identify skill development needs, and distribute challenging opportunities based on proven capabilities.
Pipeline analytics provide a detailed examination of opportunity flow through each sales stage, highlighting conversion bottlenecks and progression velocity patterns. This analysis measures how efficiently deals advance from initial contact through negotiation and closure, identifying specific stages where opportunities commonly stall.
Segmentation reports categorize deals by industry vertical, geographic region, company size, and lead source to reveal which market segments produce the most profitable outcomes. This analysis helps sales teams understand customer acquisition patterns, identify underperforming territories, and optimize targeting strategies based on historical success data.
Forecasting reports combine historical performance data with current pipeline composition to project future revenue outcomes across different scenarios. This analysis incorporates seasonal trends, market conditions, and team capacity factors to provide realistic revenue predictions. The reporting includes variance analysis that compares actual results to projections, trend identification that reveals growth or decline patterns, and scenario modeling that helps sales leaders prepare for different market conditions.
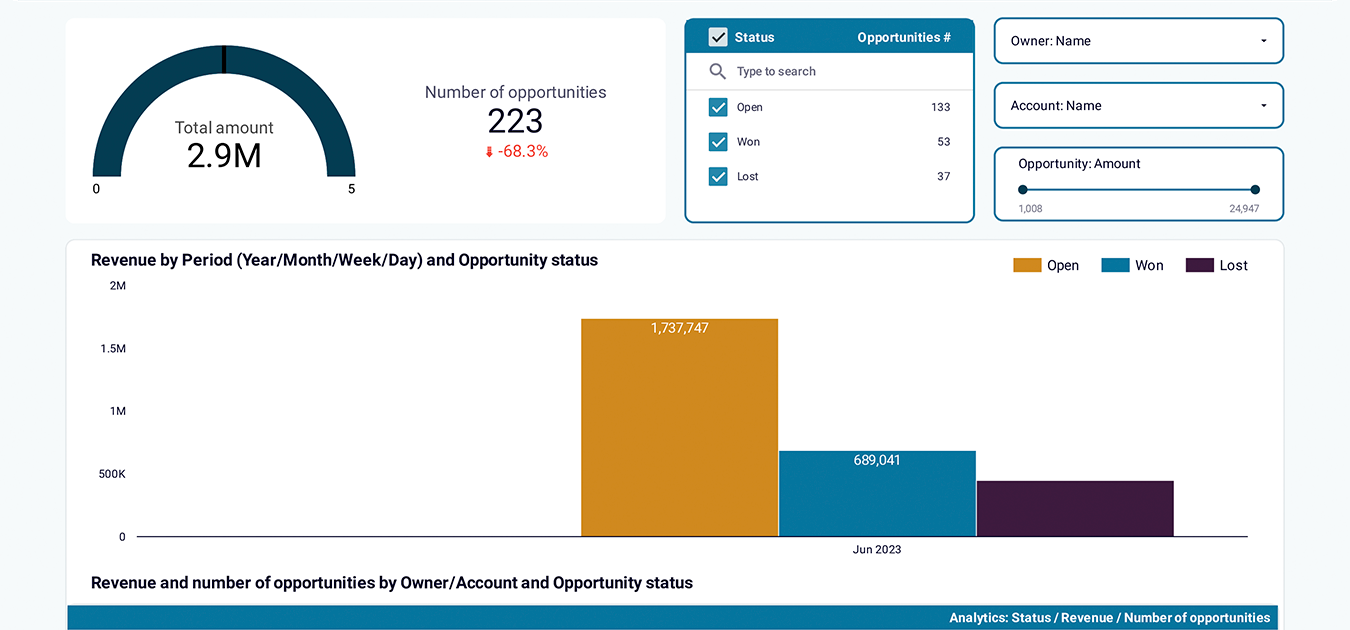
What insights you can get with the Salesforce reporting dashboards
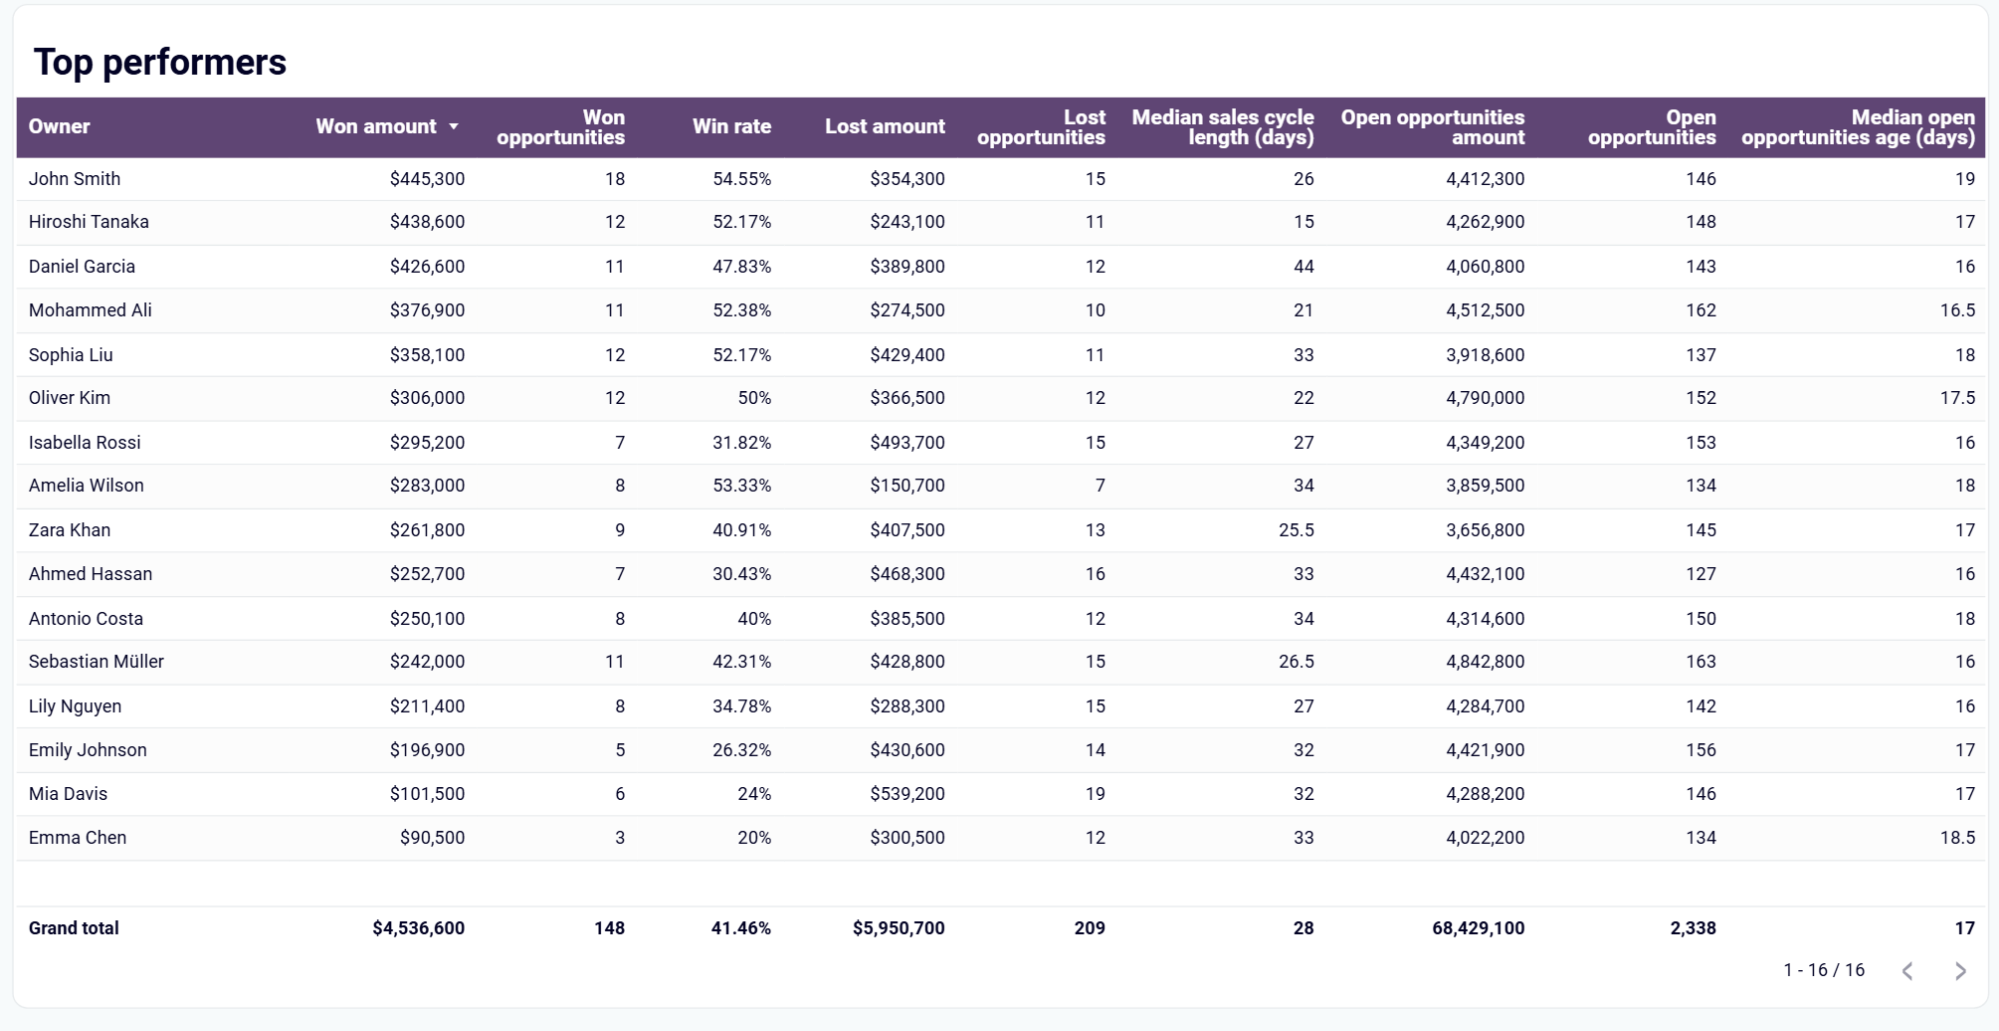
Discover your organization's highest-achieving sales professionals by analyzing multiple performance dimensions, including revenue generation, opportunity success rates, and conversion consistency. This analysis ranks team members across various effectiveness indicators, revealing specific tactics and approaches that drive exceptional results. The Salesforce dashboard enables managers to identify achievement patterns that scale across the organization and recognize representatives who consistently exceed expectations in different market conditions.
Isolate high-value opportunities from volume-based transactions to understand how different deal sizes require distinct sales approaches and resource investments. This filtering capability reveals patterns in sales cycles, win probabilities, and competitive dynamics across various transaction values. Organizations can optimize territory assignments, adjust compensation structures, and allocate senior sales talent based on deal profitability analysis and complexity requirements.
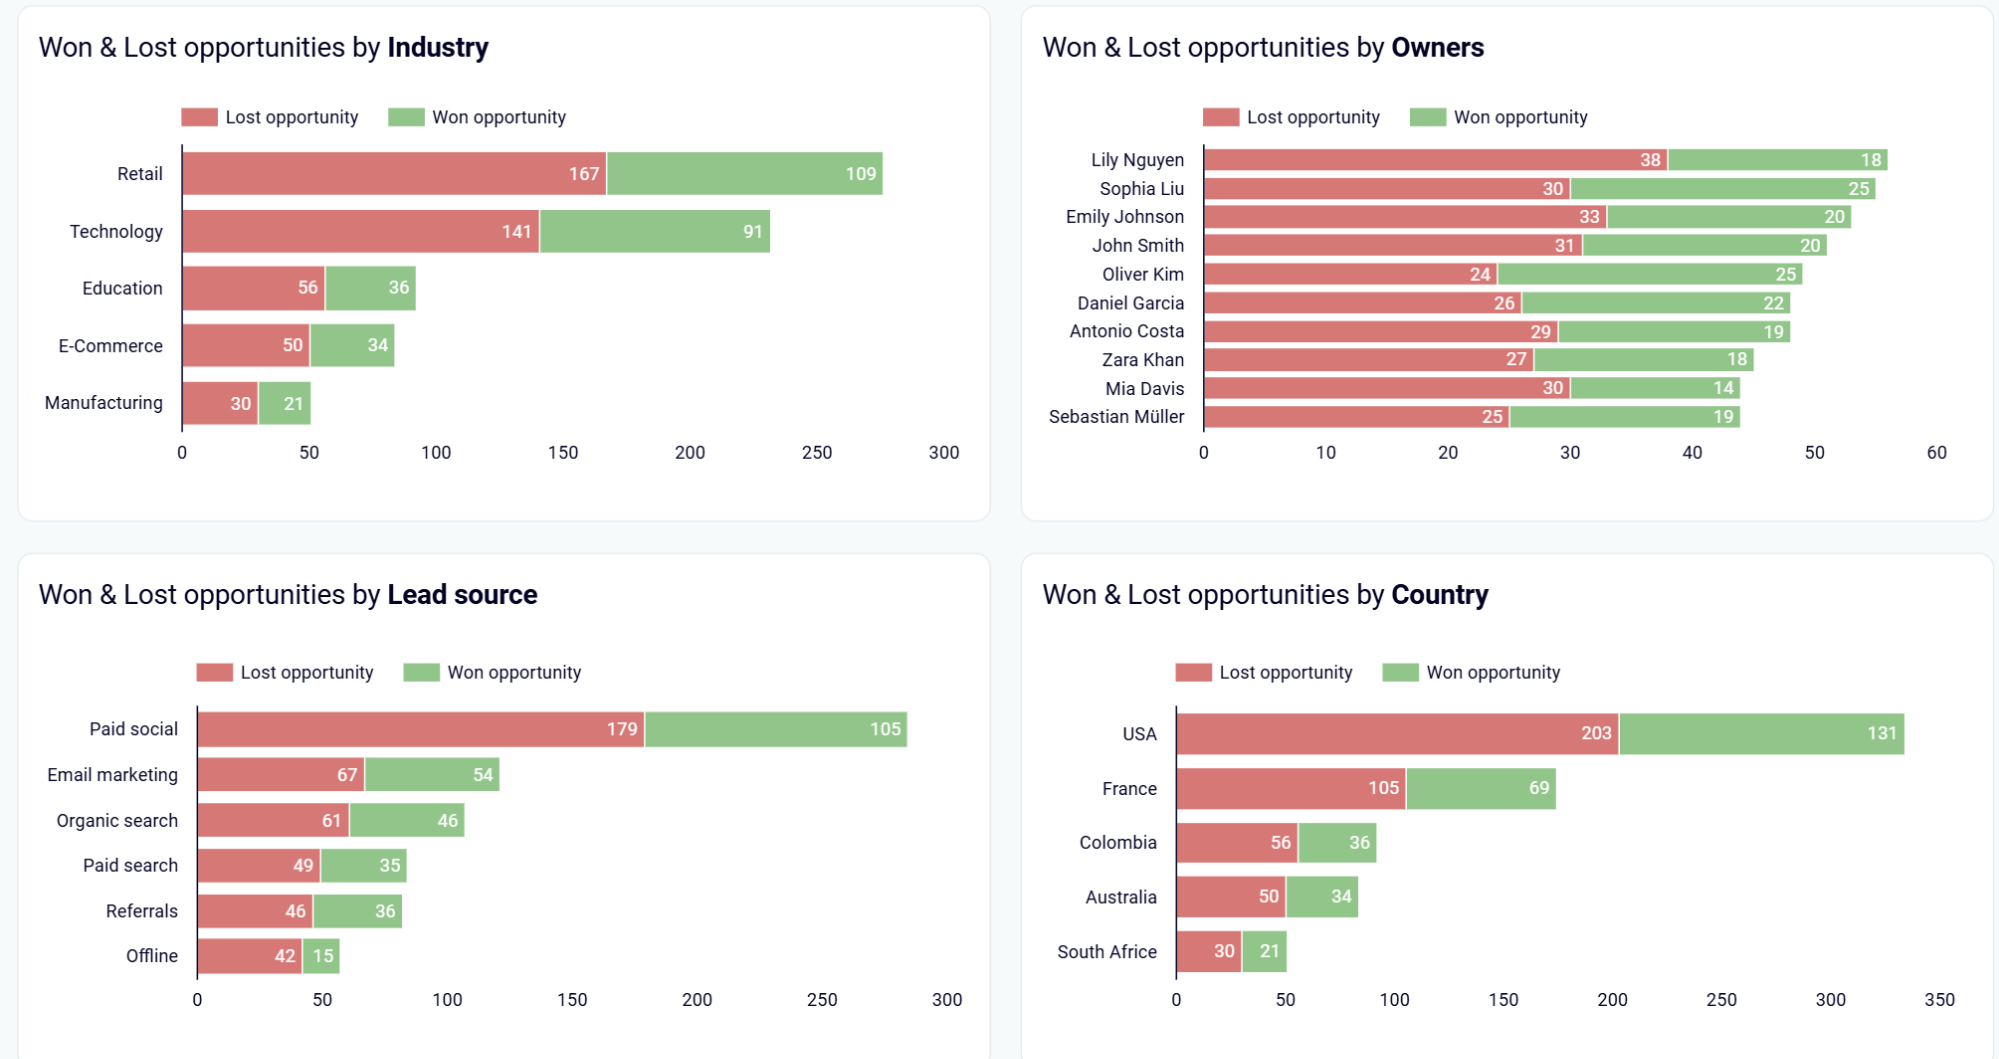
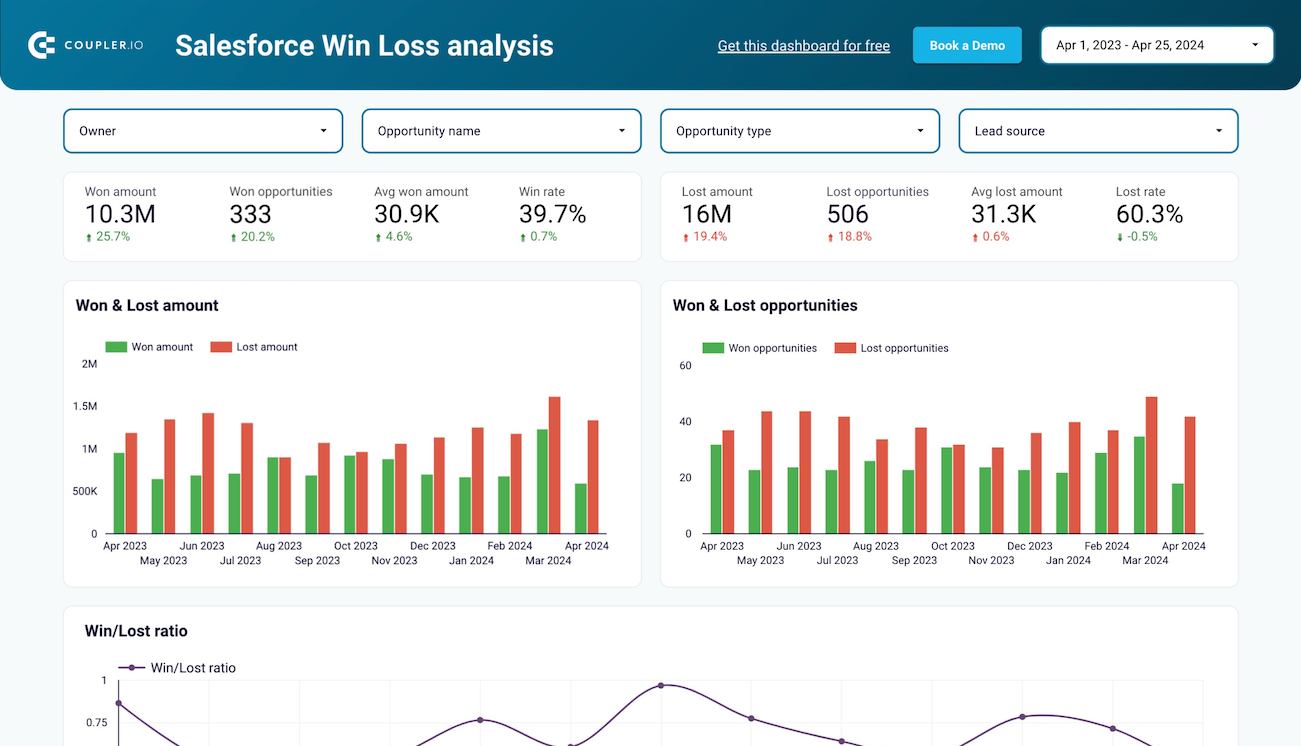
Examine won and lost opportunities through pre-configured segmentation by industry sector, sales ownership, marketing channel, and regional territory. A Salesforce analytics dashboard uncovers which business segments generate the highest conversion rates and identifies systematic patterns in opportunity losses. Sales teams can refine targeting strategies, improve competitive positioning, and replicate successful approaches across similar market segments and customer profiles.
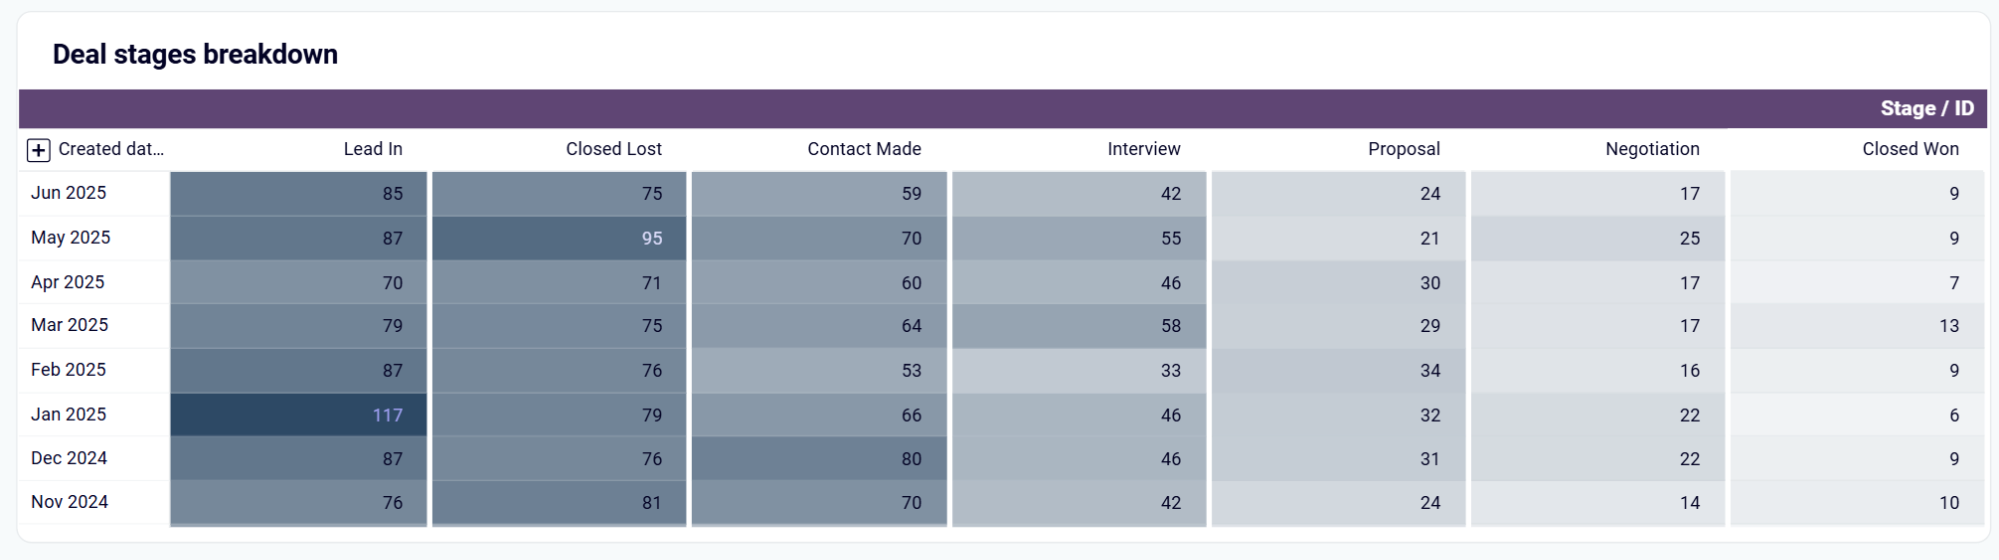
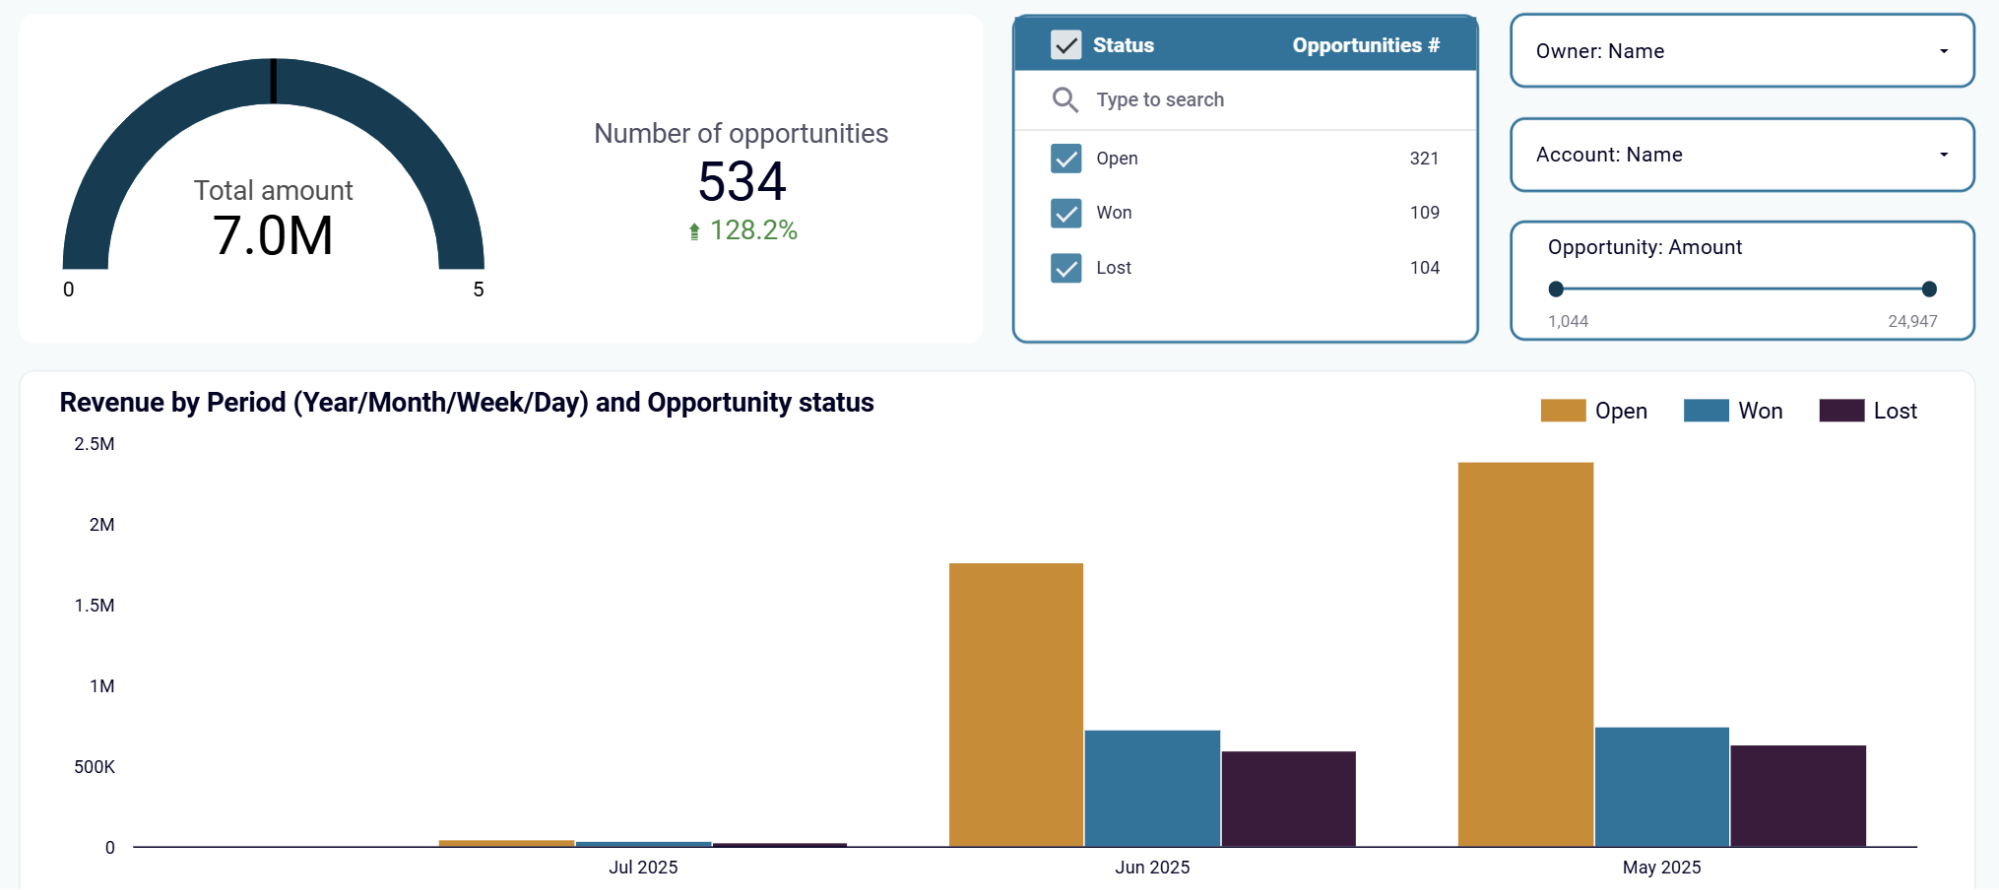
Track opportunity progression through each phase of your sales methodology, identifying where deals accelerate toward closure or encounter systematic obstacles. This monitoring reveals specific pipeline stages that create conversion challenges and measures advancement rates between each phase. With the Salesforce metrics dashboard, sales managers can implement targeted process improvements, provide stage-specific training, and ensure consistent deal advancement across the entire sales organization.
How to create a Salesforce dashboard?

Metrics you can track with Salesforce dashboard templates
Measure aggregate revenue generated across your entire sales organization within specific time periods, providing comprehensive visibility into overall business performance. This metric serves as the primary indicator of sales team effectiveness and enables comparison of performance across quarters, years, and market conditions.
Calculate the percentage of opportunities that result in successful closures, revealing the effectiveness of your sales process and team capabilities. This metric helps identify which sales strategies produce the highest success rates and provides benchmarks for individual performance evaluation.
Track the overall percentage of deals that reach final resolution, encompassing both won and lost opportunities compared to total pipeline volume. This metric provides insight into sales process efficiency and helps determine whether opportunities are being properly qualified before pipeline entry.
Quantify the percentage of opportunities that result in unsuccessful outcomes, highlighting areas requiring process improvement and competitive strategy refinement. This metric reveals patterns in deal failures and helps sales teams address systematic weaknesses in their approach.
Analyze typical time requirements for advancing opportunities from initial contact through final deal closure across different deal types and representatives. This metric enables accurate forecasting, resource planning, and identification of process acceleration opportunities throughout your sales cycle.
Monitor total monetary worth of all active opportunities currently positioned across your sales stages, providing forward-looking visibility into potential revenue generation. This metric helps predict future cash flow and identifies which pipeline stages require additional focus to maintain healthy deal progression.
Calculate probability-weighted revenue projections based on current pipeline composition and historical closure patterns for each sales stage. This metric provides realistic forecasting that accounts for deal likelihood and helps set achievable revenue targets.
Track typical duration that opportunities remain active in your pipeline before reaching closure or disqualification decisions. This metric identifies deals requiring urgent attention and helps prevent revenue slippage through proactive pipeline management.
Document both the quantity and monetary value of successfully closed deals, providing comprehensive visibility into sales achievement patterns. This dual metric reveals whether success comes from volume transactions or high-value deals, informing strategy development.
Record the count and potential revenue value of unsuccessful deals, quantifying the cost of sales process inefficiencies and competitive losses. This metric helps prioritize improvement initiatives based on the highest potential revenue recovery opportunities.