Meta (Facebook Ads) dashboard examples and reporting templates
Get complete visibility into your Facebook advertising performance with our automated dashboard for Facebook Ads that consolidates data from Facebook Ads Manager. Track ad spend, monitor campaign effectiveness, analyze conversion funnels, and make strategic decisions based on real-time insights from your advertising platform.
Facebook Ads dashboards for every need


 +3
+3


 +6
+6


 +5
+5
 +6
+6

 +3
+3
 +1
+1
 +4
+4
 +4
+4
 +2
+2
 +2
+2

 +5
+5
 +4
+4
 +5
+5
 +5
+5
 +3
+3

 +1
+1
 +3
+3

 +1
+1
 +3
+3
 +3
+3
 +2
+2

 +1
+1

 +1
+1


 +2
+2
 +3
+3

 +4
+4


about your case. It doesn't cost you a penny 😉
Choose your white label Facebook Ads dashboard to kick off
What is a Facebook Ads dashboard?
Modern Facebook Ads dashboards go beyond native reporting tools and allow you to track campaign performance, analyze audience demographics, monitor conversion funnels, and identify optimization opportunities. With automated data refreshing through Coupler.io, these dashboards ensure you're always working with the most up-to-date advertising information without manual data exports or consolidation. They create a single source of truth for your Facebook advertising efforts.

What reports should be included on a meaningful Facebook Ads dashboard?
A comprehensive Facebook Ads dashboard should include several key reports that provide complete visibility into your advertising performance. Based on our analysis of Facebook Ads campaigns, we recommend incorporating these four essential report types:
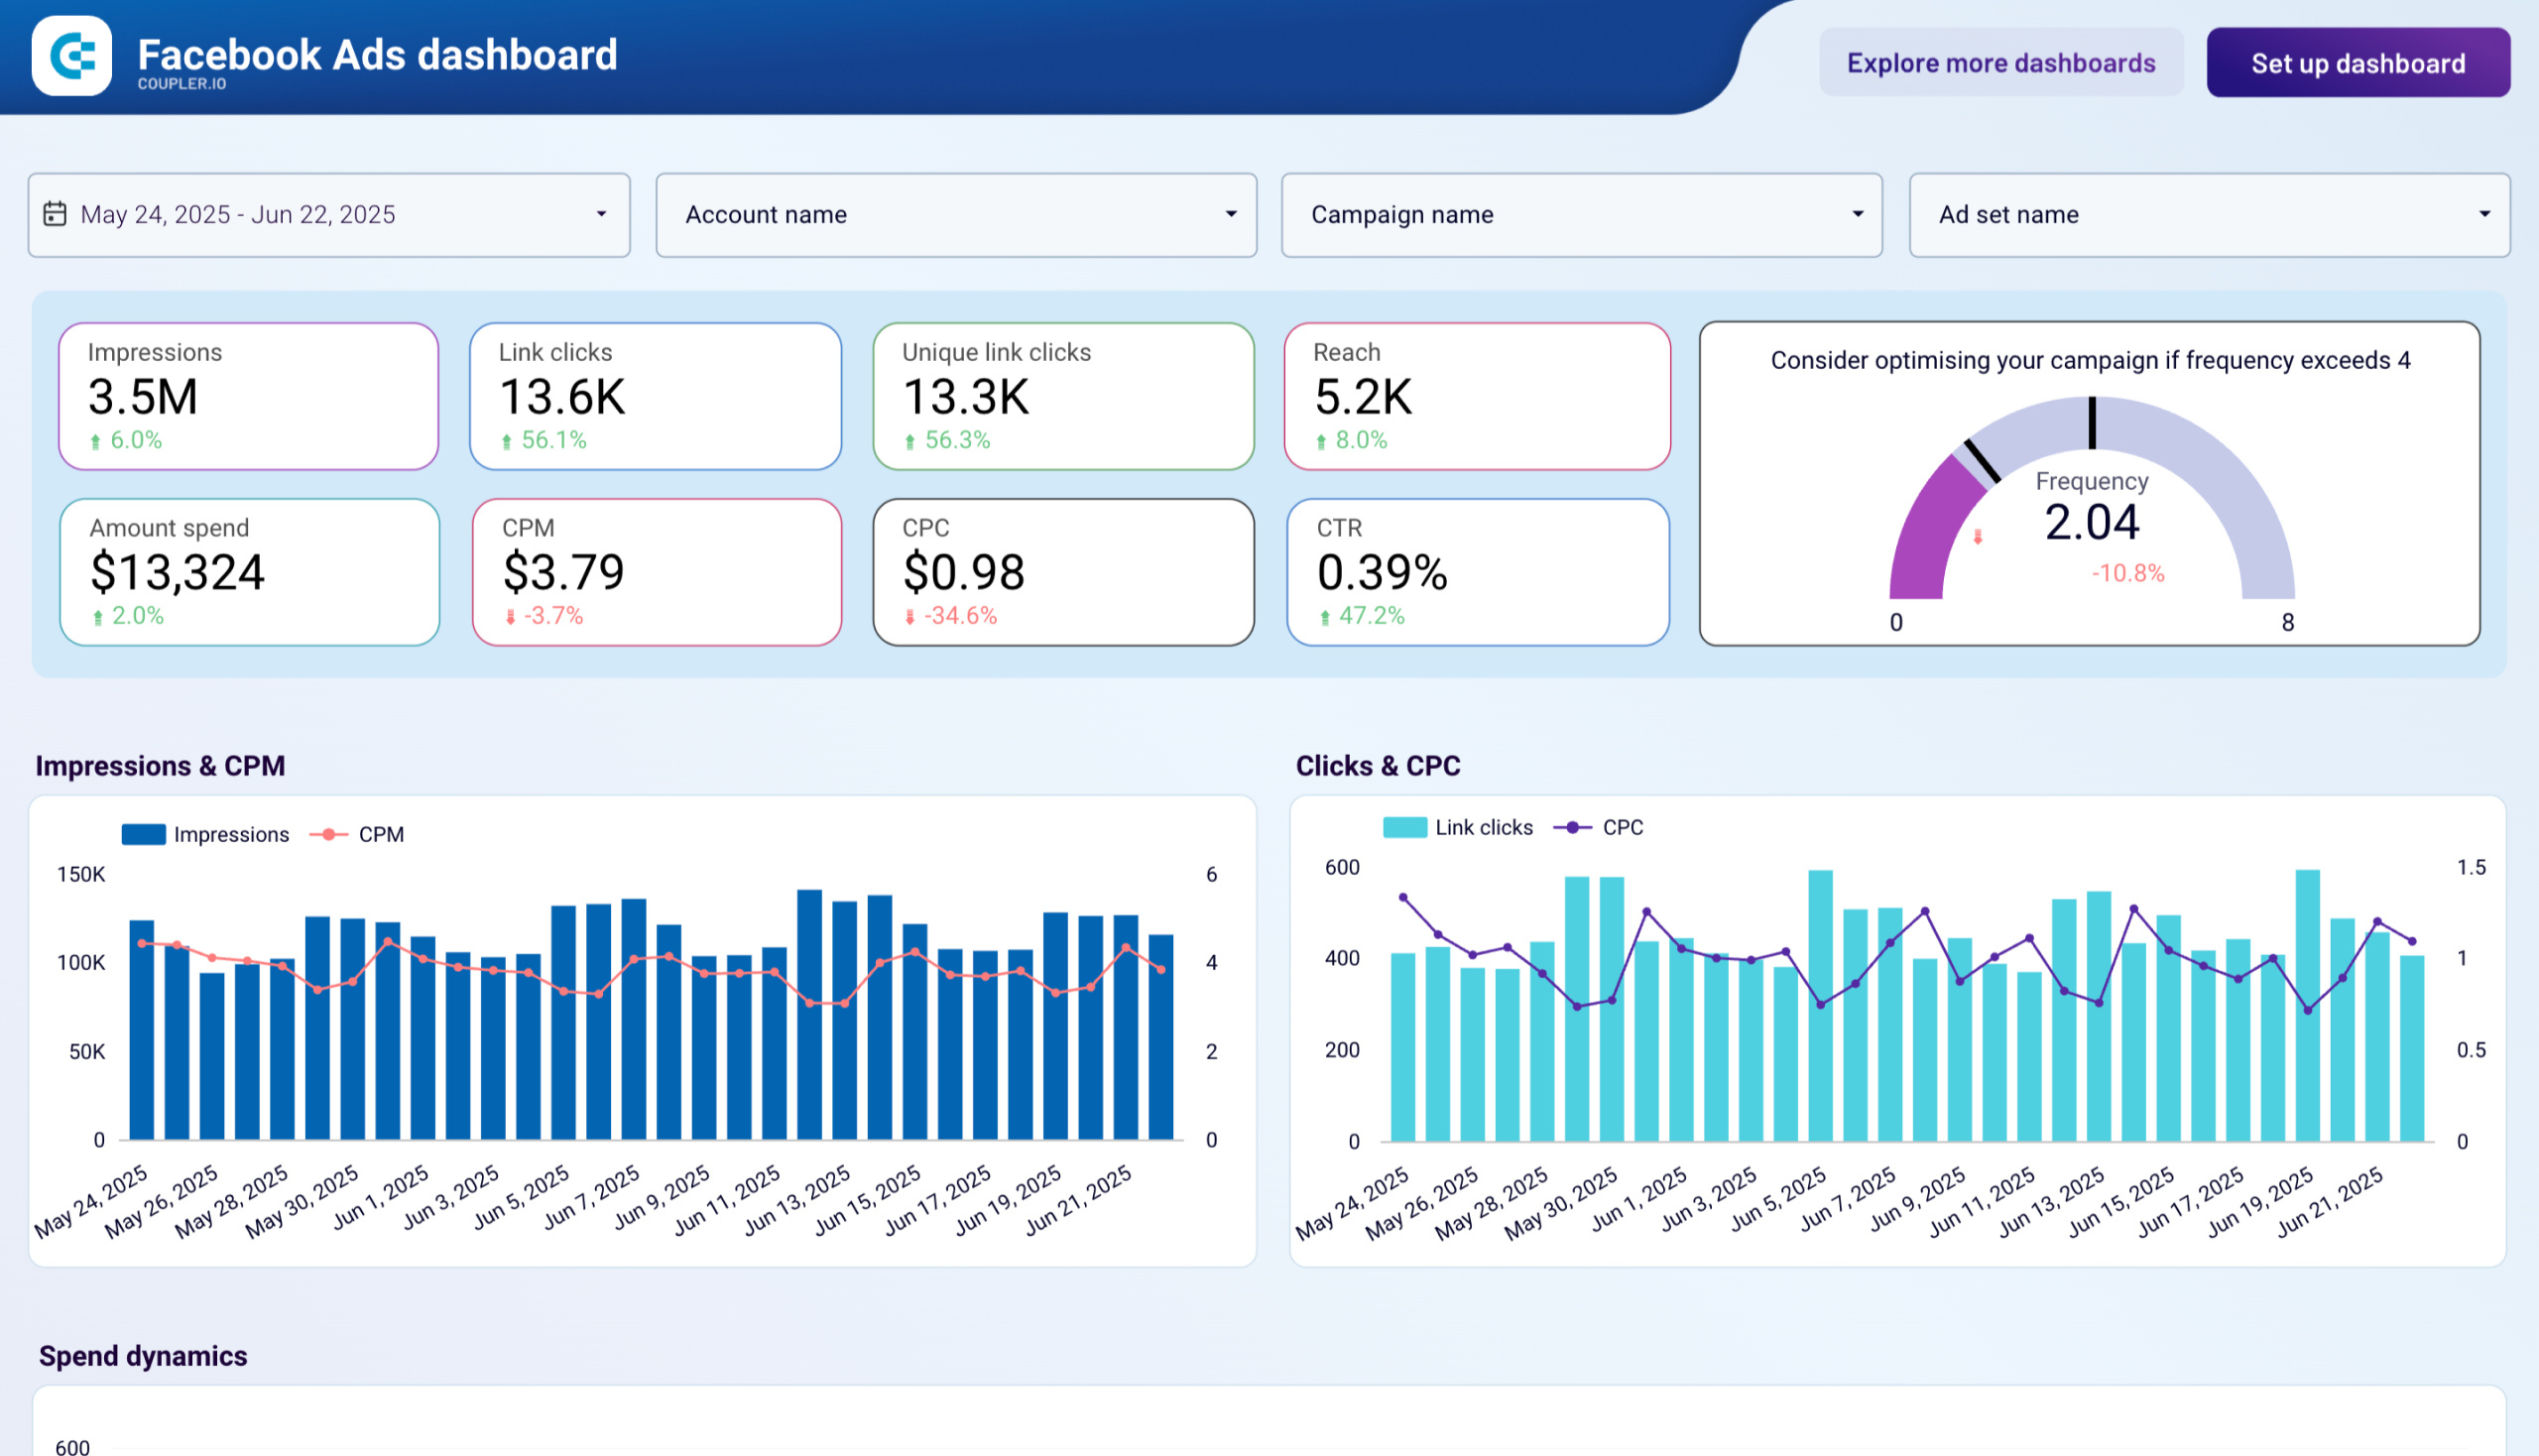
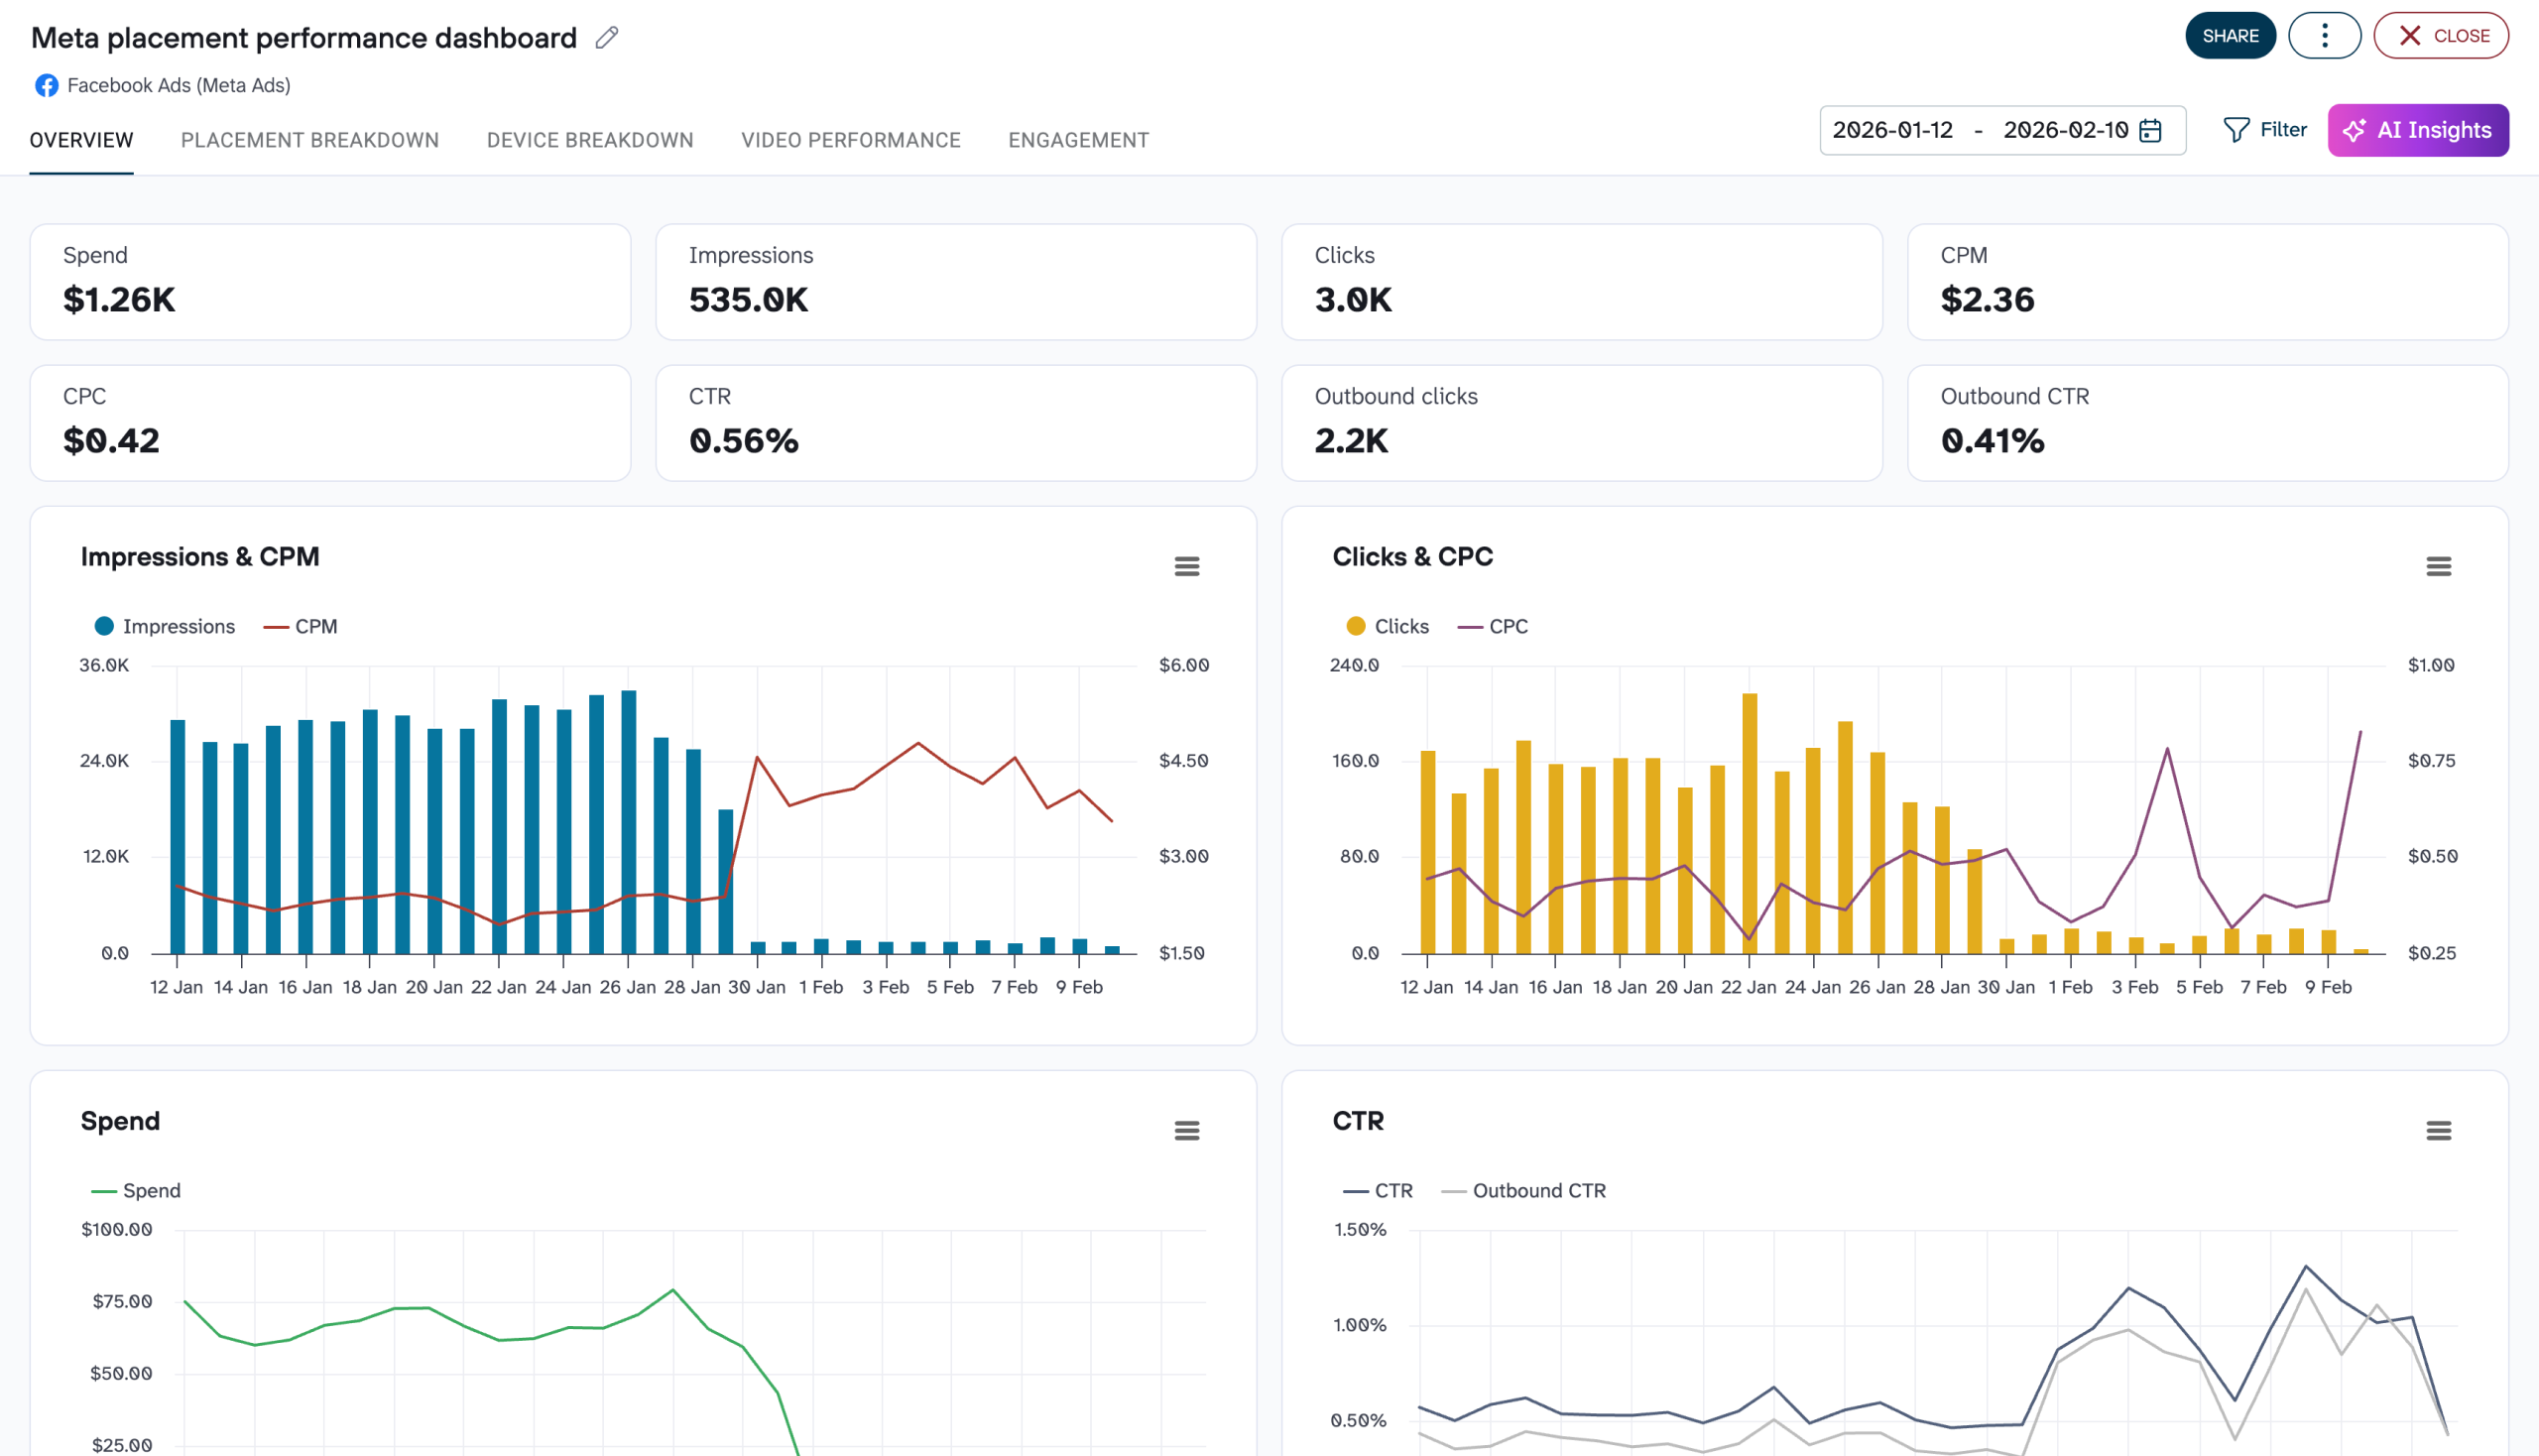
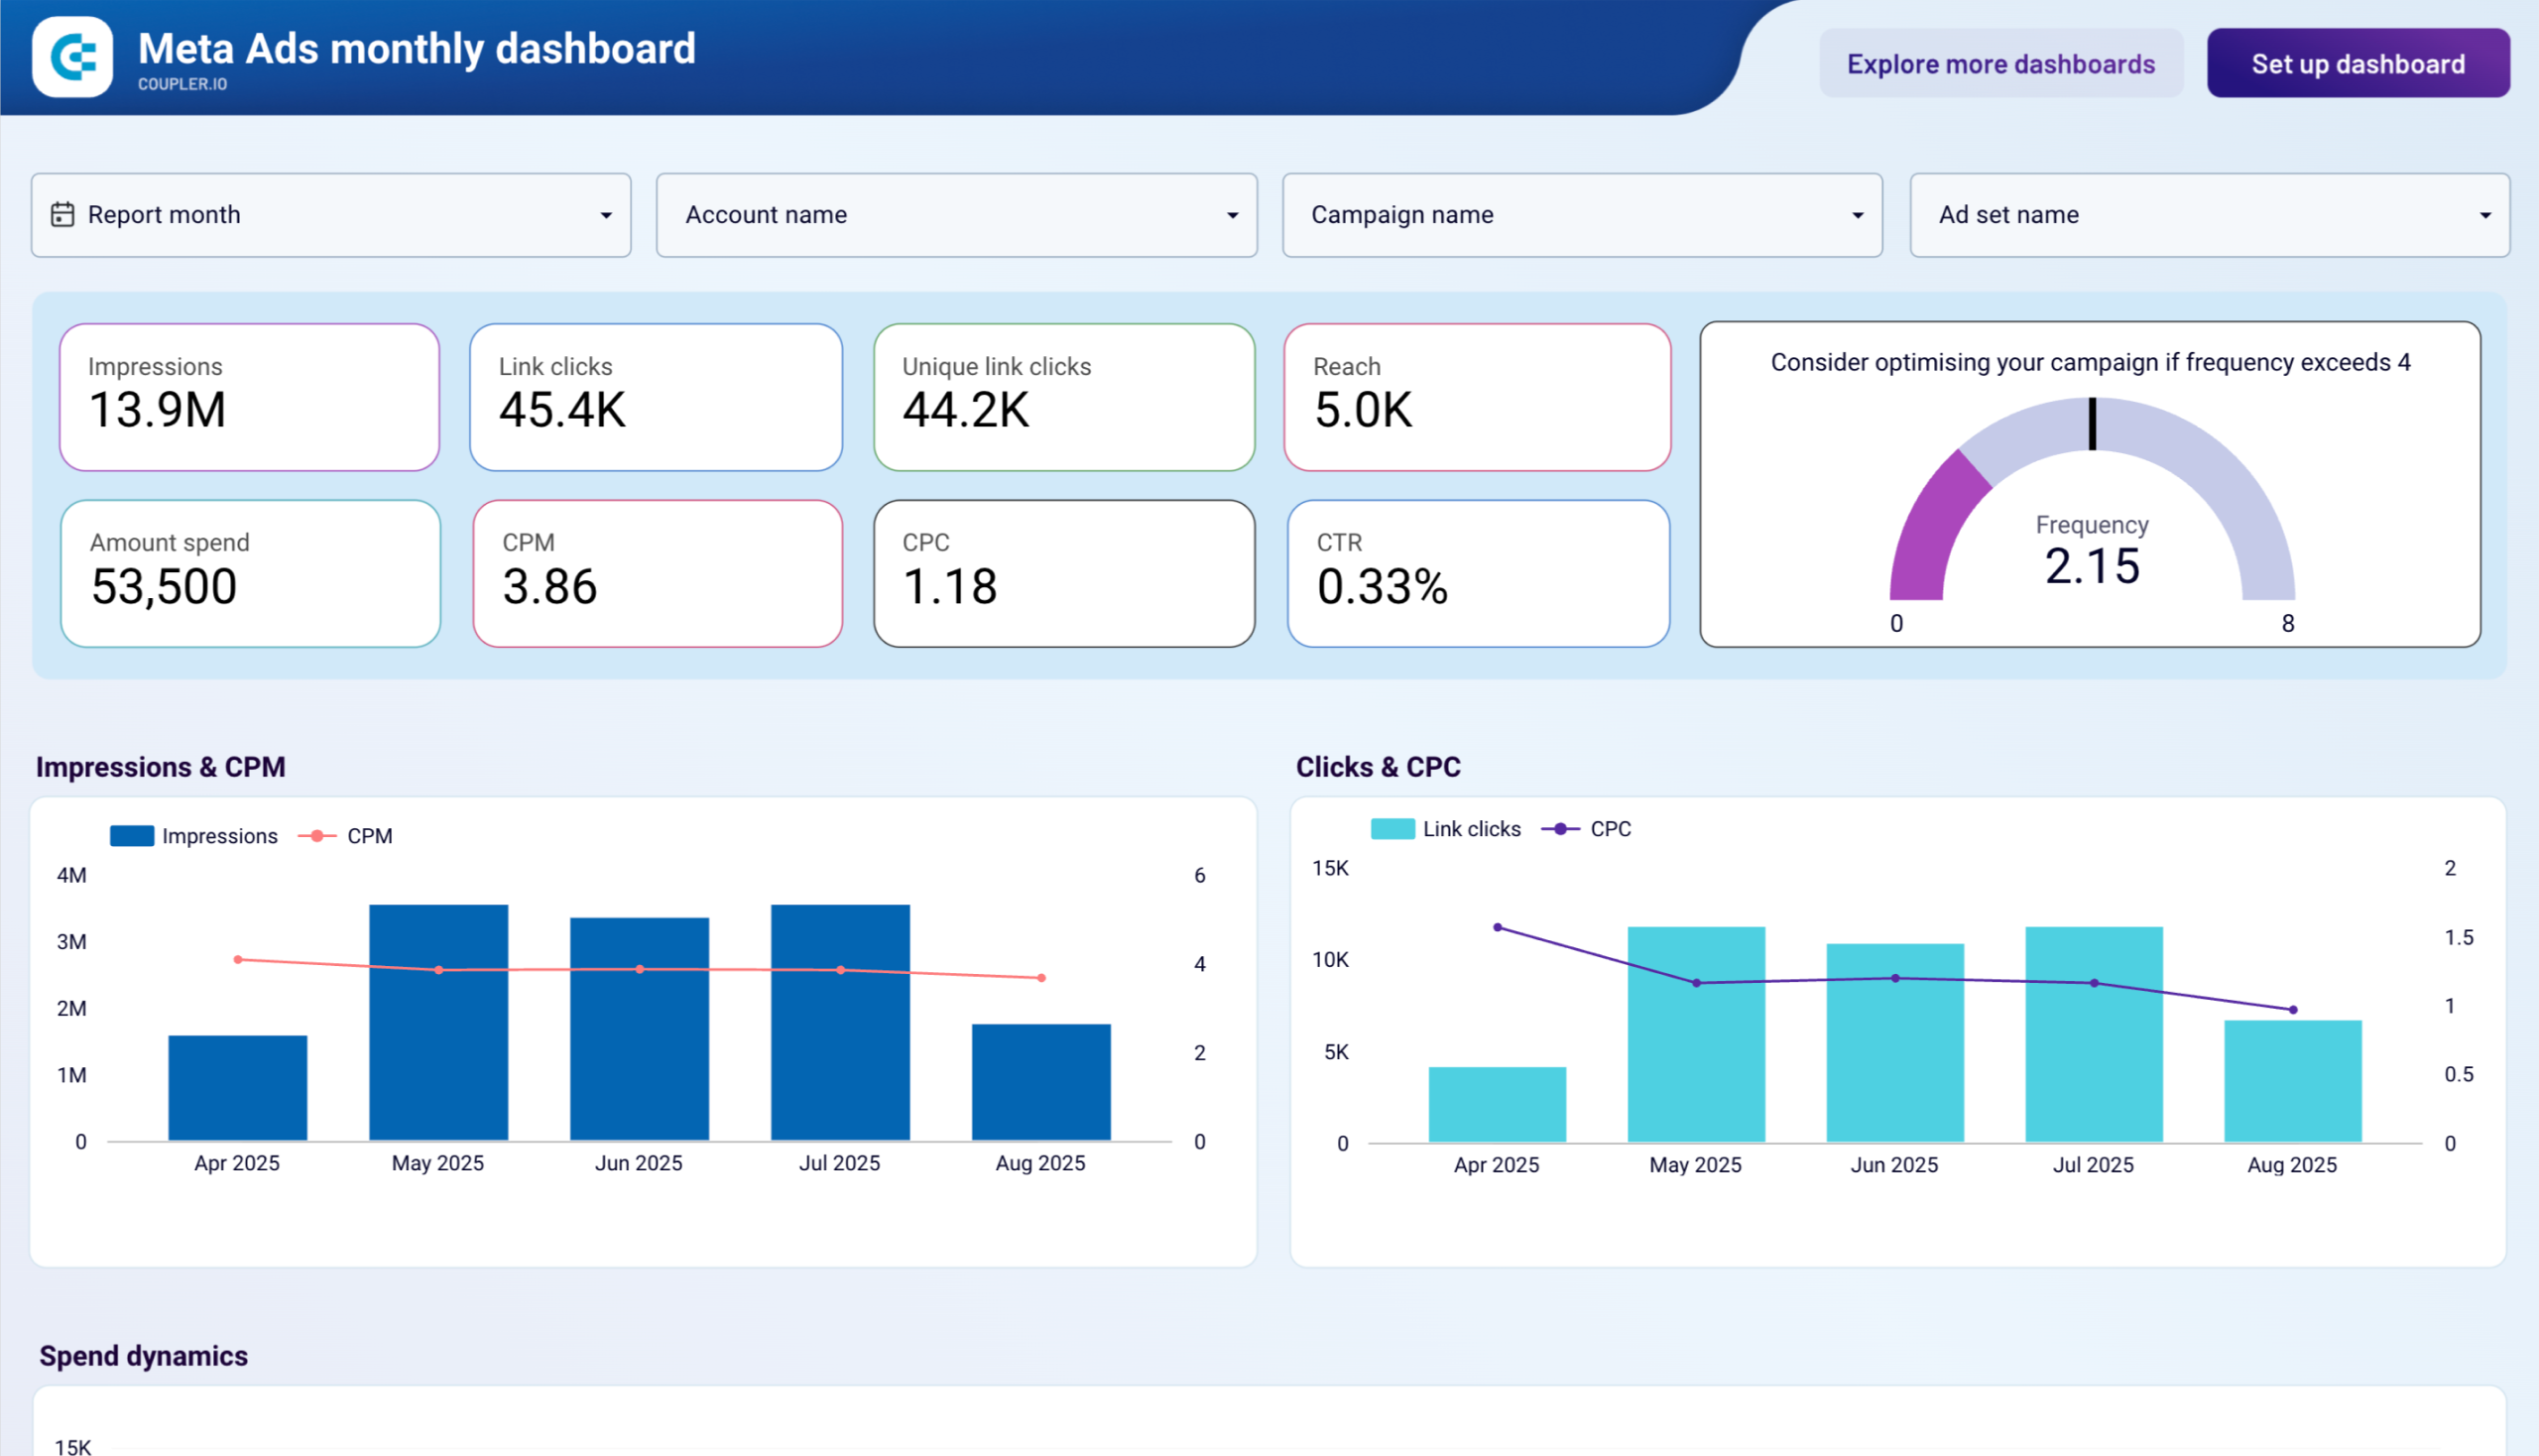
The campaign performance report offers a quick overview of key metrics such as impressions, clicks, spend, and CPM. This report helps you monitor how your ad budget translates into engagement and identify trends in campaign effectiveness over time. It includes filters that let you focus on specific campaigns or ad sets to compare their performance and make data-driven decisions about budget allocation.
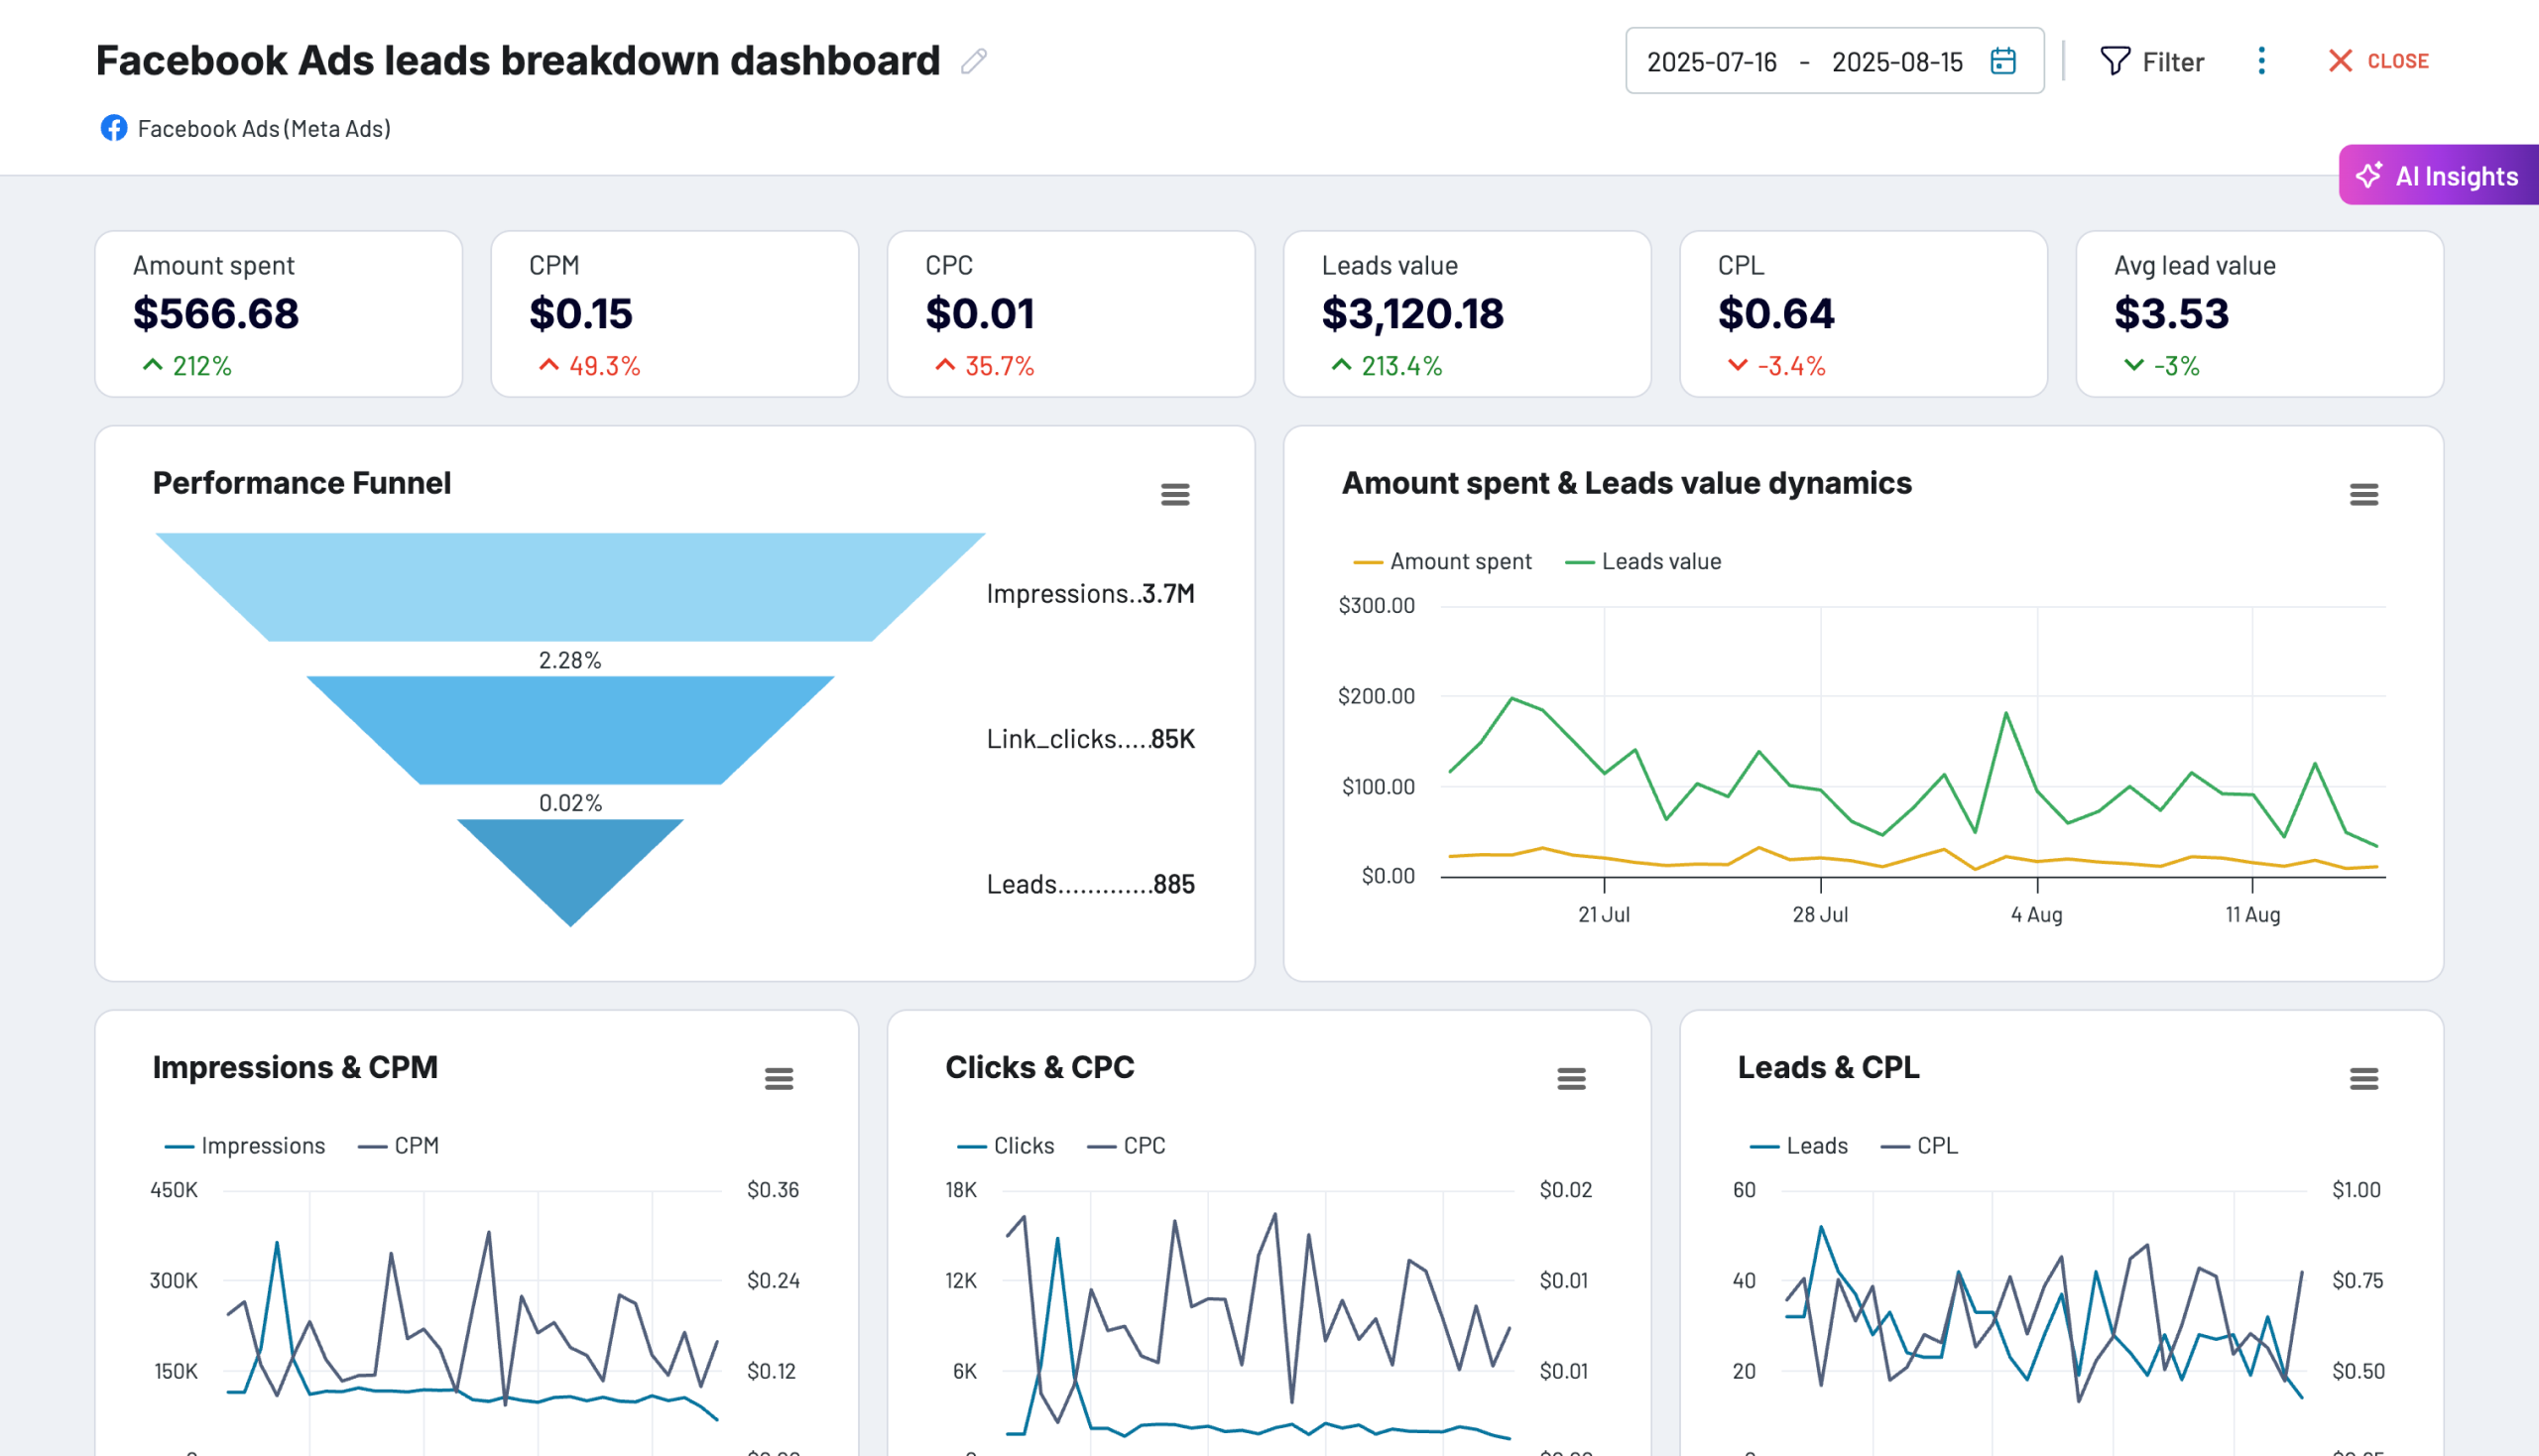
The conversion funnel report visualizes the customer journey from initial ad impressions to final conversions. It tracks how many users see your ads, click on them, and ultimately complete desired actions like purchases or lead form submissions. This report helps you identify bottlenecks in the conversion process and optimize each stage of the funnel to improve overall campaign effectiveness and return on ad spend.
The audience demographics report provides detailed insights into who is engaging with your ads across different segments. It breaks down clicks, conversions, and other key metrics by age, gender, and geographic location. This information helps you refine targeting strategies, tailor messaging to specific audience segments, and allocate budget to demographics that deliver the highest return on investment.
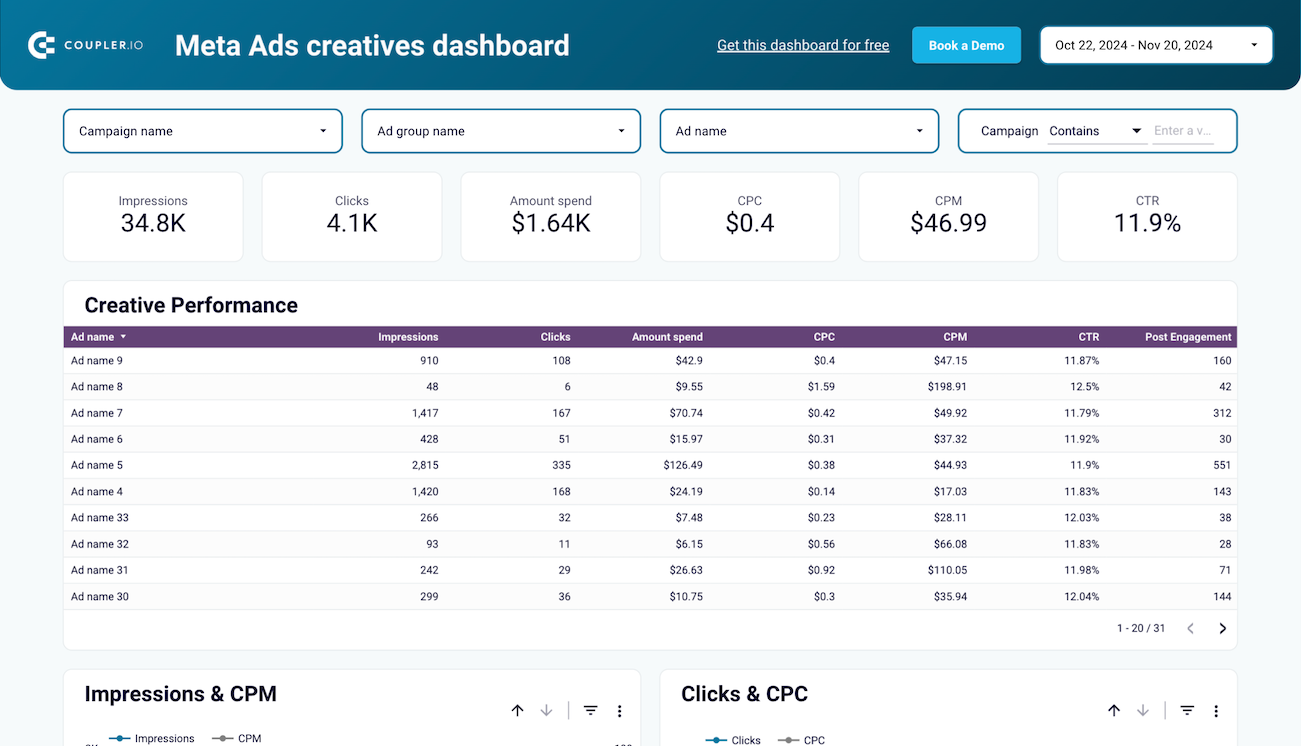
The ad creative performance report offers a detailed analysis of how individual creative assets are performing. It includes metrics like engagement rate, CTR, CPM, CPC, and conversion metrics for each creative. This report helps you identify which visual elements, copy, and formats resonate most with your audience, allowing you to optimize existing ads and inform future creative development.
What insights you can get with the Facebook Ads reporting dashboard
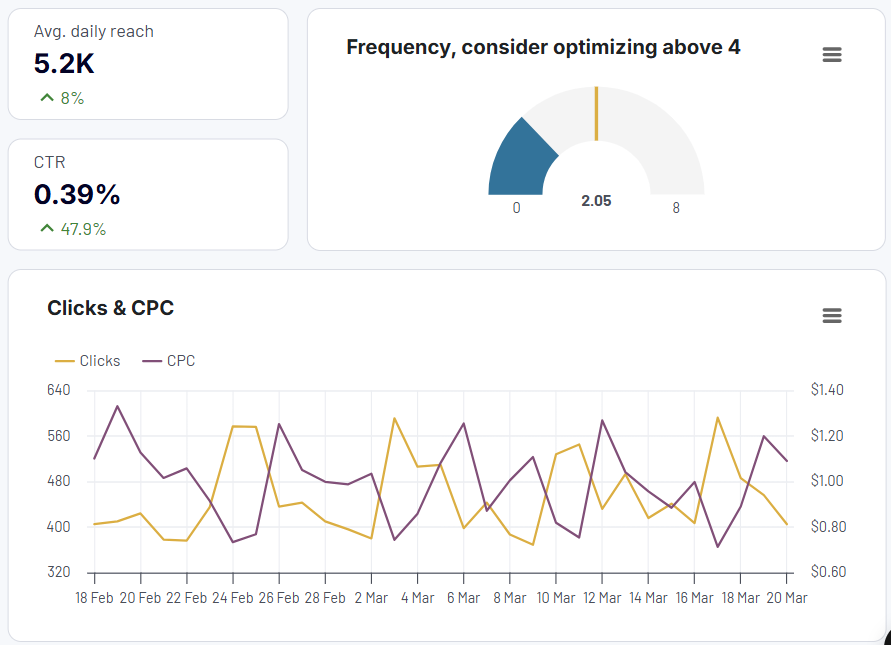
The frequency meter visually represents how often individual users see your advertisements. This critical metric helps you balance between sufficient ad visibility and audience fatigue. When frequency exceeds 8-9 impressions per user, your audience may perceive ads as spam, while frequencies below 3-5 mean users haven't seen your ads enough to engage meaningfully. This insight is particularly valuable for evaluating agency or freelancer ad management quality.
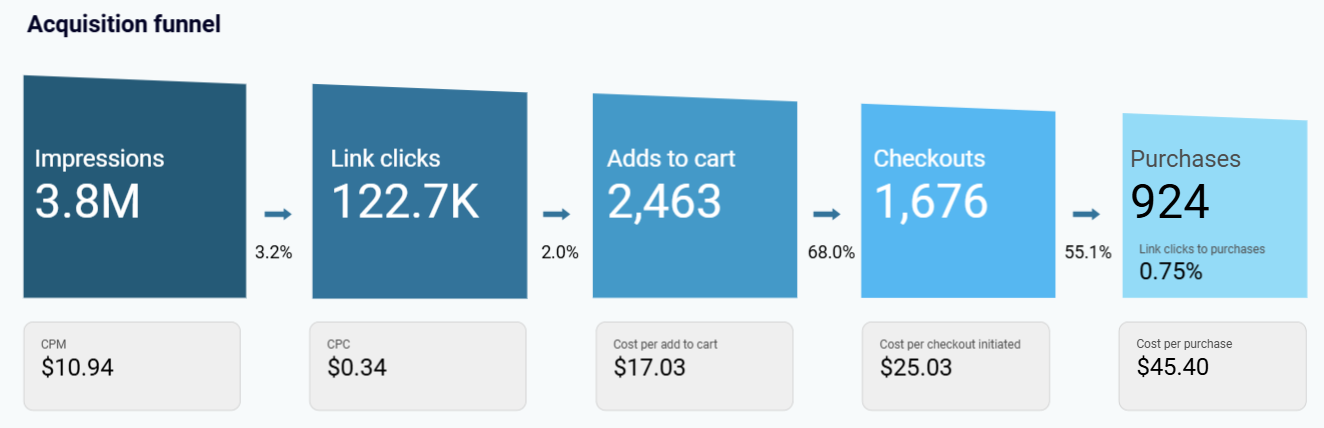
The conversion funnel visualization maps the entire user journey from initial ad impression to completed purchase. This clear funnel view helps identify potential bottlenecks where users drop off before converting. For example, you might discover that certain ads generate high numbers of clicks but fail to produce actual business value in terms of purchases. This insight allows you to optimize both ad creative and landing pages at precise funnel stages.
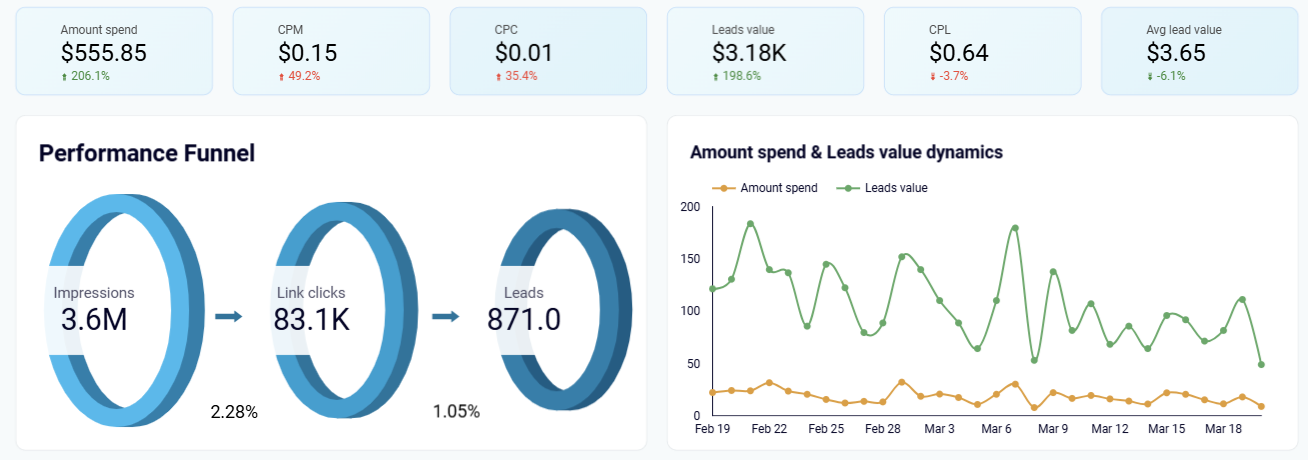
The leads value dynamics chart tracks how the total value of generated leads evolves over time compared to your ad spend. This visualization helps you evaluate the effectiveness of lead generation campaigns by showing whether your investment is producing valuable leads. By monitoring this trend line, you can quickly identify periods where lead value increases or decreases relative to spending, allowing for timely campaign adjustments.
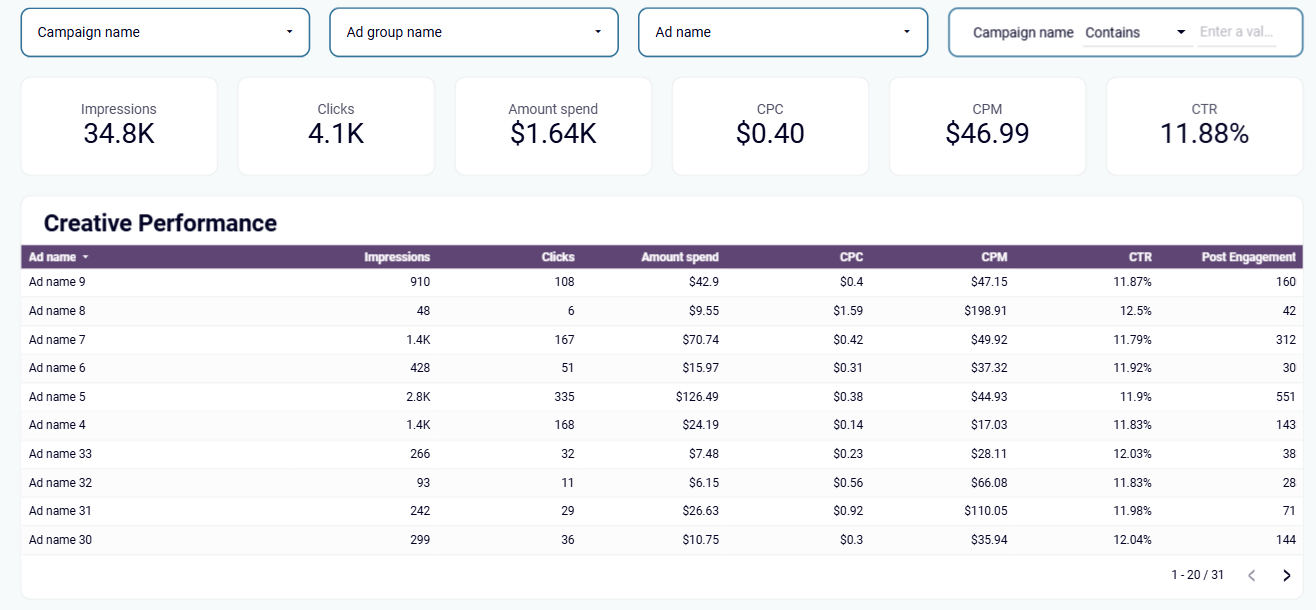
The creatives performance table provides a detailed breakdown of each creative asset by key performance indicators like engagement, CTR, CPM, CPC, conversions, and total spend. This comprehensive view enables easy comparison and prioritization among different ad formats, images, and copy variations. By identifying which creative elements drive the strongest results, you can optimize your creative strategy and allocate budget to the most effective ad variations.
How to create a Facebook Ads dashboard?

Metrics you can track with a Facebook Ads dashboard template
Monitor the total number of times your ads were shown to users across Facebook's platforms. The dashboard displays impression trends over time, allowing you to identify peaks in visibility and correlate them with campaign launches or optimization efforts. This foundational metric helps you understand your advertising reach and serves as the starting point for analyzing engagement and conversion rates.
Track the number of times users clicked on your advertisements, broken down by campaign, ad set, or creative. The dashboard visualizes click patterns over time and across different audience segments, helping you identify which ads drive the most engagement. This direct response metric is crucial for evaluating ad relevance and the effectiveness of your call-to-action elements.
Measure how often, on average, individual users see your advertisements during a selected time period. The dashboard's frequency meter visualizes this metric with threshold indicators for optimal exposure levels. Monitoring frequency prevents ad fatigue while ensuring sufficient visibility, striking the right balance between exposure and user experience to maintain campaign effectiveness.
Analyze the percentage of impressions that result in clicks across different campaigns, ad sets, and creatives. The dashboard presents CTR comparisons that reveal which ads most effectively capture audience attention. This efficiency metric helps you evaluate ad creative quality, messaging relevance, and targeting accuracy, providing insight into how well your ads resonate with intended audiences.
Track the average amount spent each time a user clicks on your advertisements. The dashboard allows you to monitor CPC trends over time and compare rates across different campaigns and audience segments. This cost-efficiency metric helps optimize budget allocation by identifying which targeting approaches and creative elements deliver clicks at the lowest cost.
Measure the percentage of users who complete desired actions after clicking your ads, whether purchases, sign-ups, or other key events. The dashboard breaks down conversion rates by campaign, audience demographics, and ad creative, helping identify your most effective conversion pathways. This performance metric directly connects advertising efforts to business outcomes and helps calculate return on ad spend.
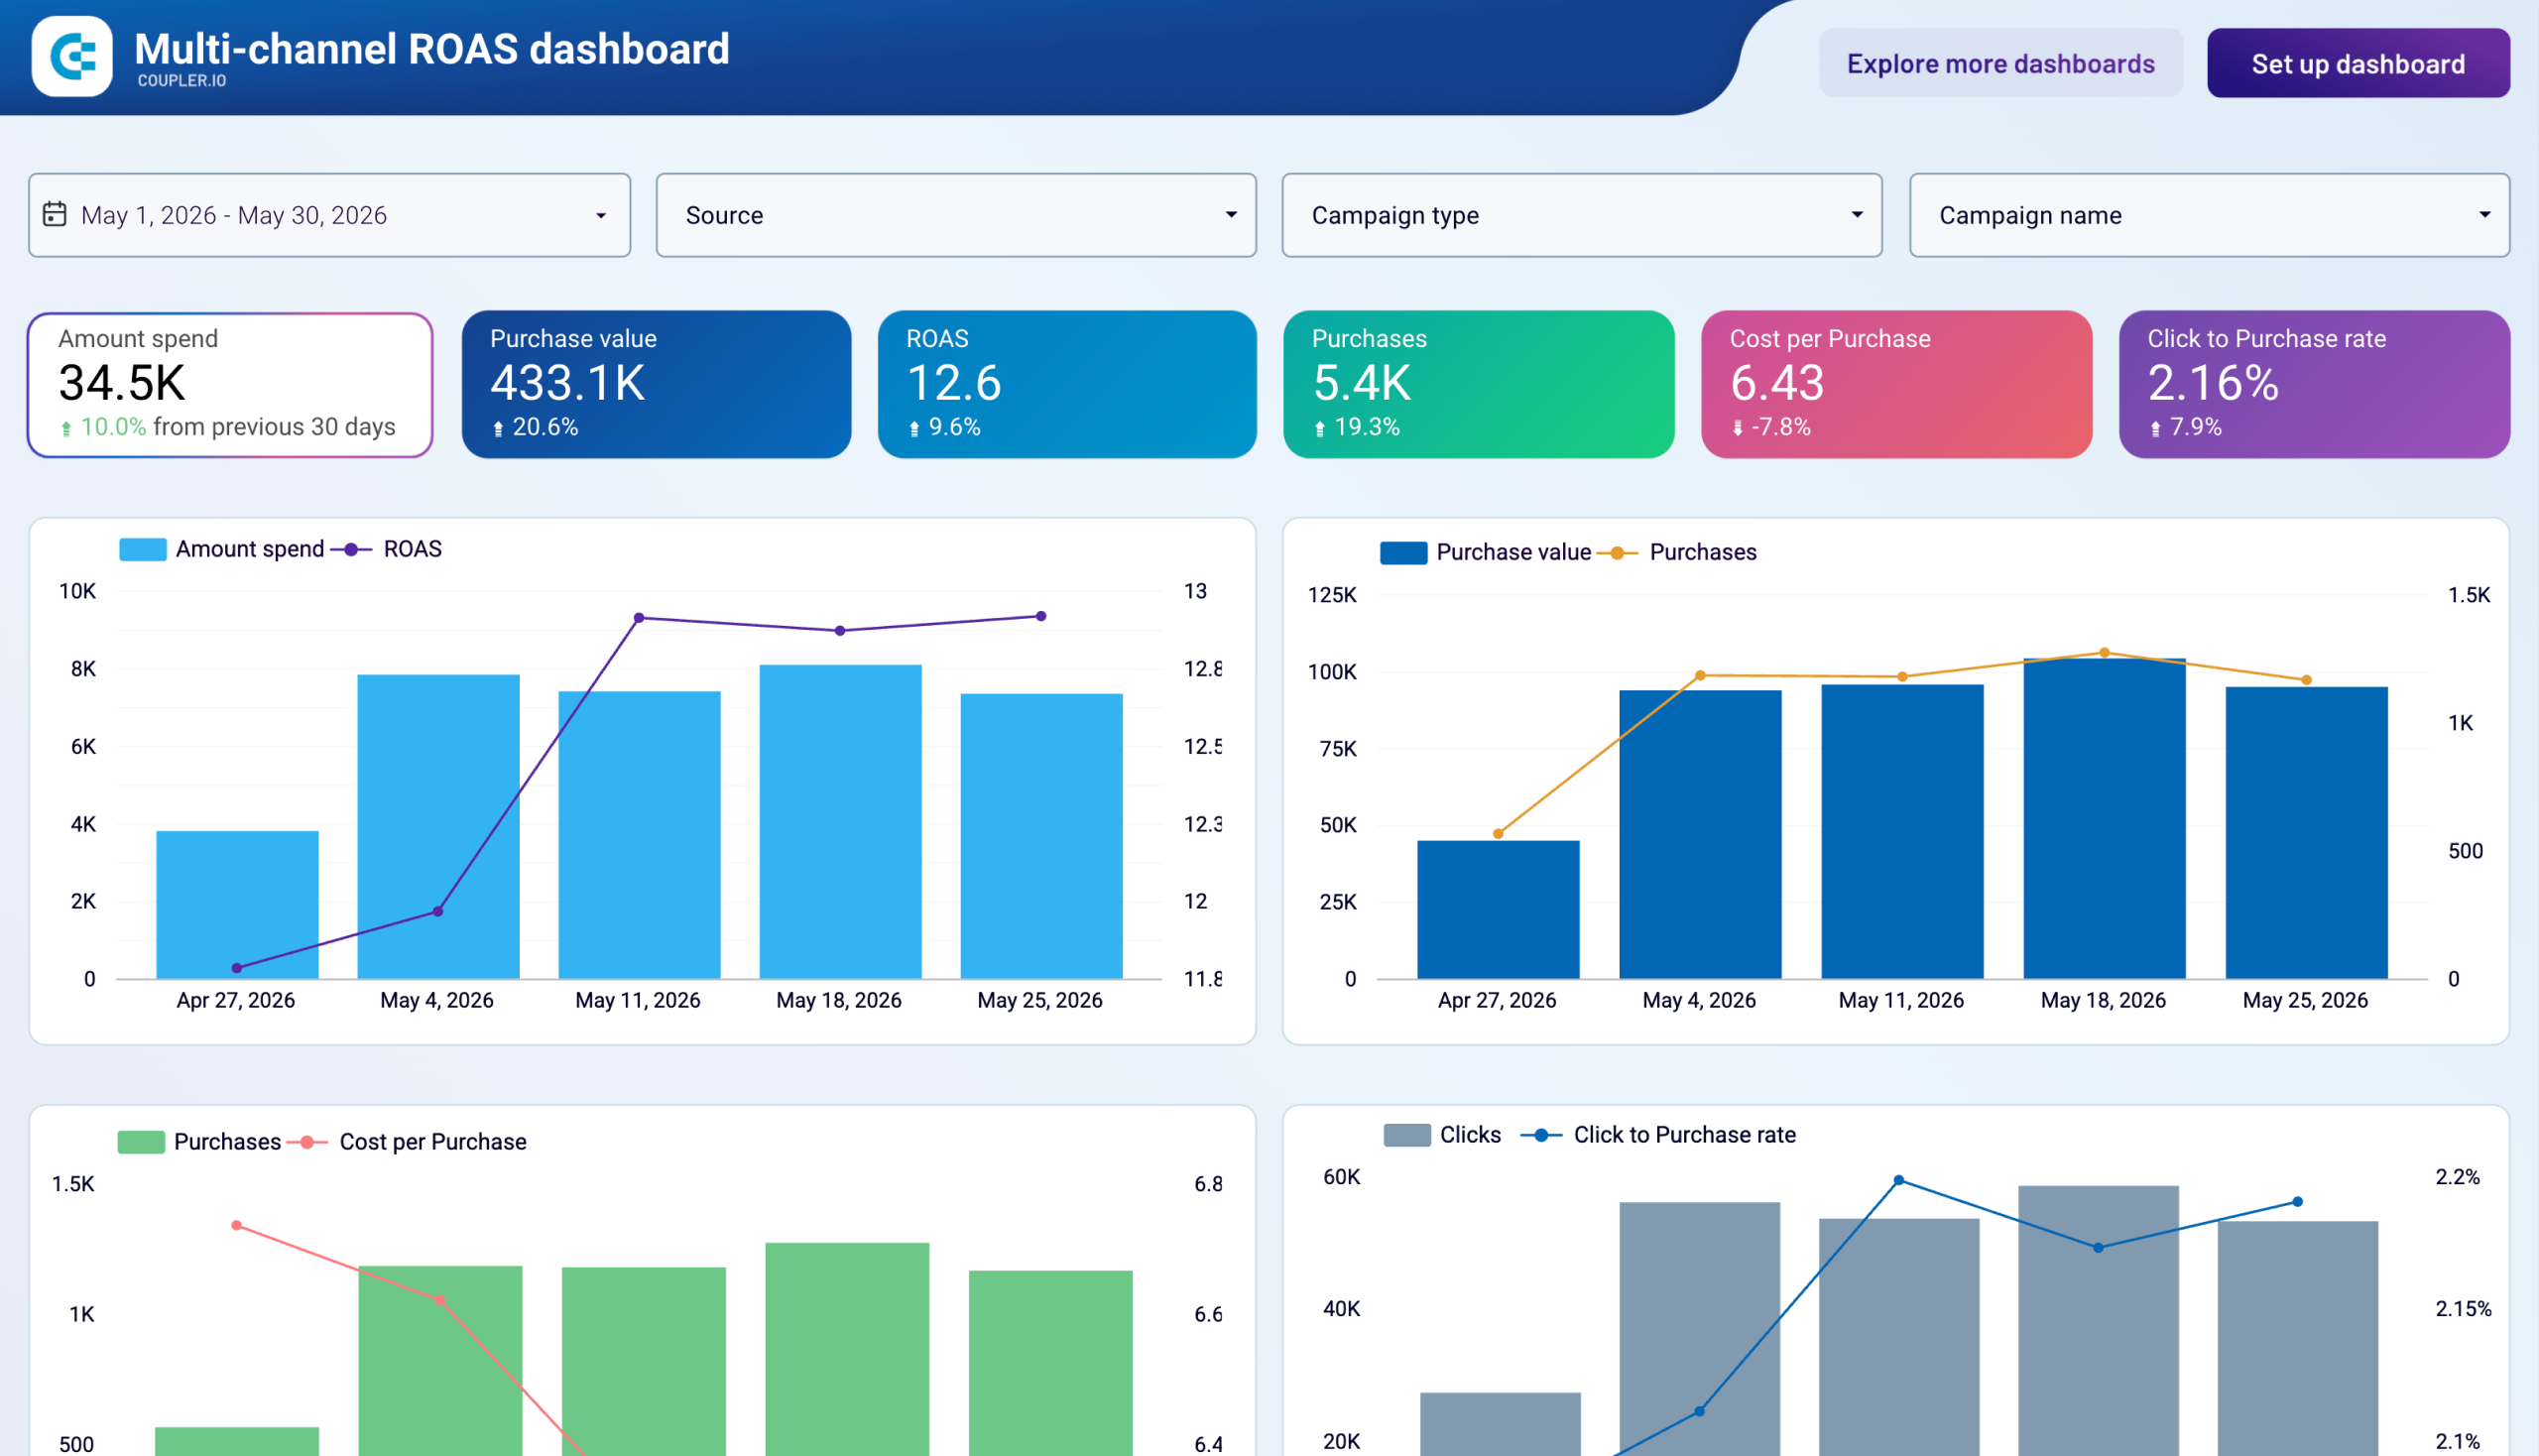
Calculate the revenue generated for every dollar spent on your Facebook advertising. The dashboard displays ROAS trends over time and comparisons across campaigns, providing clear visualization of your advertising profitability. This financial metric helps justify marketing investments and guides budget allocation decisions by showing which campaigns deliver the highest returns.
Track the number of leads captured through your Facebook ad campaigns, with detailed breakdowns by campaign, ad set, and lead form. The dashboard visualizes lead generation trends over time and across different audience segments, helping you evaluate lead acquisition efficiency. This volume metric connects advertising efforts to your sales pipeline and helps calculate cost per lead.
Monitor the average cost to acquire each lead through your Facebook advertising campaigns. The dashboard breaks down CPL by campaign, ad set, and audience demographics, helping identify your most cost-efficient lead generation approaches. This efficiency metric is crucial for optimizing lead acquisition strategies and maintaining healthy marketing economics.
Analyze how your ads perform across different countries and regions, with visualizations showing impressions, clicks, conversions, and costs by location. The dashboard's geographic insights help identify regional variances in campaign performance and audience response. This targeting insight helps optimize regional budget allocation and customize messaging for different markets.