Shopify dashboard examples and reporting templates
Transform your e-commerce store performance with automated Shopify dashboard templates that consolidate inventory management, order analytics, marketing attribution, and customer insights. Track stock levels, monitor sales funnels, analyze customer behavior, and optimize marketing spend with real-time data from your Shopify store integrated seamlessly into powerful visualization tools.
Shopify dashboard examples for every need


 +5
+5


 +4
+4

 +5
+5

 +5
+5

about your case. It doesn't cost you a penny 😉
Choose your white label Shopify dashboard examples to kick off
What is a Shopify dashboard?
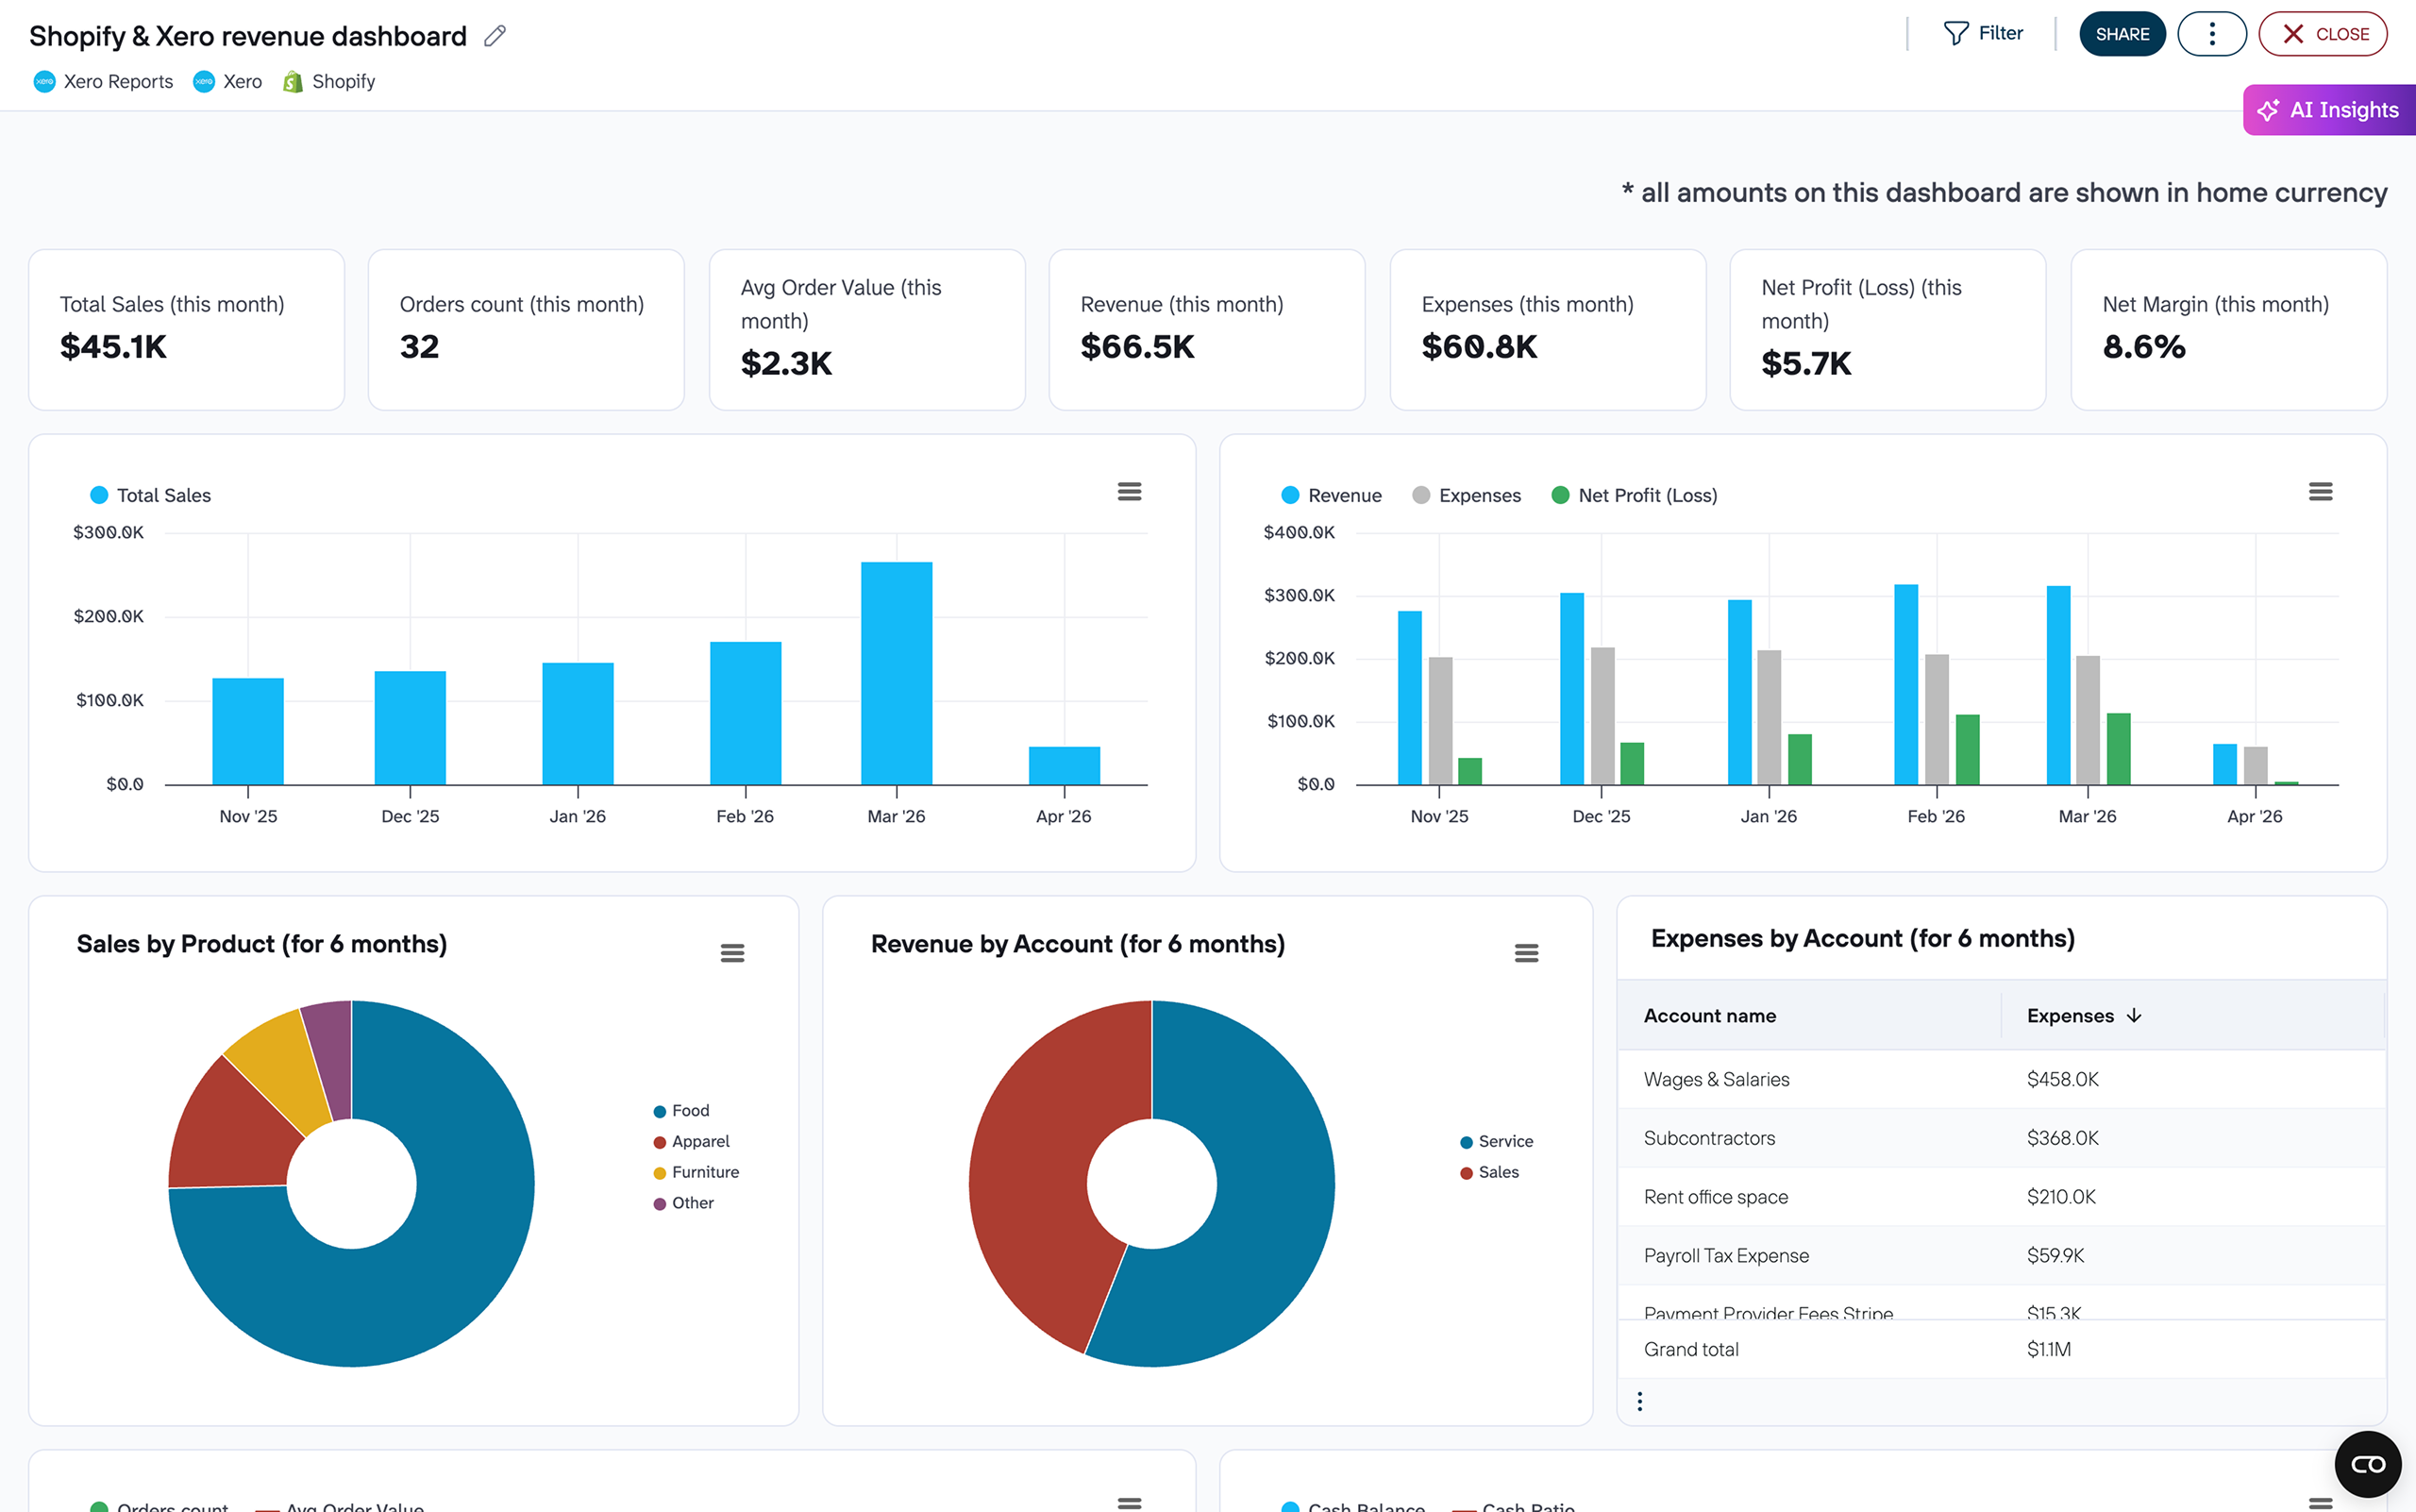
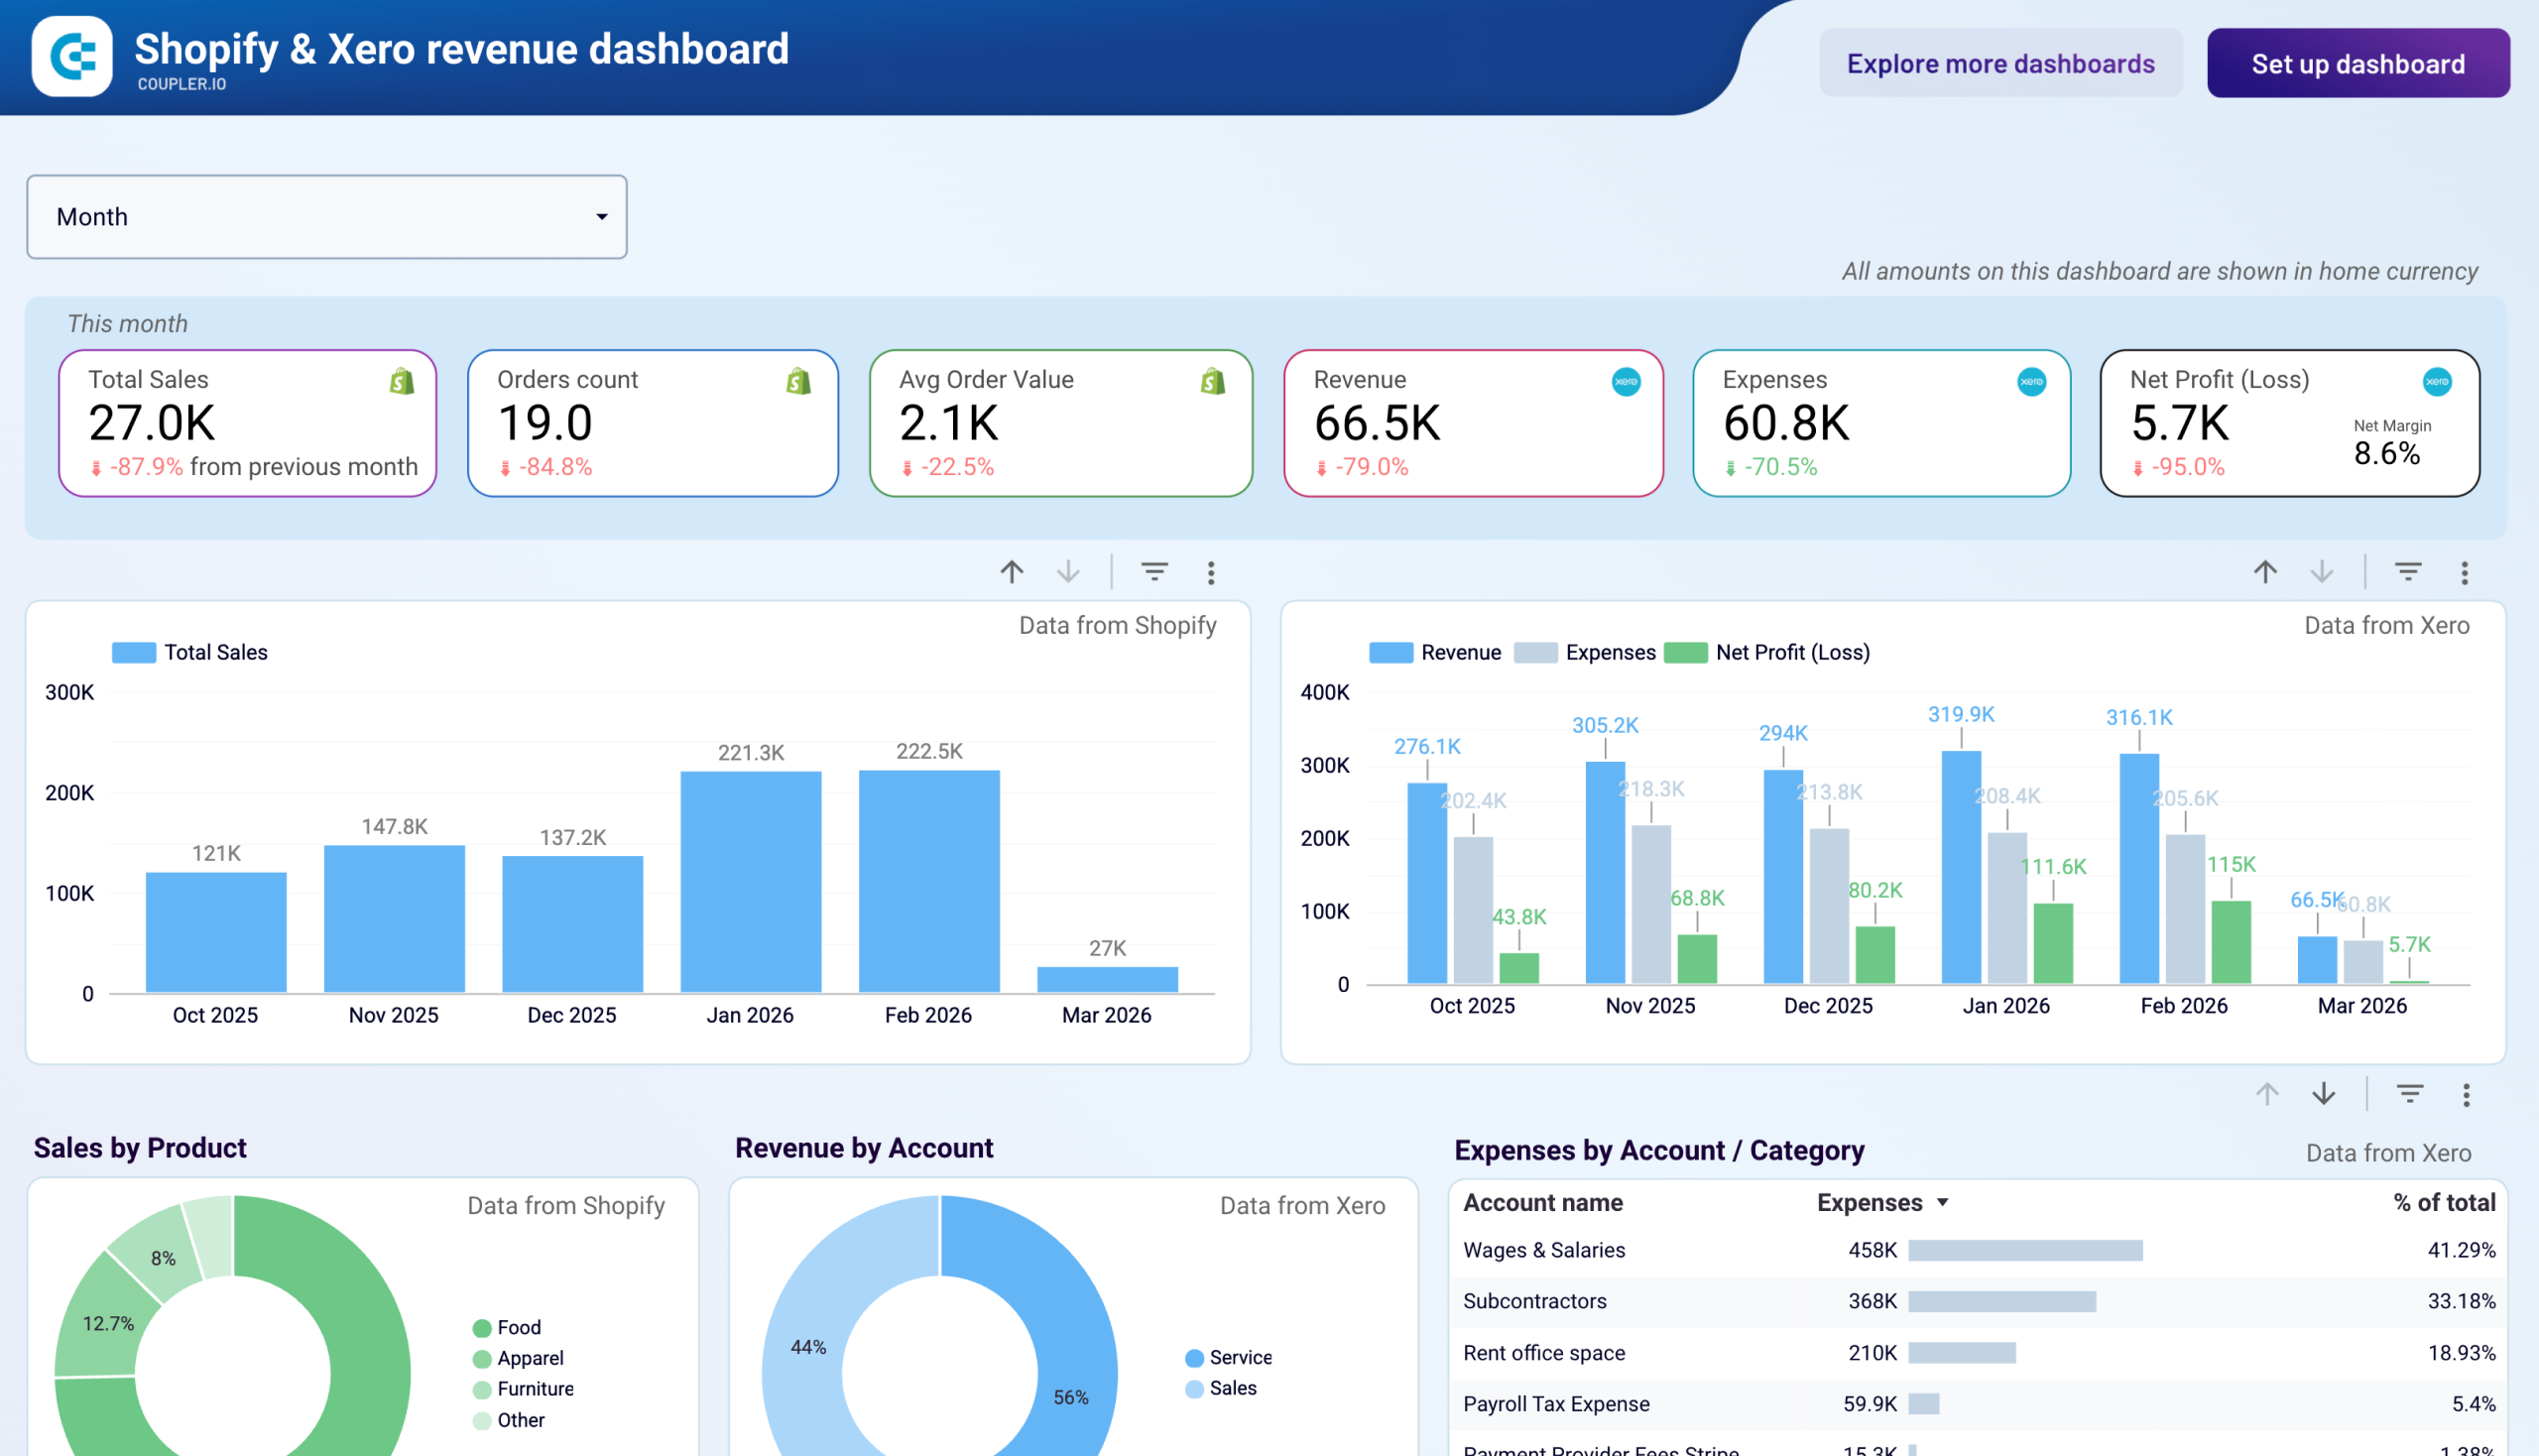
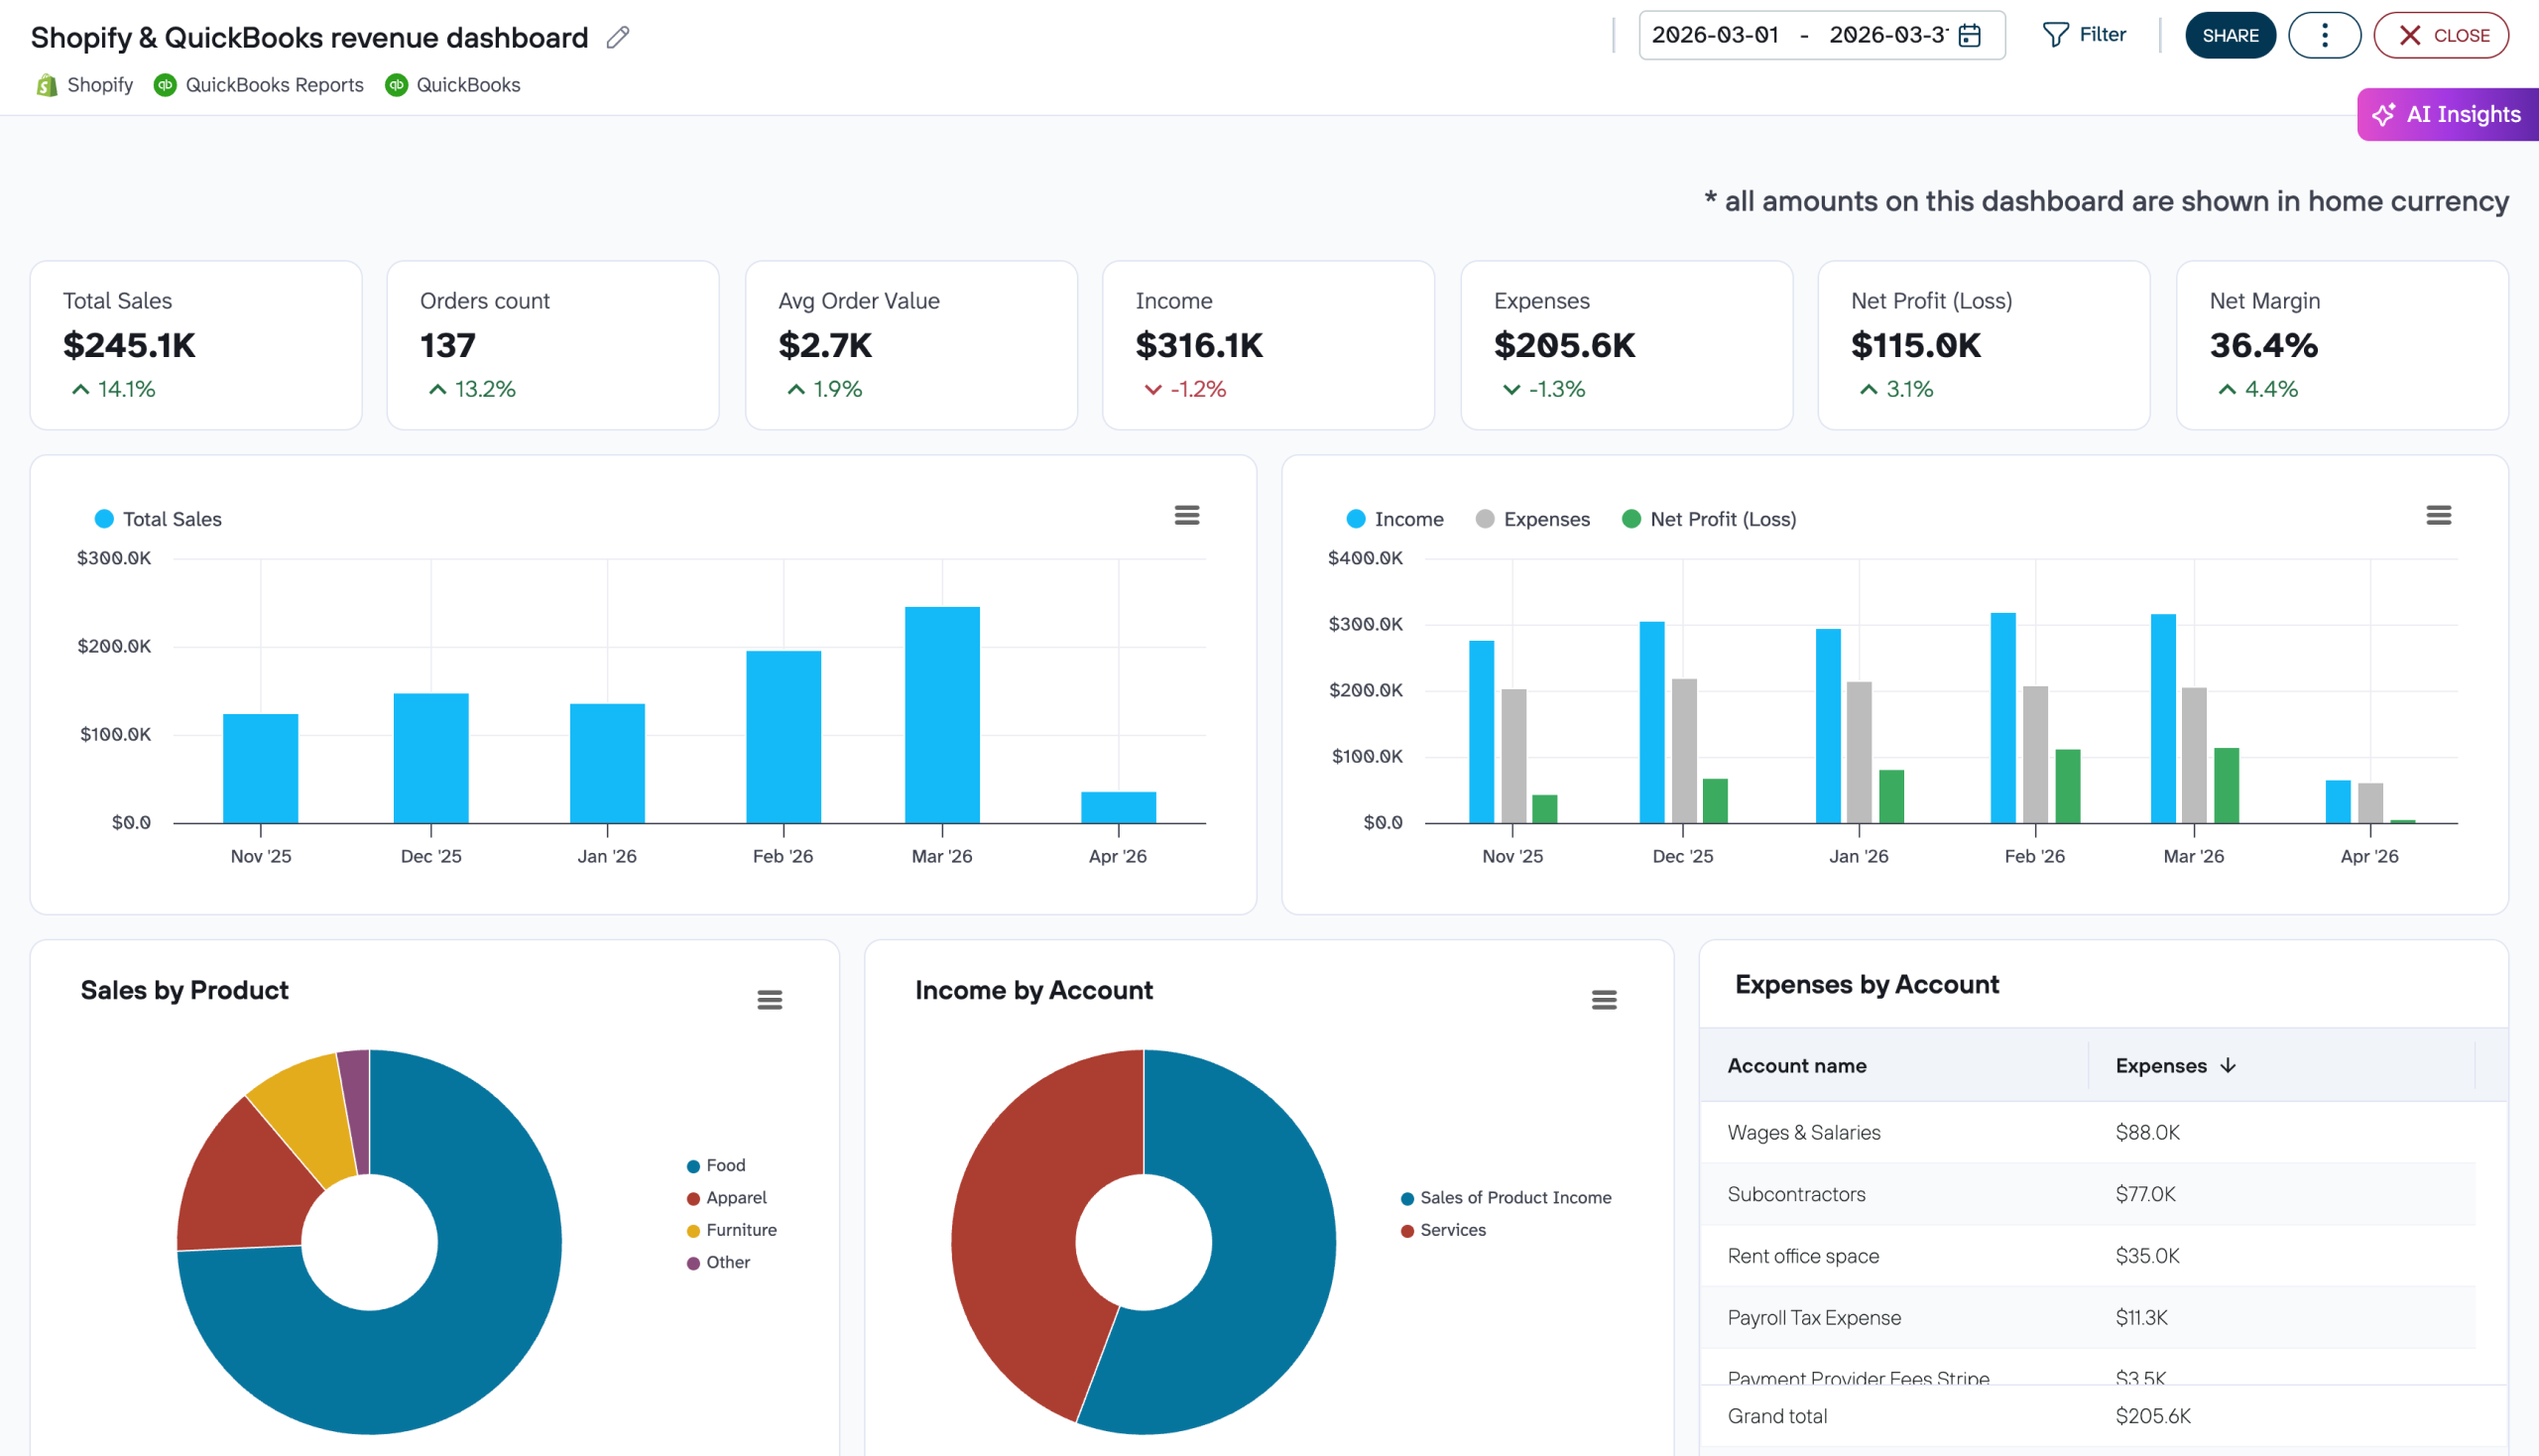
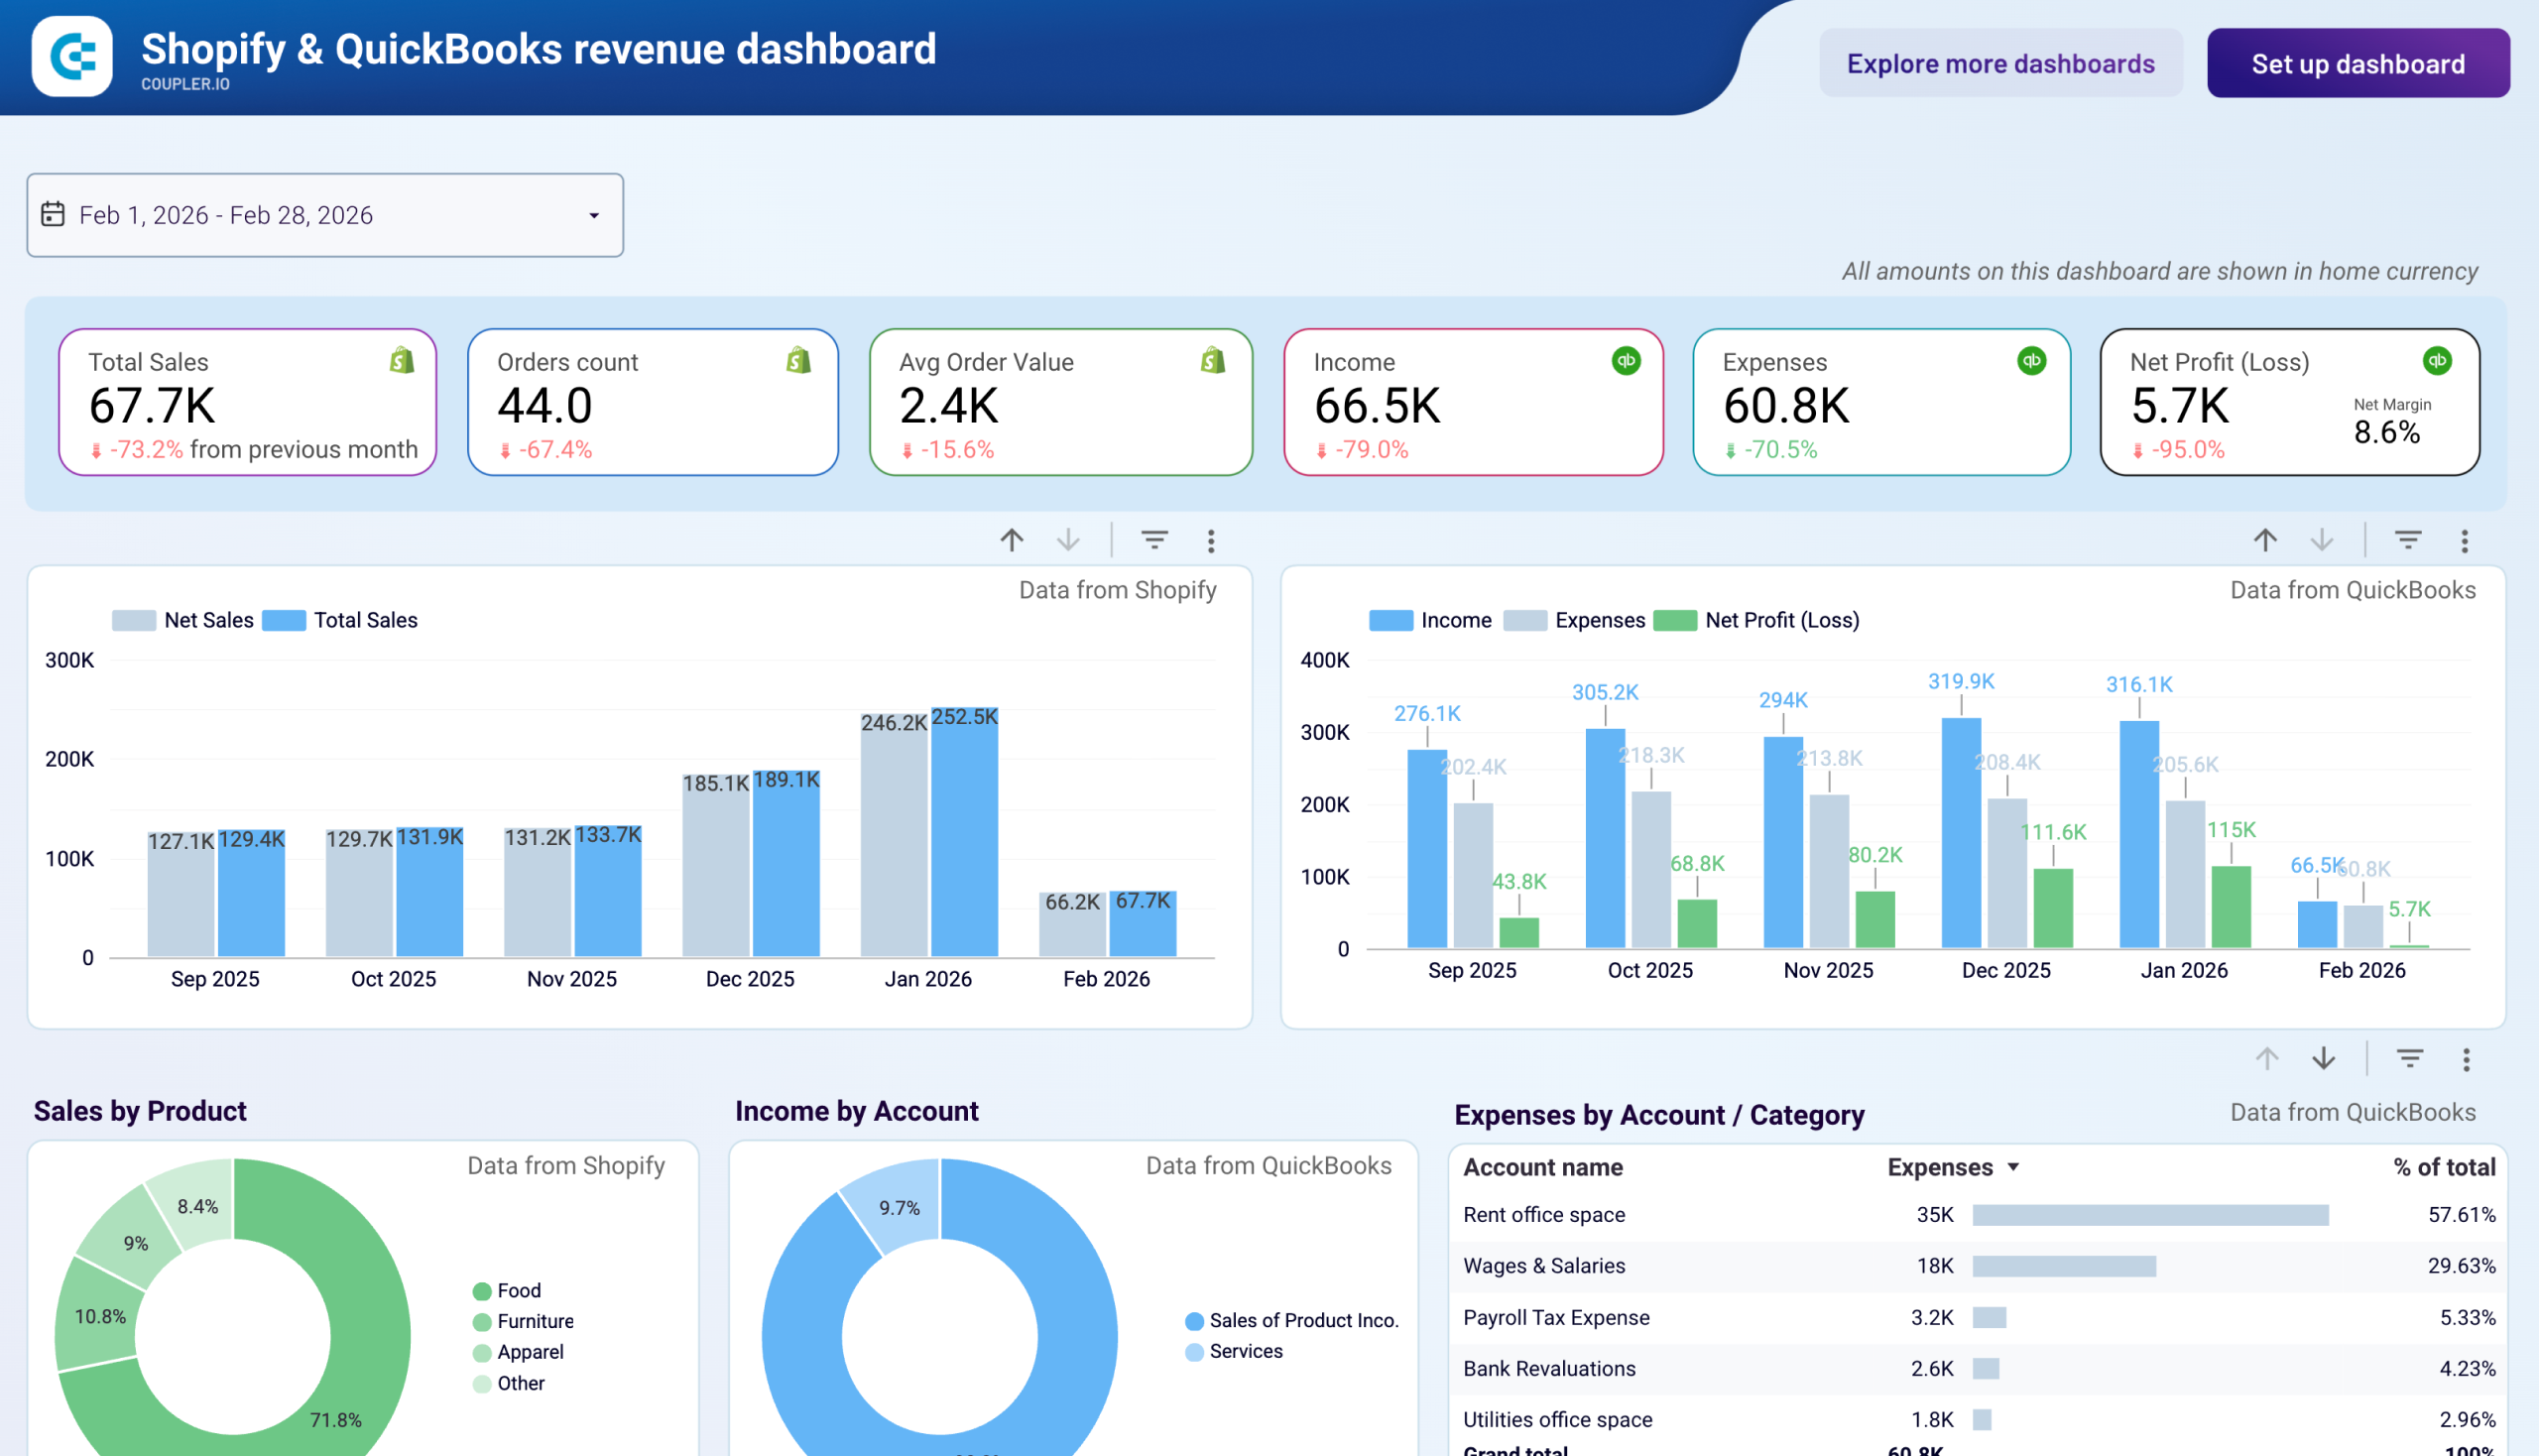
Unlike standard reports that operate in isolation, Shopify reporting dashboards reveal critical relationships between marketing spend, inventory turnover, customer acquisition costs, and revenue generation. Coupler.io automatically refreshes data on scheduled intervals, consolidating information from multiple sources and loading it into business intelligence tools like Looker Studio, Power BI, and Google Sheets. This automation eliminates manual data exports and spreadsheet management, providing store owners with real-time visibility into inventory levels, customer behavior patterns, marketing performance, and sales trends in a single, comprehensive view.

What reports should be included in Shopify dashboards?
Building an effective Shopify analytics dashboard requires carefully selected reports that address the core challenges of ecommerce management. Based on successful implementations across various store types, we recommend incorporating these four critical report categories to achieve comprehensive business visibility.
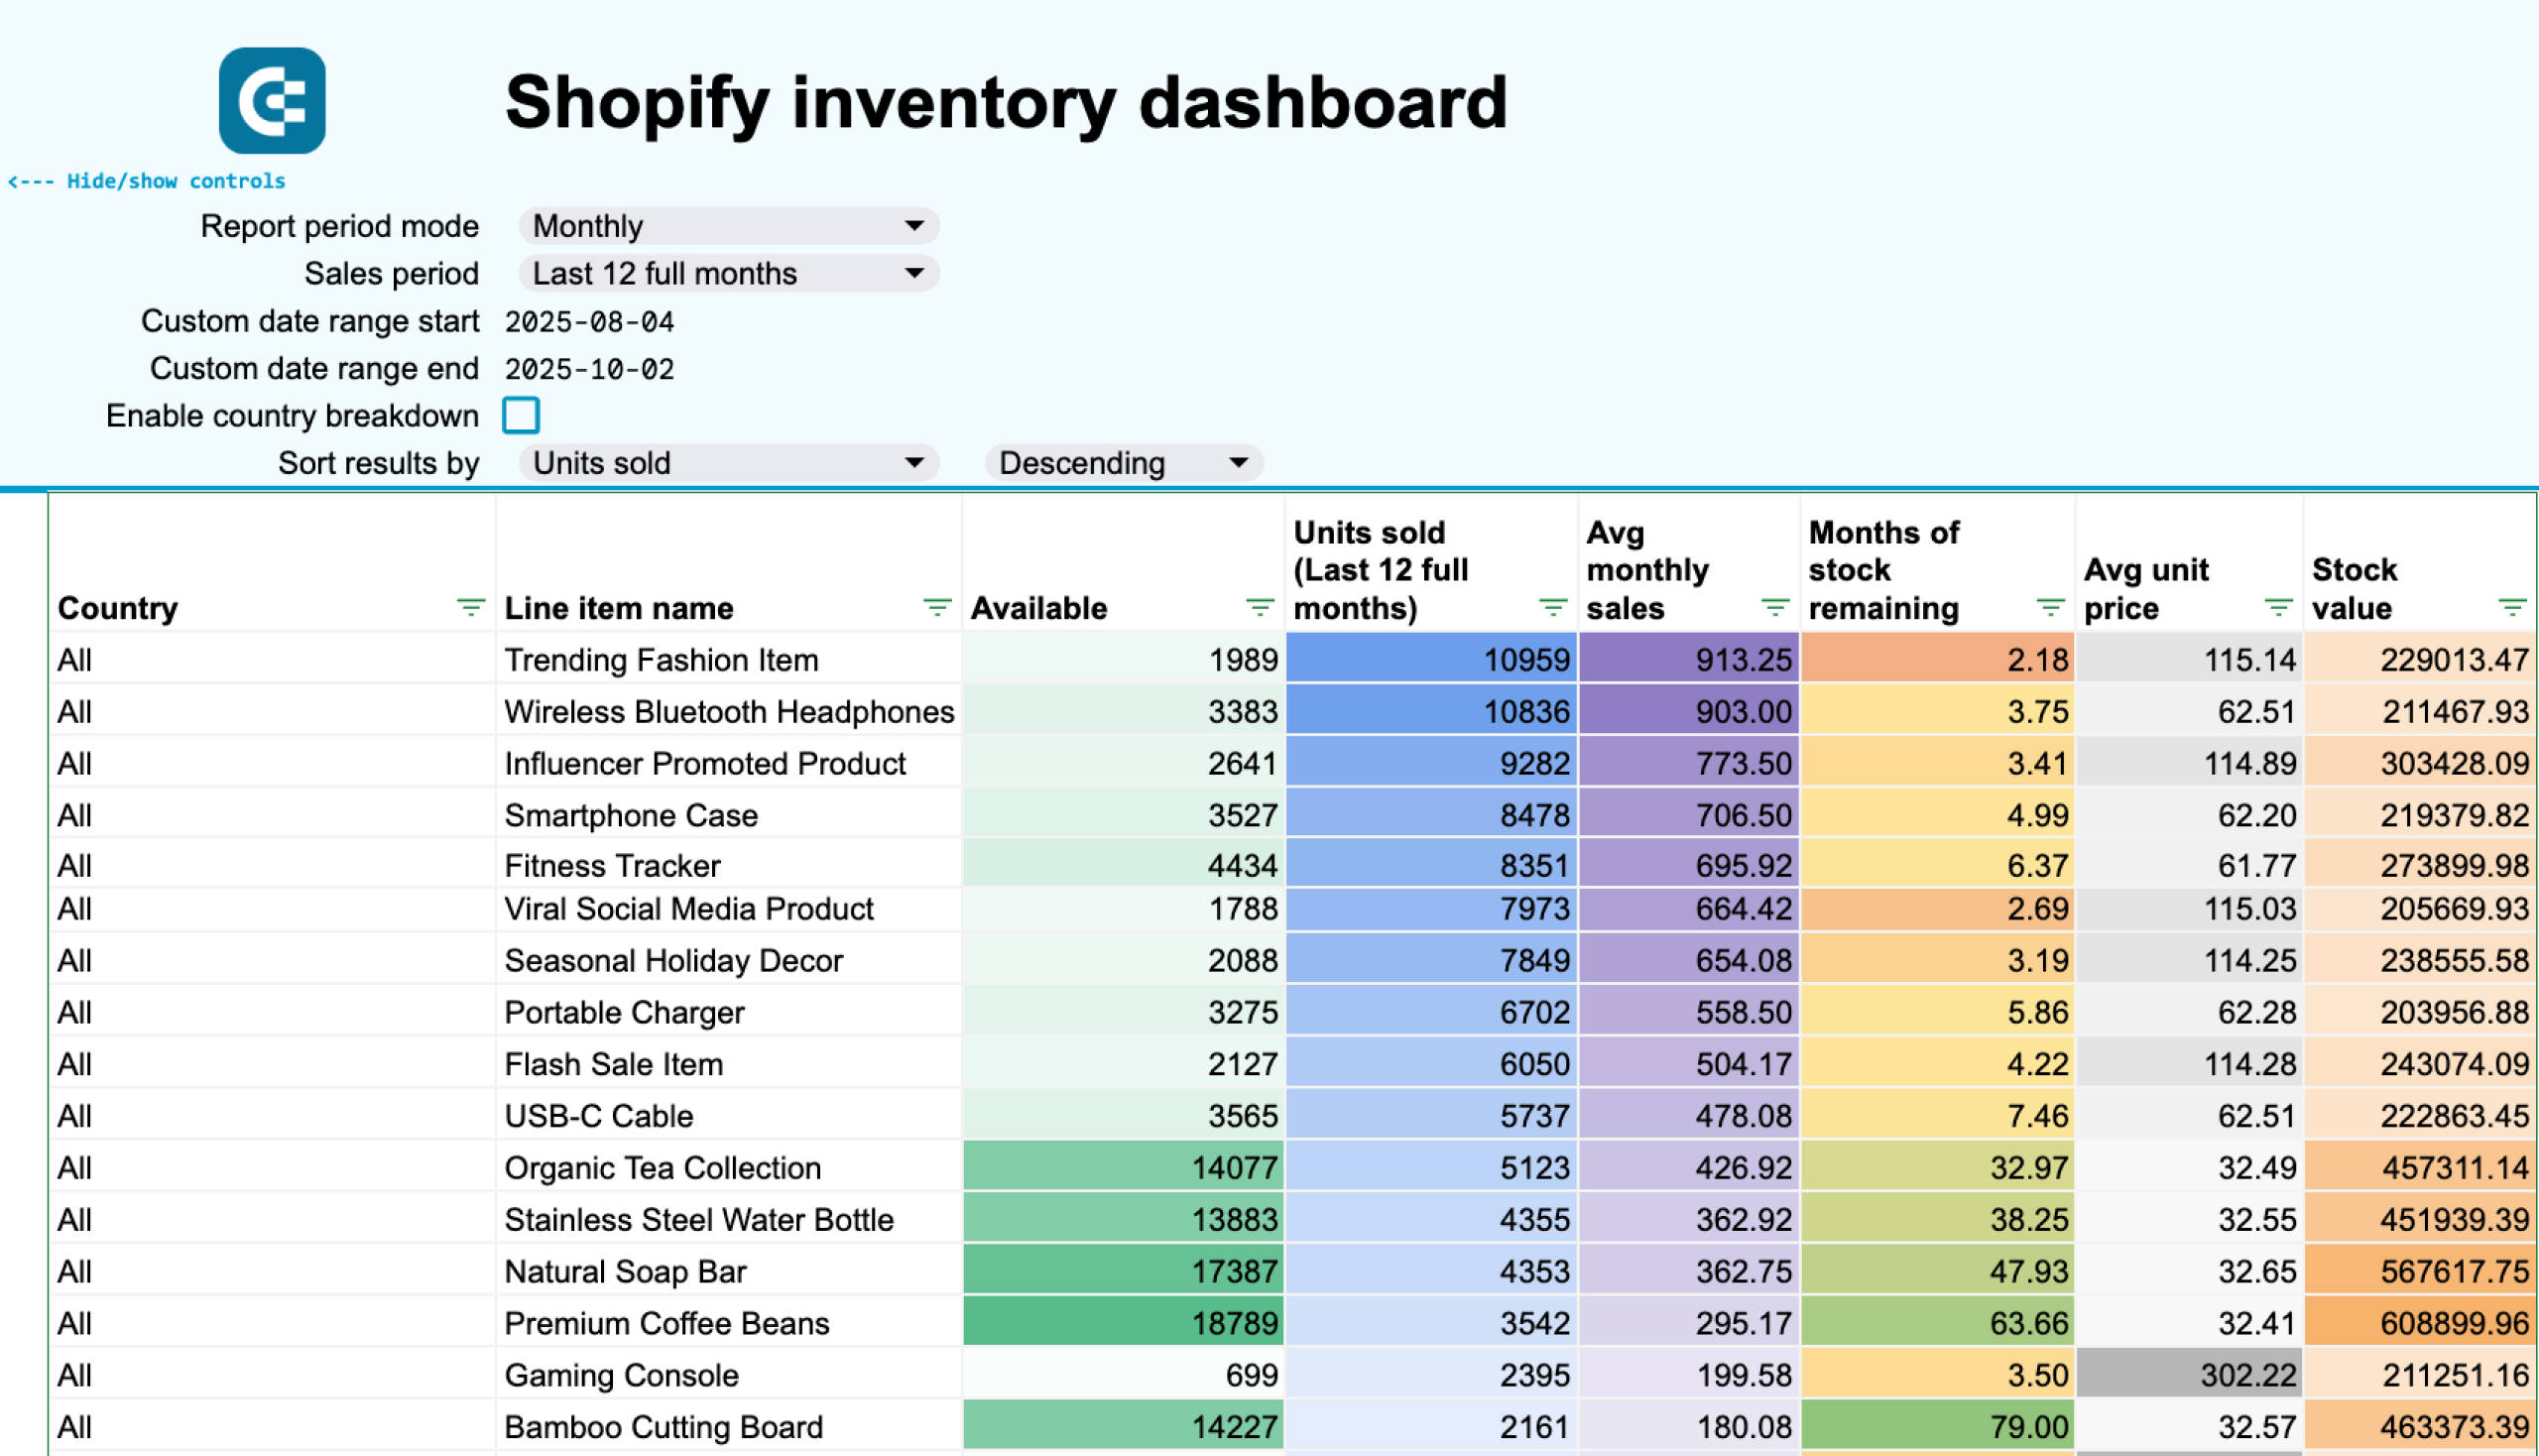
The inventory management report provides SKU-level analysis with automated calculations for days of stock remaining, helping prevent stockouts before they impact sales. The Shopify inventory dashboard tracks product availability across multiple locations, monitors turnover rates, and identifies slow-moving inventory that ties up capital. It includes procurement planning tools that predict when to reorder products based on historical sales patterns and seasonal trends.
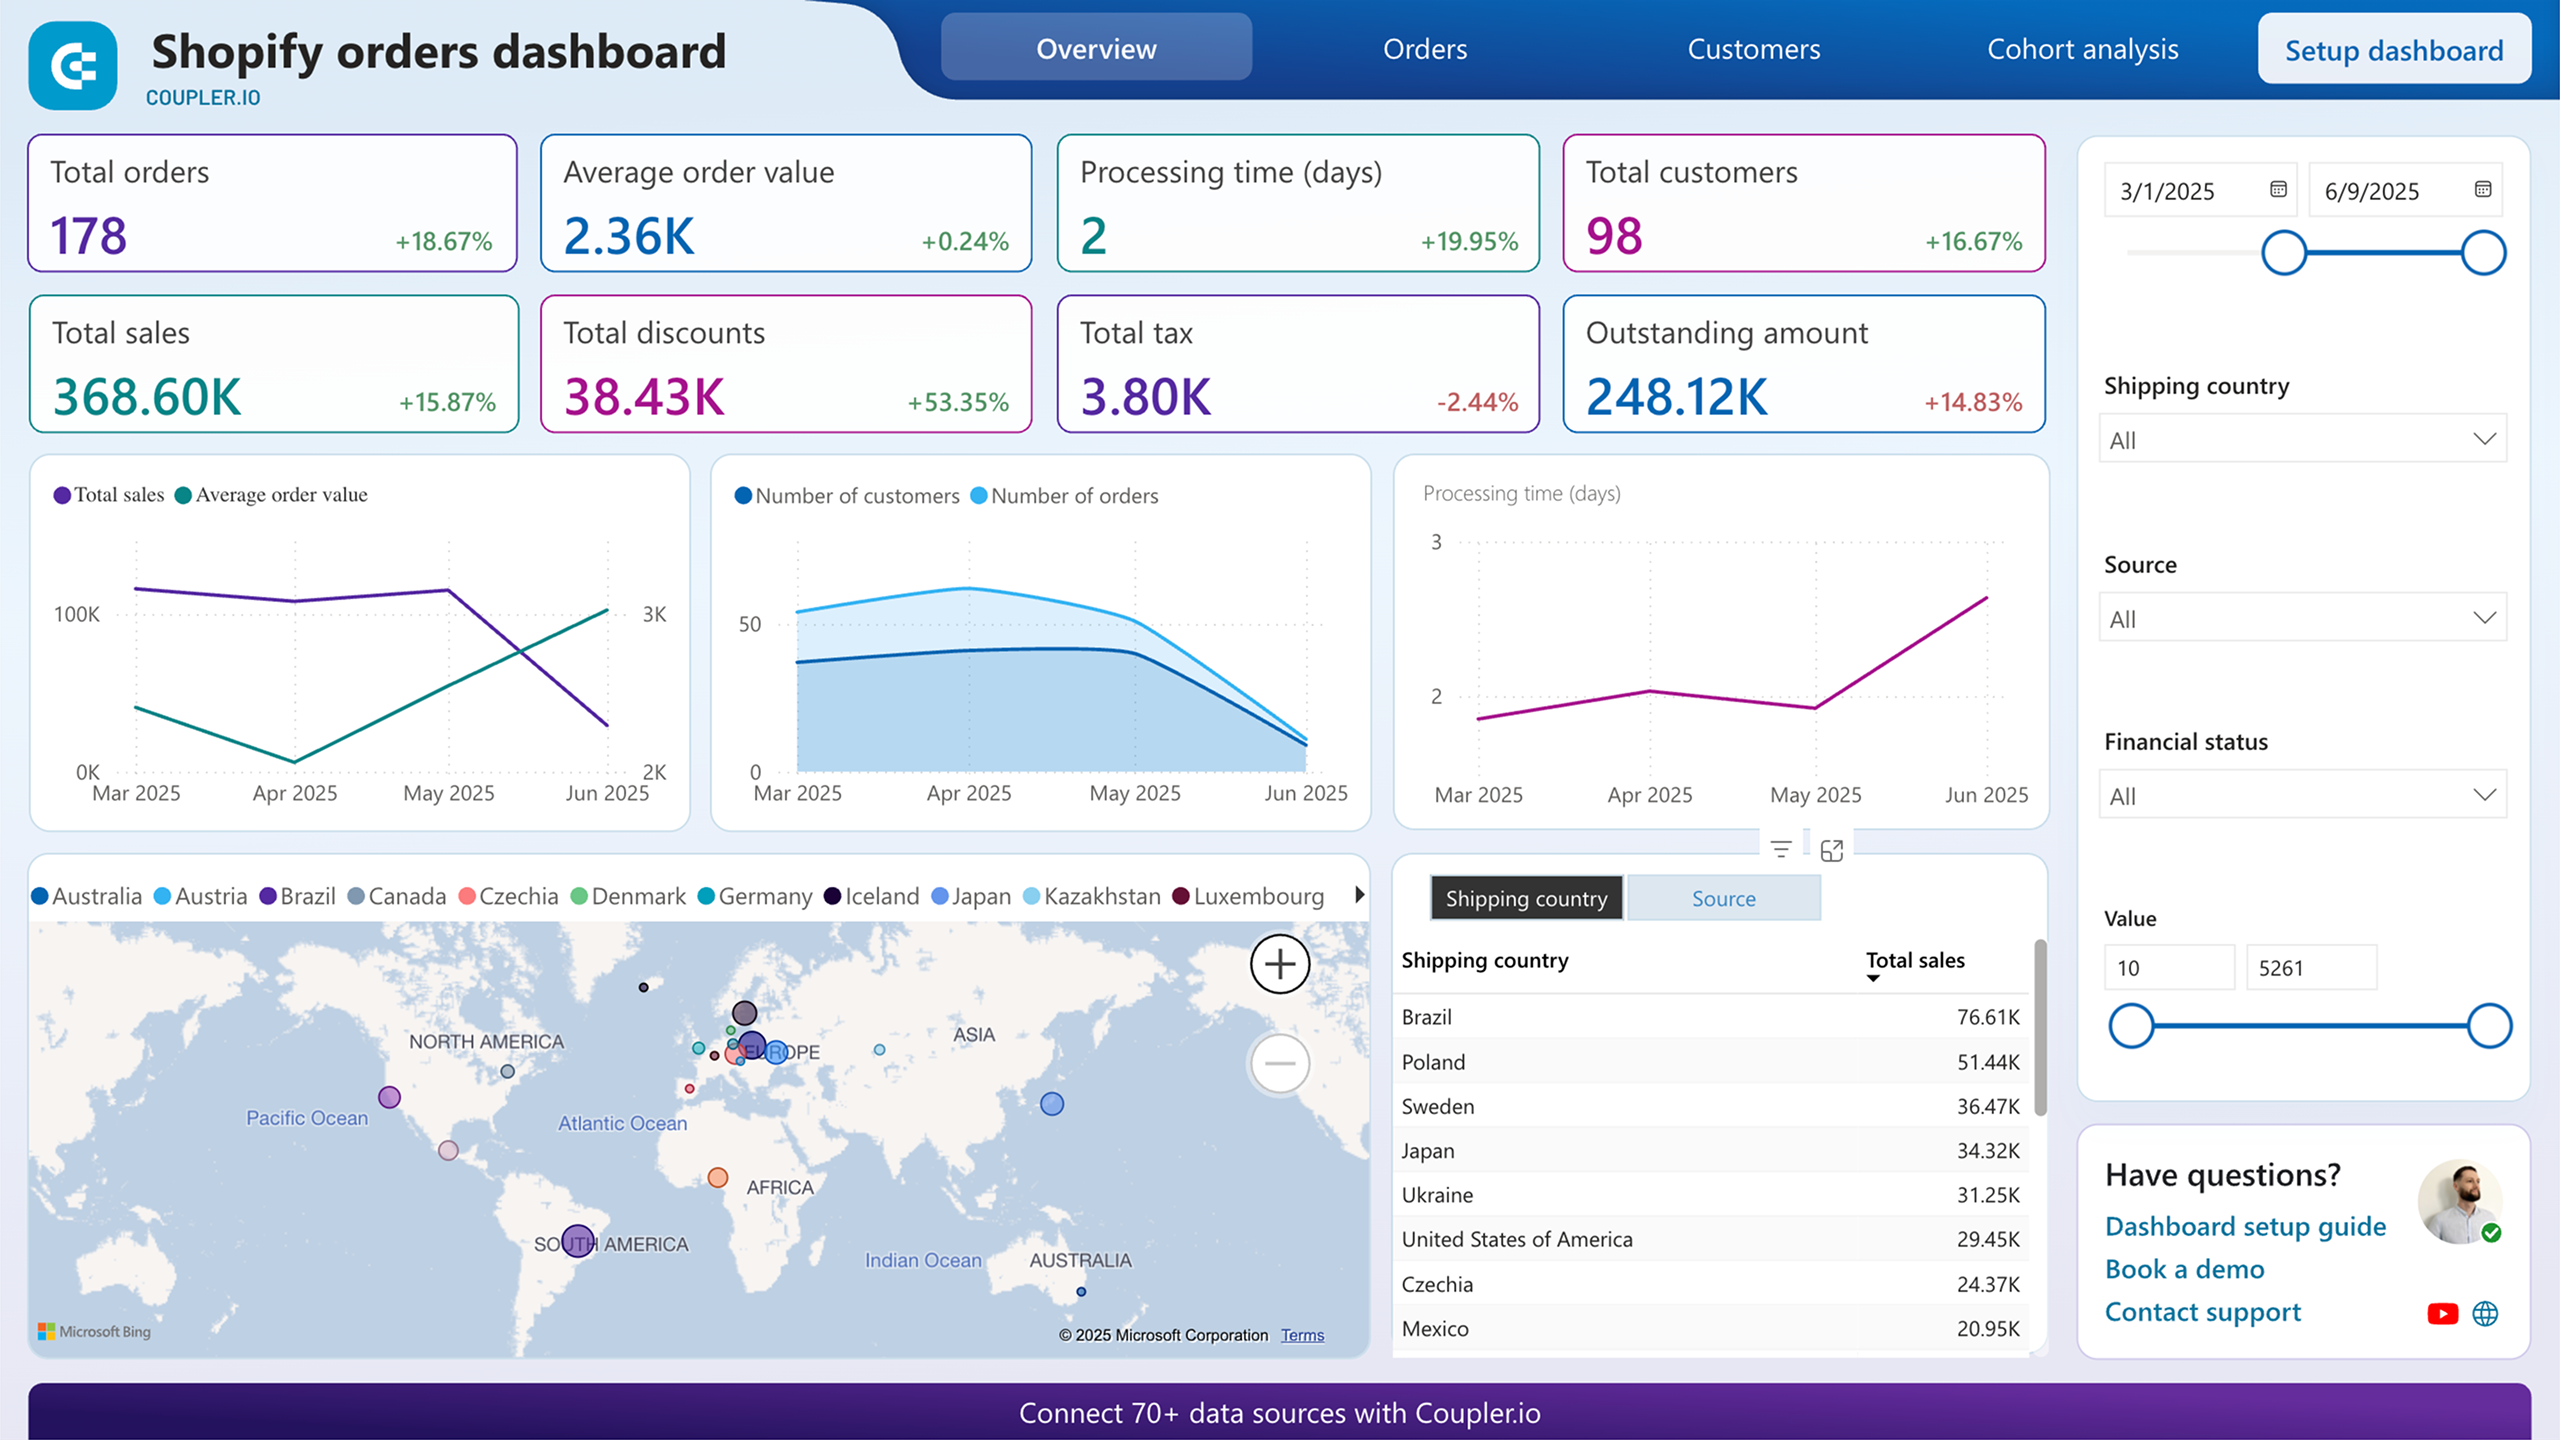
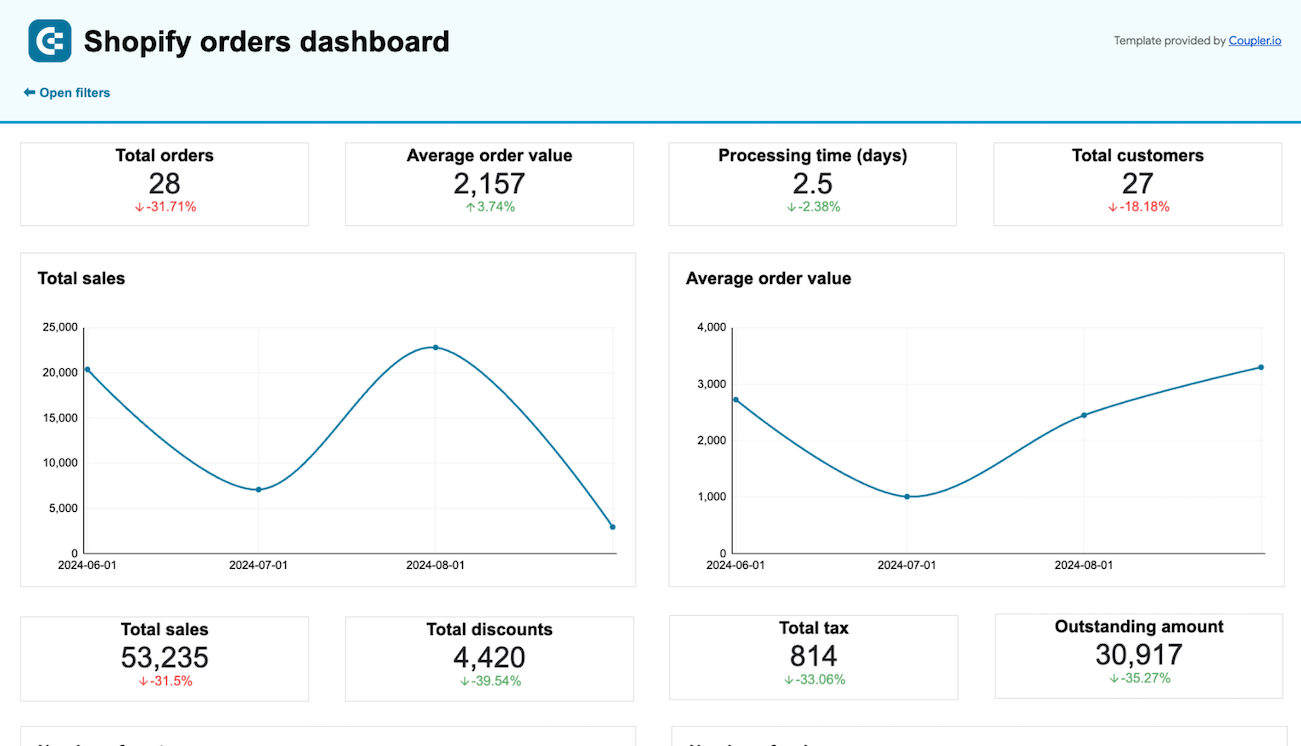
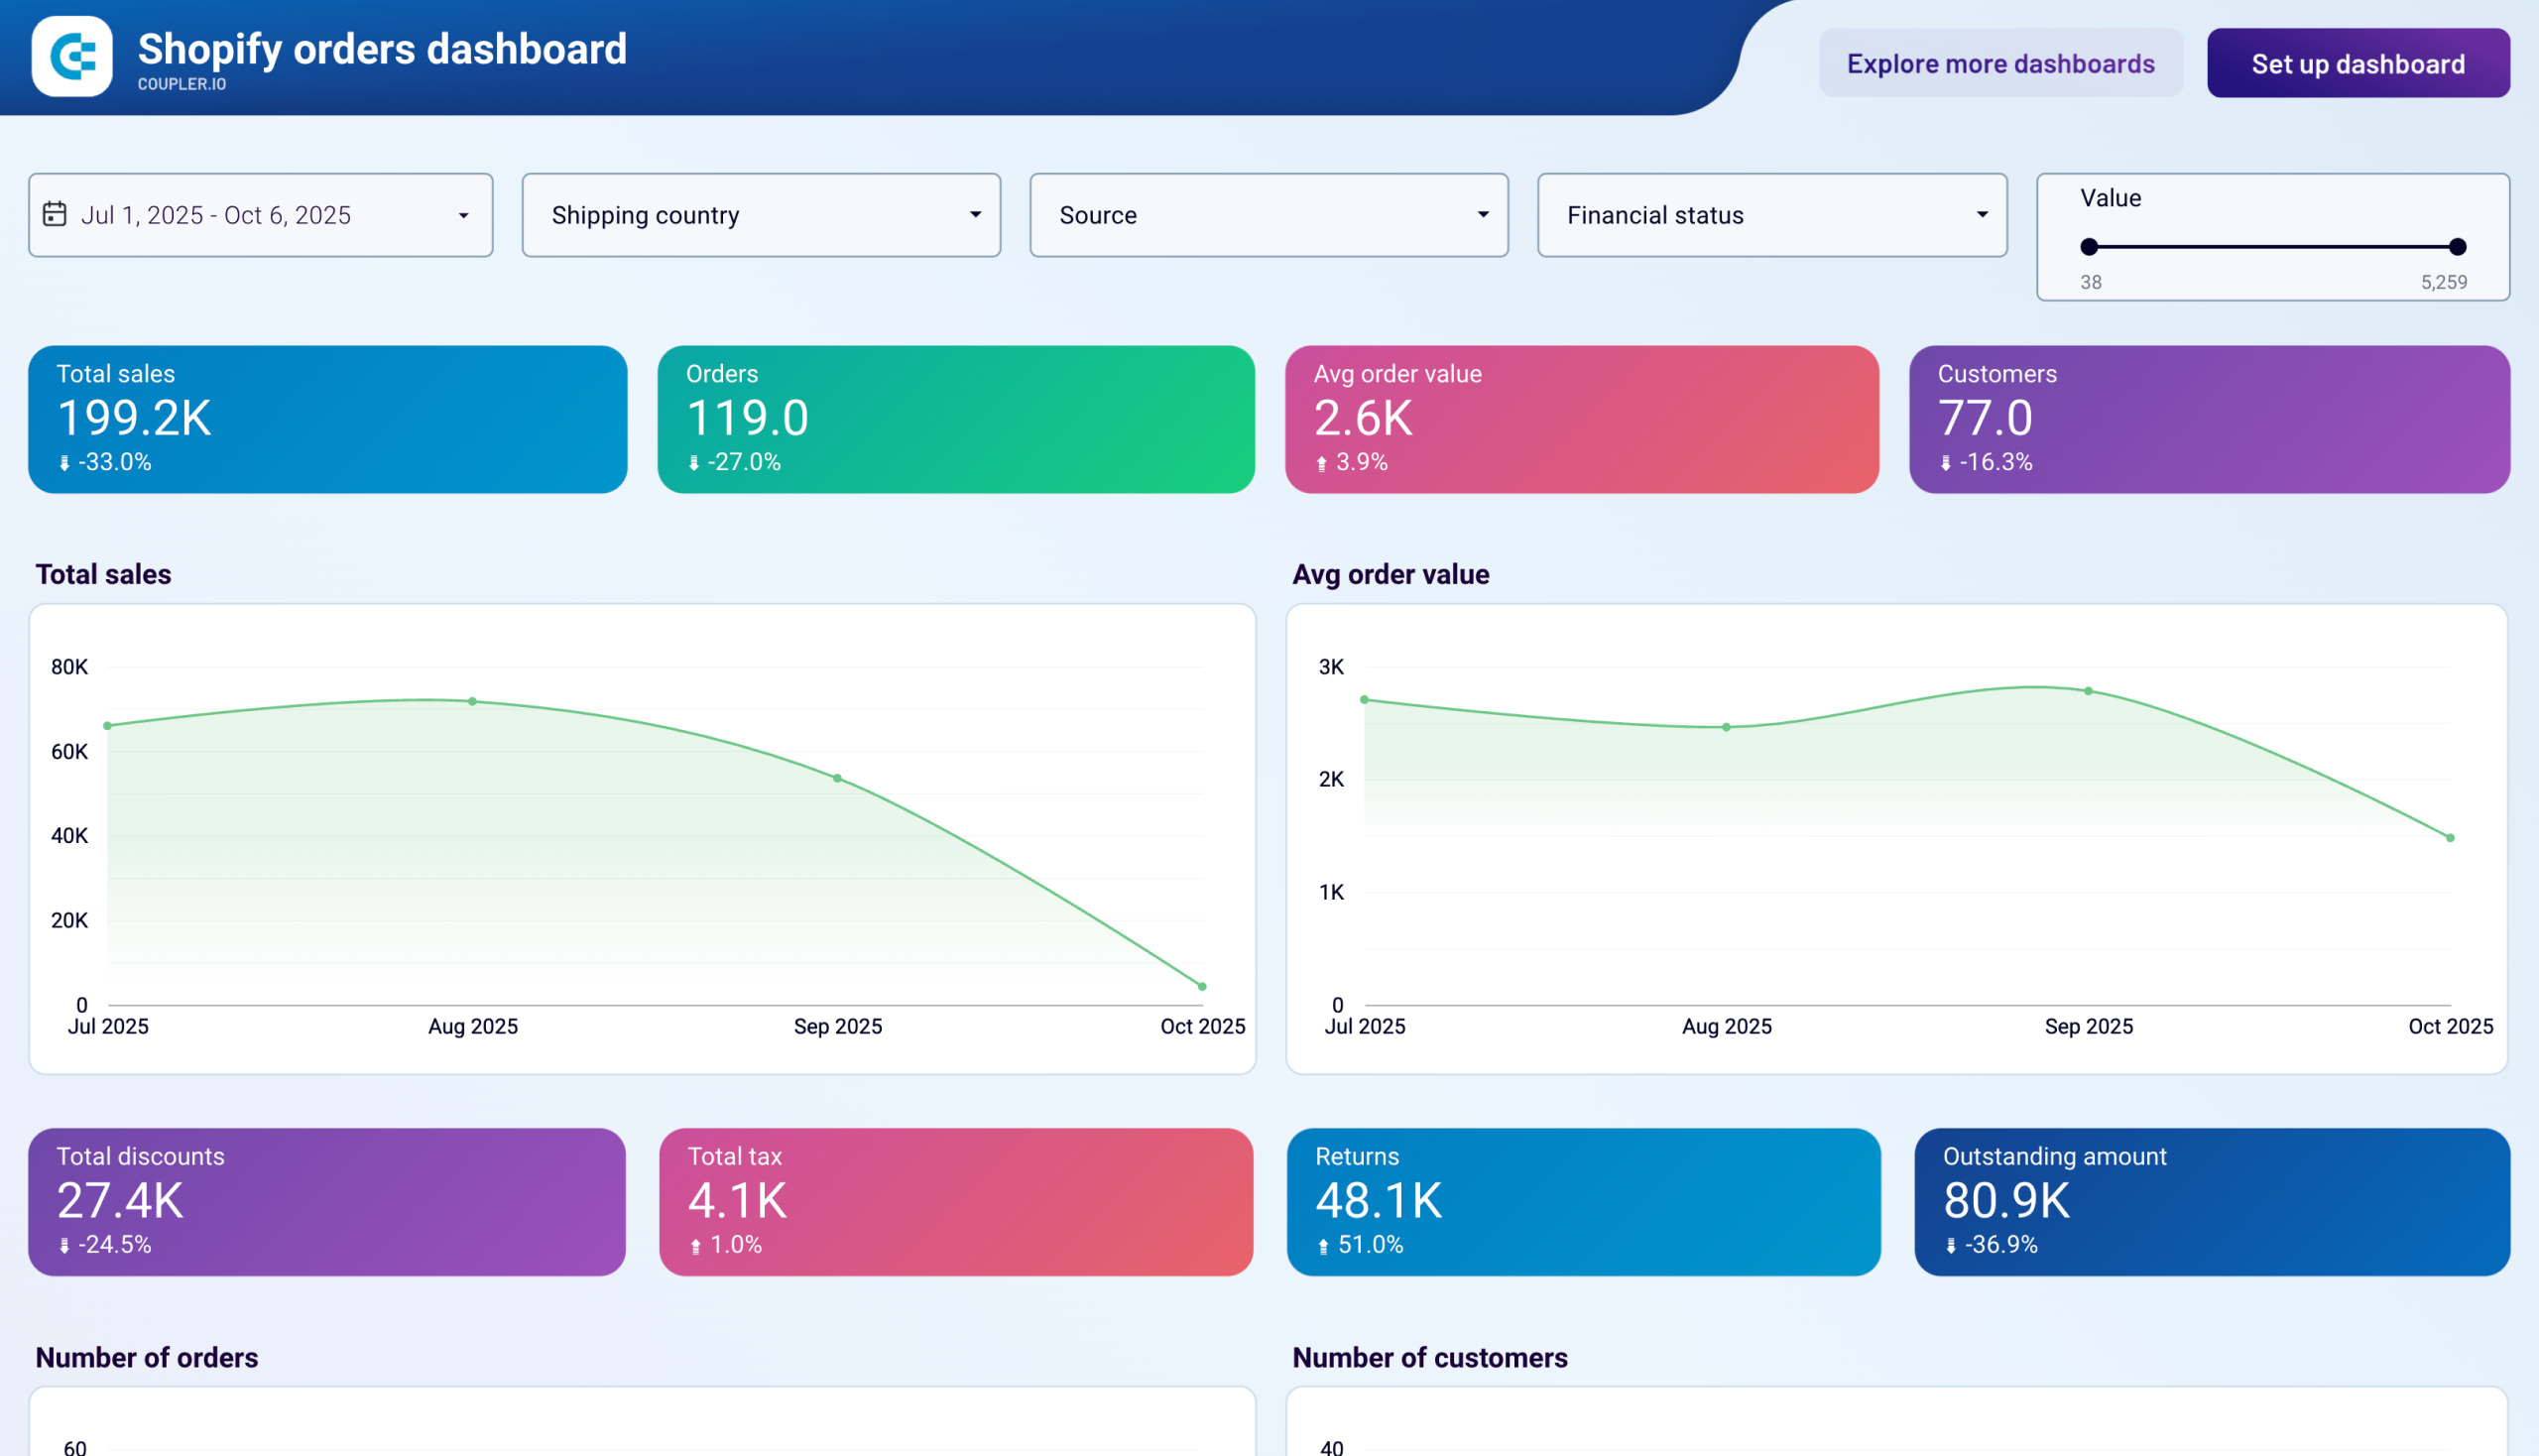
The customer analytics report delivers detailed insights into purchasing behavior, geographic distribution, and customer value segmentation. It tracks individual customer performance, including total sales, order frequency, discount usage, and payment patterns across different regions. The Shopify KPI dashboard helps identify your most valuable customers, understand regional preferences, and optimize pricing strategies based on customer behavior patterns.
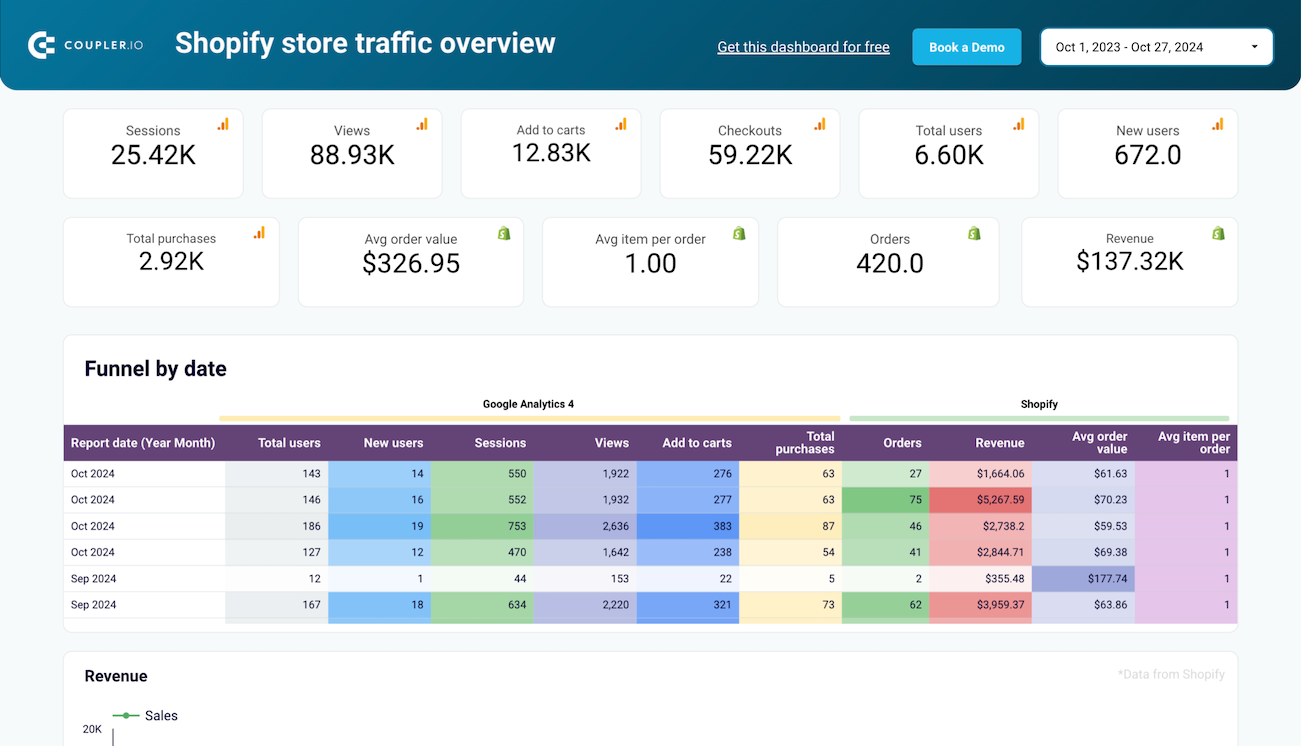
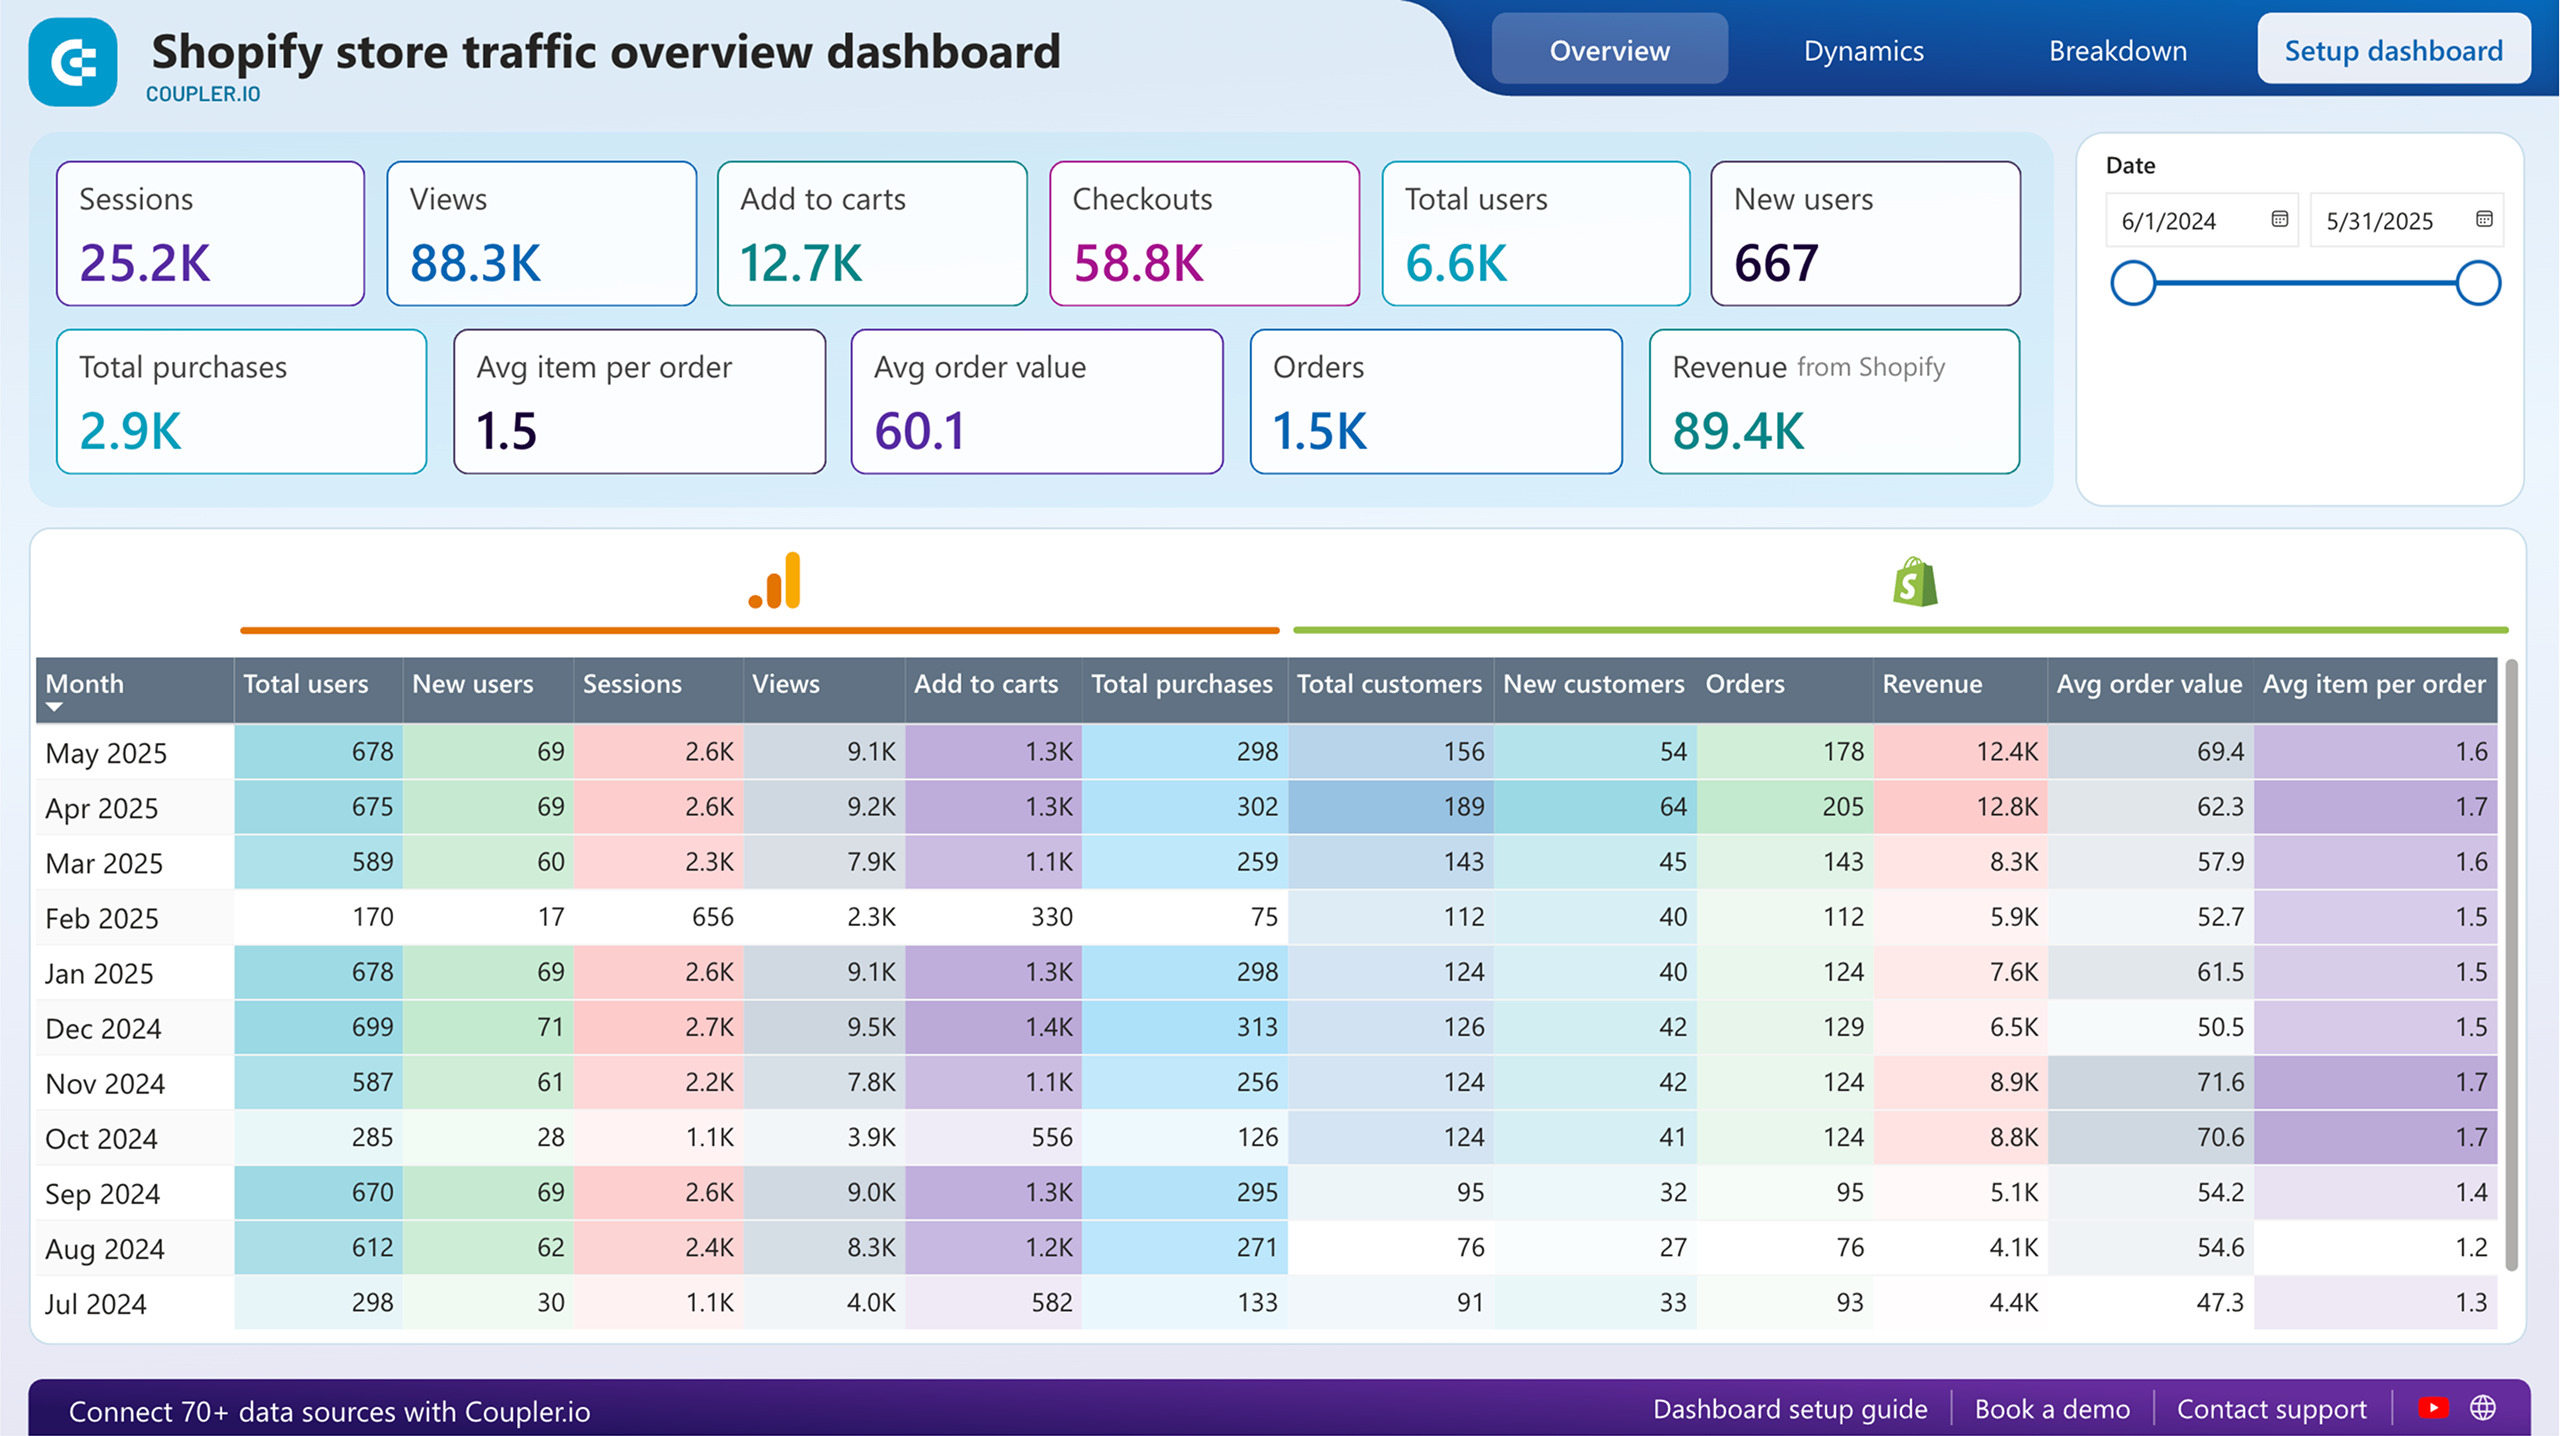
The marketing funnel report connects advertising spend across multiple platforms with actual store conversions, providing clear attribution from impression to purchase. It tracks the complete customer journey through weekly performance metrics, showing how users progress from initial ad exposure through website visits to completed transactions. The Shopify marketing funnel dashboard includes spend analysis by platform, conversion rate tracking at each funnel stage, and ROI calculations that help optimize budget allocation.
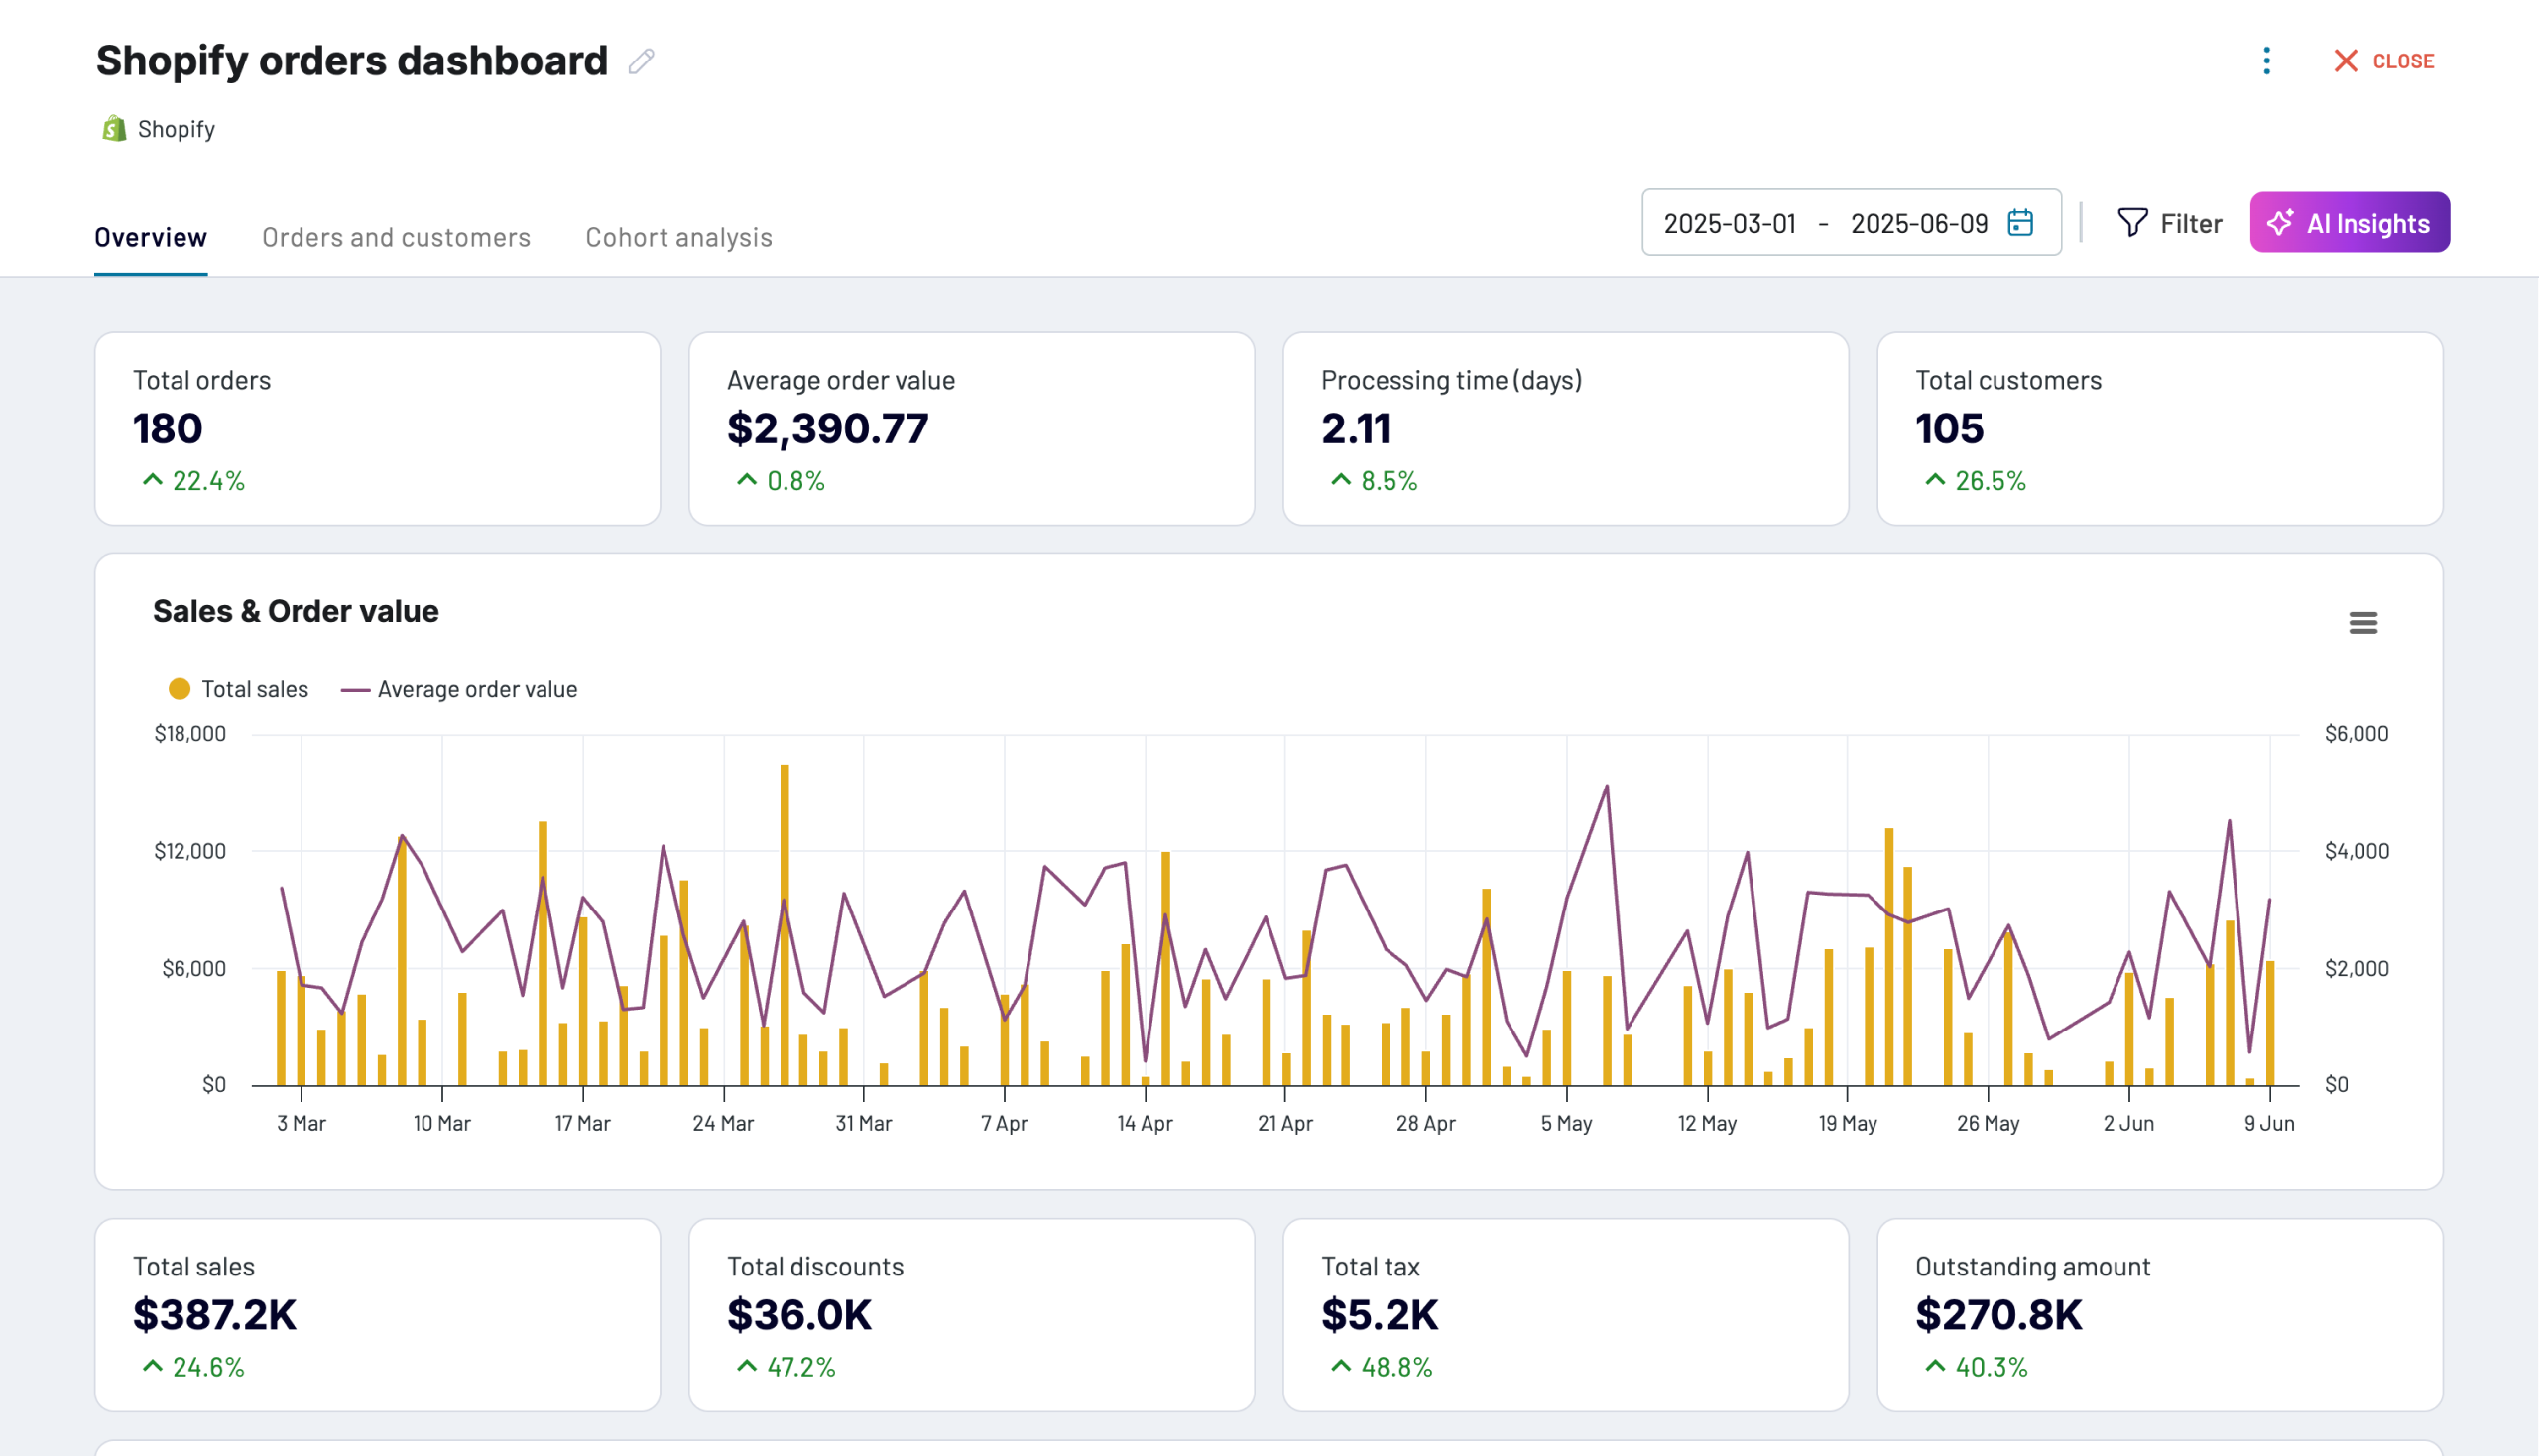
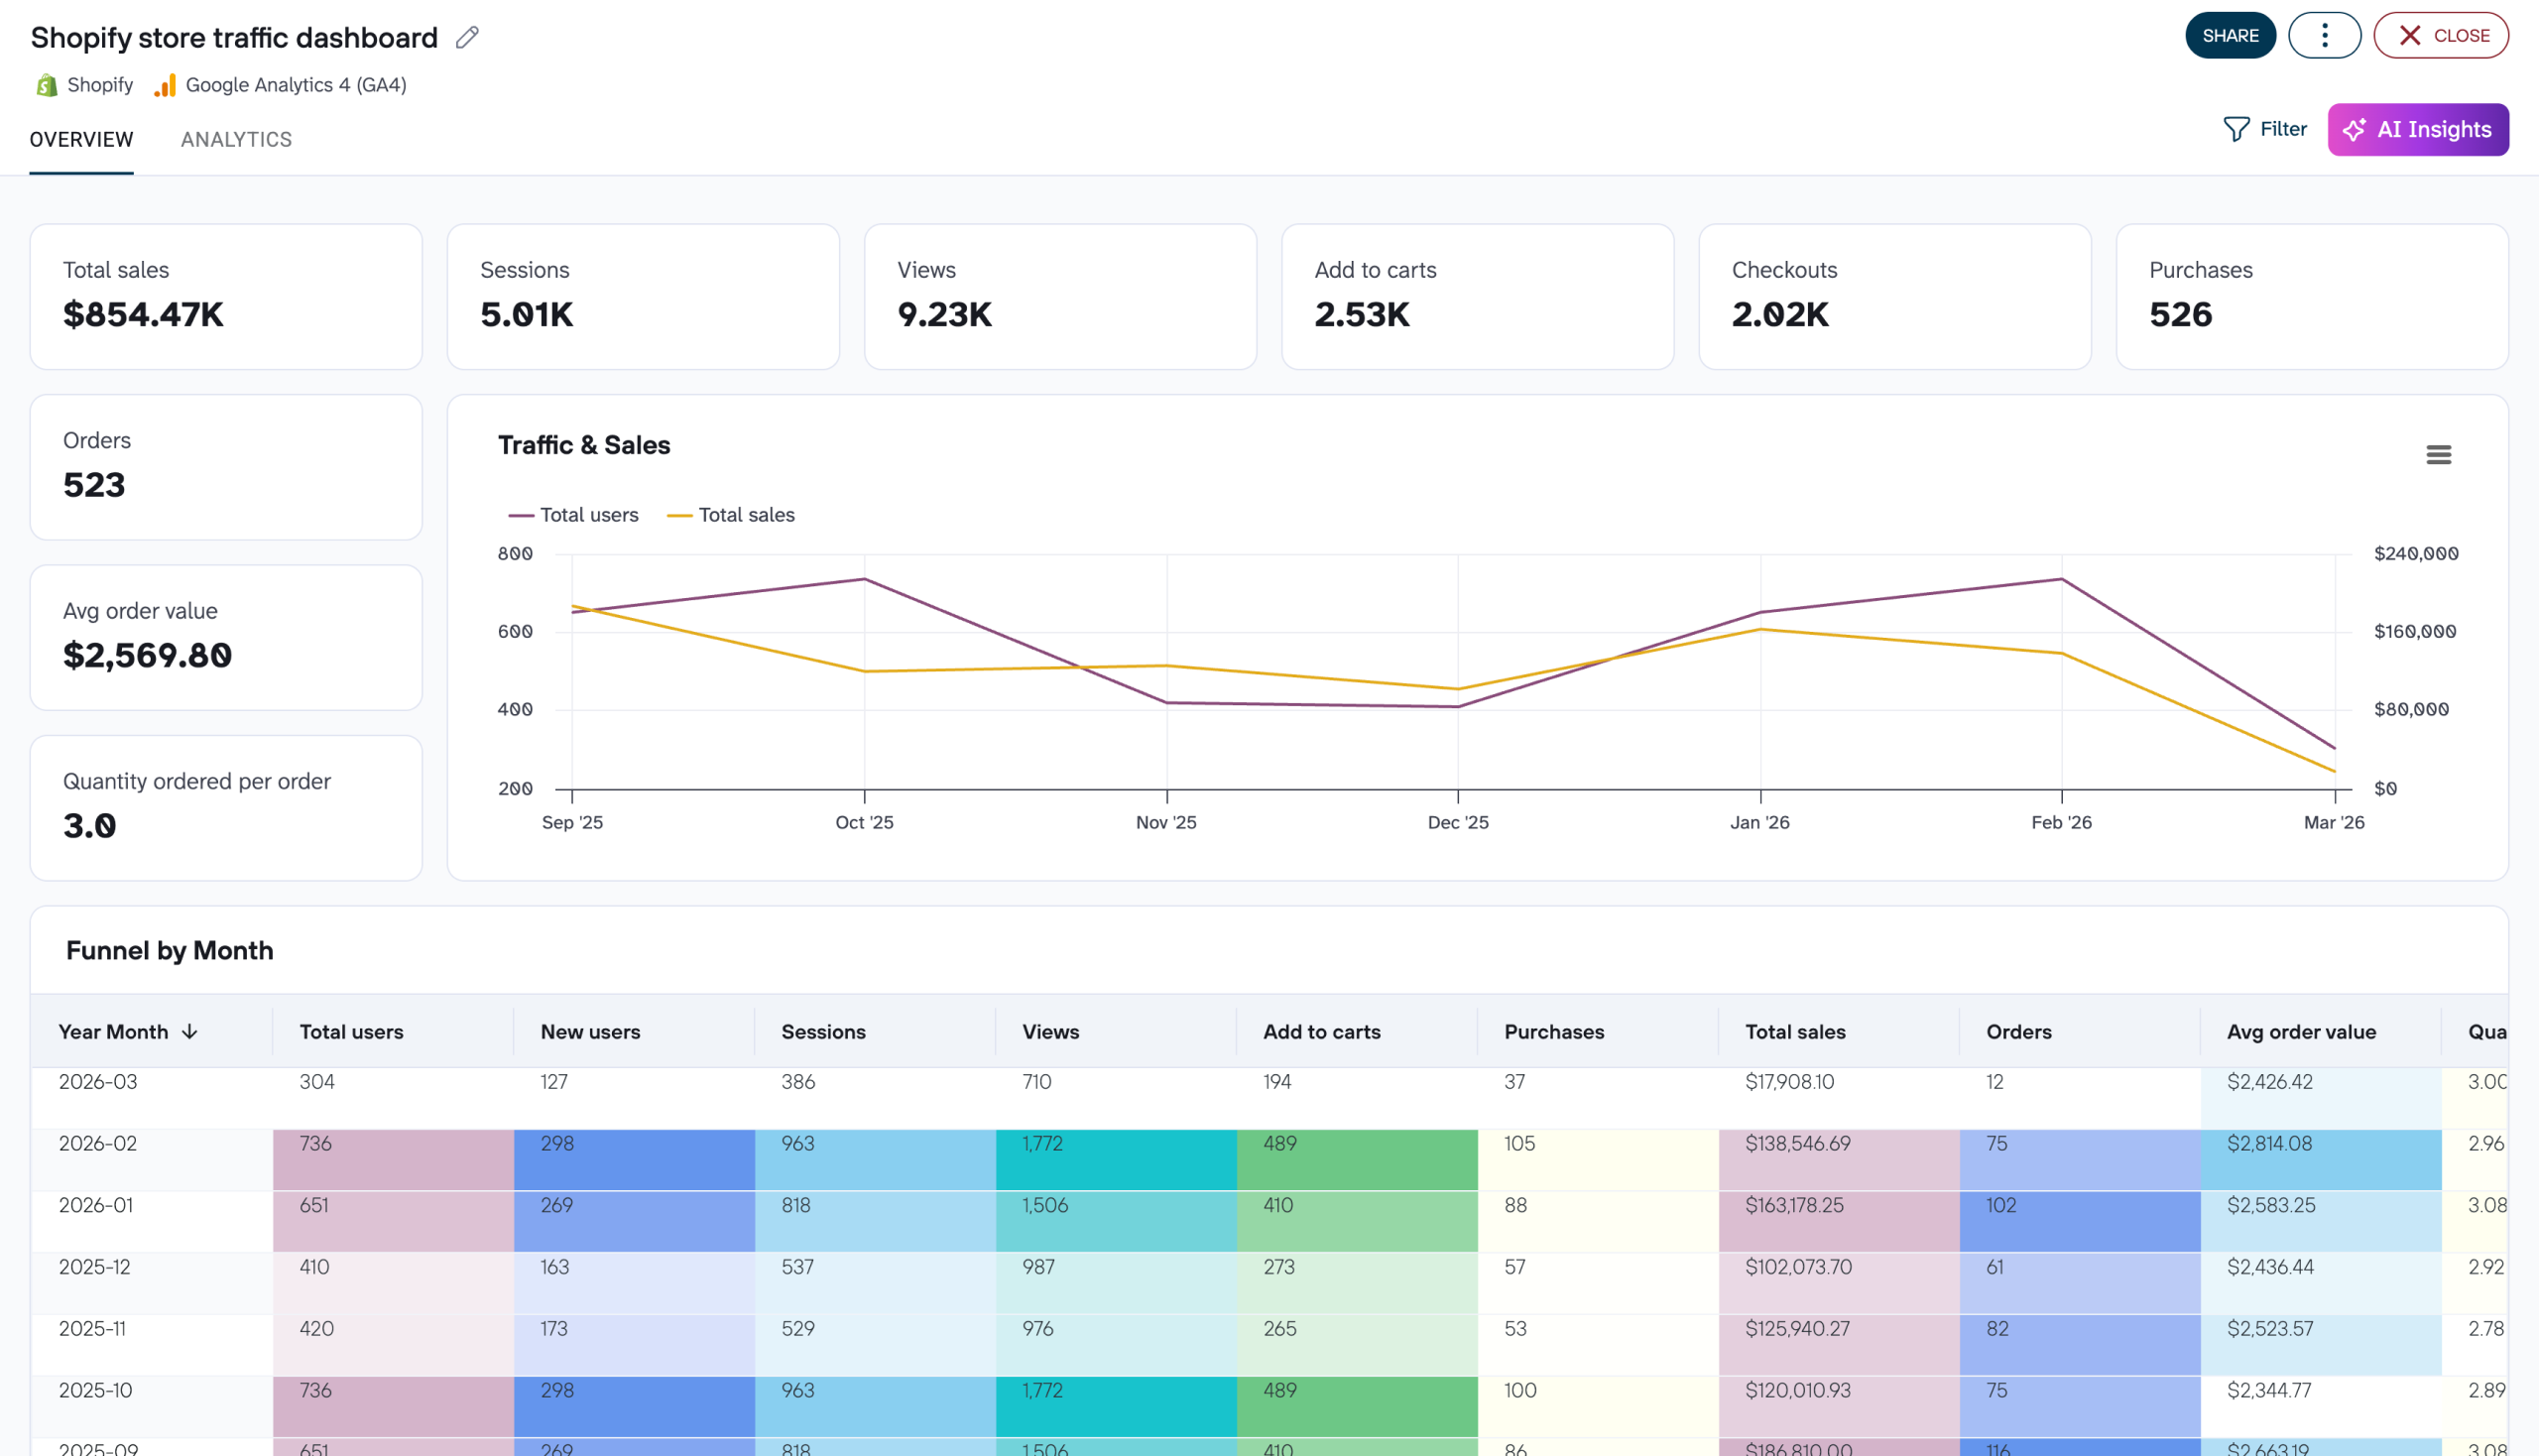
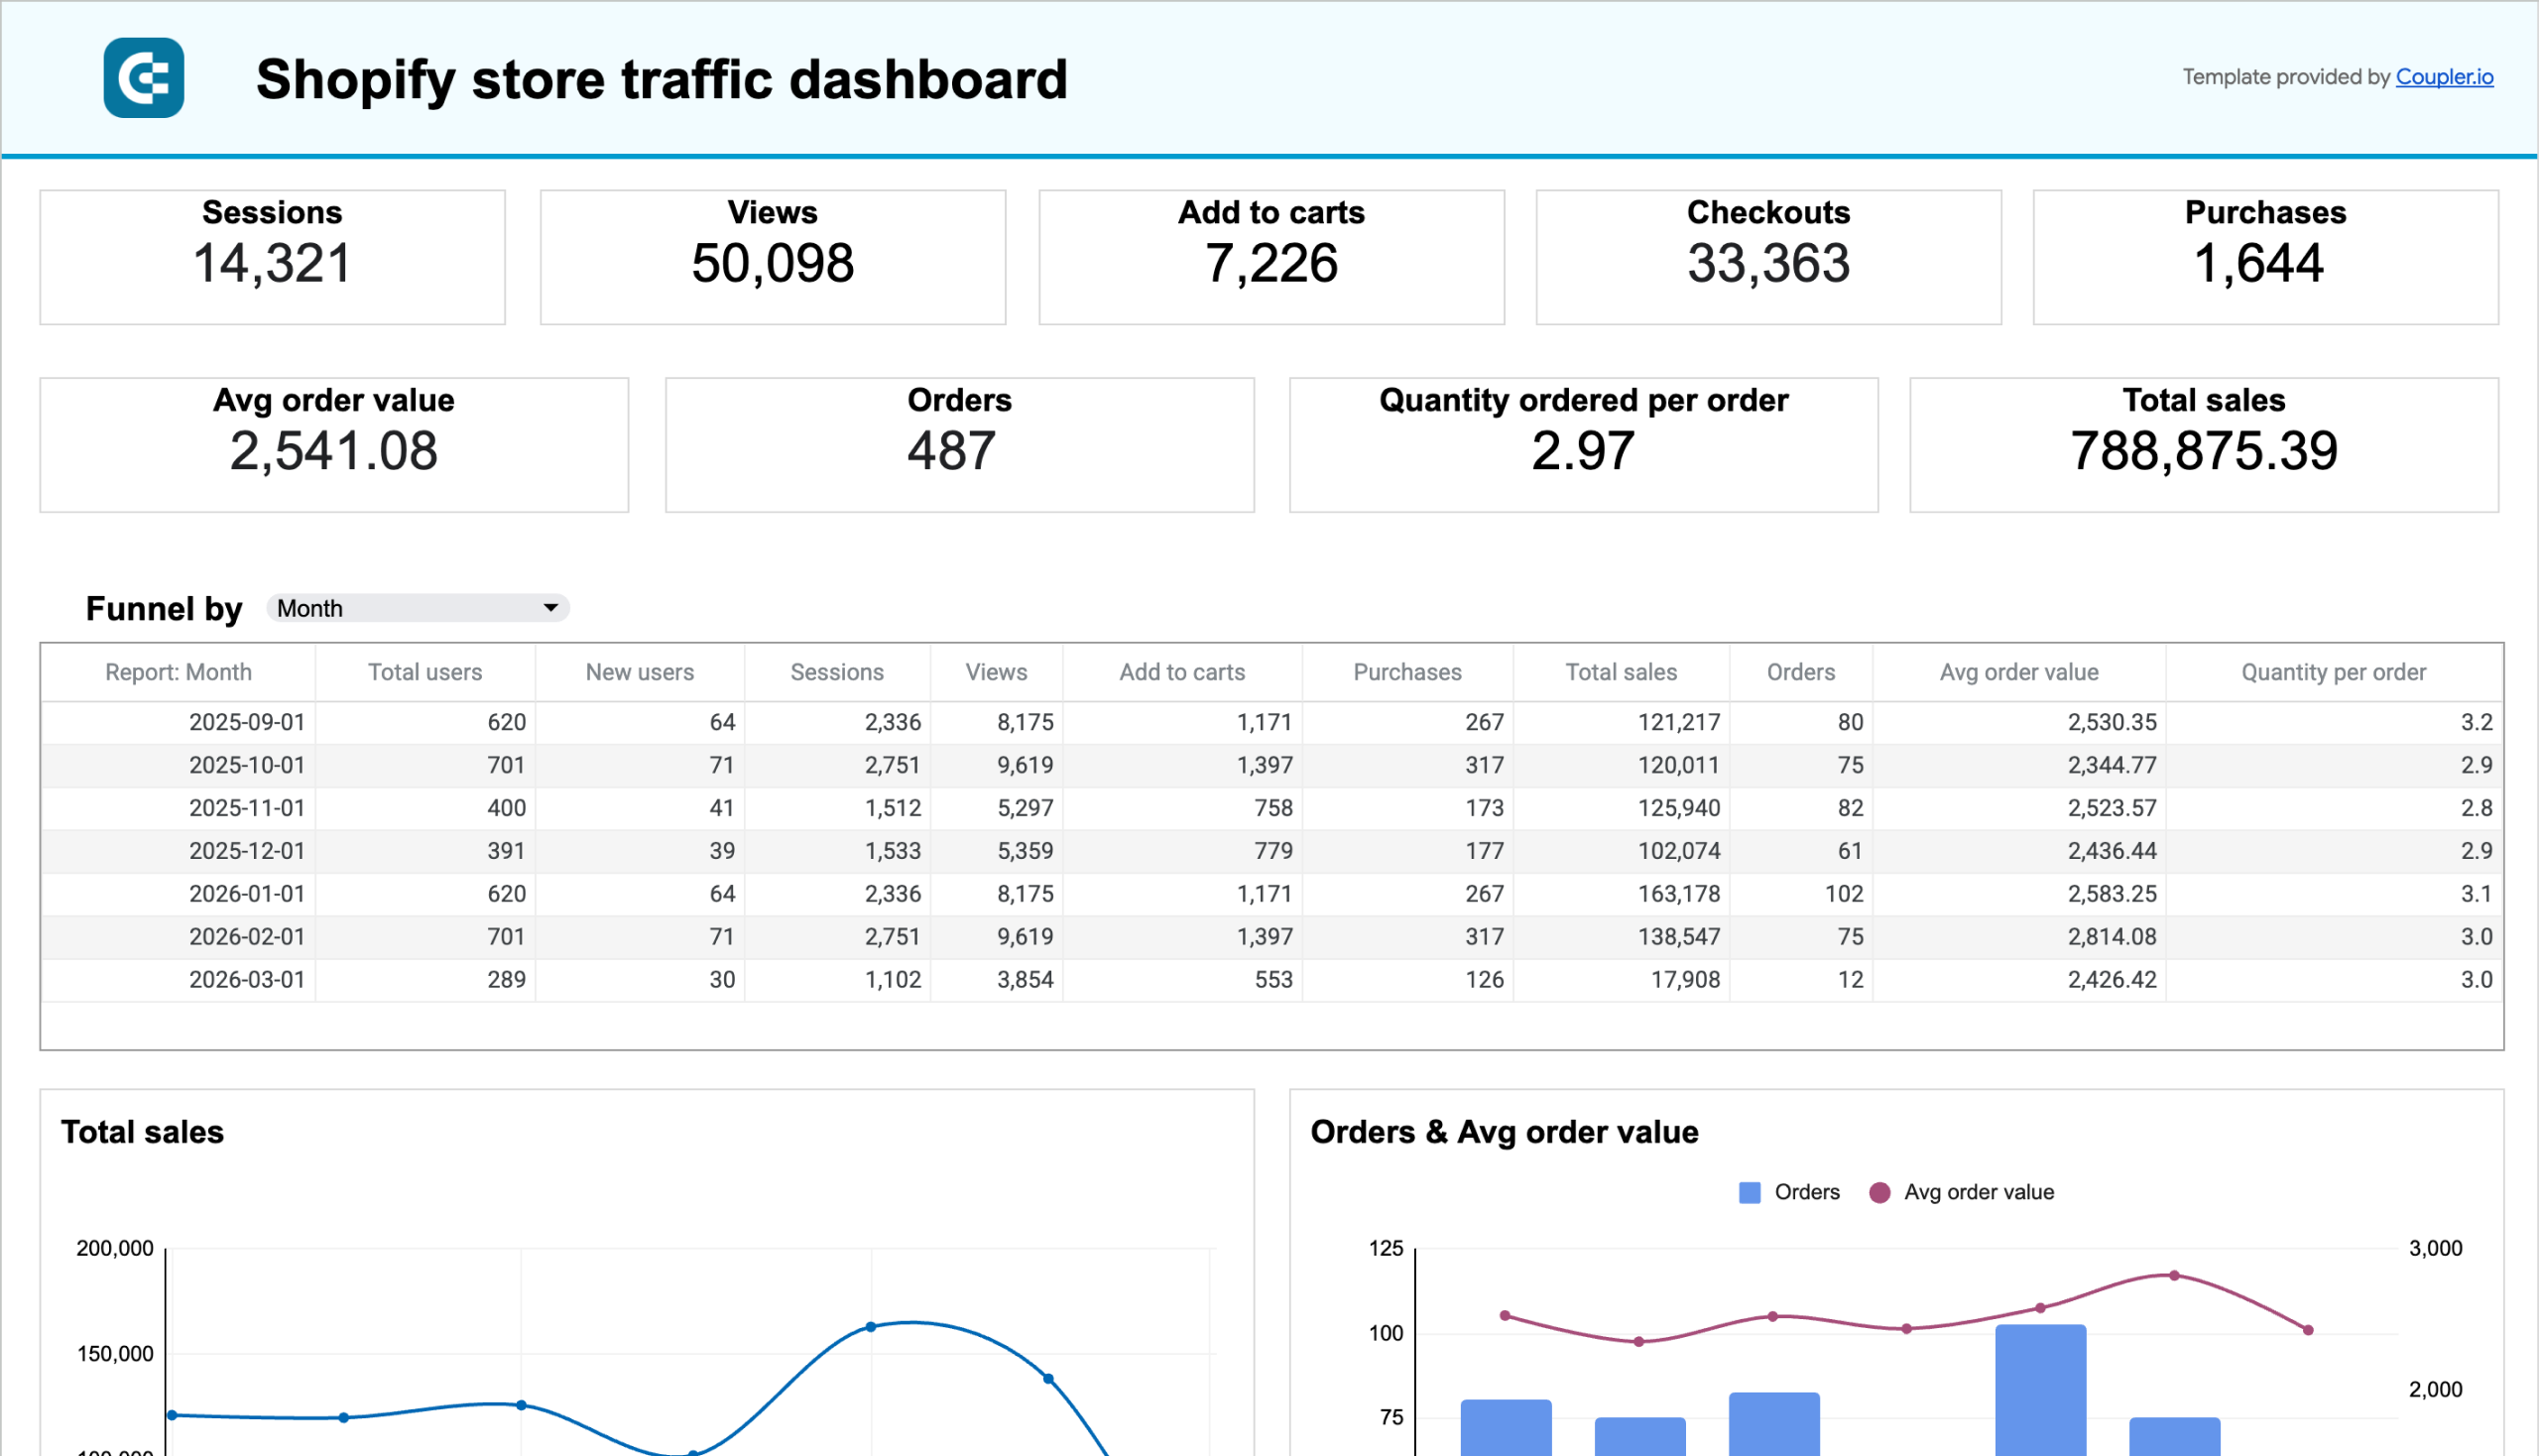
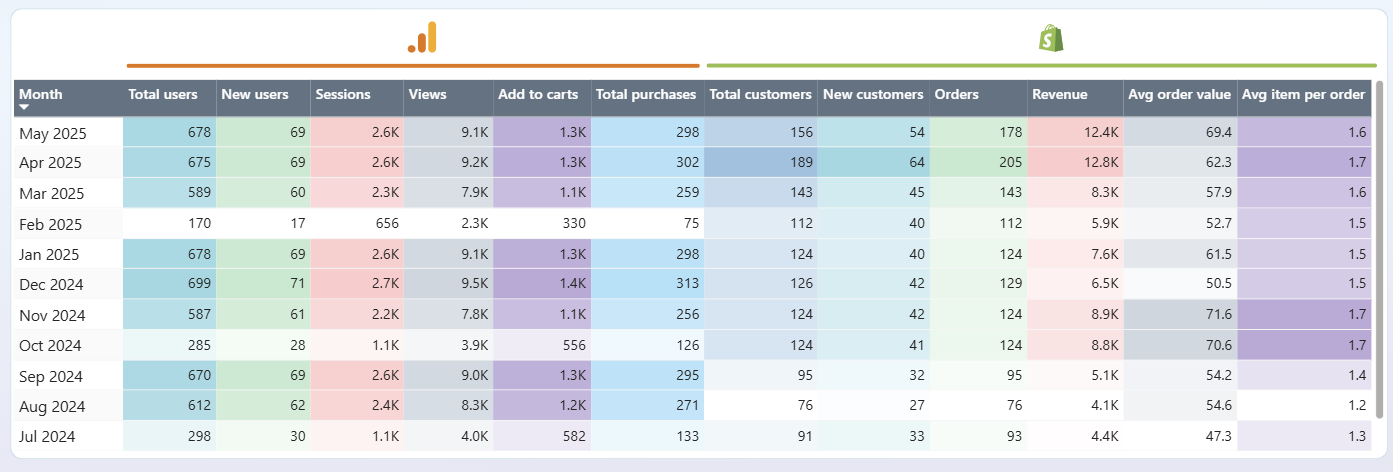
The sales performance report monitors monthly trends in user behavior, tracking the progression from website visits to completed purchases with detailed conversion analysis. It identifies drop-off points in the sales process, compares new versus returning customer behavior, and tracks key metrics like average order value and items per transaction. This report includes product performance rankings, seasonal trend analysis, and revenue attribution to different traffic sources.
What insights you can get with the Shopify reporting dashboard
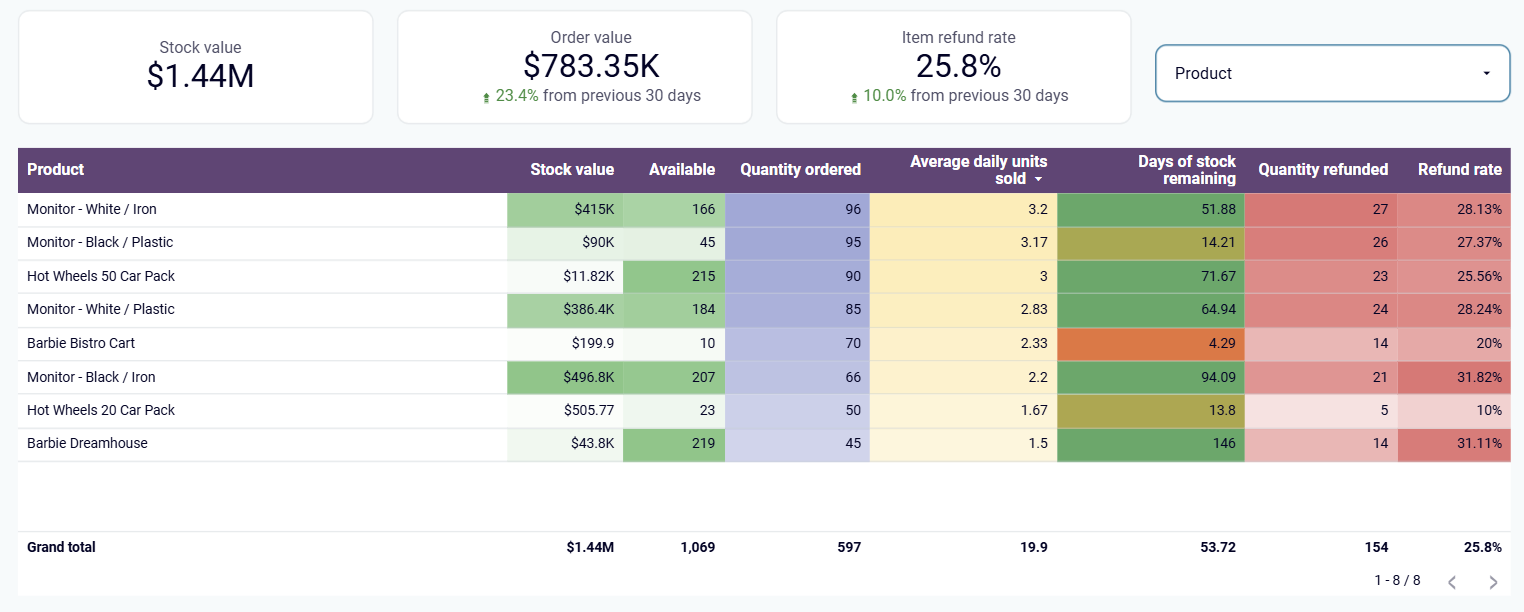
Product-level SKU analysis with automated "Days of stock remaining" calculations enables proactive inventory management and procurement planning. This insight prevents costly stockouts by predicting when products will run out based on current sales velocity, helping maintain optimal inventory levels while avoiding overstock situations that tie up working capital.
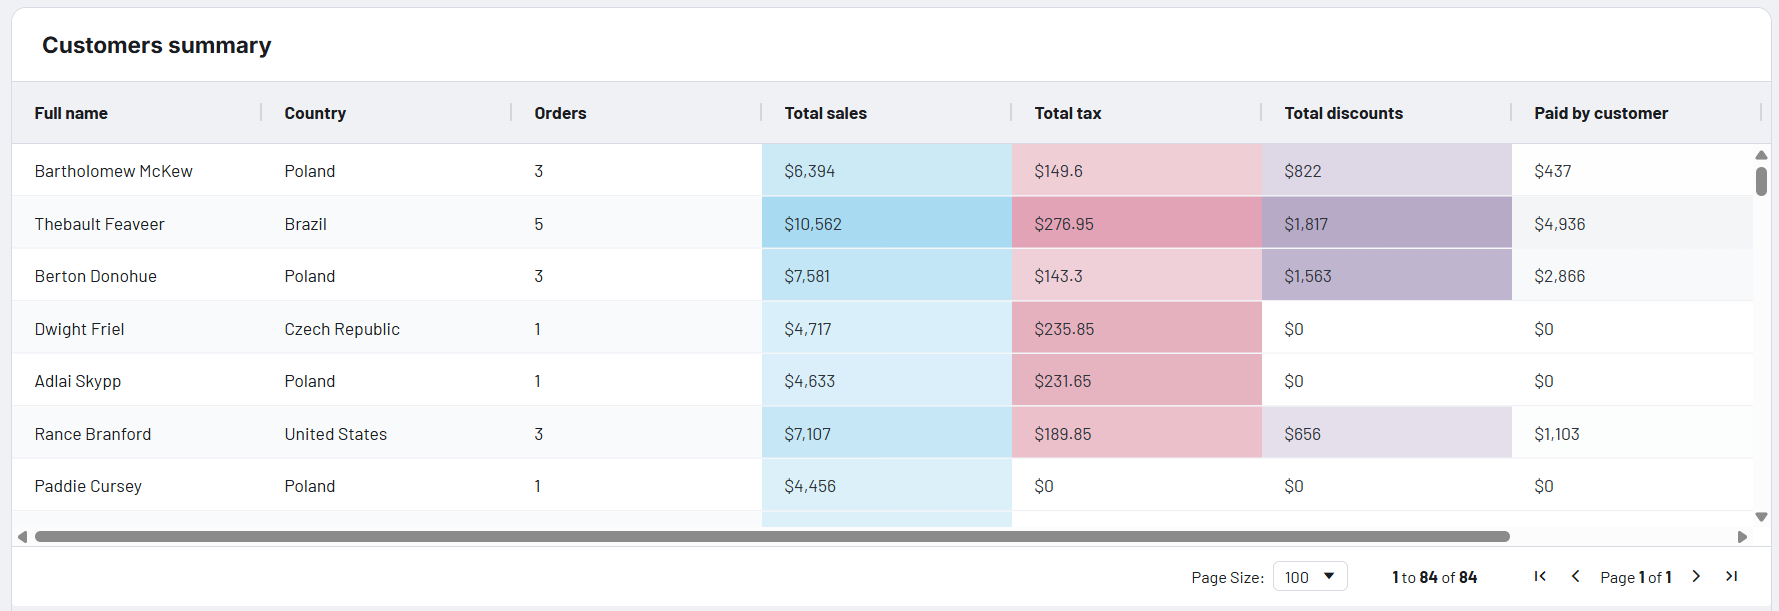
Detailed customer summaries showing order history, total sales, tax contributions, and payment patterns across different countries reveal your most valuable customer segments. This analysis helps optimize pricing strategies, identify high-value markets, and make informed decisions about shipping policies and regional expansion opportunities based on actual customer behavior data.
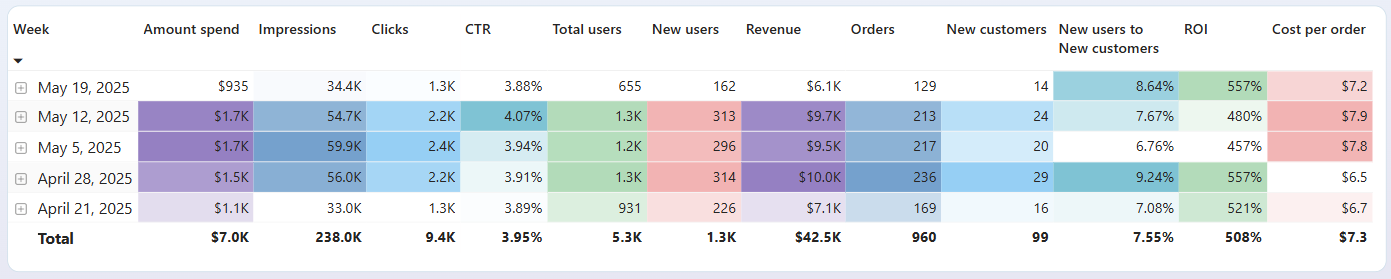
Weekly funnel performance monitoring connects advertising impressions and clicks across multiple platforms with actual website users and conversions. This insight enables data-driven marketing decisions by showing which channels drive the highest-quality traffic and revealing optimization opportunities at each stage of the customer acquisition process.
Month-by-month tracking of user behavior from initial visits through completed purchases identifies seasonal patterns and conversion bottlenecks. This insight reveals drop-off points in the sales process, compares performance across different time periods, and helps optimize the customer journey to improve overall conversion rates and revenue growth.
How to create a Shopify dashboard?

Metrics you can track with the Shopify dashboard template
Track the percentage of products returned by customers across different regions and product categories to identify quality issues or shipping problems. This metric helps optimize product offerings, improve customer satisfaction, and reduce costs associated with processing returns and exchanges.
Monitor daily sales velocity for each product to understand demand patterns and seasonal fluctuations. This metric enables accurate inventory planning, identifies trending products, and helps optimize marketing campaigns by focusing on items with consistent or growing sales momentum.
Calculate how long current inventory will last based on sales velocity, enabling proactive procurement decisions. This metric prevents stockouts by predicting when products will run out, helping maintain optimal inventory levels while avoiding excess stock that ties up working capital.
Analyze comprehensive customer profiles including order frequency, revenue contribution, tax payments, and discount usage patterns. This metric identifies your most valuable customers, helps optimize pricing strategies, and enables targeted retention campaigns based on individual customer behavior and profitability.
Measure the average number of days between order placement and fulfillment to optimize operational efficiency. This metric helps identify bottlenecks in your fulfillment process, improve customer satisfaction through faster delivery, and benchmark performance against industry standards.
Calculate the total operational expenses associated with processing and fulfilling each order, including marketing, shipping, and handling costs. This metric reveals true order profitability, helps optimize pricing strategies, and identifies opportunities to reduce operational expenses while maintaining service quality.
Track total advertising expenditure across all marketing platforms and campaigns to monitor budget utilization and spending patterns. This metric ensures marketing investments stay within allocated budgets, identifies high-spending periods, and enables better financial planning for advertising activities.
Measure the revenue generated relative to marketing spend to evaluate campaign effectiveness and profitability. This metric identifies which marketing channels and campaigns deliver the highest returns, enabling data-driven budget allocation decisions and optimization of advertising strategies for maximum business growth.