Win loss analysis dashboard examples and reporting templates
A comprehensive win loss analysis dashboard template that connects directly to your Salesforce CRM to automatically track deal outcomes, identify performance patterns, and optimize sales strategies. Simply connect your Salesforce account through Coupler.io to start analyzing your sales wins and losses across multiple dimensions.
Specifically visualized for

Looker Studio
Sources used
-
 Salesforce
Key metrics:
- Won deals revenue
- Lost deals count
- Win rate percentage
- Deal closure time
- Revenue by opportunity type
- Performance by sales owner
- Lead source effectiveness
- Industry segment conversion rates
- Geographic performance metrics
- Deal stage progression rates
Three challenges this win loss analysis dashboard template helps resolve
- Unclear deal failure patterns: Identify specific reasons and segments where deals consistently fail, enabling targeted improvements to sales processes and strategies.
- Inefficient resource allocation: Pinpoint which opportunity types, industries, and lead sources generate the best results to optimize sales team focus and marketing investments.
- Limited sales performance visibility: Transform scattered Salesforce data into clear win/loss insights that reveal performance trends across teams, regions, and deal categories.
What you will learn from the win loss analysis dashboard
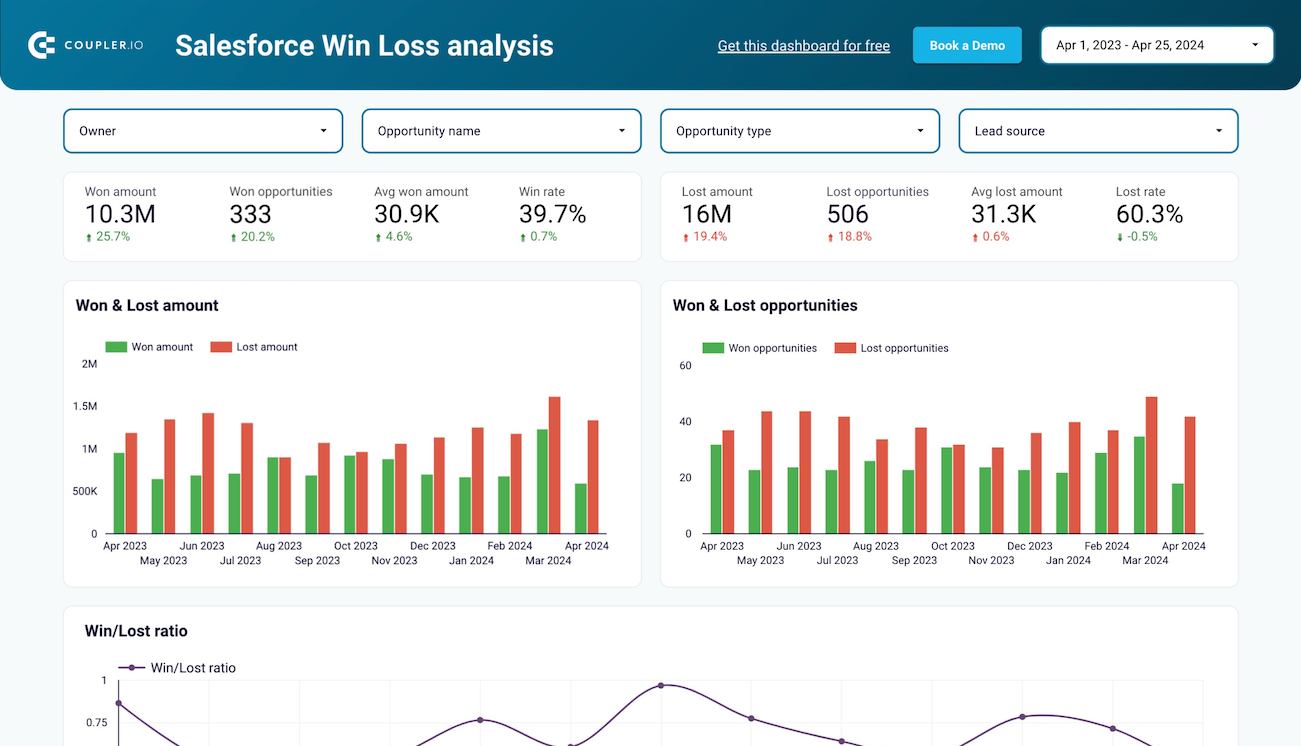
This Salesforce win loss analysis dashboard transforms your raw CRM data into actionable insights that drive sales performance improvements. By connecting your Salesforce account, you'll discover critical patterns in your sales process and identify opportunities to increase win rates.
- Which opportunity types generate the highest revenue? Analyze different deal categories like Upsell, New Business, or Renewal opportunities to understand which types consistently deliver results. This insight helps sales teams prioritize their efforts on the most profitable opportunity types and adjust strategies for underperforming categories.
- What factors contribute to lost deals in your pipeline? Examine lost opportunities segmented by industry, sales owner, lead source, and geographic region to identify common failure patterns. Understanding why deals fail allows sales managers to implement targeted coaching, refine qualification processes, and address systemic issues that impact conversion rates.
- Which sales segments deserve increased investment? Compare performance across different categories to identify your highest-converting industries, most effective lead sources, and top-performing sales territories. This analysis enables data-driven resource allocation, helping you concentrate efforts on segments that generate the best returns while reducing focus on consistently underperforming areas.
- How do different lead sources impact deal outcomes? Track conversion rates and revenue generation across various lead acquisition channels to optimize your marketing spend and lead generation strategies for maximum sales impact.
What reports you get with our win loss analysis dashboards
A meaningful win loss analysis dashboard should provide both high-level performance metrics and granular insights that drive sales improvements. The key is combining outcome data with contextual factors that influence deal success.
Opportunity type performance analysis
The Salesforce Win & Loss Analysis Dashboard includes detailed breakdowns of deal performance by opportunity type, allowing sales teams to evaluate the effectiveness of different sales strategies. For example, filtering by Upsell deals reveals their revenue generation compared to other opportunity categories, helping teams understand which approaches consistently deliver results and deserve increased focus.
Segmented deal outcome analysis
This dashboard provides comprehensive segmentation of won and lost deals across multiple categories, including industry, sales owner, lead source, and geographic regions. This multi-dimensional view helps identify patterns in deal success and failure, enabling sales managers to understand which market segments, team members, and acquisition channels drive the best conversion rates.
Performance comparison and optimization insights
The dashboard highlights both best-performing and underperforming segments, providing clear guidance on where to concentrate sales efforts and where to reduce focus. By comparing win rates across different categories, sales teams can make data-driven decisions about resource allocation, territory assignments, and strategic priorities to maximize overall sales effectiveness.
How to create a win loss analysis dashboard?
Step 1
1
Go to the Readme tab where you can see instructions on how to set up the win loss analysis dashboard template.
Step 2
2
Click the button to set up the Coupler.io connector for your Salesforce account.
Step 3
3
Follow the instructions to prepare and load data to the dashboard.
Step 4
4
Go back to Coupler.io to configure the schedule for the data refresh of your win loss analysis reporting dashboard.
