GoHighLevel dashboard examples and reporting templates
Turn your GoHighLevel CRM data into actionable insights without manual exports or spreadsheet work. These dashboard templates automatically pull data from your GoHighLevel account alongside advertising platforms and Google Analytics 4 to reveal how your sales pipeline performs and which marketing channels deliver actual opportunities. Instead of switching between multiple tools to understand deal progression or campaign effectiveness, you get unified visibility into sales metrics and acquisition costs that directly impact revenue.
GoHighLevel dashboard examples for every need


 +2
+2


 +3
+3
about your case. It doesn't cost you a penny 😉
Choose your white label GoHighLevel dashboard template to kick off
What is a GoHighLevel dashboard?
Marketing teams measure cost per opportunity across channels and optimize budget allocation based on actual CRM conversions rather than platform-reported metrics alone. With automated data refreshing through Coupler.io, our GoHighLevel reporting dashboard solutions ensure you're always working with current information without manual exports or data consolidation. This creates a single source of truth for sales and marketing performance.

What reports should be included in GoHighLevel dashboards?
Effective GoHighLevel reporting dashboard solutions provide specific views into different aspects of your sales and marketing performance. Rather than generic overviews, these reports connect directly to business decisions about resource allocation, process optimization, and revenue forecasting. Each report serves a distinct purpose in understanding how prospects move through your funnel and what drives successful outcomes.
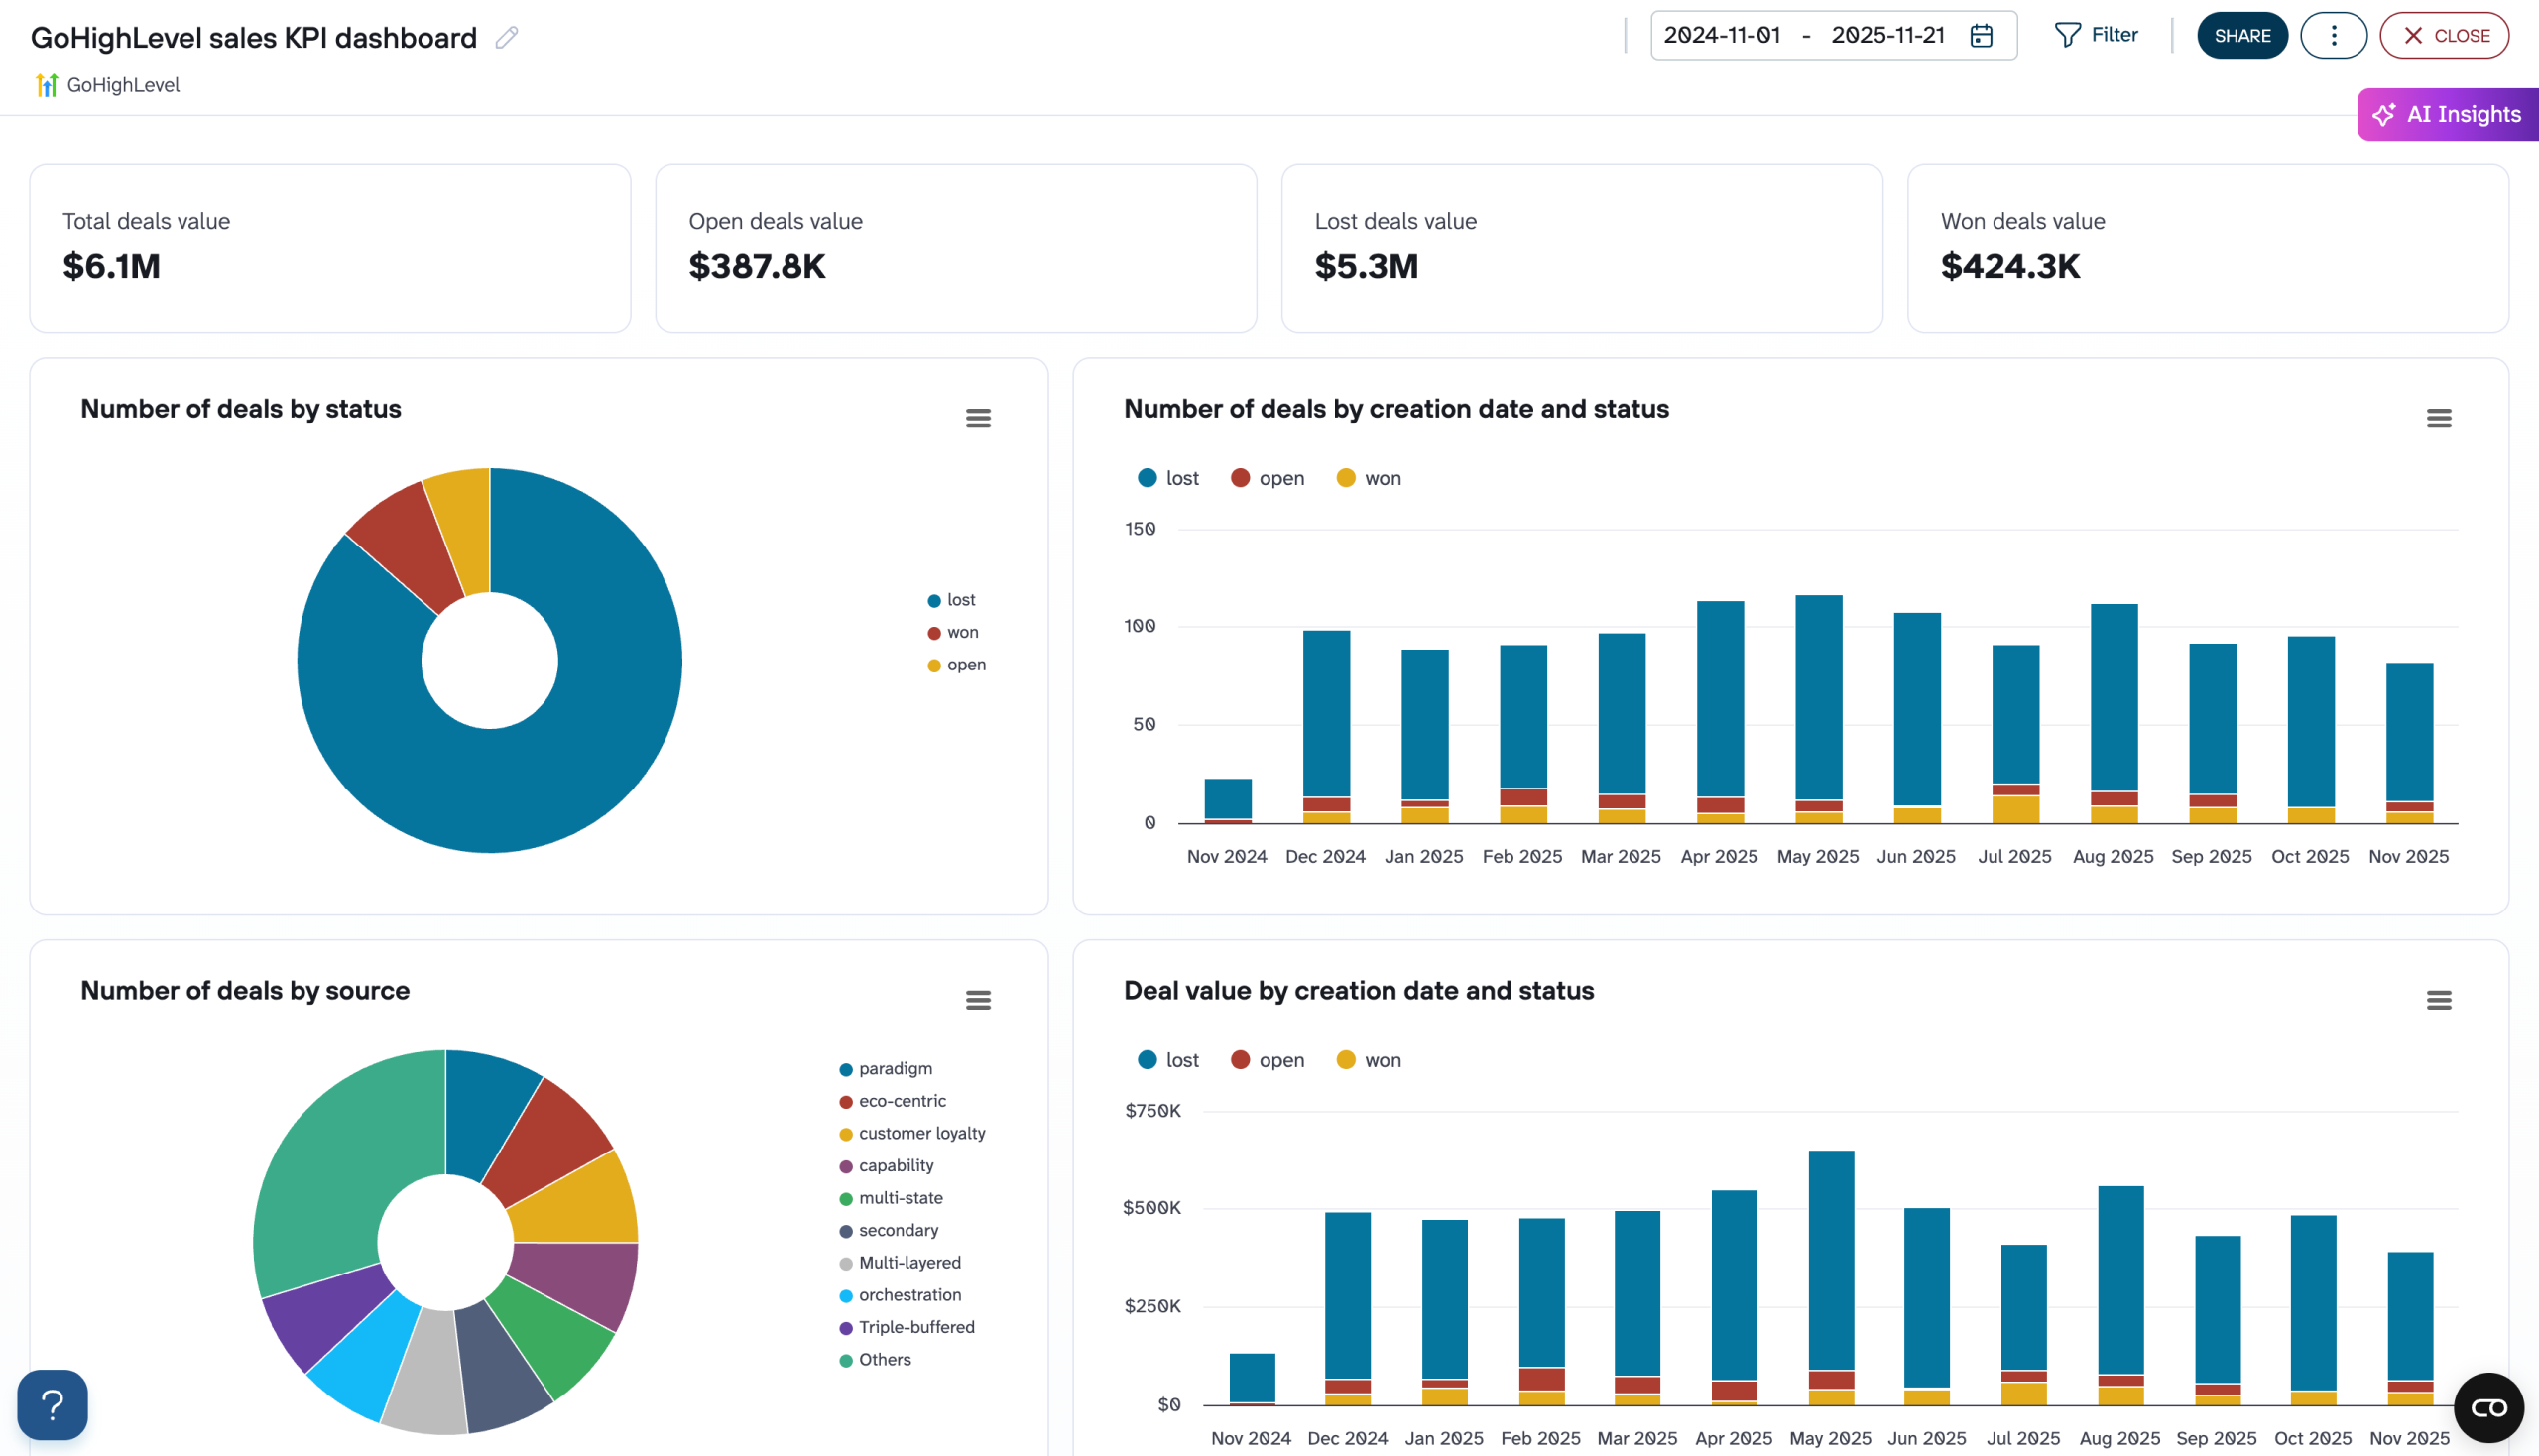
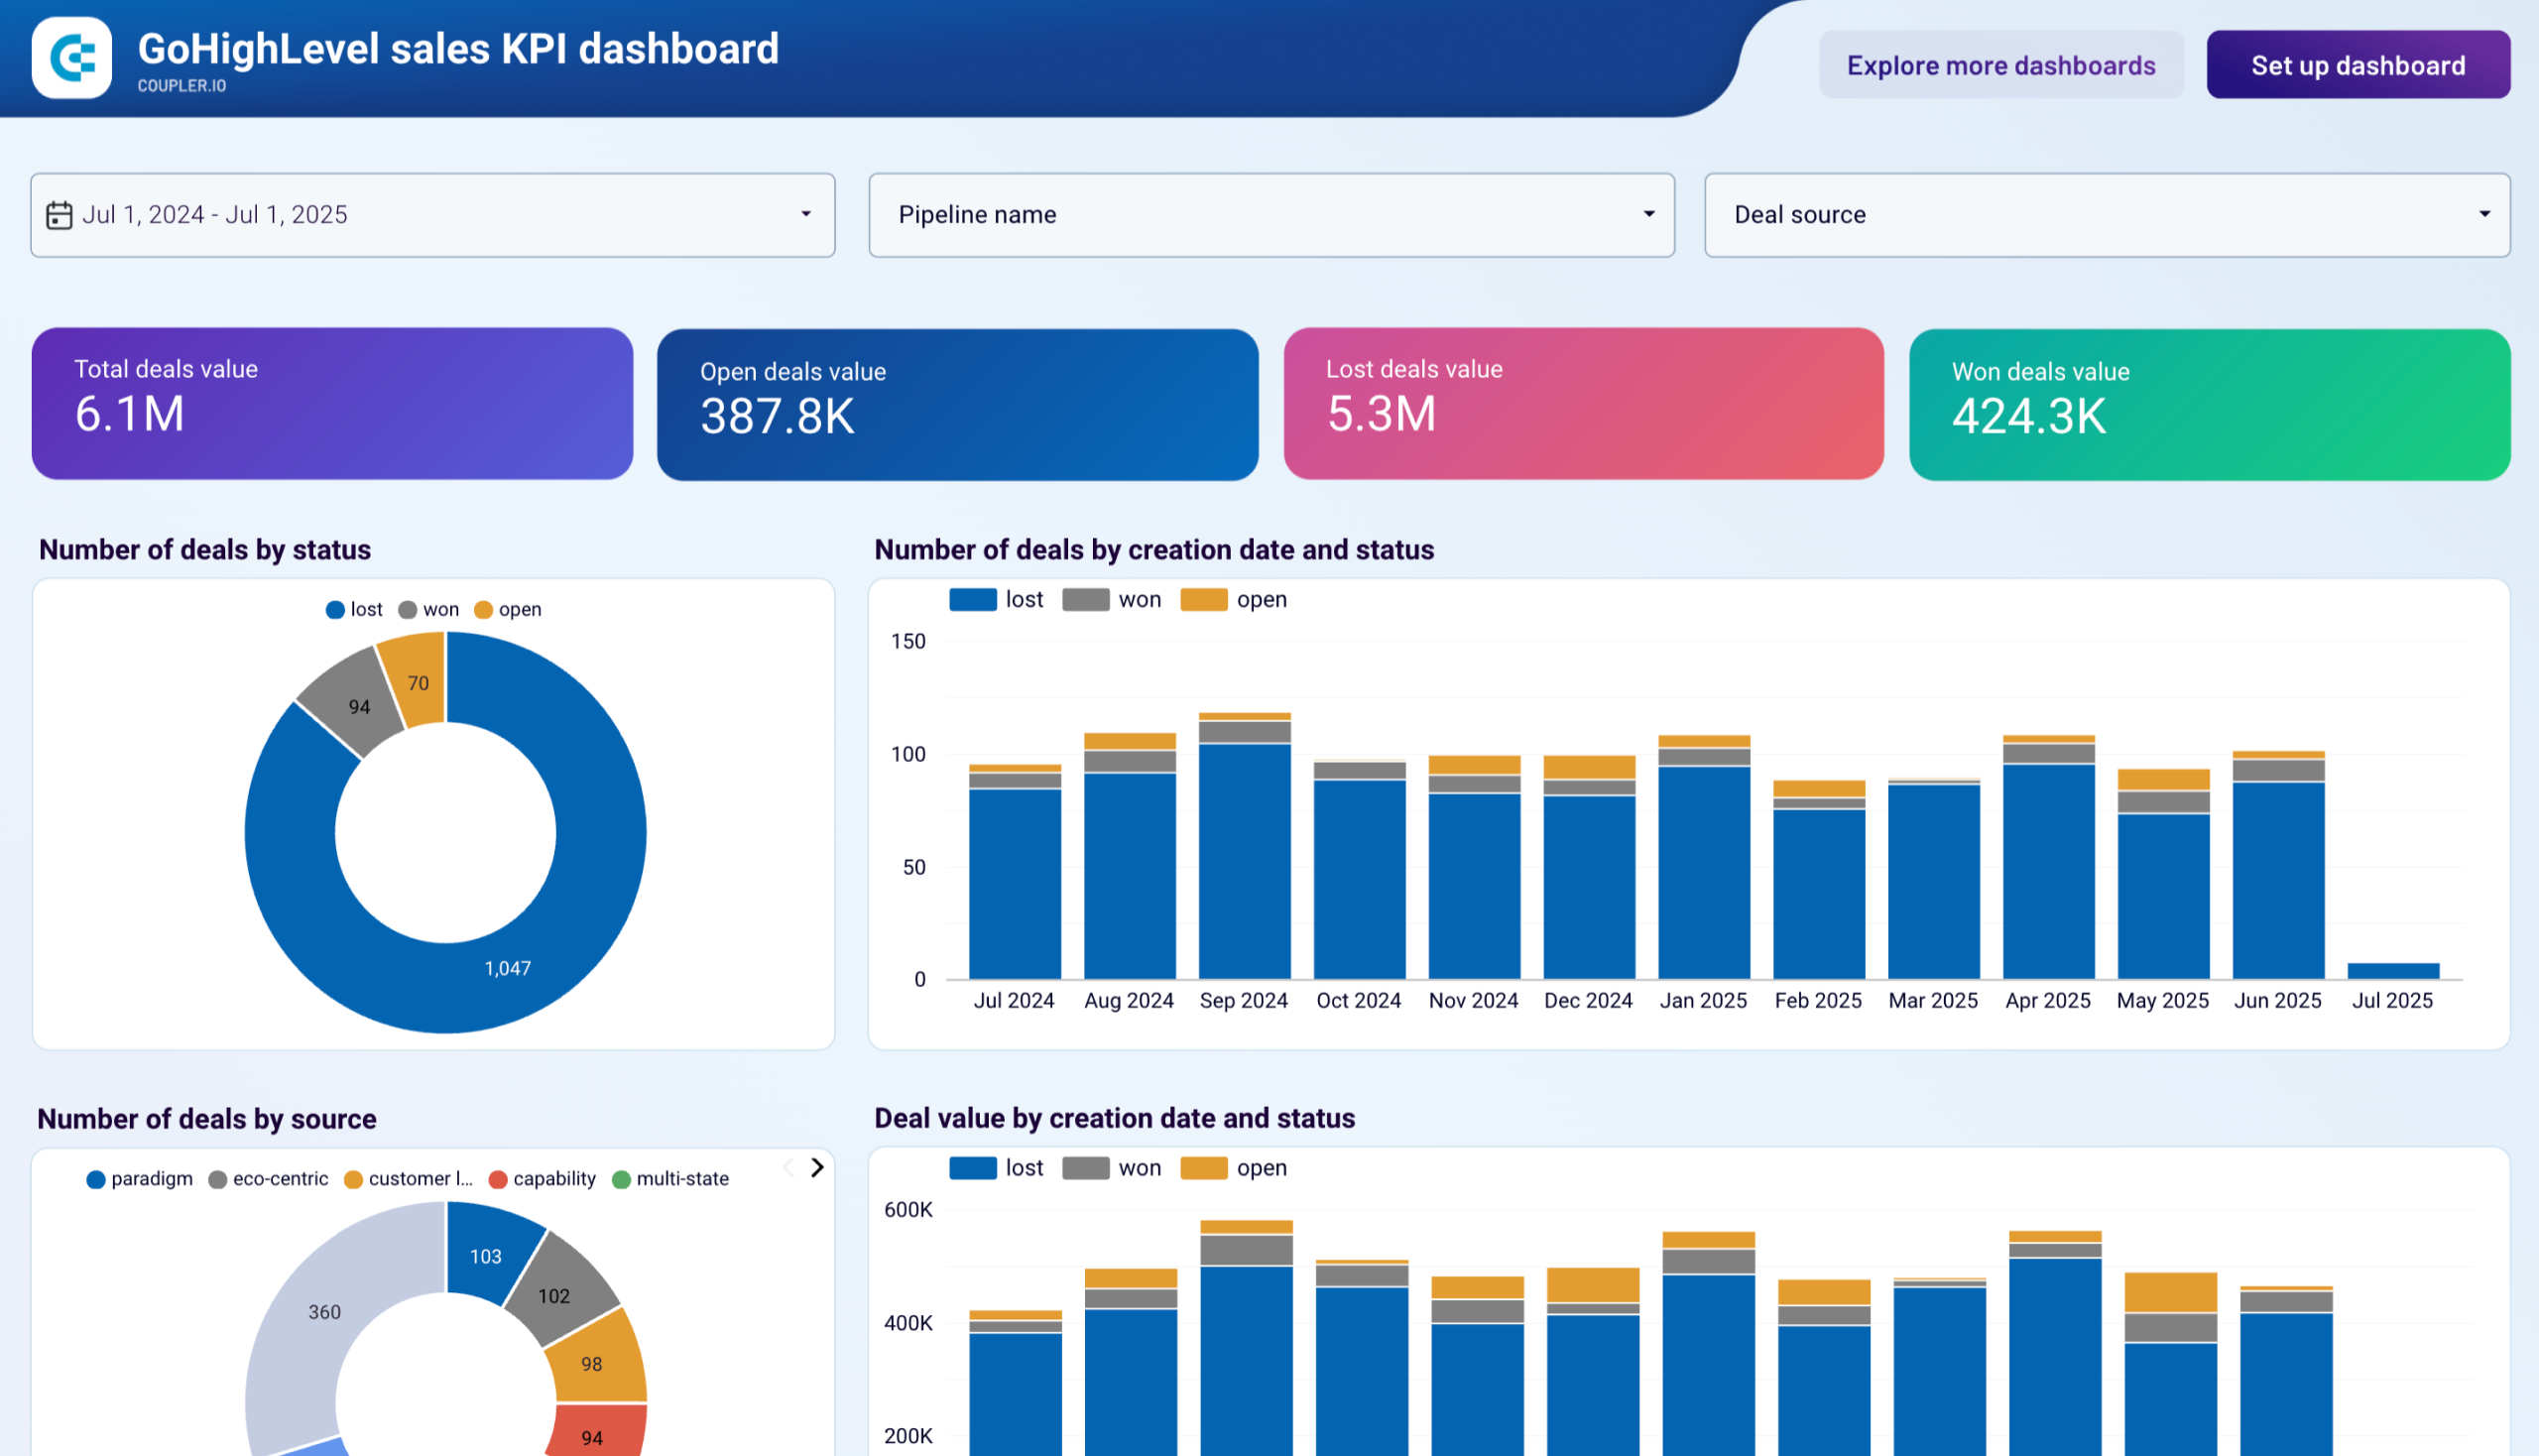
Understanding how deals distribute across won, lost, and open statuses reveals immediate pipeline health. This GoHighLevel dashboard shows the proportion of deals in each category through visual breakdowns that highlight imbalances before they impact revenue targets. When lost deals grow disproportionately large compared to wins, teams can investigate common failure reasons and implement process improvements or training programs.
Tracking which sources generate valuable deals determines where marketing budgets should flow. A GoHighLevel CRM dashboard breaks down deal creation and values by source, revealing which channels consistently deliver high-quality opportunities versus those producing leads that rarely convert. This attribution extends beyond initial contact to show how different sources perform throughout the entire sales cycle.
The customer acquisition funnel report displays the entire journey from ad impressions through website visits to CRM opportunities and won deals. Our GoHighLevel custom dashboard combines data from multiple advertising platforms with Google Analytics 4 and GoHighLevel CRM to calculate true conversion rates at each stage. Unlike platform-native reporting that stops at clicks or form submissions, this view connects advertising spend directly to business outcomes.
Budget allocation across advertising platforms requires visibility into how investments distribute over time and which channels receive the most resources during different periods. The spend analysis report uses stacked charts to show monthly investment distribution across platforms like Facebook Ads, LinkedIn Ads, Bing Ads, Pinterest Ads, and Twitter Ads. This temporal view in our GoHighLevel dashboard templates reveals budget shifts that correlate with performance changes. It’s helpful to understand whether increased investment in specific channels drove better results or if efficiency declined despite higher spending.
What insights you can get with the GoHighLevel reporting dashboards
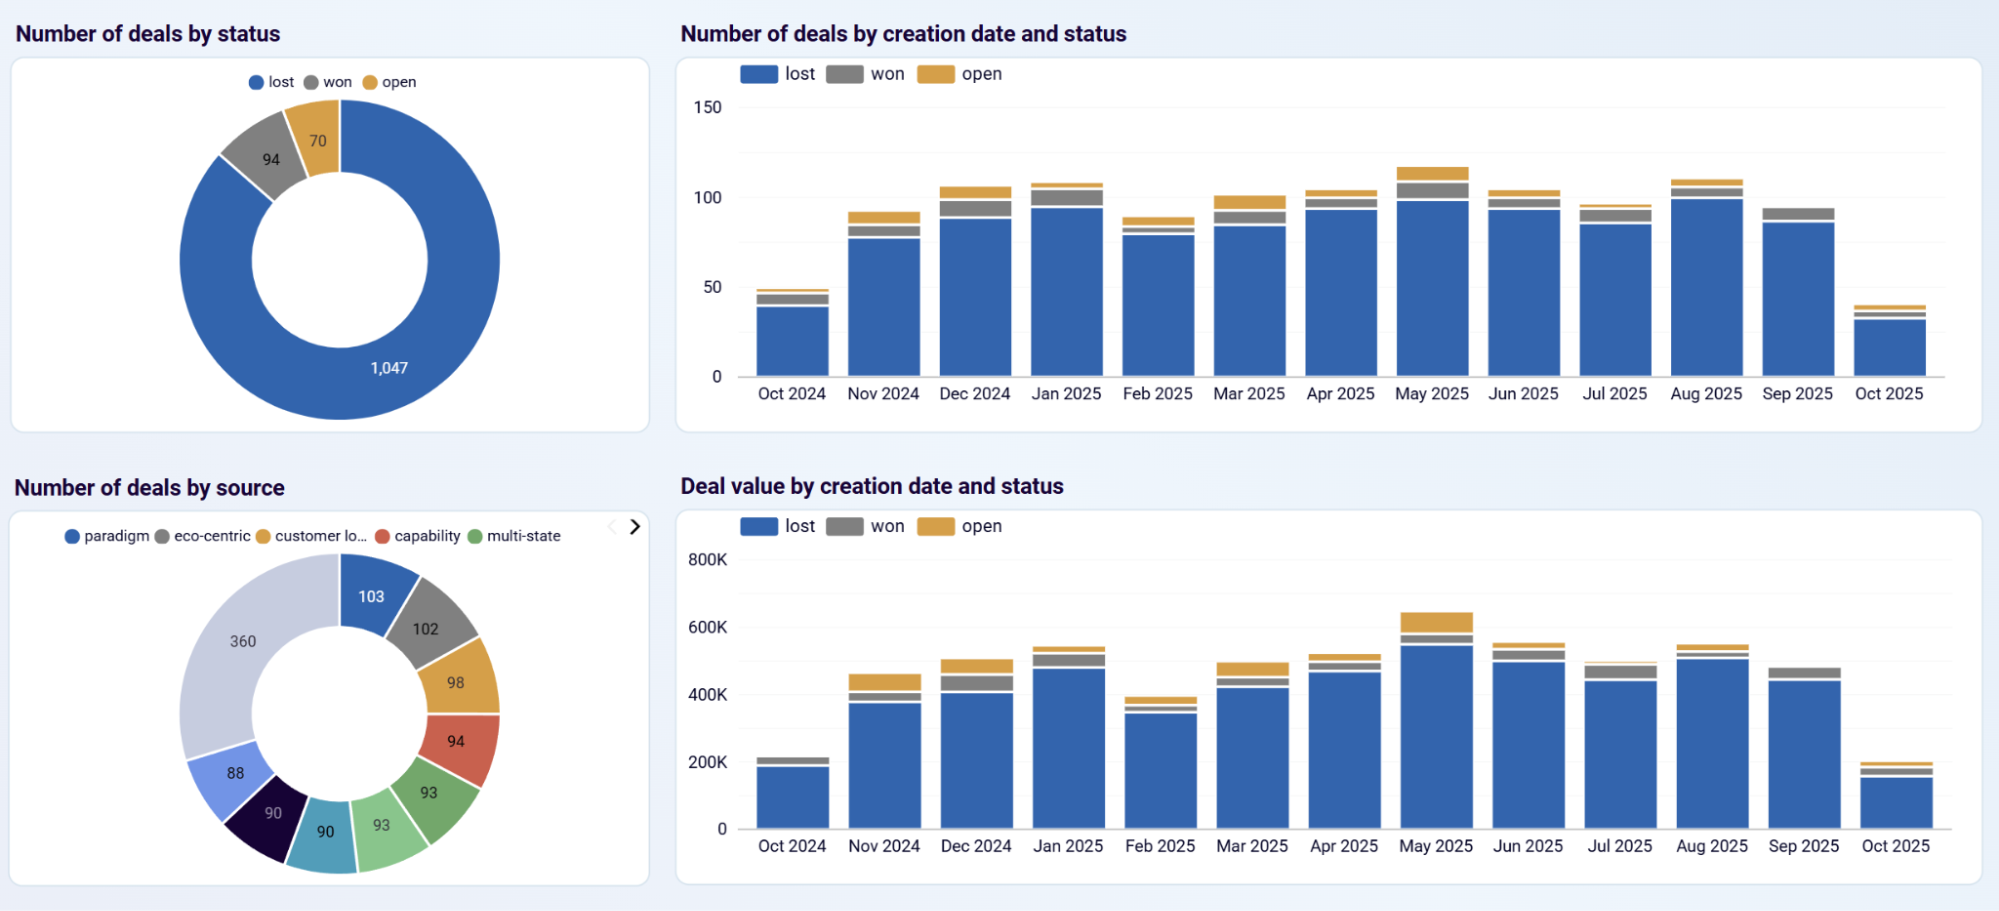
Deal distribution across won, lost, and open statuses appears through visualizations that make pipeline imbalances immediately visible. This view helps identify whether too many deals move to lost status compared to wins, suggesting potential issues with qualification criteria, sales processes, or competitive positioning. Teams can assess if the pipeline contains sufficient open deals to meet revenue targets for upcoming periods.
Deal source analysis breaks down which lead generation channels produce the most valuable opportunities. This breakdown identifies productive sources that deserve increased marketing investment versus underperforming channels that may need optimization or elimination. Sales and marketing teams use this data to align budget allocation with actual results rather than assumptions about channel effectiveness.

The complete customer journey is visualized from initial ad impressions through to won opportunities, displaying conversion rates at each funnel stage. This end-to-end view identifies specific bottlenecks where prospects drop off, whether at the click-through stage, website engagement phase, or CRM opportunity conversion. The monthly funnel overview provides detailed breakdowns of advertising spend, impressions, clicks, CTR, total users, new users, opportunities, and cost per opportunity.
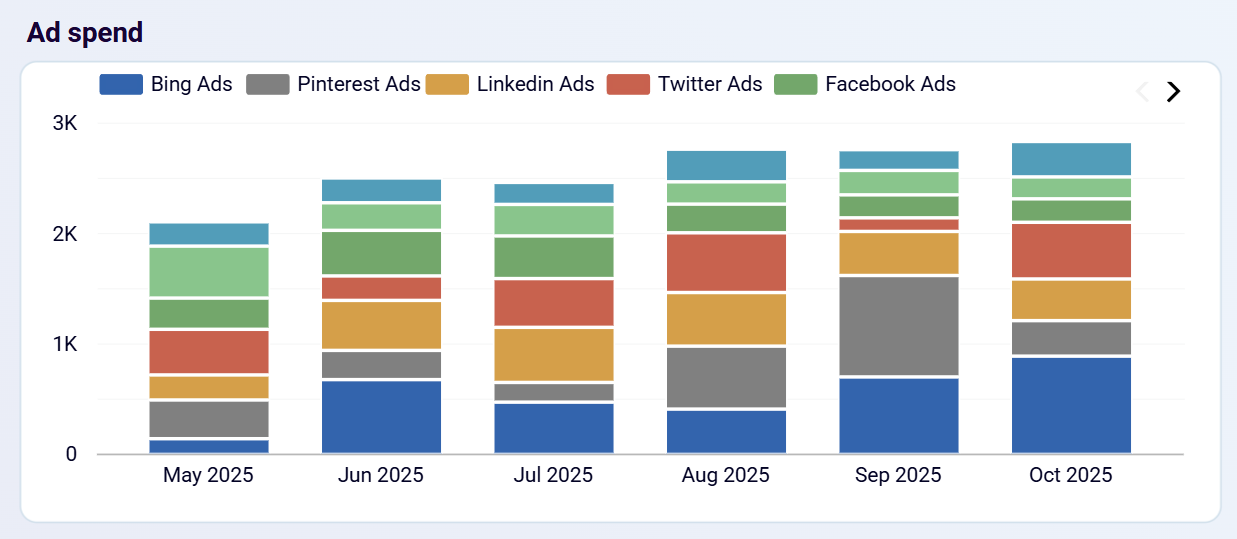
Multi-platform spend analysis shows how advertising budgets distribute across channels like Facebook Ads, LinkedIn Ads, Bing Ads, Pinterest Ads, and Twitter Ads throughout different time periods. The stacked chart visualization reveals which platforms receive the most investment during specific months and how budget allocation shifts in response to performance or strategic priorities. Marketing teams use these patterns to understand whether spending increases on particular platforms correspond with improved opportunity generation.
How to create a GoHighLevel dashboard?

Metrics you can track with a GoHighLevel dashboard template
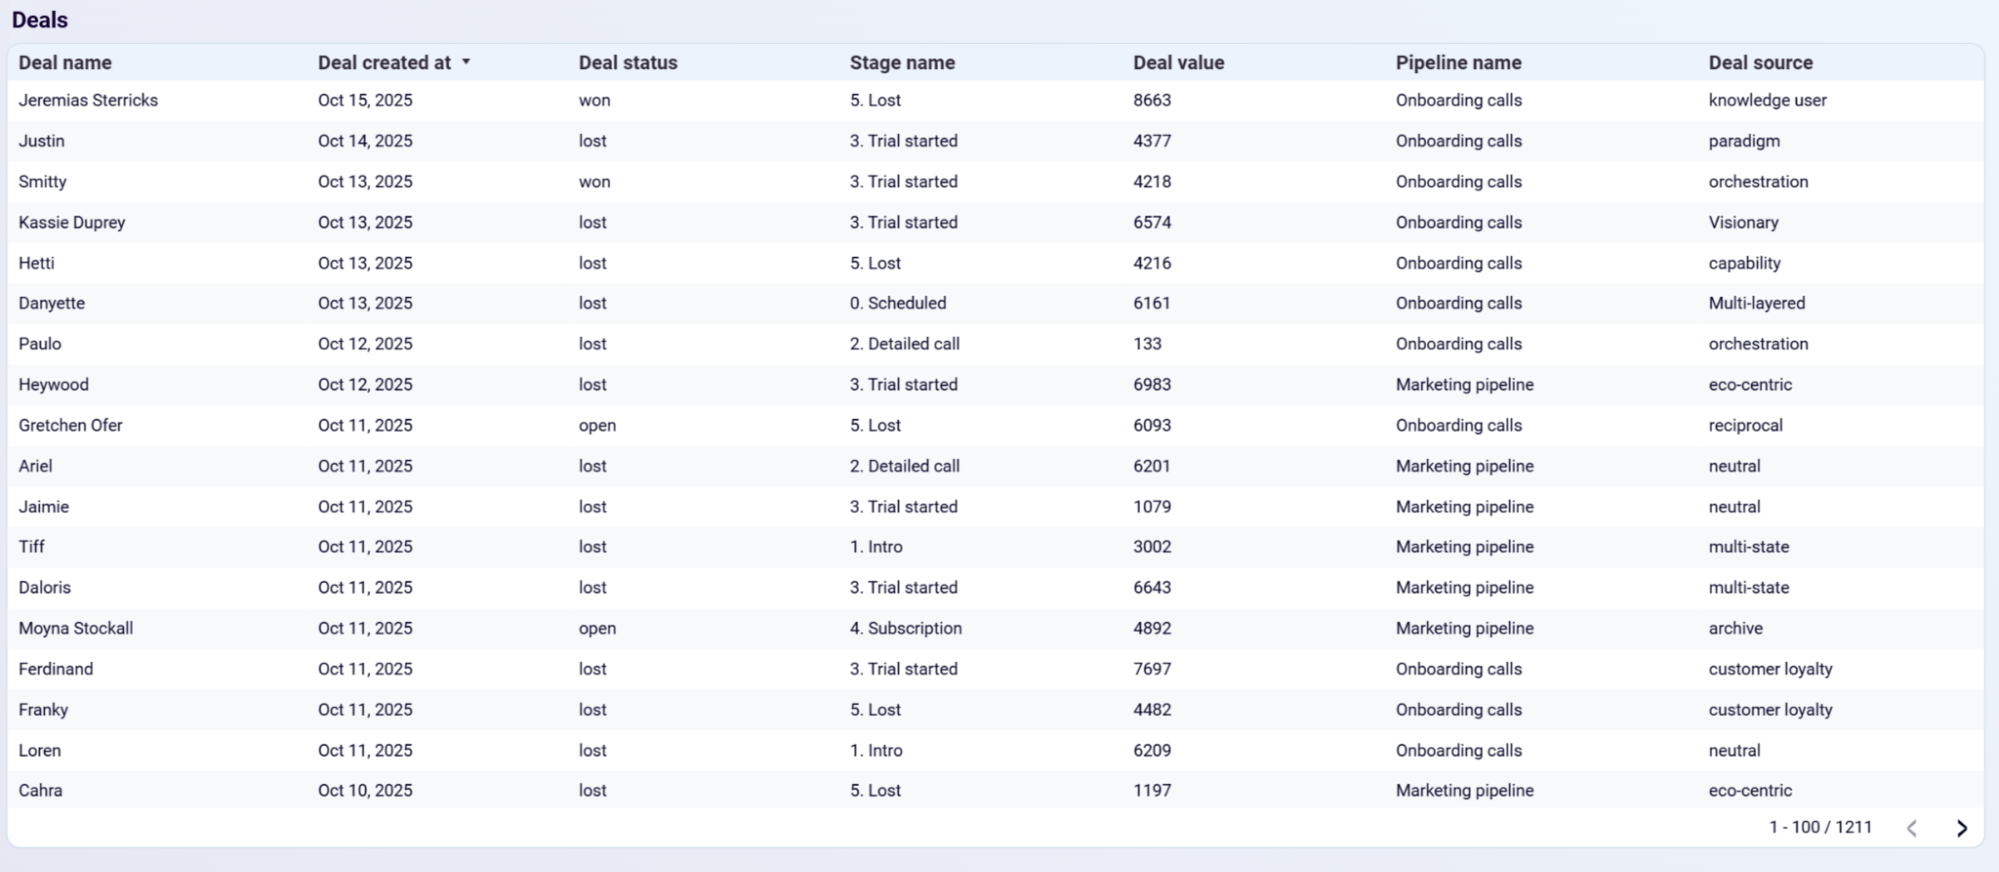
Track deal counts segmented by their current status (won, lost, open), originating source, or pipeline stage. This metric reveals pipeline distribution and helps identify which lead sources produce the most opportunities and where deals concentrate within your sales process. Use this data to allocate resources effectively and optimize underperforming channels or stages.
Monitor the total monetary value of all active opportunities currently in your sales pipeline. This metric indicates potential revenue that could be realized if open deals close successfully. Sales managers use this figure to forecast revenue, assess whether the pipeline contains sufficient value to meet targets, and prioritize high-value opportunities requiring attention.
Measure the total value of opportunities that failed to close, revealing potential revenue lost to competitors or process failures. This metric helps quantify the financial impact of lost deals and prioritizes investigation into common failure reasons. When lost deal value grows disproportionately, it signals urgent needs for sales process improvements or competitive positioning adjustments.
Calculate the total revenue generated from successfully closed opportunities within a specific period. This metric directly measures sales team effectiveness and campaign success in converting pipeline opportunities into actual revenue. Track trends over time to identify growth patterns, seasonal variations, and correlations with marketing activities or strategic initiatives that drive successful deal closures.
Aggregate the combined monetary value of all deals regardless of status, providing a comprehensive view of your total pipeline potential. This metric offers context for understanding what percentage of total opportunity value converts to revenue versus what remains open or is lost. Use this figure for strategic planning and resource allocation decisions across sales and marketing functions.
Monitor advertising investment across all platforms, including Facebook Ads, LinkedIn Ads, Bing Ads, Pinterest Ads, and Twitter Ads. The GoHighLevel dashboard tracks spending patterns over time, revealing how budget distribution shifts across channels and periods. This visibility helps marketing teams ensure spending aligns with strategic priorities and performance outcomes rather than historical allocation patterns.
Track the cost per thousand impressions across advertising platforms to understand reach efficiency and competitive pressure. Rising CPM indicates increased competition for ad space or declining relevance scores, while stable impressions with growing costs suggest budget increases without proportional reach expansion. Our GoHighLevel dashboard templates help optimize bidding strategies and creative performance to maintain cost-effective audience reach.
Measure the average cost paid for each click on your advertisements across different platforms and campaigns. This metric reveals how effectively your ad creative and targeting generate engagement relative to investment. Declining CPC suggests improving ad relevance or reduced competition, while increasing costs signal the need for creative refreshes, audience adjustments, or bidding strategy changes to maintain efficiency.
Calculate the advertising spend required to generate each opportunity in your GoHighLevel CRM by connecting platform costs with pipeline results. This GoHighLevel reporting dashboard metric bridges the gap between marketing investment and sales outcomes, showing true acquisition efficiency beyond intermediate metrics like clicks. When the cost per opportunity increases, it signals declining campaign effectiveness, requiring optimization of targeting, creative, or landing experiences.
Track total income generated from closed deals within your GoHighLevel CRM, providing the ultimate measure of sales and marketing effectiveness. This metric connects all upstream activities—from advertising spend through opportunity creation—to actual business outcomes. The GoHighLevel analytics dashboard displays revenue trends over time, helping identify seasonal patterns, successful campaigns, and growth trajectories that inform strategic planning and forecasting.
Measure return on ad spend by comparing revenue generated against advertising investment across all platforms. This metric reveals which channels deliver profitable returns versus those consuming budget without adequate revenue generation. A GoHighLevel agency dashboard calculates ROAS to optimize budget allocation toward high-performing platforms while investigating or reducing investment in channels showing insufficient returns relative to costs.