LinkedIn Ads dashboard examples and reporting templates
Maximize your LinkedIn advertising performance with automated, real-time analytics dashboards that consolidate critical metrics from your campaigns. Track lead generation, monitor creative performance, analyze company targeting, and optimize spend with customizable reports that update automatically. Make data-driven decisions based on actionable insights from your LinkedIn ads campaigns.
LinkedIn Ads dashboard examples for every need


 +3
+3


 +6
+6


 +5
+5
 +6
+6

 +3
+3
 +1
+1
 +4
+4
 +4
+4
 +2
+2
 +2
+2

 +5
+5
 +4
+4
 +5
+5
 +5
+5
 +3
+3

 +1
+1
 +3
+3

 +1
+1
 +3
+3
 +3
+3
 +2
+2

 +1
+1

 +1
+1

 +2
+2
 +3
+3

 +4
+4


about your case. It doesn't cost you a penny 😉
Choose your white label LinkedIn Ads dashboard to kick off
What is a LinkedIn Ads dashboard?
Actionable LinkedIn advertising dashboards not only display basic metrics. They offer advanced insights like creative performance comparison, lead form funnel analysis, company reach tracking, and frequency optimization. With automated data refreshing through Coupler.io, these dashboards ensure you're always working with the most current information without manual exports or data manipulation. They serve as a single source of truth for measuring and optimizing your LinkedIn advertising performance.

What reports should be included on a meaningful LinkedIn Ads performance dashboard?
A comprehensive LinkedIn ads dashboard should include several key reports that provide complete visibility into your advertising performance. Based on our analysis of effective LinkedIn advertising dashboards, we recommend incorporating these four essential report types:
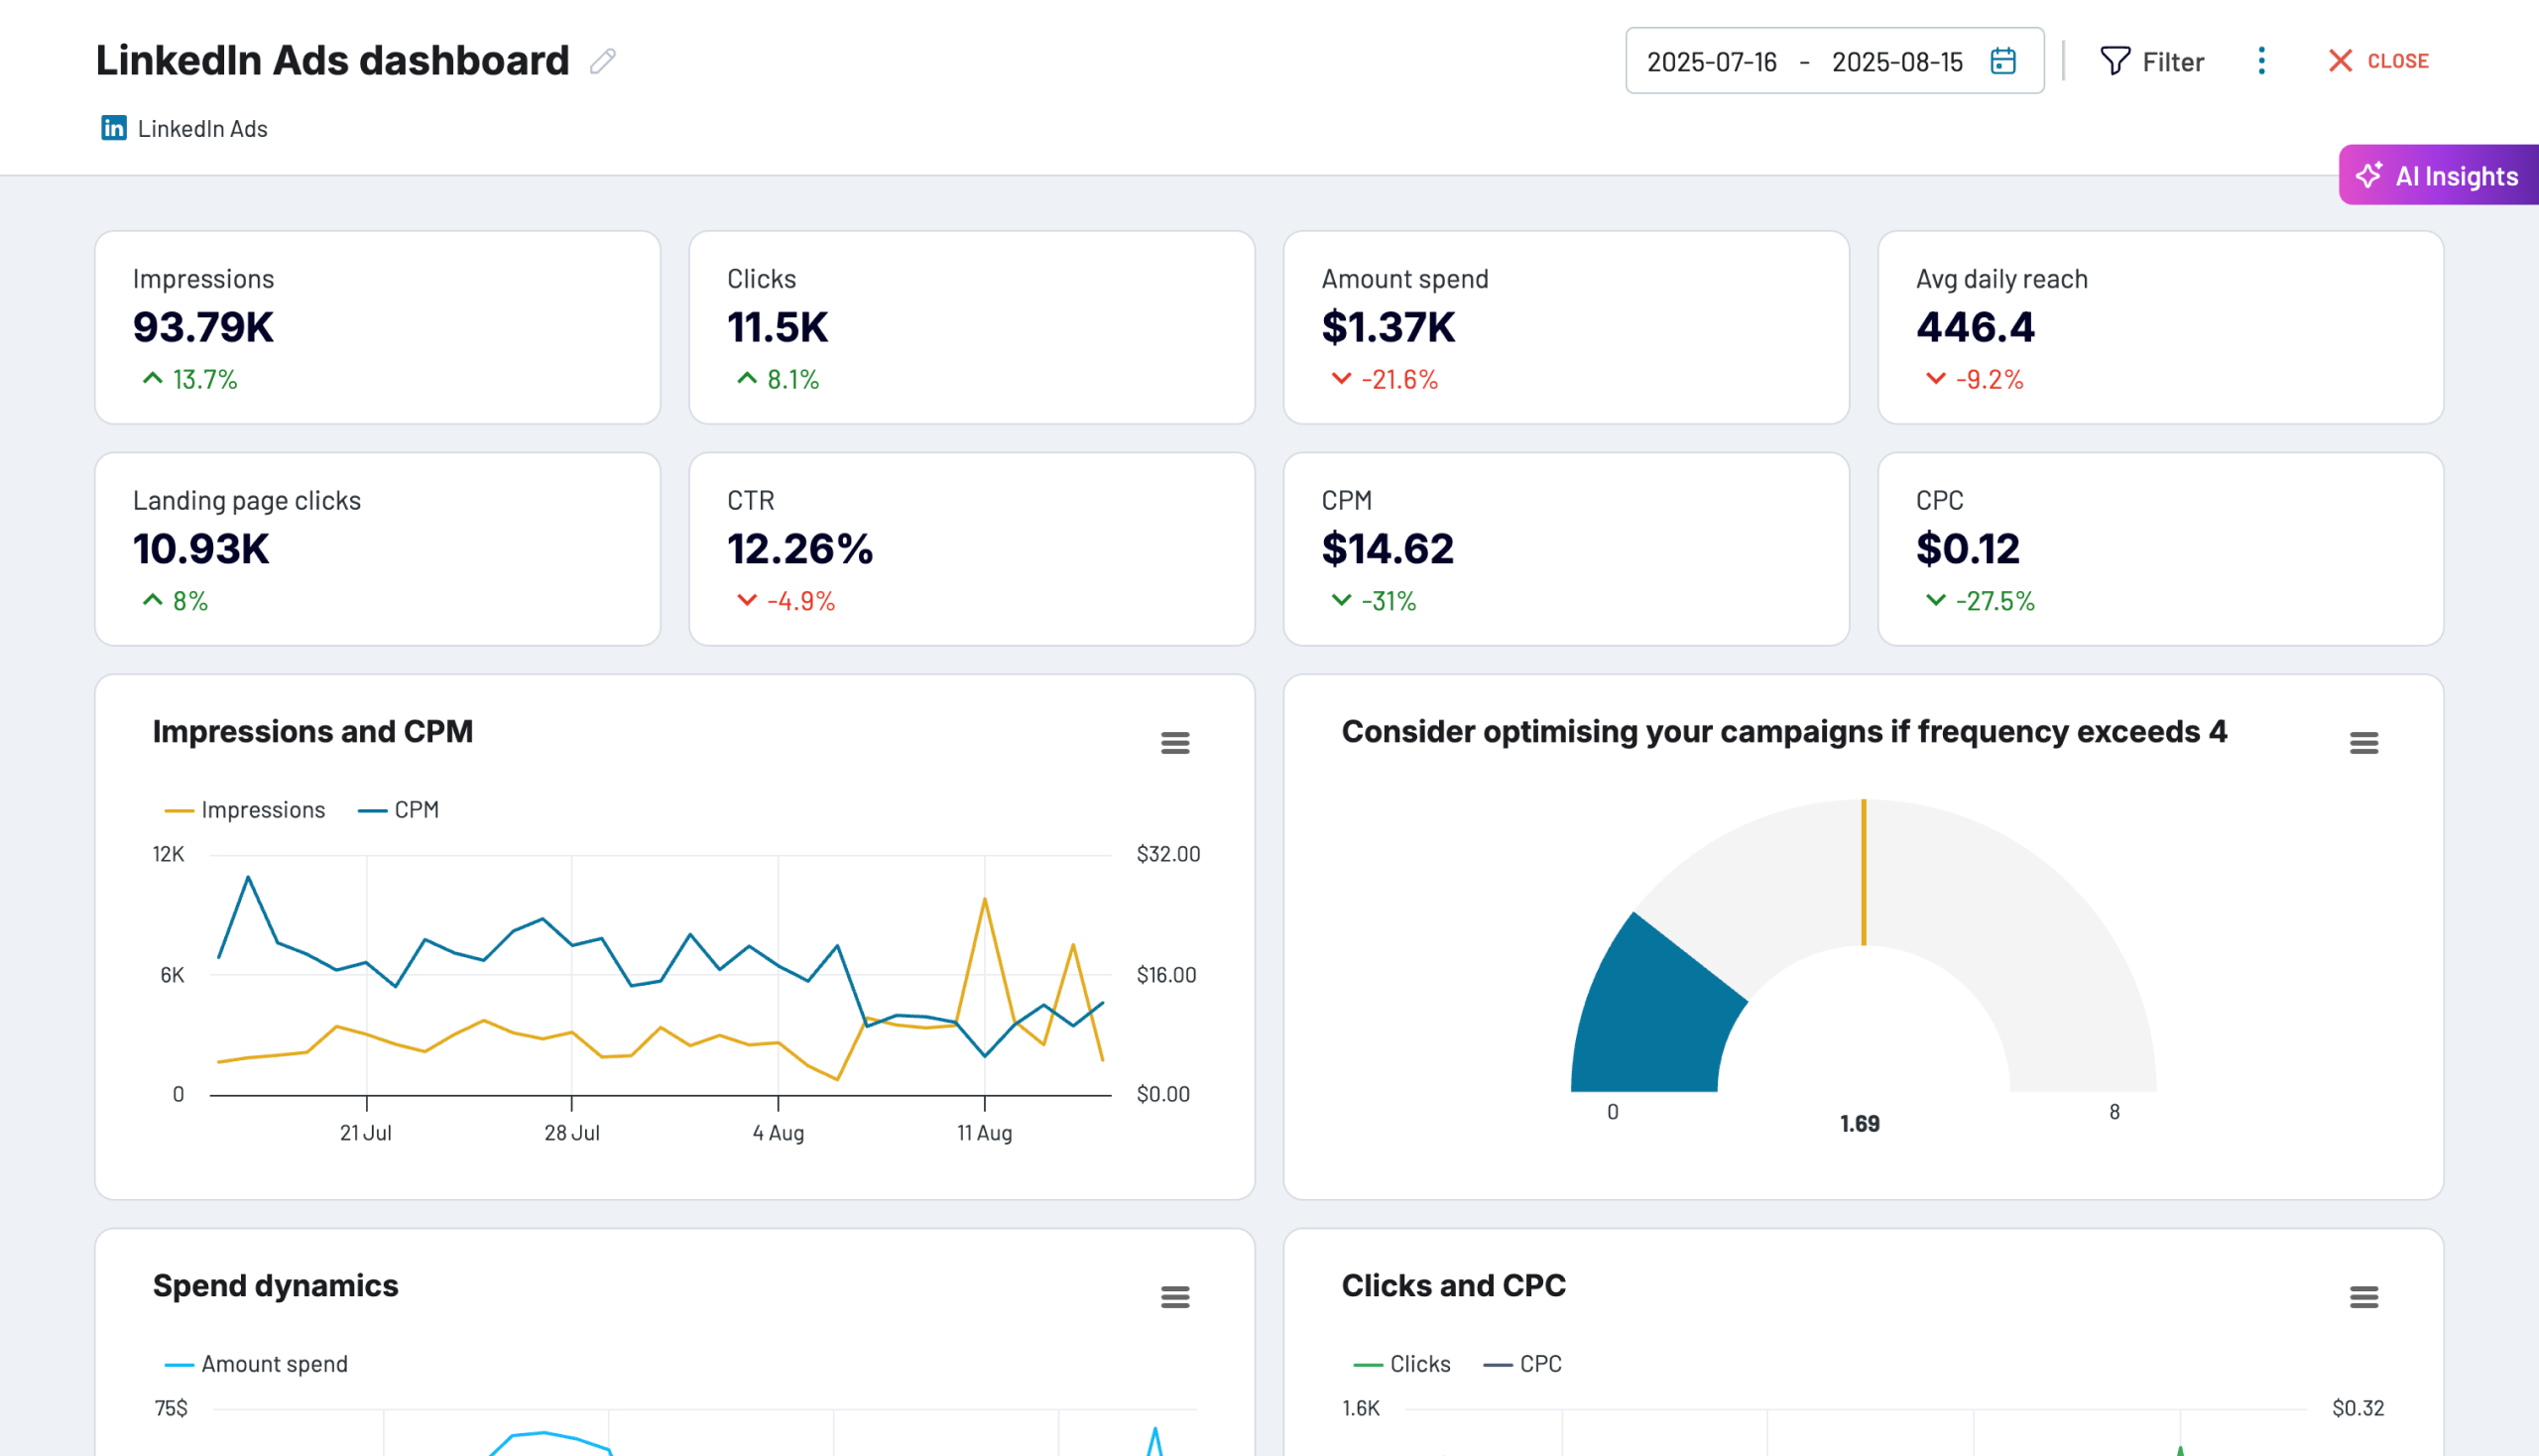
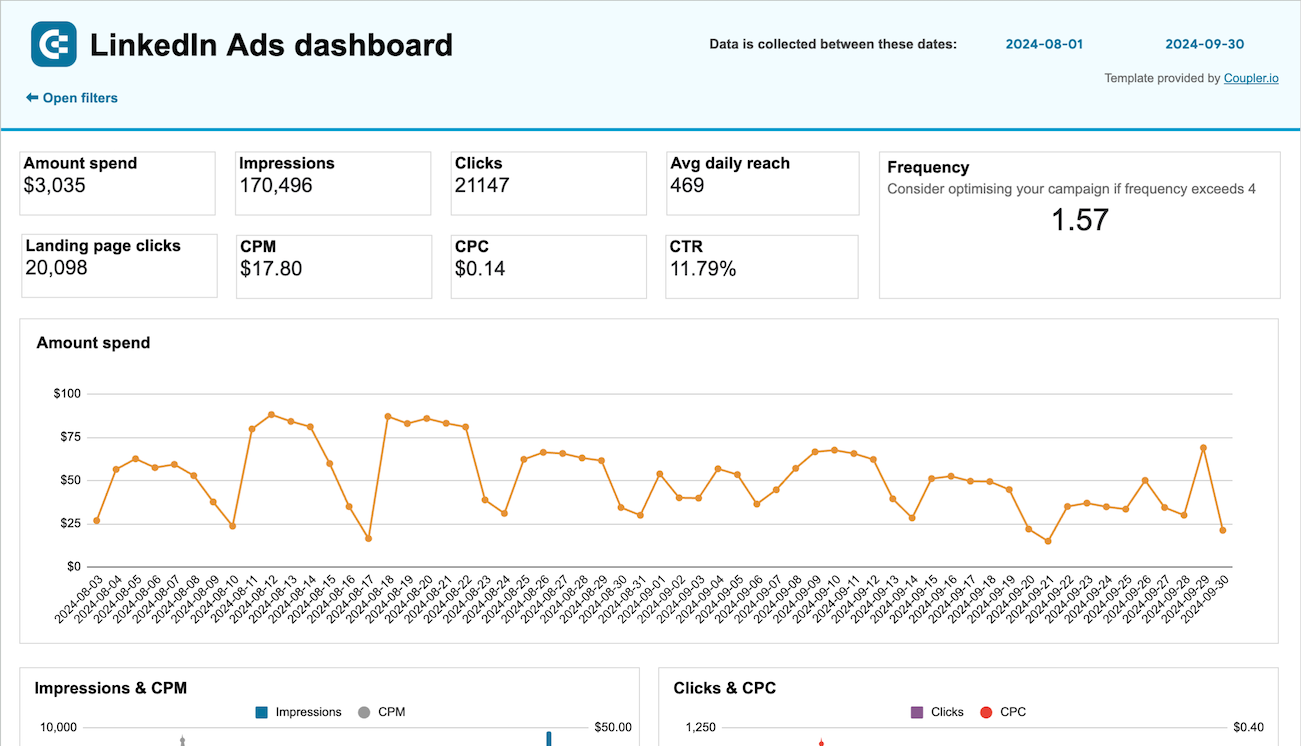
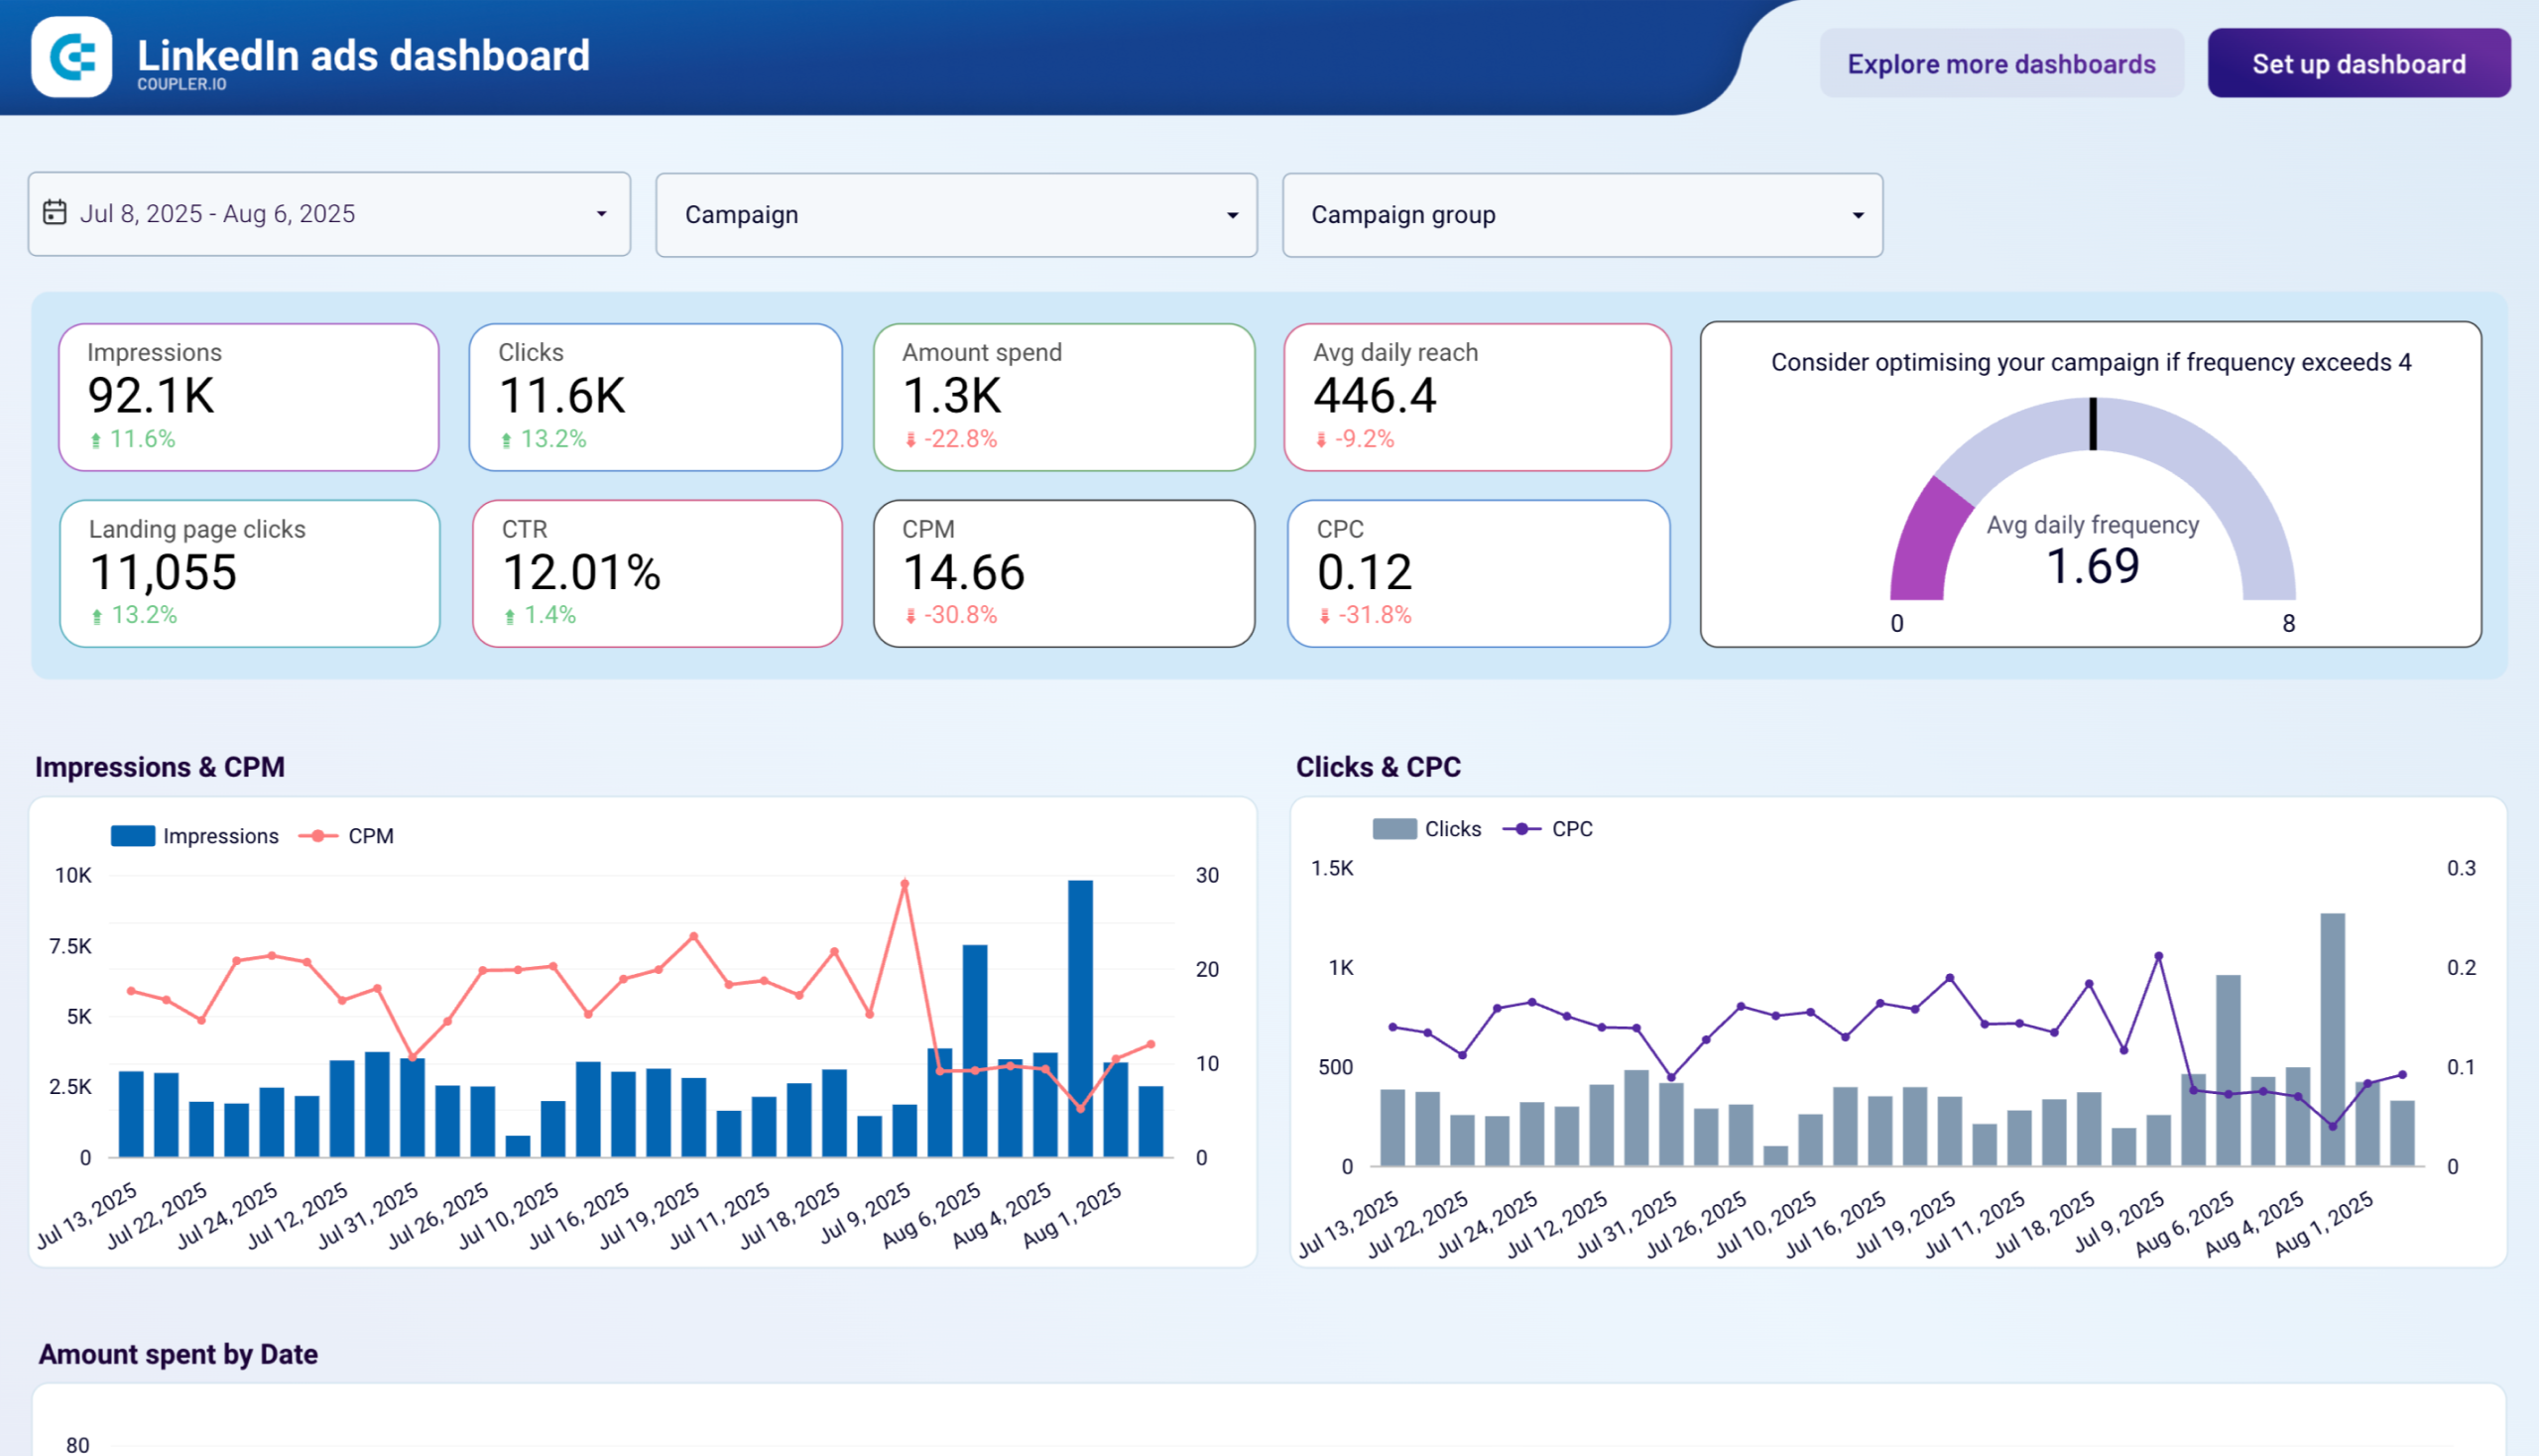
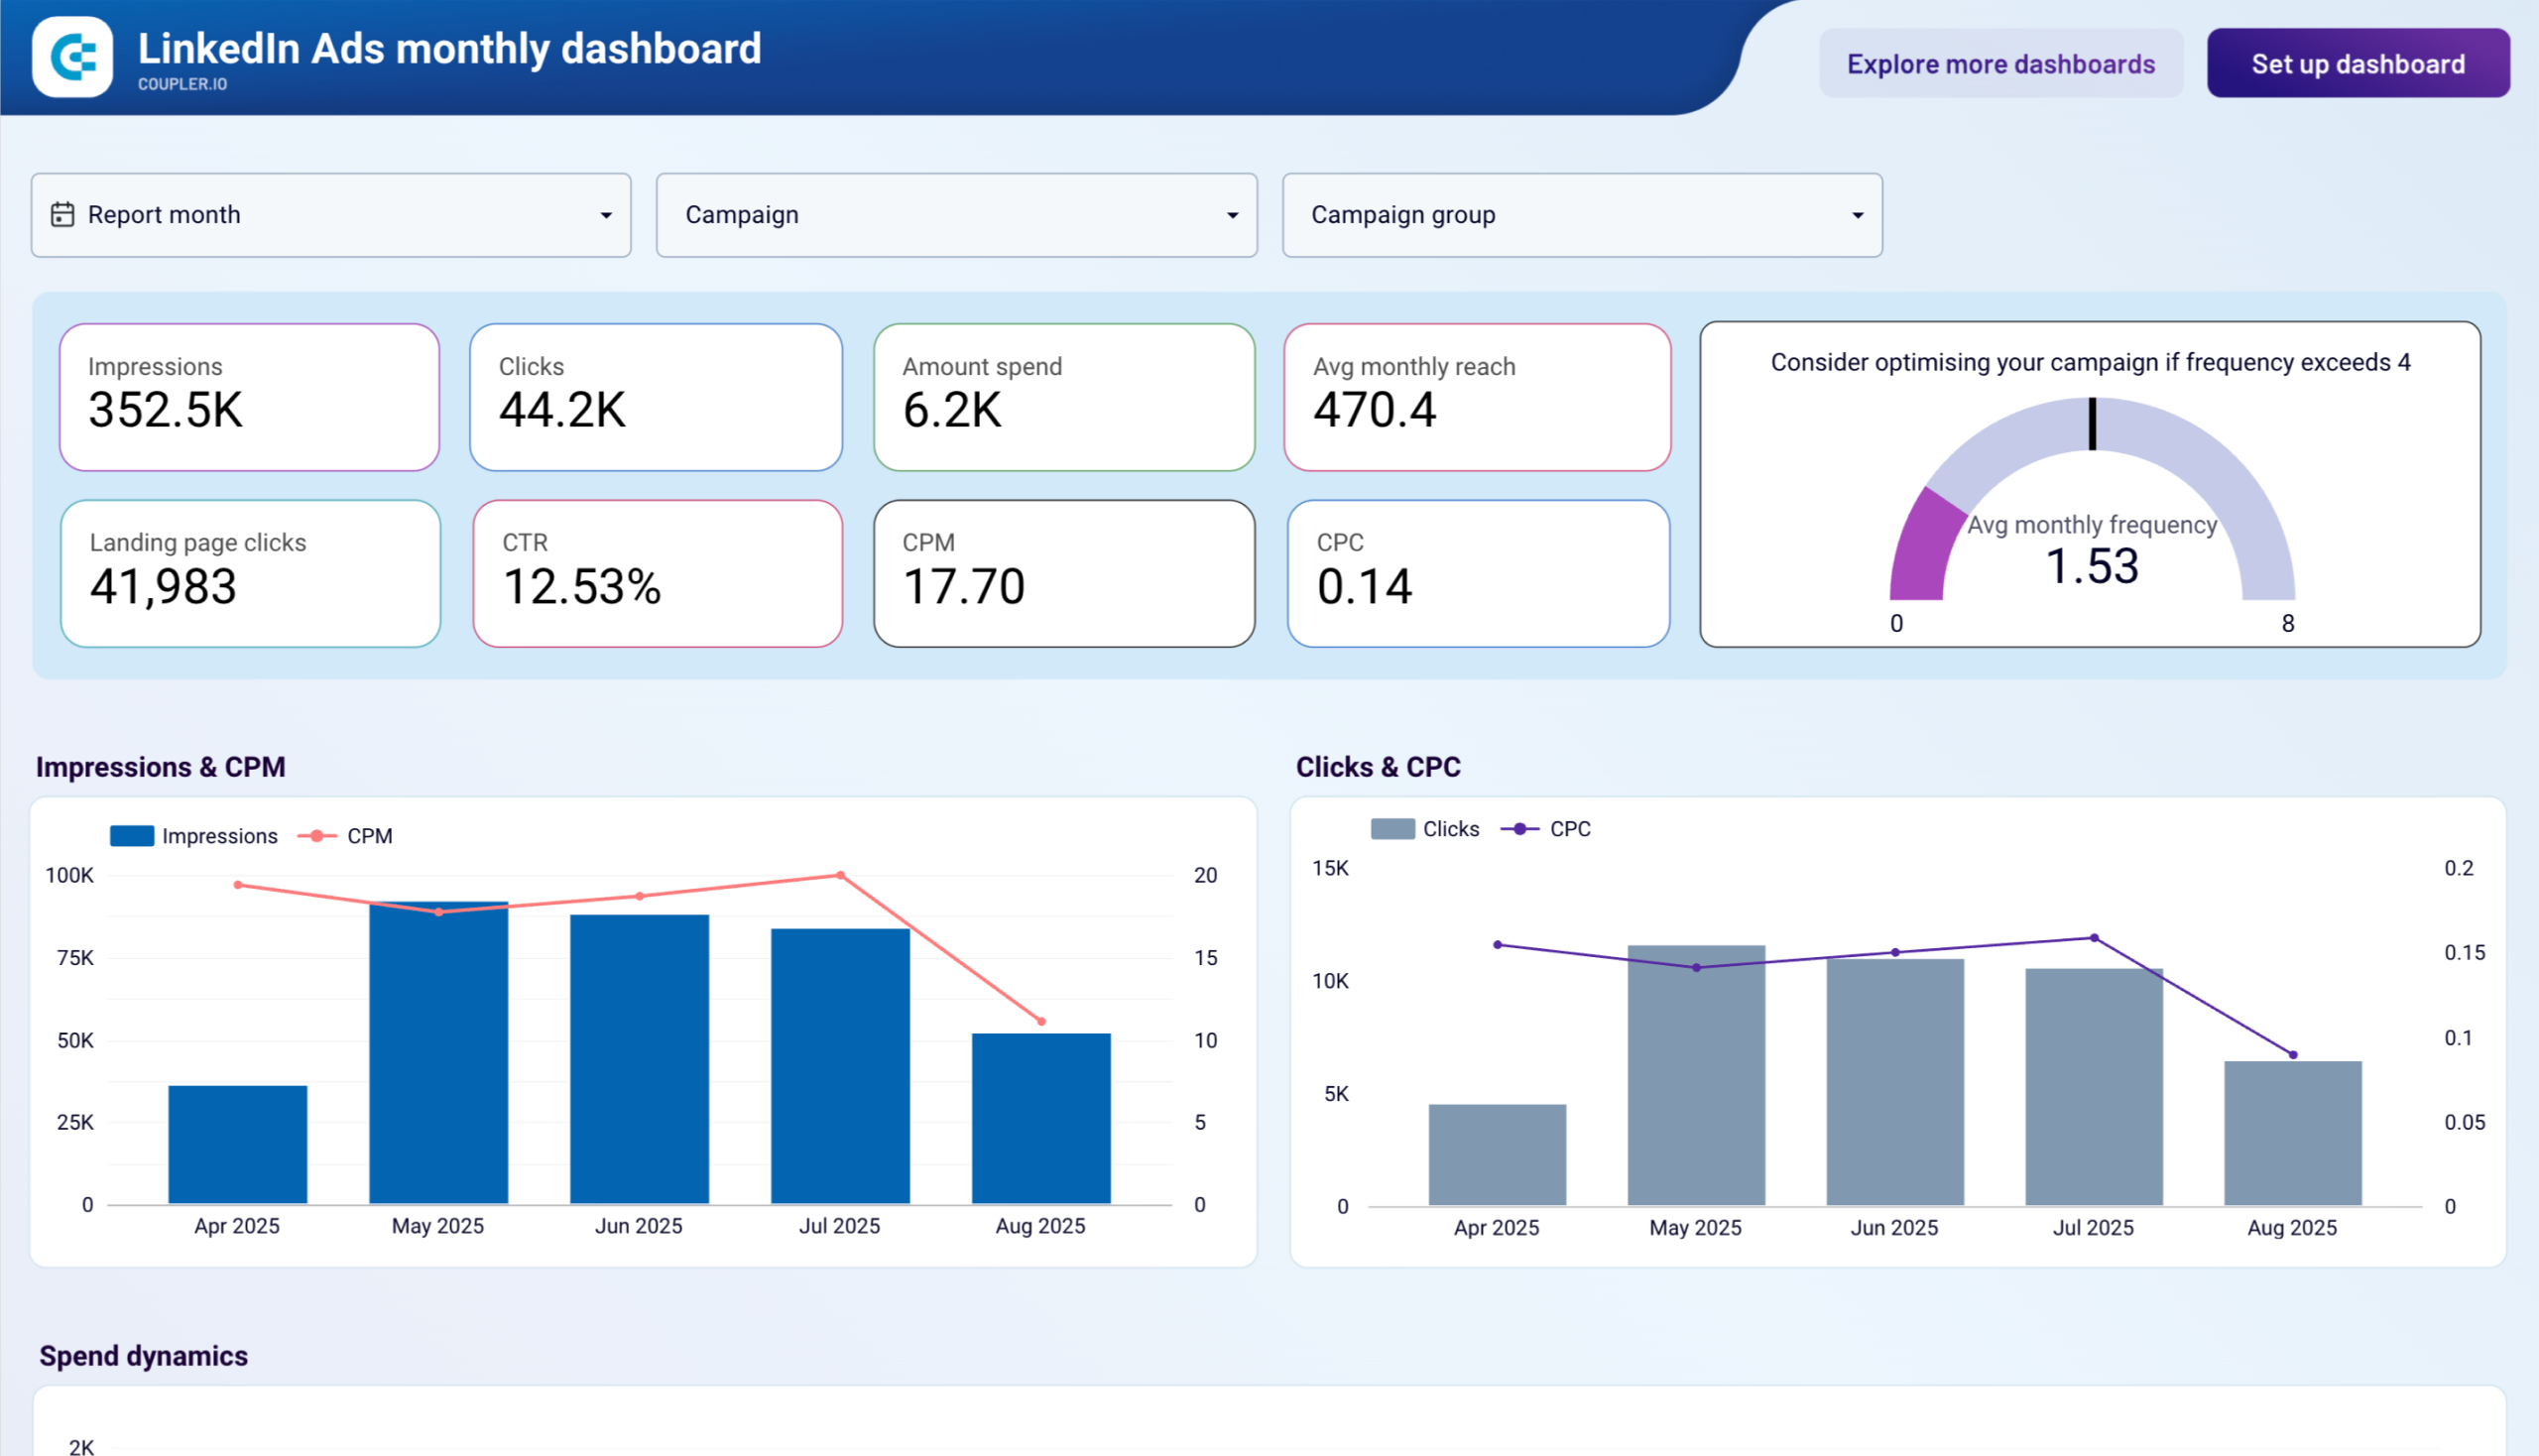
The campaign performance report provides a detailed breakdown of how your LinkedIn ads campaigns are performing. It tracks essential metrics like impressions, clicks, spend, CTR, CPC, and conversions across different campaigns and time periods. The report includes a frequency meter that shows the threshold value for ad frequency, helping you determine when to increase or decrease campaign frequency to prevent ad fatigue. This data is crucial for optimizing budget allocation and improving overall campaign effectiveness.
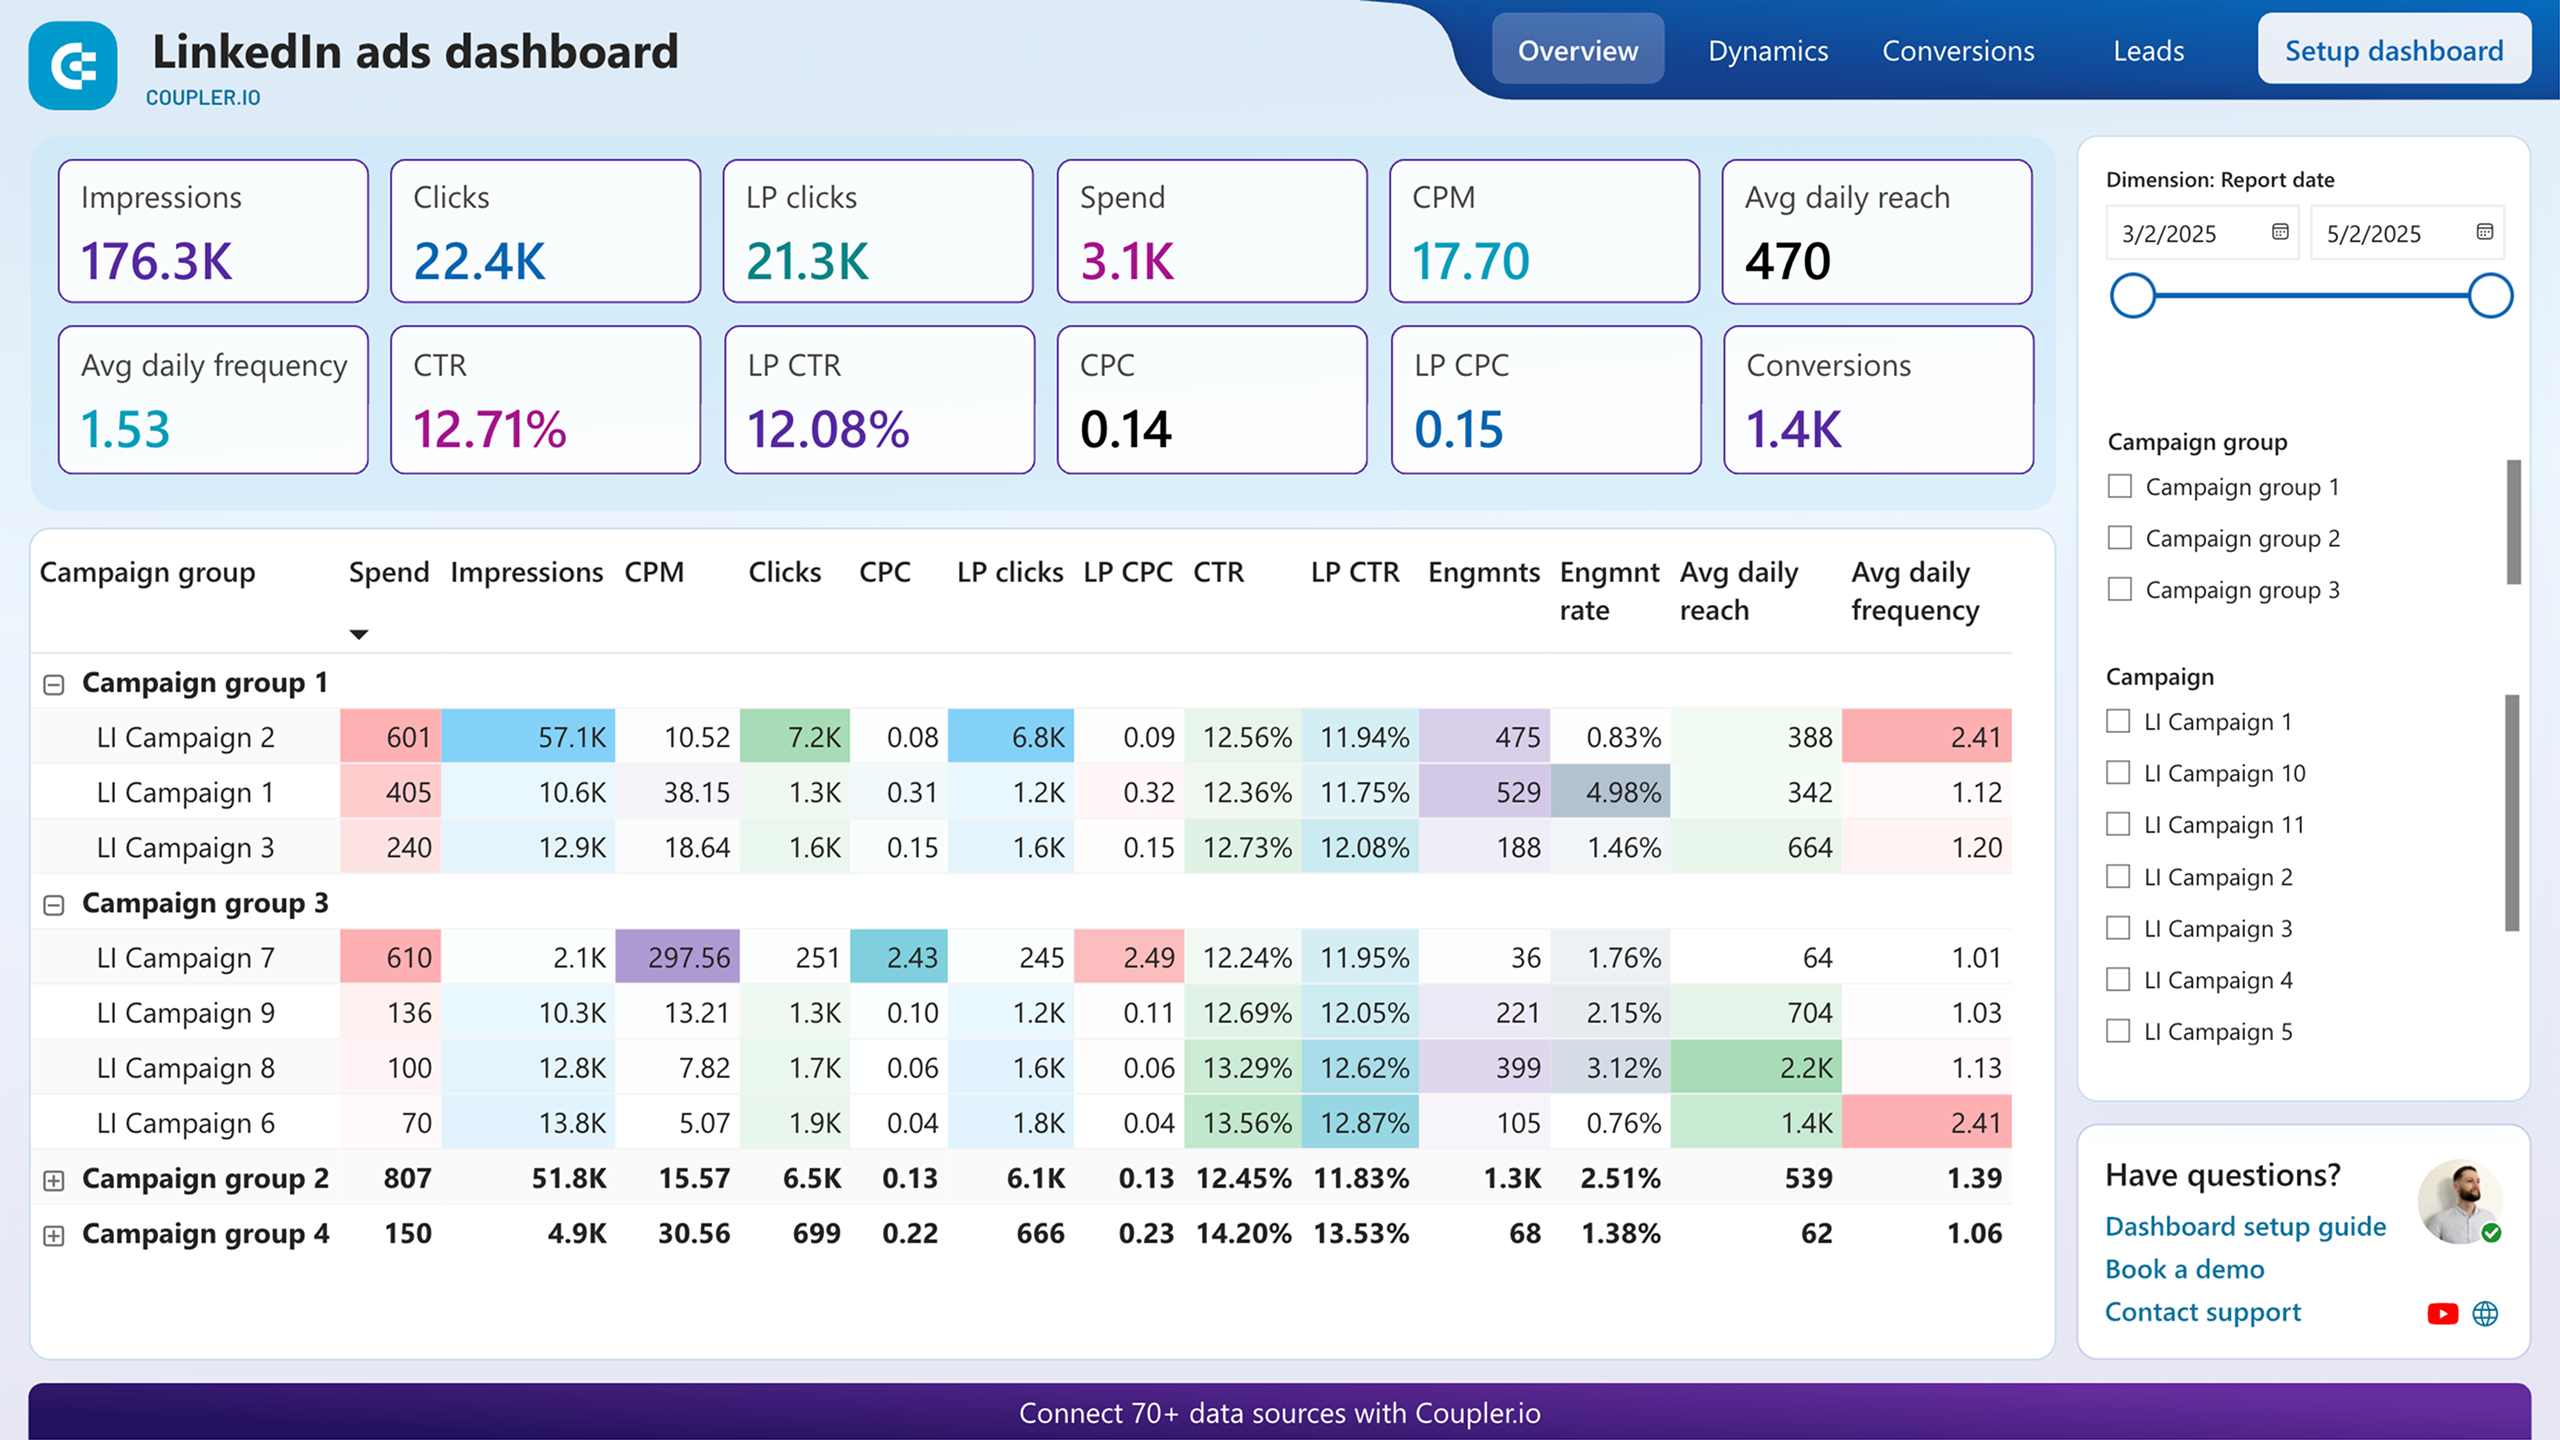
The creative analytics report delivers detailed insights into how individual ad creatives are performing across your LinkedIn campaigns. It provides a comprehensive breakdown of each creative by key performance indicators like engagements, CTR, CPM, CPC, conversions, and total spend. The report also visualizes impressions, CPM, clicks, and CPC trends over time, enabling you to identify which content resonates most with your audience and optimize creative elements accordingly.
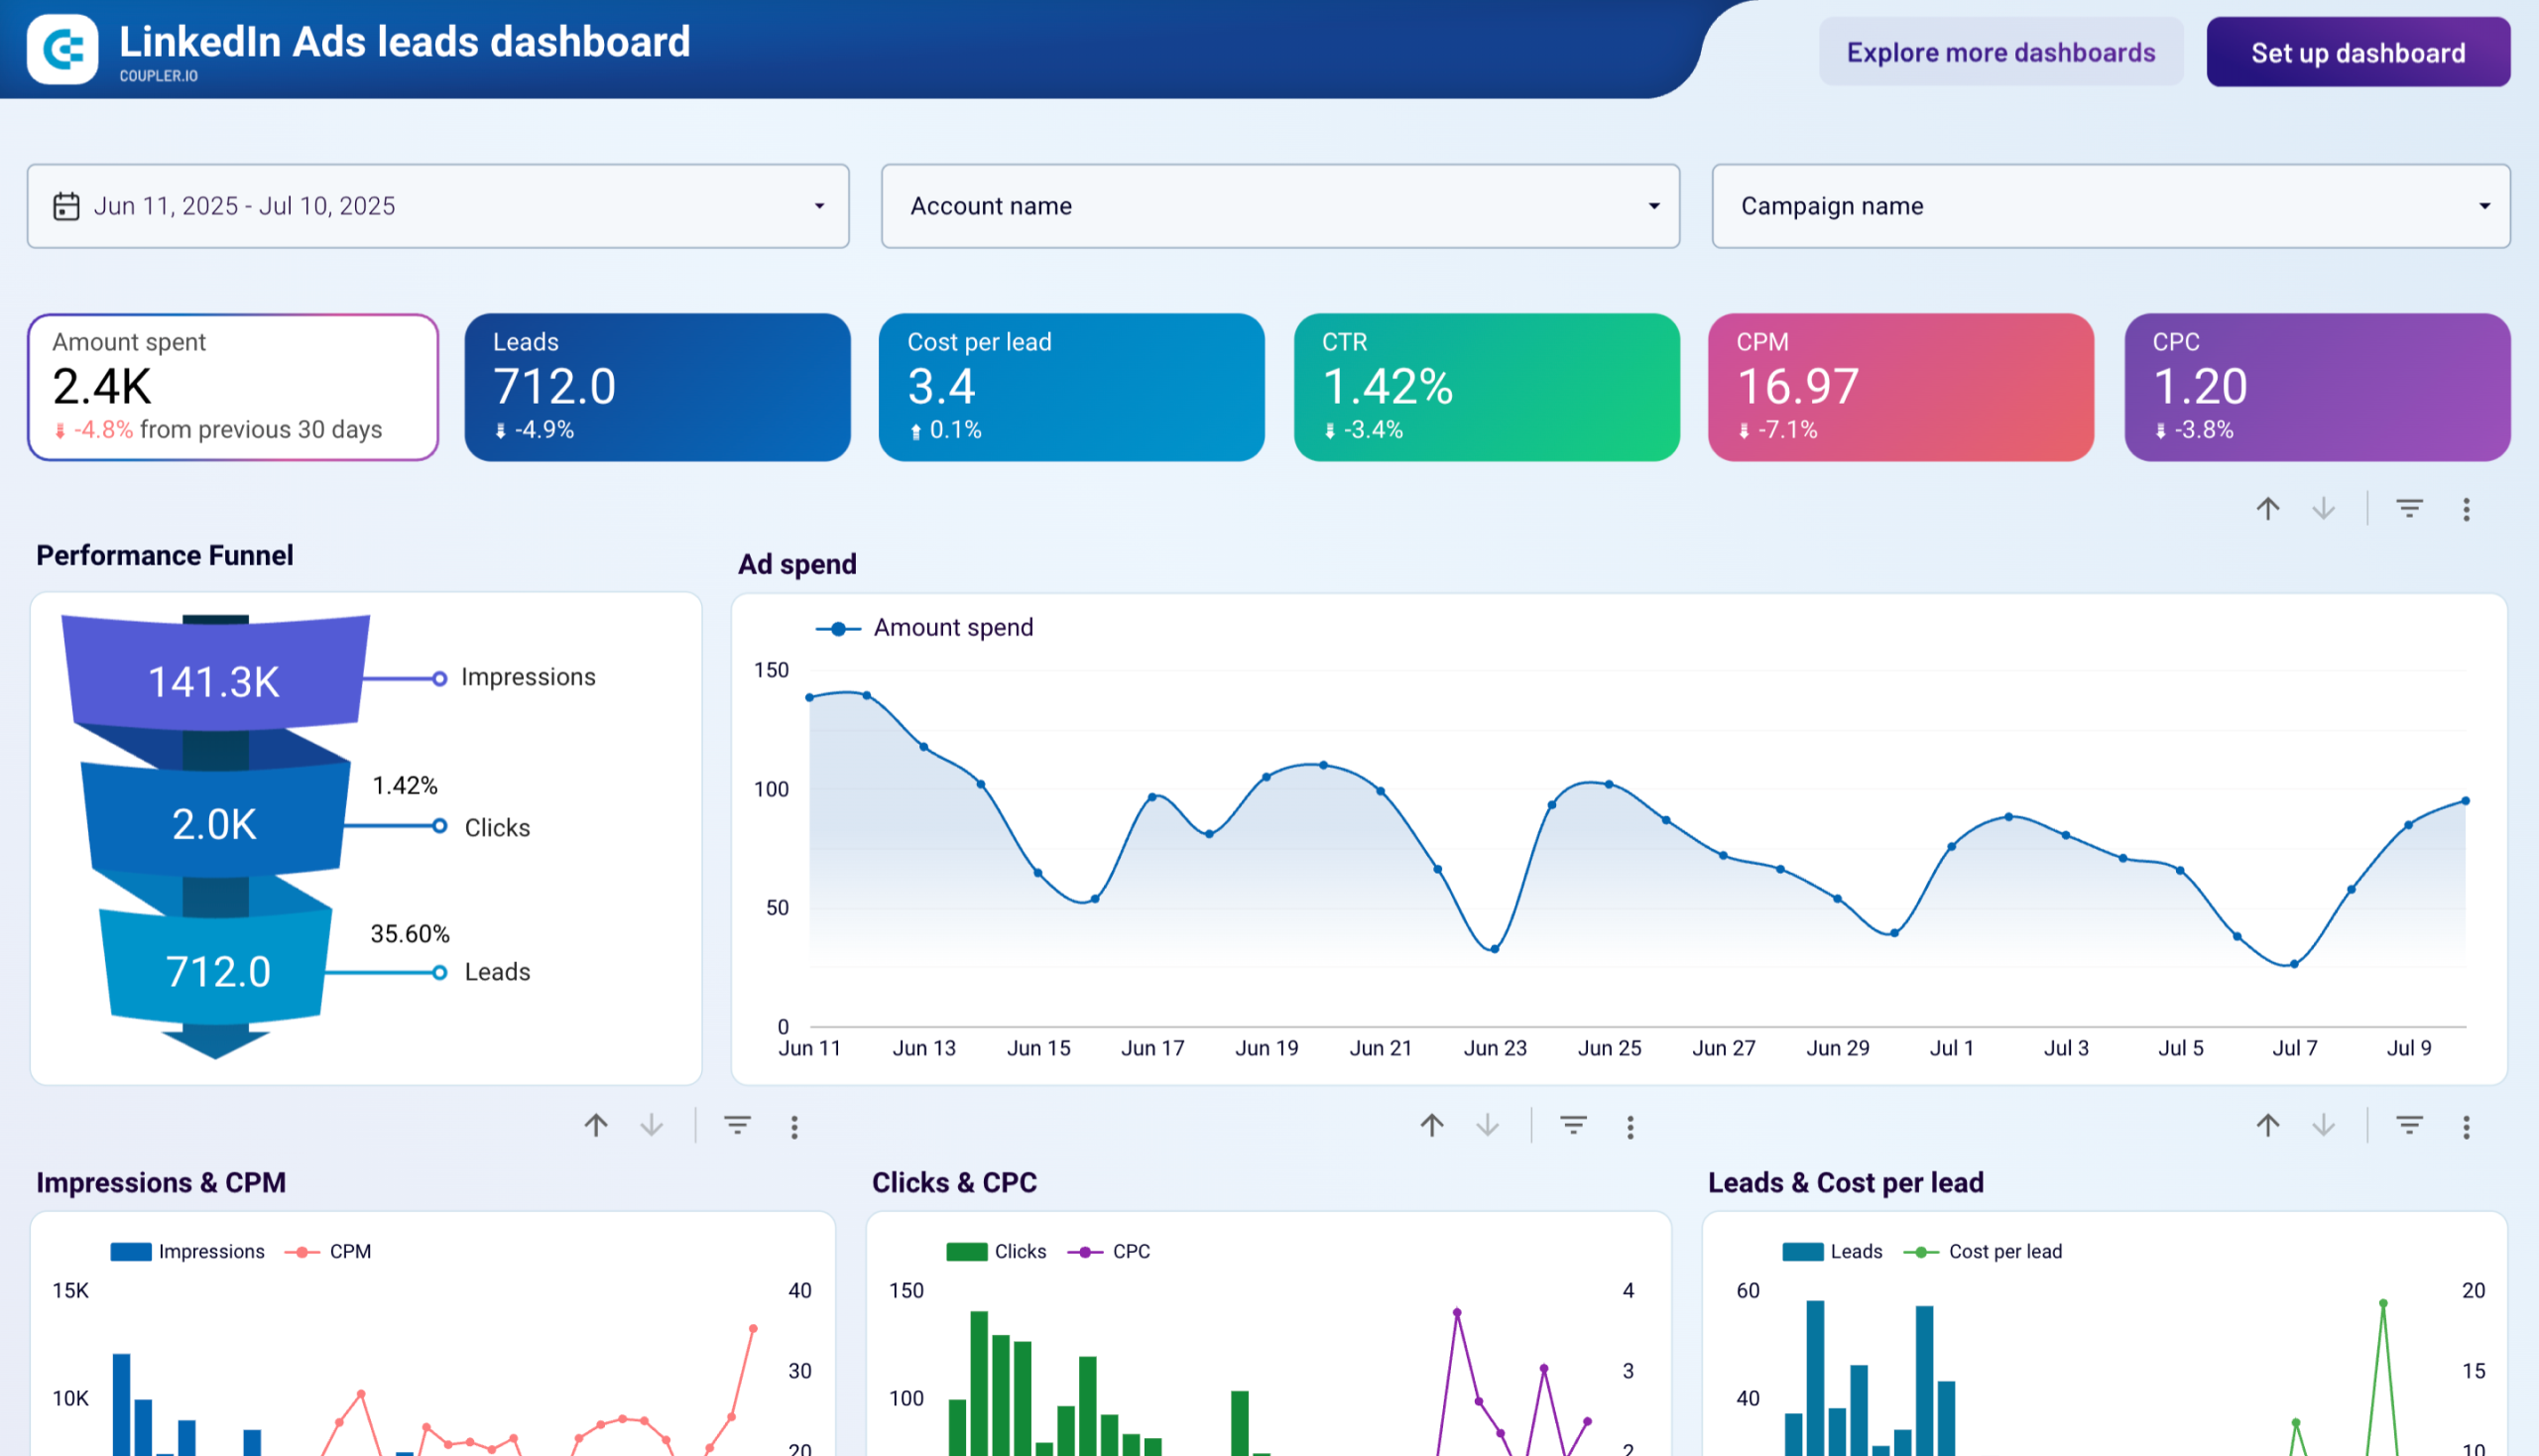
The lead generation funnel report visualizes the entire conversion journey from impression to lead, showing exactly how your advertising efforts translate into tangible business outcomes. It tracks how impressions convert to clicks, then to lead form opens, and finally to completed leads. The report also provides detailed metrics on conversion rates at each stage, helping you identify bottlenecks in your funnel. These insights are essential for optimizing landing pages, lead form designs, and targeting strategies to maximize lead generation efficiency.
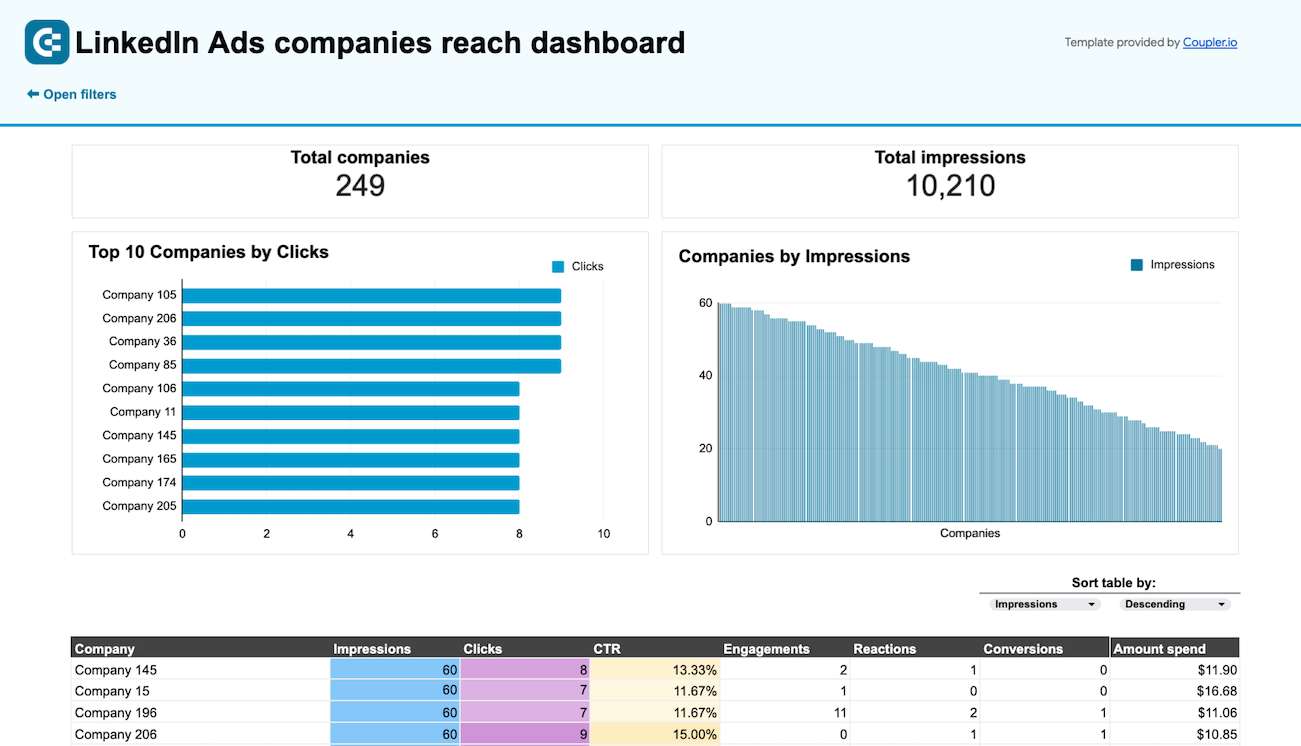
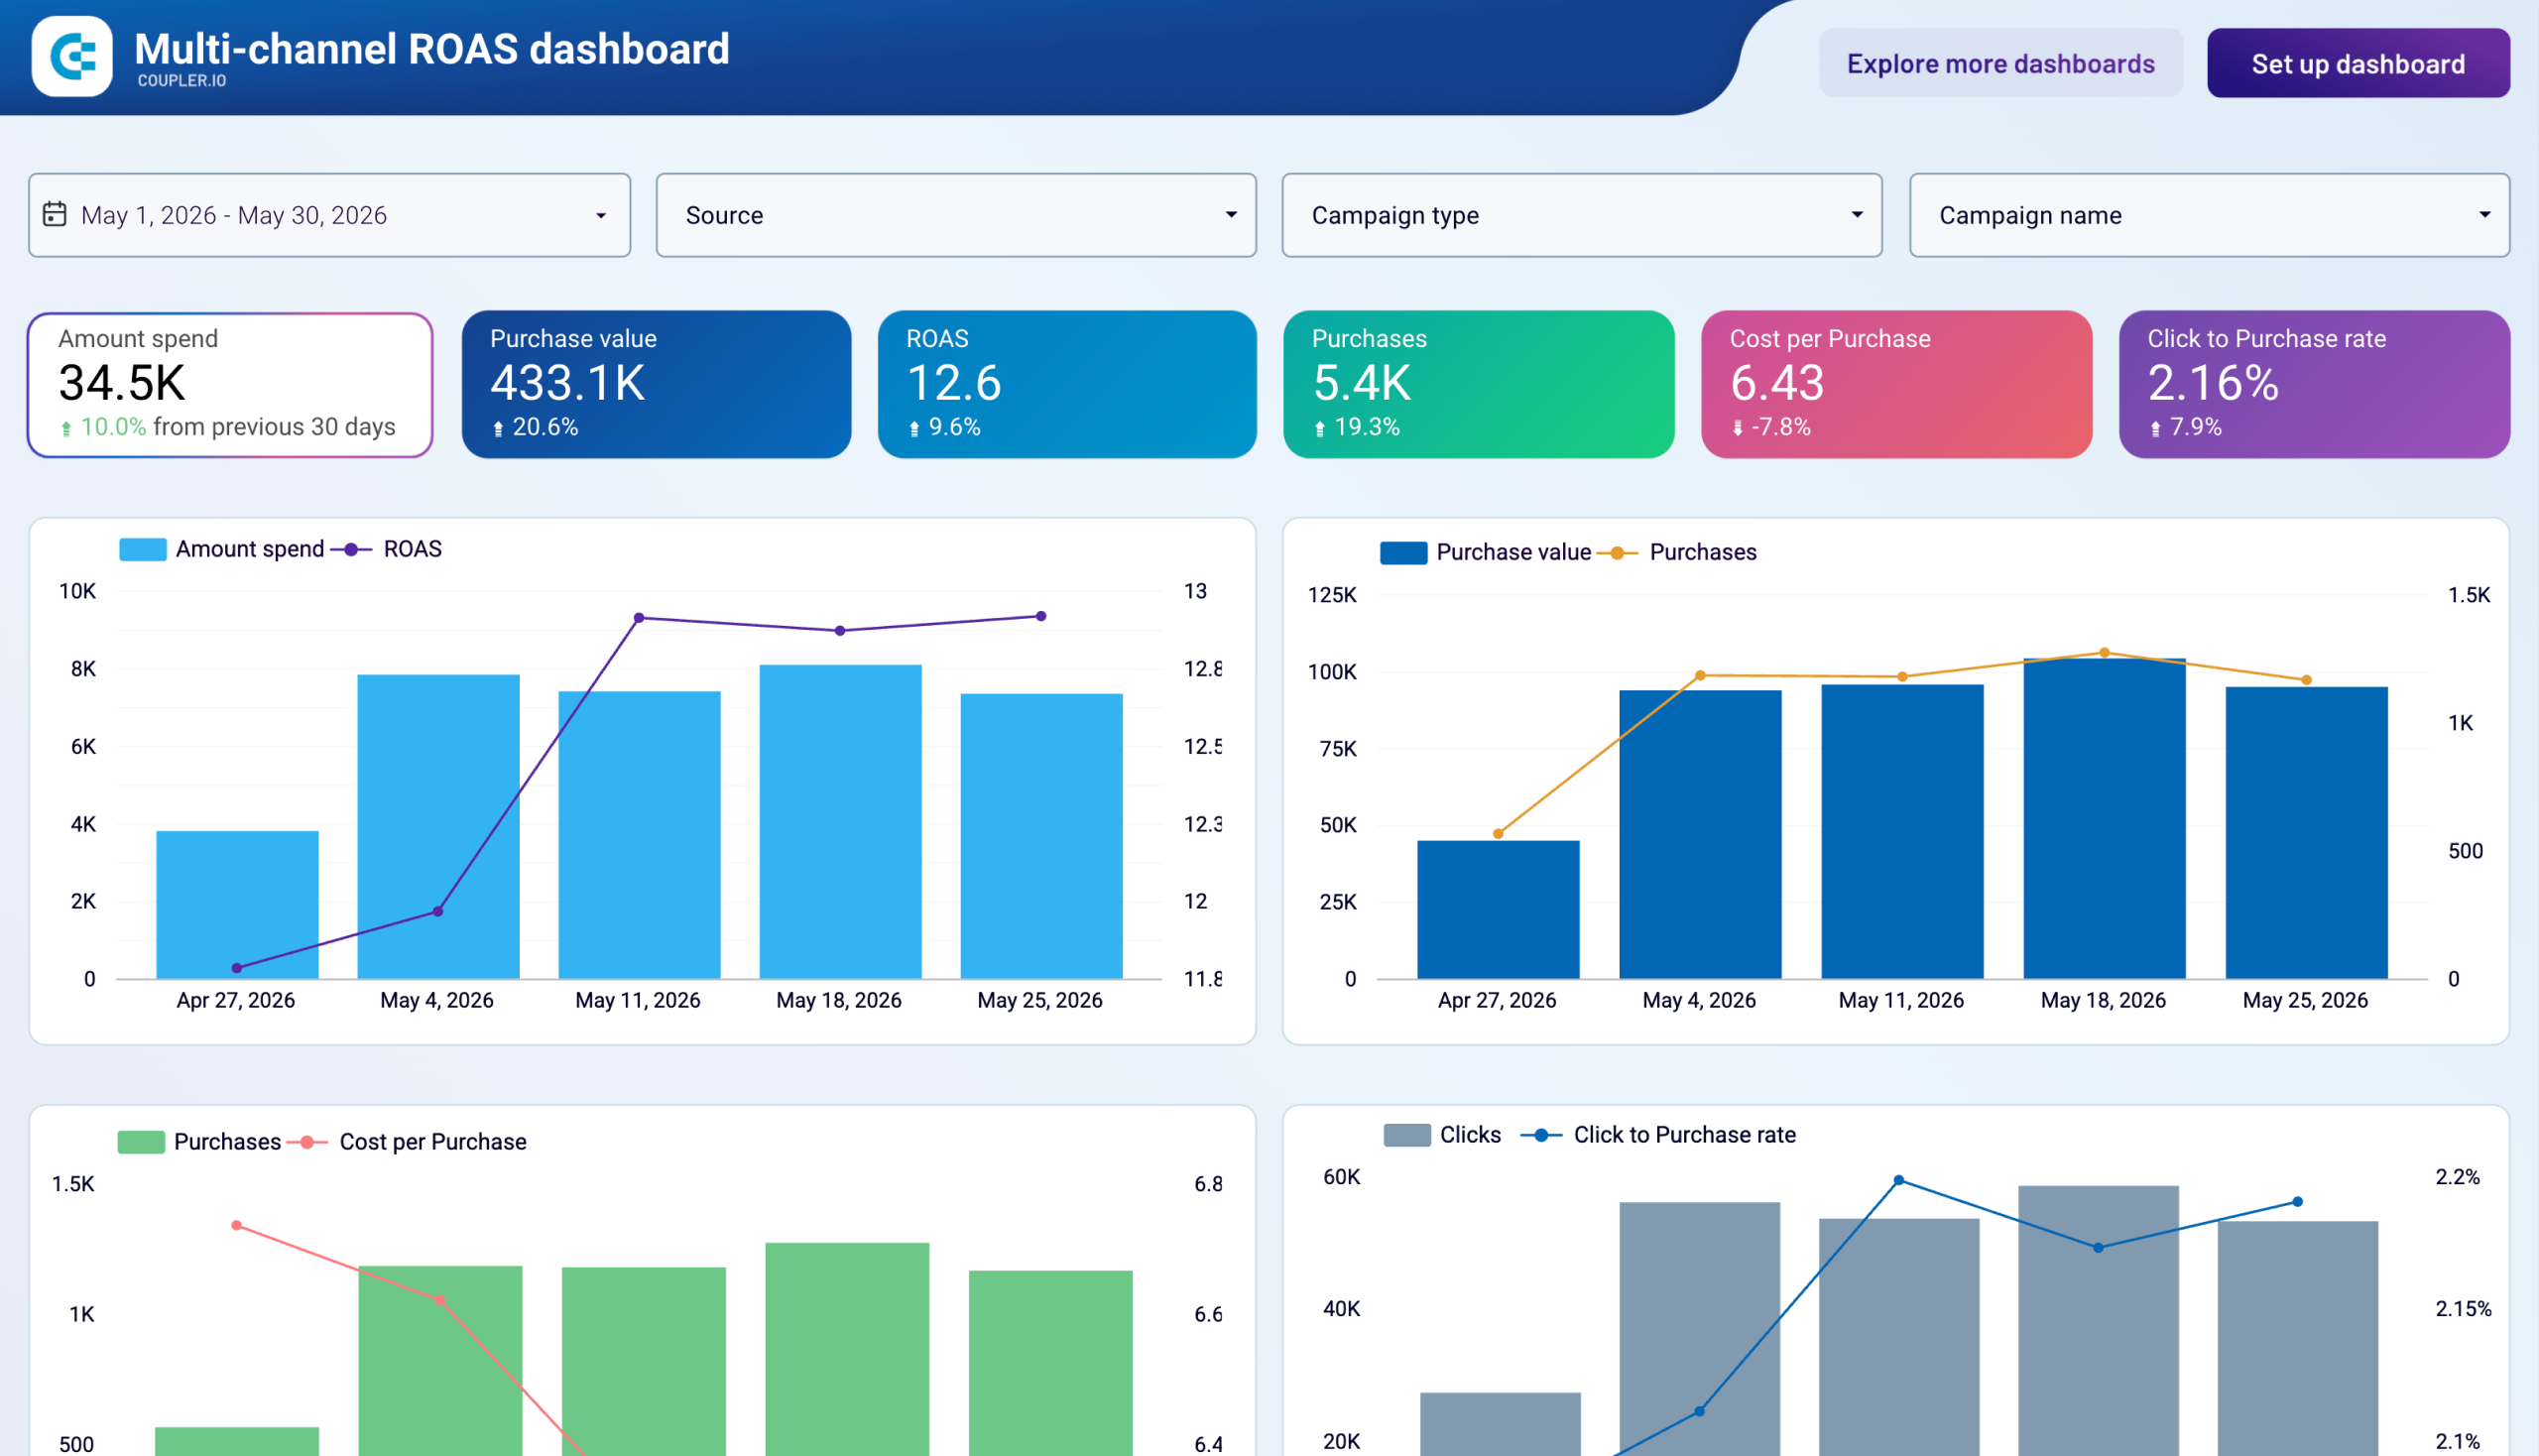
The company reach and engagement report offers B2B marketers visibility into which companies are seeing and interacting with their ads. It shows impressions, clicks, and engagement metrics at the company level, helping you identify high-value prospects based on their interaction patterns. The report allows you to compare metrics like impressions, clicks, CTR, and spend across different companies, enabling more targeted decision-making for account-based marketing strategies. This insight is invaluable for aligning marketing efforts with sales strategies and nurturing high-potential business relationships.
What insights you can get with the LinkedIn advertising dashboard
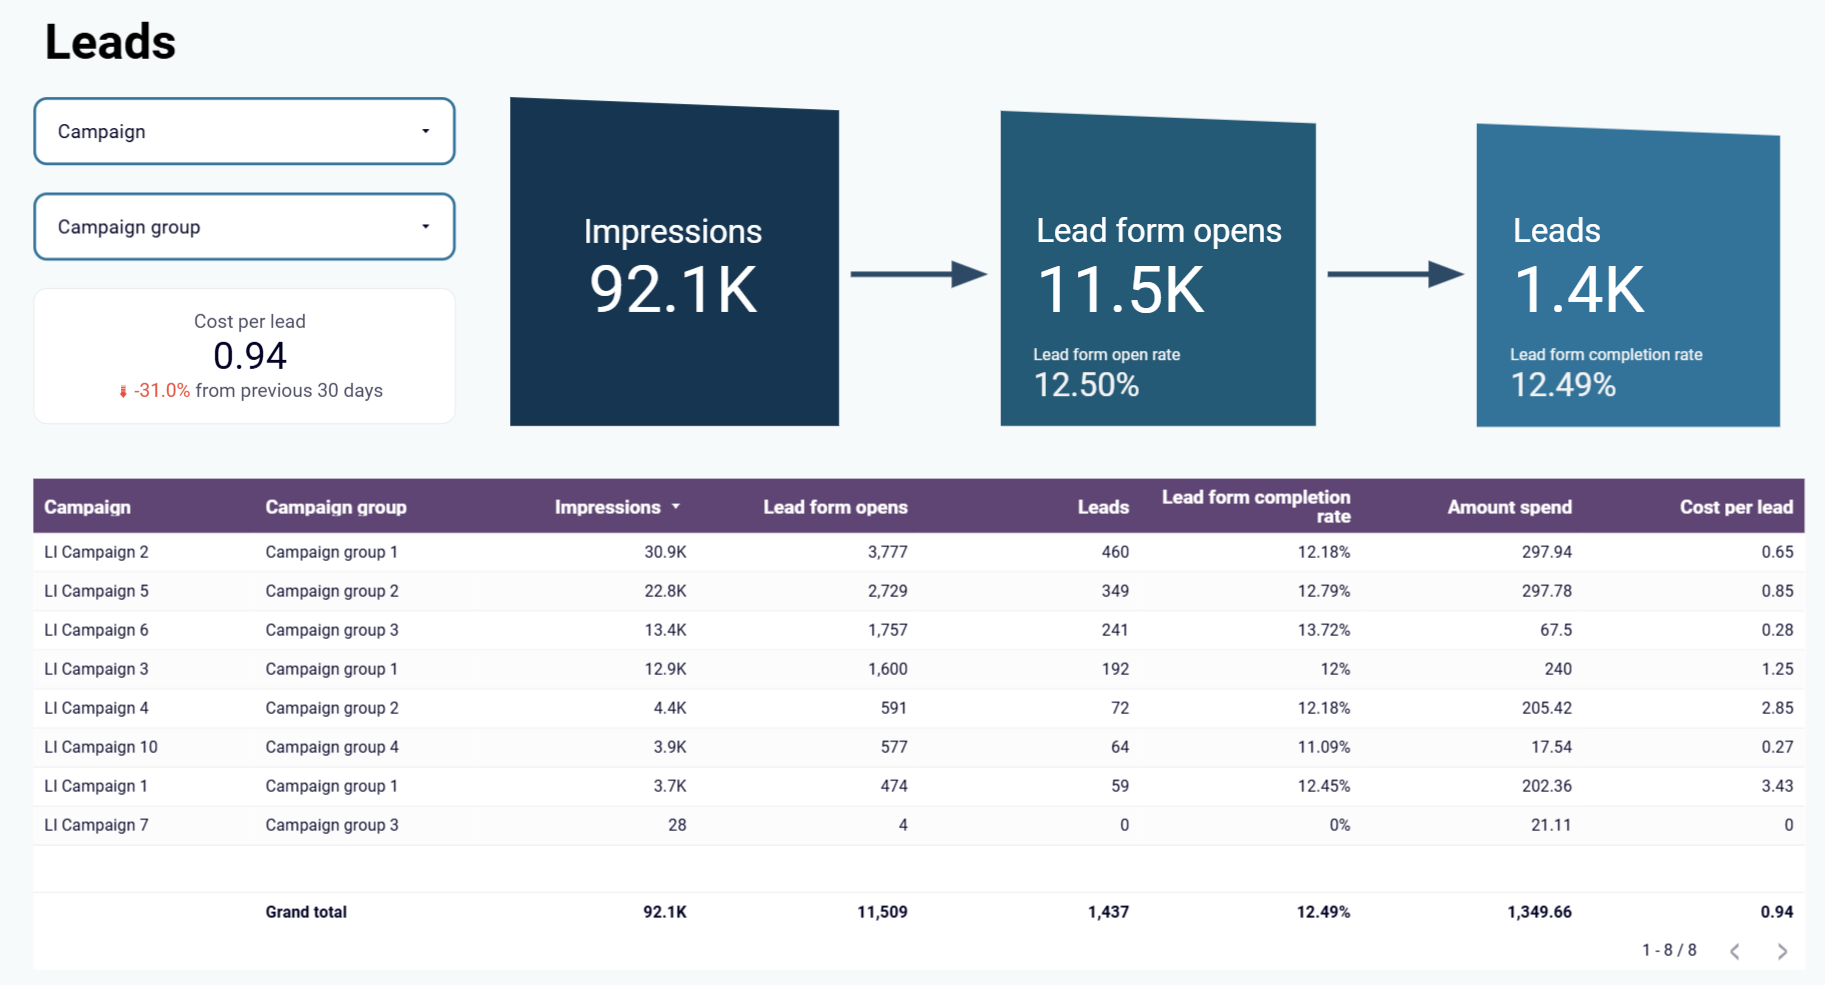
The dashboard provides a clear visualization of your lead generation funnel, showing how impressions transform into lead form opens and ultimately convert to completed leads. You can easily identify where potential leads drop off in the journey and calculate conversion rates between each stage. This insight helps pinpoint optimization opportunities in your forms, landing pages, or targeting to increase lead generation efficiency and improve overall campaign ROI.
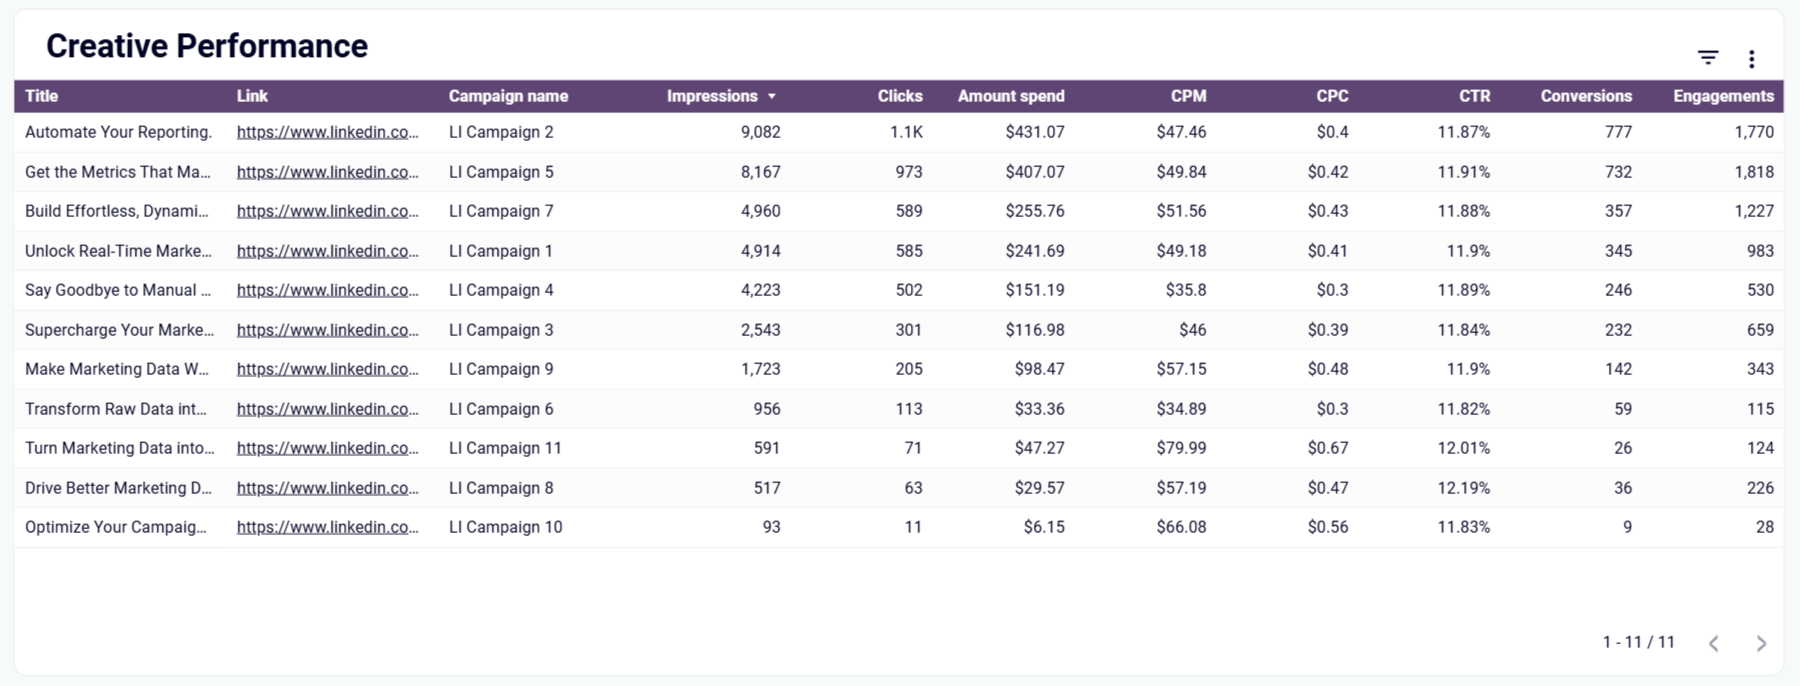
The creative performance table breaks down each ad's effectiveness across key metrics like engagements, CTR, CPM, CPC, conversions, and spend. This comprehensive view allows you to compare creative elements side-by-side, identify which content resonates most with your audience, and make data-driven decisions about creative optimization. By understanding which visuals, copy, and offers drive the strongest results, you can replicate successful elements across your campaigns.
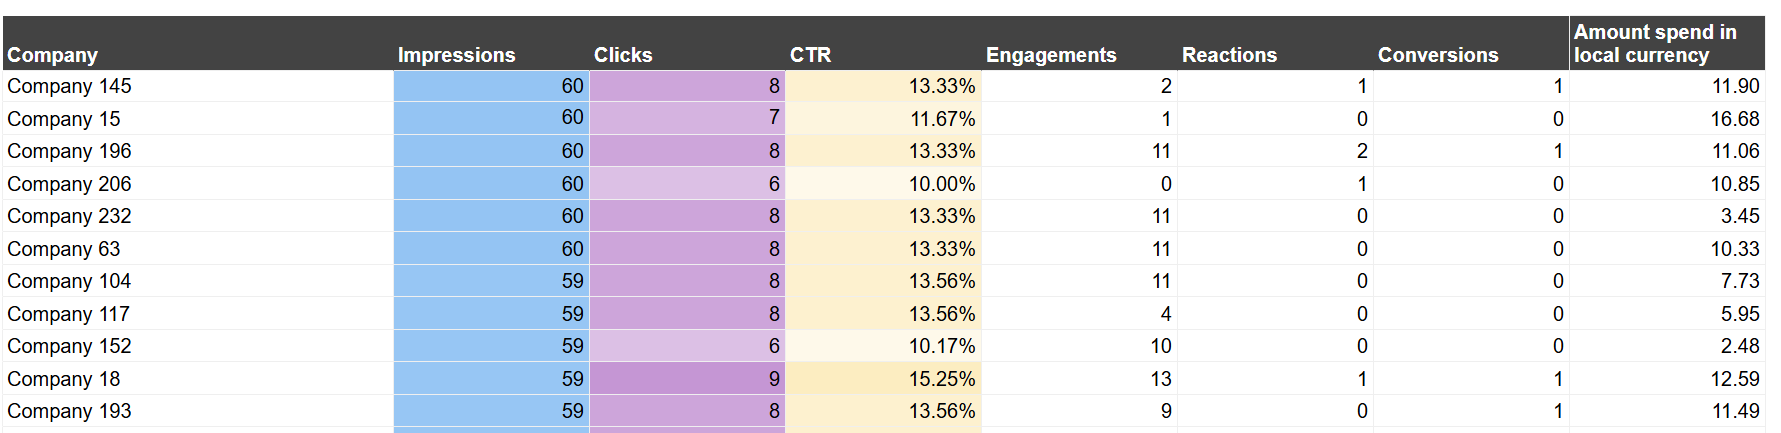
The dashboard reveals which companies are most actively engaging with your ads by analyzing impressions, clicks, and interaction patterns. This company-level visibility allows you to pinpoint high-value prospects based on their engagement intensity and frequency. By identifying organizations showing sustained interest through multiple interactions, you can prioritize sales outreach, refine targeting parameters, and allocate resources toward the most promising business relationships, creating alignment between your marketing efforts and account-based sales strategies.
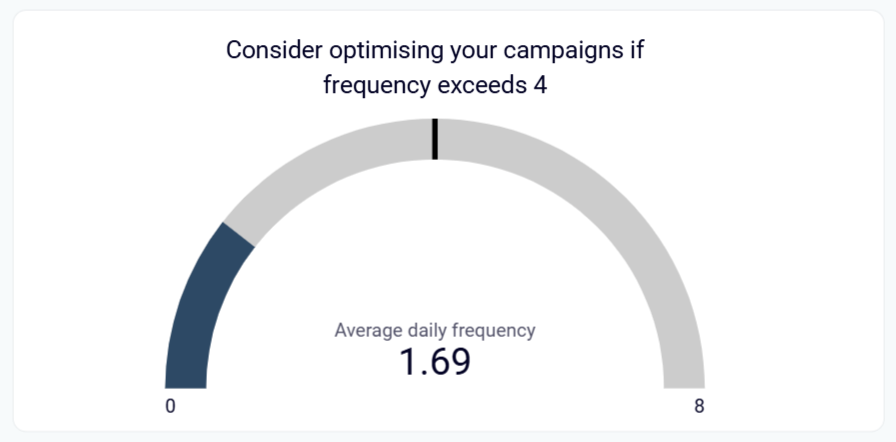
The frequency meter provides clear visibility into how often your audience sees your ads, helping you identify the optimal exposure threshold. When frequency is too low, users haven't seen your ads enough to engage; when it's too high, users may become annoyed and consider your ads spam. This insight helps you maintain the ideal frequency balance, ensuring your ads remain effective without causing negative audience reactions that could harm brand perception.
How to create a LinkedIn Ads dashboard?

Metrics you can track with a LinkedIn Ads dashboard template
Track the total number of times your LinkedIn ads were displayed to users, providing visibility into your campaign's reach and exposure. The LinkedIn ads analytics dashboard presents impression data across campaigns, time periods, audience segments, and even at the company level for B2B targeting analysis. This foundational metric helps evaluate overall campaign visibility and serves as the starting point for calculating engagement rates.
Measure how many times users clicked on your LinkedIn ads, indicating active interest in your content or offer. The LinkedIn advertising dashboard displays click trends over time, breaks down clicks by campaign and creative, and compares performance across different targeting parameters. This direct response metric helps evaluate ad relevance and creative effectiveness while serving as a key indicator of audience engagement.
Monitor your total LinkedIn advertising investment across campaigns, ad formats, and time periods. The LinkedIn ads KPI dashboard presents spend data alongside performance metrics to provide clear visibility into budget utilization and return on investment. This metric enables precise budget management, helps identify cost outliers, and ensures your LinkedIn advertising resources are allocated optimally.
Track how much you're paying for every thousand impressions your LinkedIn ads receive. The LinkedIn ads dashboard visualizes CPM trends over time and compares rates across campaigns, helping you evaluate the cost efficiency of your reach. This metric is particularly valuable for awareness-focused campaigns and provides insight into audience targeting efficiency on the LinkedIn platform.
Measure the average amount you pay for each click on your LinkedIn ads, a critical efficiency metric for performance-based campaigns. The LinkedIn ads reporting dashboard displays CPC data alongside other metrics, allowing you to identify factors that influence click costs. Understanding CPC trends helps optimize bidding strategies, improve targeting precision, and maximize the number of engaged prospects within your budget constraints.
Analyze the percentage of impressions that result in clicks, indicating how compelling your ads are to your target audience. The LinkedIn ads dashboard calculates this engagement metric automatically and presents comparative CTR data across campaigns, creatives, and time periods. This metric helps evaluate content relevance, offer appeal, and targeting accuracy while guiding optimization efforts for better audience response.
Count the number of desired actions taken by users after engaging with your LinkedIn ads, such as form submissions, content downloads, or website conversions. The LinkedIn advertising dashboard tracks conversion volume across campaigns and provides attribution analysis for multi-touch conversion paths. This outcome-focused metric directly connects your advertising efforts to business results and helps calculate return on ad spend.
Track how many users clicked to open your LinkedIn lead generation forms, indicating initial interest in your offer. The LinkedIn ads analytics dashboard compares form opens across campaigns and time periods, helping identify which ads most effectively drive prospect engagement. This mid-funnel metric provides visibility into the transition between ad clicks and lead capture, highlighting potential drop-off points in your conversion path.
Measure the percentage of users who submit your LinkedIn lead forms after opening them, revealing form effectiveness and offer appeal. The LinkedIn ads KPI dashboard calculates this critical conversion metric automatically and presents it alongside other funnel metrics for comprehensive analysis. Understanding form completion rates helps optimize form length, question sequence, and value proposition to maximize lead generation from interested prospects.