Customer acquisition dashboard examples and reporting templates
Optimize your lead generation strategy with automated customer acquisition dashboard templates that consolidate data from CRM platforms, advertising channels, and analytics tools. Track the complete customer journey from initial impressions to final conversions while identifying the most effective channels and campaigns driving qualified leads to your business.
Customer acquisition dashboard examples for every need


 +1
+1


 +3
+3

 +3
+3

about your case. It doesn't cost you a penny 😉
Choose your white label customer acquisition dashboard to kick off
What is a customer acquisition dashboard?
Modern acquisition reporting goes beyond basic lead counts to show the relationship between marketing spend and actual revenue generated from each channel. With automated data integration through Coupler.io, these dashboards eliminate manual reporting tasks while providing real-time visibility into funnel performance, enabling marketing teams to optimize their strategies based on accurate conversion data rather than assumptions.

What reports should be included in Customer acquisition dashboards?
A comprehensive customer acquisition dashboard should include several key reports that provide complete visibility into your lead generation and conversion process. Based on our analysis of HubSpot and Pipedrive-based customer acquisition dashboards, we recommend incorporating these four essential report types that track the entire customer journey from initial marketing touchpoints through final conversions.
The multi-channel funnel report forms the foundation of effective customer acquisition reporting by visualizing the complete lead journey across all marketing touchpoints. This report combines impression data from advertising platforms with website traffic metrics from Google Analytics and lead conversion data from your CRM system. It reveals how prospects move from initial awareness through consideration to final conversion, highlighting drop-off points and optimization opportunities. The report enables teams to compare conversion rates at each funnel stage against industry benchmarks, identifying where improvements can generate the greatest impact on overall acquisition performance.
Channel performance reporting provides detailed analysis of how different marketing channels contribute to lead generation and customer acquisition success. This report tracks metrics from organic search, paid advertising, social media, email marketing, and referral sources to determine which channels deliver the highest quality leads and best return on investment. The attribution component shows how multiple touchpoints work together in the customer journey, helping teams understand the true value of each marketing channel and make informed decisions about budget allocation and campaign optimization strategies.
Geographic acquisition reporting reveals how customer acquisition performance varies across different regions, countries, and markets. This report analyzes lead generation patterns, conversion rates, and customer lifetime value by location, enabling teams to identify high-performing markets and expansion opportunities. The geographic breakdown helps optimize targeting strategies, adjust messaging for different regions, and allocate marketing budgets based on regional performance data to maximize acquisition efficiency in each market.
Campaign ROI reporting tracks the relationship between marketing spend and acquisition results across all channels and campaigns. This report compares advertising costs with lead generation volume, conversion rates, and customer acquisition costs to identify the most cost-effective marketing investments. The spend efficiency analysis helps teams optimize budget allocation, pause underperforming campaigns, and scale successful initiatives to maximize the return on marketing investments while maintaining acquisition quality and volume targets.
What insights you can get with the Customer acquisition dashboard
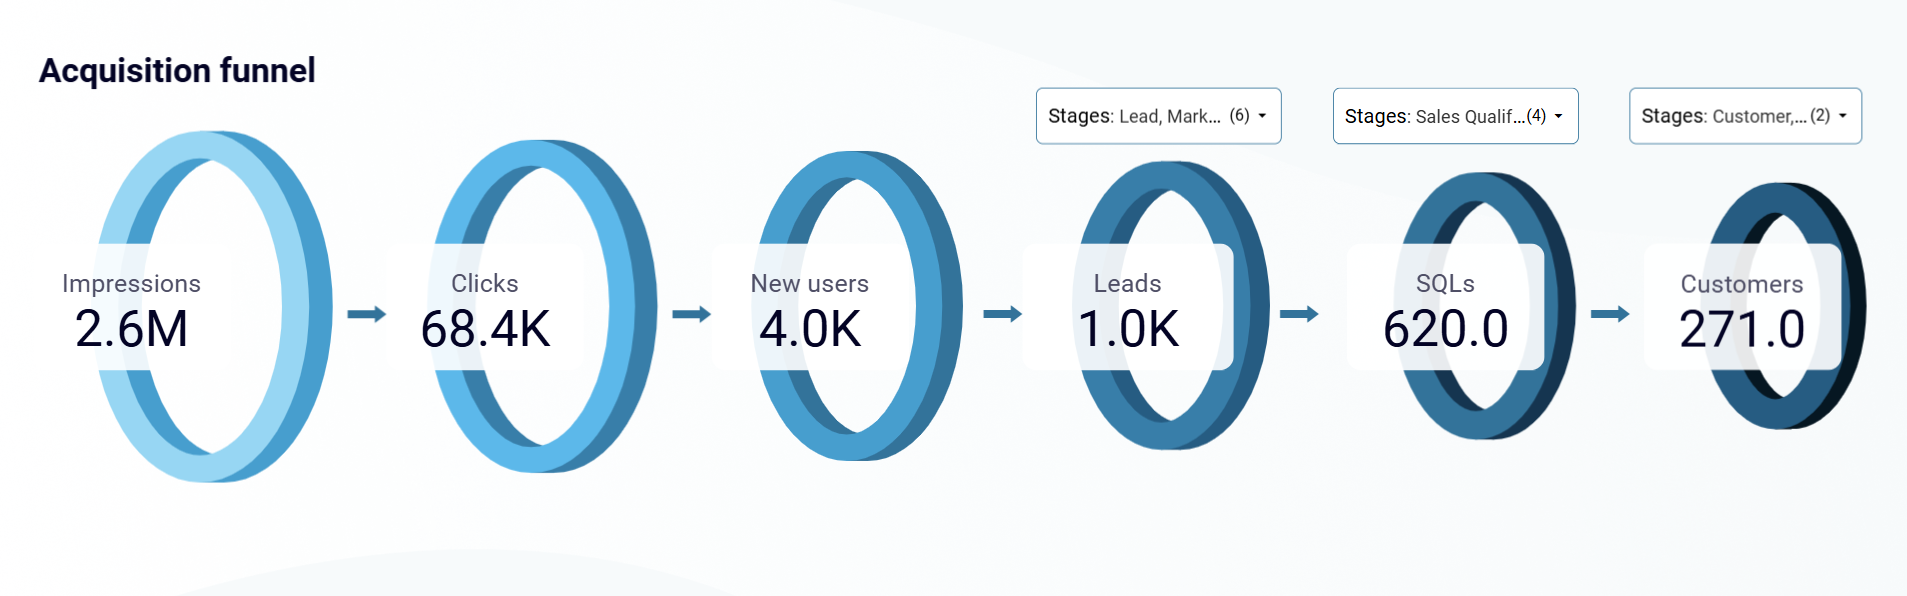
Track the complete customer journey from advertising impressions through website visits to CRM conversions with detailed breakdowns at each stage. The dashboard reveals conversion rates between funnel steps, helping identify bottlenecks and optimization opportunities. Compare your performance against industry benchmarks to understand where improvements can generate the greatest impact on lead generation success.
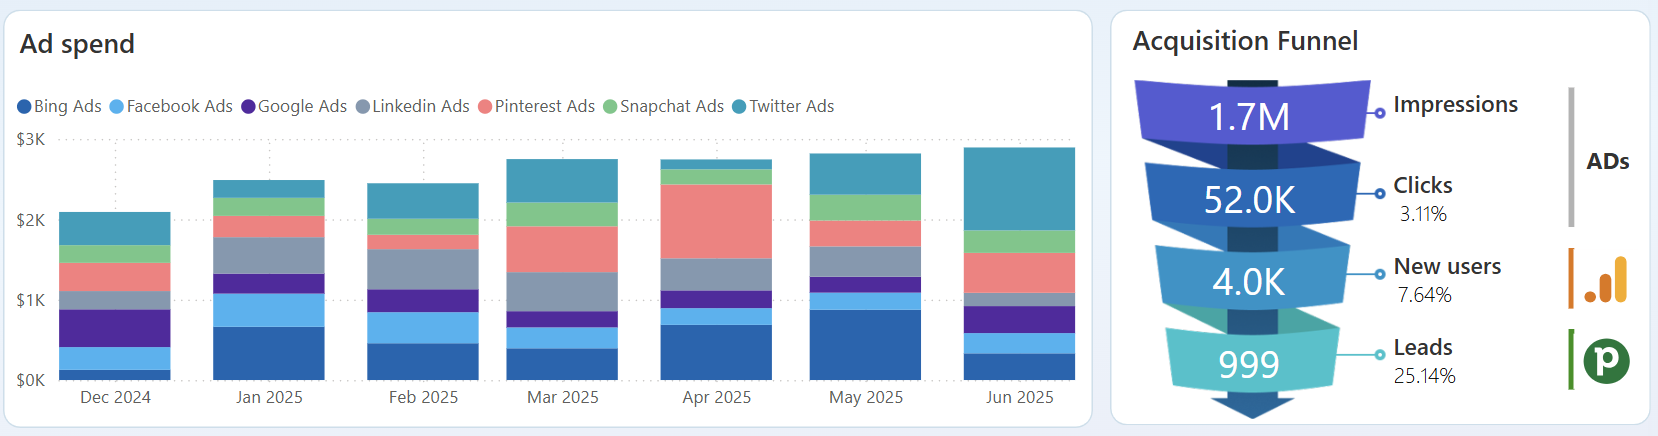
Analyze how marketing investments translate into qualified leads and customers across different platforms and campaigns. The dashboard compares advertising costs with conversion outcomes, revealing which channels deliver the best return on investment. Identify underperforming campaigns that drain budget without generating quality leads, enabling smarter allocation of marketing resources.

Monitor acquisition trends through month-over-month analysis to identify seasonal patterns, campaign impacts, and growth opportunities. Track how conversion rates fluctuate across different time periods and correlate performance changes with specific marketing activities. Use historical data to forecast future acquisition volume and plan marketing investments accordingly.
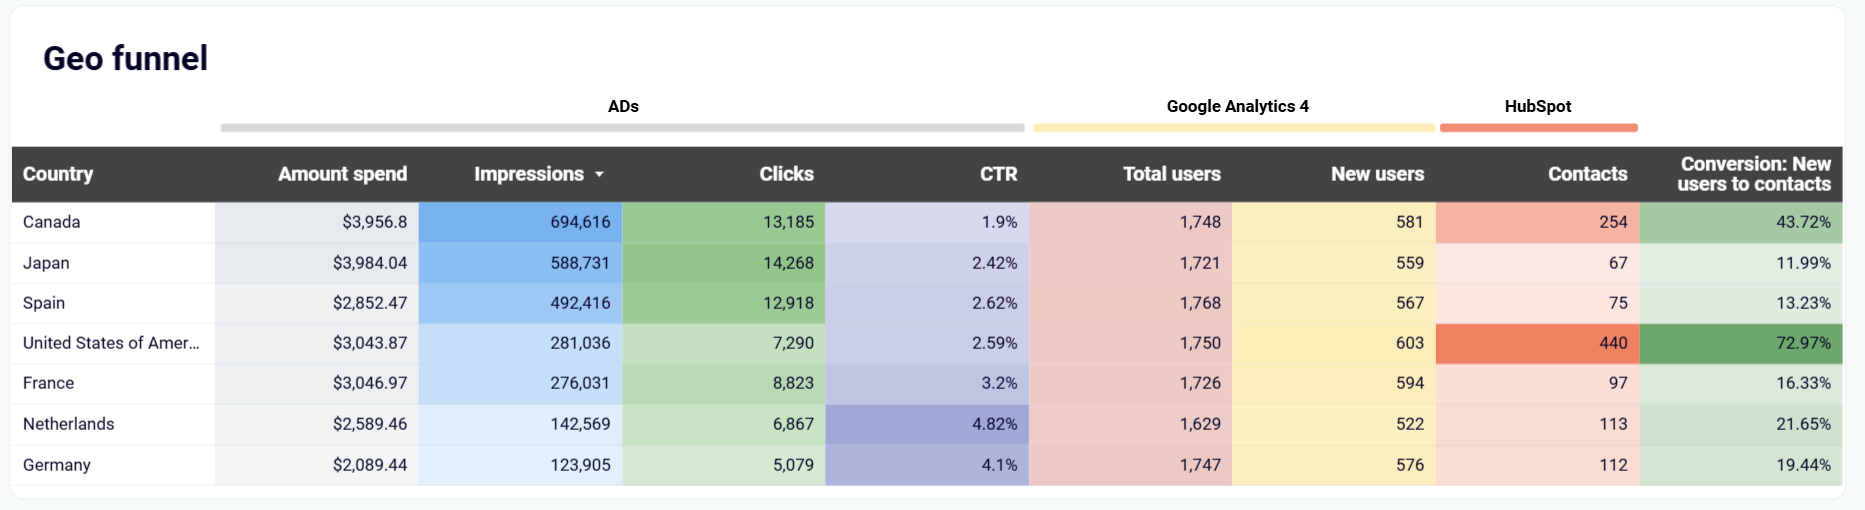
Understand how customer acquisition effectiveness varies across different regions and markets with location-specific conversion analysis. The dashboard shows which geographic areas generate the highest quality leads and best conversion rates. Apply regional filters to assess funnel performance in specific countries, enabling targeted optimization strategies for different markets.
How to create a customer acquisition dashboard?

Metrics you can track with a customer acquisition dashboard template
Monitor the total number of times your ads were displayed across all advertising platforms including Google Ads, Facebook Ads, and LinkedIn Ads. Track impression trends over time to understand your campaign reach and brand visibility across different channels and audiences.
Track the number of users who clicked on your advertisements across all connected platforms. Monitor click performance to evaluate ad engagement and identify which campaigns and channels generate the most interest from your target audience.
Analyze your total advertising investment across all platforms and campaigns. Track spending patterns over time to understand budget allocation efficiency and identify opportunities to optimize your marketing investments for better acquisition results.
Monitor the complete volume of website visitors generated from your marketing efforts using Google Analytics 4 data. Track user trends to understand how your advertising campaigns translate into actual website traffic and engagement.
Track first-time visitors to your website to measure your ability to attract fresh prospects through your marketing channels. This metric helps evaluate the effectiveness of your campaigns in expanding your audience reach.
Monitor leads entering your CRM system from all marketing touchpoints and channels. Track lead generation volume over time to understand which campaigns and sources deliver qualified prospects to your sales pipeline.
Measure how effectively prospects move through each stage of your acquisition process, from initial impressions to final CRM conversions. Compare conversion performance across different channels to identify the most efficient acquisition paths.
Track which marketing channels and sources contribute to lead generation and customer acquisition success. Analyze attribution data to understand how different touchpoints work together in the customer journey and optimize budget allocation accordingly.