Pipedrive dashboard examples and reporting templates
Transform your sales data into actionable insights with automated Pipedrive reporting dashboards that consolidate CRM data with marketing analytics. Monitor deal progression, track revenue forecasts, analyze team performance, and optimize your sales funnel from lead generation to closed deals with real-time visibility across your entire sales process.
Pipedrive dashboard examples for every need


 +1
+1


 +3
+3

 +3
+3
about your case. It doesn't cost you a penny 😉
Choose your white label Pipedrive dashboard to kick off
What is a Pipedrive dashboard?
With automated data refreshing through Coupler.io, your sales team gains instant access to current pipeline health, revenue forecasts, and individual performance metrics without manual data compilation or spreadsheet management.

What reports should be included in Pipedrive dashboards?
Building an effective Pipedrive dashboard requires the selection of reports that address different aspects of your sales operation. Based on our analysis of successful sales teams, we recommend incorporating these four essential report categories that provide complete pipeline visibility and actionable performance insights.
The customer acquisition report bridges marketing efforts with sales outcomes by tracking leads from their first interaction through deal closure. This report combines data from advertising platforms, website analytics, and Pipedrive to show how marketing spend translates into qualified prospects. It reveals which channels generate leads that actually convert to customers, identifies bottlenecks in the lead qualification process, and calculates the true cost of customer acquisition across different marketing sources.
The sales performance report monitors individual and team metrics including deal velocity, win rates, and revenue attribution over time. It tracks how deals progress through each pipeline stage and identifies patterns in successful closures versus losses. This report highlights seasonal trends, reveals which deal types or sources have the highest success rates, and shows how external factors like campaigns or market conditions impact sales results.
The pipeline health report provides real-time visibility into deal distribution across stages, aging analysis, and probability-weighted forecasting. It identifies deals that have stalled beyond normal progression times and flags opportunities requiring immediate attention. This report shows which pipeline stages create bottlenecks, tracks the average time deals spend at each phase, and calculates conversion rates between stages.
The team performance report analyzes individual sales representative metrics to identify top performers and coaching opportunities. It compares win rates, deal sizes, sales cycle lengths, and activity levels across team members while accounting for territory or market differences. This report reveals which strategies drive the highest success rates, identifies skill gaps that impact performance, and tracks how individual contributions support overall team goals.
What insights you can get with the Pipedrive dashboard
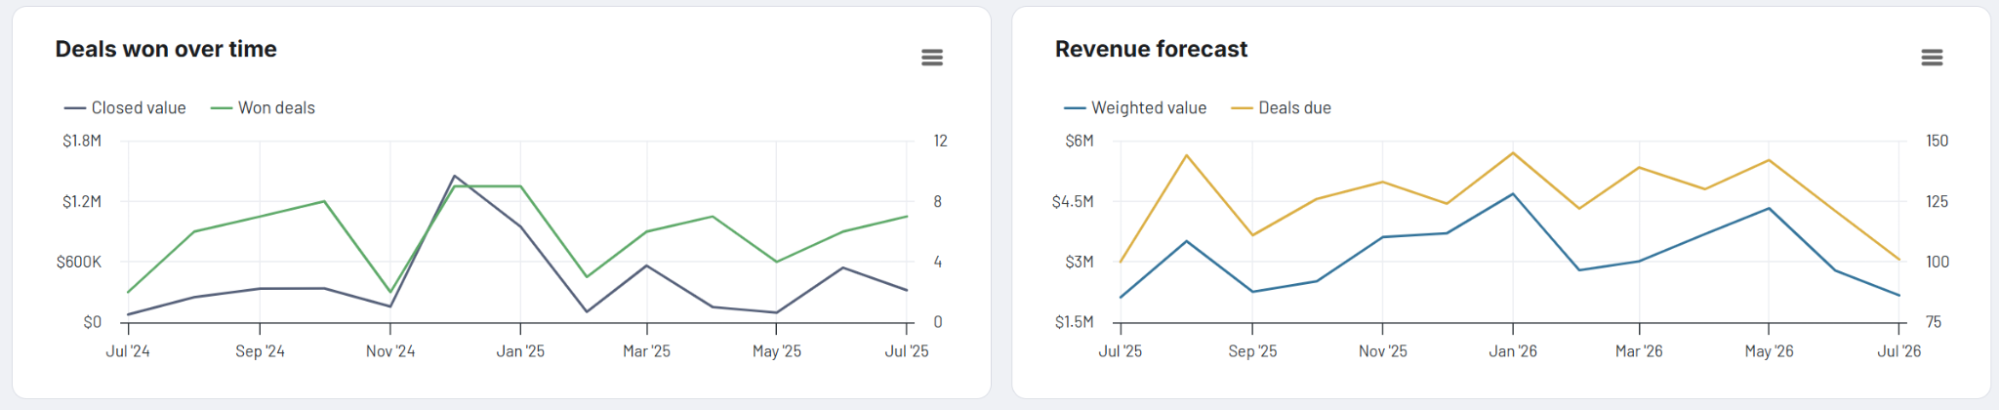
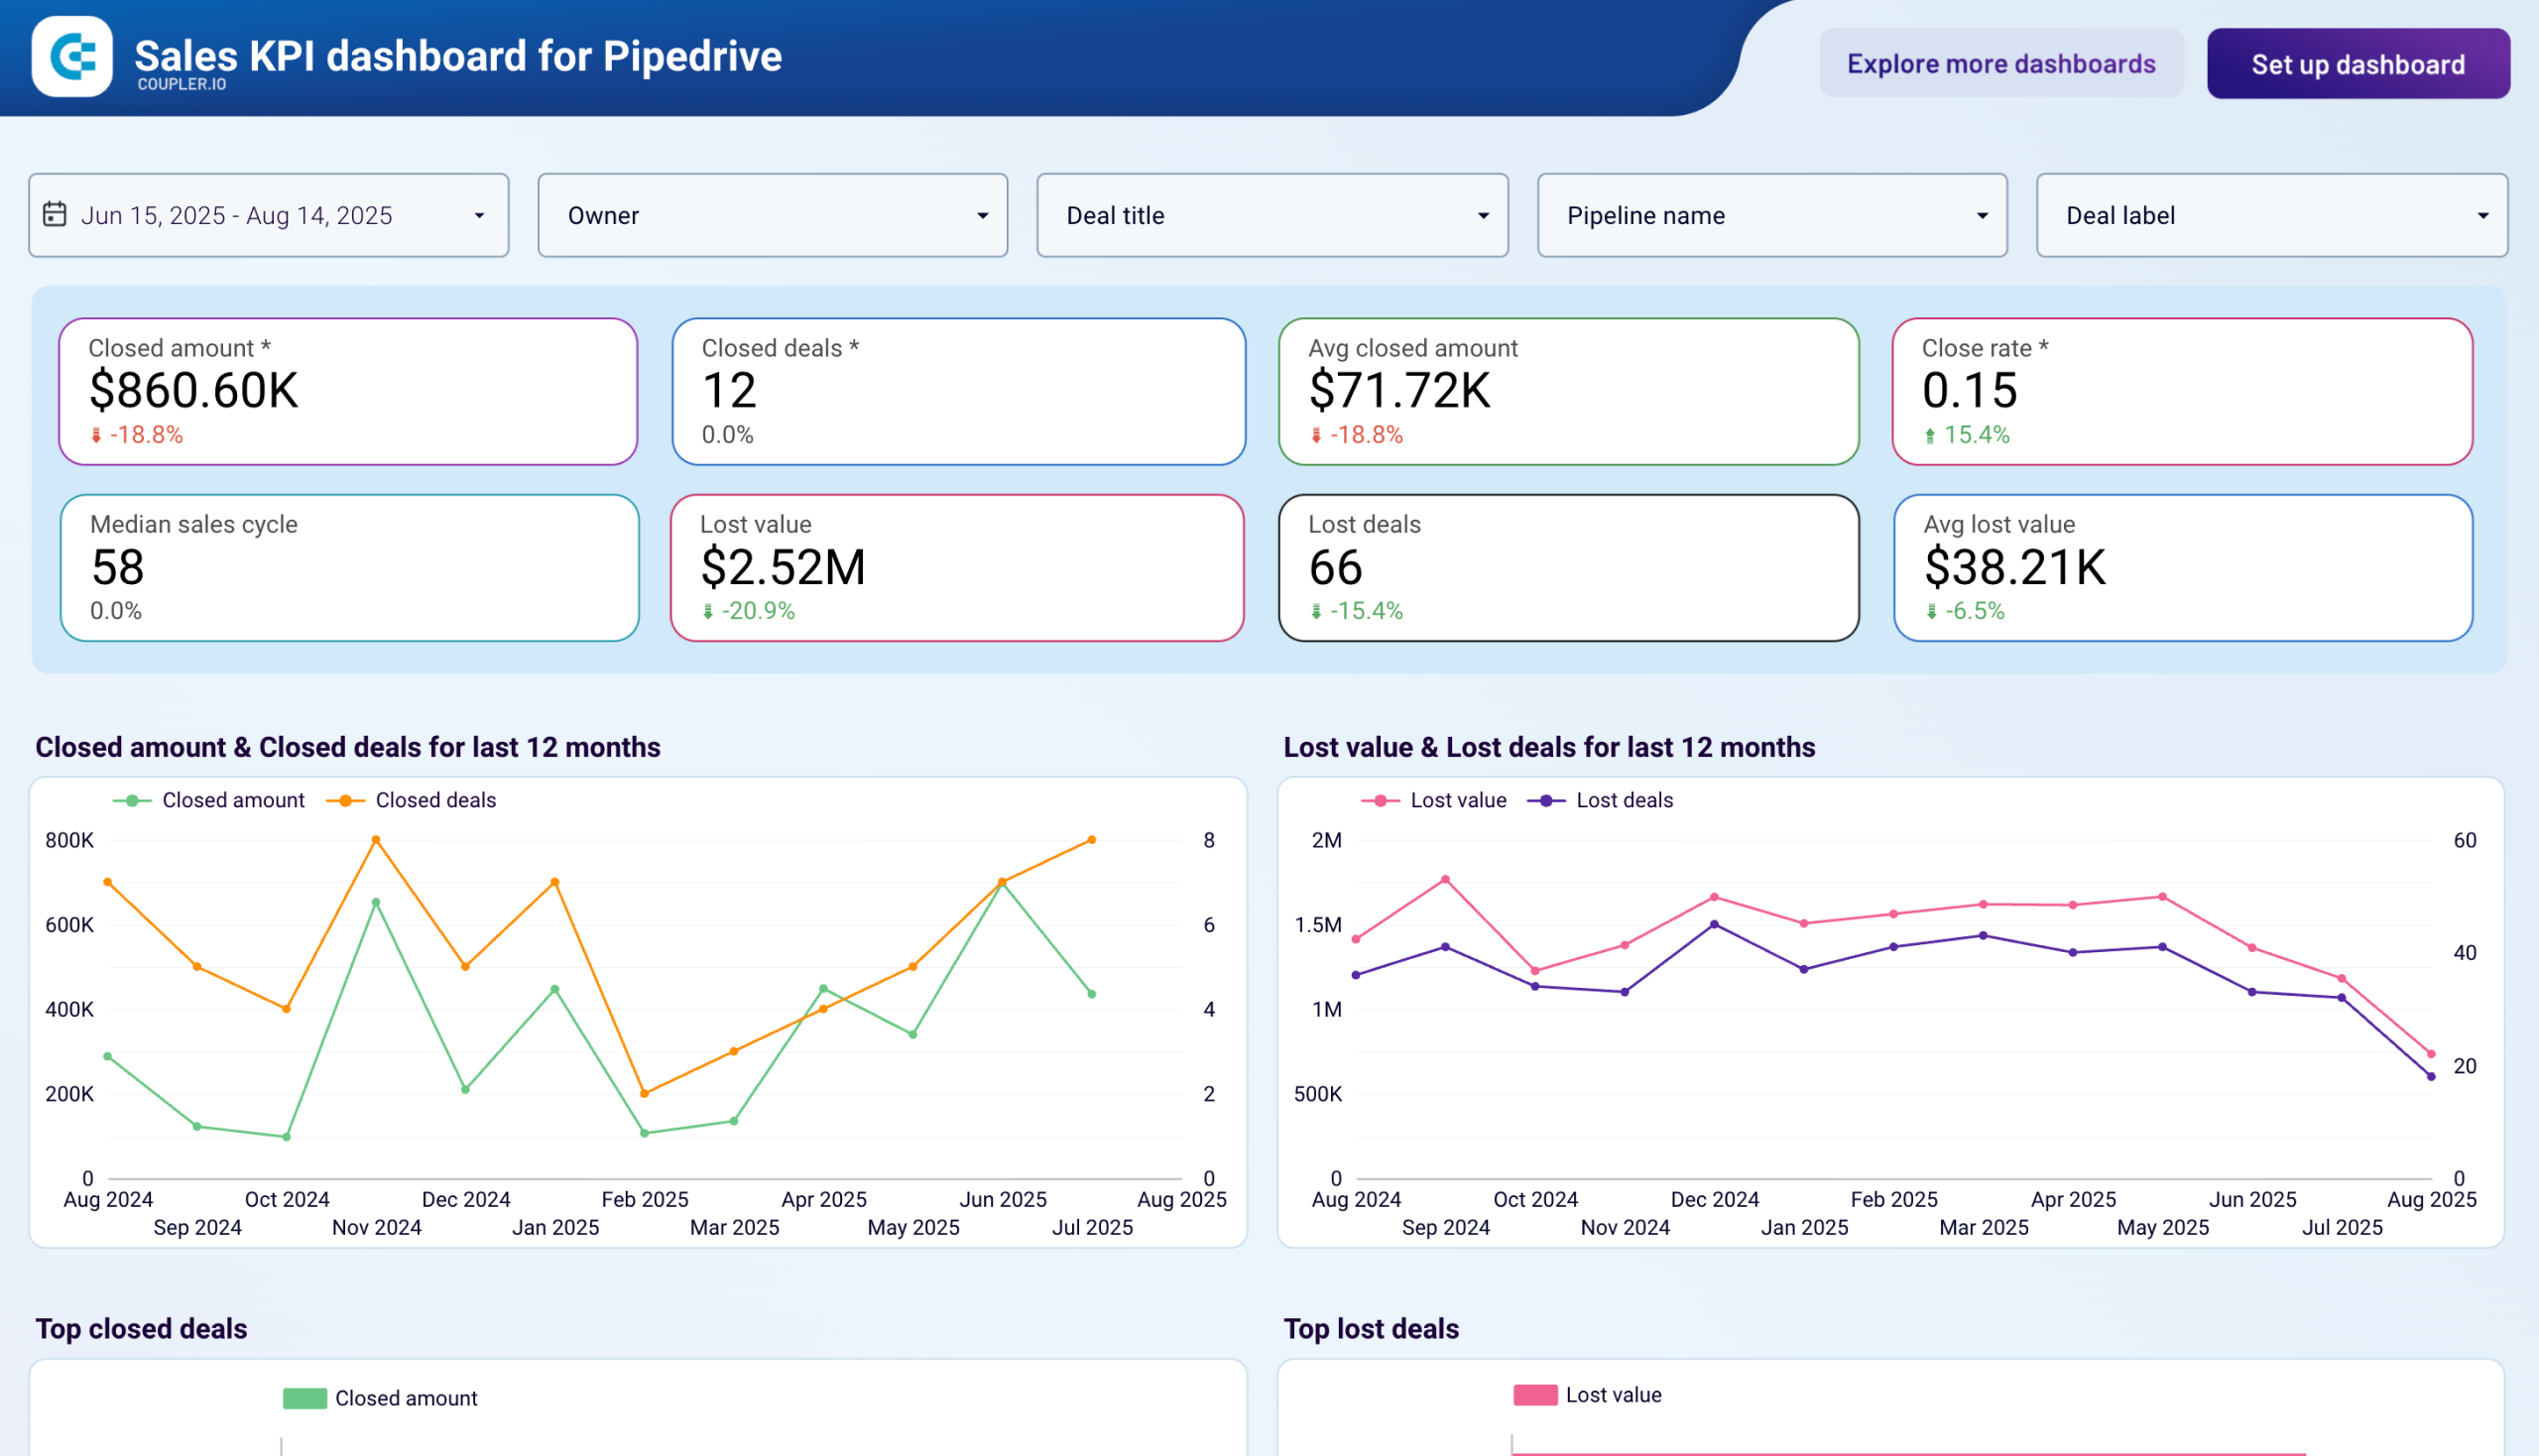
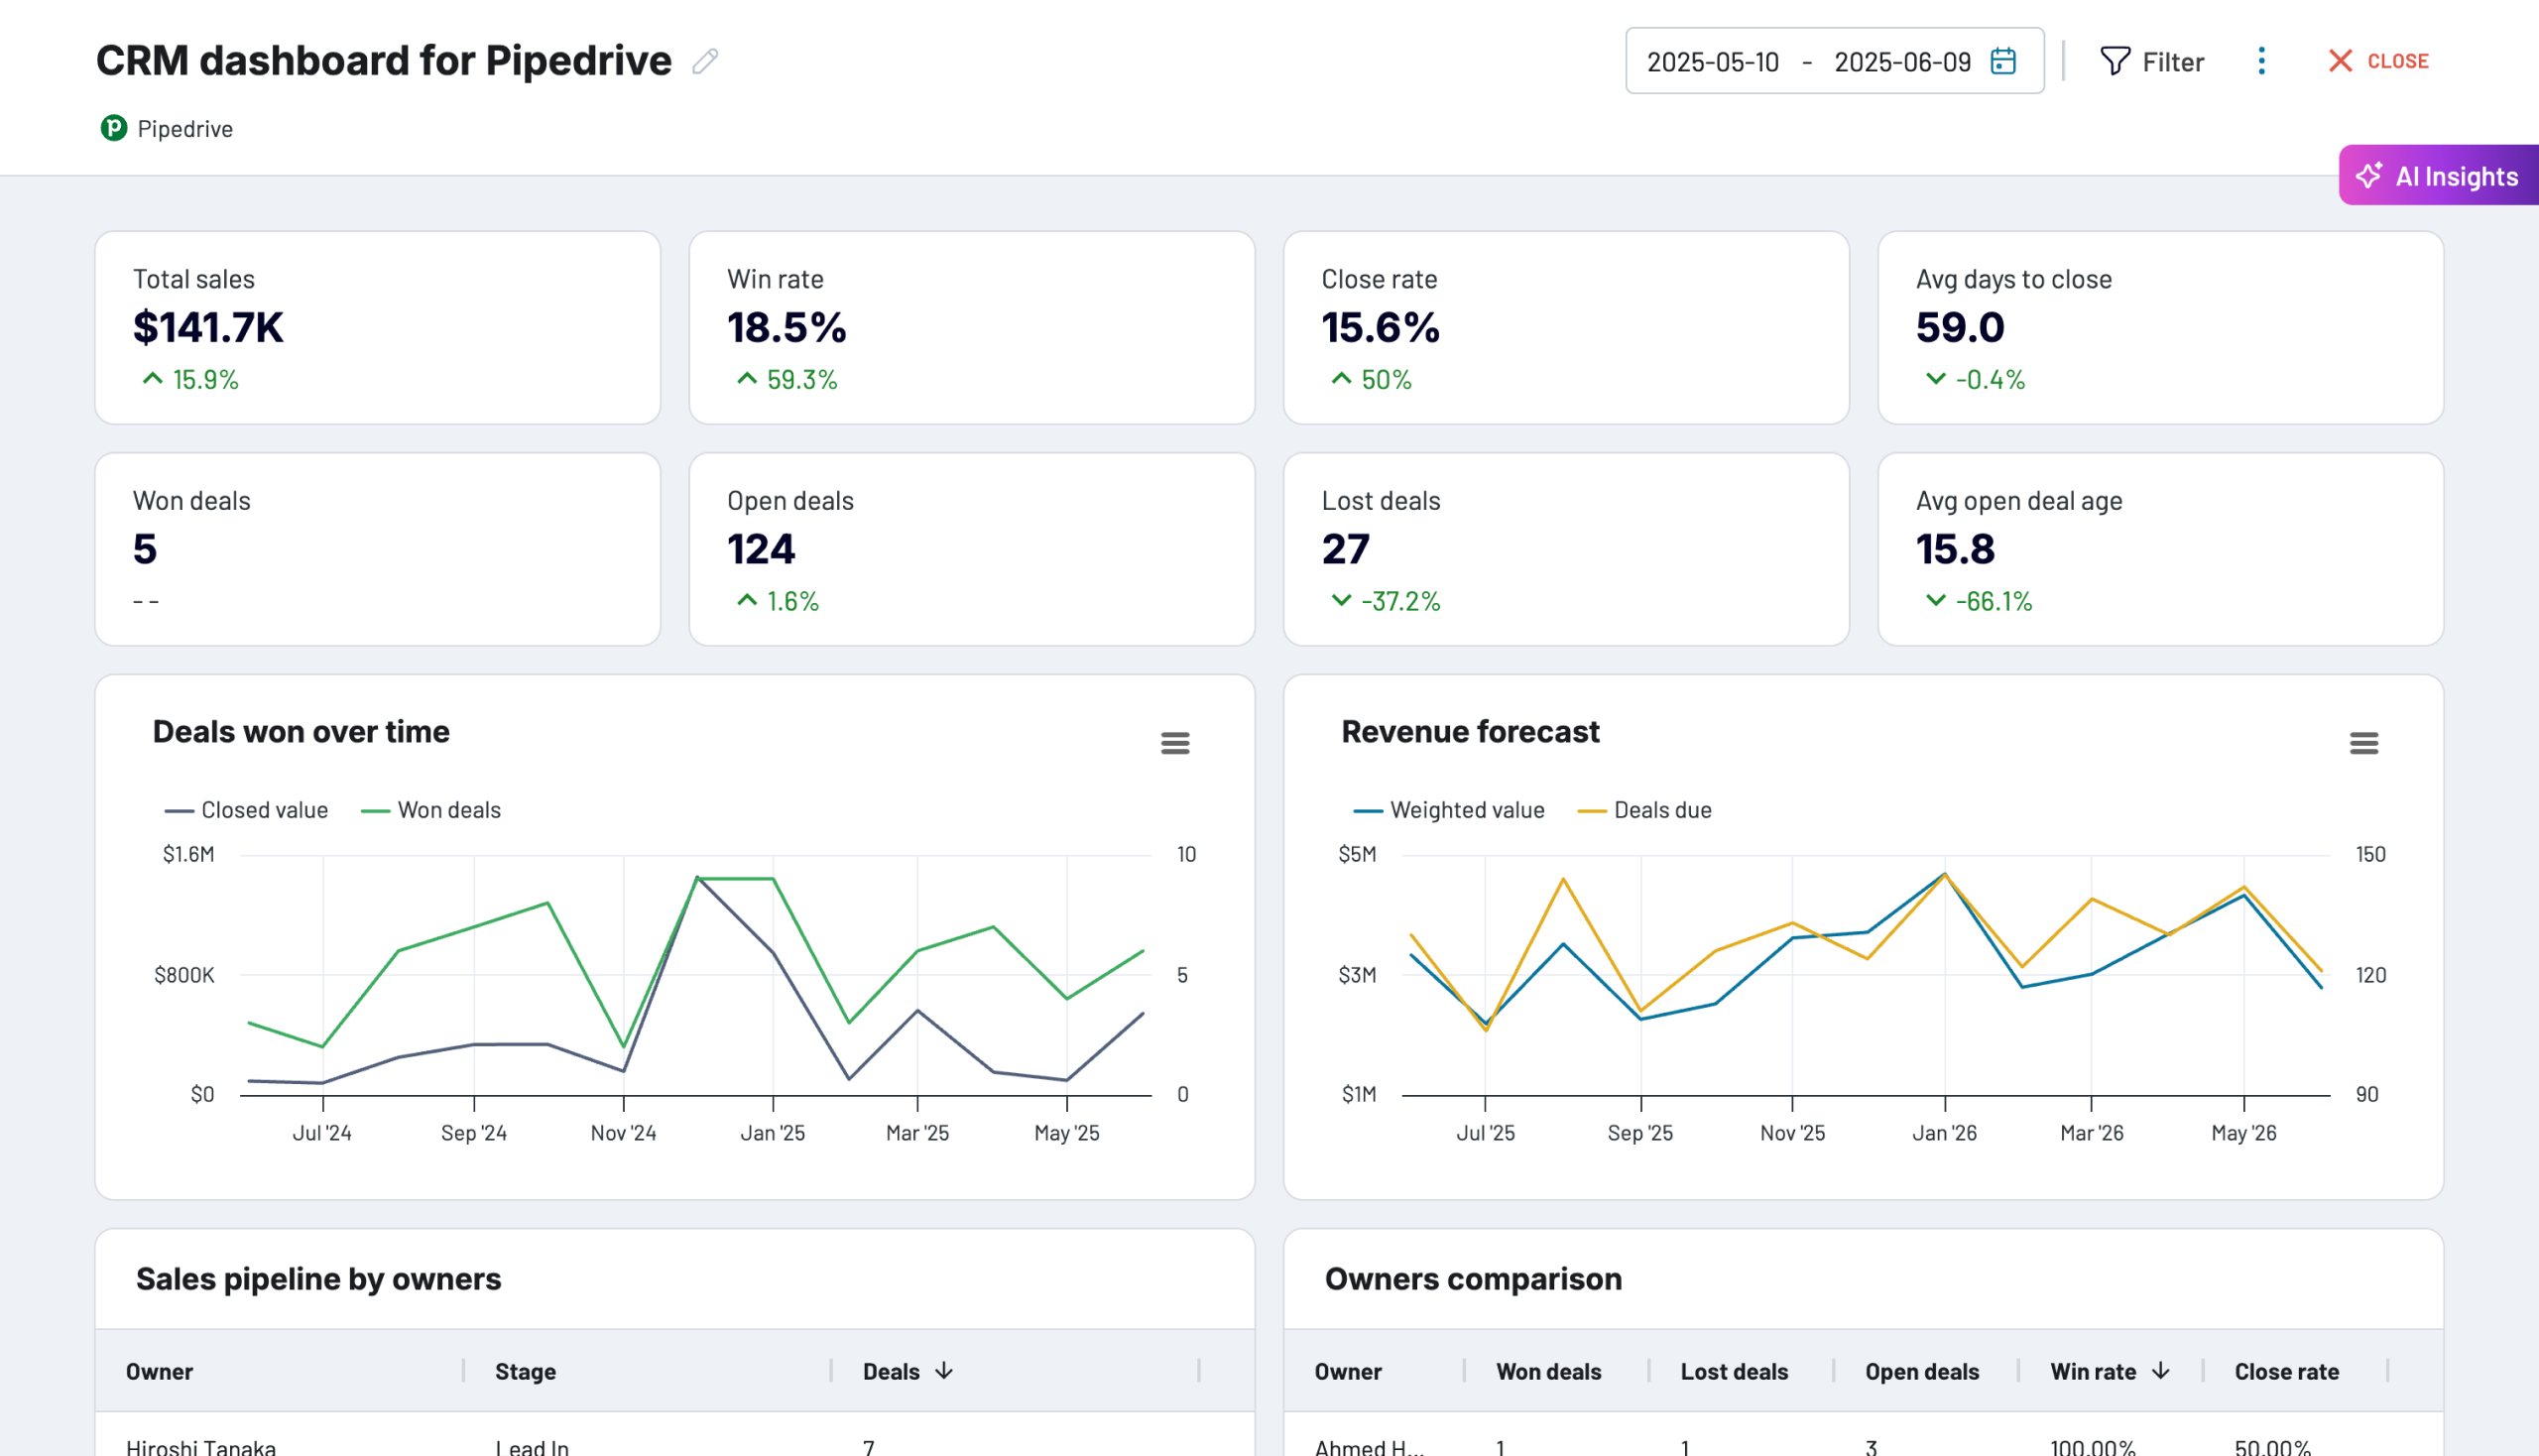
Monitor your sales pipeline health with detailed tracking of deals won over time and weighted revenue predictions. The dashboard displays closed deal values alongside the number of successful transactions, revealing patterns in your sales velocity and helping identify seasonal trends or market impacts on performance. Revenue forecasting combines probability-weighted deal values with historical closure patterns to provide accurate predictions for upcoming periods, enabling better resource planning and goal setting.
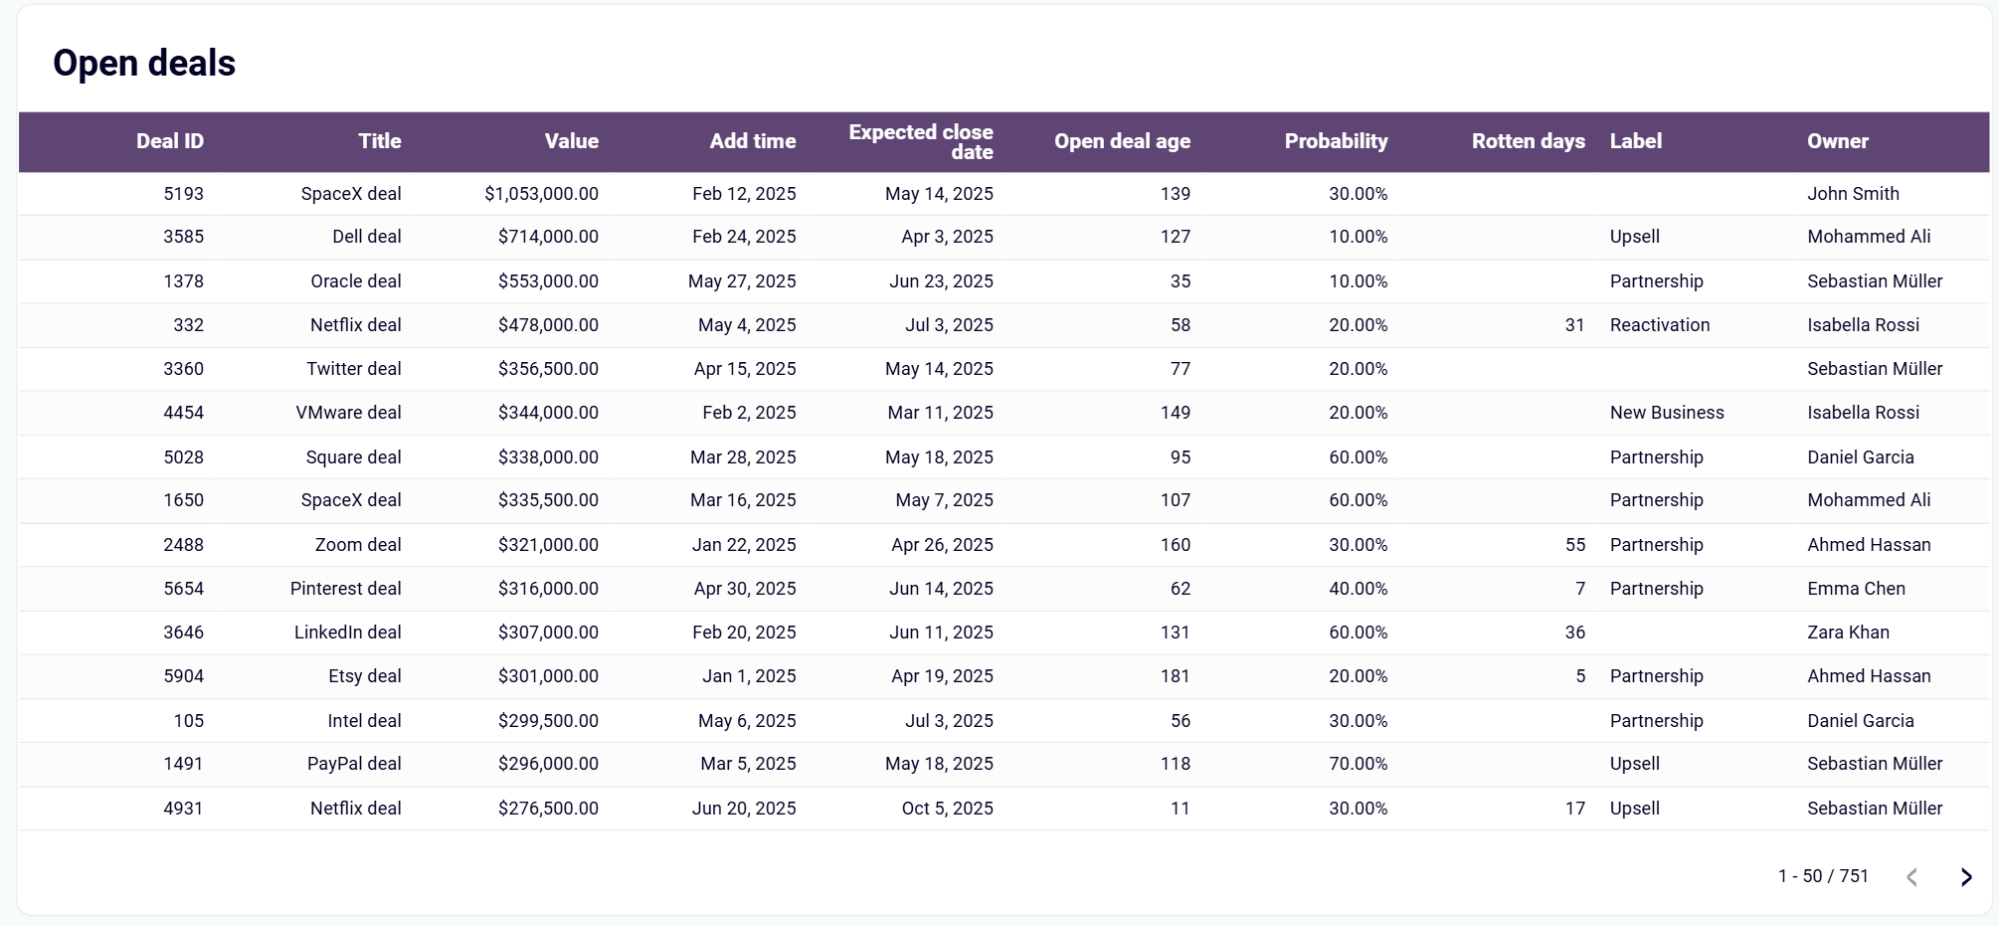
Track all active opportunities with detailed visibility into deal values, probability ratings, aging metrics, and ownership assignments across your entire pipeline. The dashboard displays critical information, including expected close dates, time since deal creation, and rotten days indicators that highlight stalled opportunities requiring immediate attention. This comprehensive view enables sales managers to identify high-value deals at risk, prioritize follow-up activities, and prevent revenue slippage through proactive deal management.
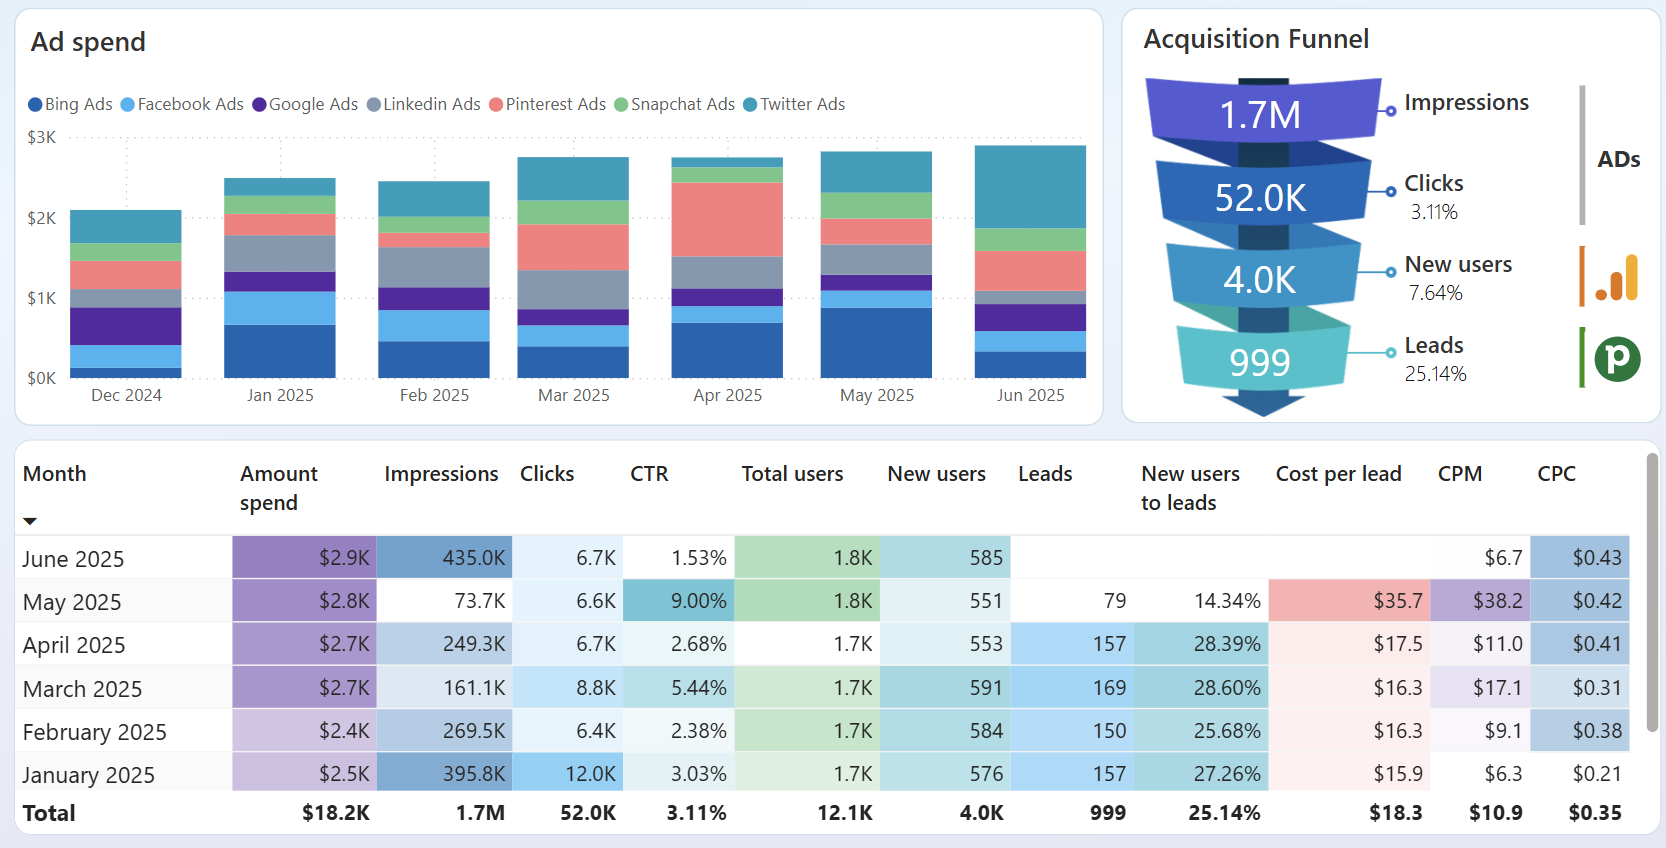
Track the complete journey from marketing touchpoints to closed deals by combining advertising data with Pipedrive CRM information. The dashboard shows how marketing spend across platforms like Google Ads and Facebook Ads translates into qualified leads and eventual customers. Month-over-month analysis reveals which campaigns and channels generate the highest-value prospects, enabling better budget allocation and more effective lead generation strategies.
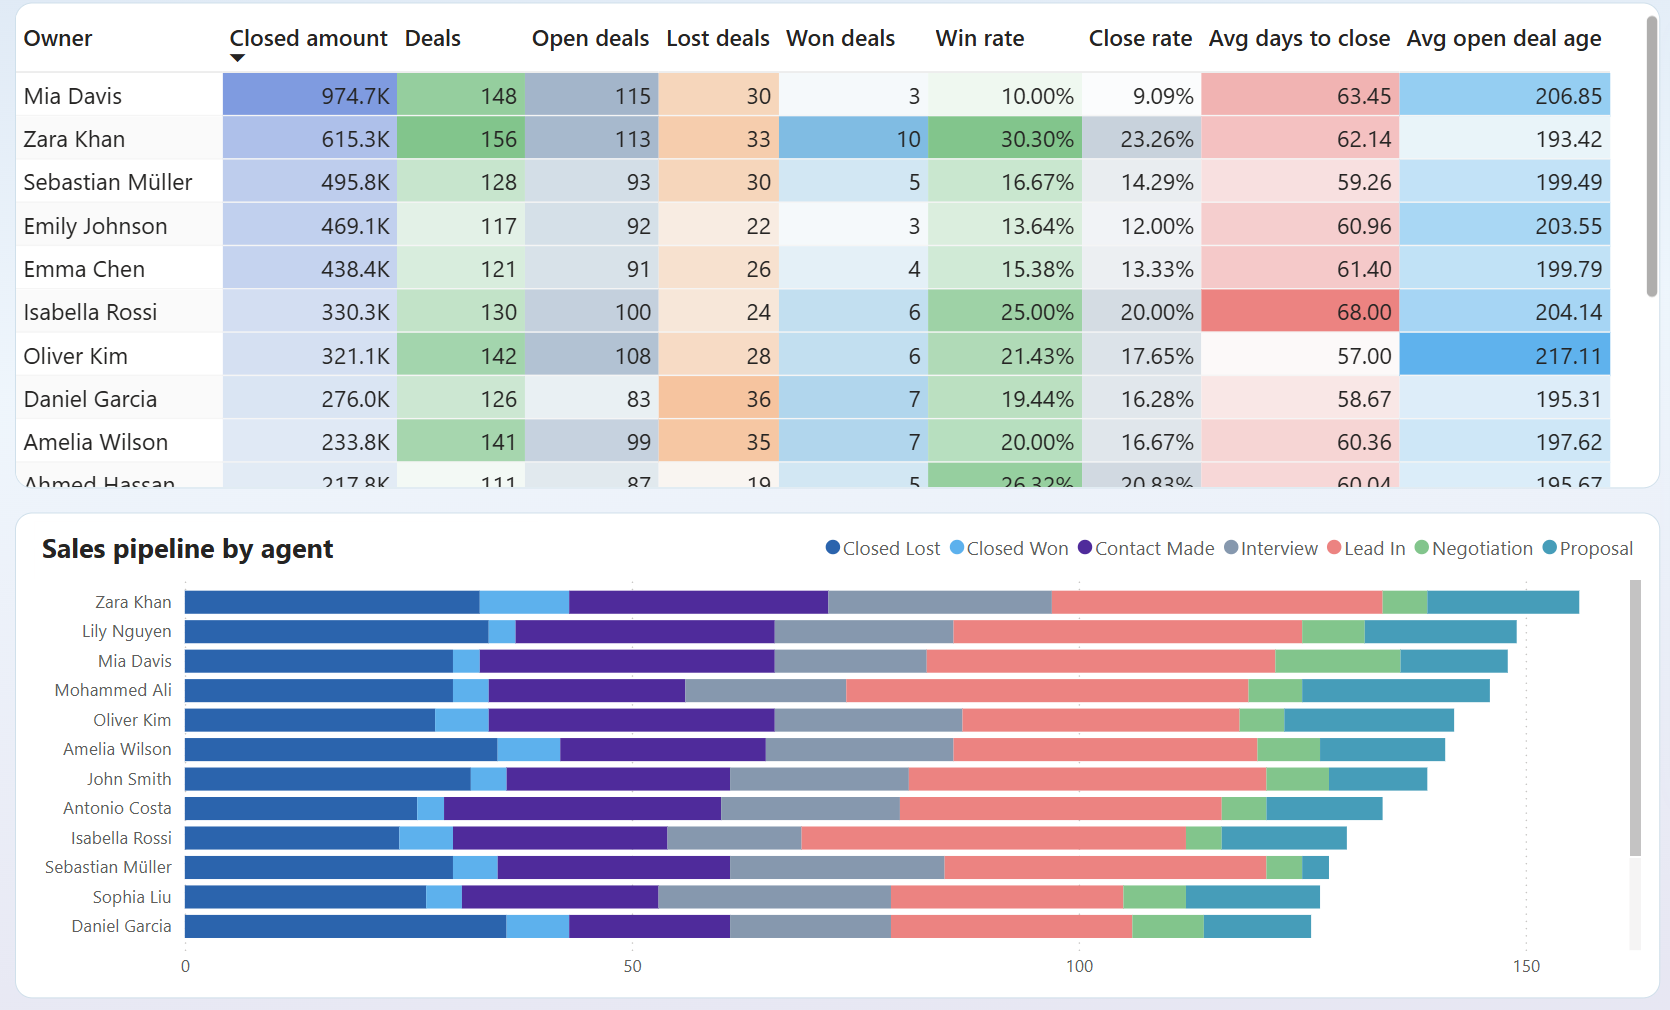
Compare team member performance across key metrics, including closed amounts, win rates, deal counts, and average sales cycle length. The dashboard provides detailed breakdowns showing each representative's pipeline distribution across different deal stages, helping identify top performers and coaching opportunities. Visual pipeline analysis reveals how different team members manage their deals and which approaches lead to higher success rates.
How to create a Pipedrive dashboard?

Metrics you can track with Pipedrive dashboard templates
Monitor the total number of successfully completed deals alongside their monetary value, providing comprehensive visibility into sales success across different time periods, team members, and deal sources. This metric reveals both volume and value trends, enabling analysis of deal size patterns and identification of high-performing periods or representatives.
Track deals that didn't result in closure along with their potential monetary value, helping identify revenue at risk and patterns in lost opportunities. This metric reveals which deal types, sources, or stages are most vulnerable to loss, enabling targeted improvements to sales processes and strategies.
Calculate the mean value of successfully closed deals to understand typical transaction sizes and identify opportunities for deal expansion or upselling. This metric helps set realistic revenue expectations, evaluate performance against benchmarks, and identify representatives or strategies that consistently achieve higher deal values.
Measure the percentage of deals that result in successful closures compared to total opportunities, calculated across different time periods and sales representatives. This metric reveals the effectiveness of your sales process and individual performance levels, helping identify which strategies and approaches lead to higher conversion rates.
Track the overall percentage of deals that reach closure regardless of outcome, comparing won and lost deals against total opportunities created. This metric provides insight into sales process efficiency and helps identify whether opportunities are being properly qualified before entering the pipeline.
Analyze the middle value of sales cycle lengths to understand typical deal progression timelines without skewing from extremely long or short cycles. This metric provides more accurate forecasting than averages and helps identify realistic expectations for deal closure timing across different deal types and sizes.
Calculate the mean monetary value of deals that didn't close successfully, revealing the typical revenue impact of lost opportunities. This metric helps quantify the cost of sales process inefficiencies and prioritize improvements that could recover the highest value lost deals.
Measure the typical length of your sales cycle from initial opportunity creation to deal closure, with analysis by deal size, source, and sales representative. This metric helps forecast revenue timing, identify process inefficiencies, and set realistic expectations for prospect progression through your pipeline.