Google Ads dashboard examples and reporting templates
Gain complete visibility into your advertising performance with our automated Google Ads reporting dashboard that consolidates data from all your campaigns. Track keyword metrics, analyze ad creatives, monitor quality scores, and make strategic decisions based on real-time insights from your Google Ads platform.
Google Ads dashboard examples for every need


 +3
+3


 +6
+6


 +5
+5
 +6
+6

 +3
+3
 +1
+1
 +4
+4
 +4
+4
 +2
+2
 +2
+2

 +5
+5
 +4
+4
 +5
+5
 +5
+5
 +3
+3

 +1
+1
 +3
+3

 +1
+1
 +3
+3
 +3
+3
 +2
+2

 +1
+1

 +1
+1


 +2
+2
 +3
+3

 +4
+4


about your case. It doesn't cost you a penny 😉
Choose your Google Ads dashboard template to kick off
What is a Google Ads performance dashboard?
Google Ads dashboards track essential metrics like impressions, clicks, CTR, CPC, conversions, and quality scores, allowing you to identify underperforming campaigns, optimize budget allocation, and improve ROI. With automated data refreshing through Coupler.io, these dashboards ensure you're always working with the most up-to-date performance data without manual exports or complex data manipulation. They serve as a single source of truth for your paid search strategy, enabling faster, data-driven optimizations.

What reports should be included on a meaningful Google Ads reporting dashboard?
A comprehensive Google Ads dashboard should incorporate several key reports that provide complete visibility into your advertising performance. Based on our analysis of PPC dashboards, we recommend including these four essential report types:
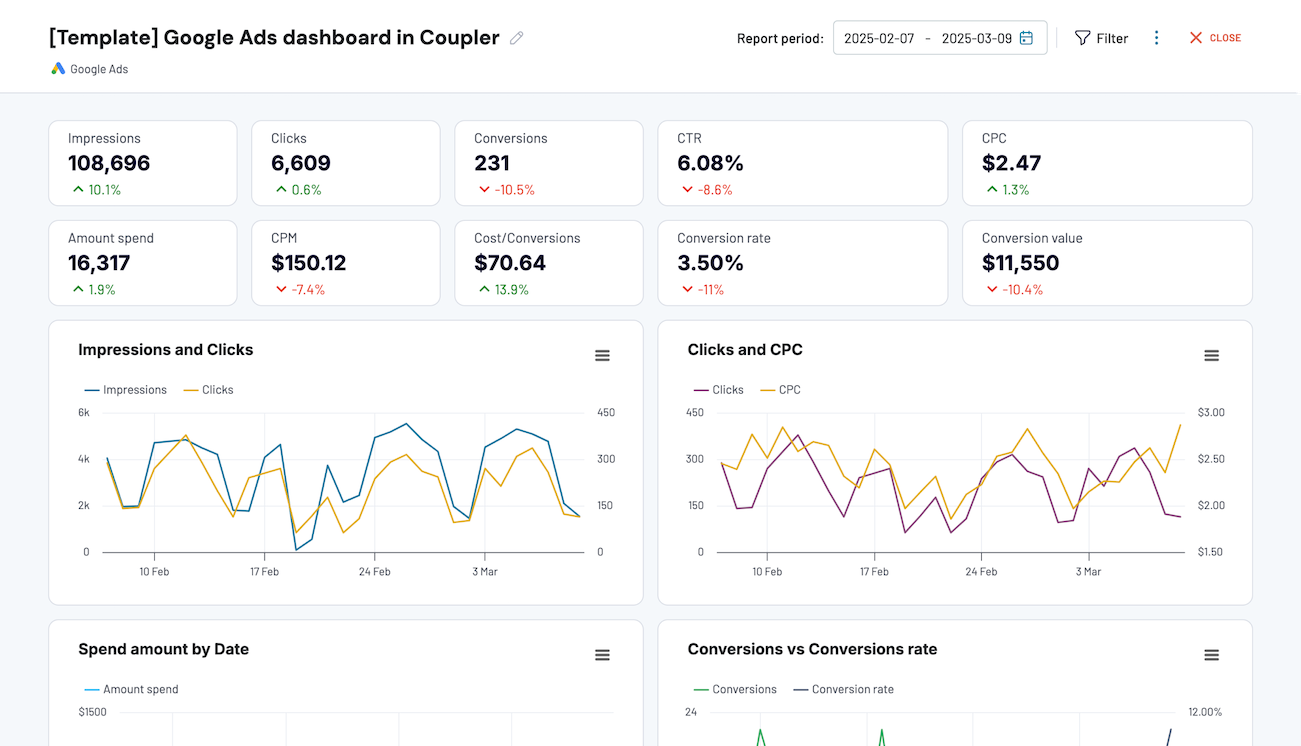
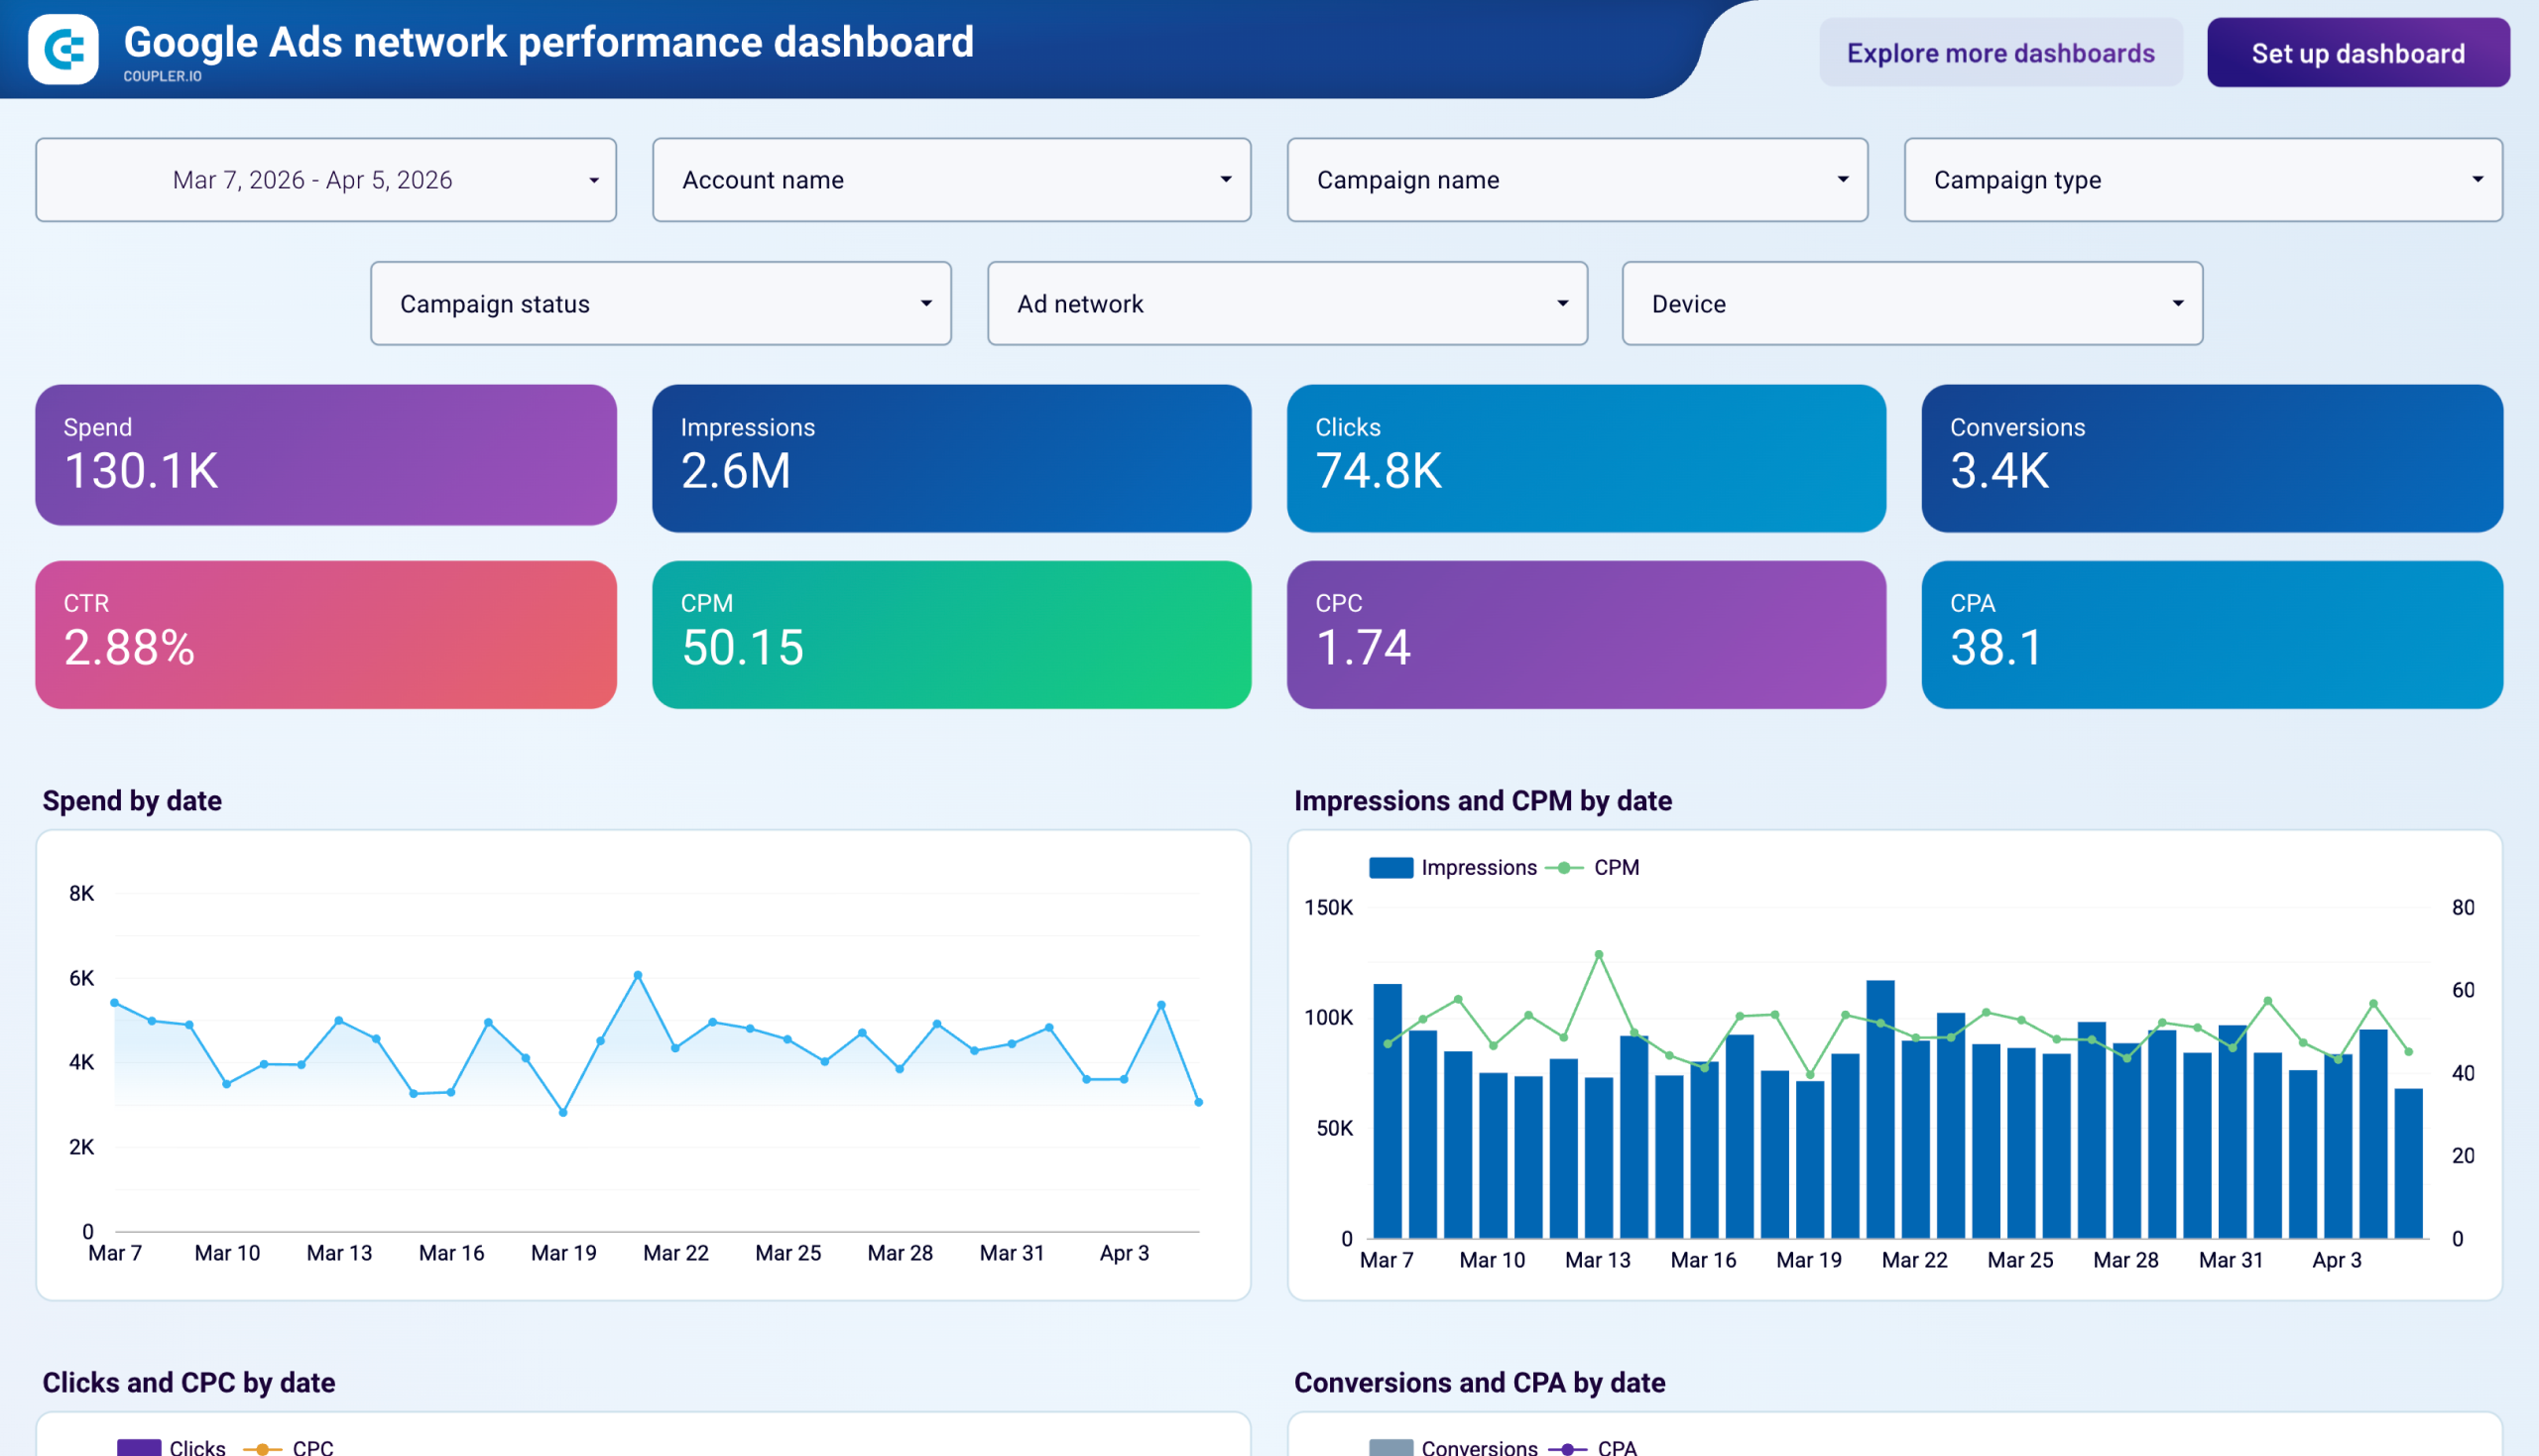
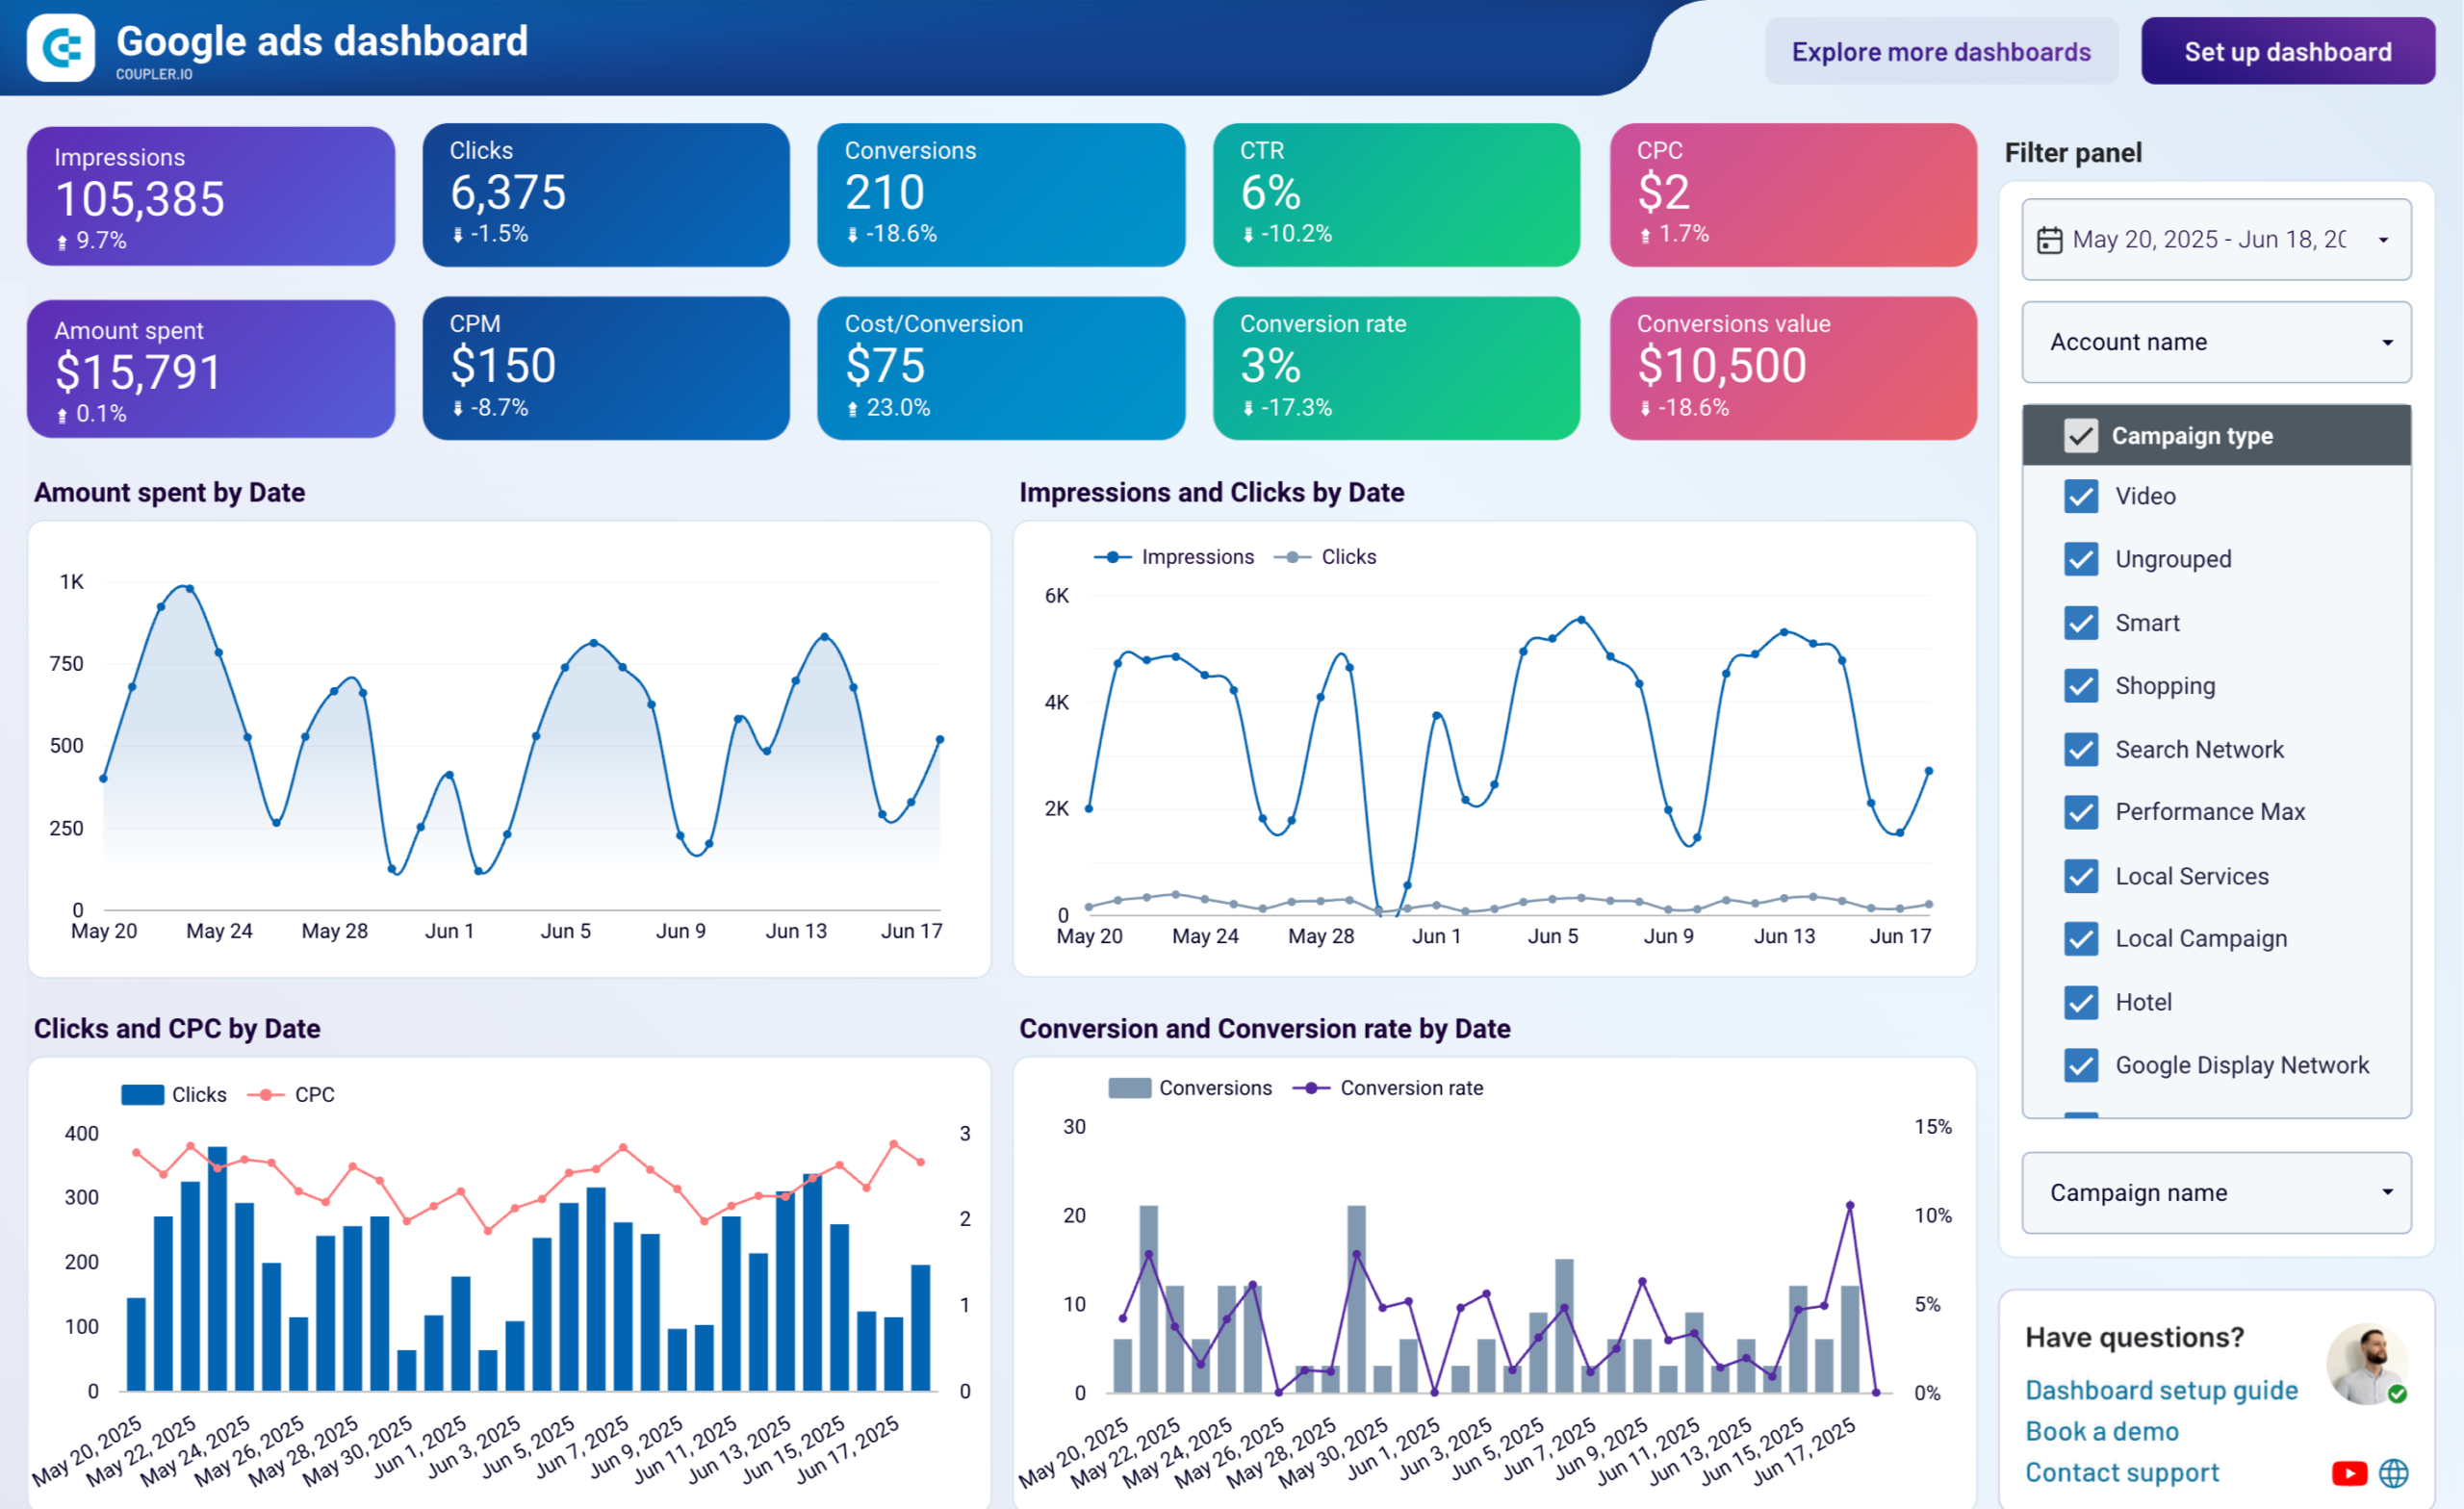
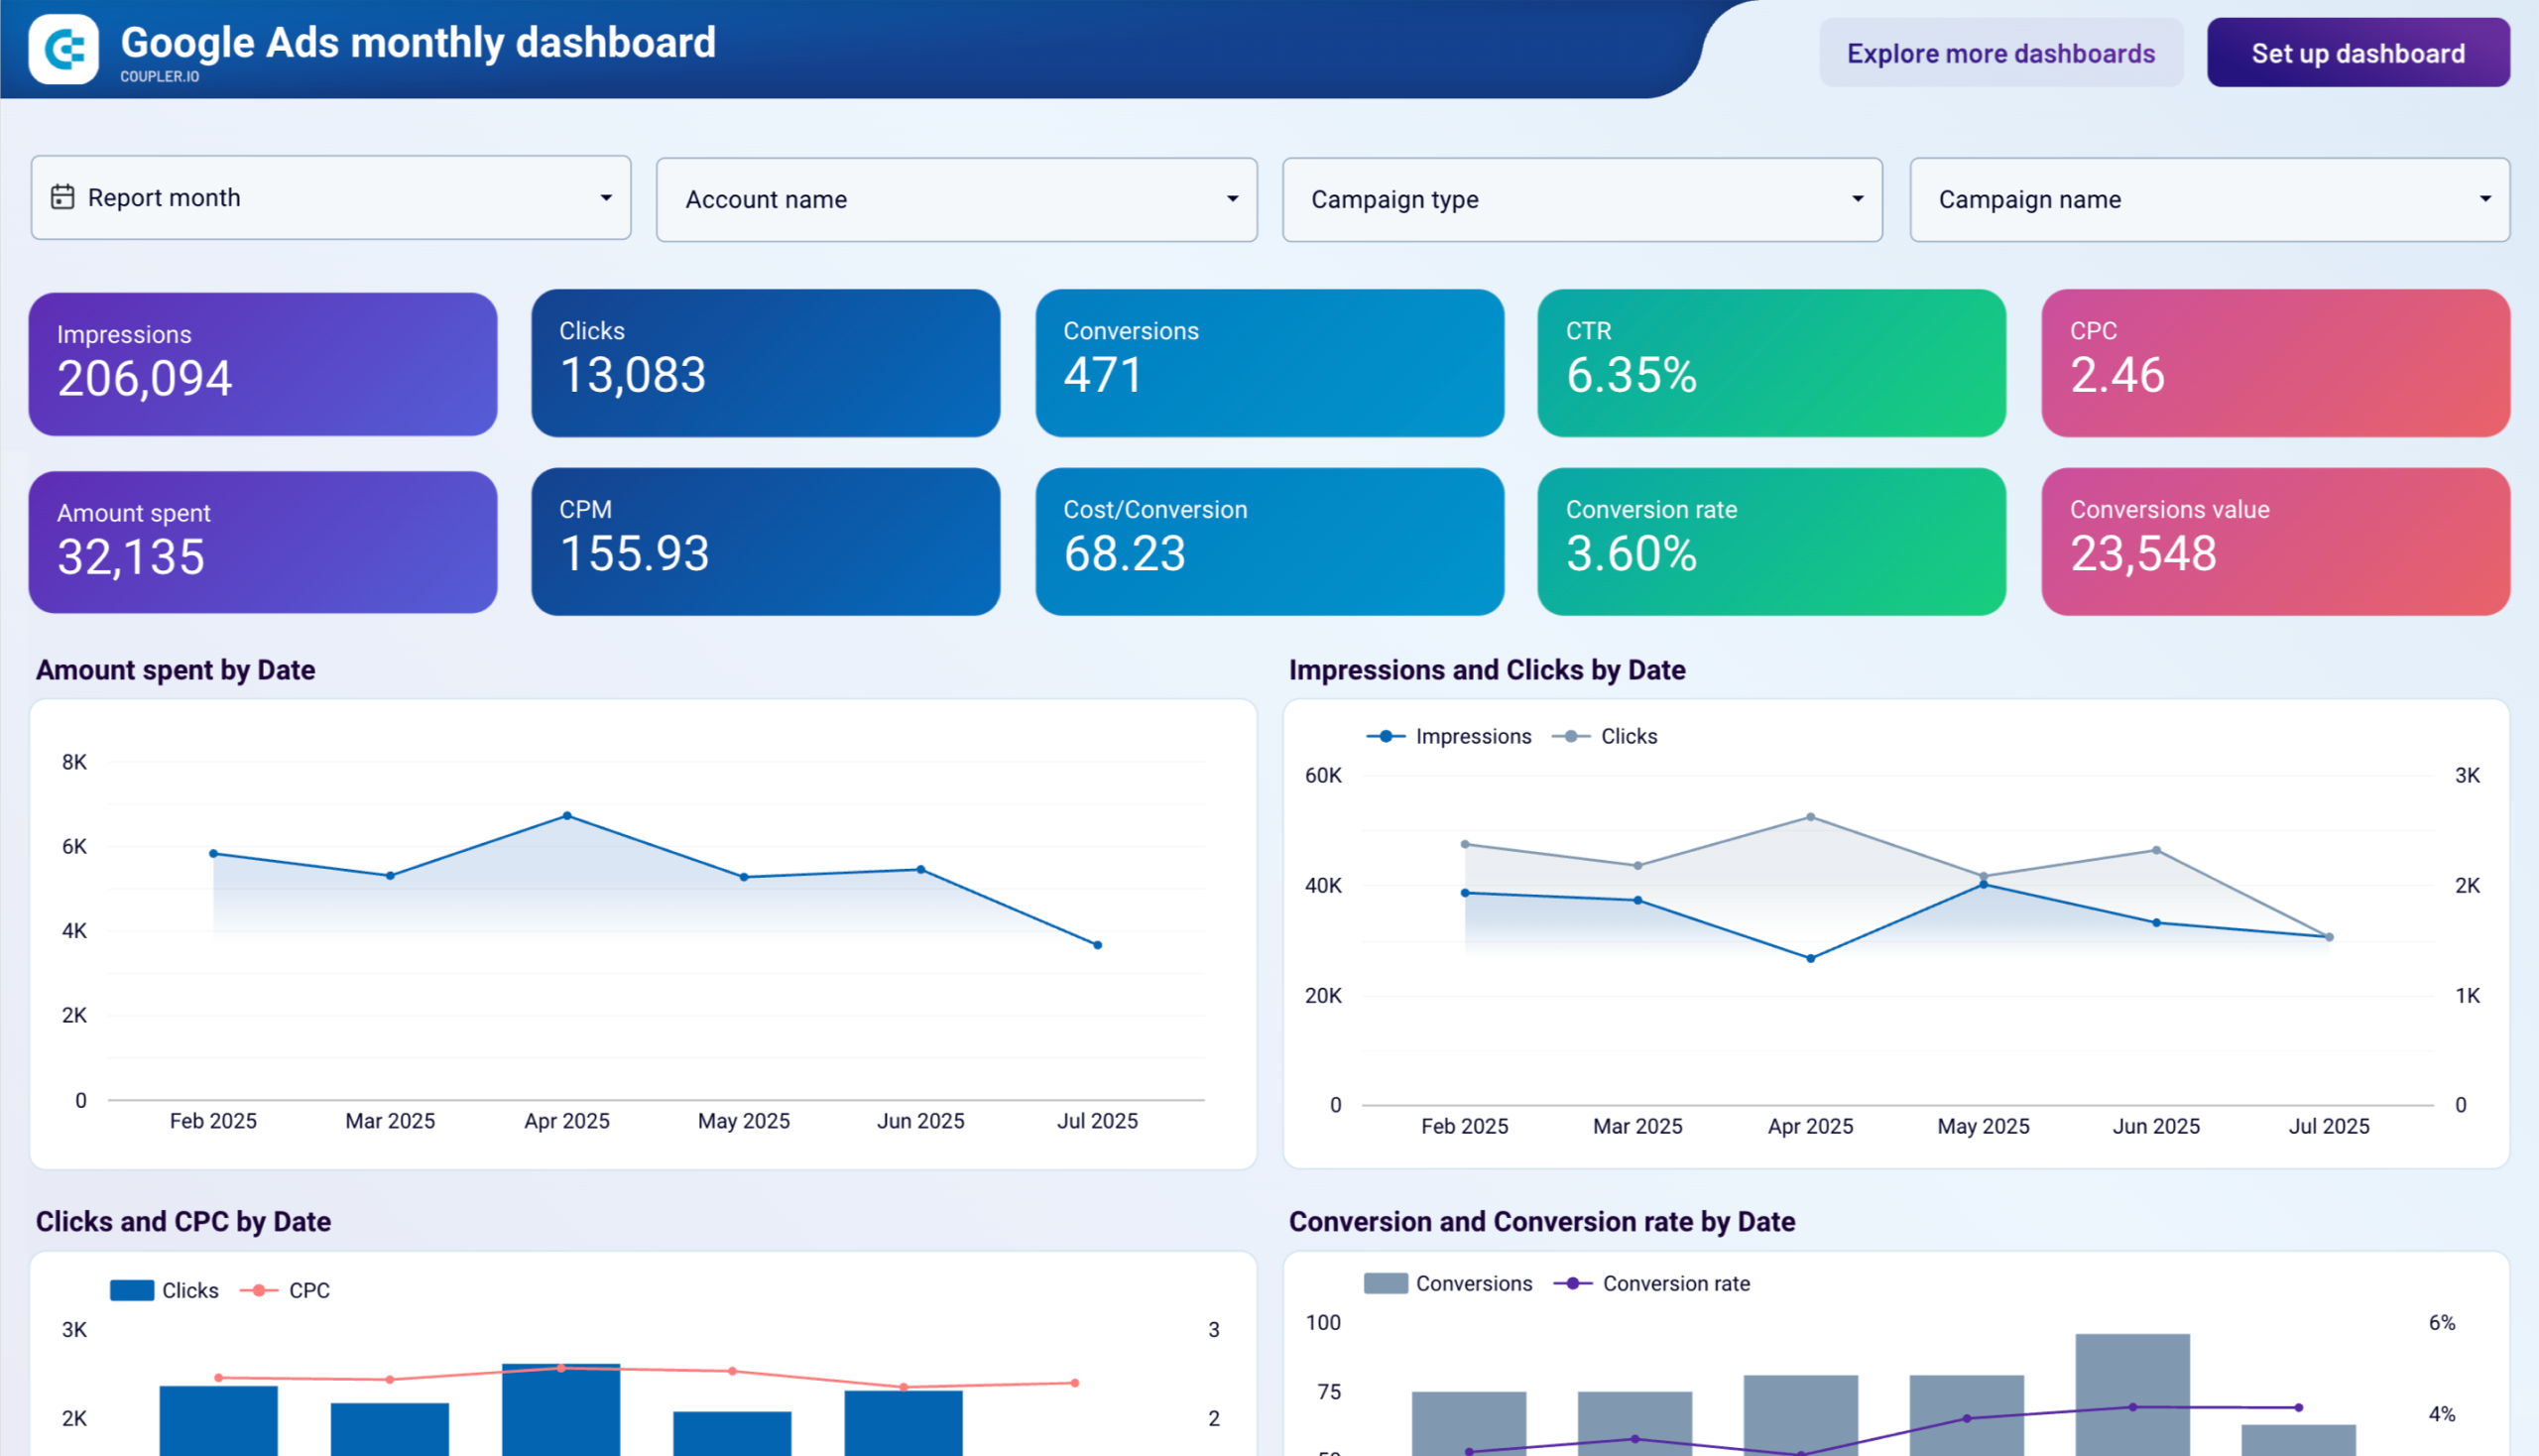
The campaign performance report provides a detailed breakdown of all your campaigns with key metrics like impressions, clicks, spend, and conversions. On a Google Ads KPI dashboard, this report helps you compare performance across different campaigns, identify top performers, and spot areas that need optimization. It typically includes trend analysis over time, allowing you to track the impact of campaign changes. This foundation report is essential for understanding overall account health and making informed budget allocation decisions.
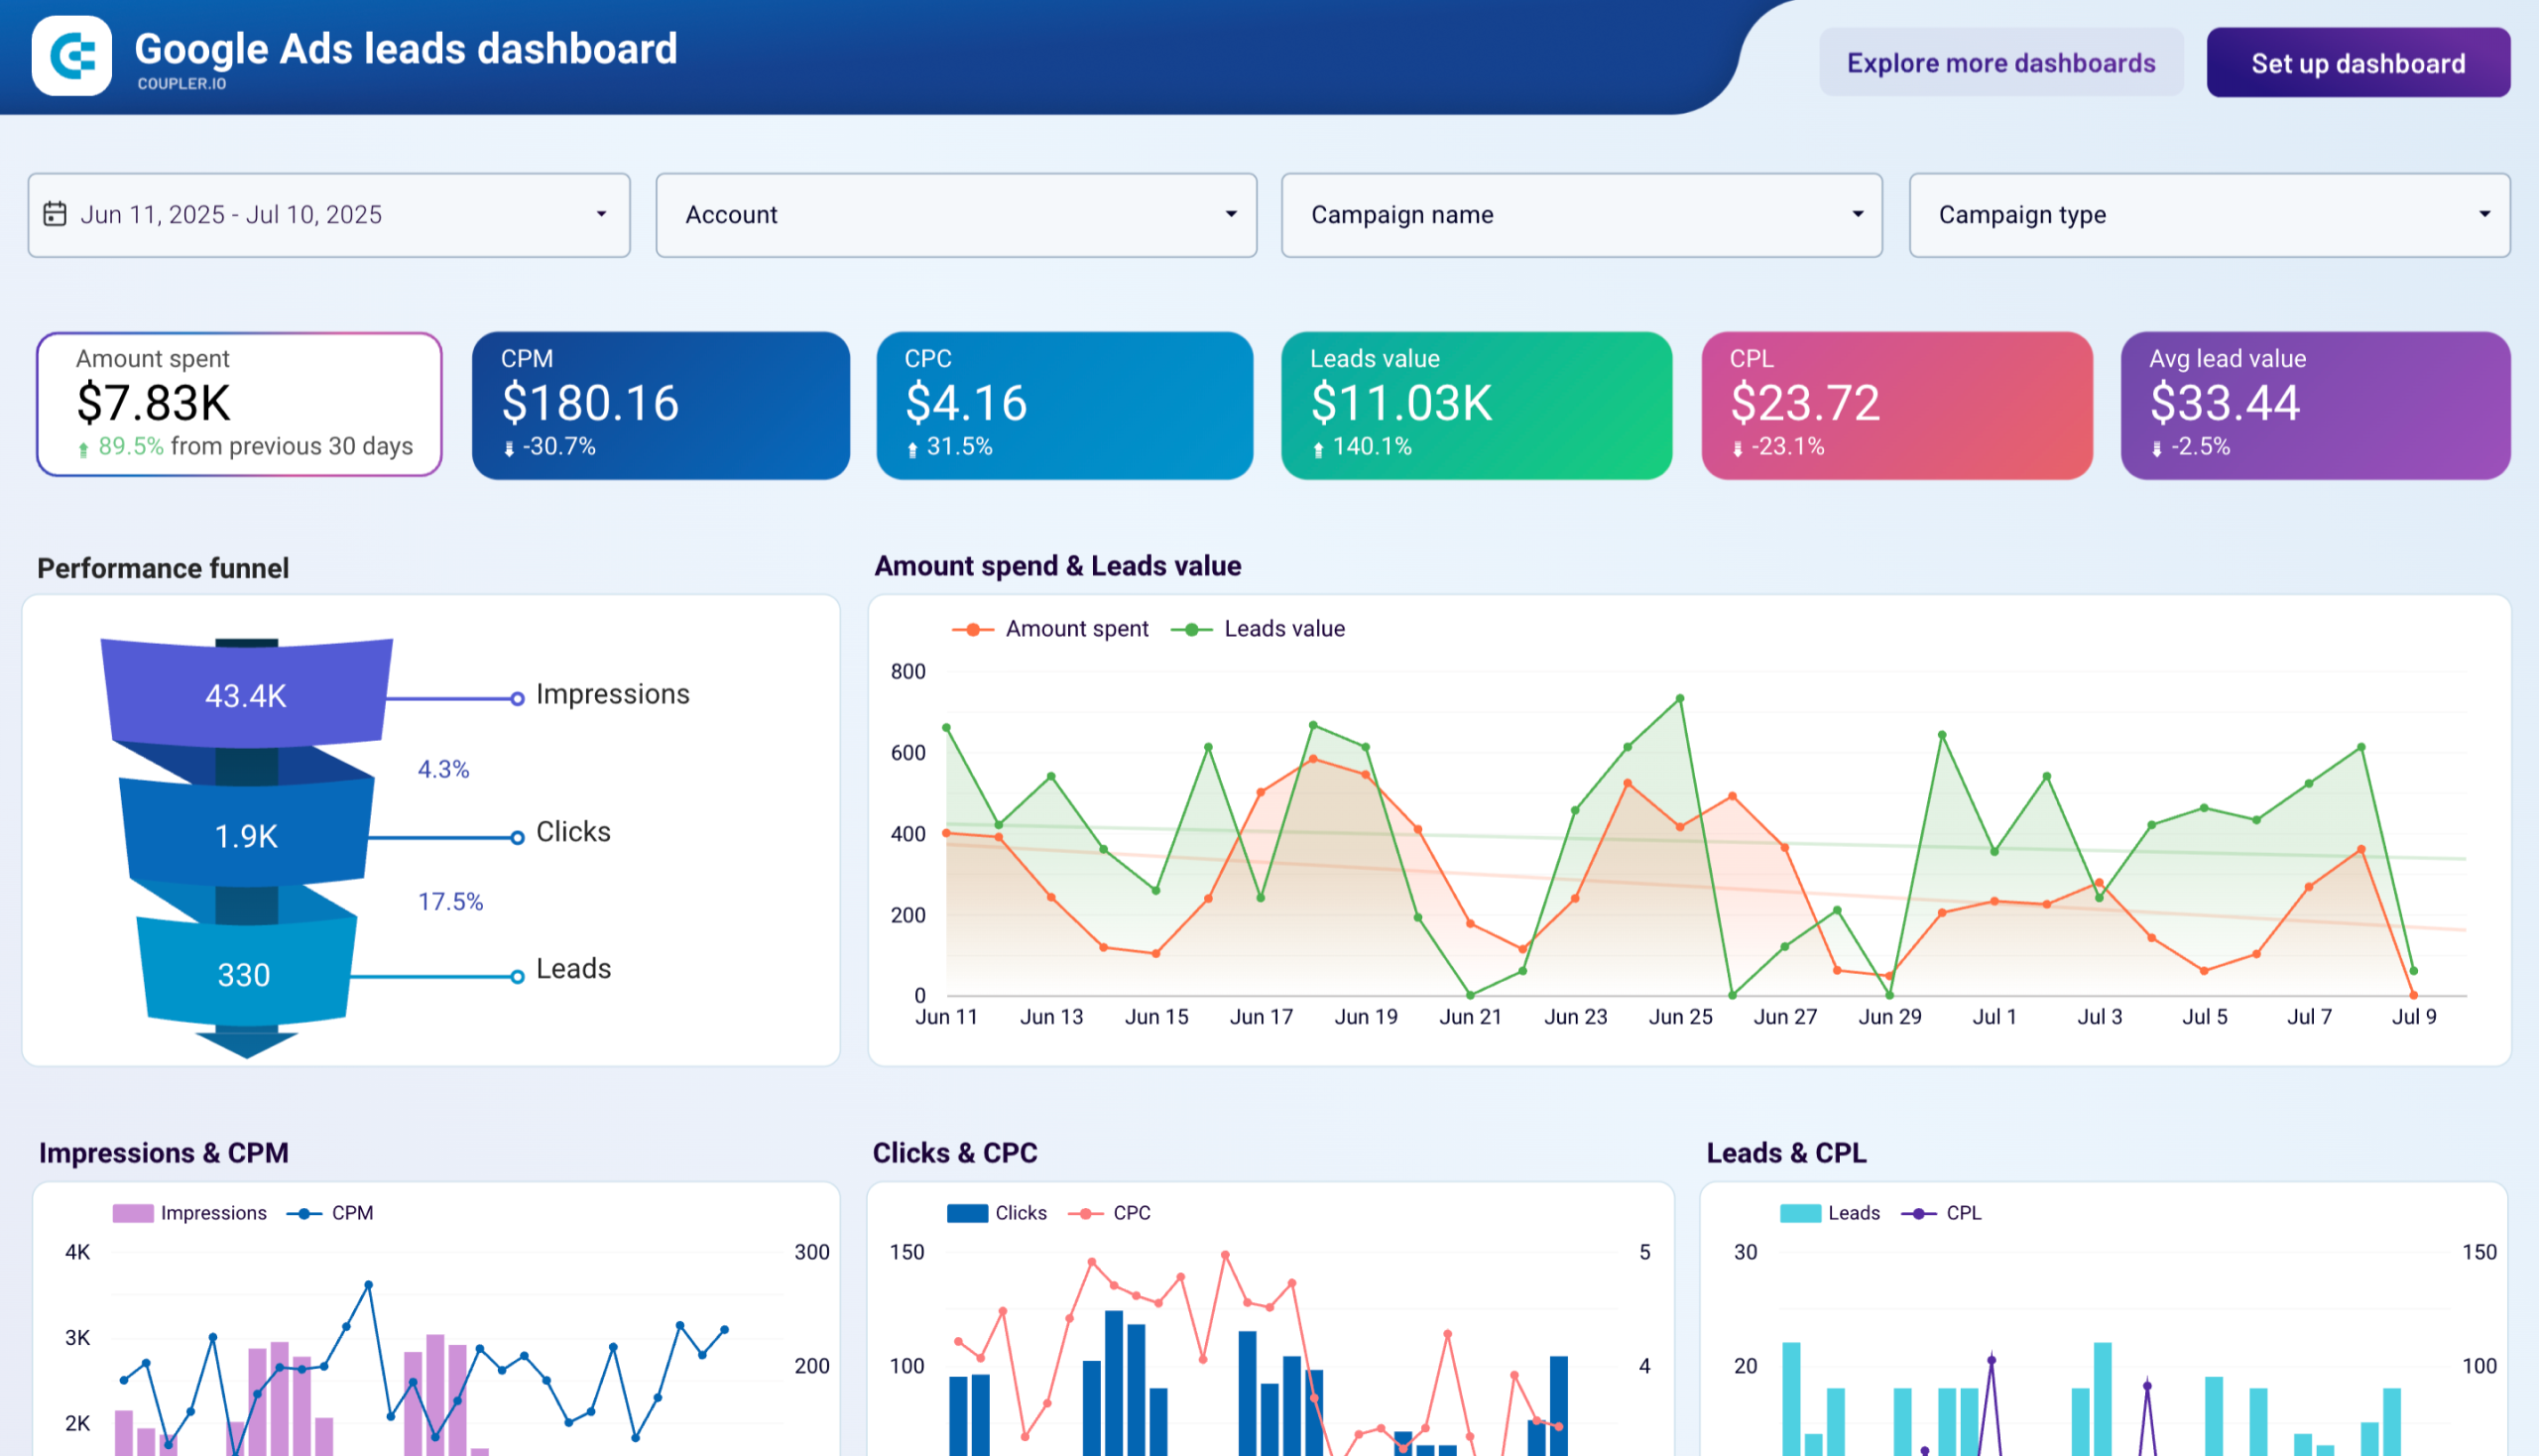
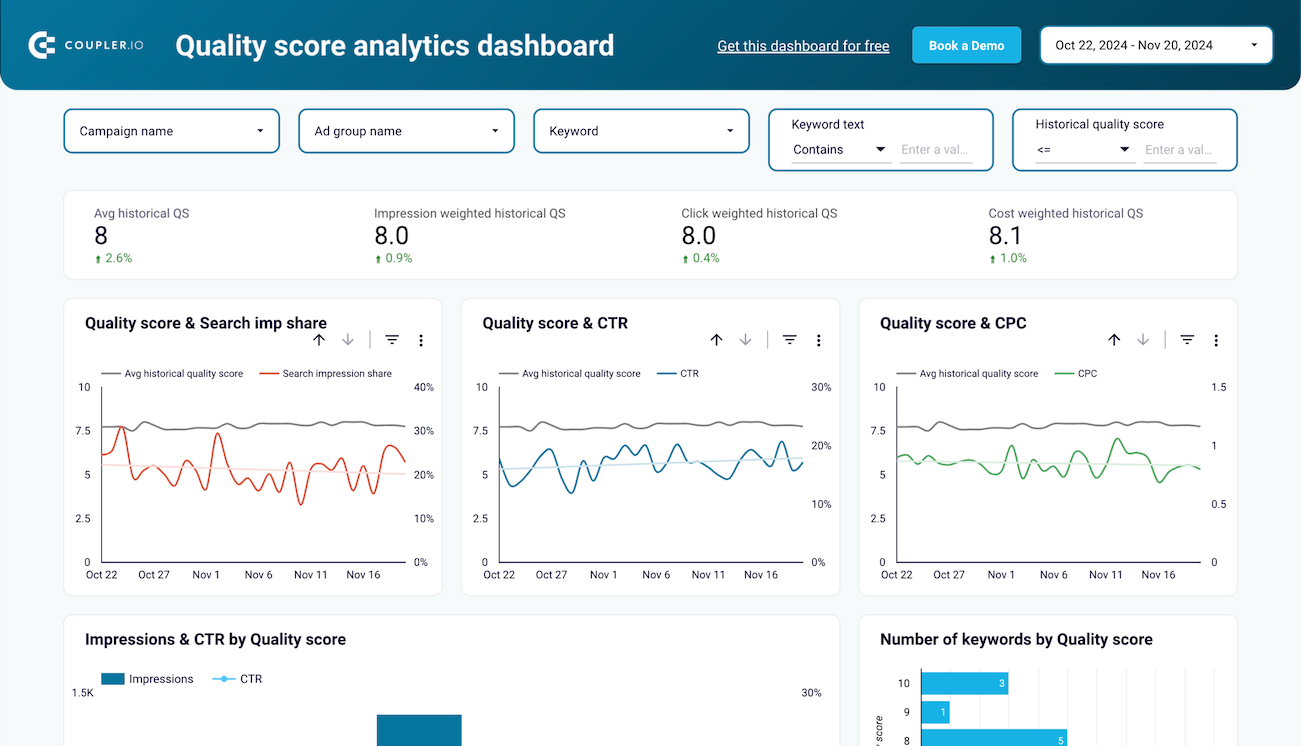
The keyword performance report offers insights into how specific search terms drive traffic and conversions. It tracks metrics like impressions, clicks, cost per click (CPC), and quality score for all keywords across campaigns. This report helps identify high-performing keywords worth additional investment as well as underperforming terms that may need optimization or pausing. It includes tools for analyzing search impression share and detecting seasonal trends, making it invaluable for refining your targeting strategy and improving ad relevance. It’s an essential part of any Gooogle Ads performance dashboard.
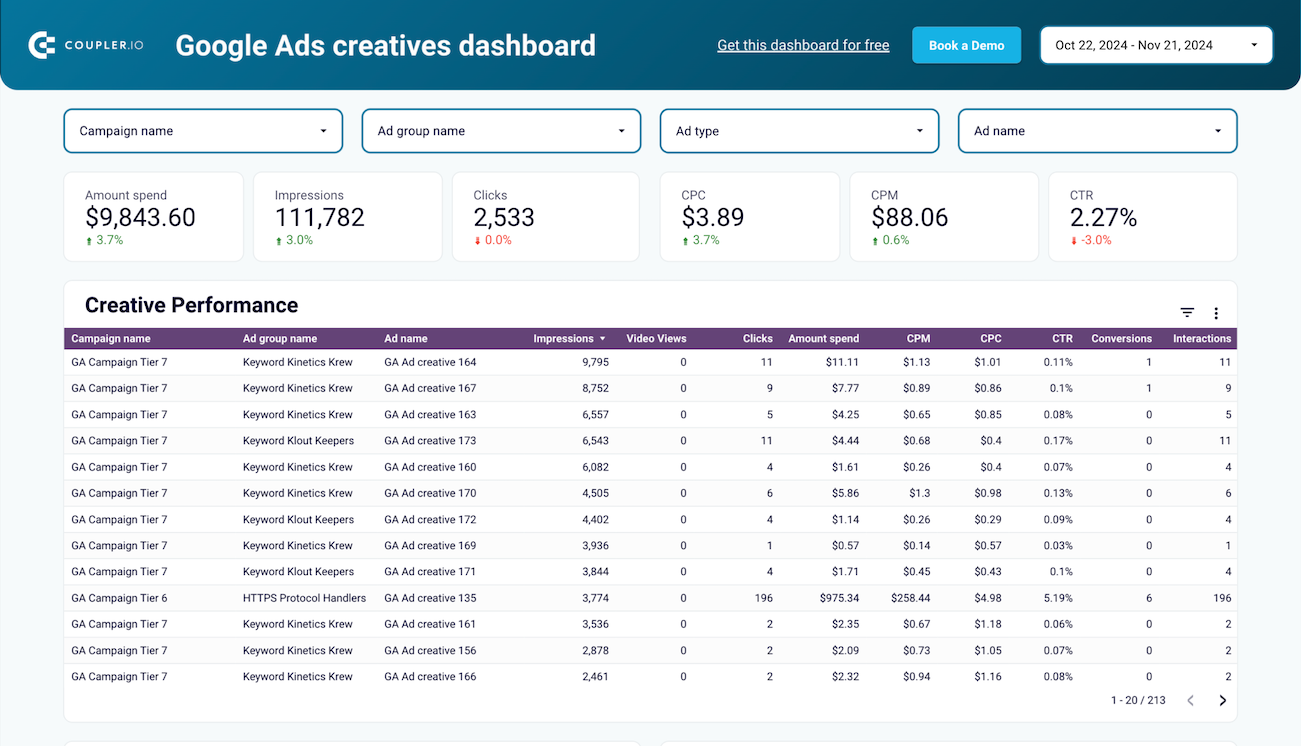
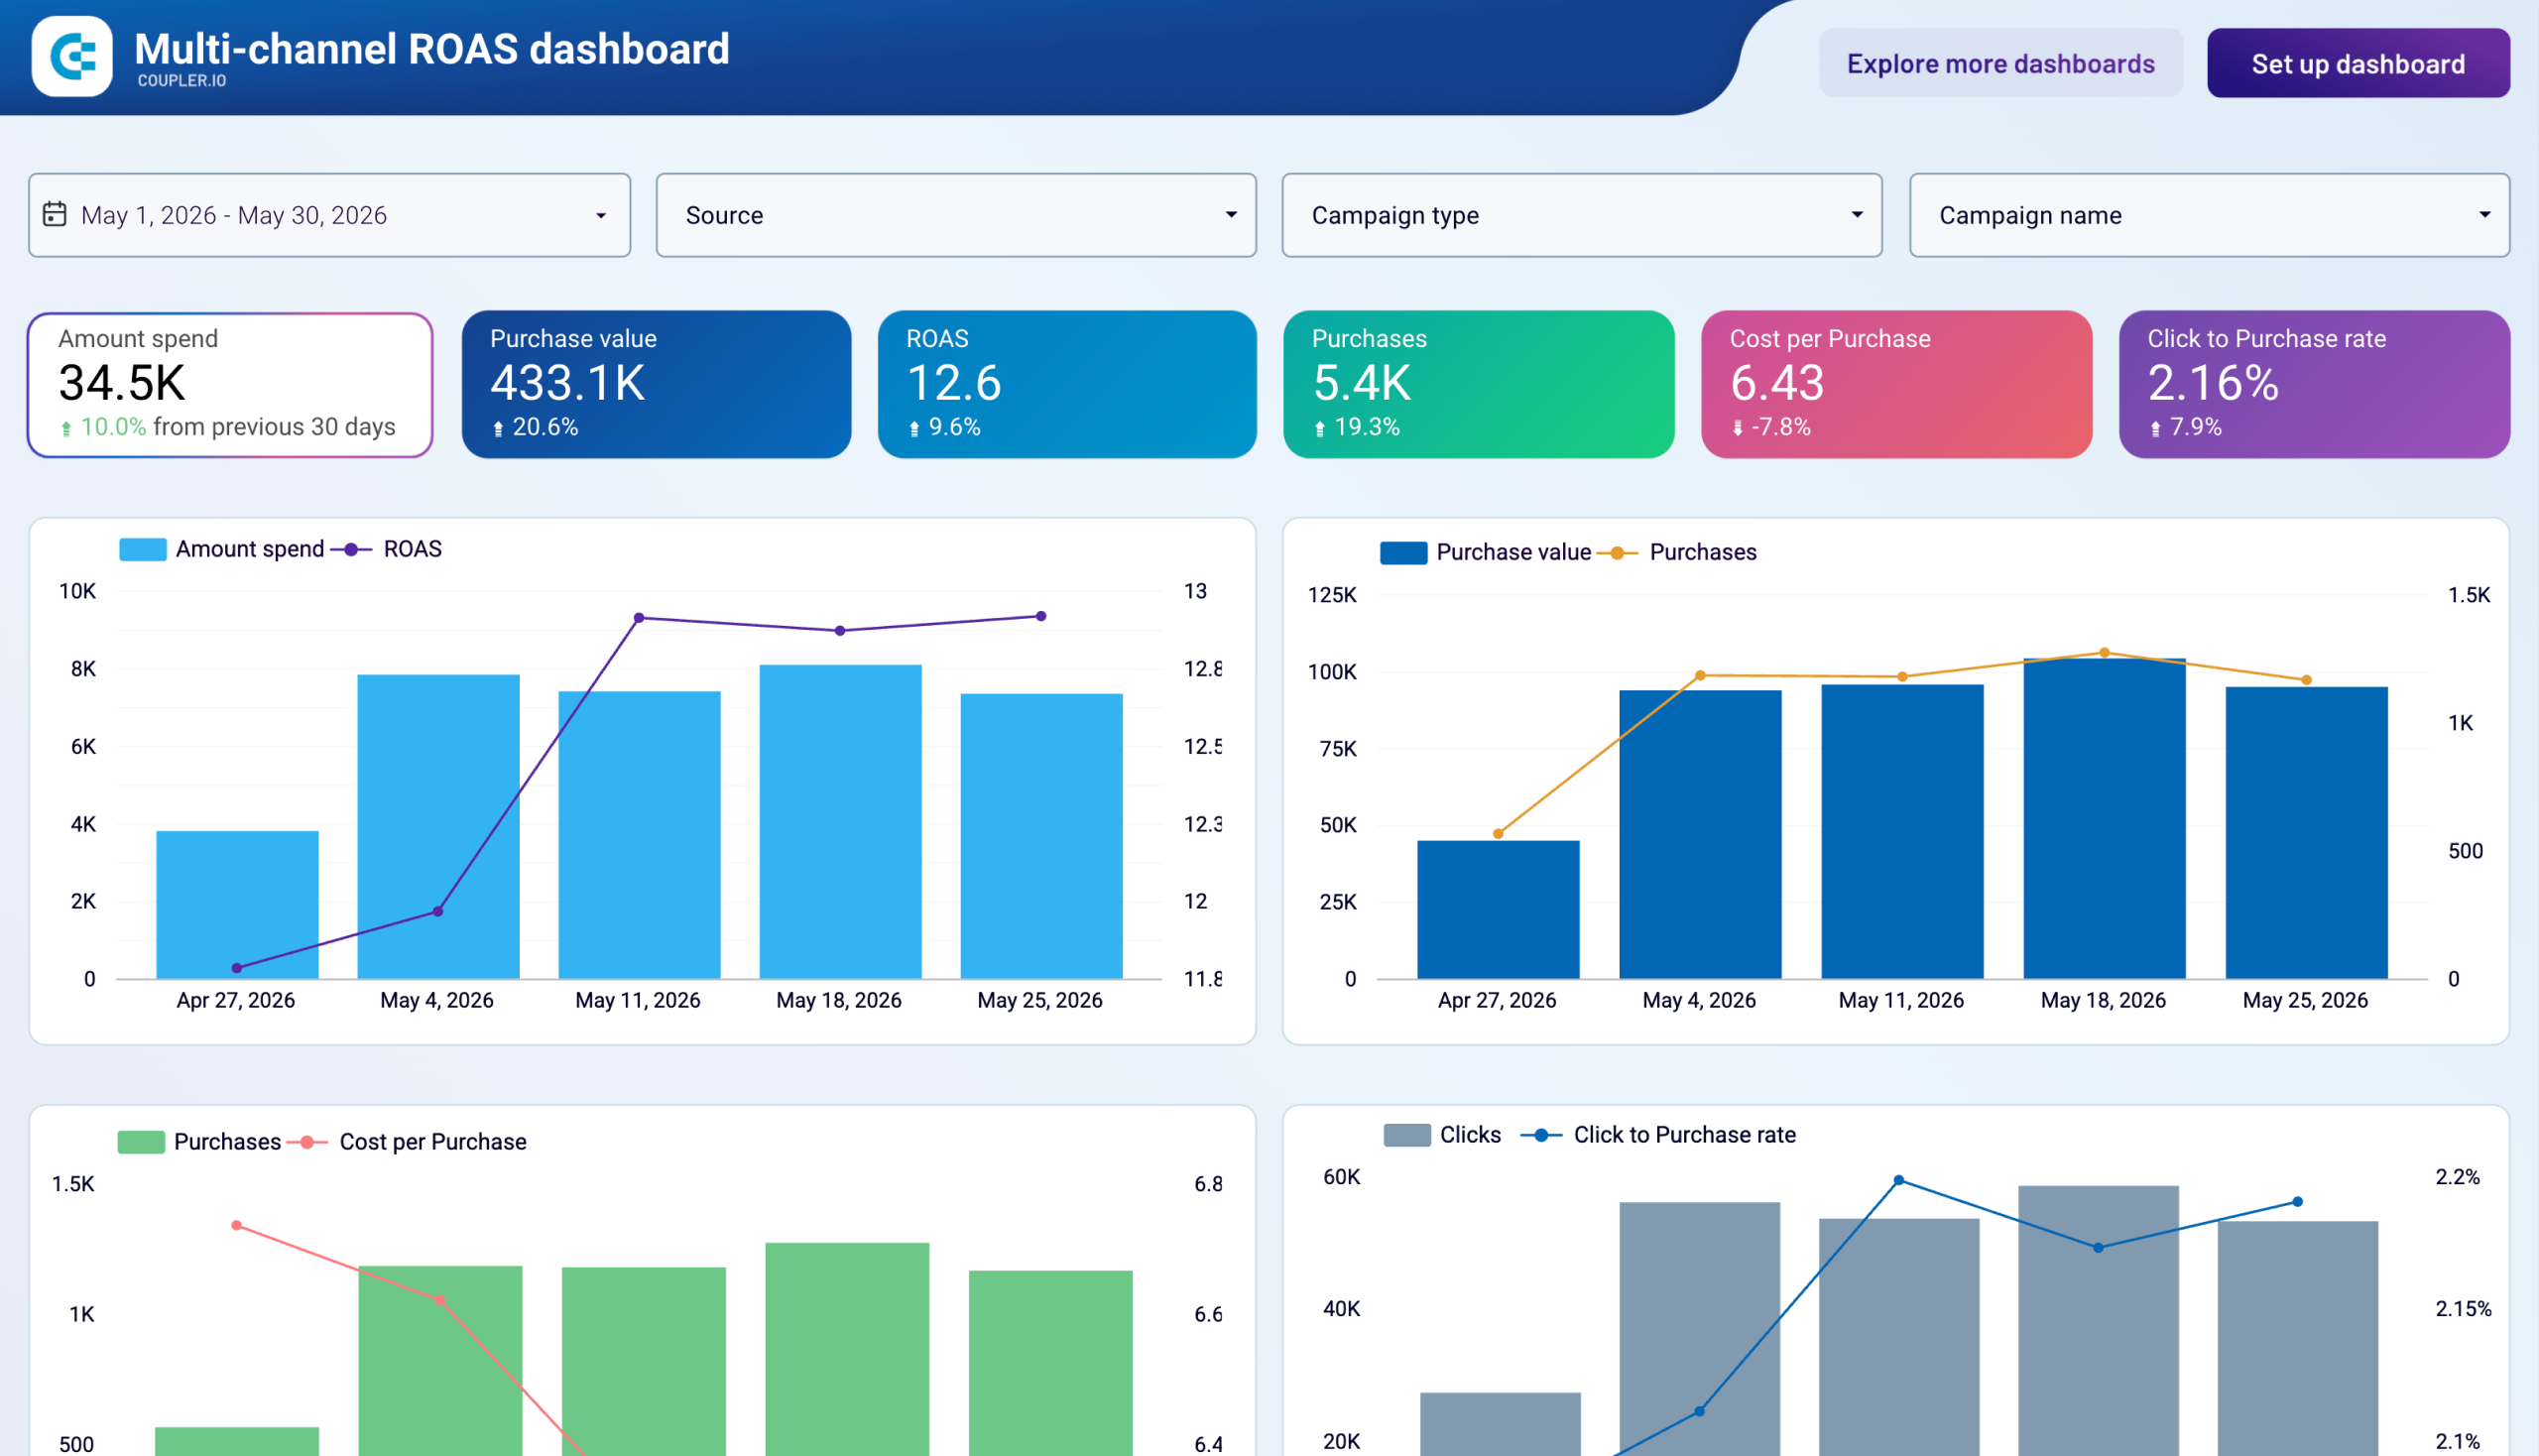
The creatives performance report analyzes how your ad copy, images, and formats perform across campaigns. It provides metrics like engagement rate, click-through rate, conversion rate, and cost per conversion for each creative element. This report helps you understand which messaging resonates with your audience and which visual elements drive the best results. By comparing creative performance across different campaigns and audience segments, you can develop more effective ad content and improve overall campaign performance.
The quality score analysis report monitors the Google Ads quality score components that impact your ad rank and cost per click. It tracks ad relevance, landing page experience, and expected click-through rate across all keywords. This report helps identify areas where your ads may fall short of Google's quality standards, allowing you to make targeted improvements. By optimizing these components, you can achieve better ad positions at lower costs, ultimately improving campaign efficiency and ROI.
What insights you can get with Google Ads dashboards
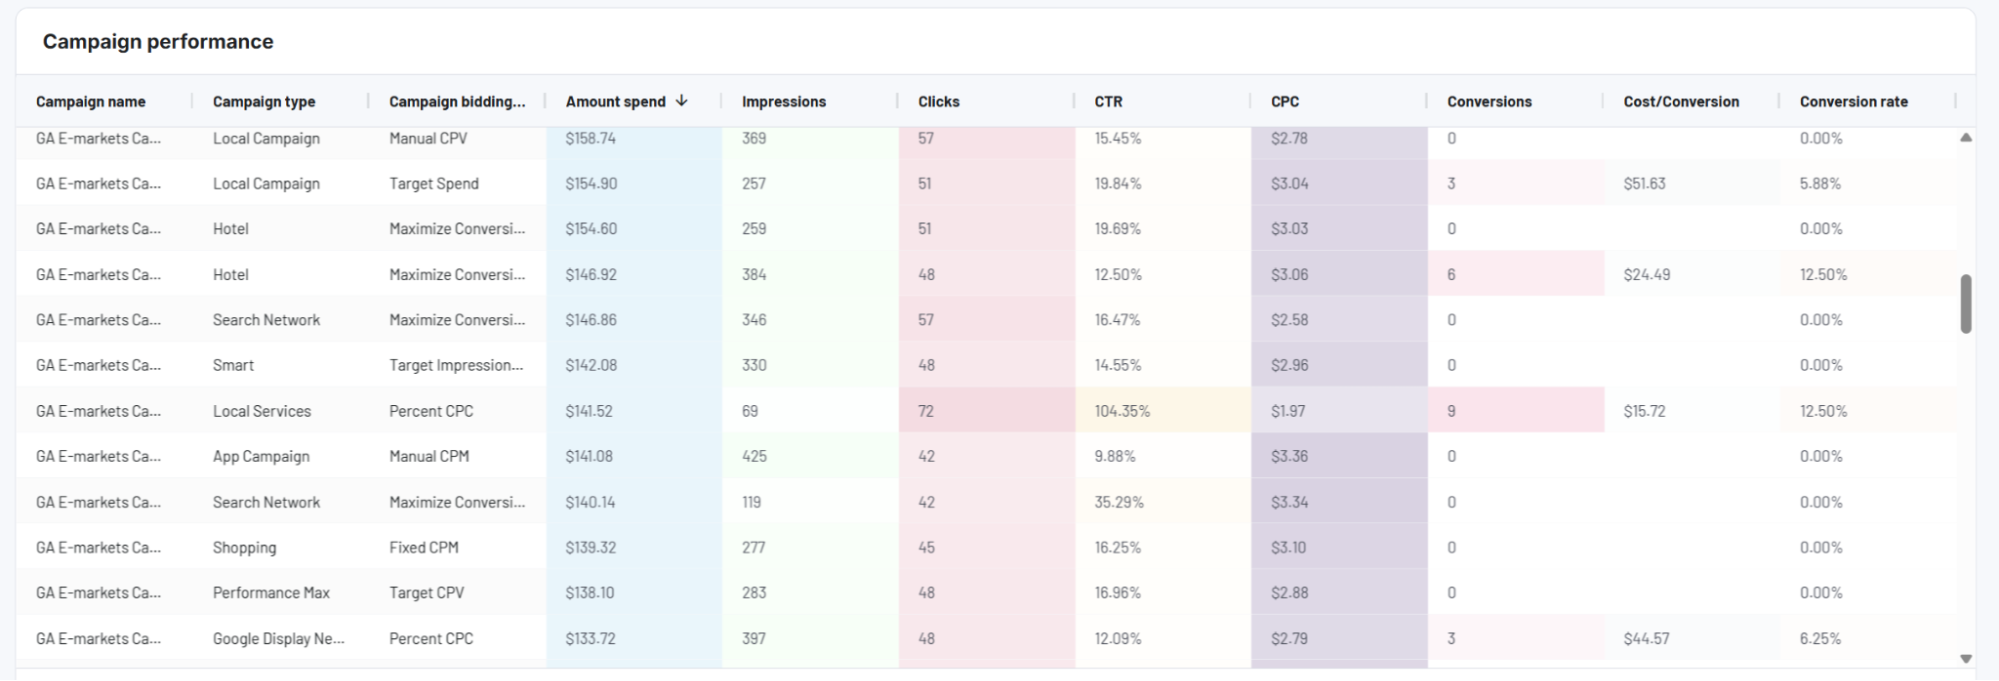
The campaign performance table provides a comprehensive view of all your campaigns with key metrics like impressions, clicks, CTR, CPC, conversions, and total spend. This detailed breakdown helps you quickly identify which campaigns deliver the best results and which need optimization. With this insight, you can make data-driven decisions about budget allocation, pausing underperforming campaigns, and scaling successful ones to maximize ROI.
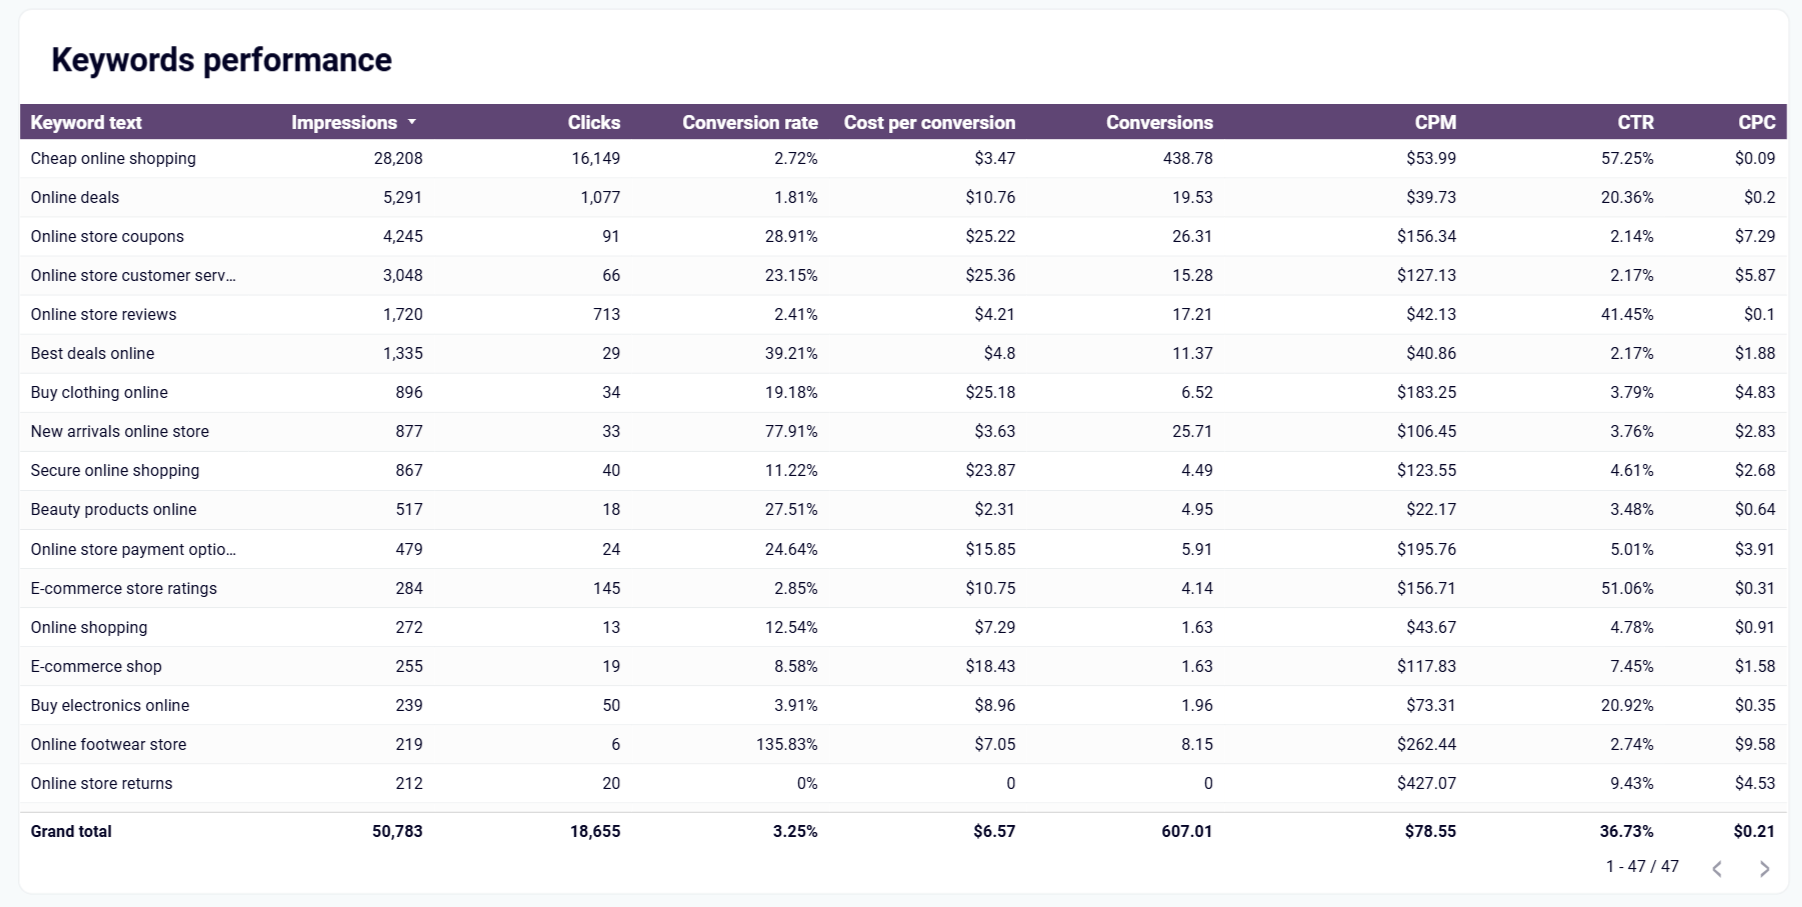
The keyword performance table shows all keywords from your Google Ads account with crucial metrics like impressions, clicks, CPM, CTR, and CPC. It helps you identify underperforming phrases with high impressions but few clicks that should be eliminated, as well as best-performing terms worth additional investment. By filtering data by campaign or ad group, you can refine your keyword strategy and reallocate budget from low to high-performing keywords.
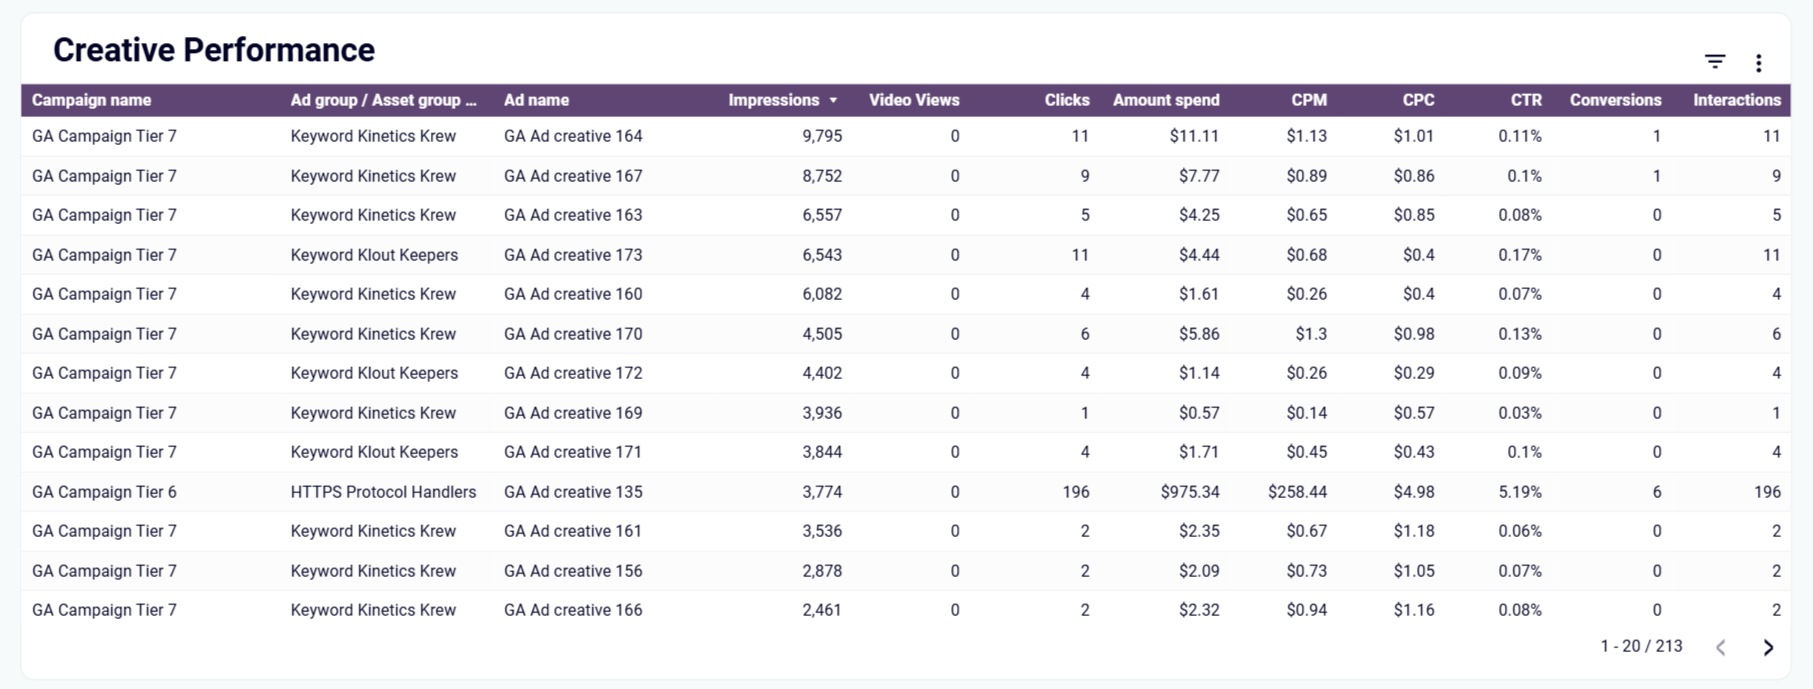
The creative performance table breaks down your ad creatives by key metrics like engagements, CTR, CPM, CPC, conversions, and total spend. This comprehensive view shows how each creative performs across campaigns, enabling easy comparison and prioritization. By identifying which ad variations generate the most conversions, you can understand what messaging resonates with your audience and replicate successful elements in future campaigns.
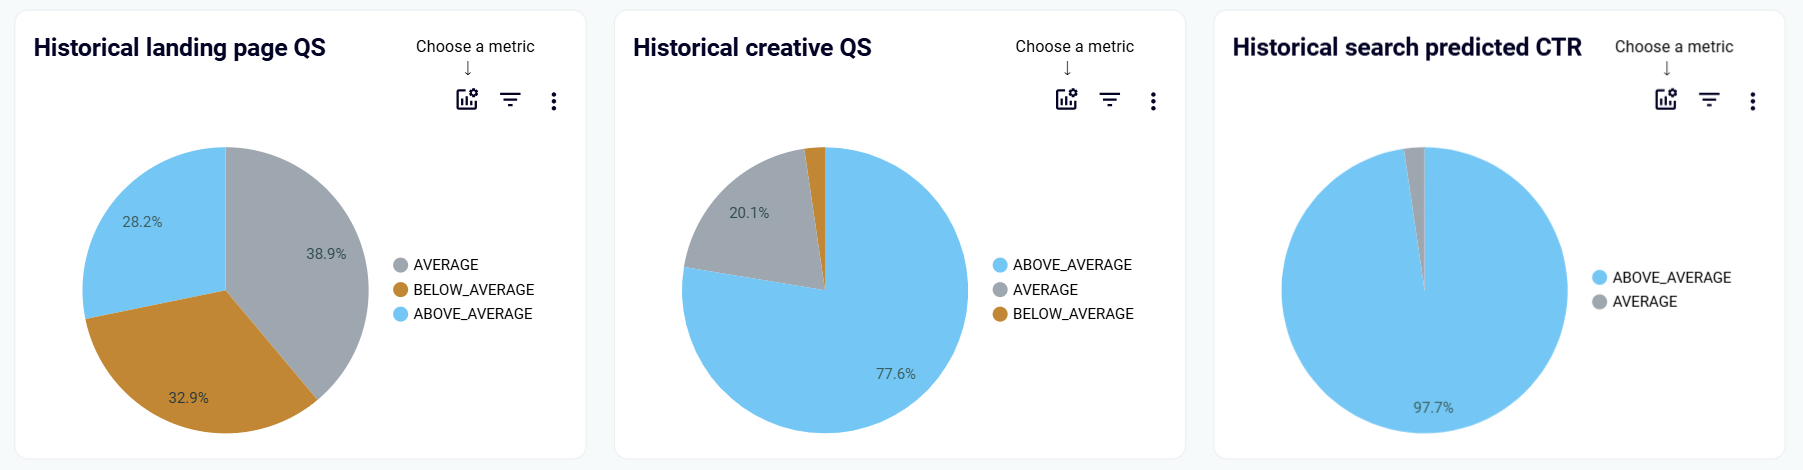
The quality score components analysis visualizes the three factors that determine your quality score: ad relevance, landing page experience, and expected CTR. Through pie charts showing the percentage of keywords rated below average, average, or above average for each component, you can pinpoint exactly which factors are dragging down your scores. This targeted insight helps you focus optimization efforts on specific areas, leading to higher ad positions at lower costs.
How to create a Google Ads dashboard?

Metrics you can track with a Google Ads dashboard template
Monitor how many times your ads are displayed to potential customers across the Google Network. This metric helps you understand your campaign reach and visibility in search results. By tracking impression trends over time, you can identify seasonal patterns, evaluate the impact of bid adjustments, and ensure your ads are being shown to your target audience consistently.
Track the number of times users click on your ads to visit your website or landing page. This engagement metric directly reflects user interest in your offering and serves as a foundation for calculating other performance indicators. Monitoring clicks alongside impressions helps you understand how compelling your ads are to your target audience and identify opportunities to improve ad copy or targeting.
Measure the percentage of ad impressions that result in clicks, calculated as clicks divided by impressions. CTR is a critical indicator of ad relevance and effectiveness, with higher rates suggesting your messaging resonates with the audience. By comparing CTR across campaigns, ad groups, and keywords, you can identify which elements of your advertising strategy are working best and which need refinement.
Monitor how much you pay, on average, for each click on your ads. This efficiency metric helps you understand how your budget is being utilized and whether your bidding strategy is cost-effective. Tracking CPC alongside conversion metrics allows you to identify keywords or campaigns that might be expensive but deliver strong results, as well as those that cost more than they're worth.
Measure the percentage of users who complete a desired action (like a purchase or form submission) after clicking your ad. This effectiveness metric reveals how well your landing pages and overall user experience convert interest into actual business results. By comparing conversion rates across campaigns and ad groups, you can identify which targeting strategies and messaging approaches drive the most valuable actions.
Track how much you spend, on average, to generate each conversion through your Google Ads campaigns. This ROI metric helps you evaluate the profitability of your advertising efforts and compare performance across different campaigns, products, or services. Monitoring cost per conversion enables you to optimize budget allocation toward the marketing activities that deliver the best return on investment.
Monitor Google's rating of the quality and relevance of your keywords, ads, and landing pages on a scale from 1-10. This composite metric impacts your ad rank and costs, with higher scores leading to better positions at lower costs. By tracking quality score alongside its component factors, you can identify specific areas for improvement that will enhance campaign performance while reducing advertising costs.
Measure the percentage of impressions your ads receive compared to the total impressions they could potentially receive. This competitive metric reveals how often your ads appear when users search for your keywords and identifies opportunities where you might be missing out due to budget constraints or poor ad rank. Tracking impression share helps you understand your market position and make strategic adjustments to increase visibility.