Marketing dashboard examples and reporting templates
Derive insights into your marketing efforts with our ready-to-use marketing dashboards. They are available as templates to which you only need to connect your data source. Use the dashboards to measure your marketing campaign’s efficiency, analyze the engagement of your content, and increase conversion rates.
Marketing dashboard examples for every need


 +3
+3


 +6
+6


 +5
+5
 +6
+6

 +3
+3
 +1
+1
 +4
+4
 +4
+4
 +2
+2

 +2
+2


 +5
+5
 +4
+4
 +5
+5
 +5
+5


 +3
+3

 +1
+1
 +3
+3


 +1
+1
 +3
+3
 +3
+3

 +2
+2


 +1
+1

 +1
+1


 +2
+2
 +3
+3
 +4
+4


about your case. It doesn't cost you a penny 😉
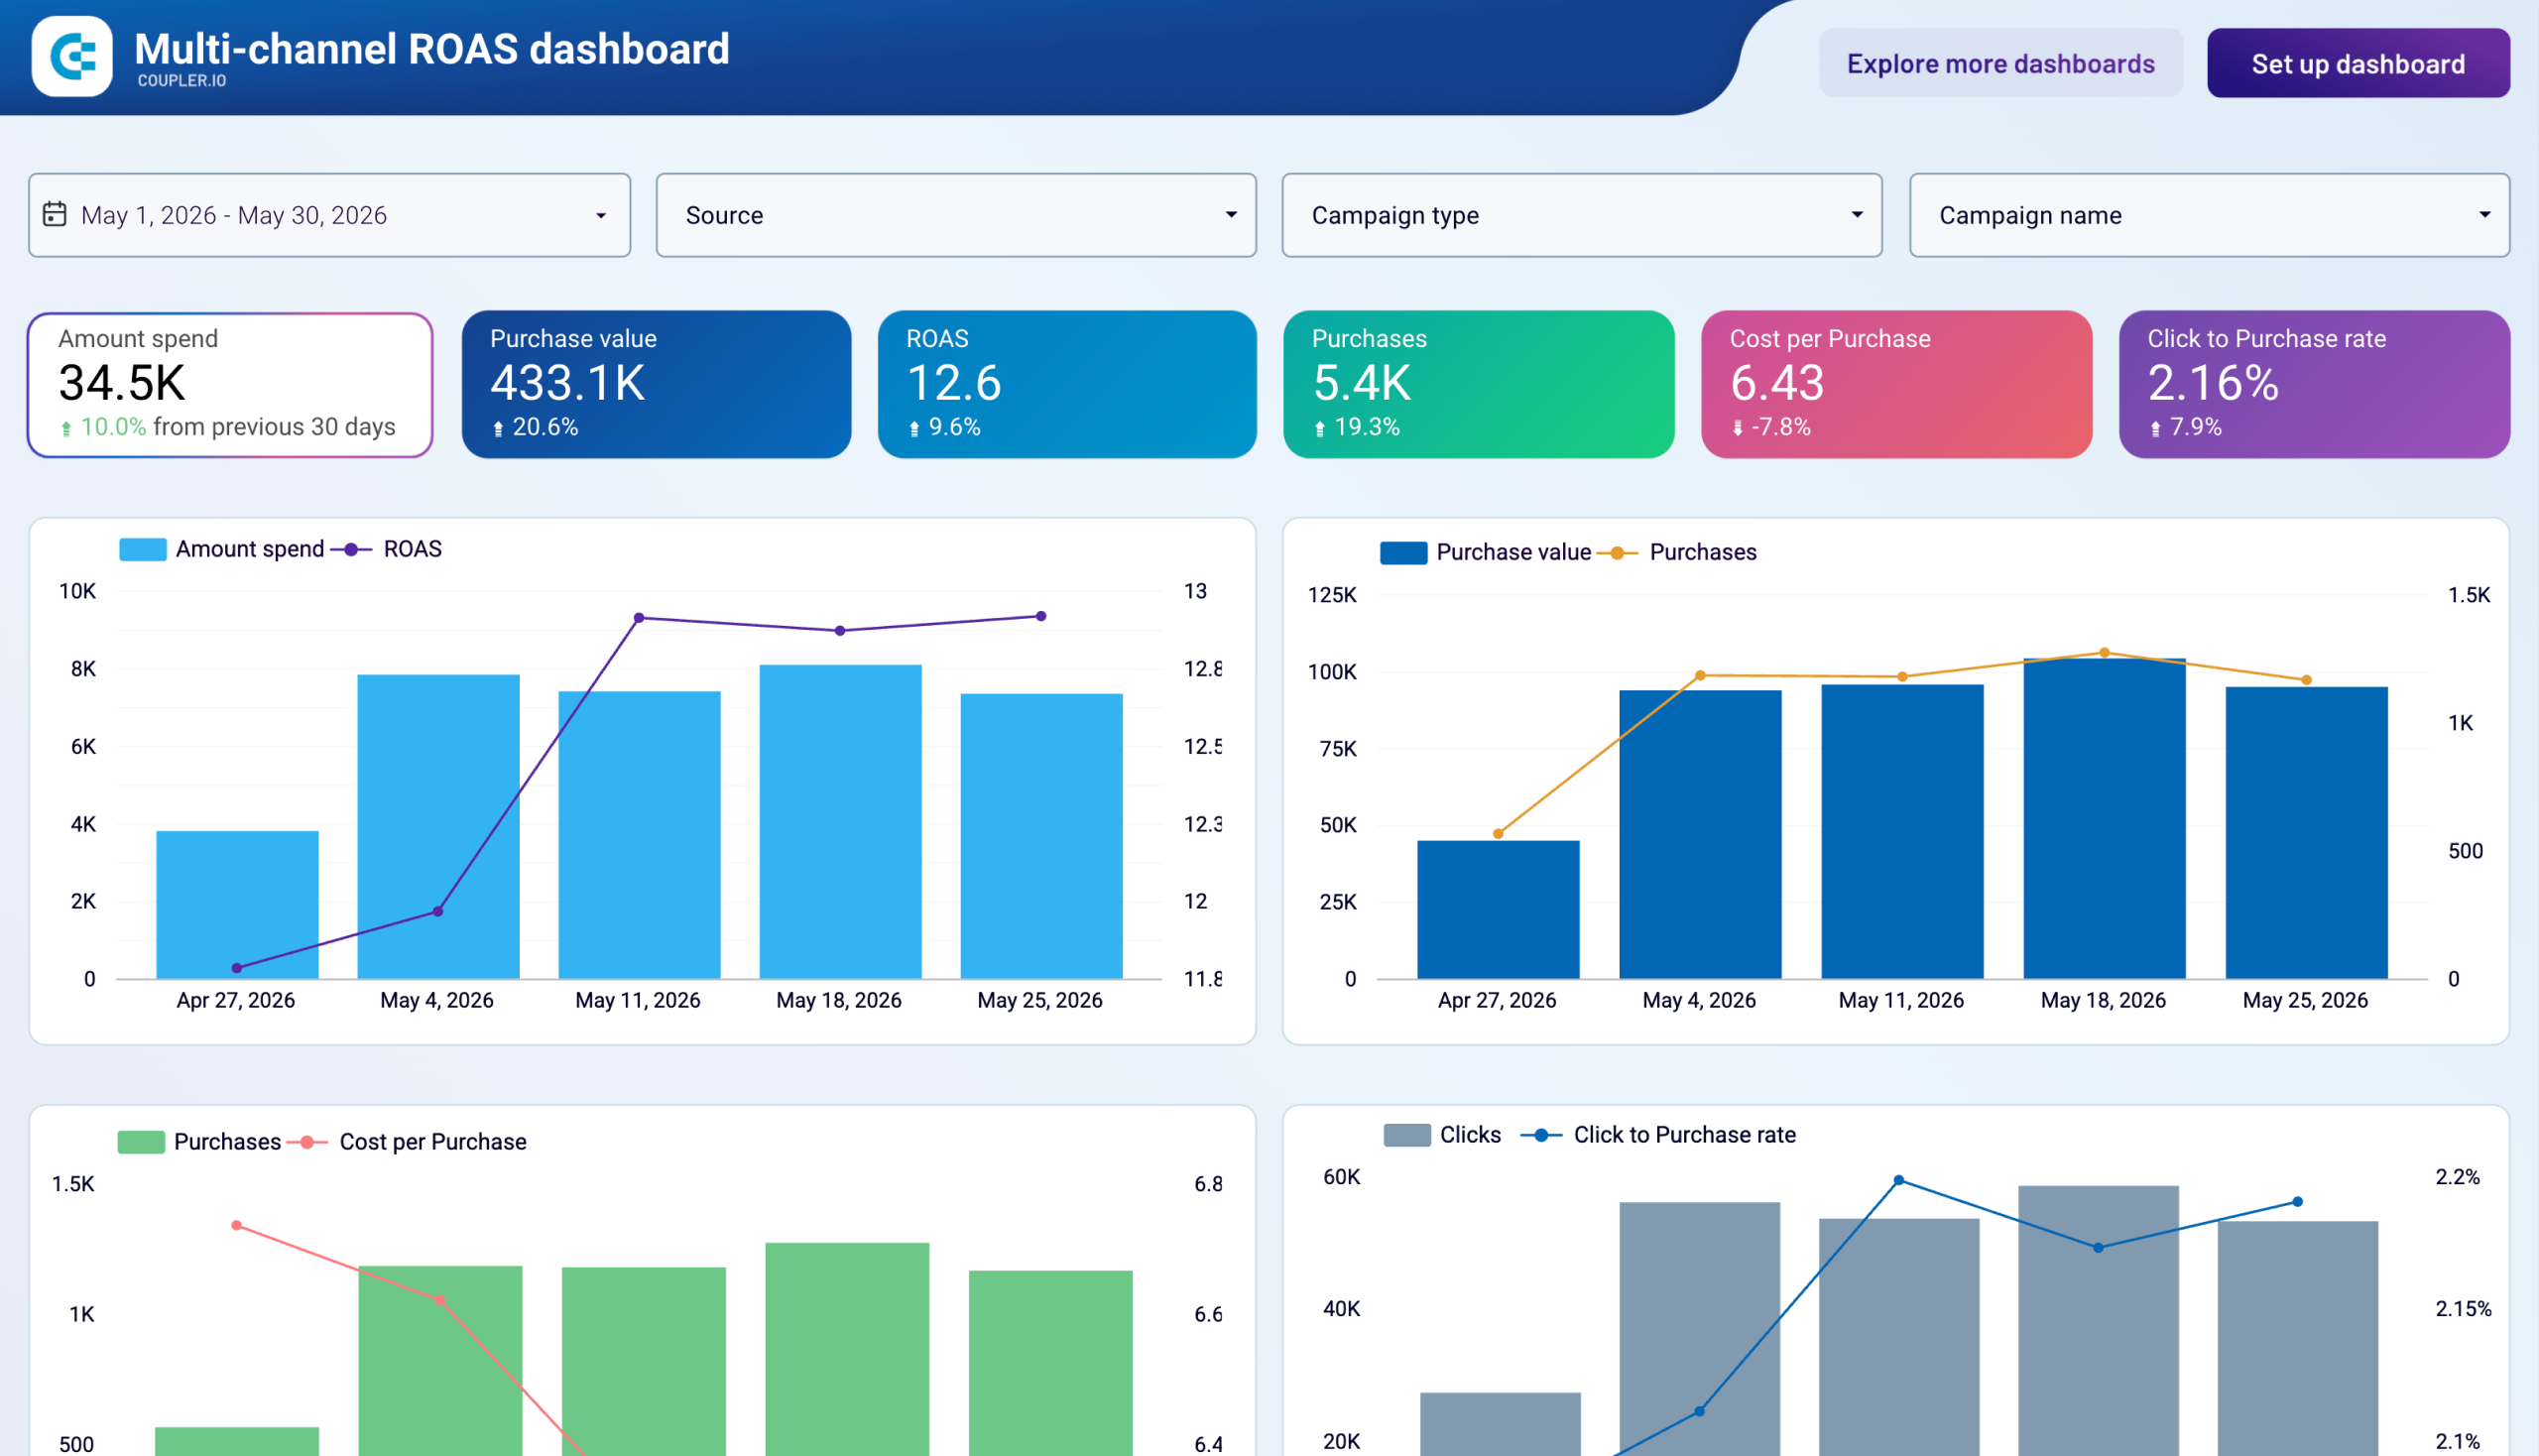
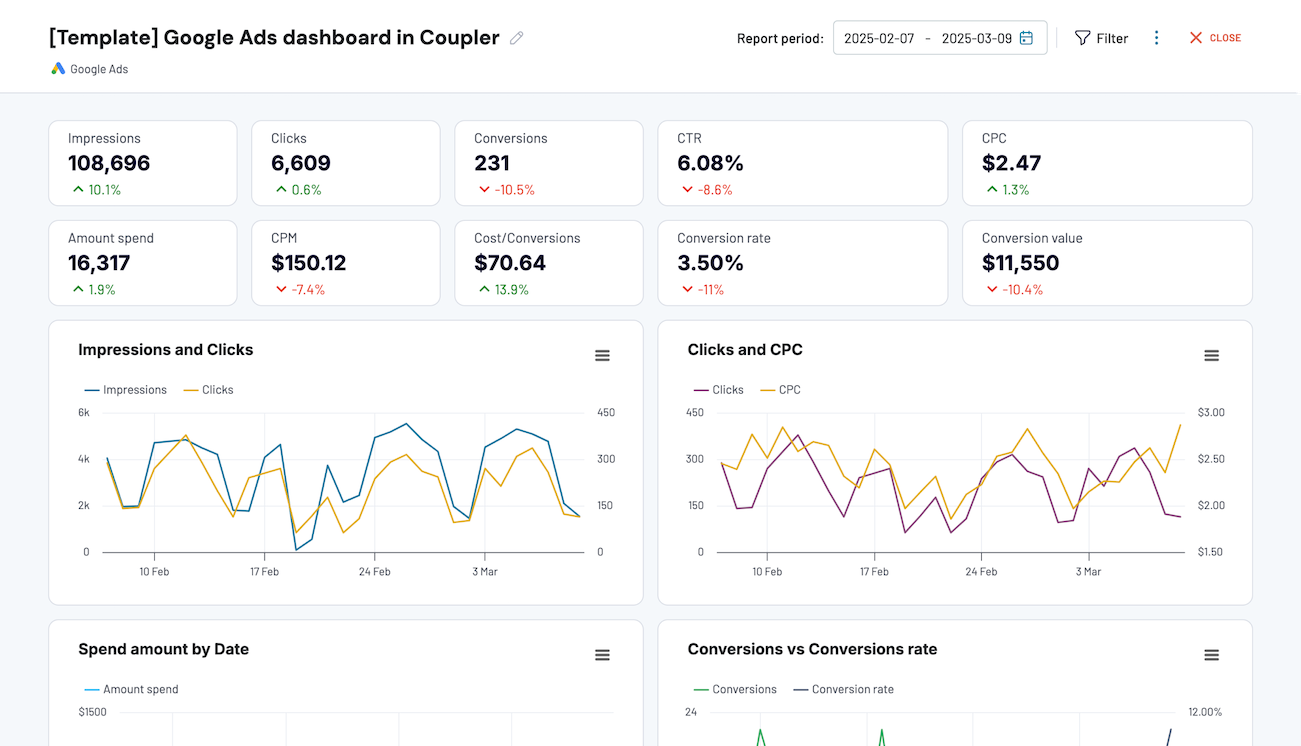
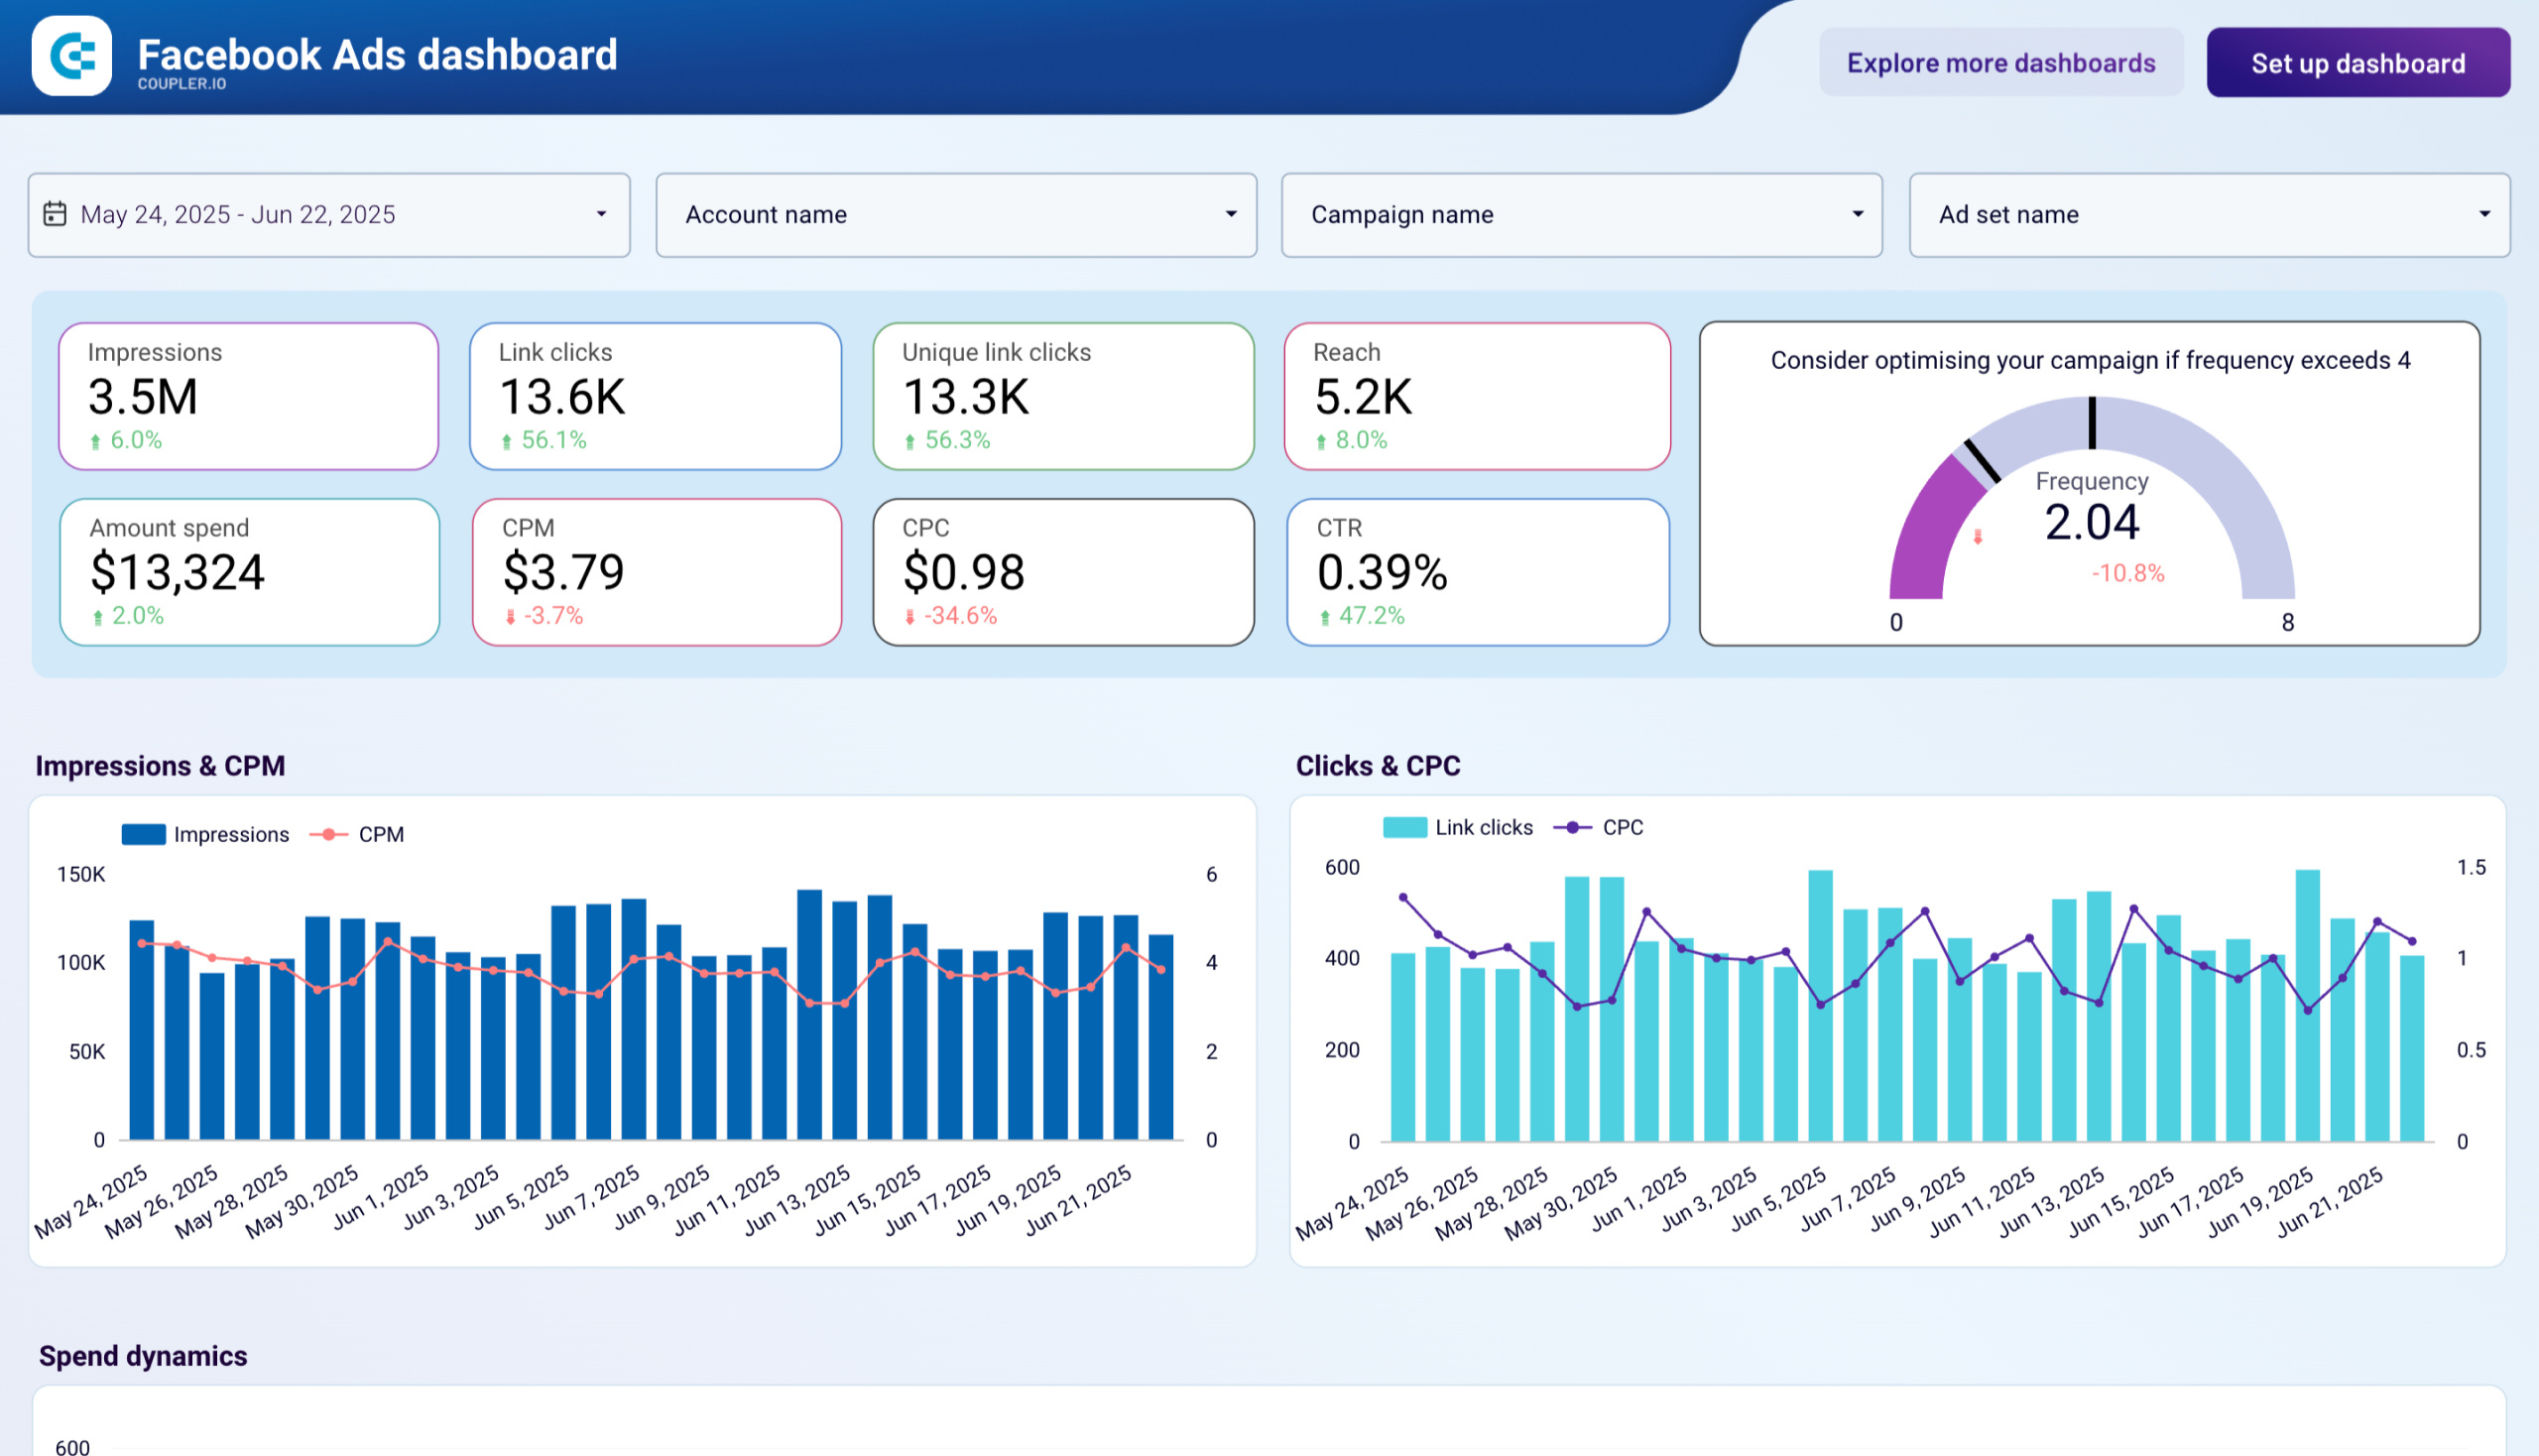
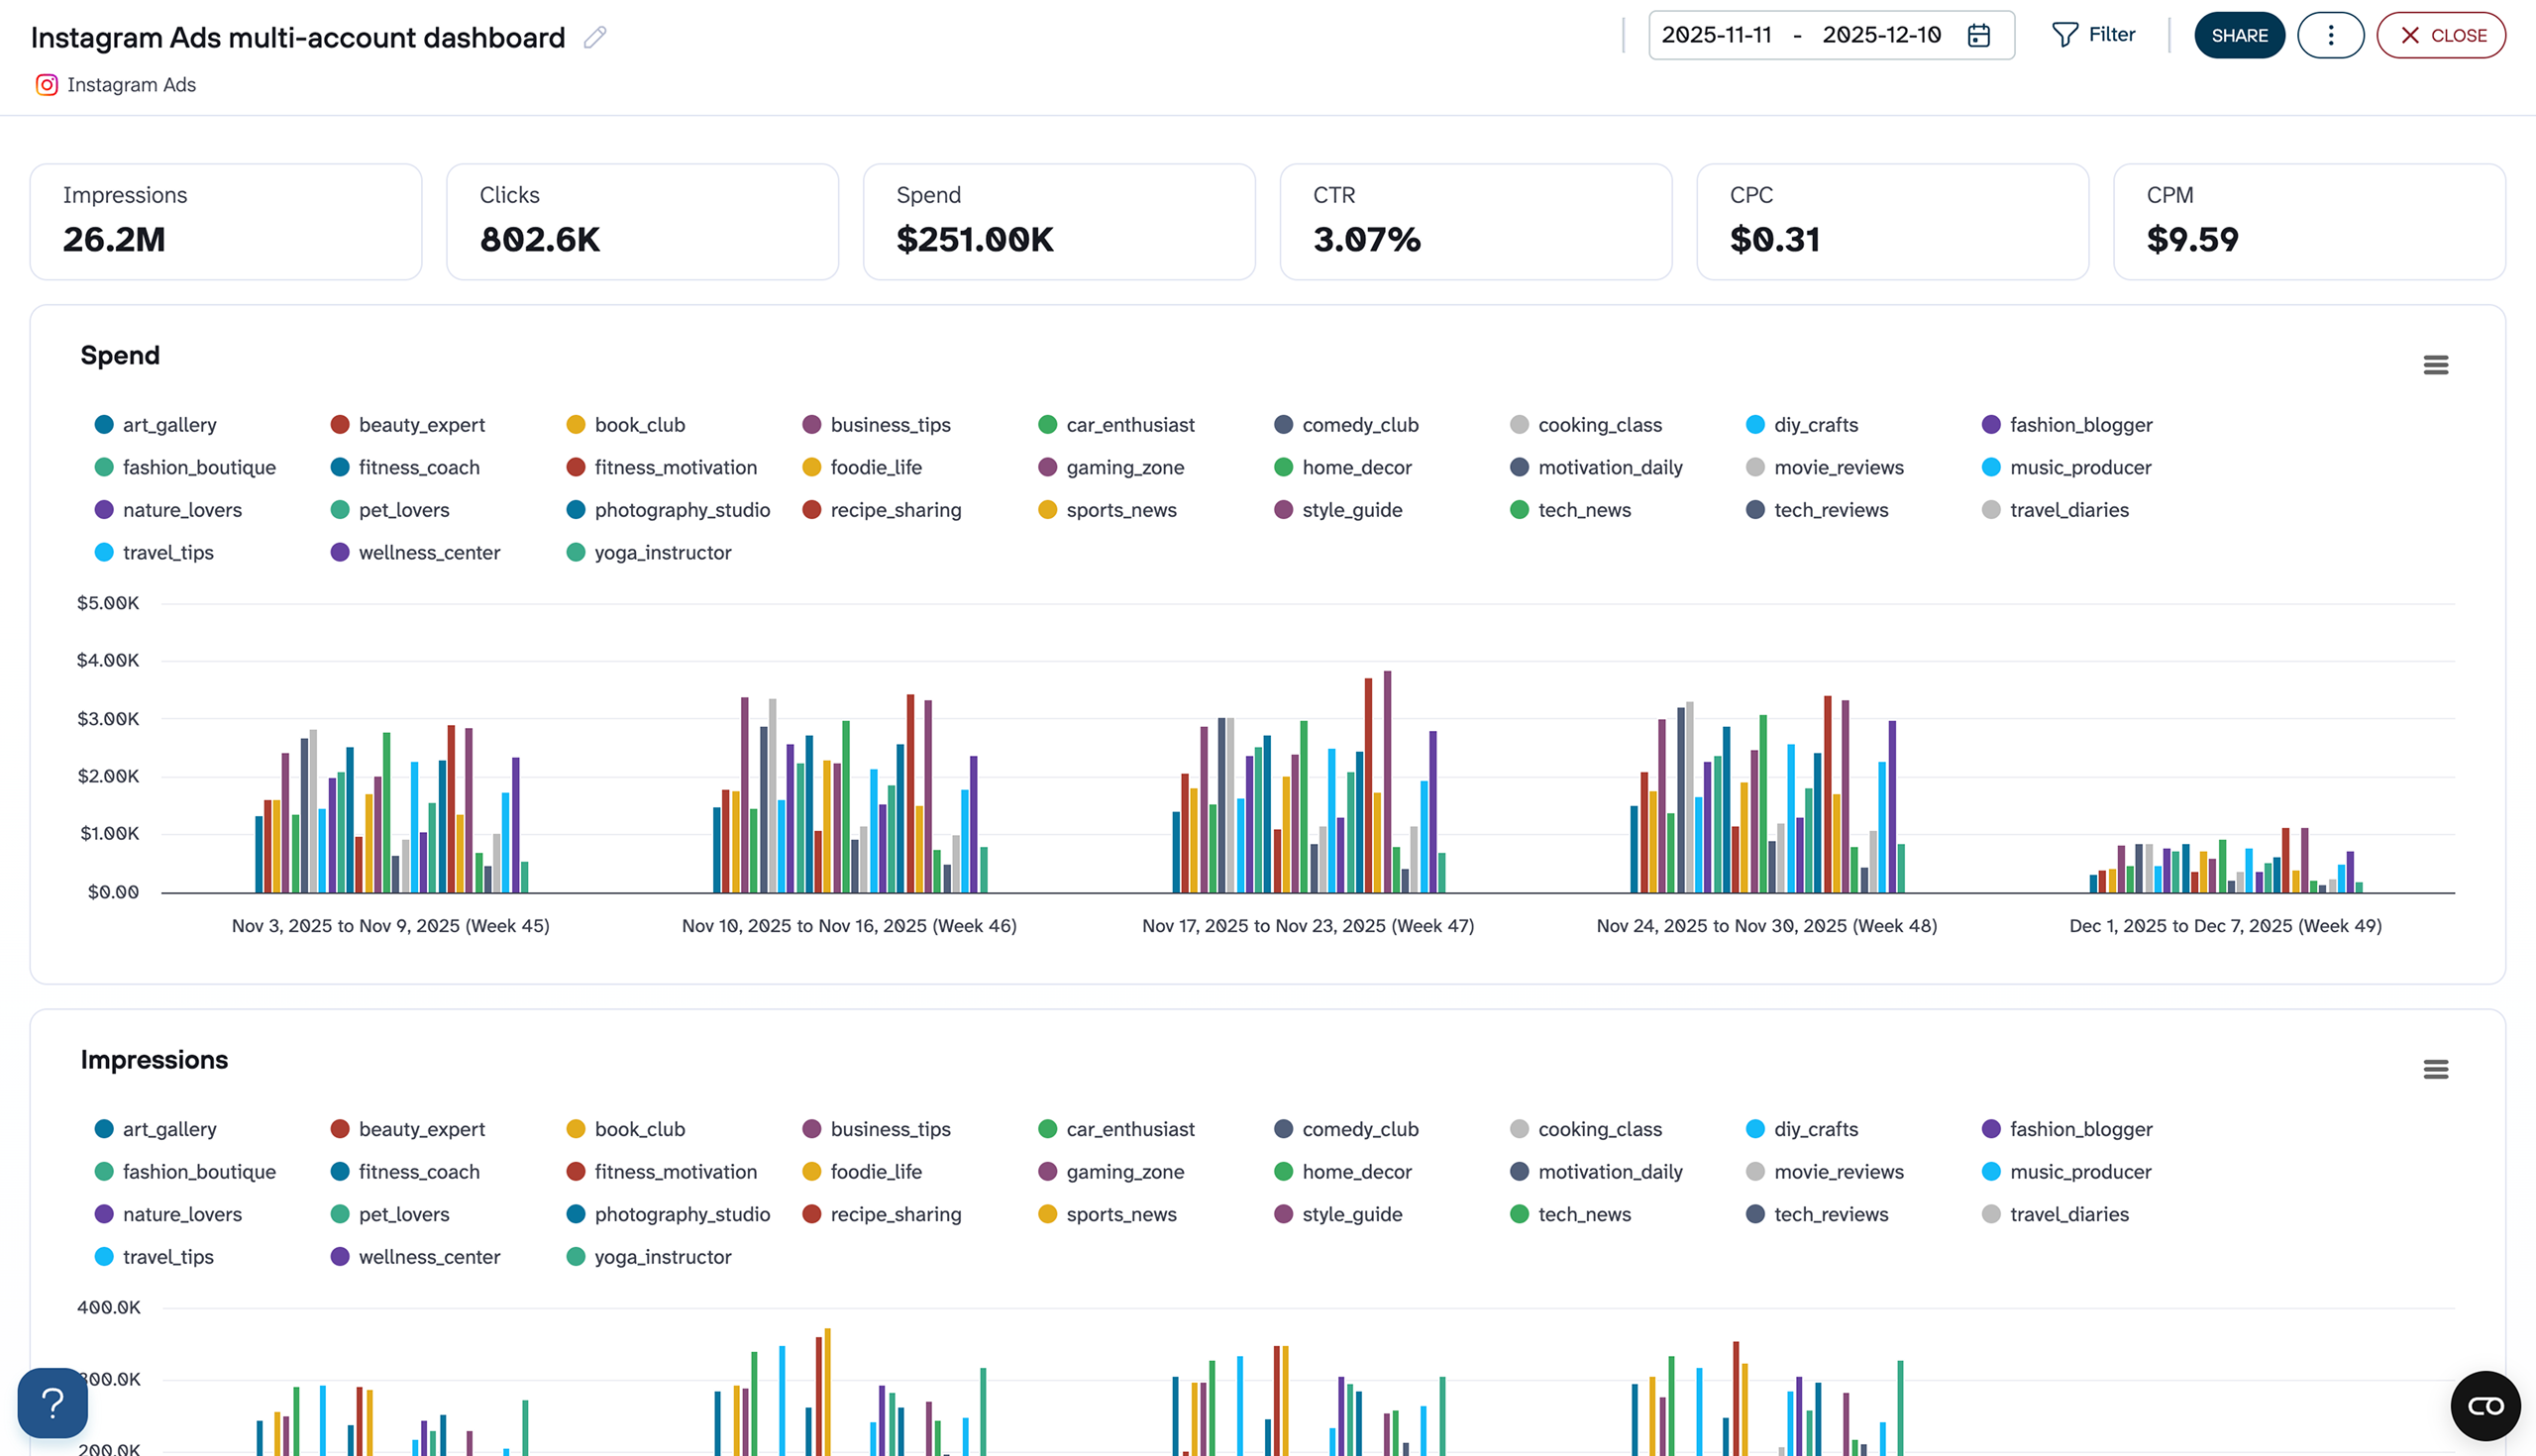
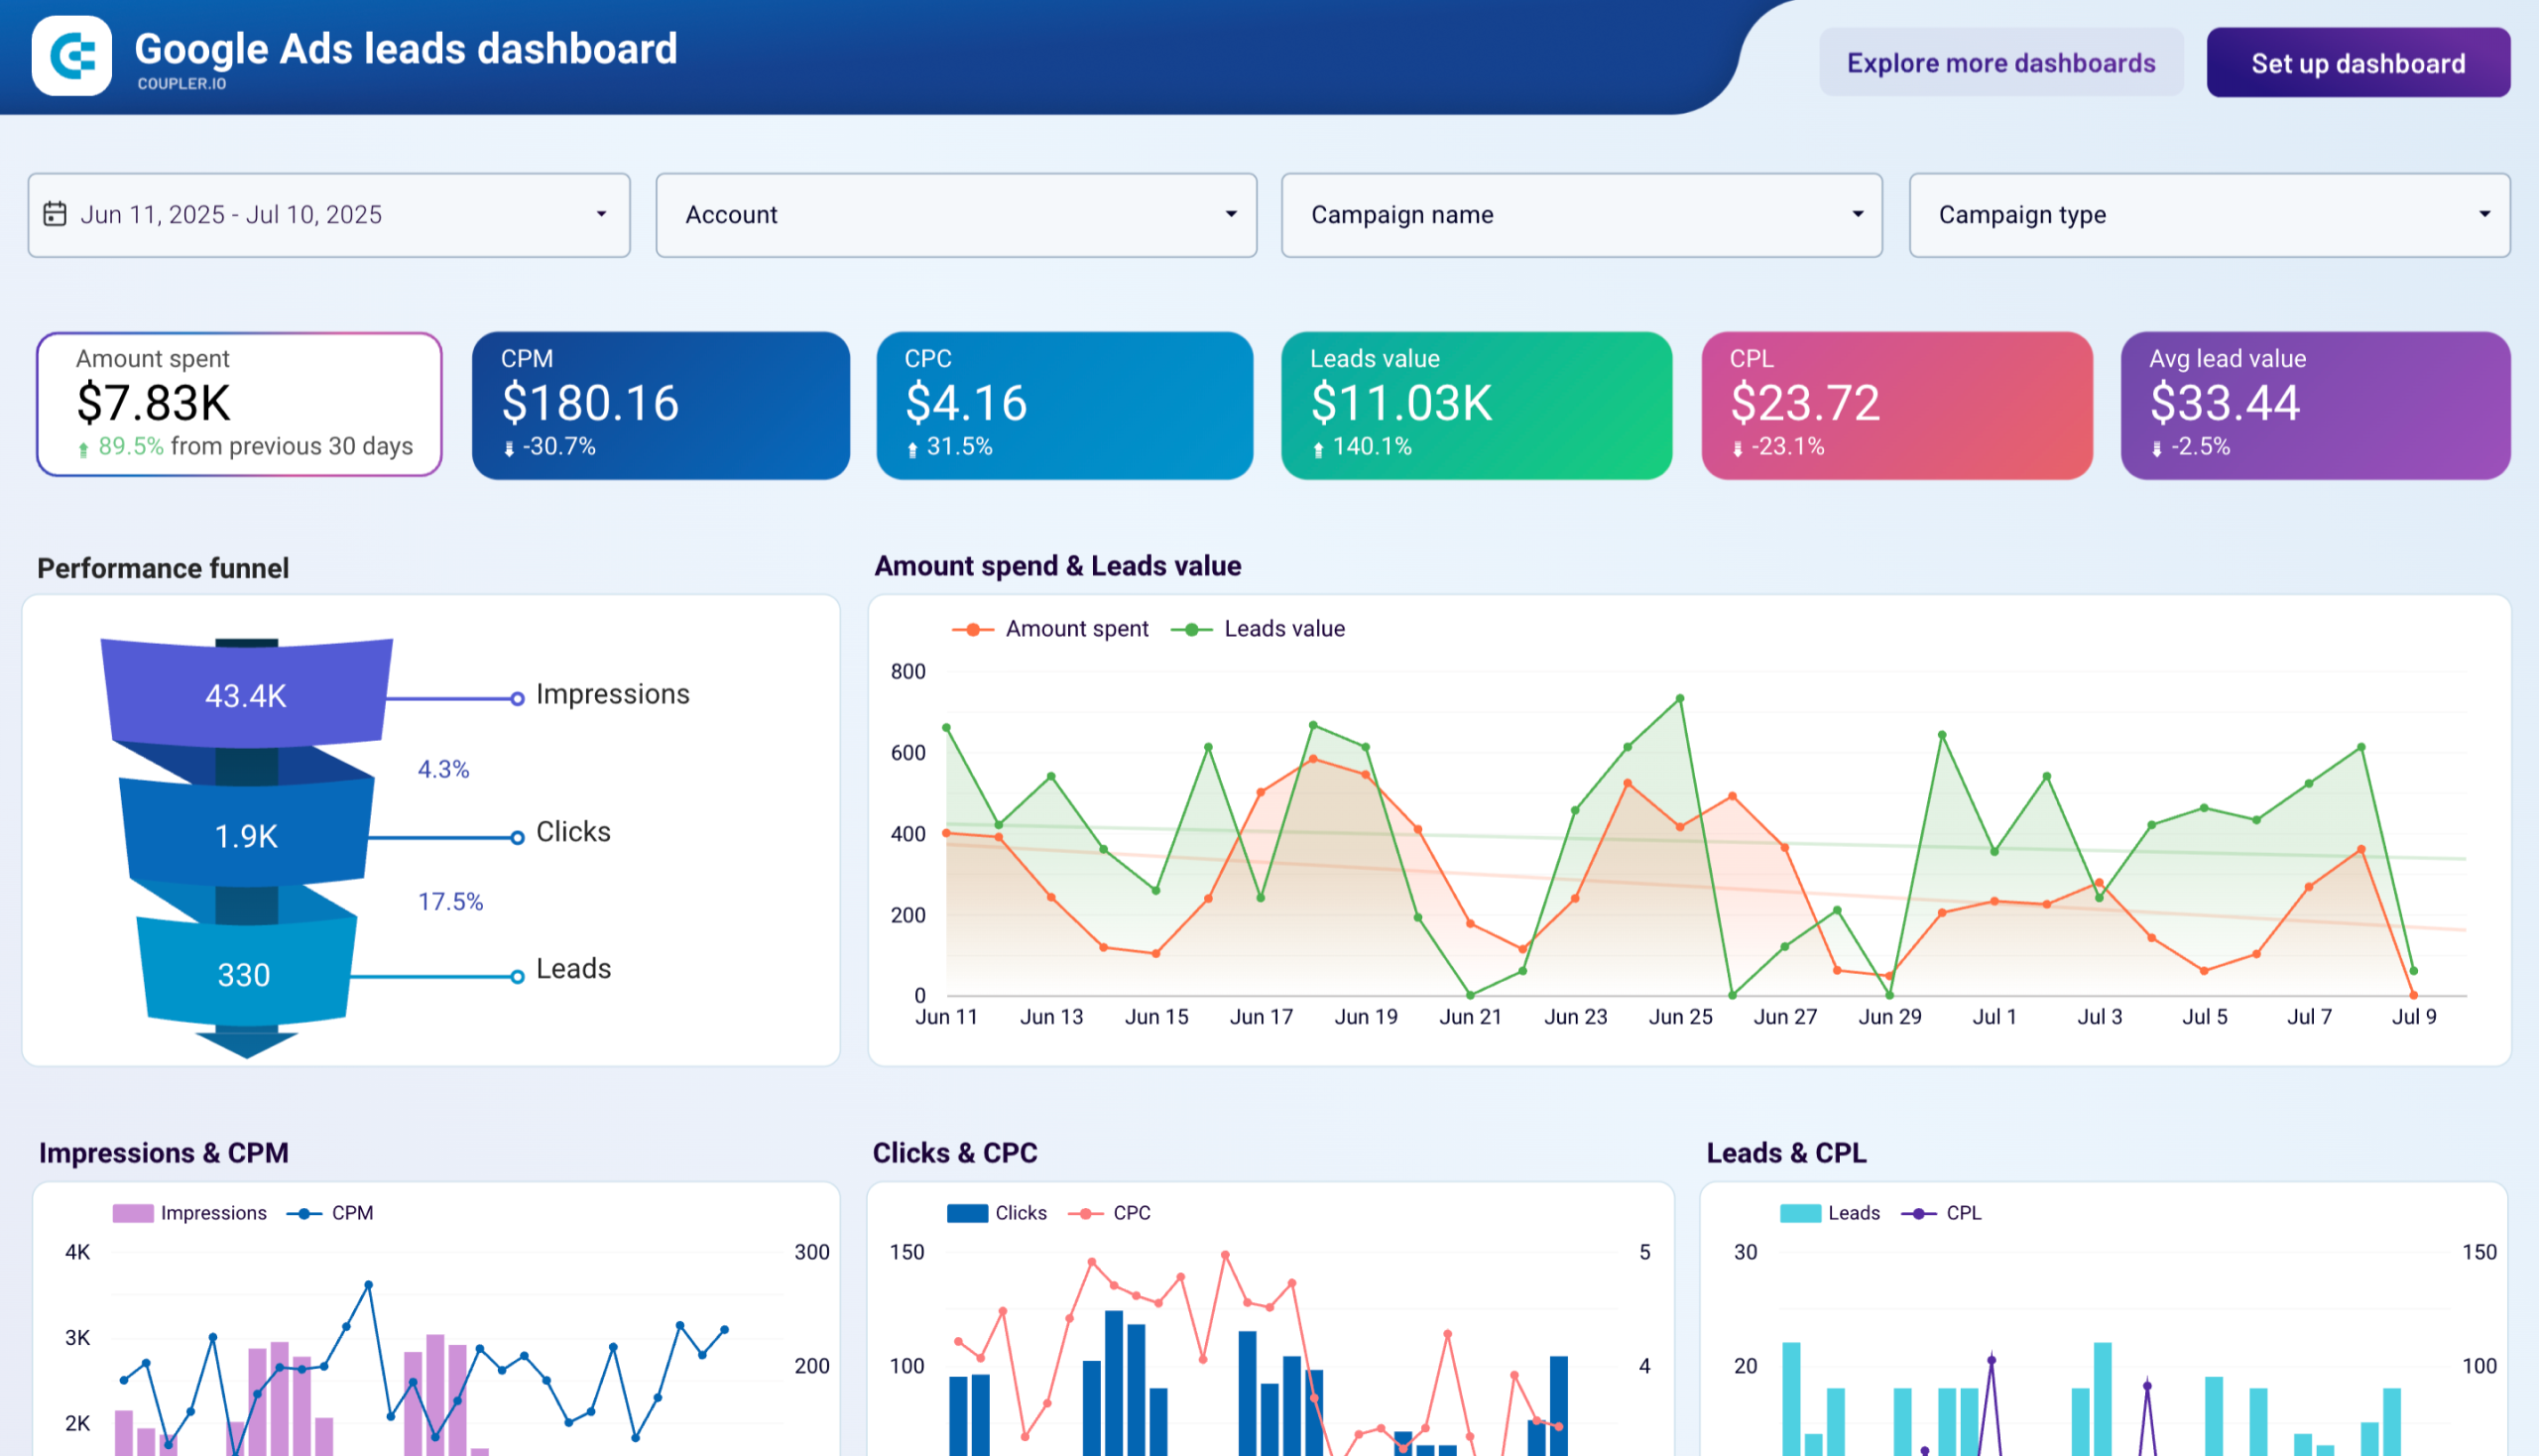
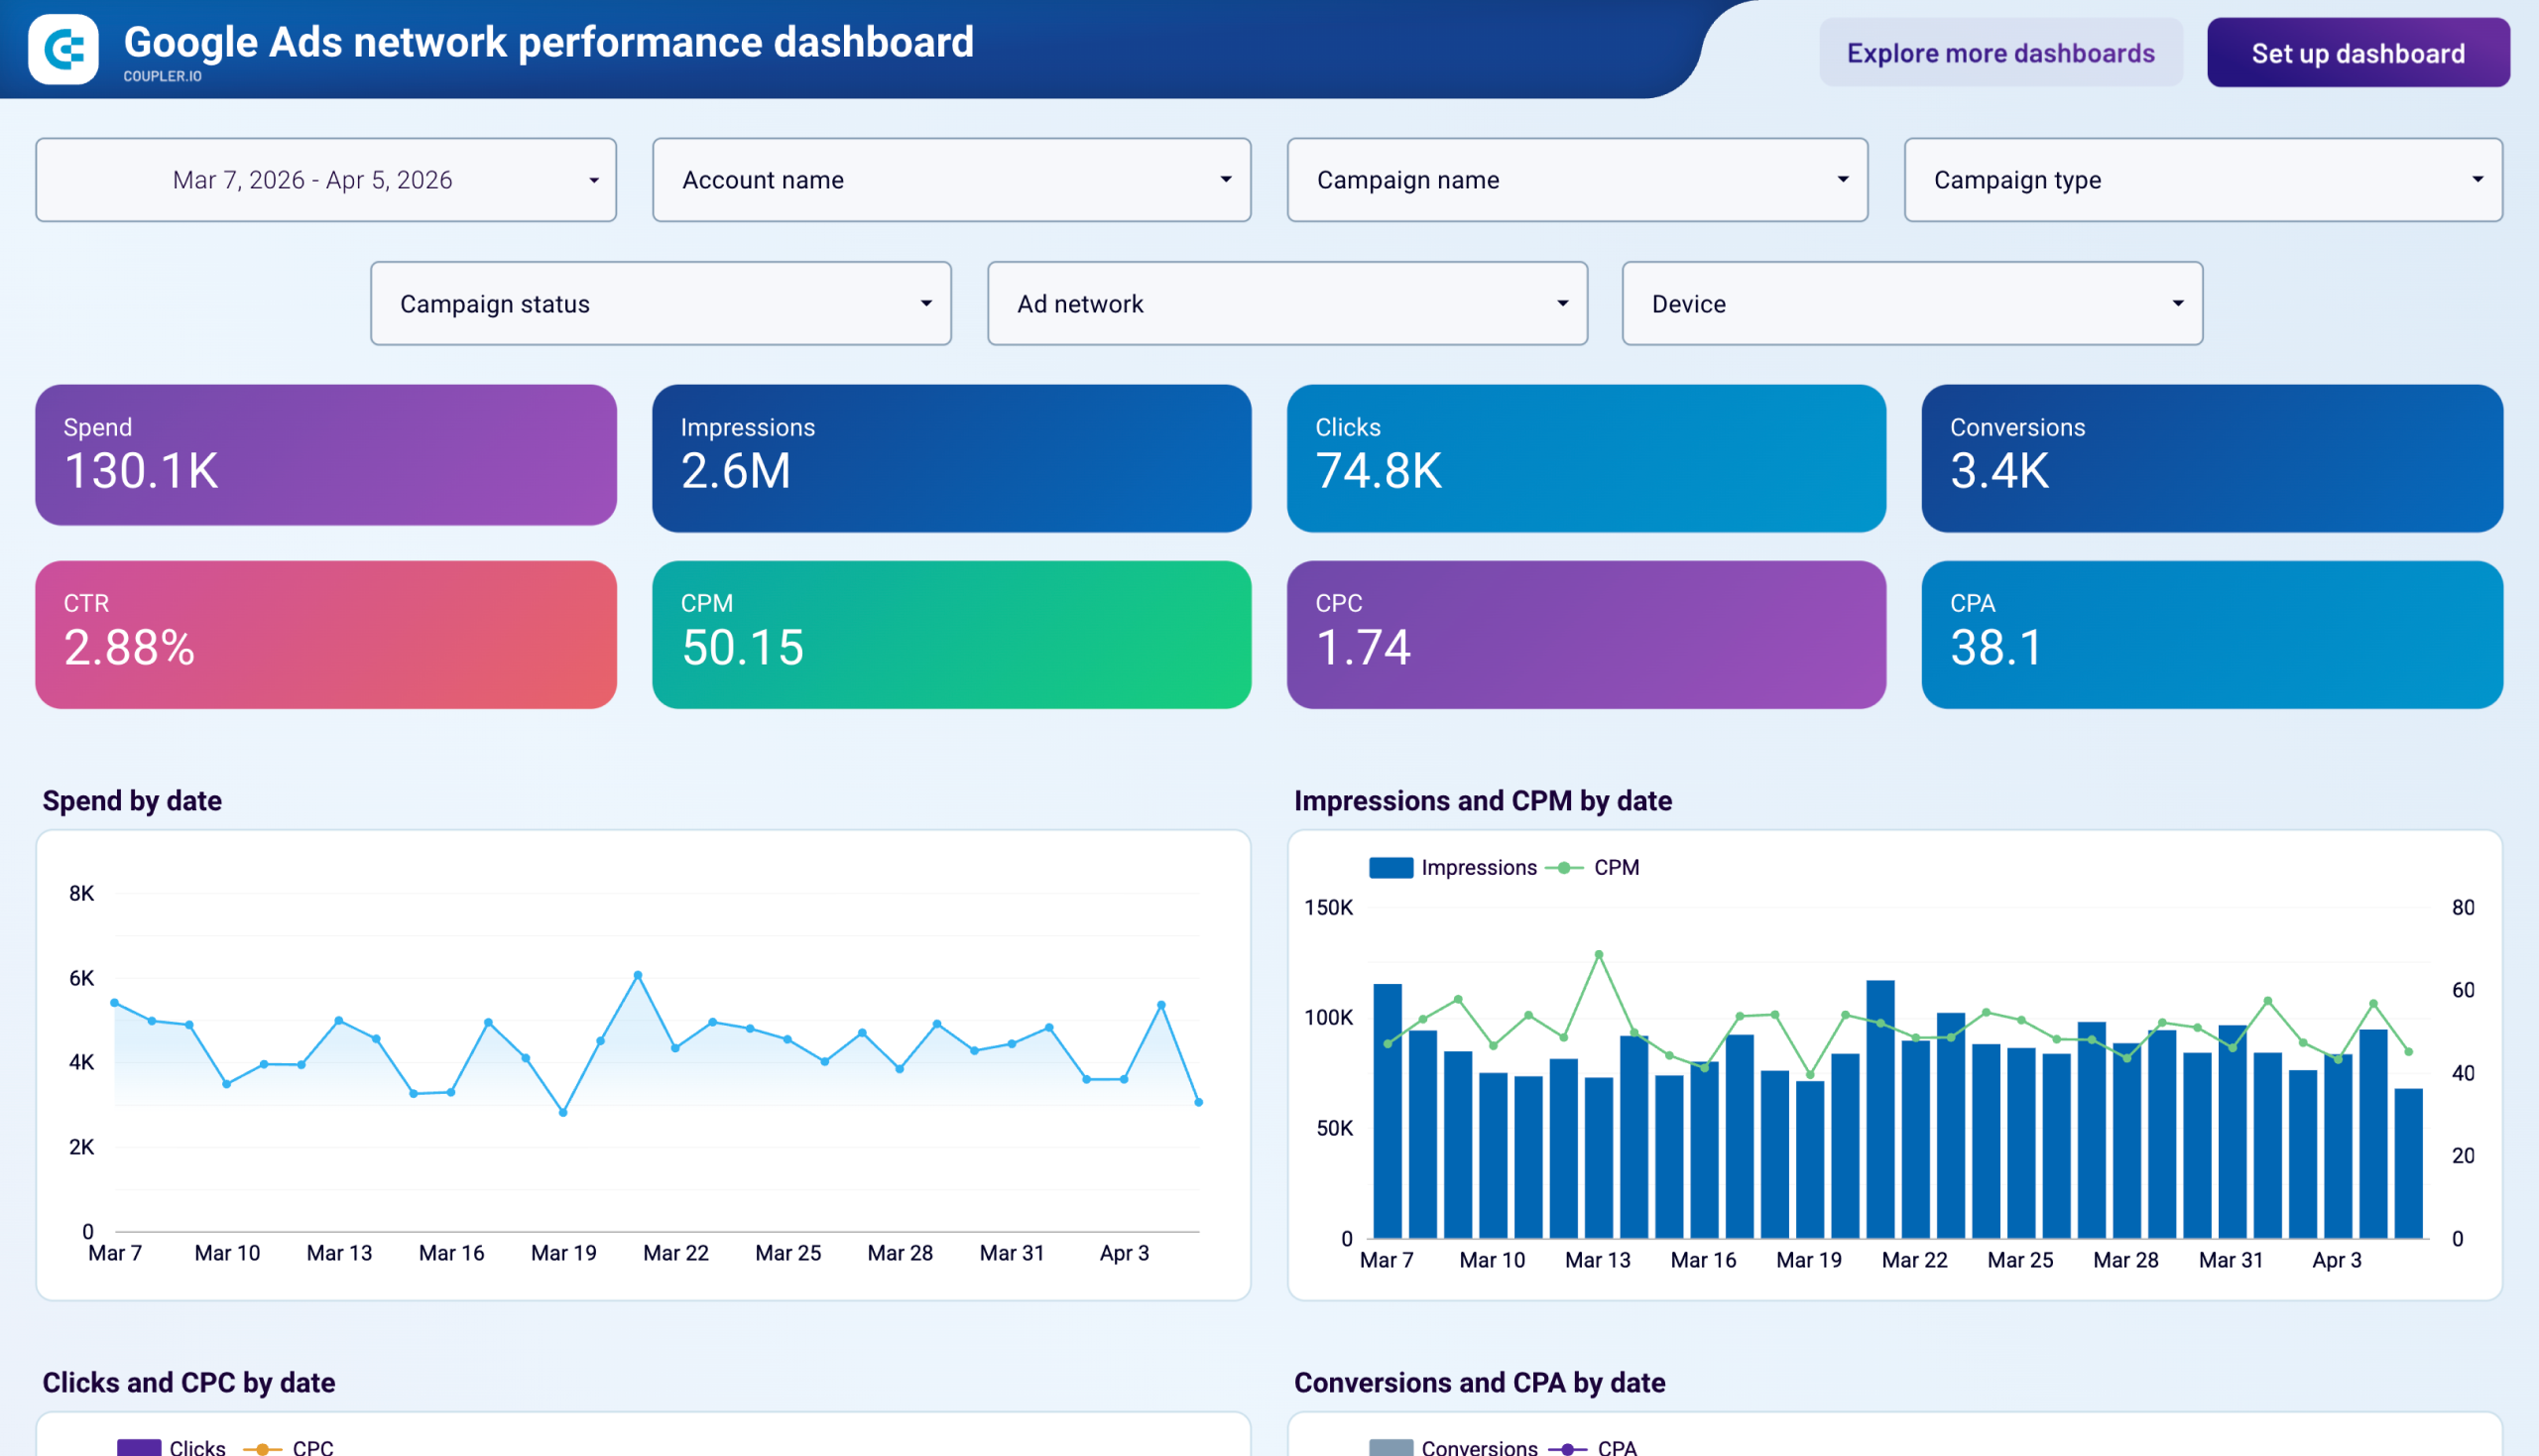
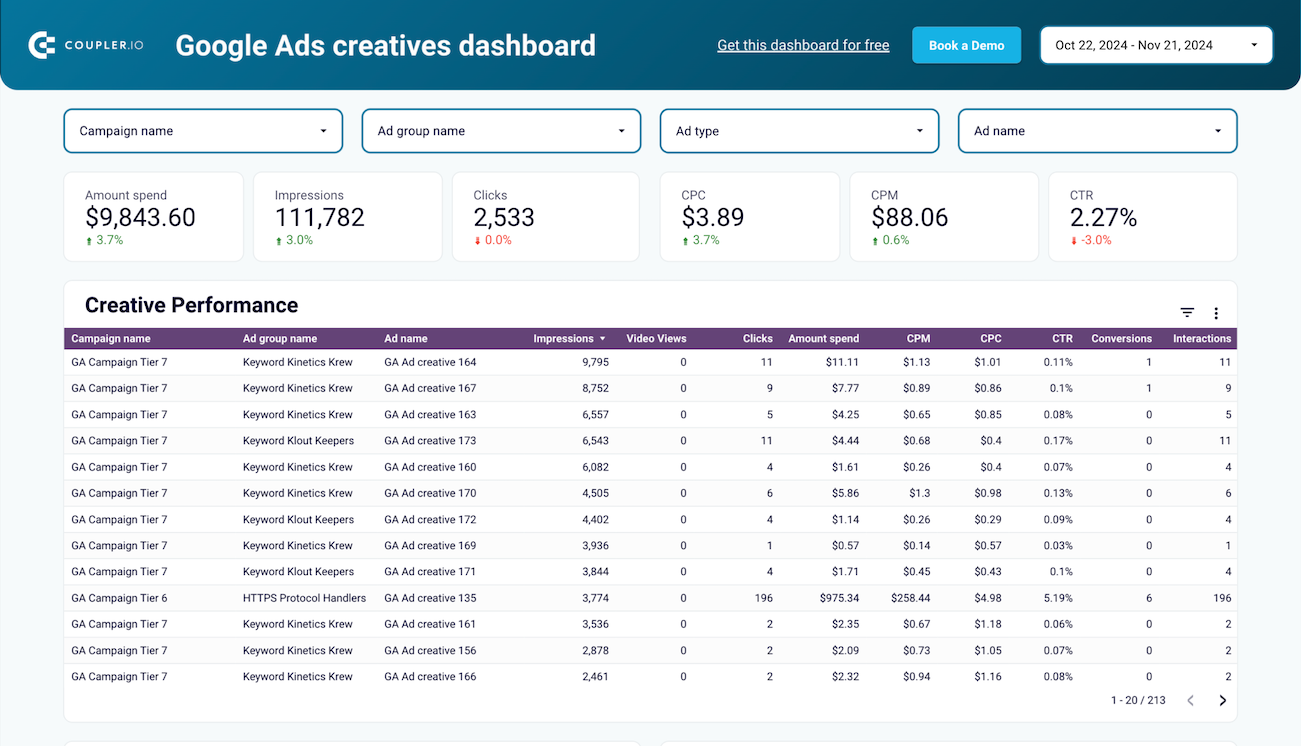
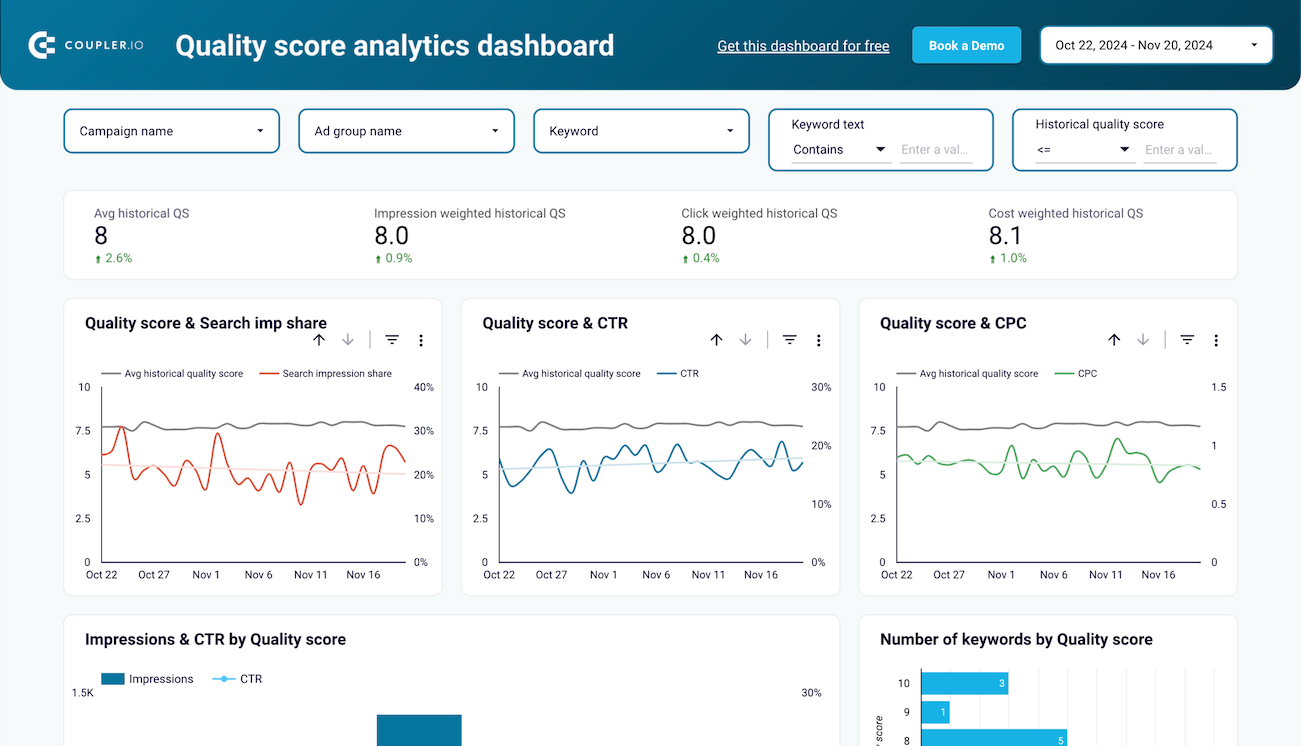
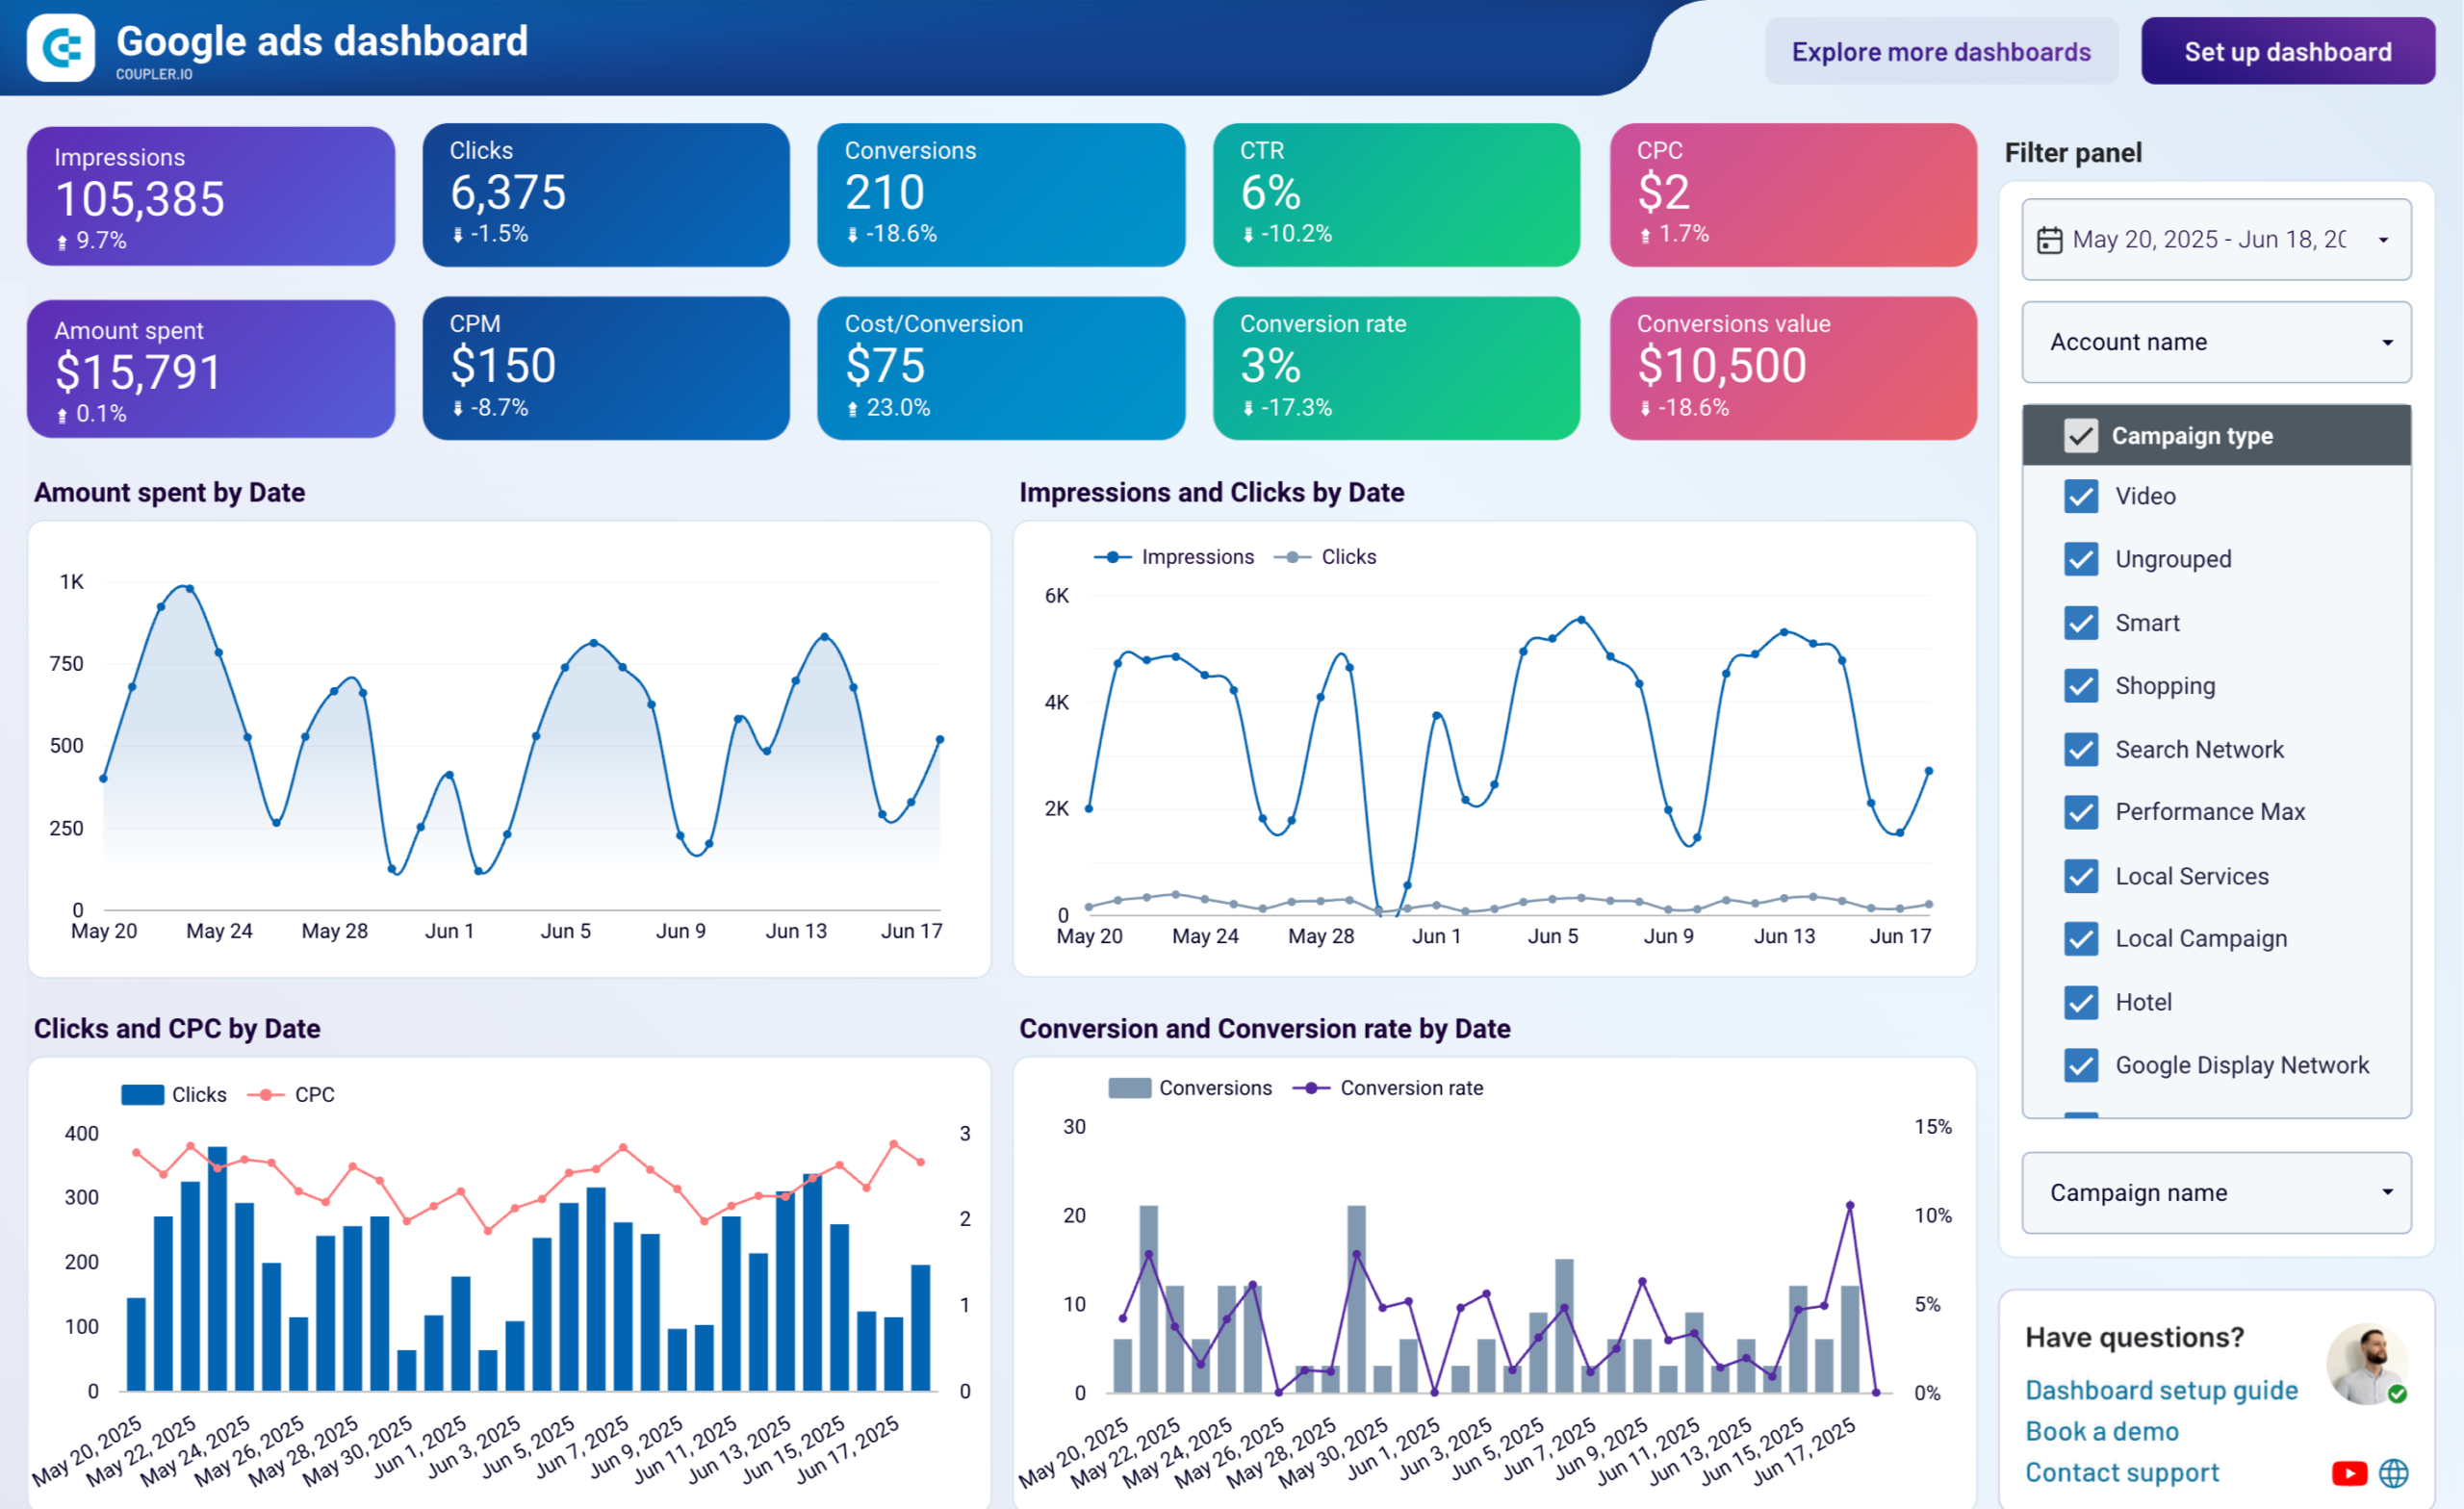
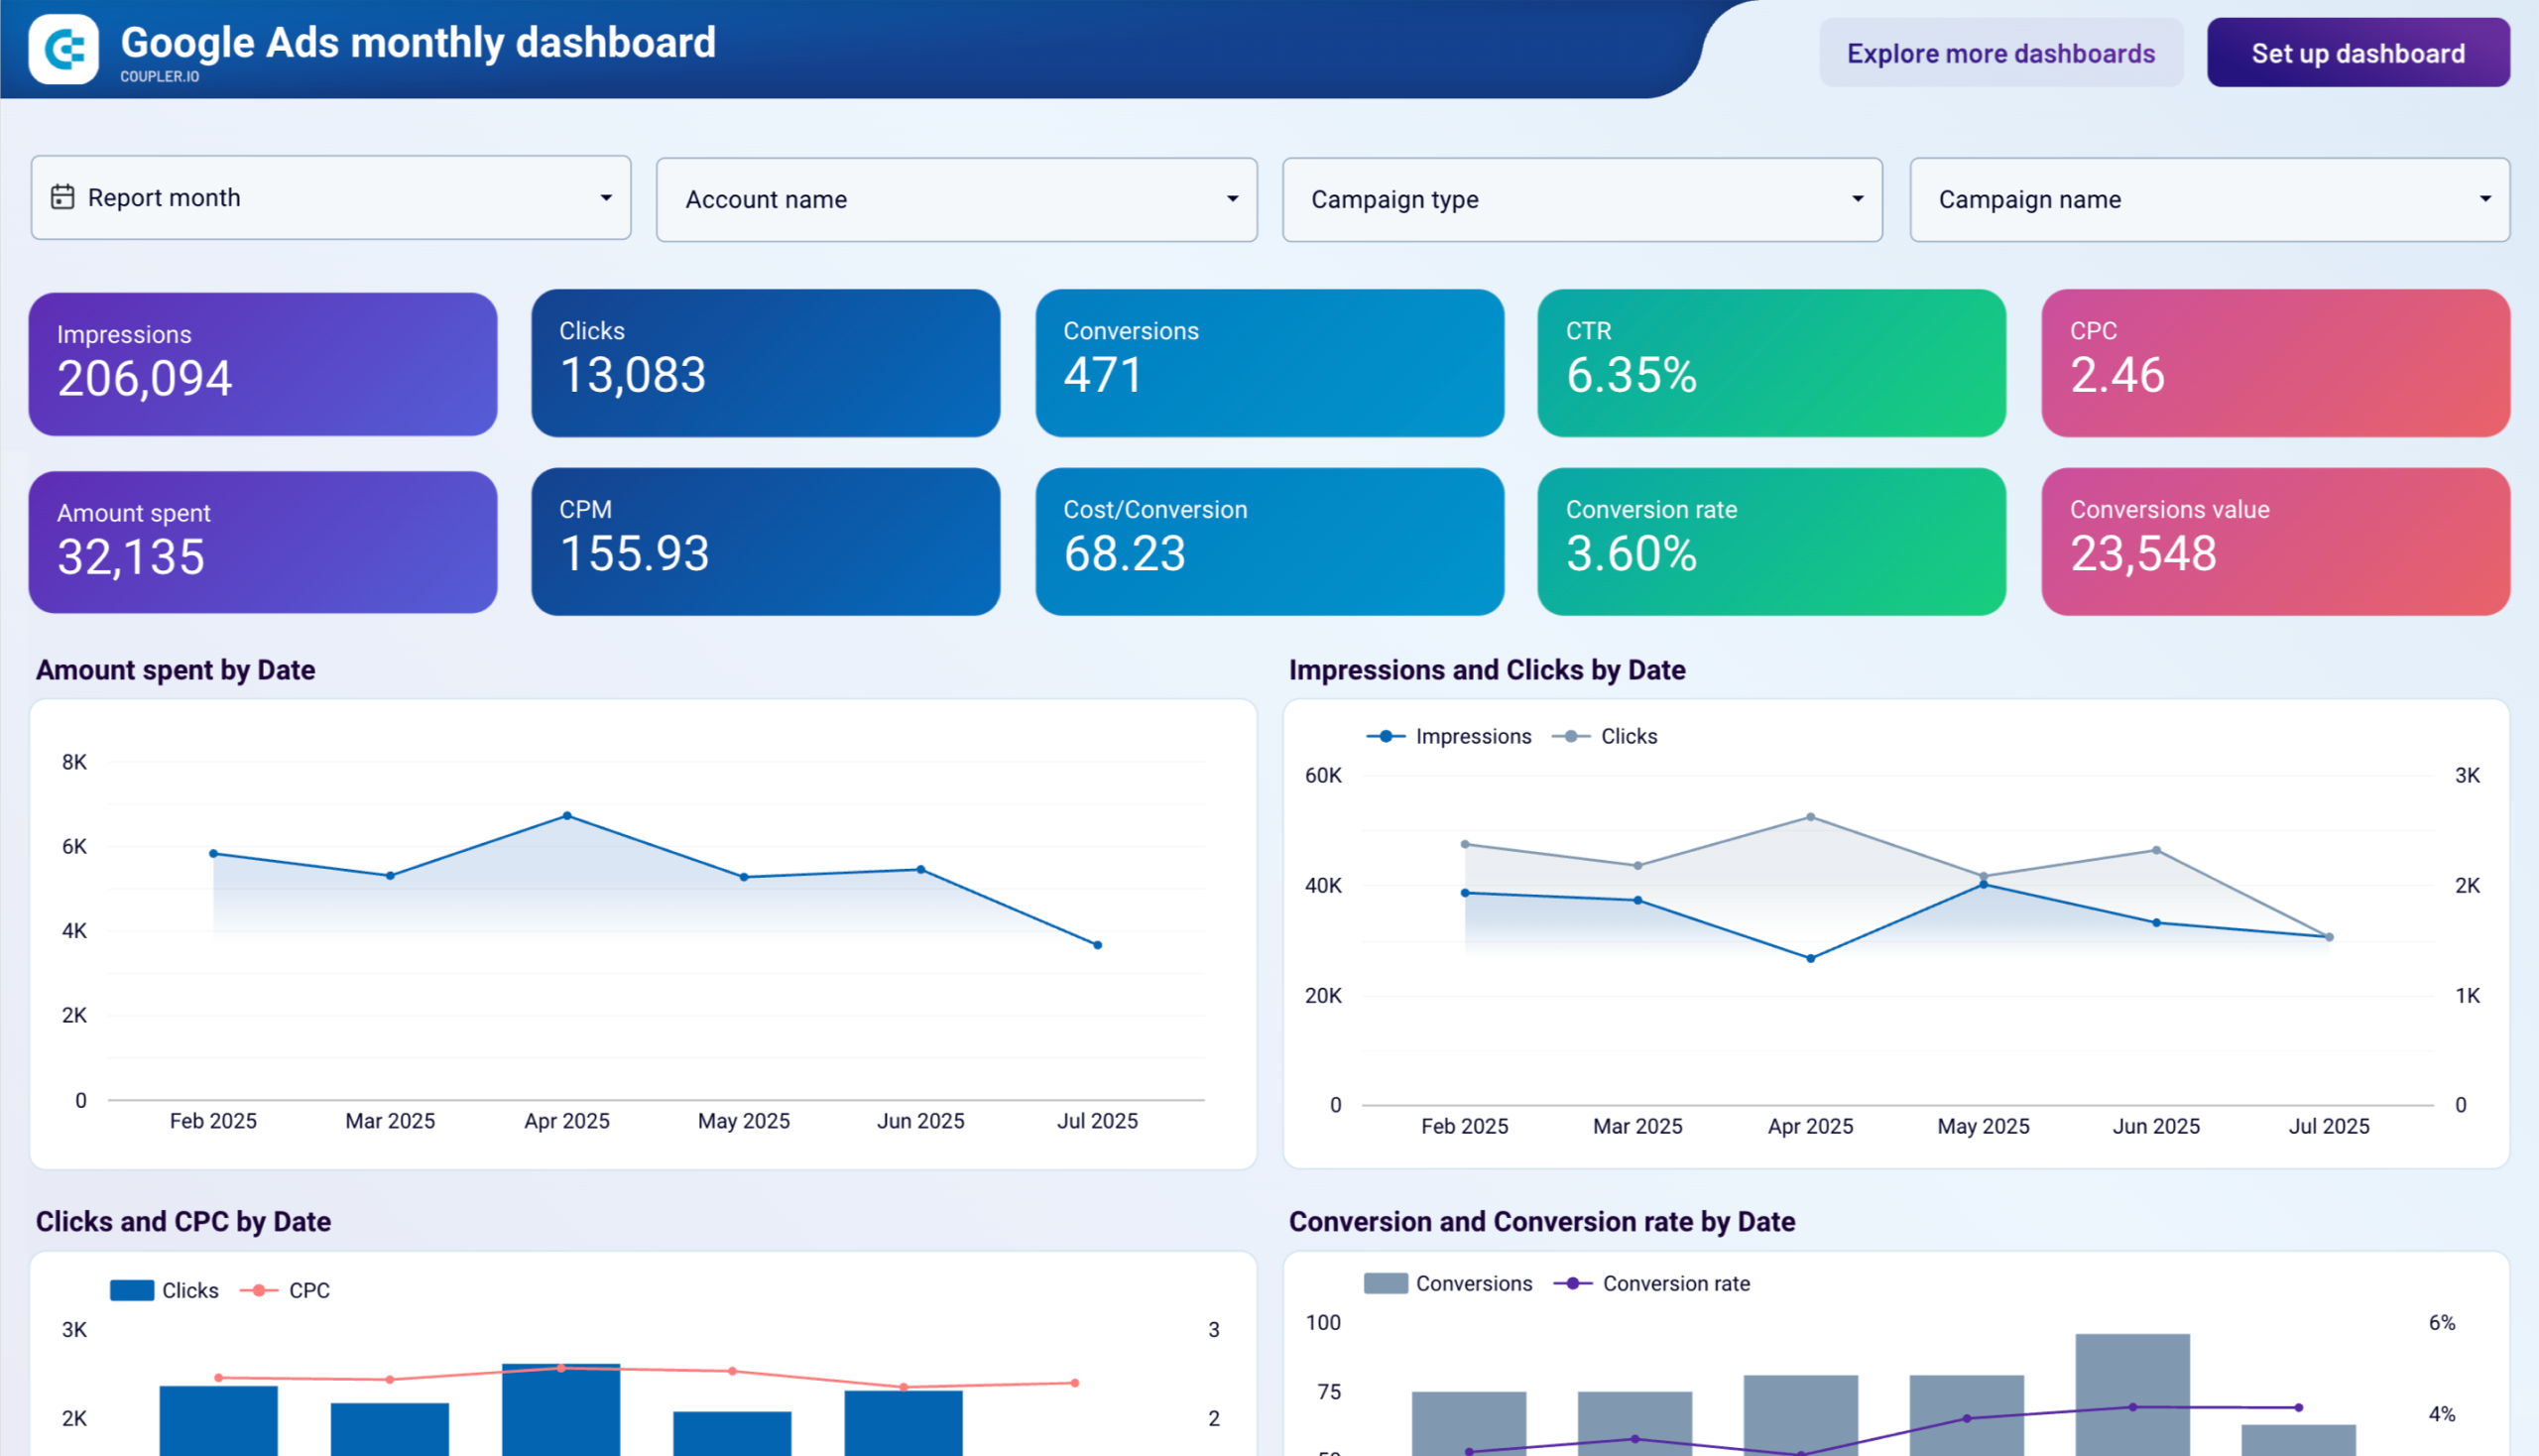
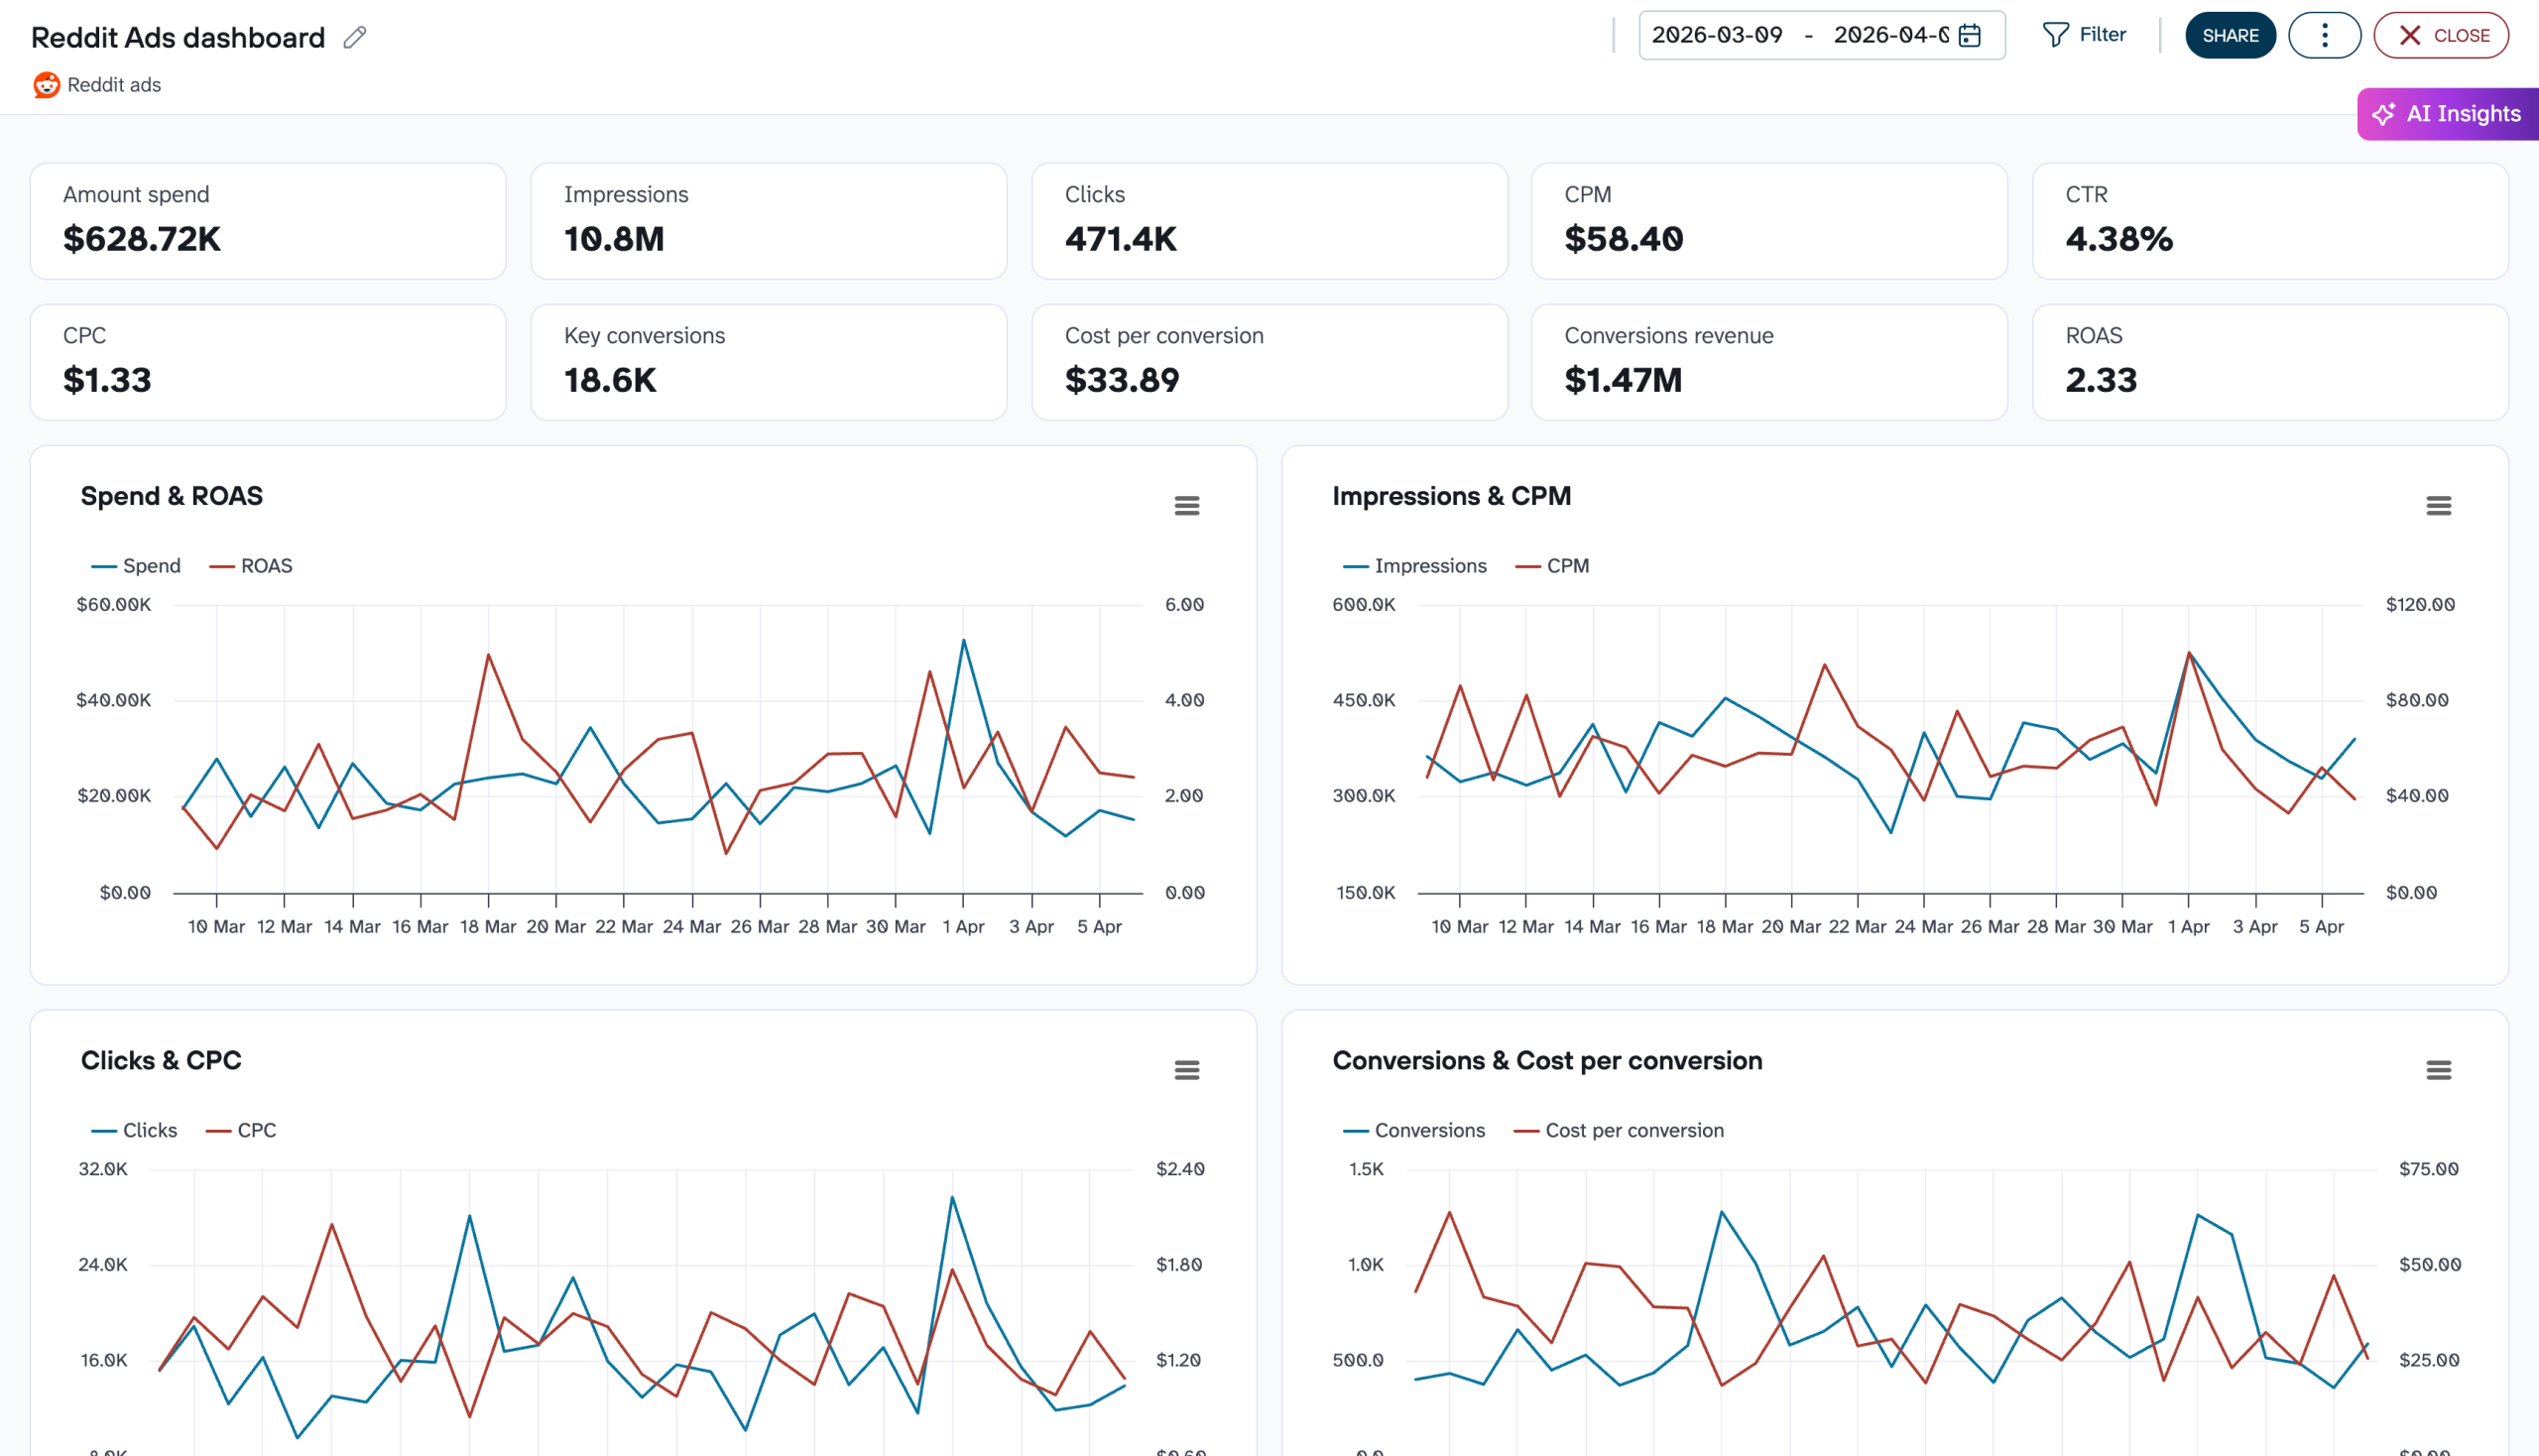
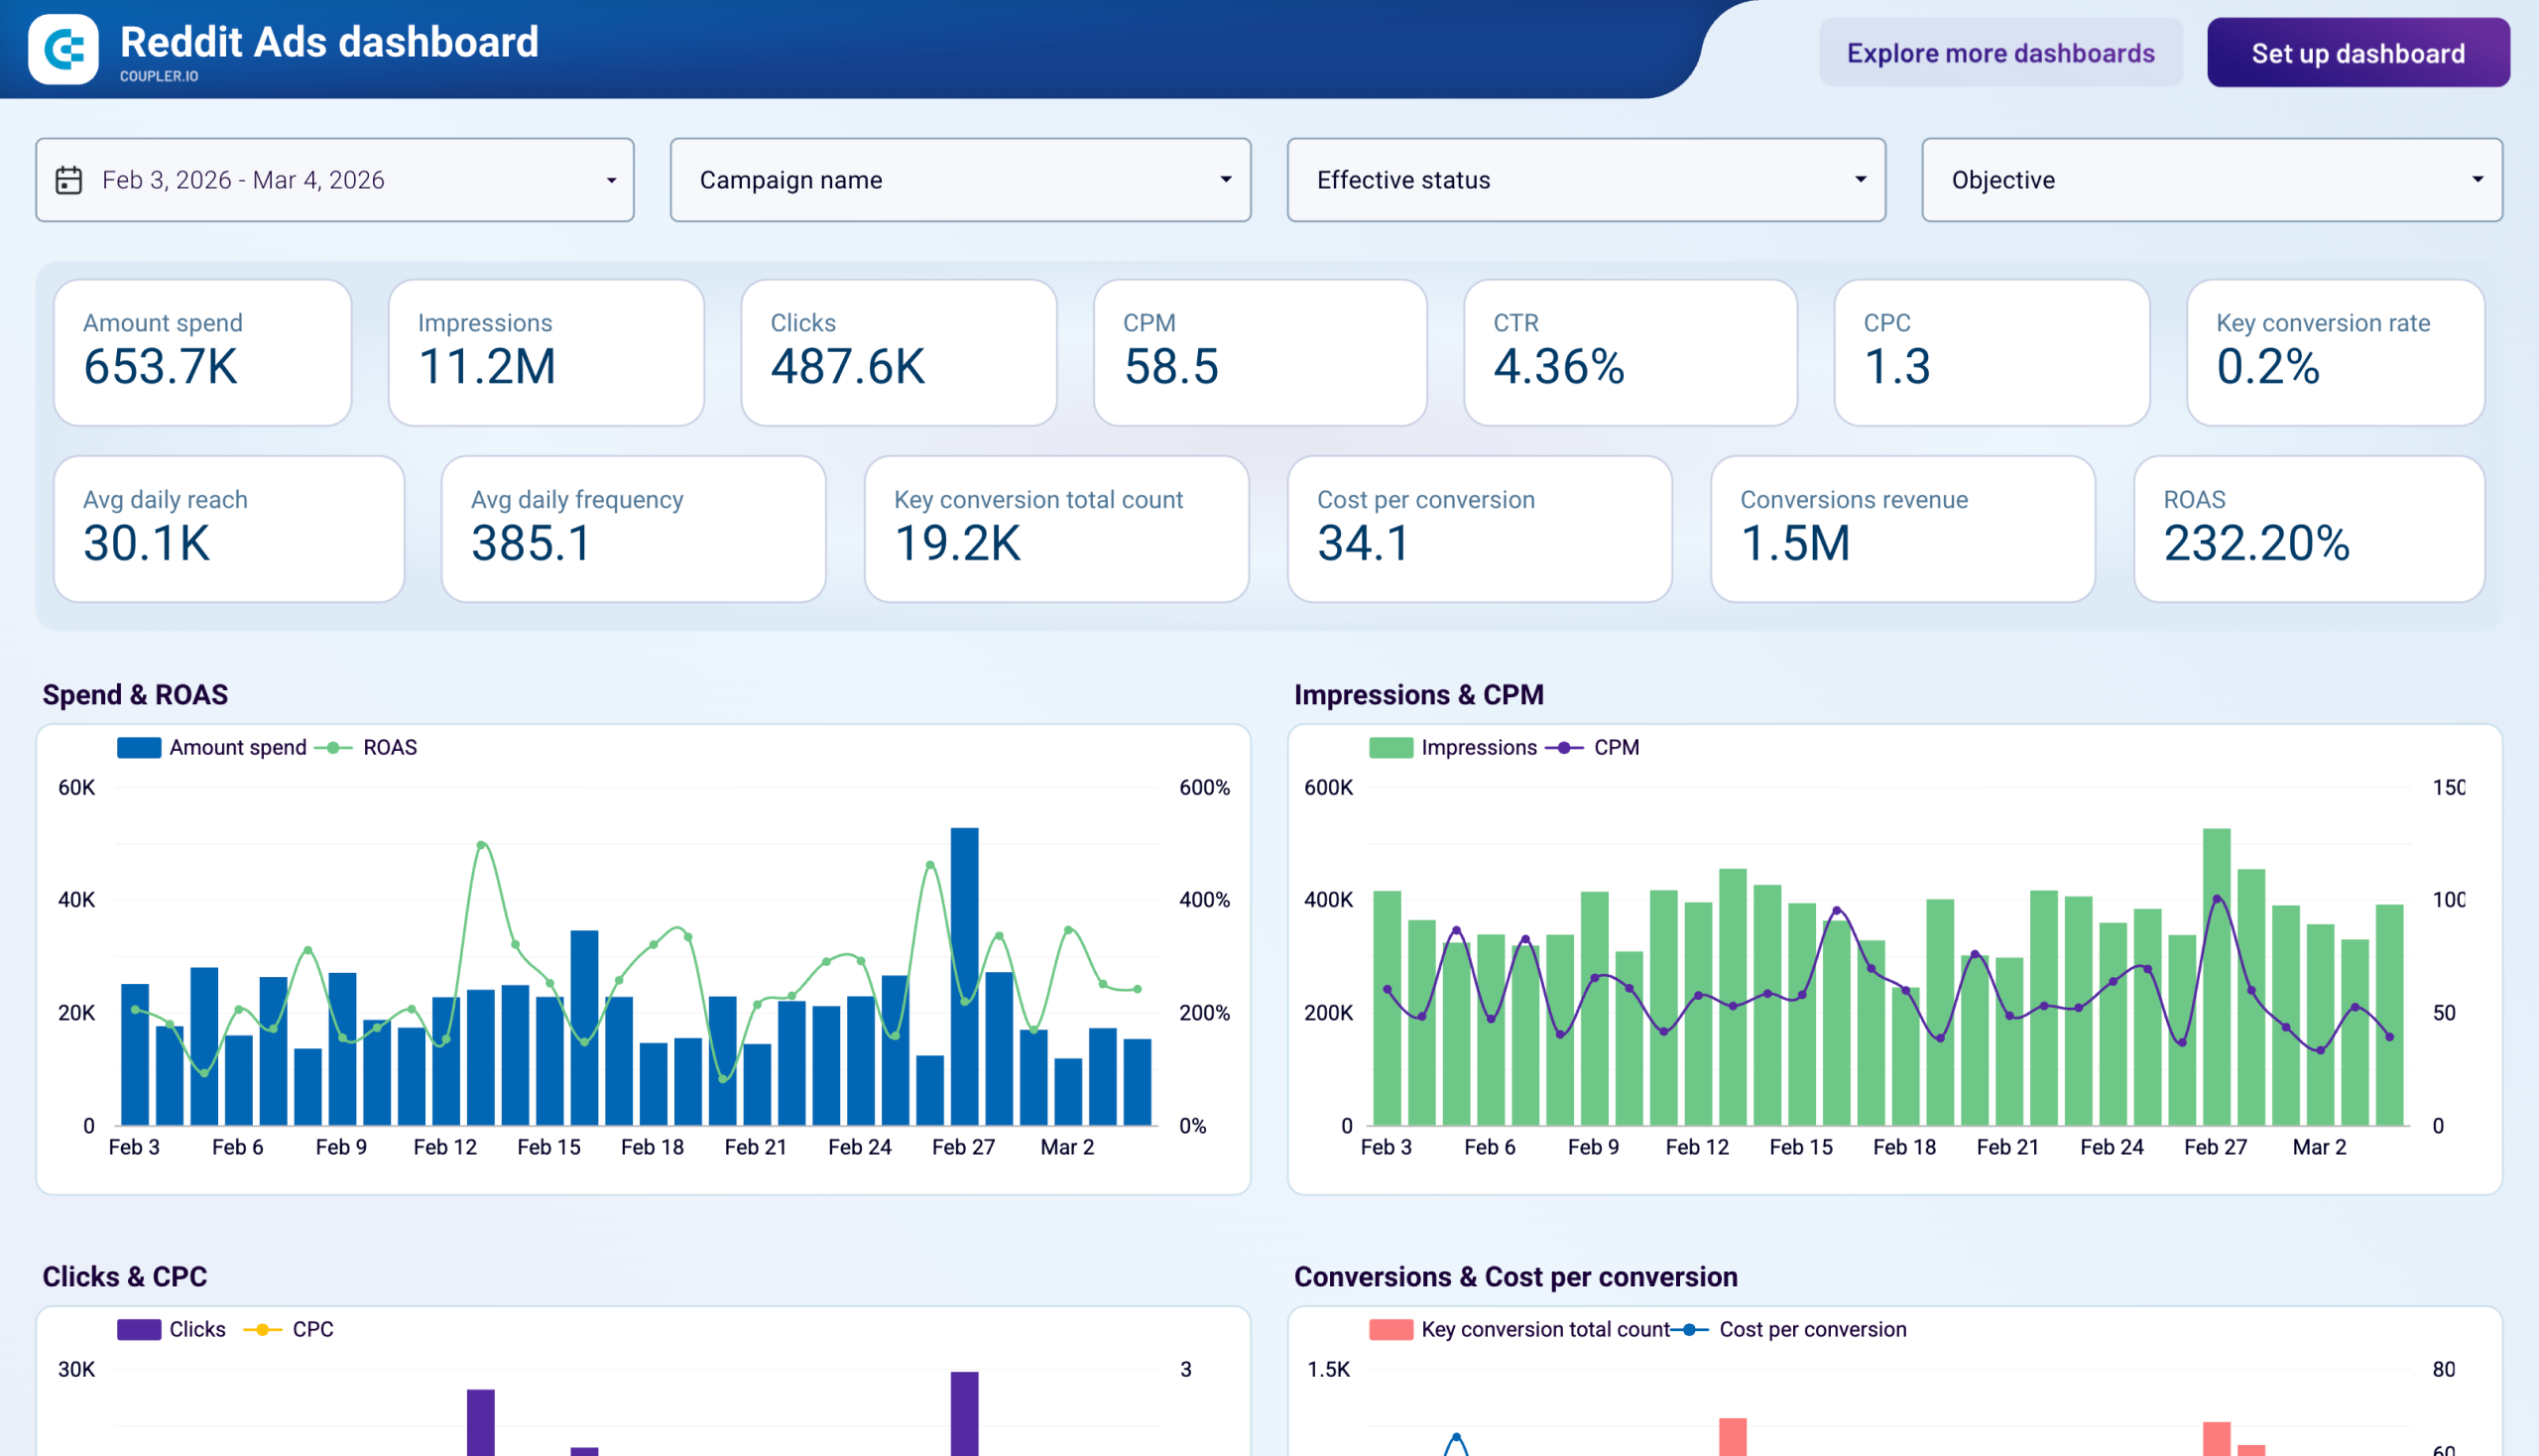
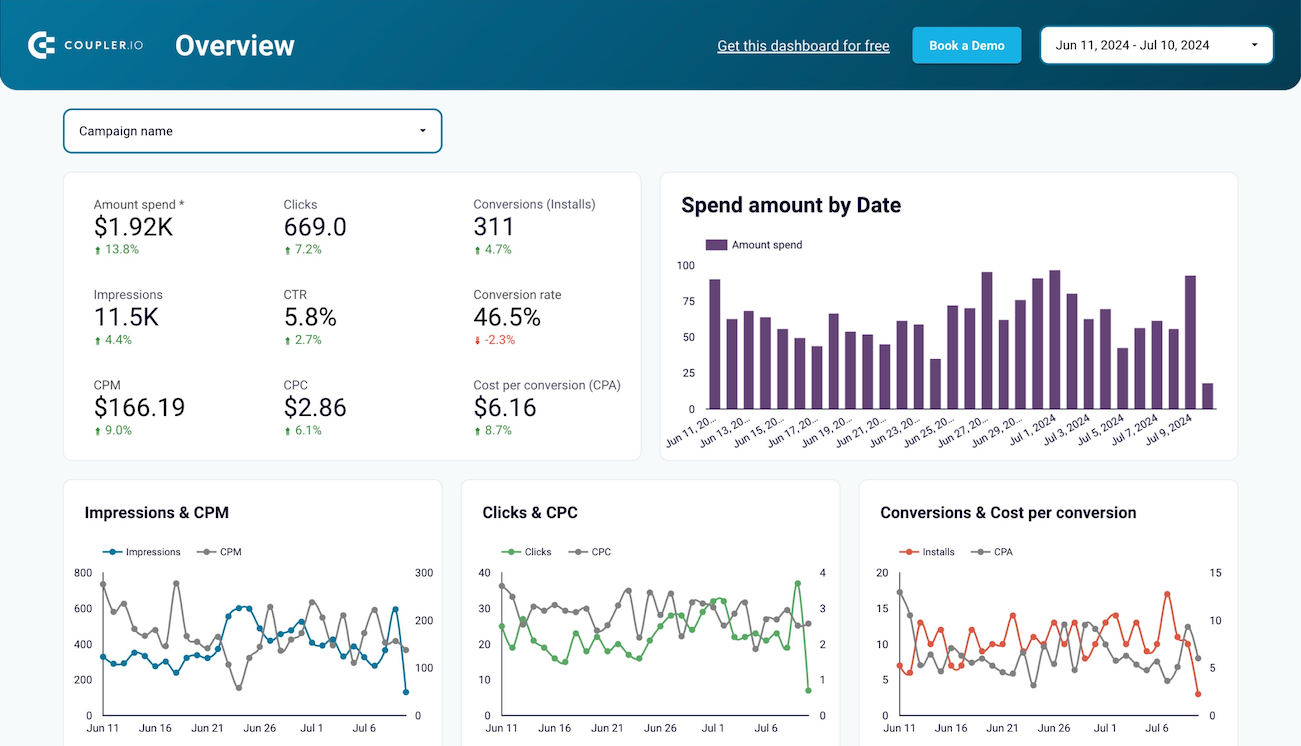
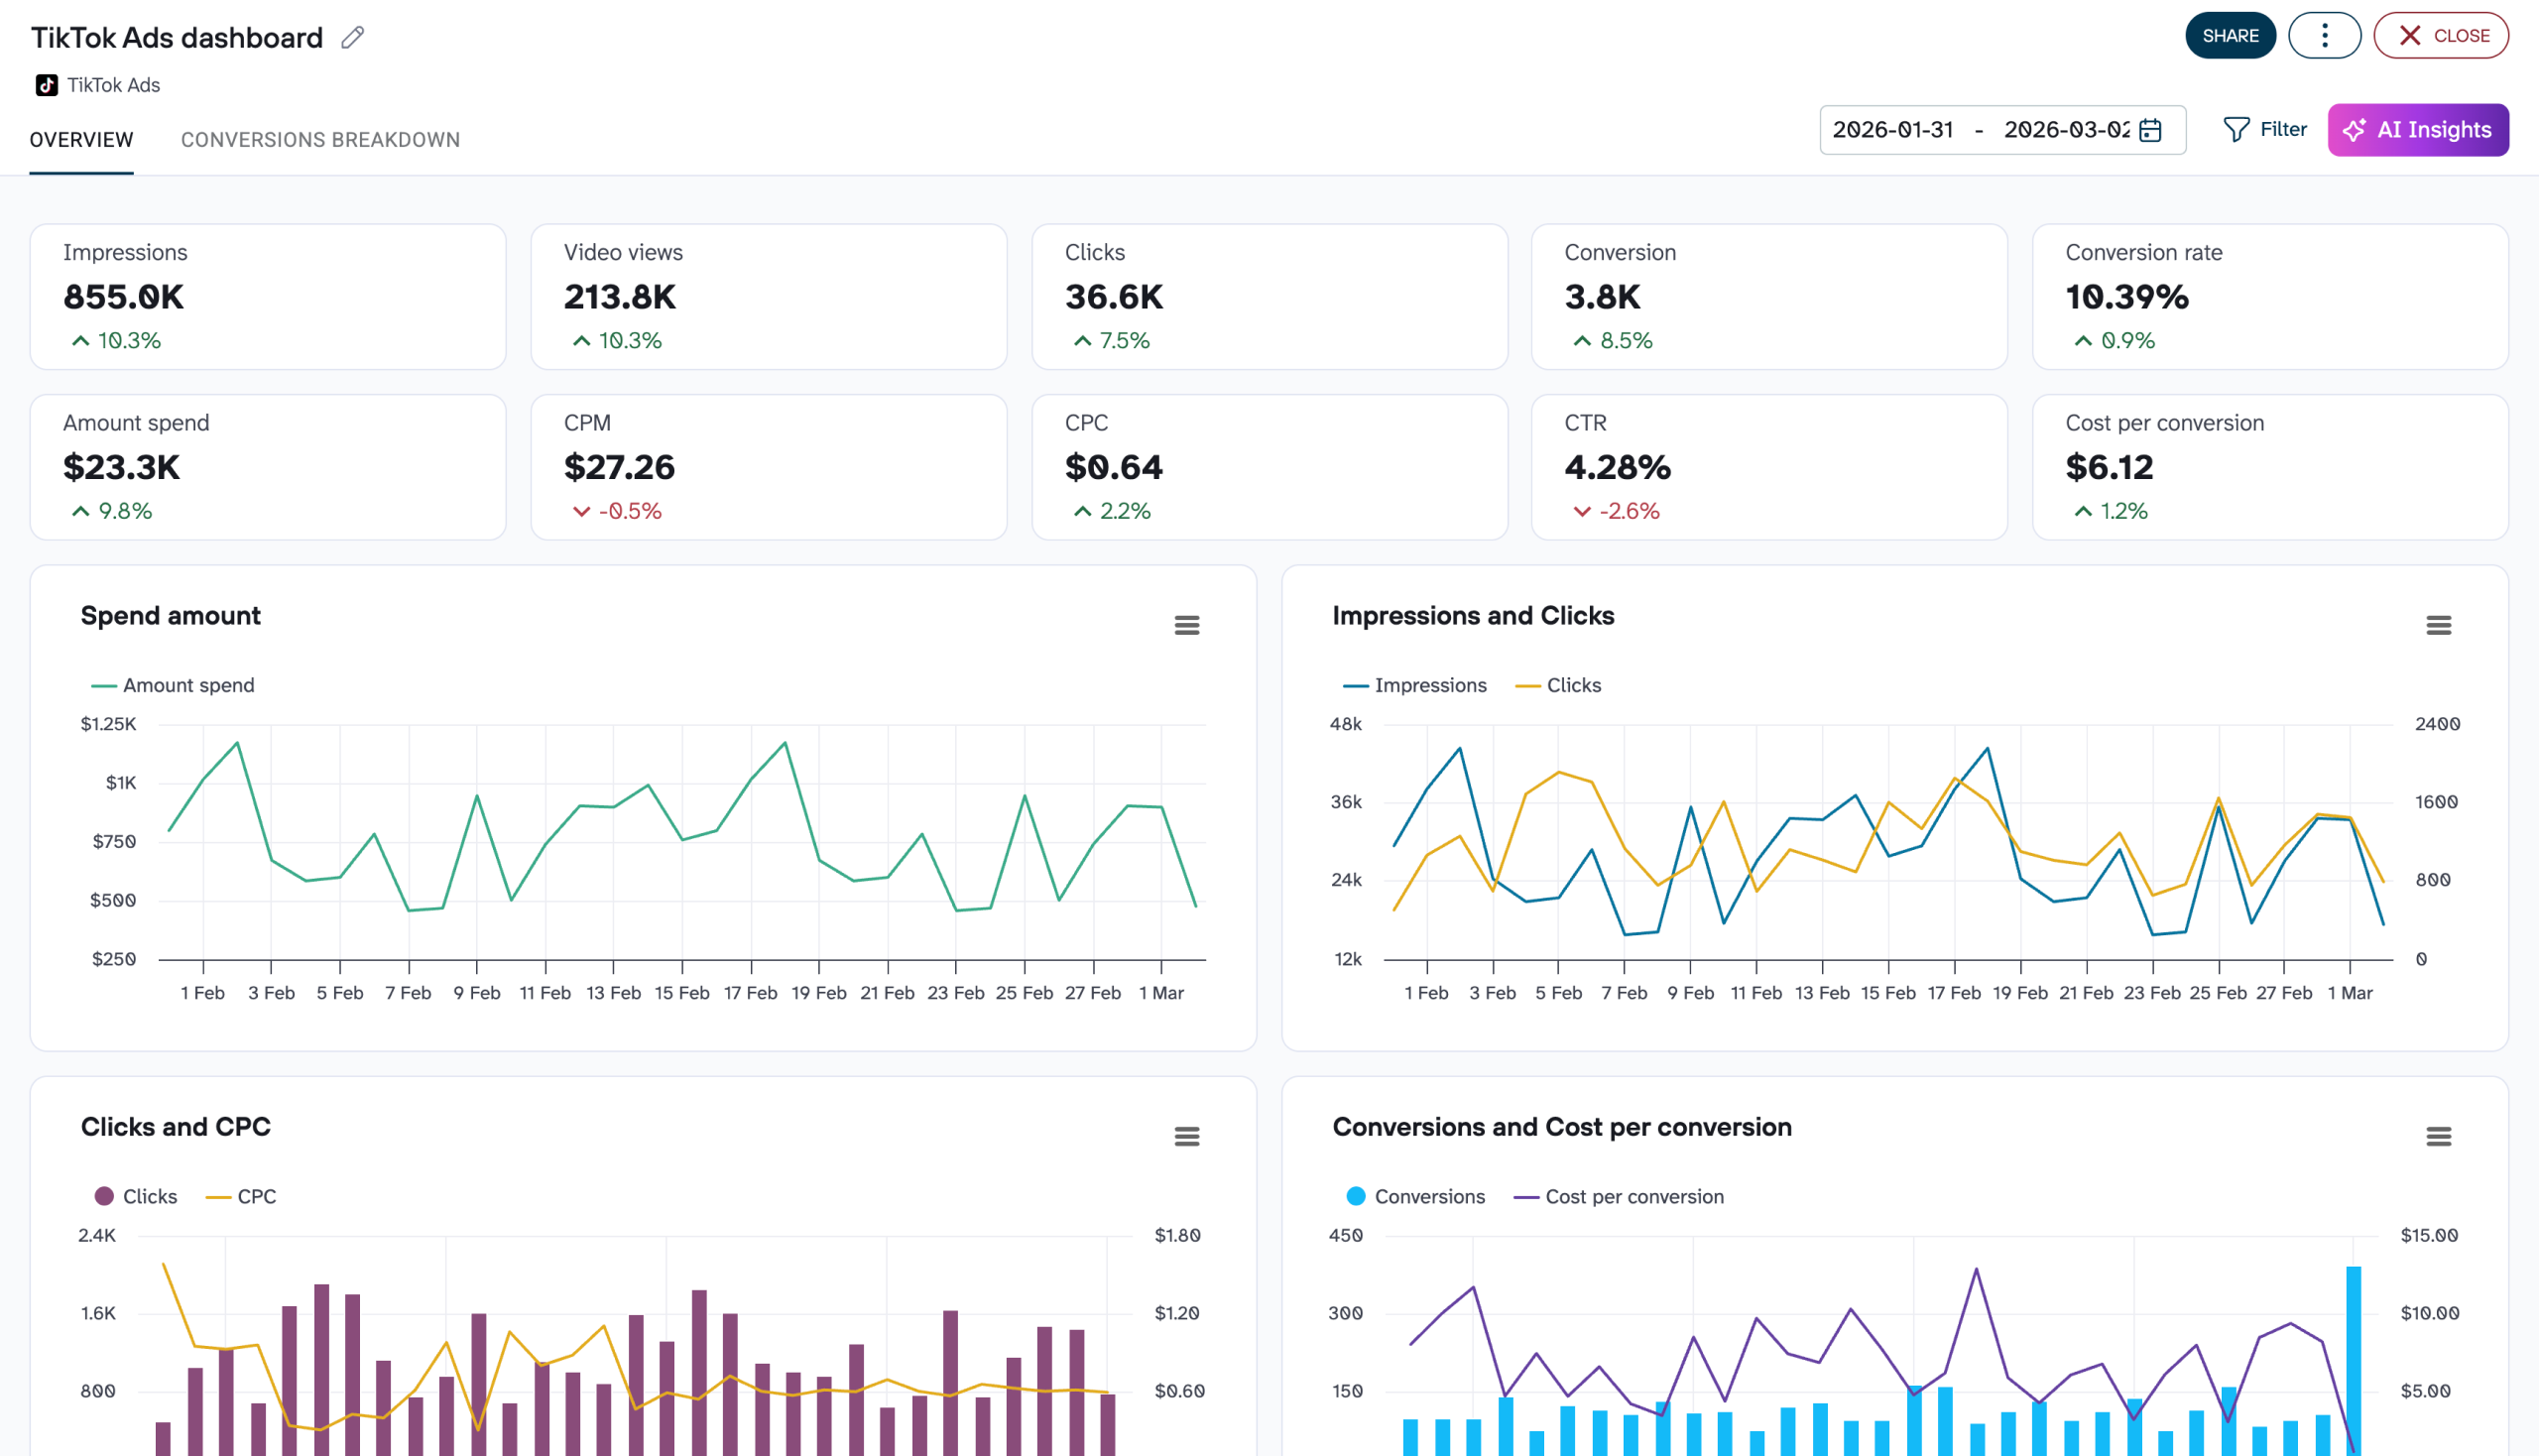
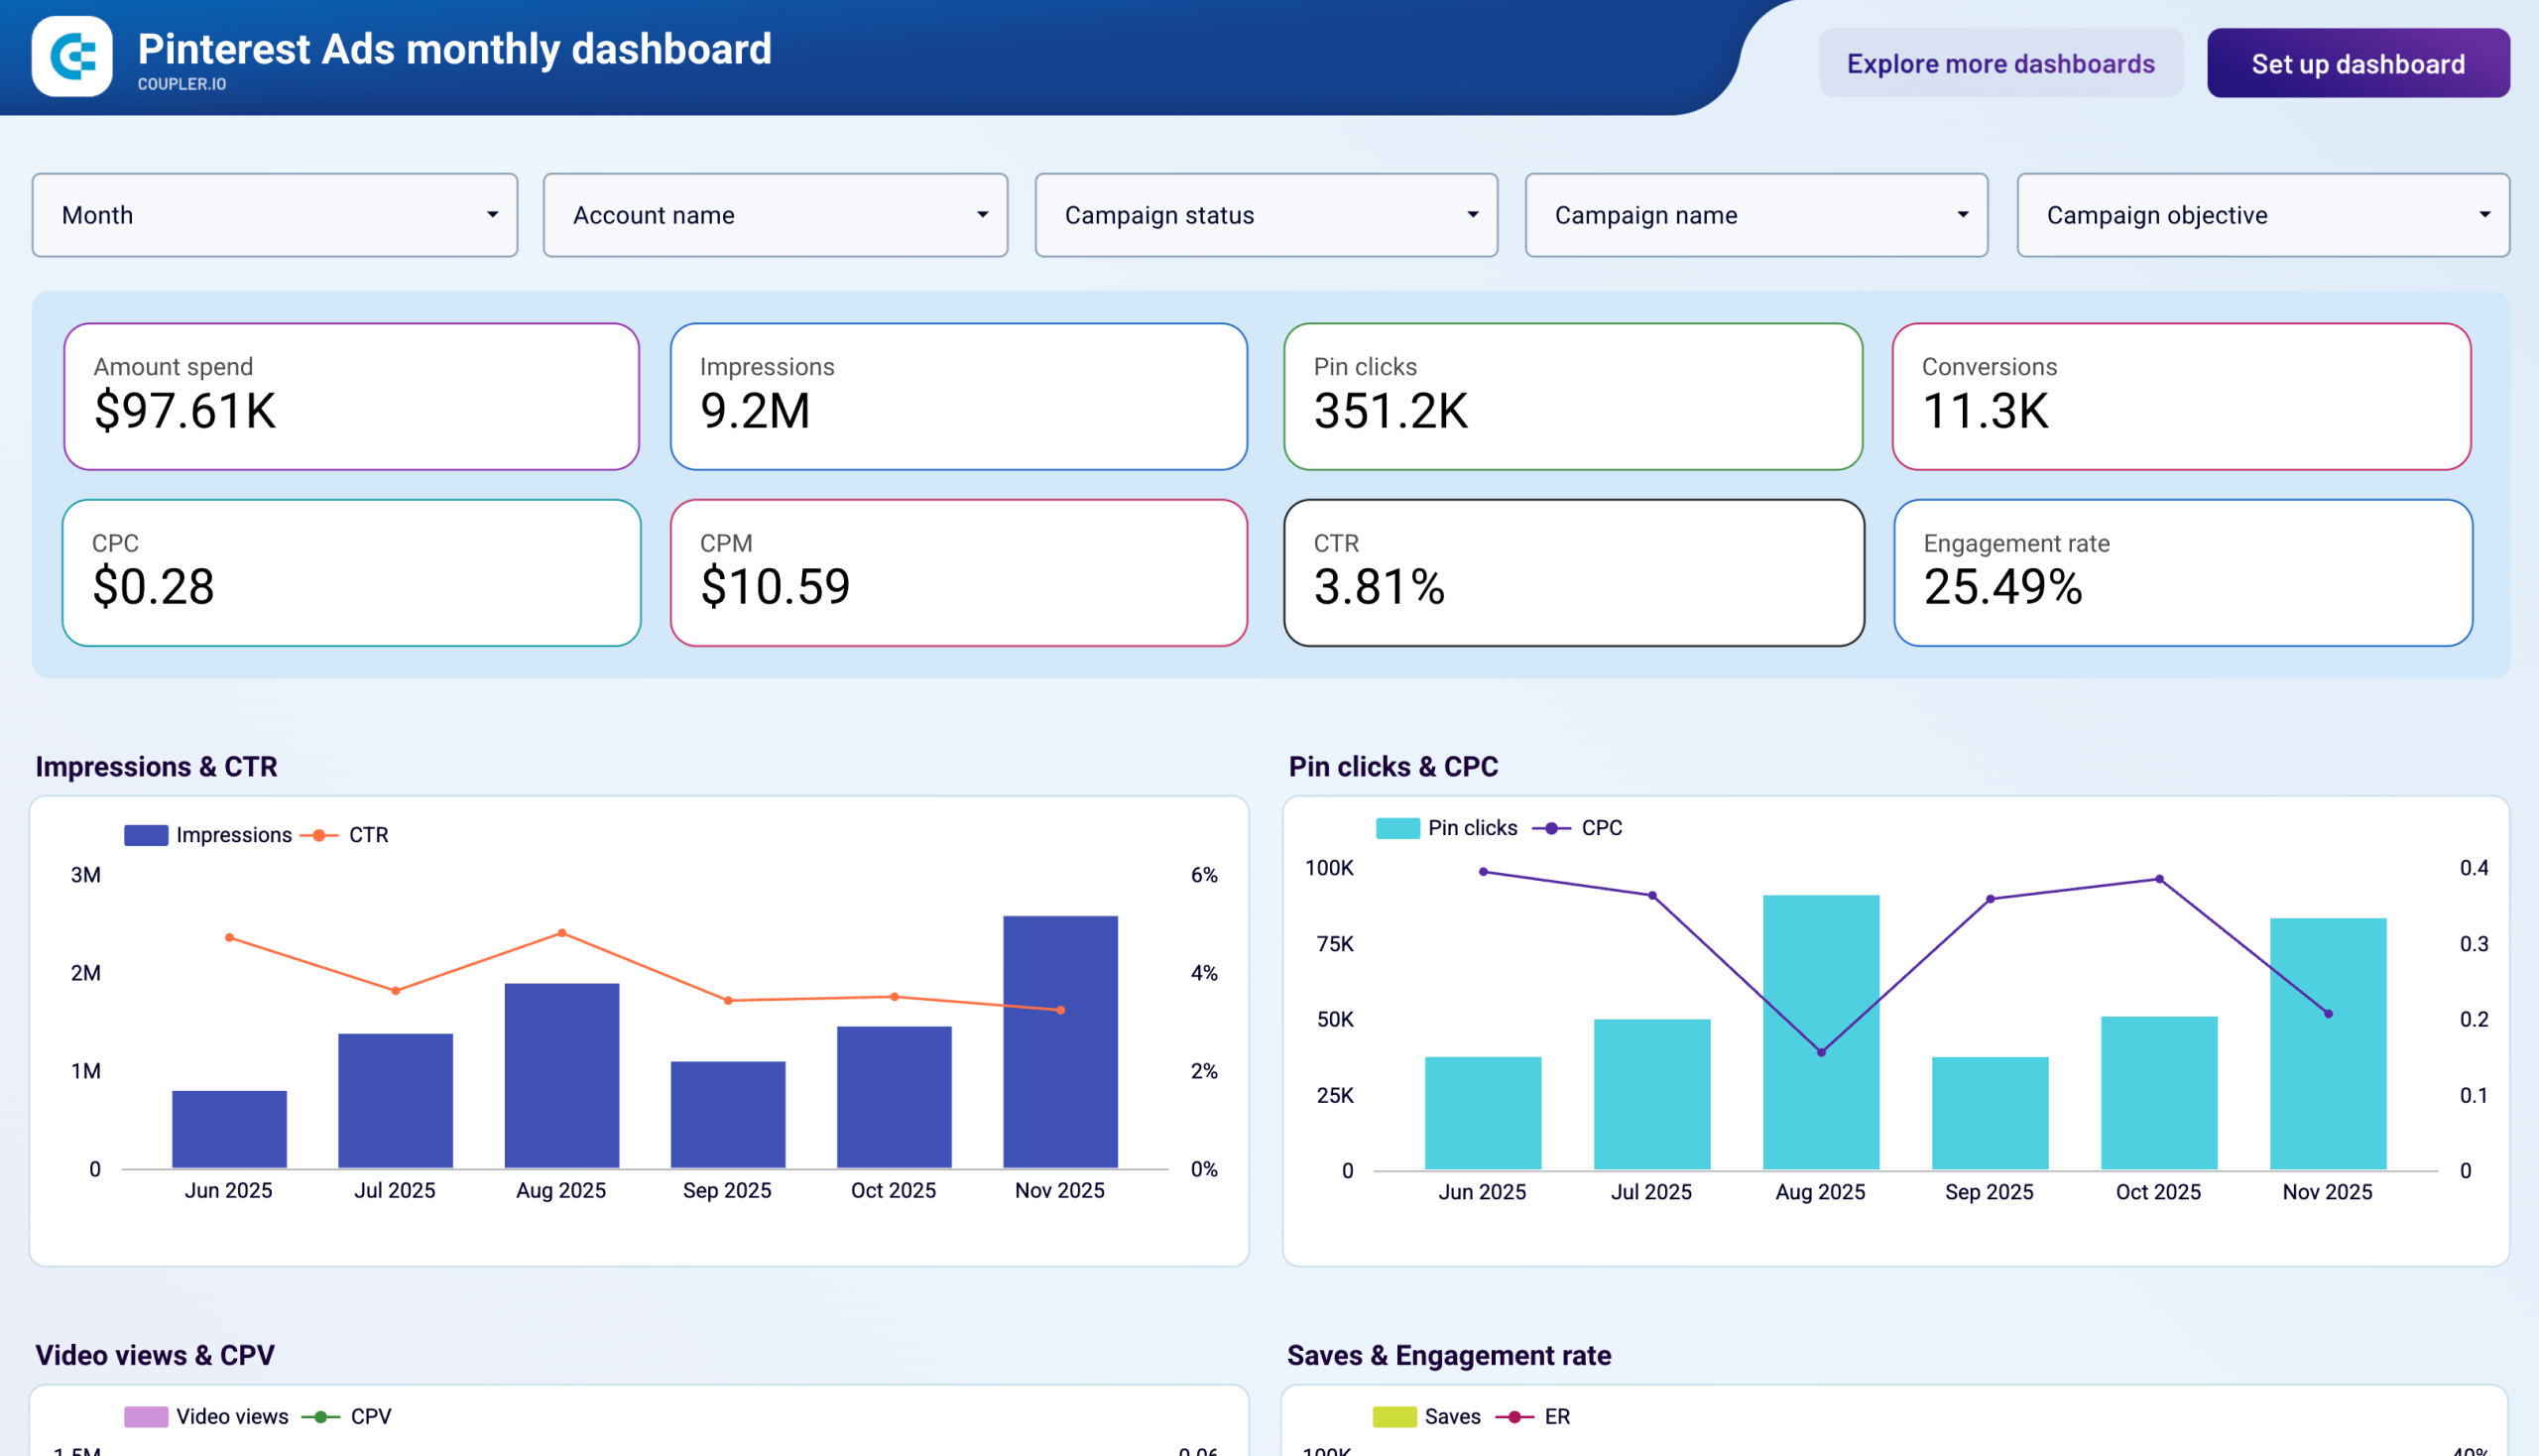
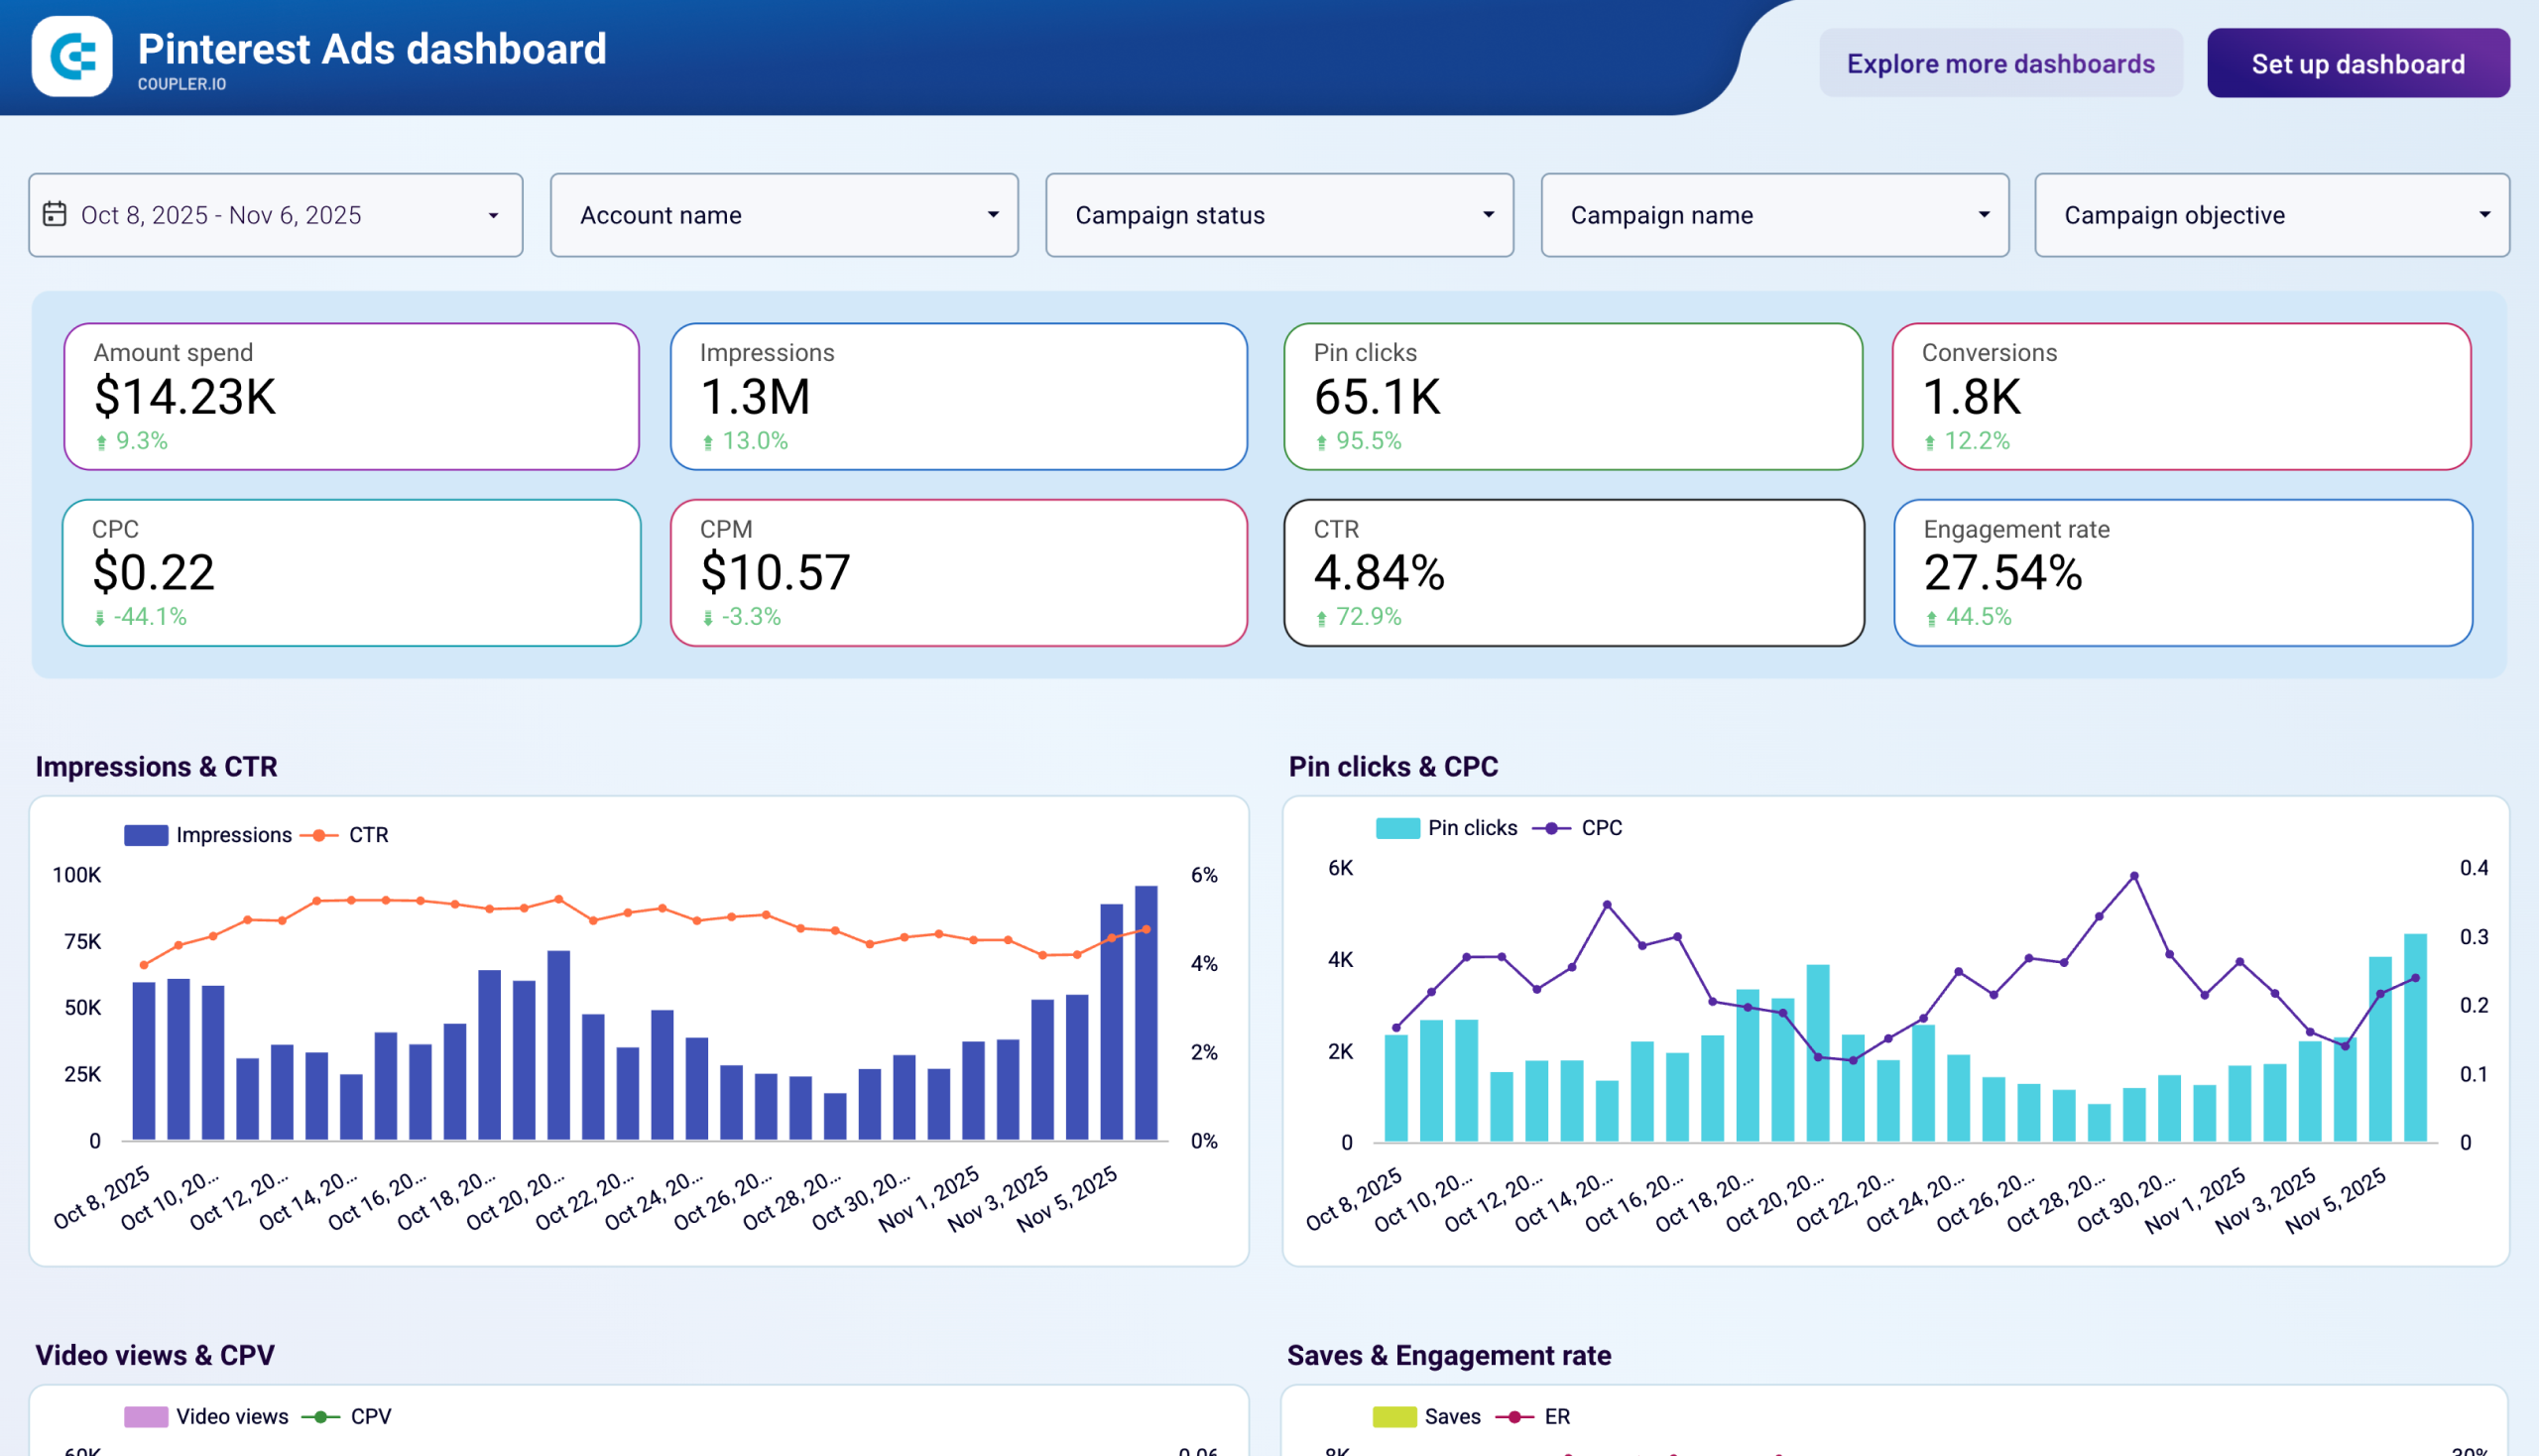
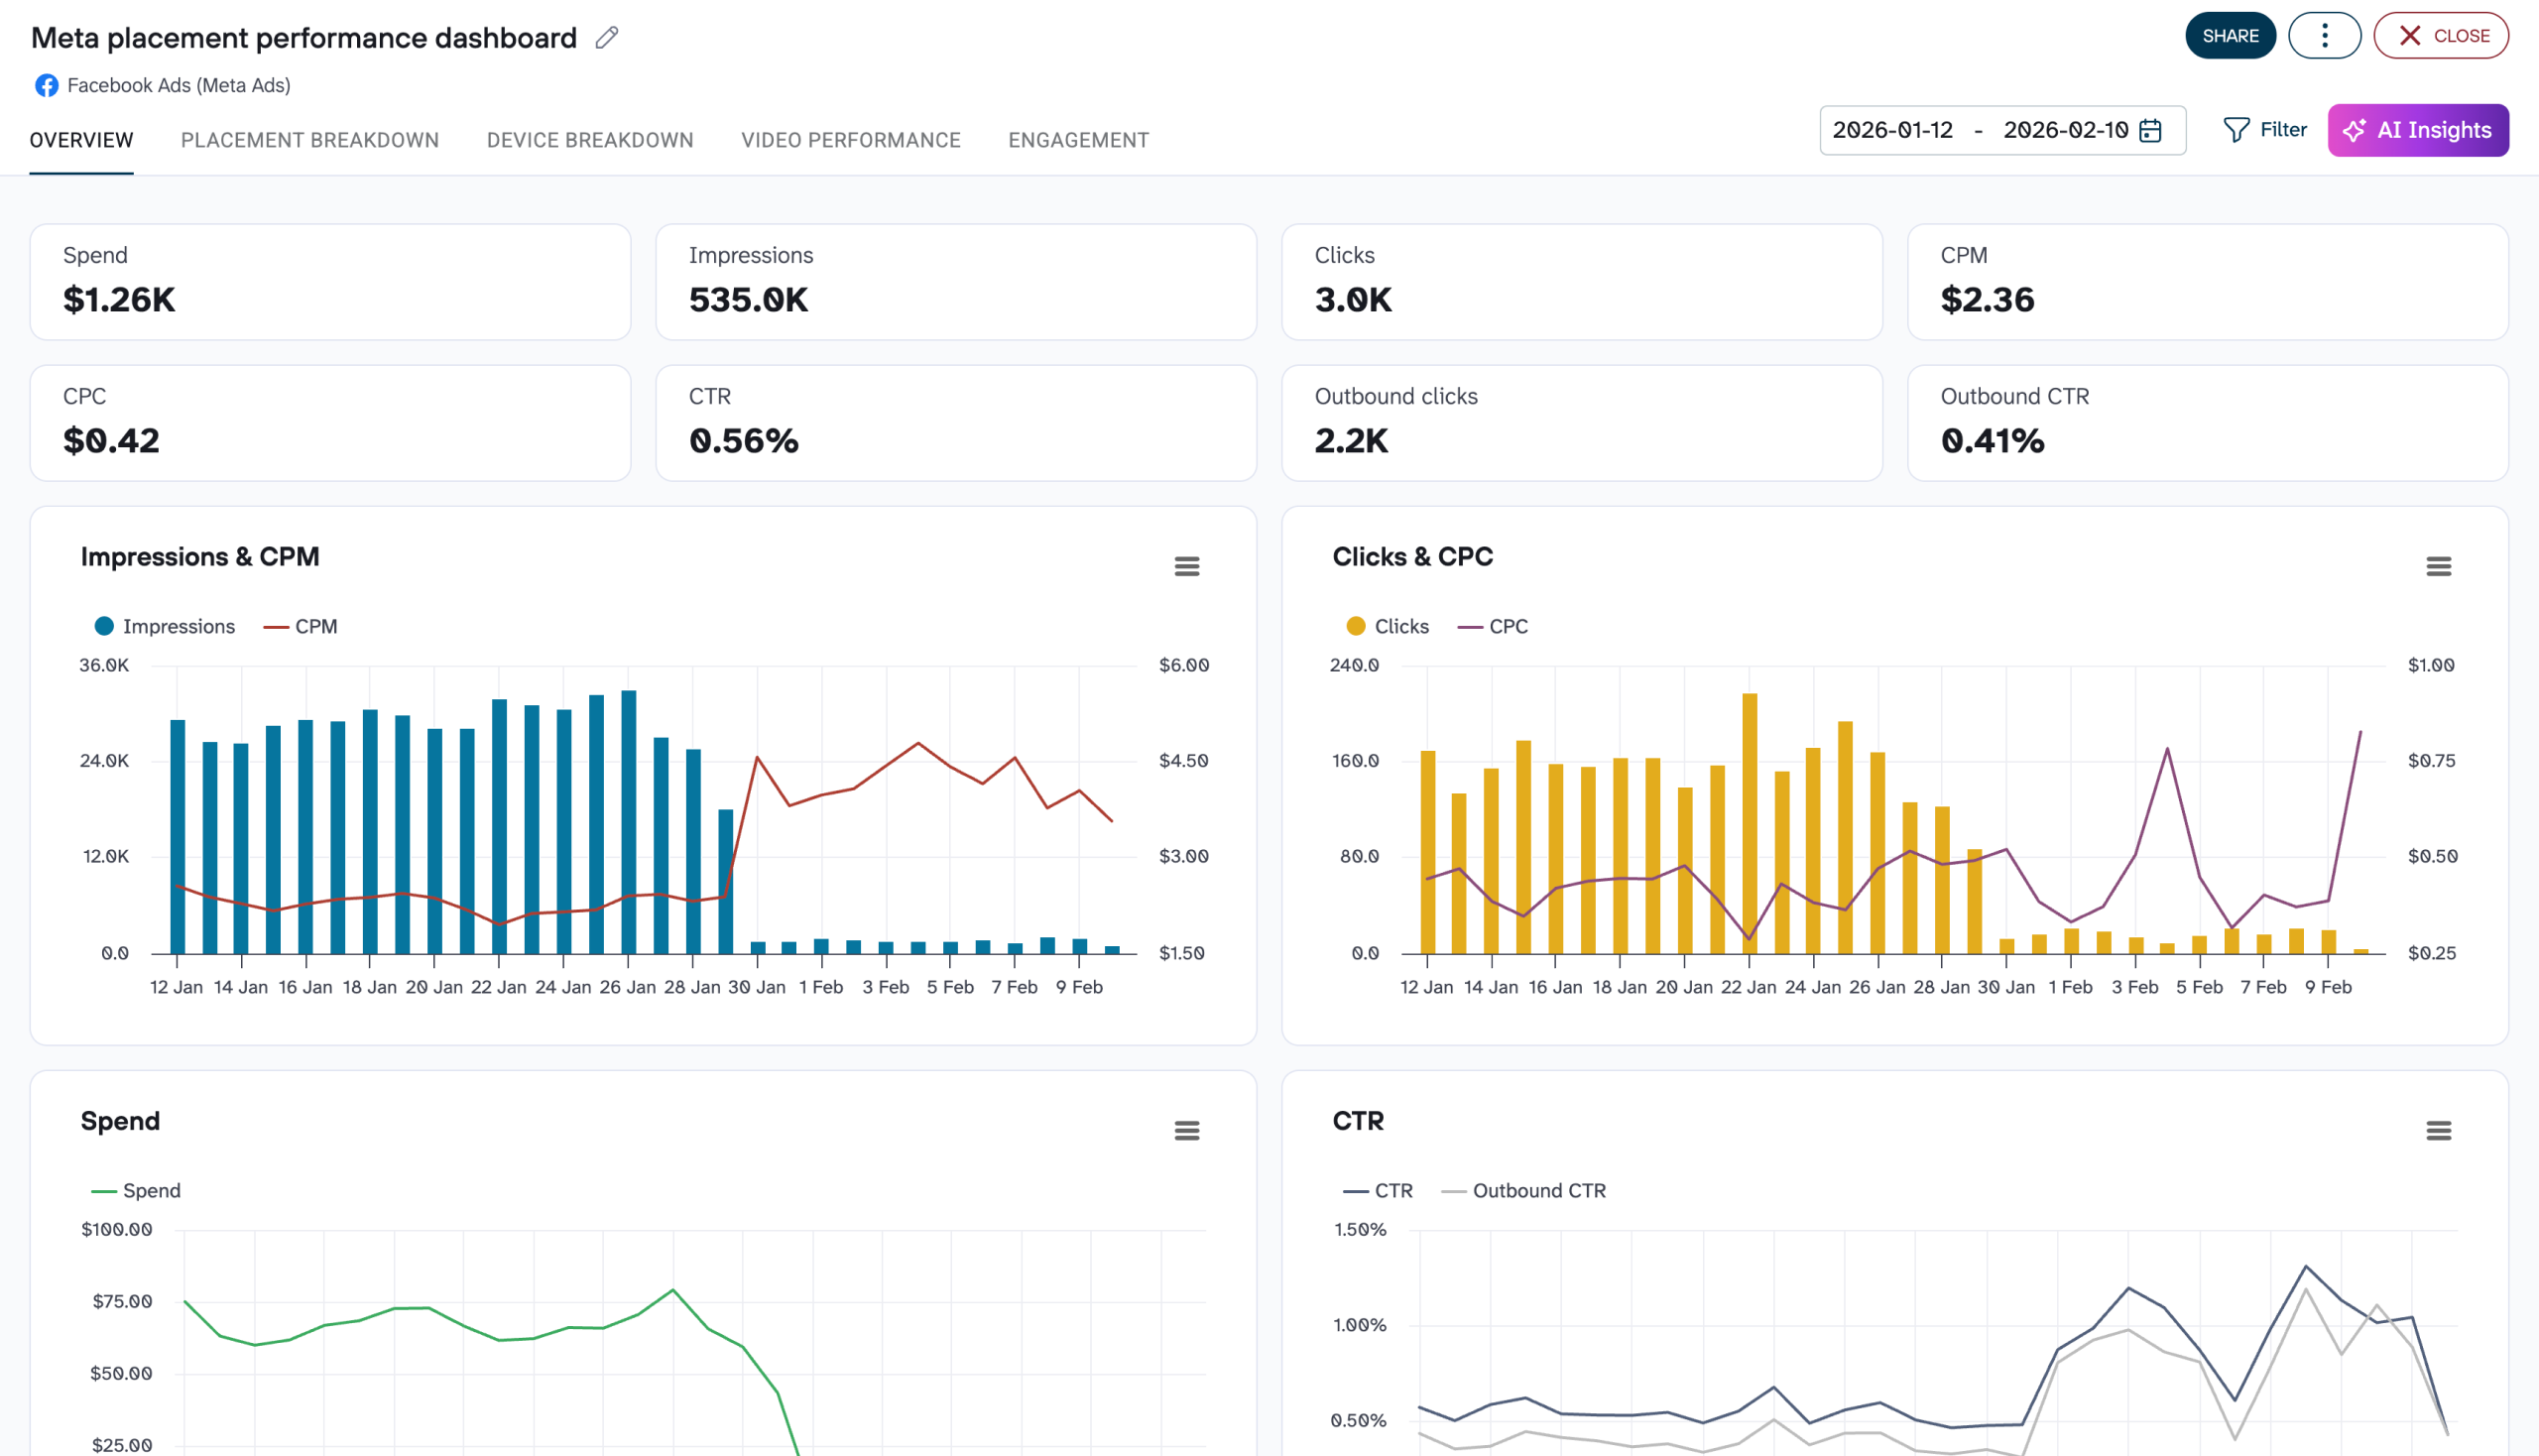
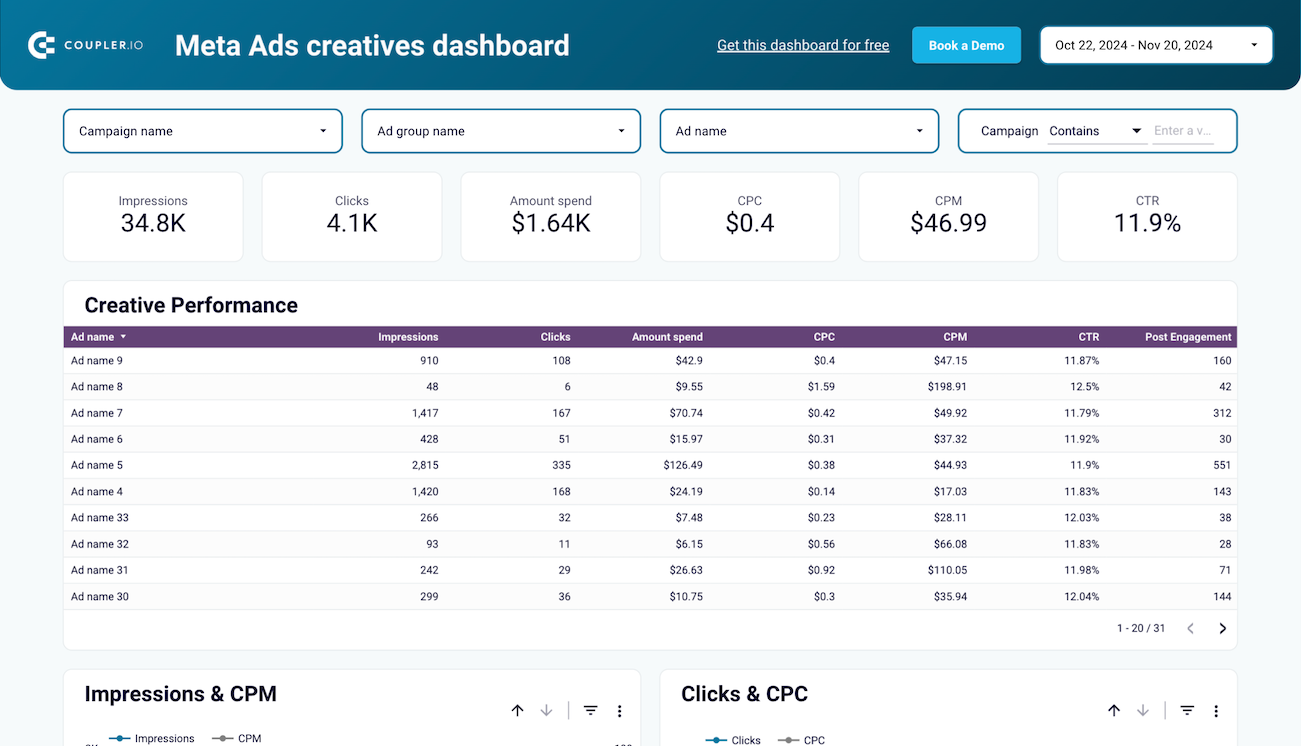
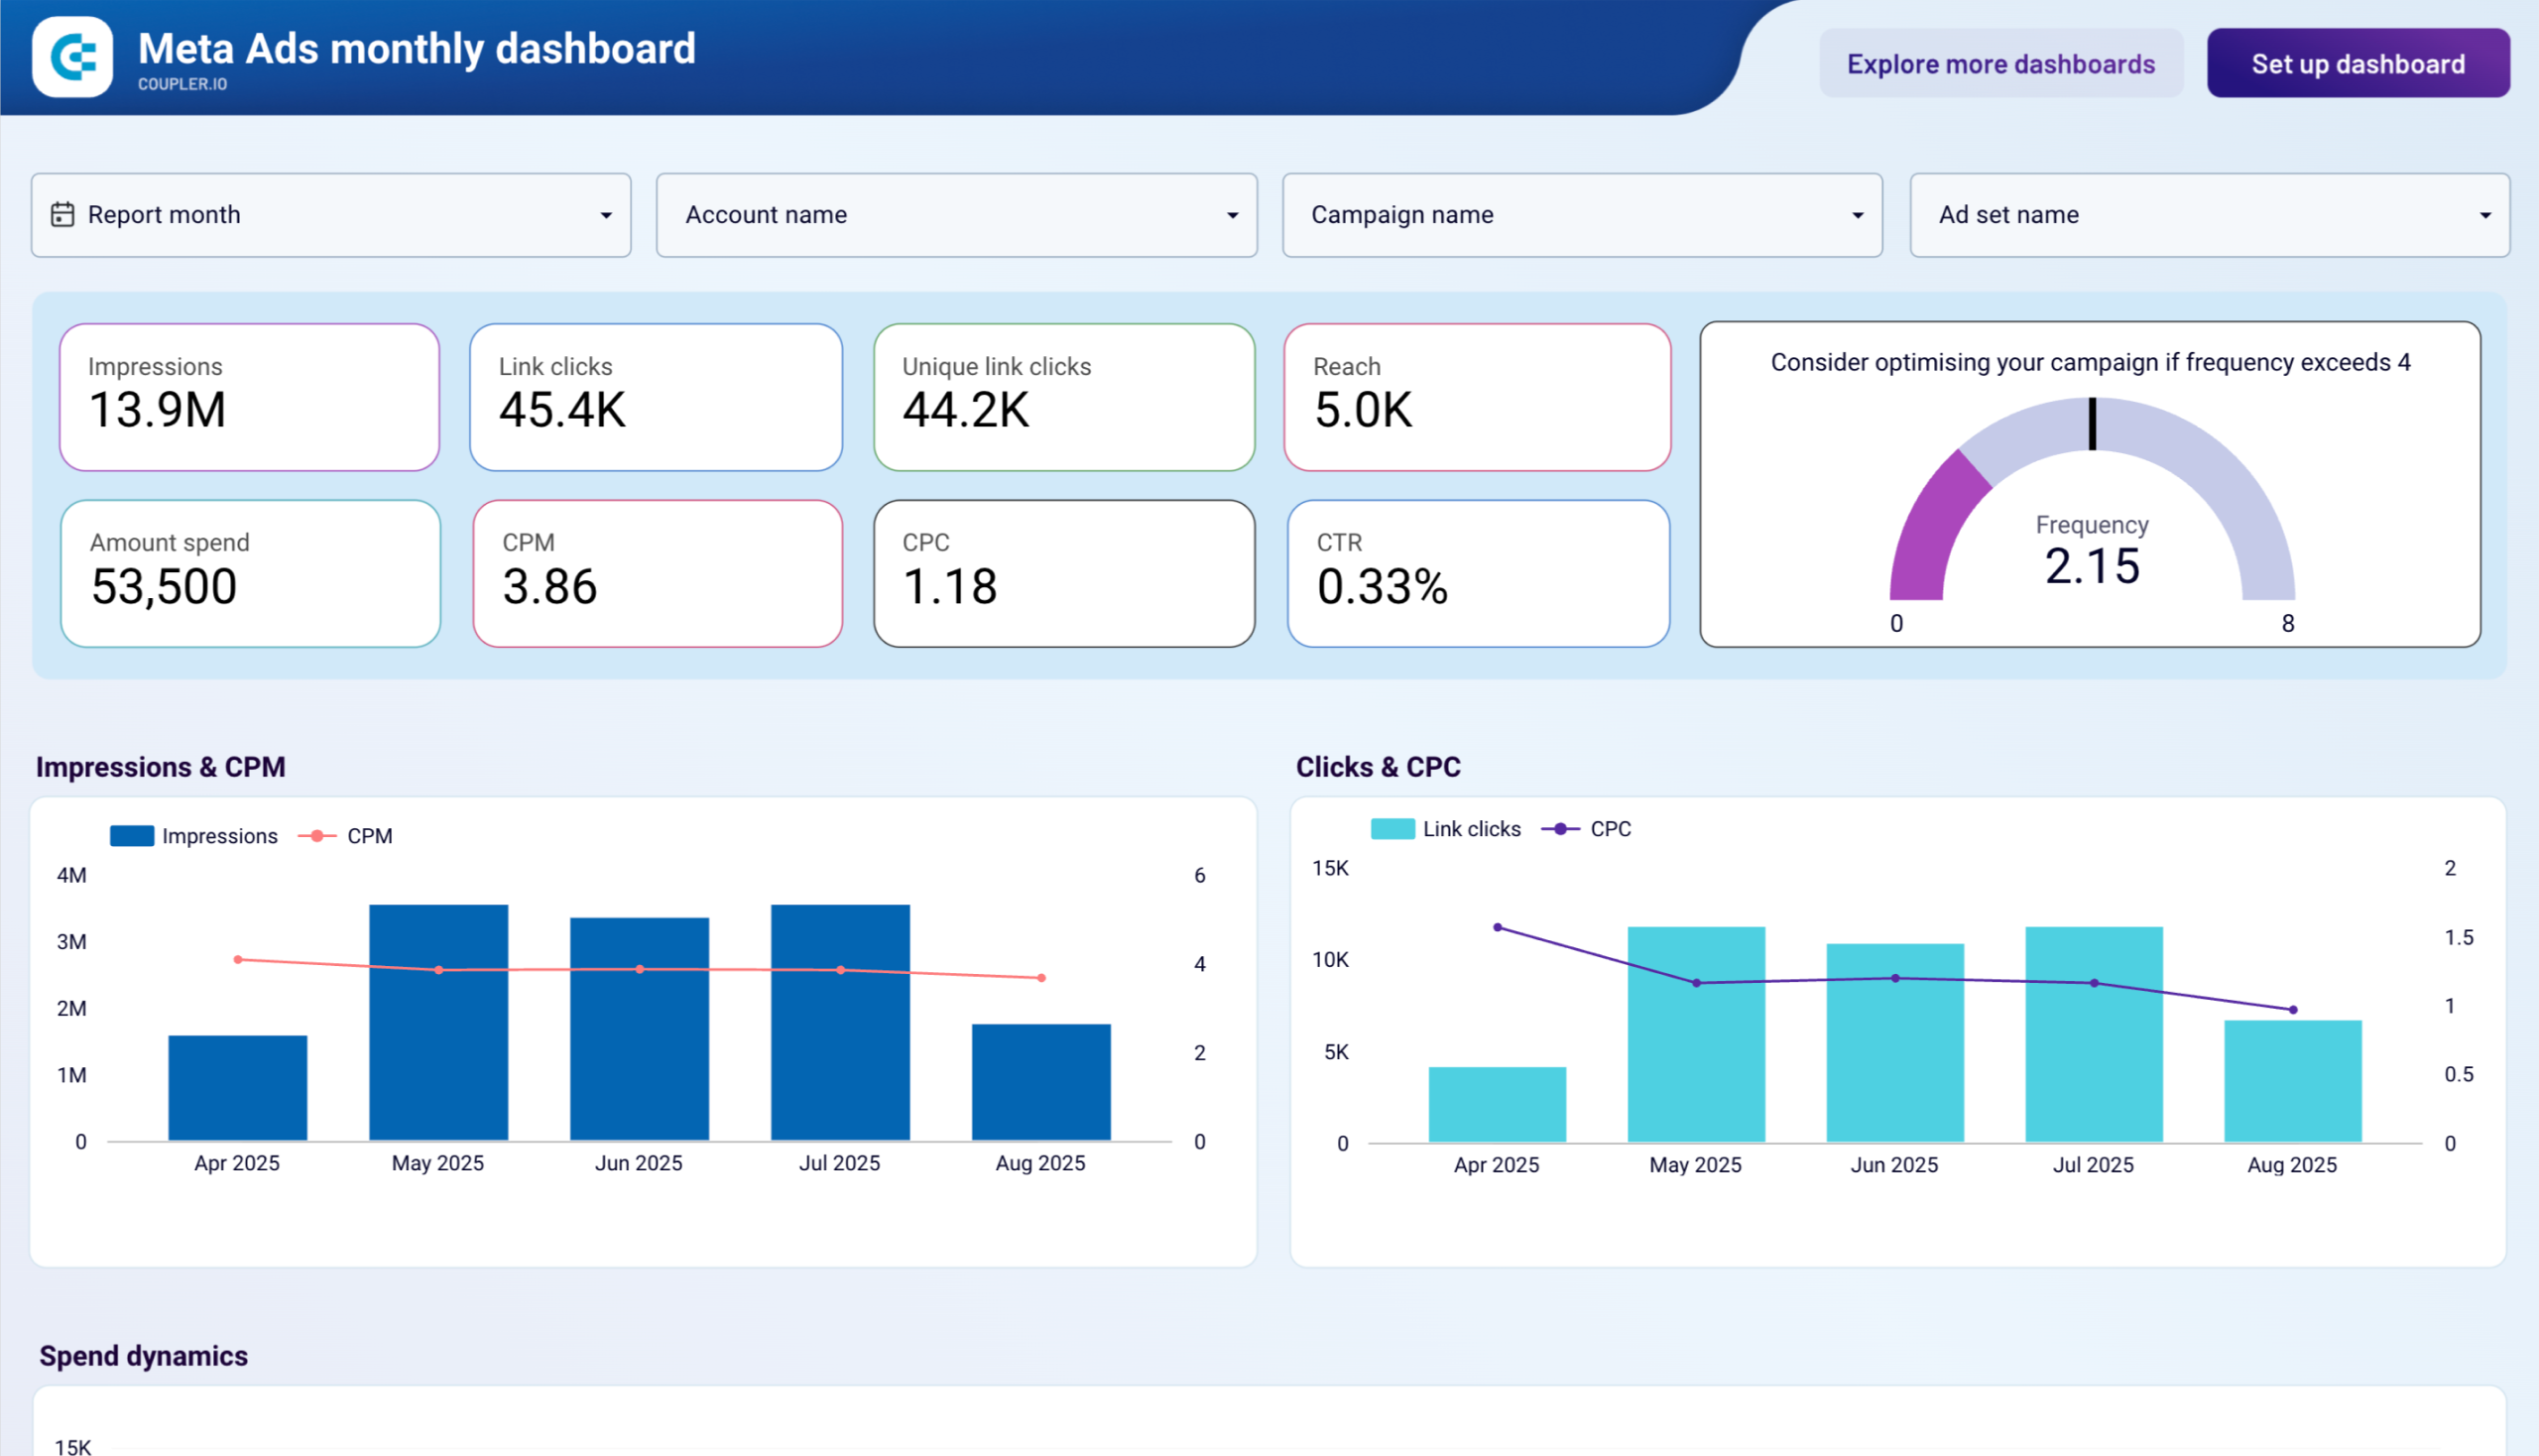
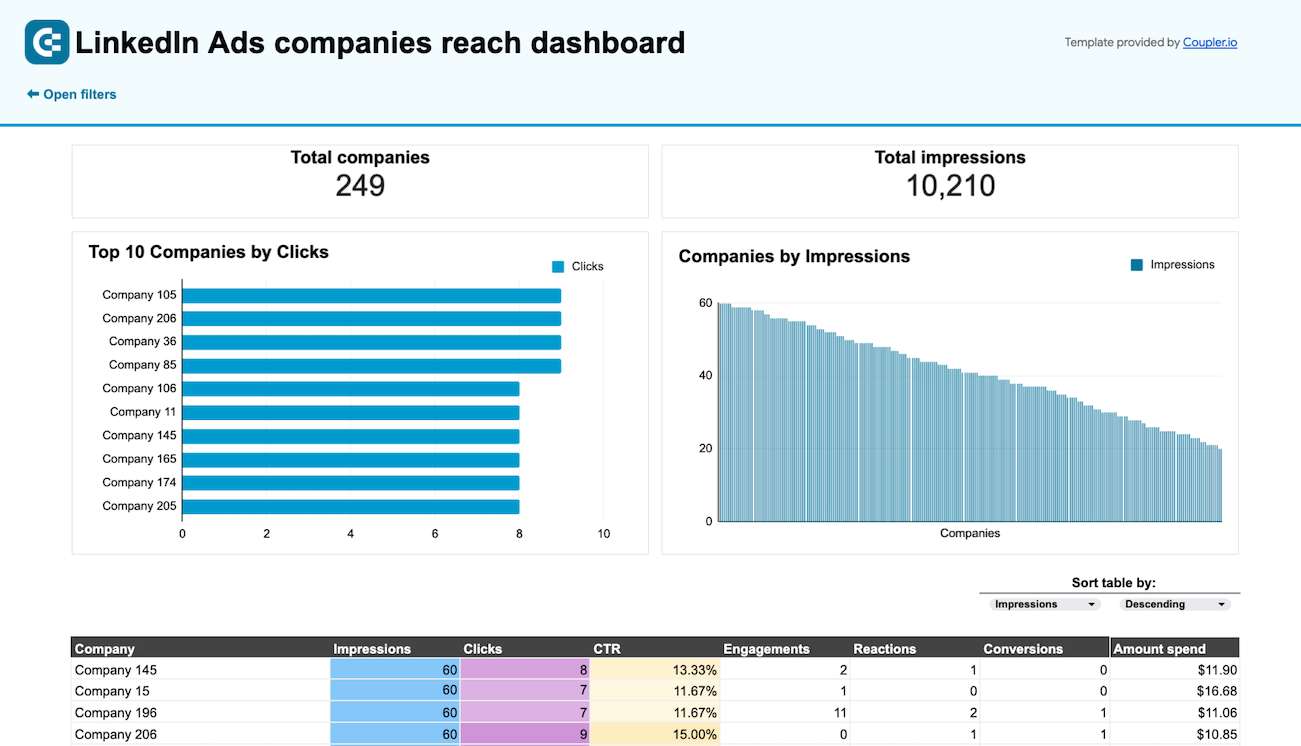
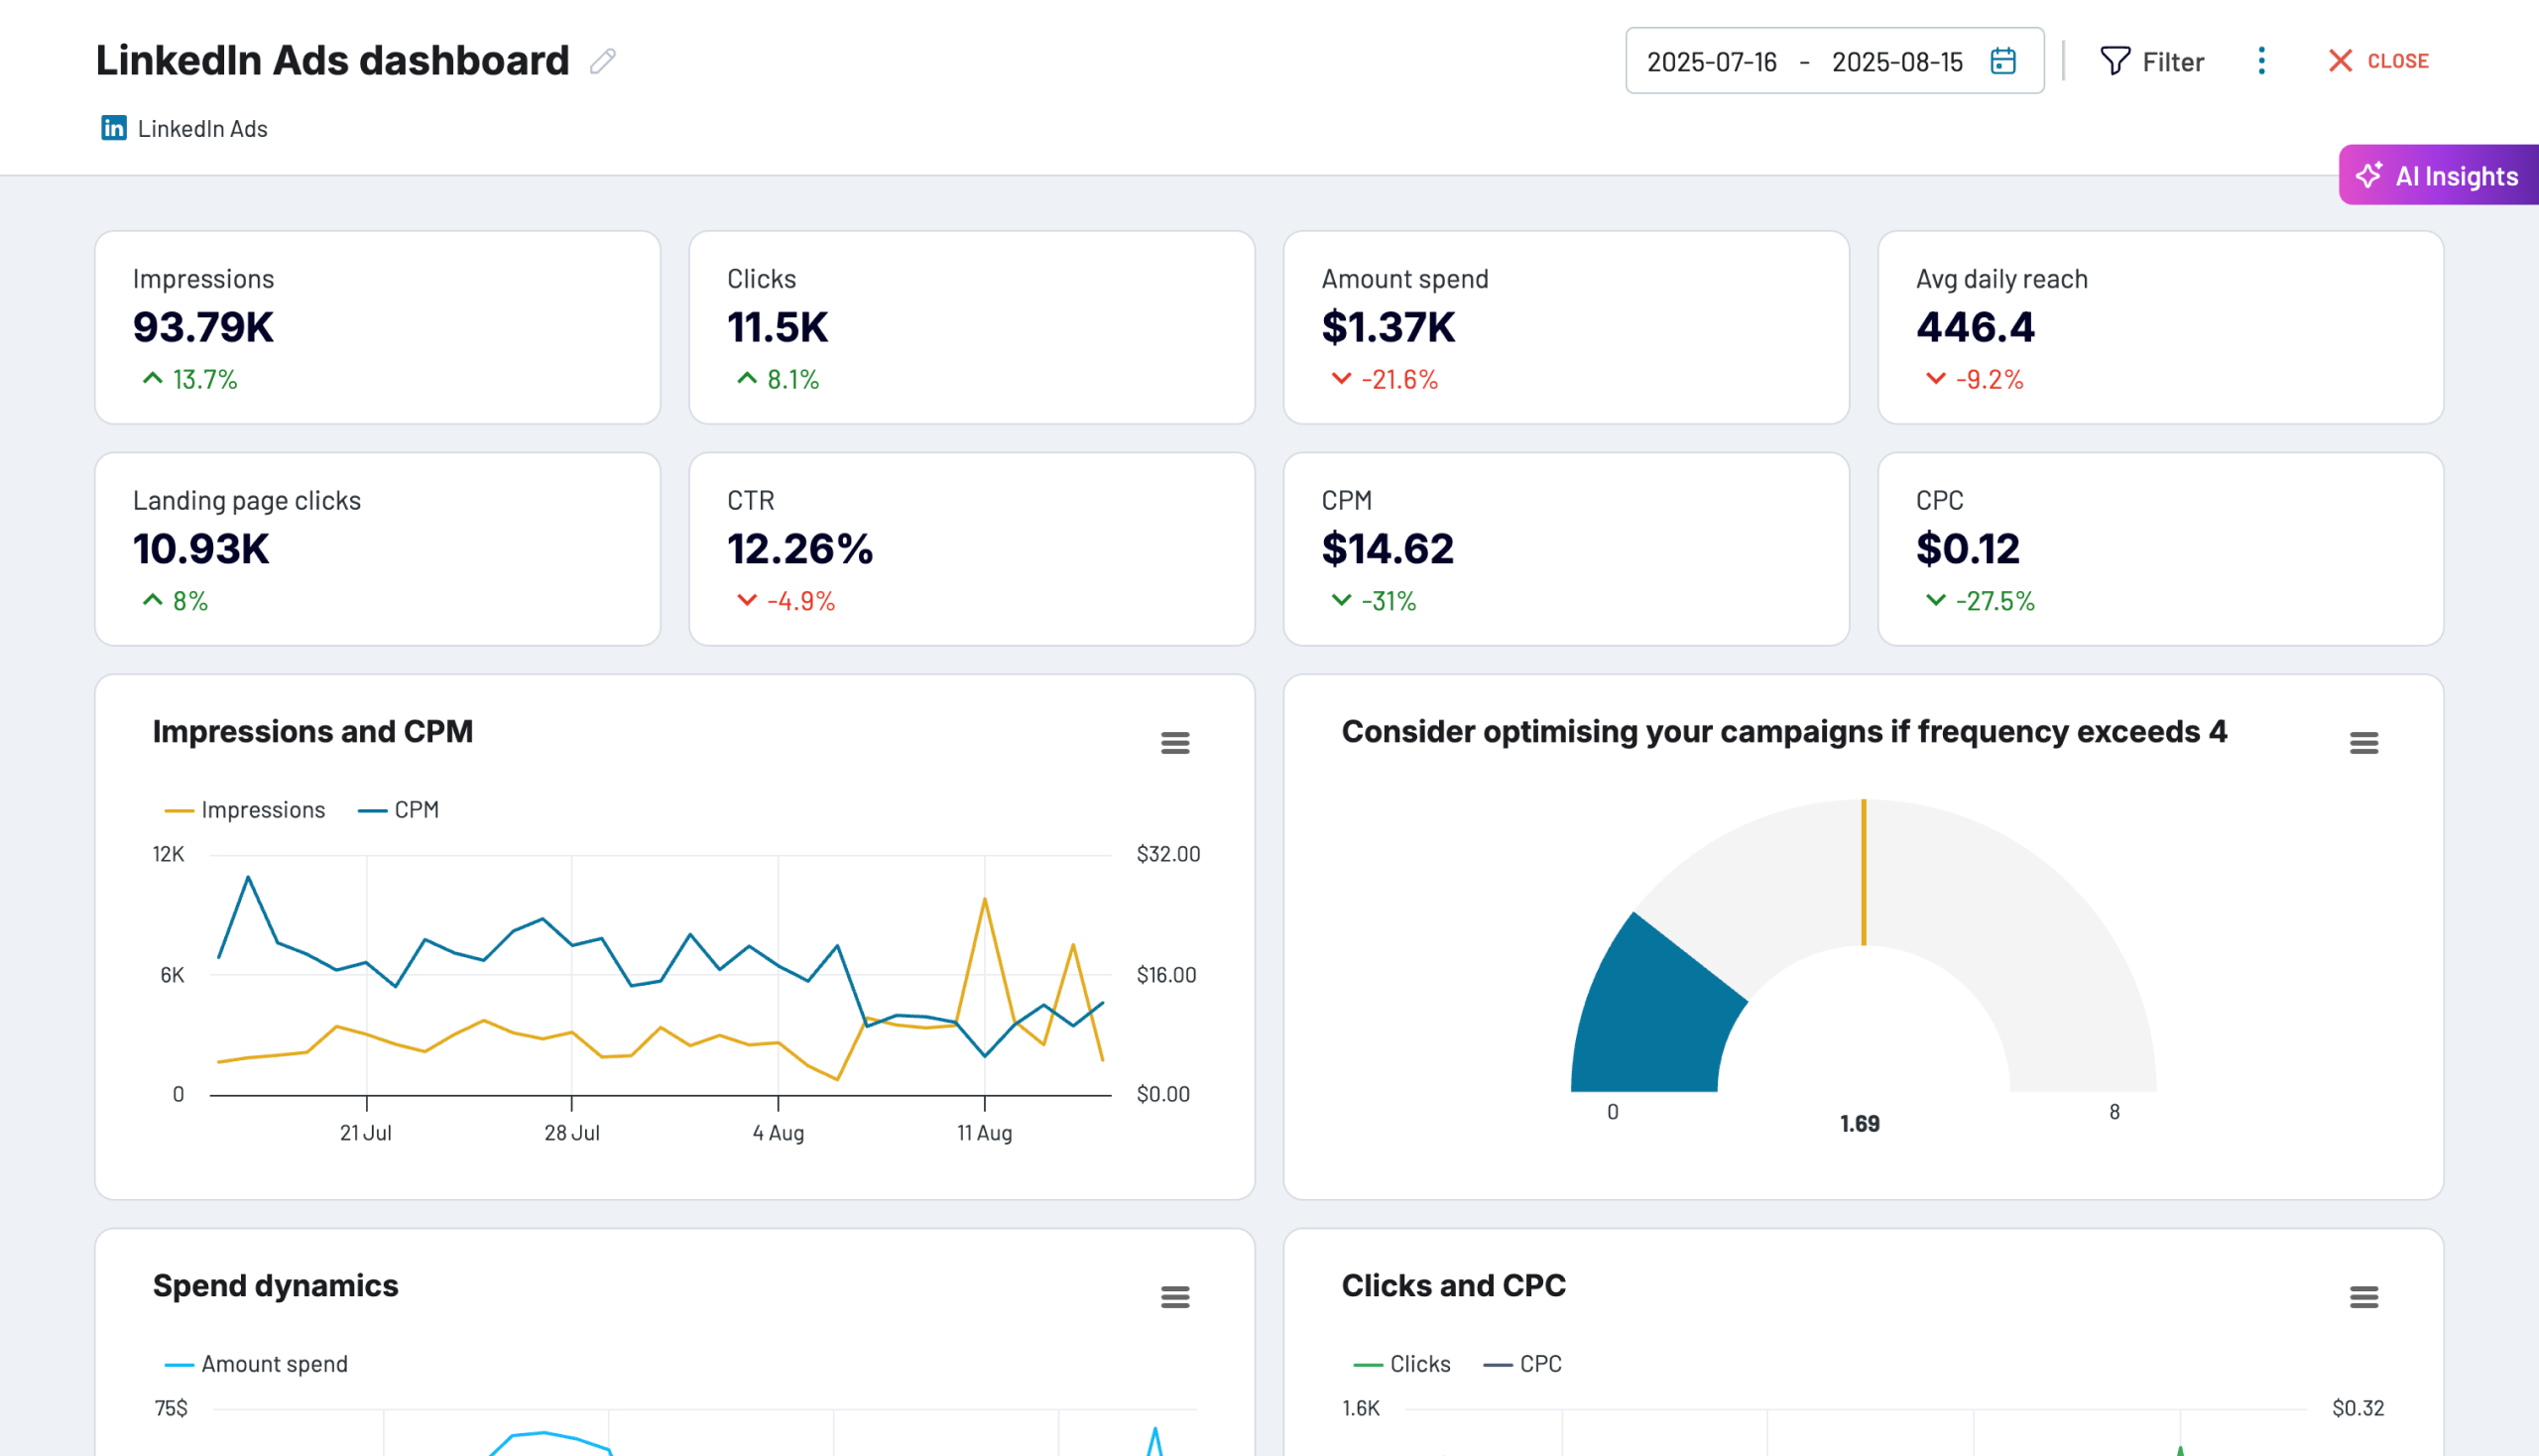
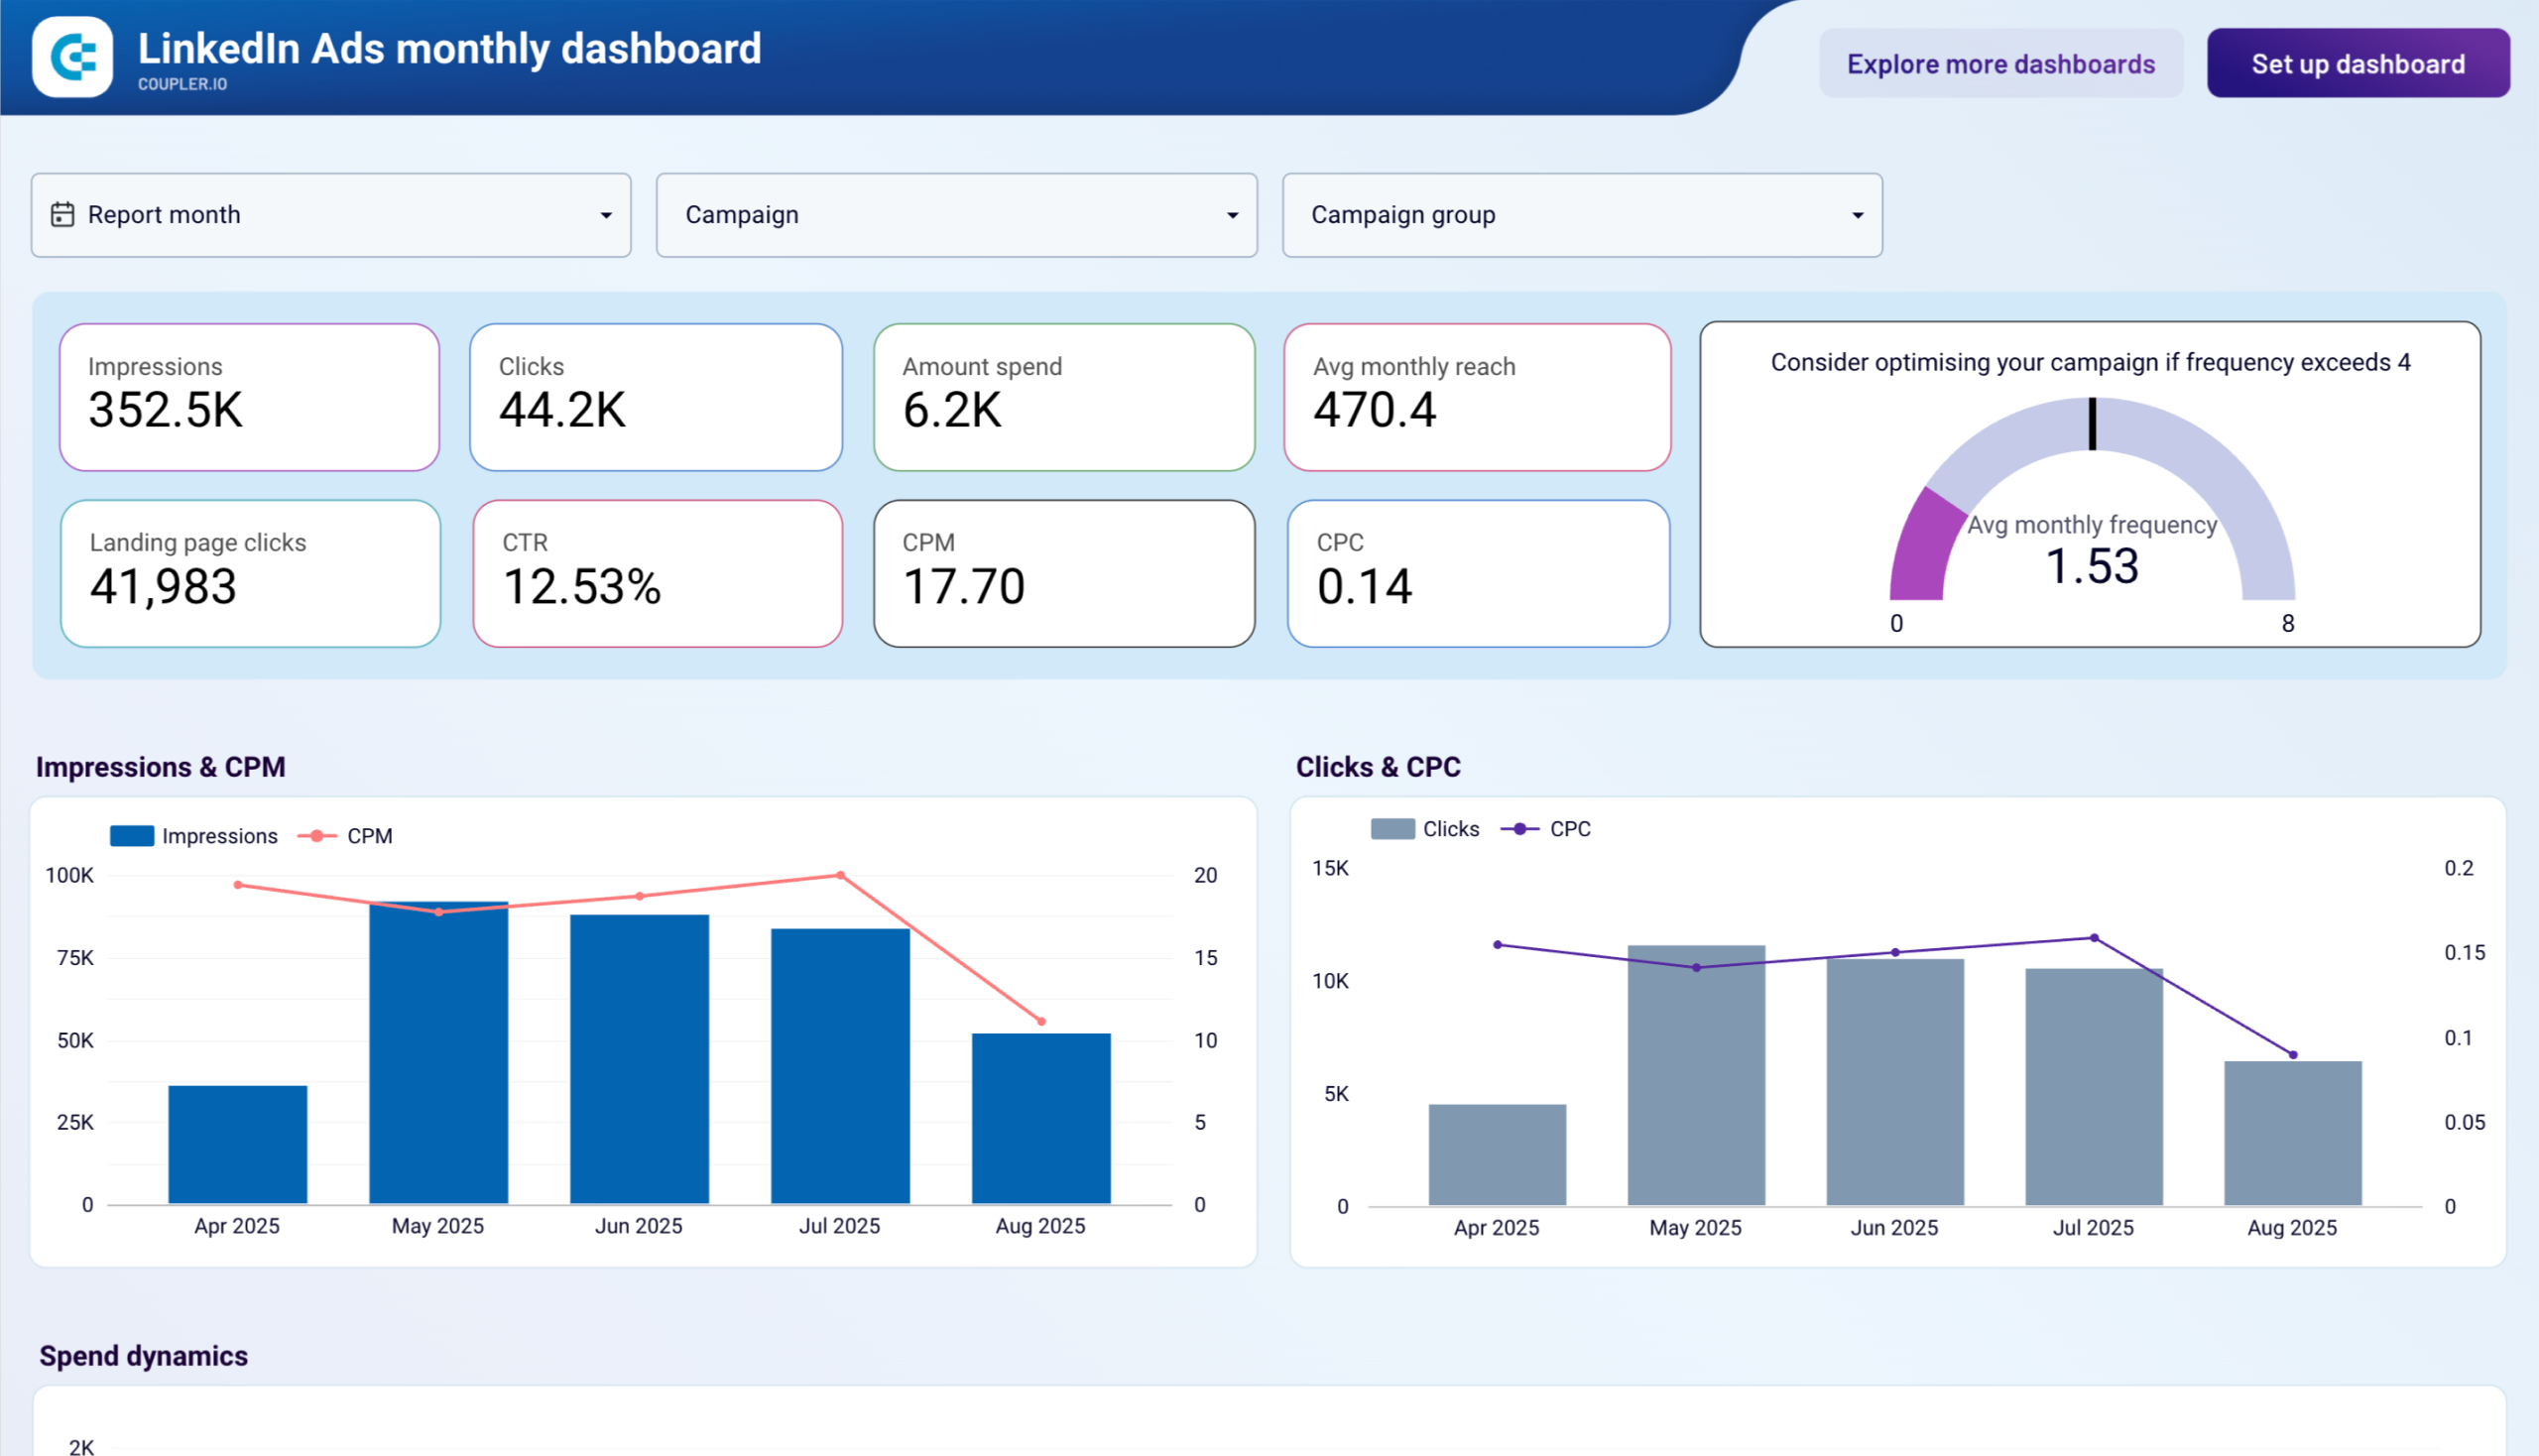
PPC dashboards
Monitor campaign performance, track ad spend, and analyze ROI across advertising campaigns. Each marketing reporting dashboard allows you to identify high and low-performing ads to optimize your PPC budget. Make informed decisions on your pay-per-click investments.
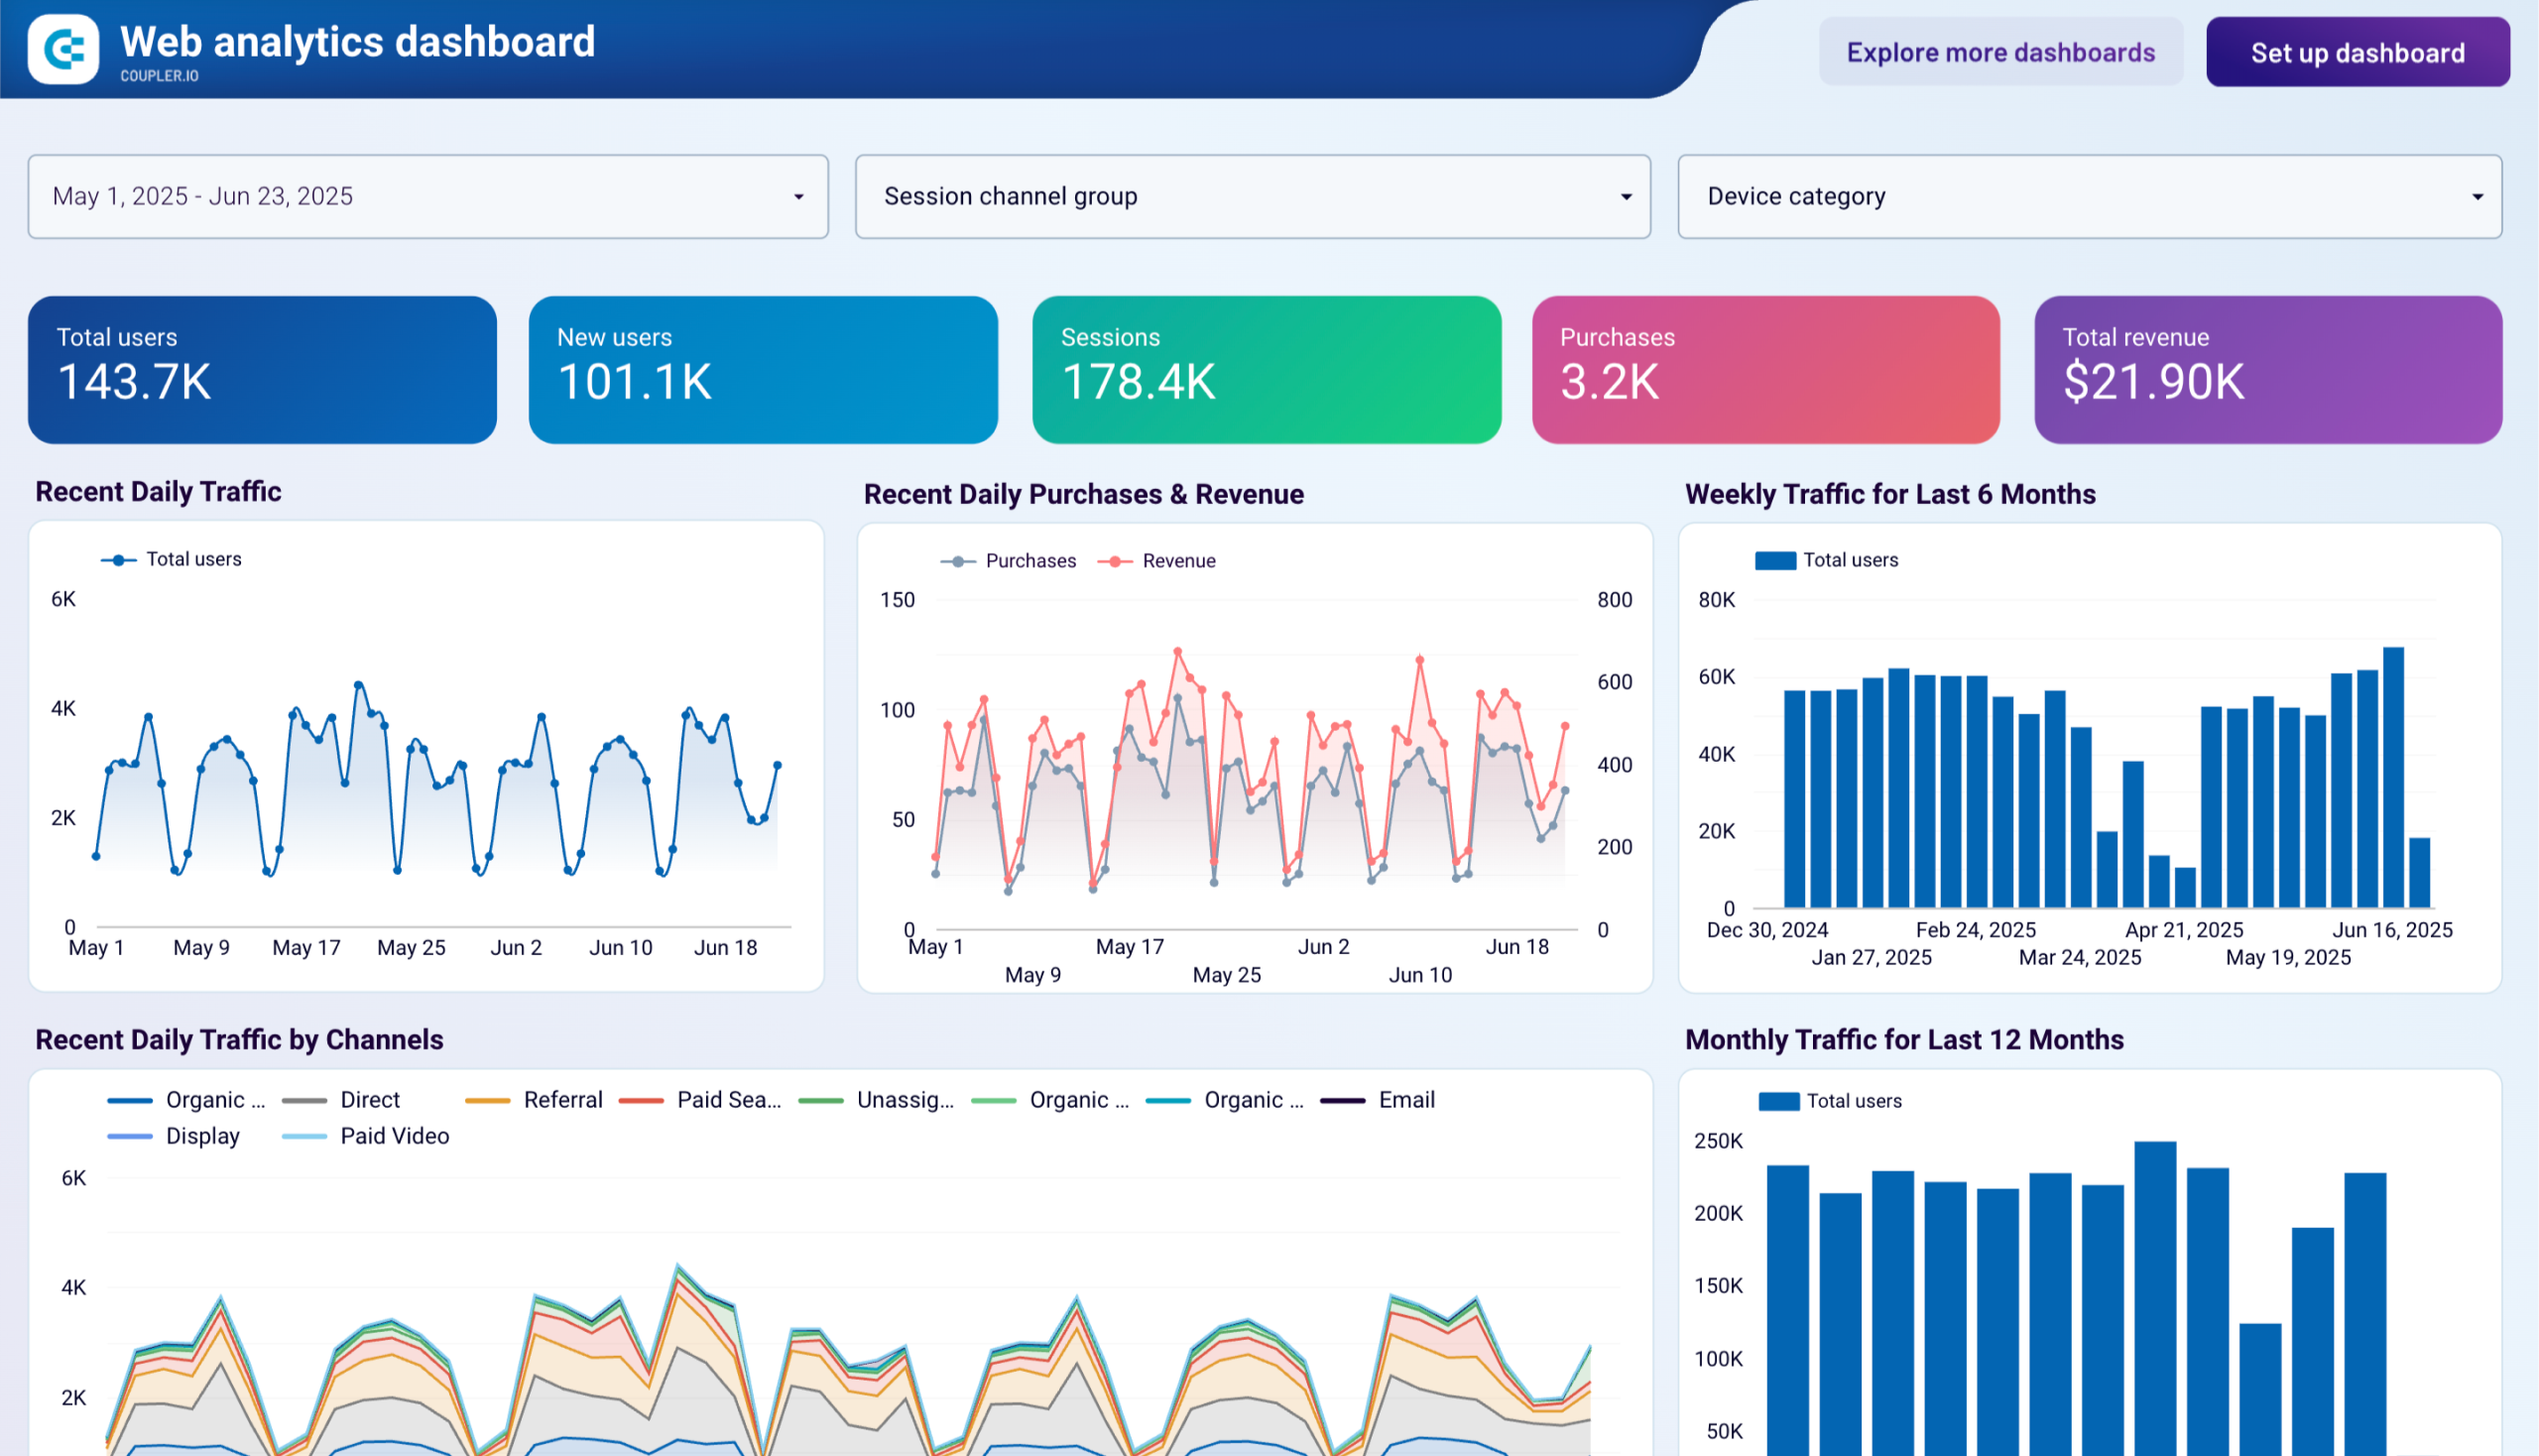
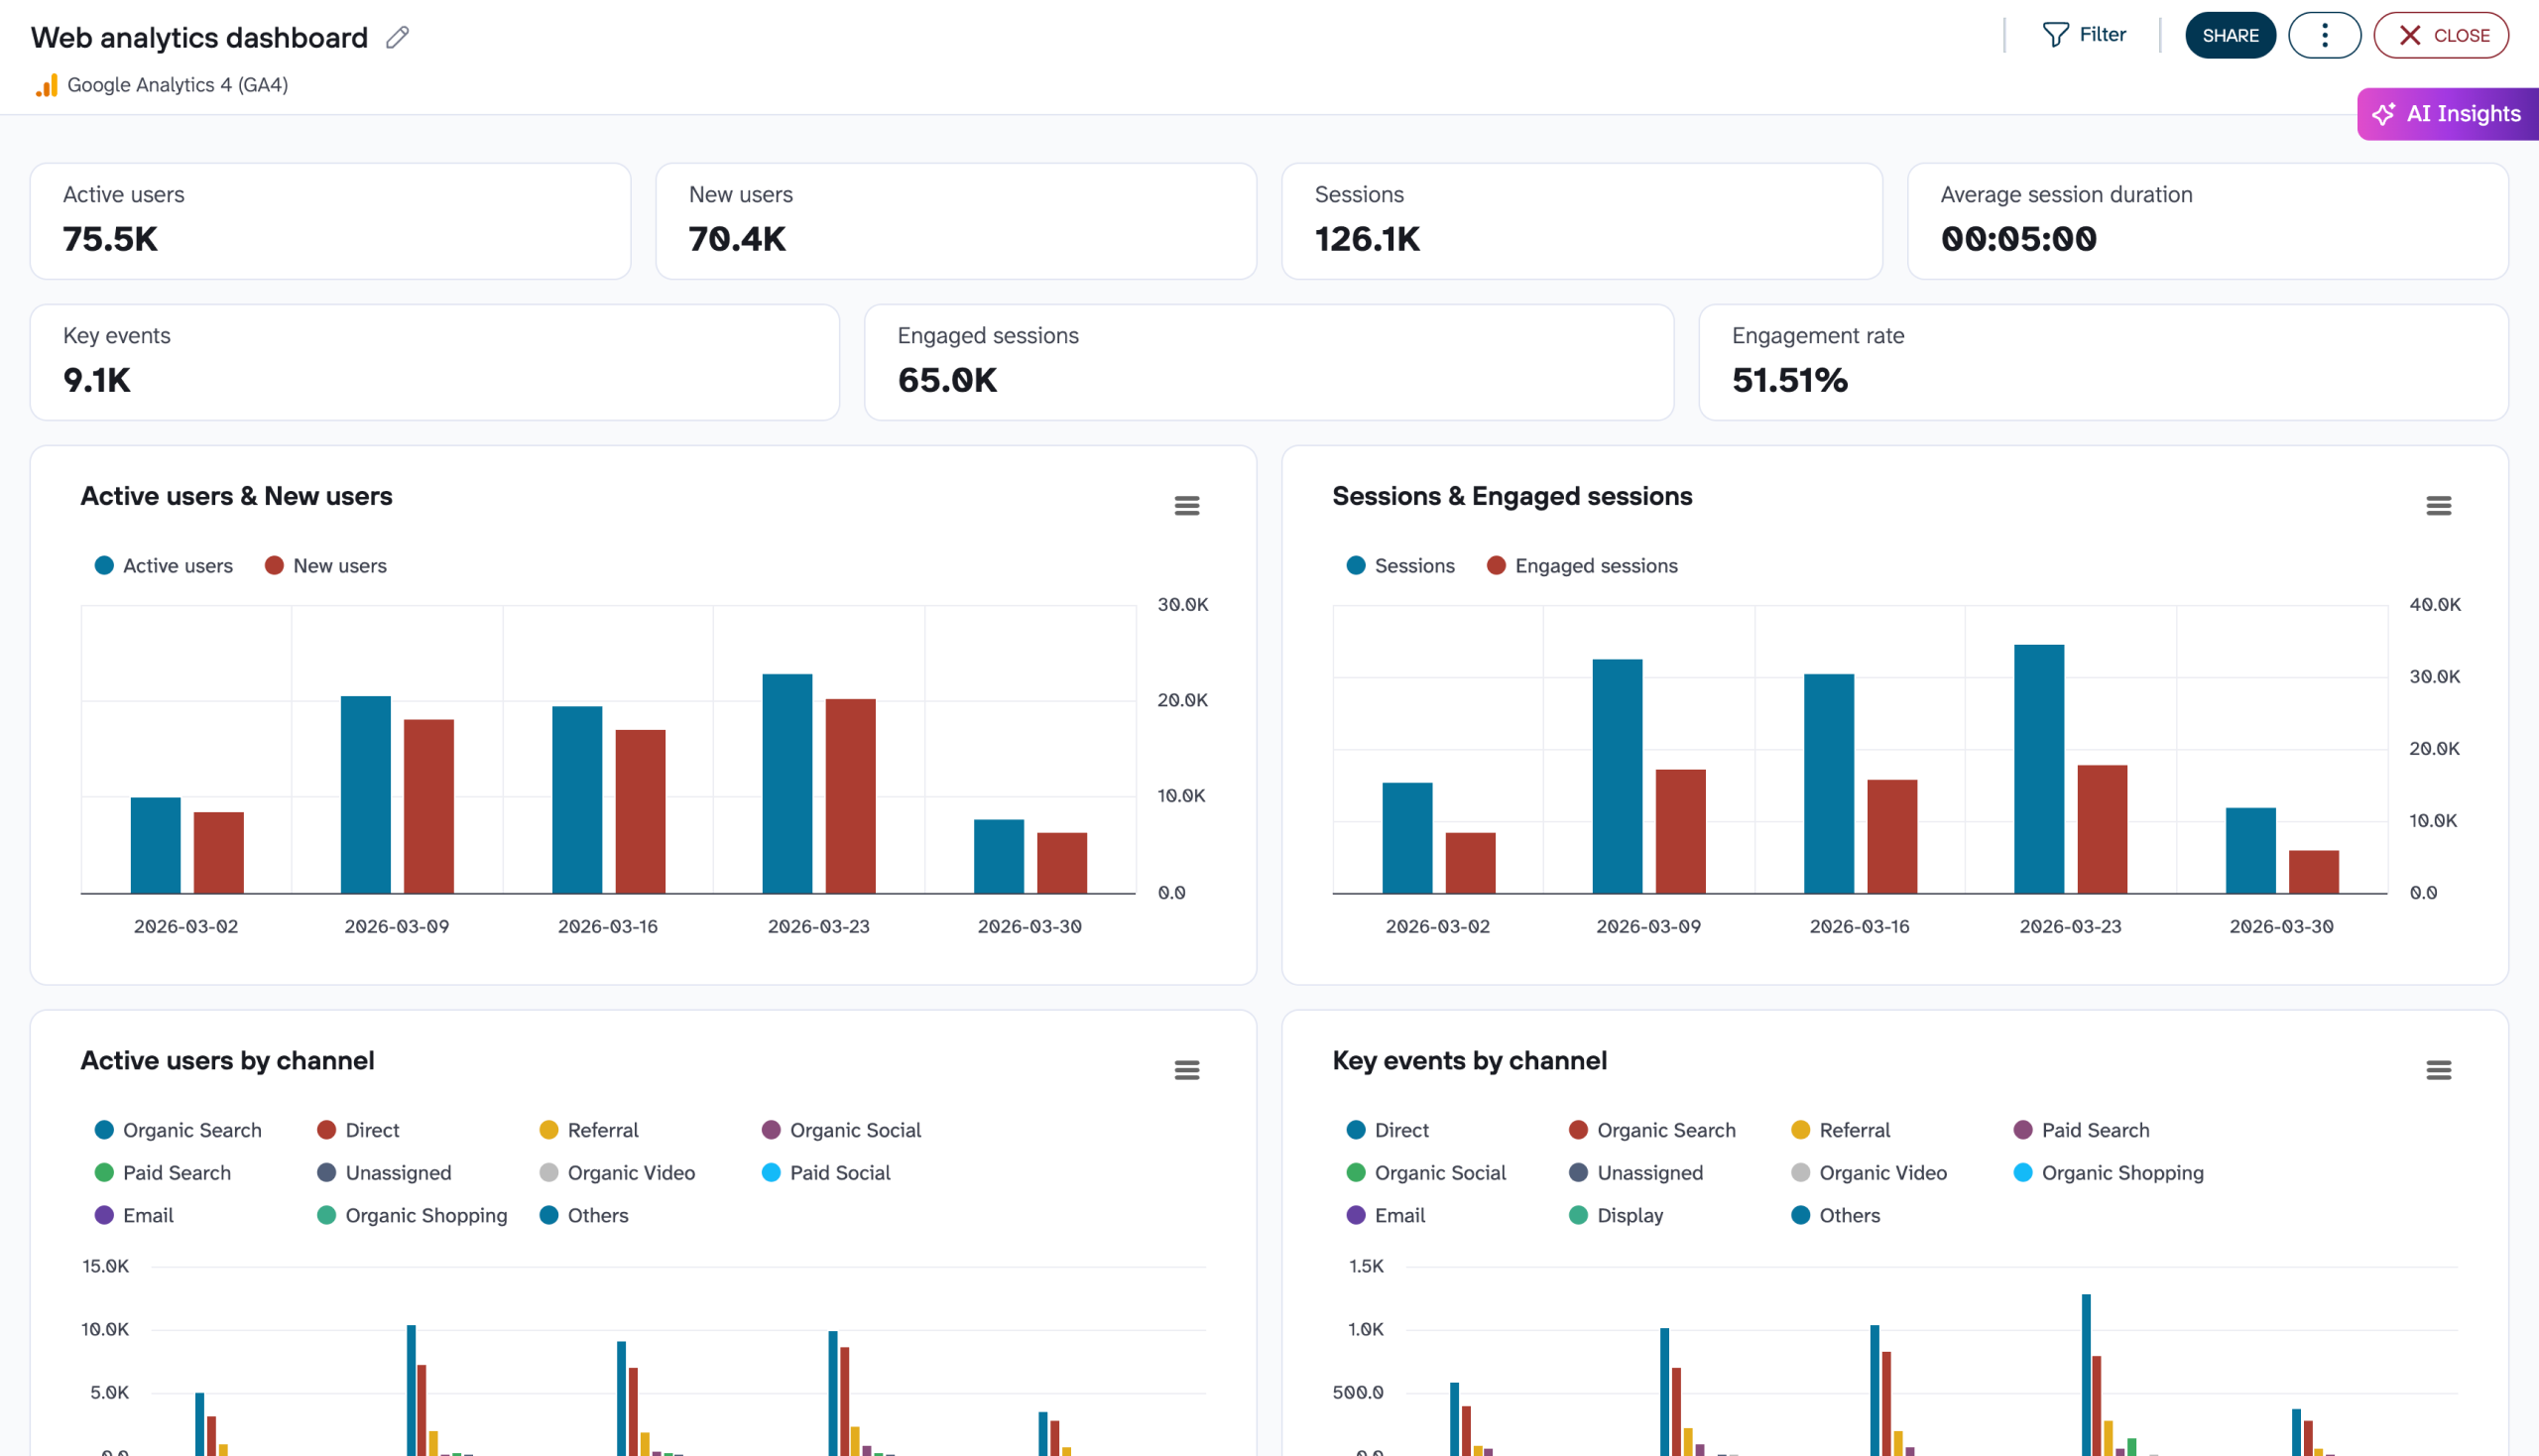
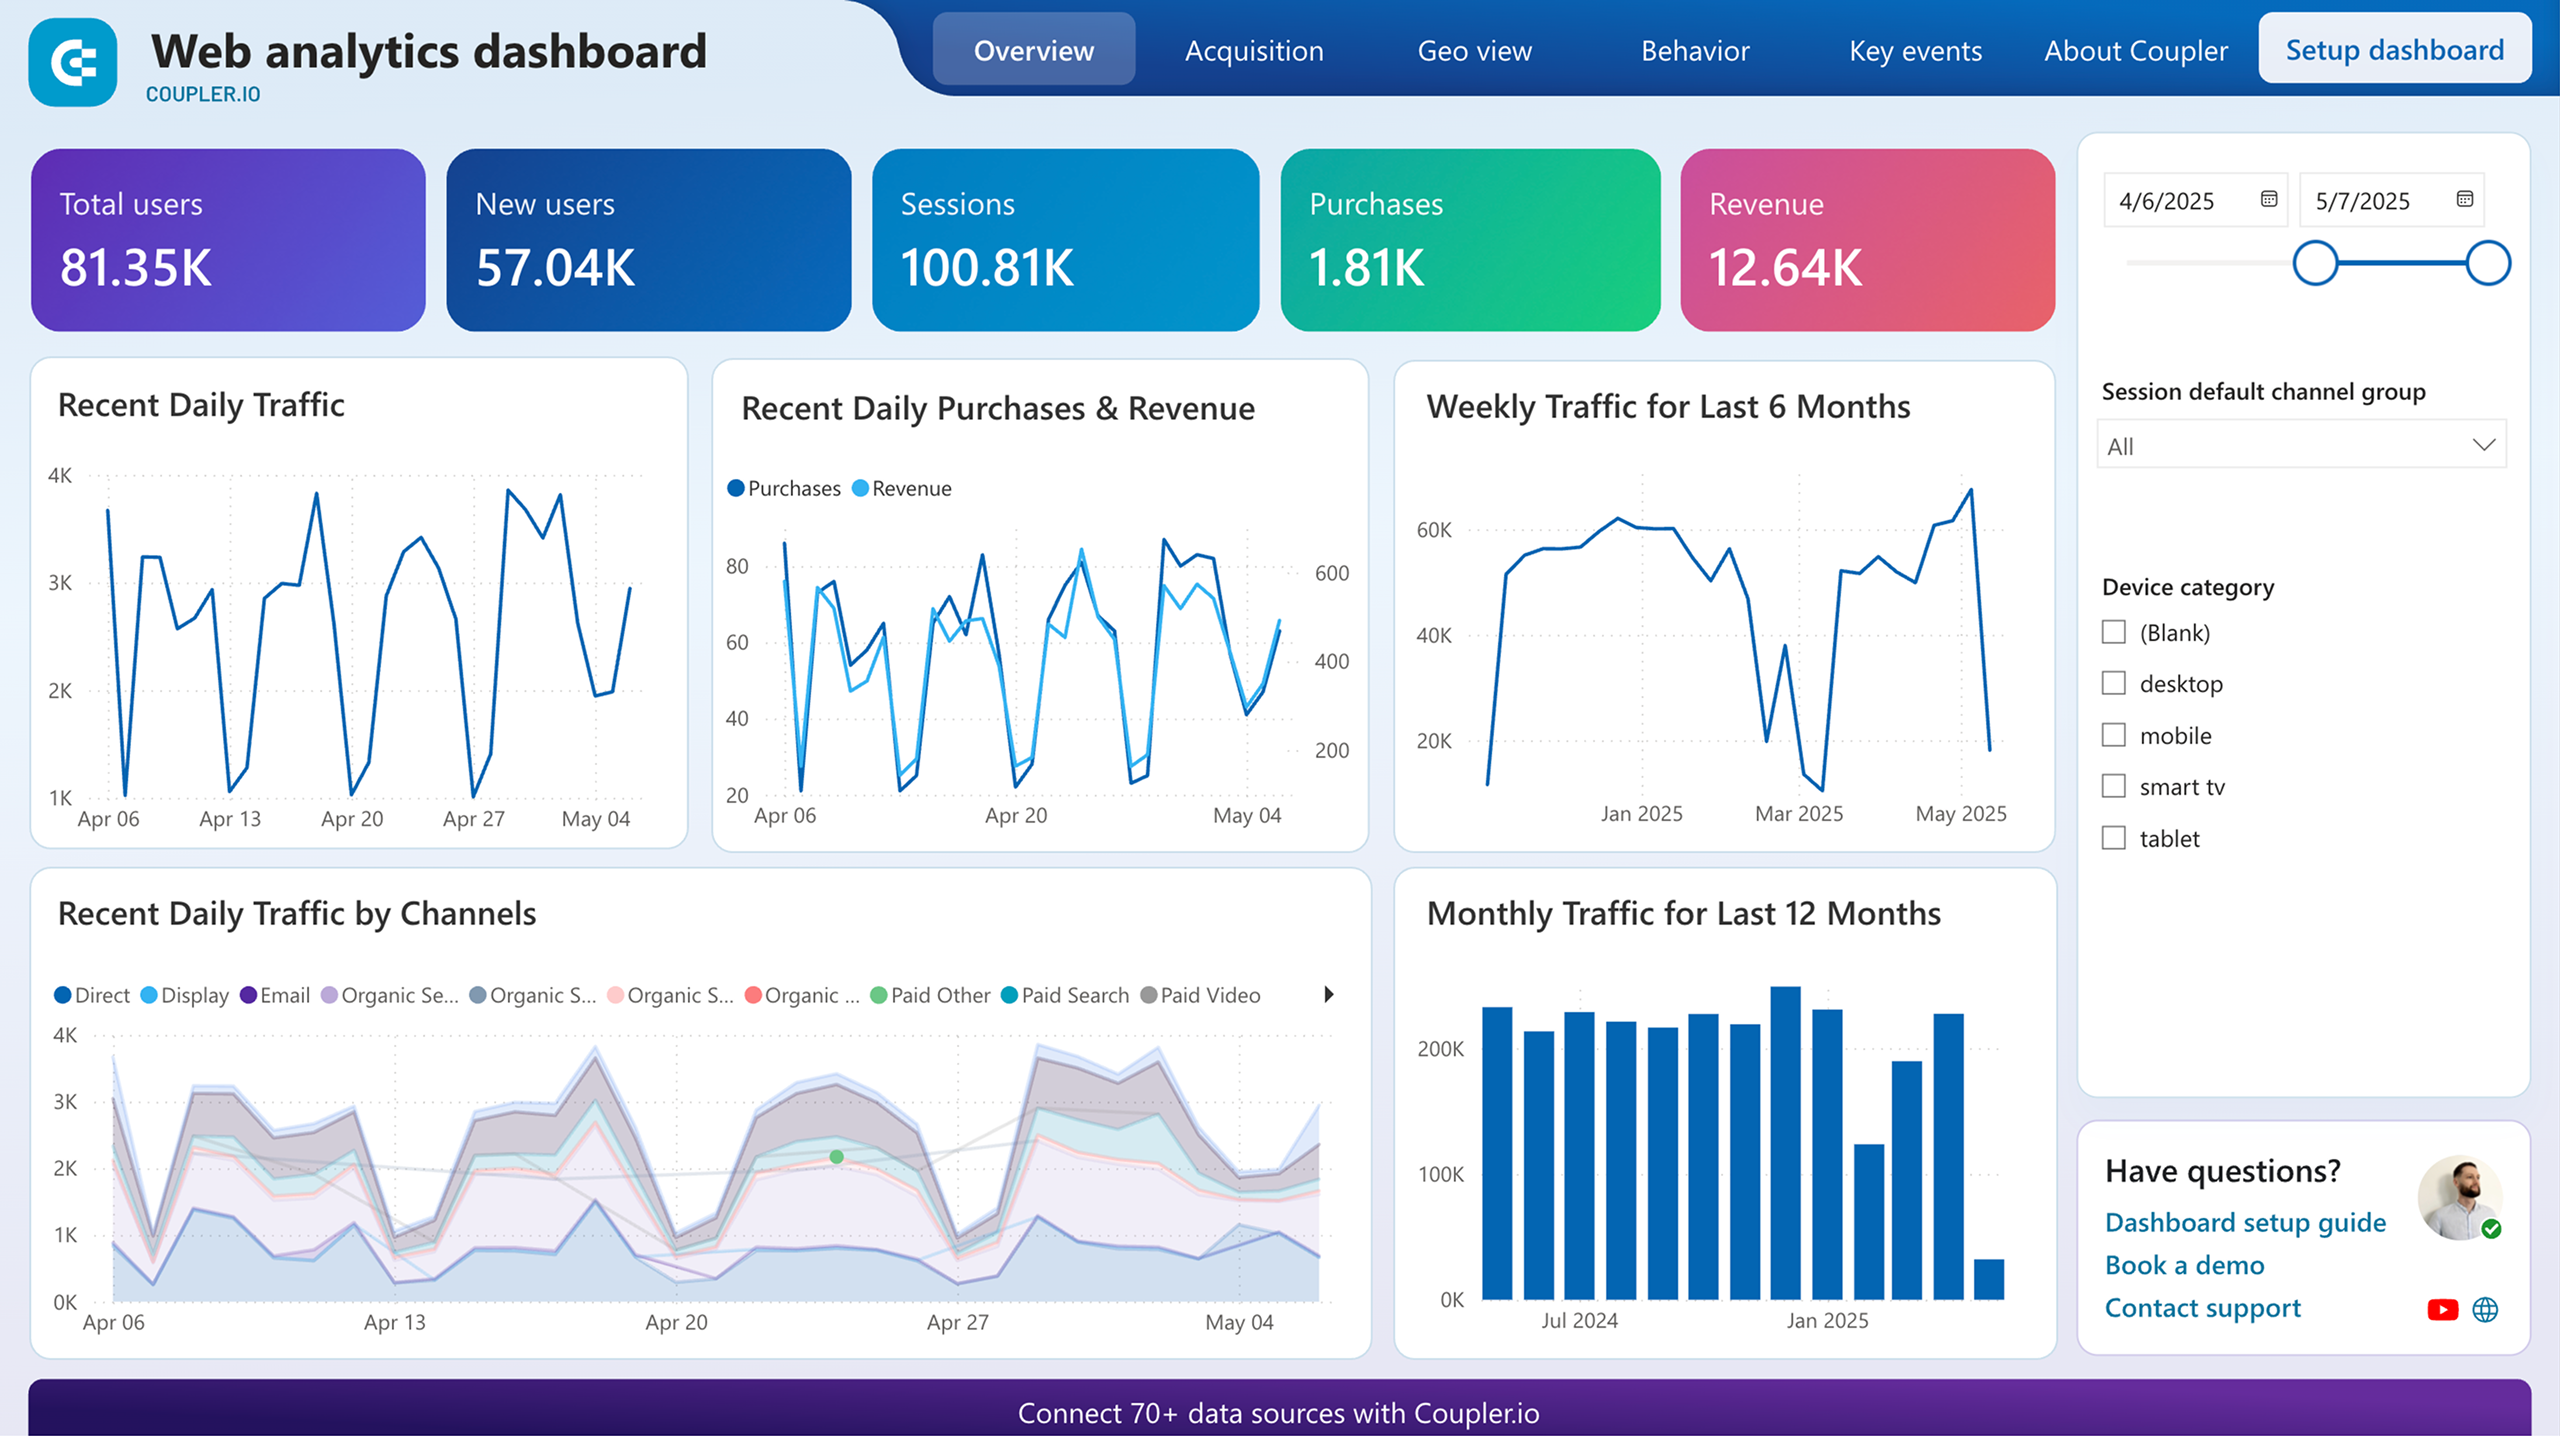
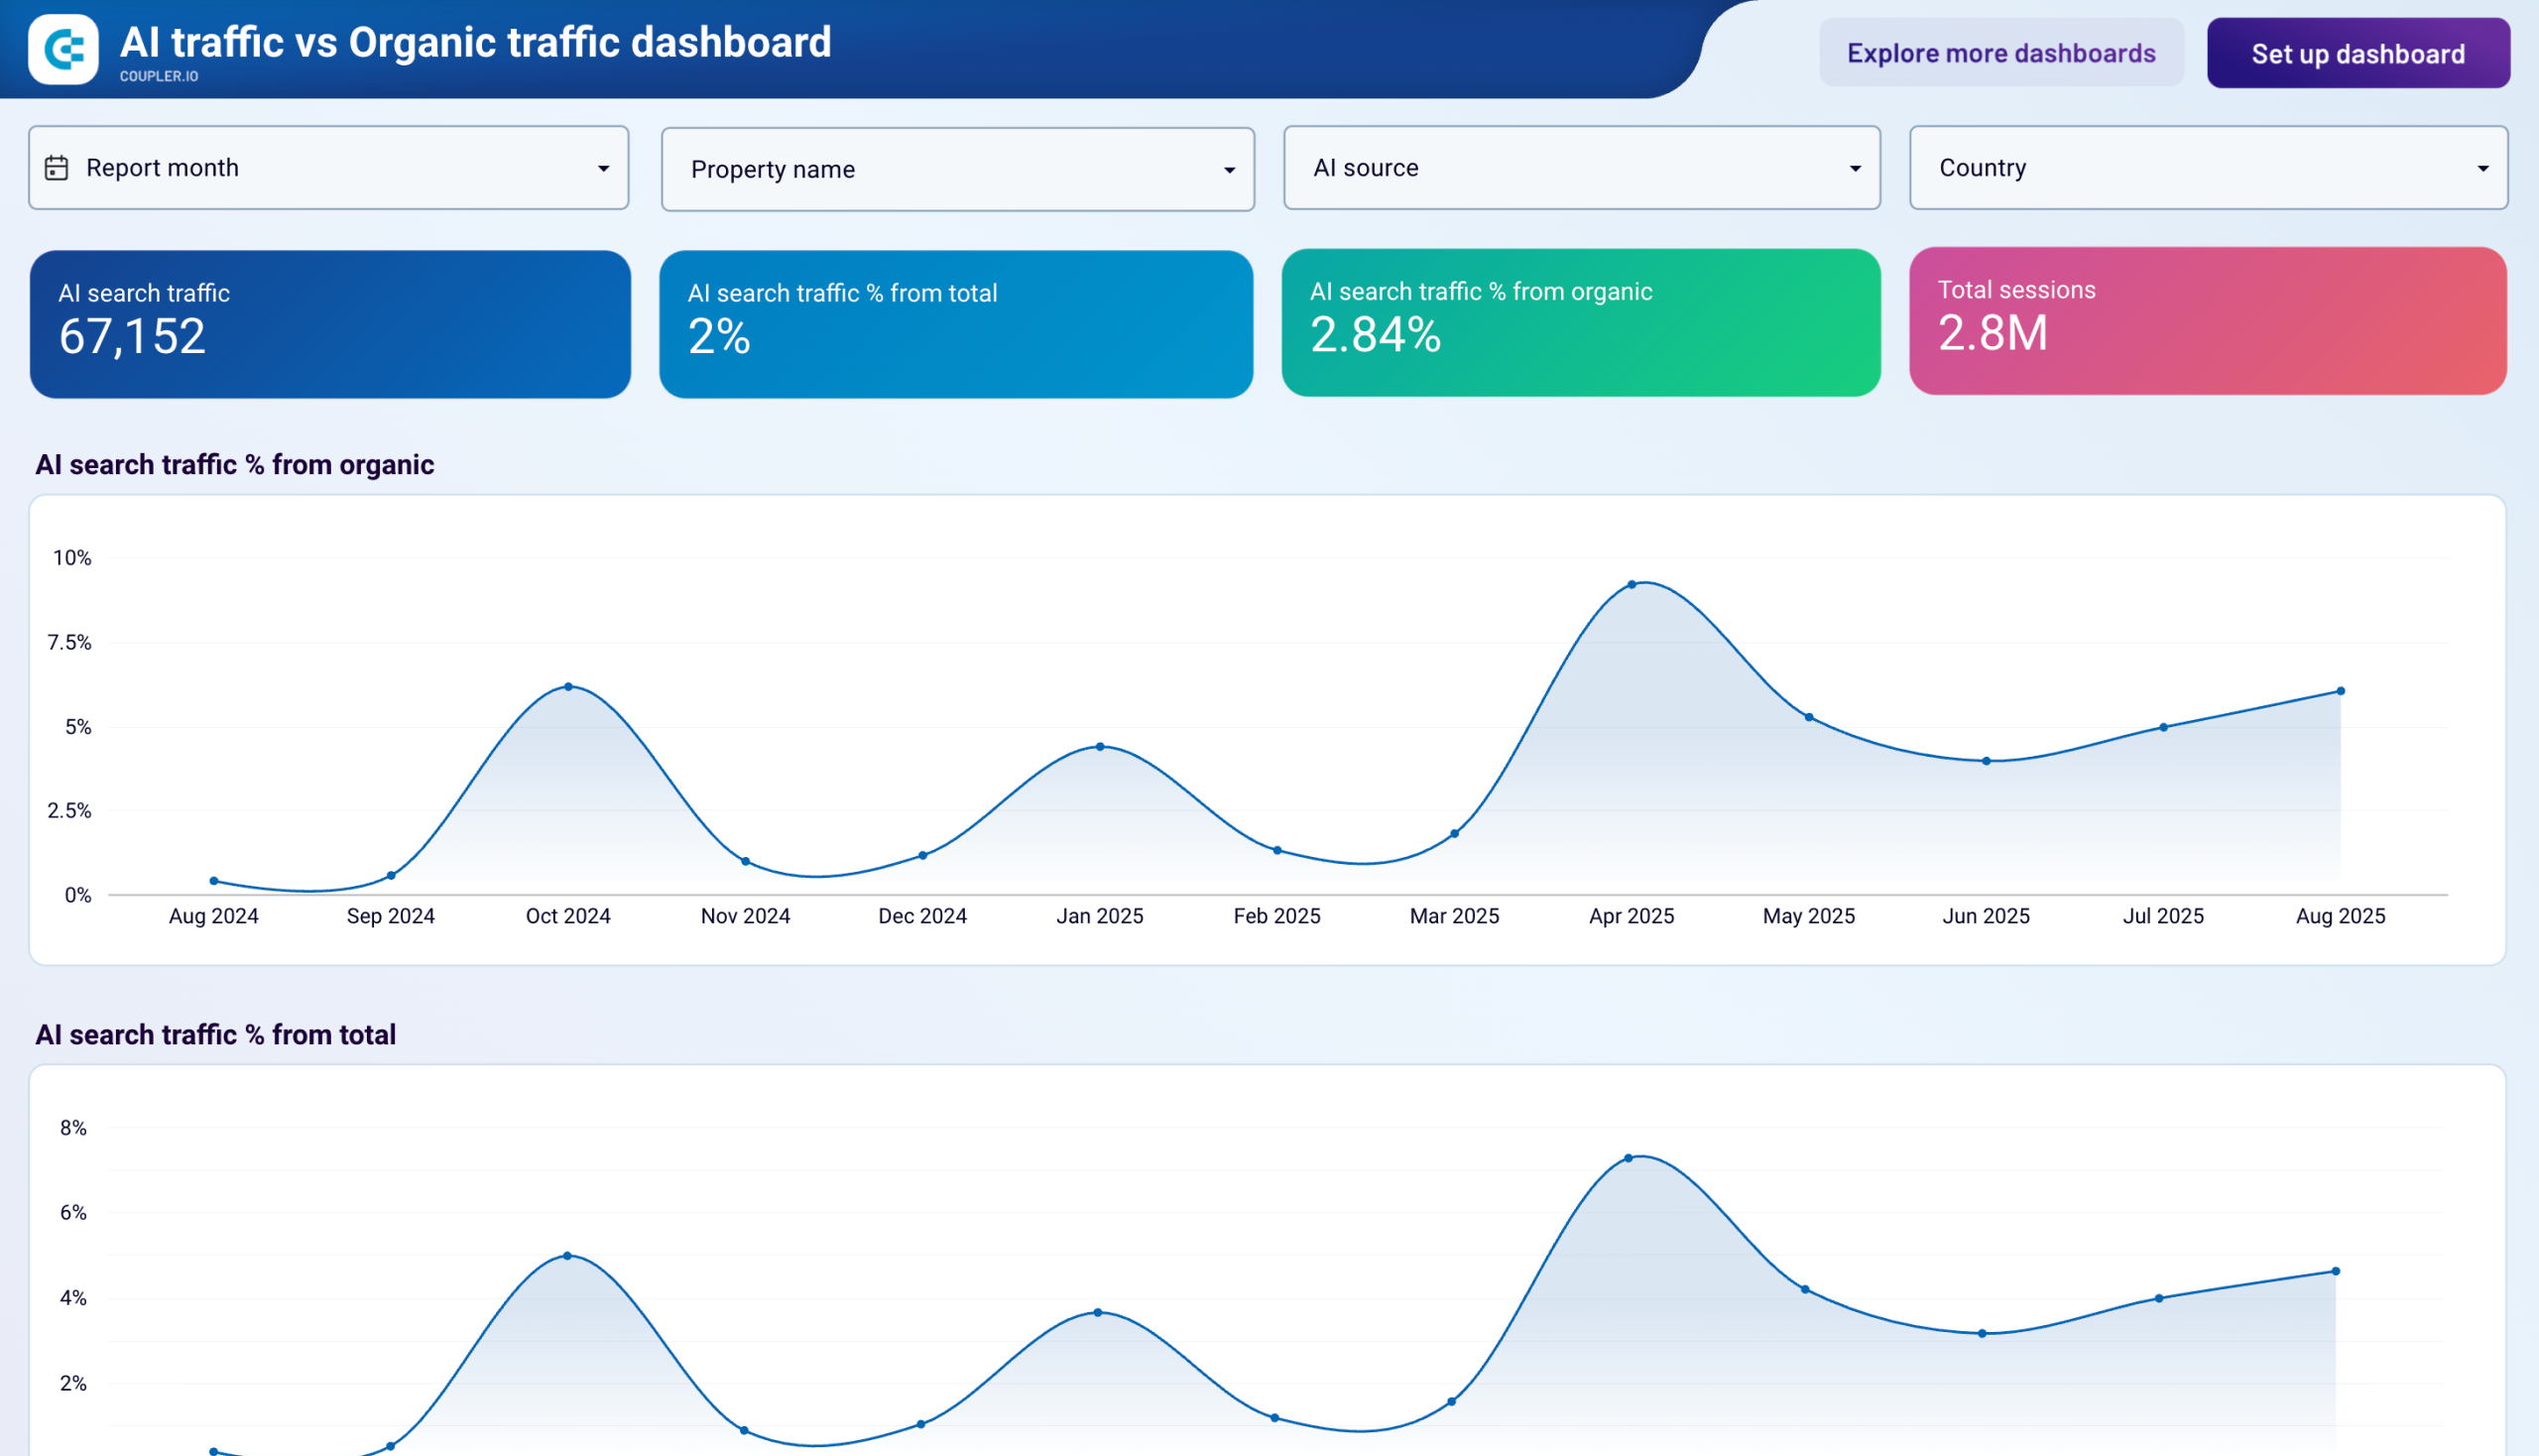
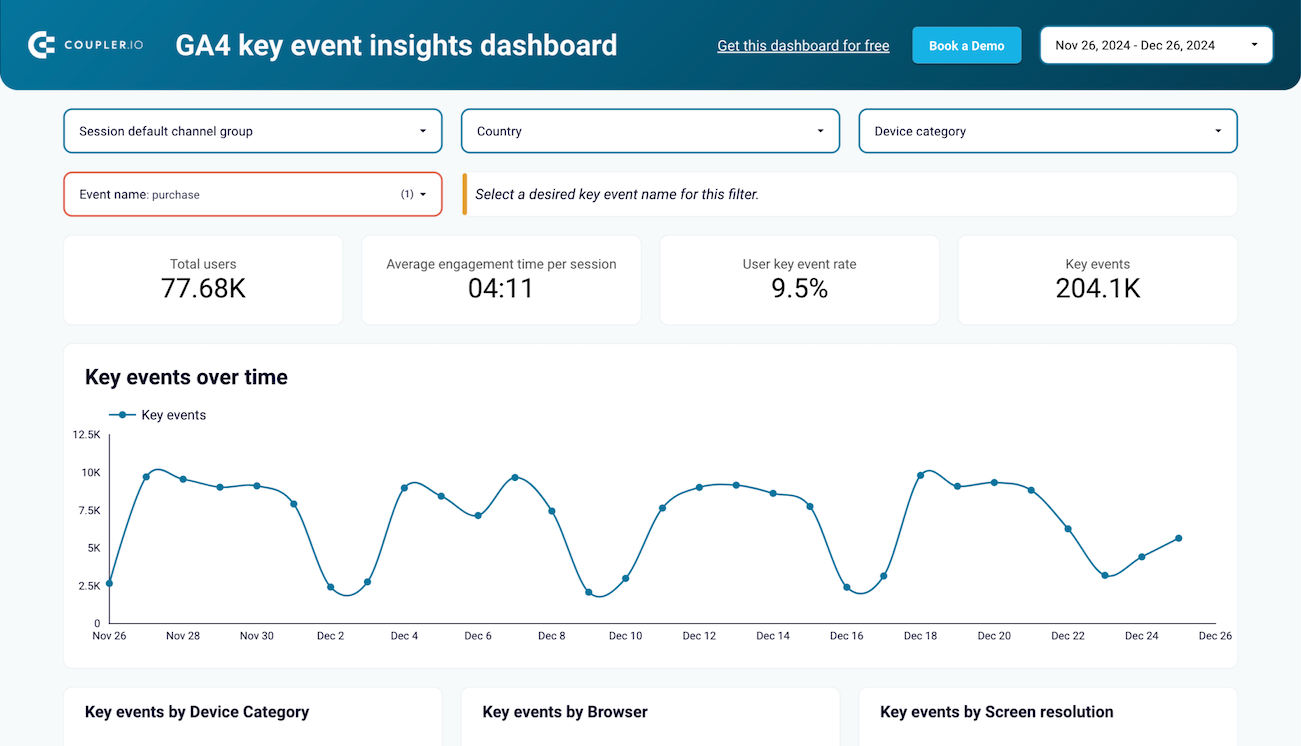
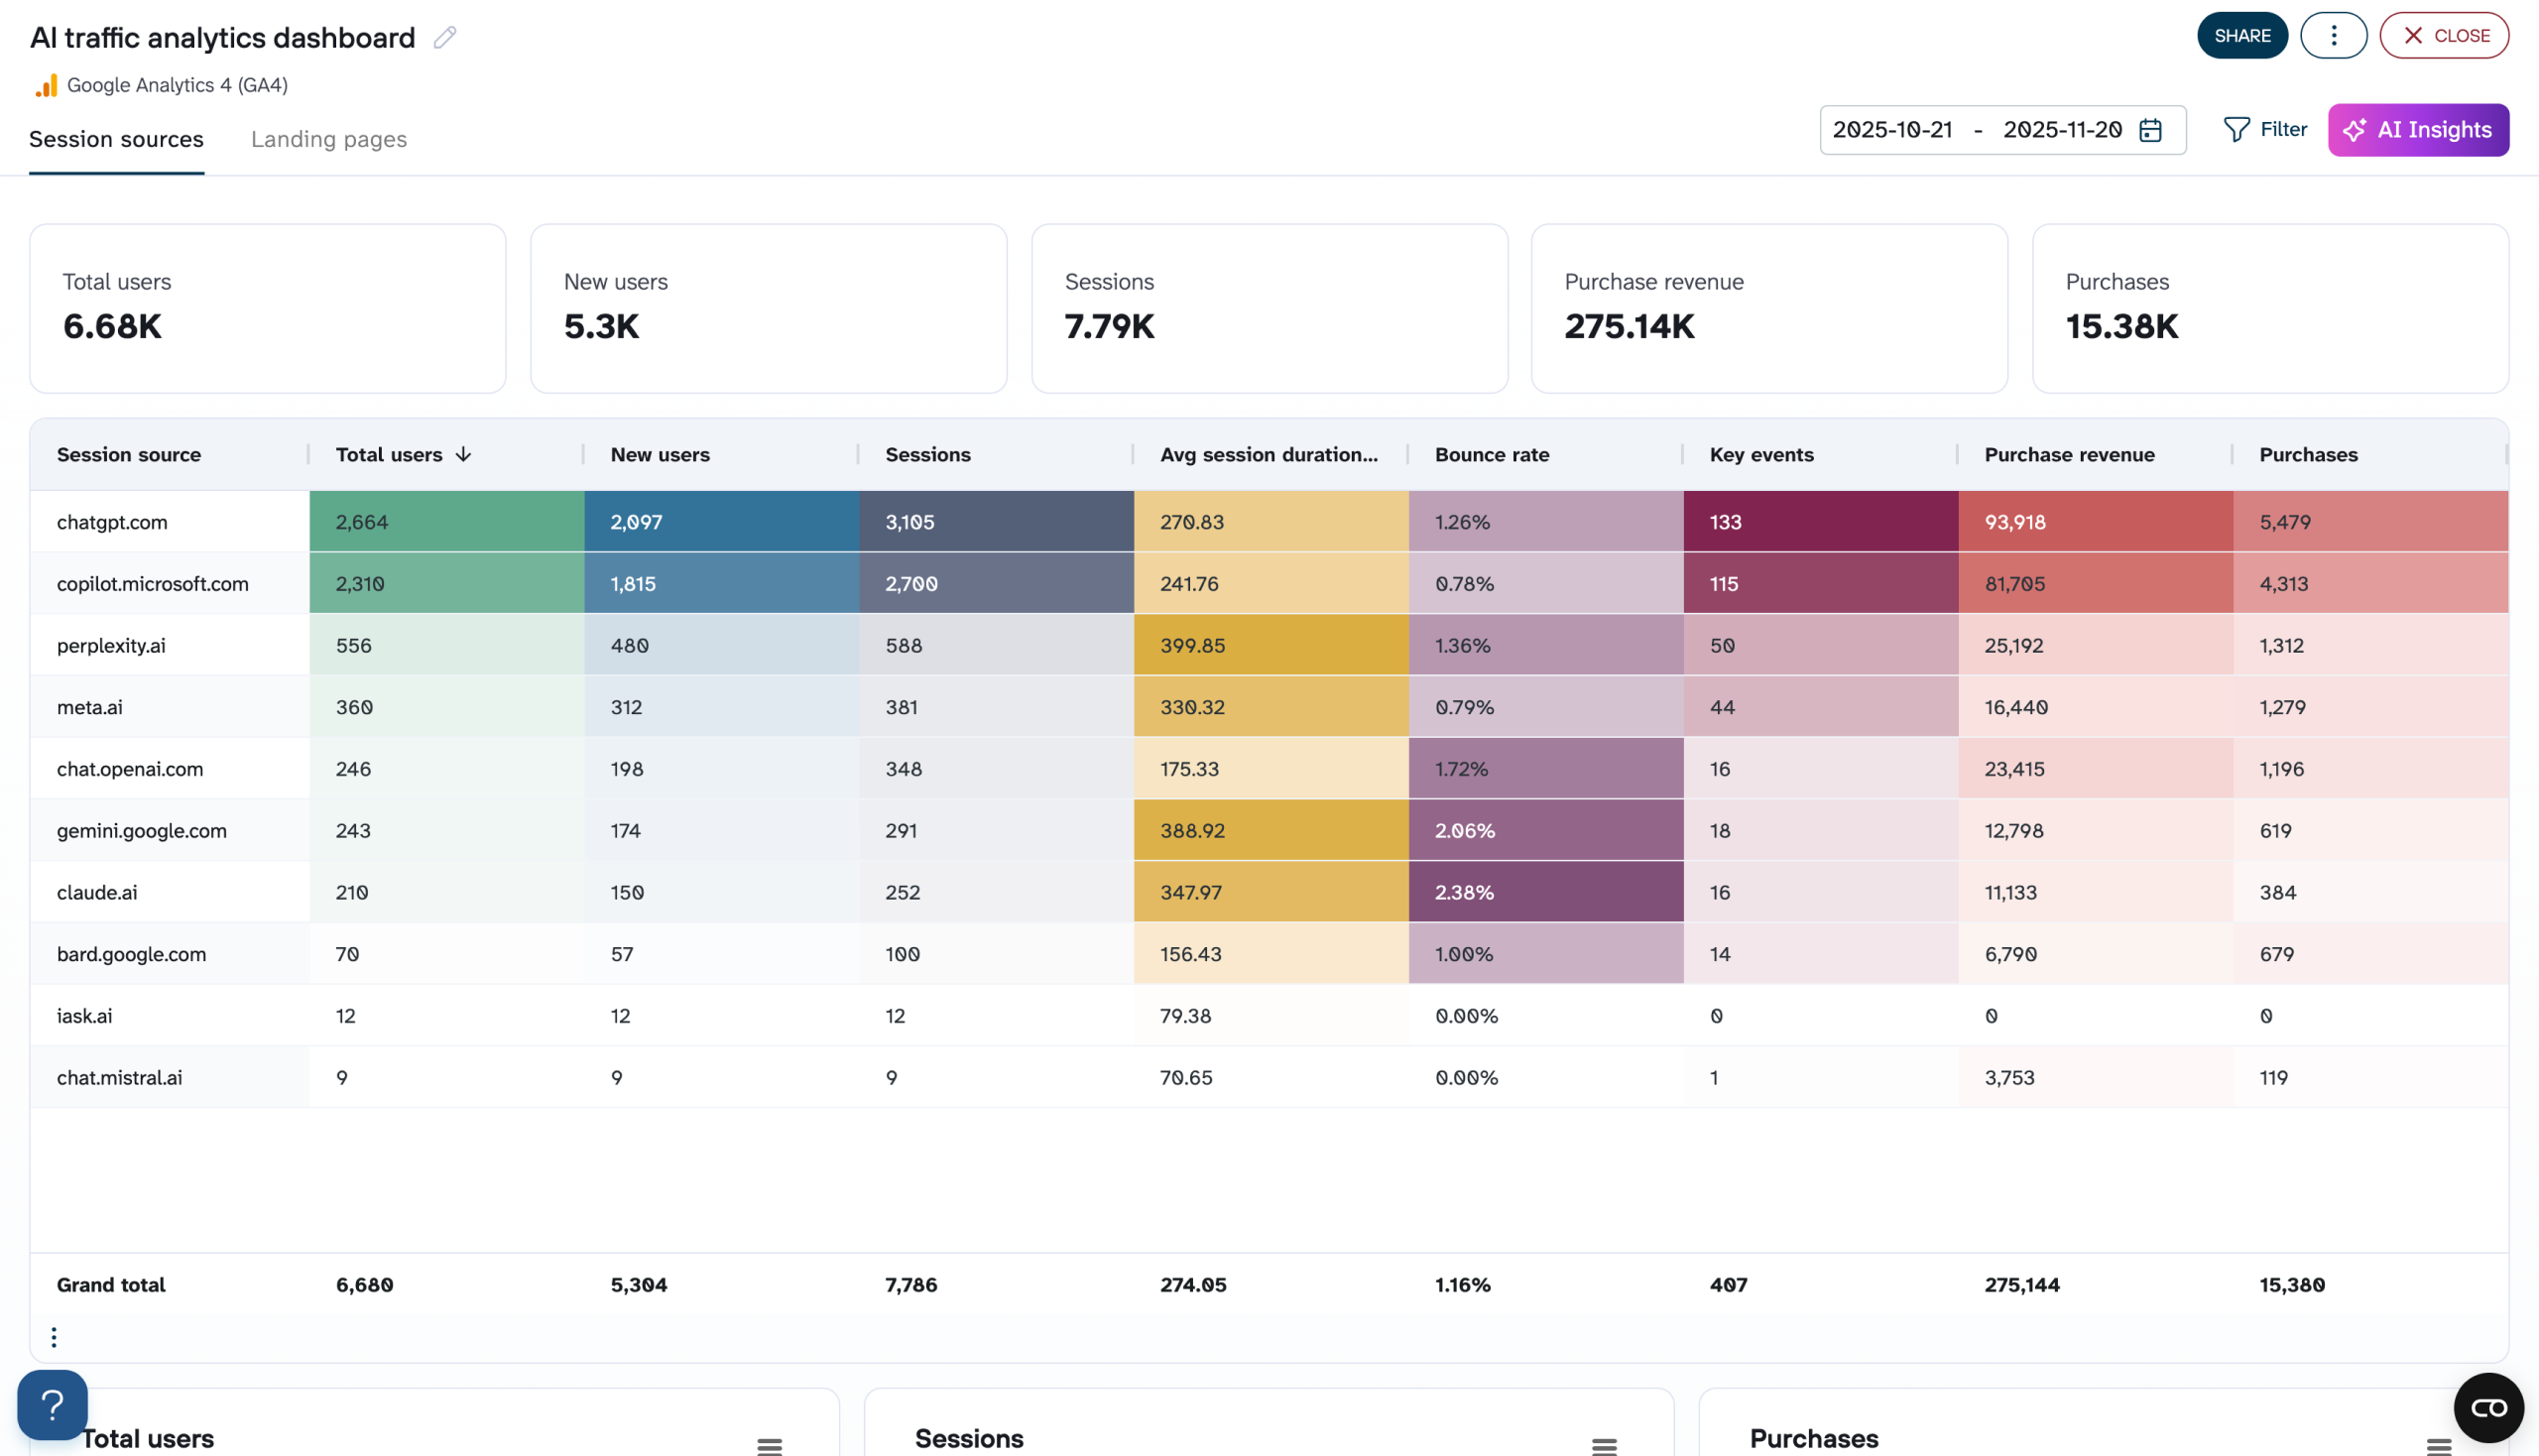
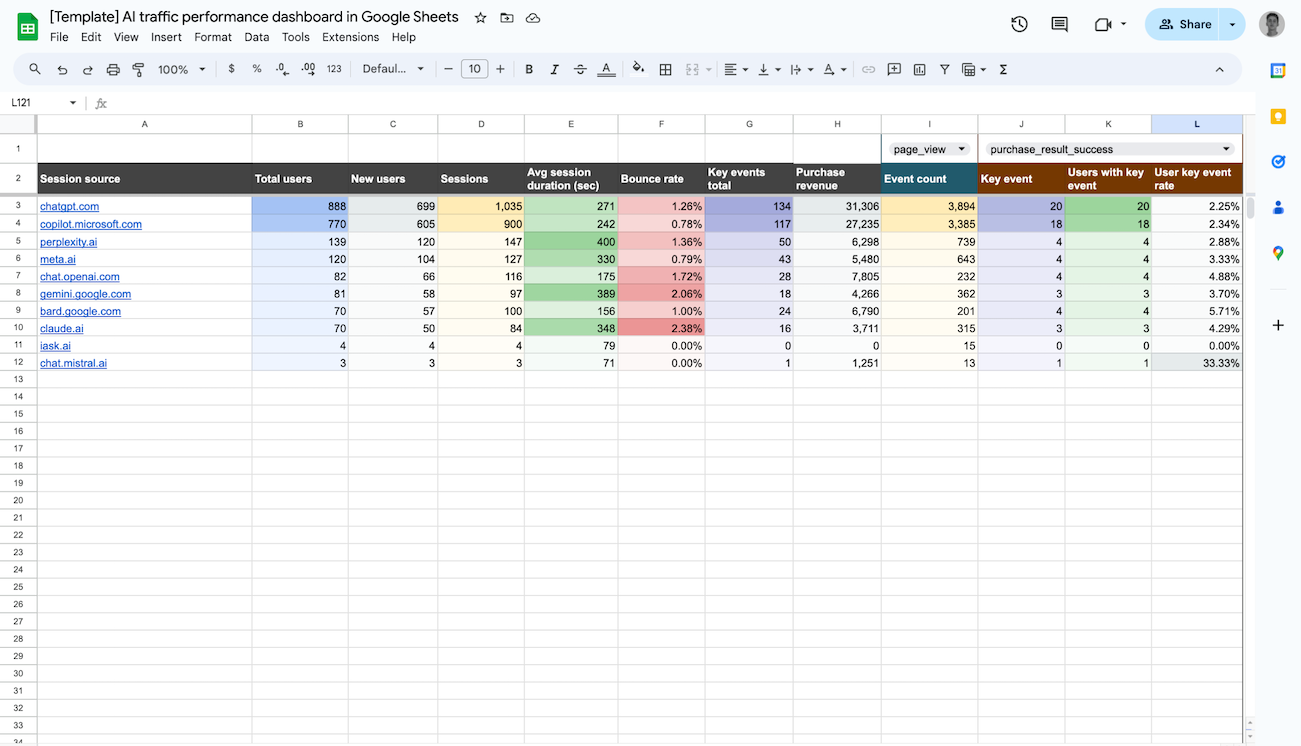
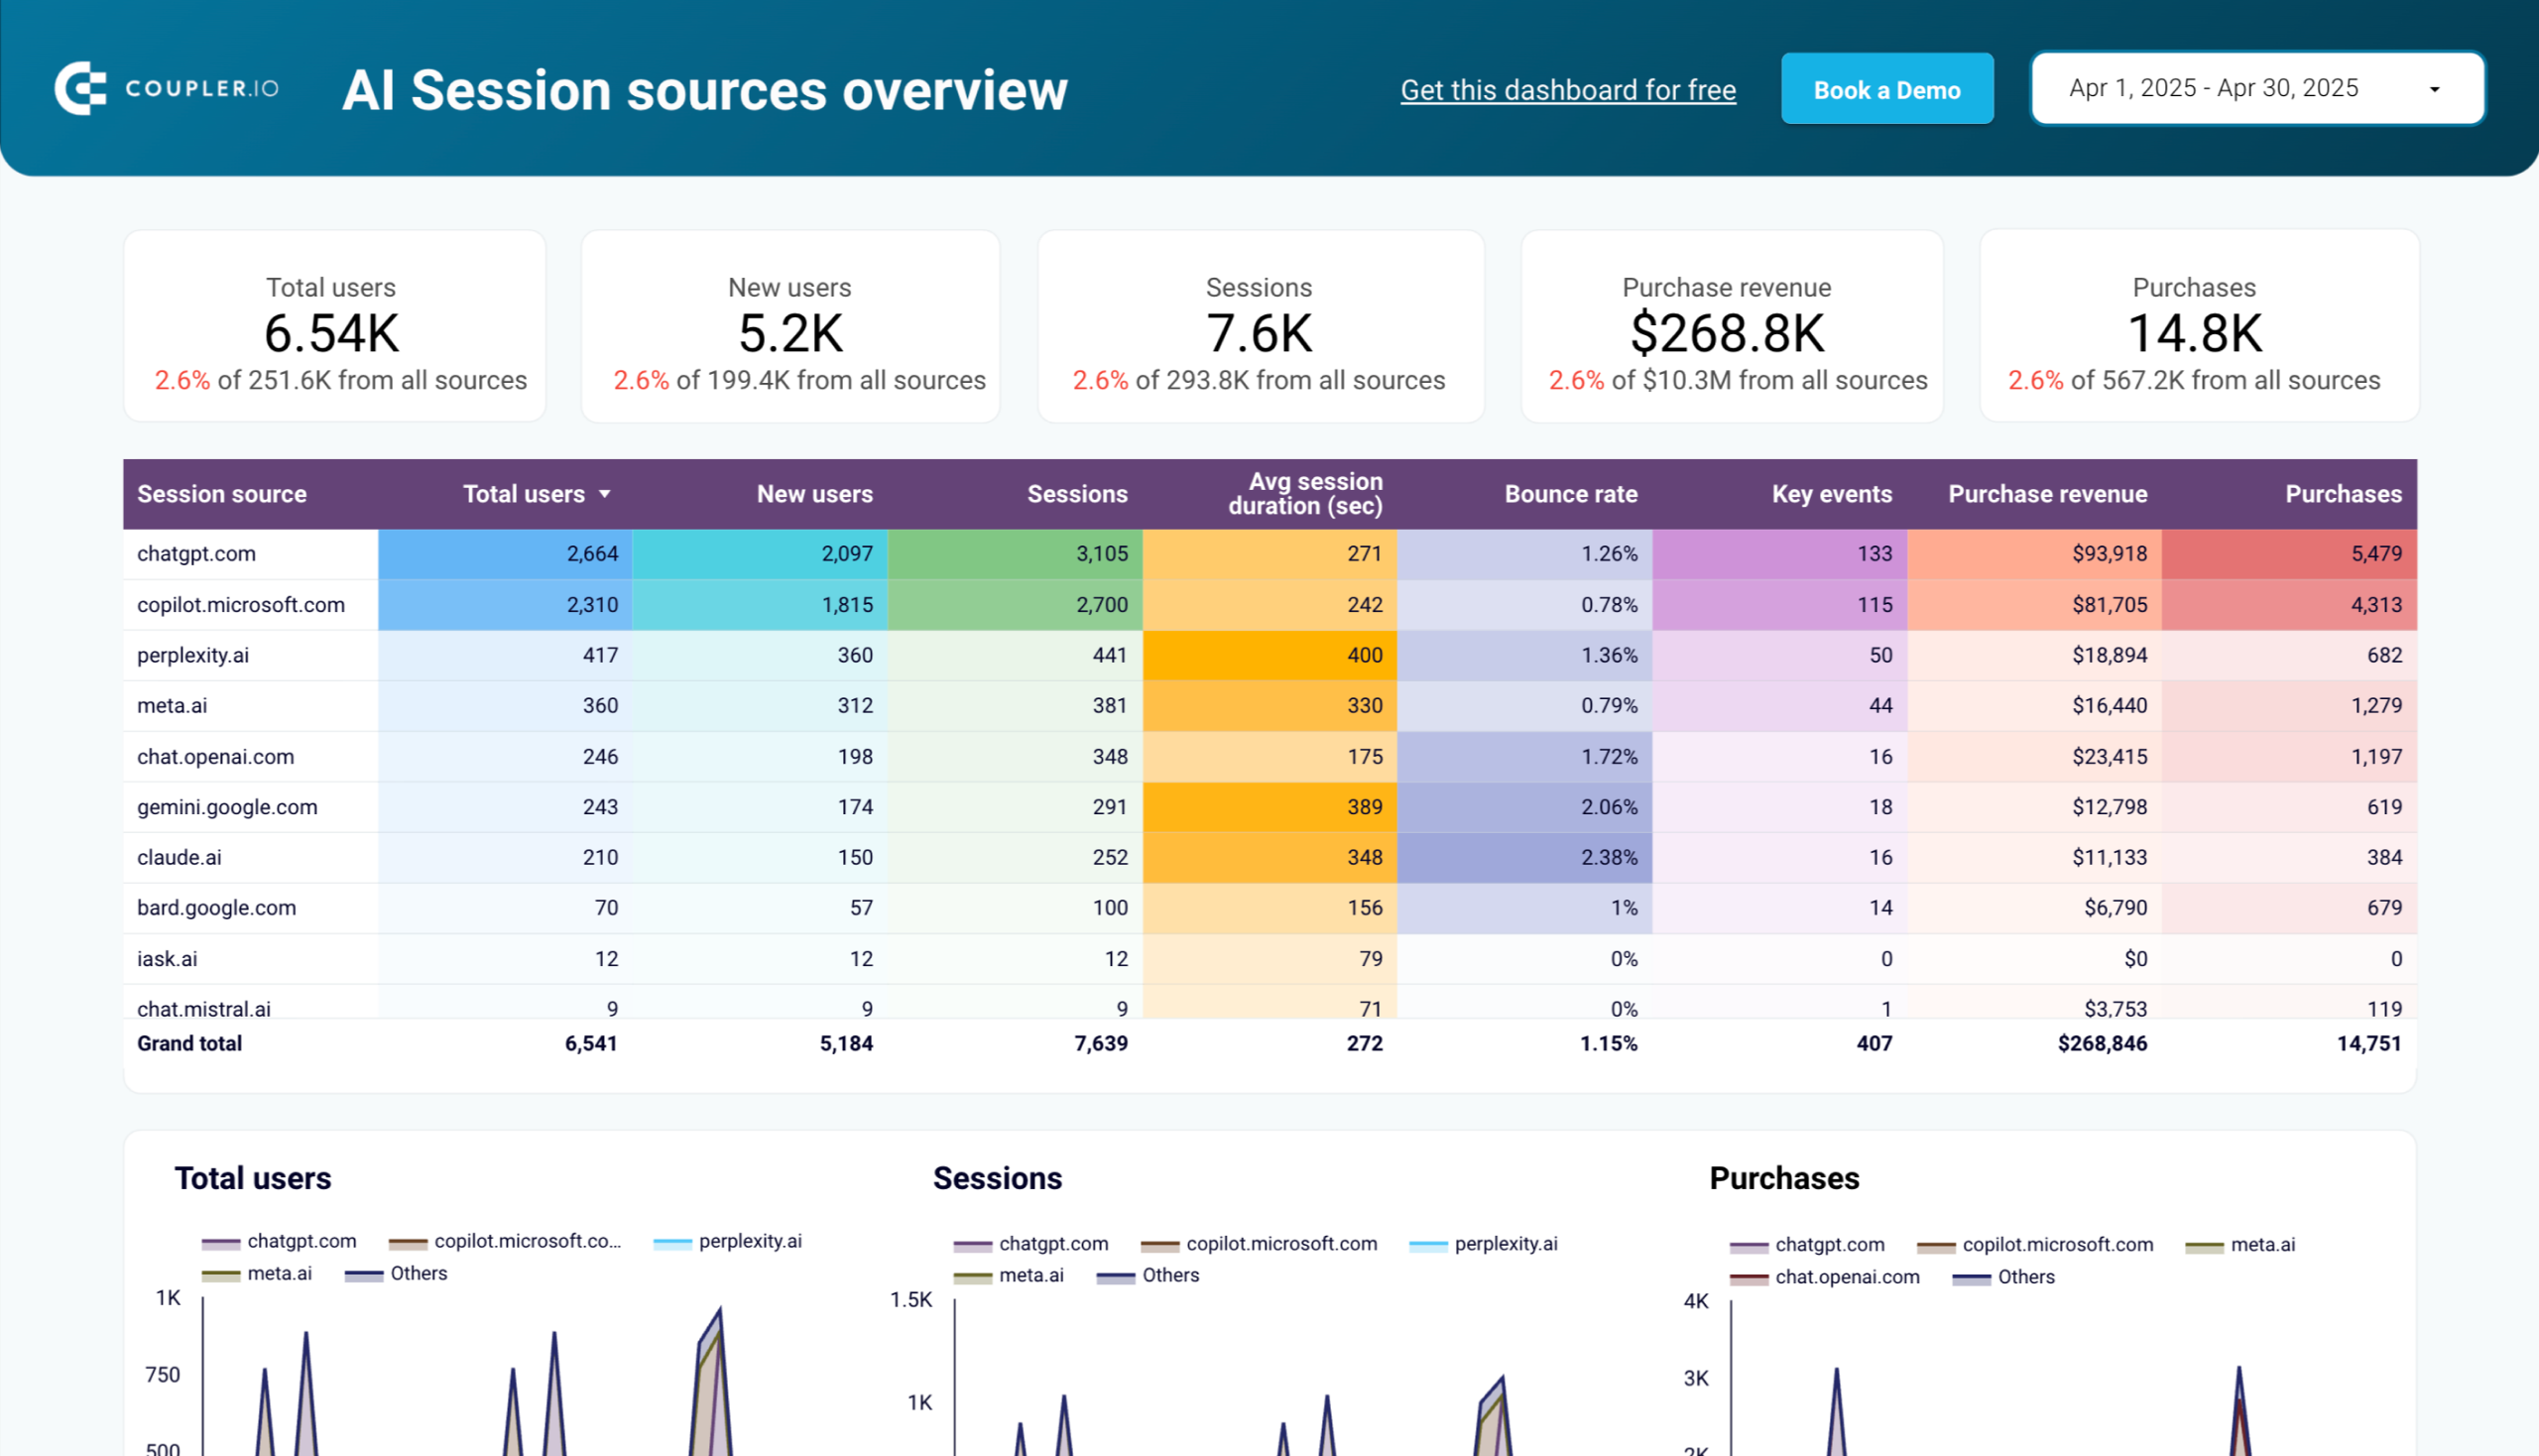
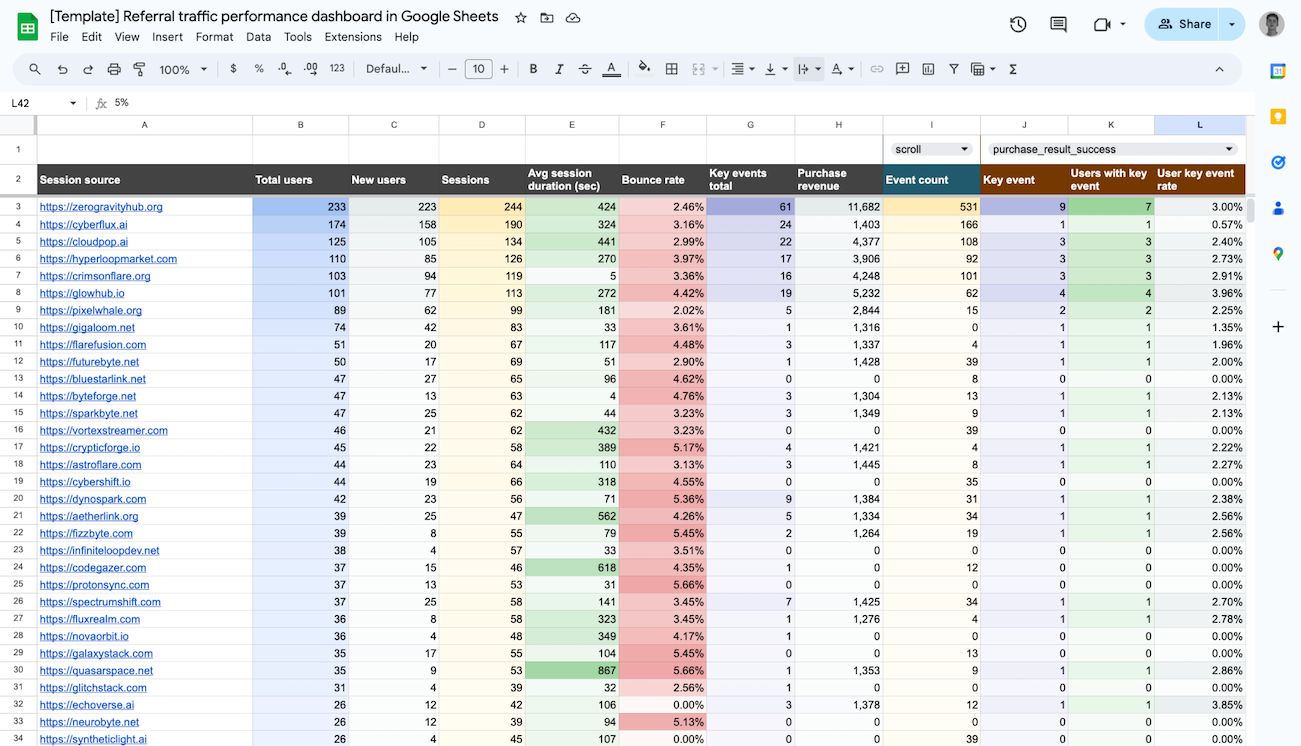
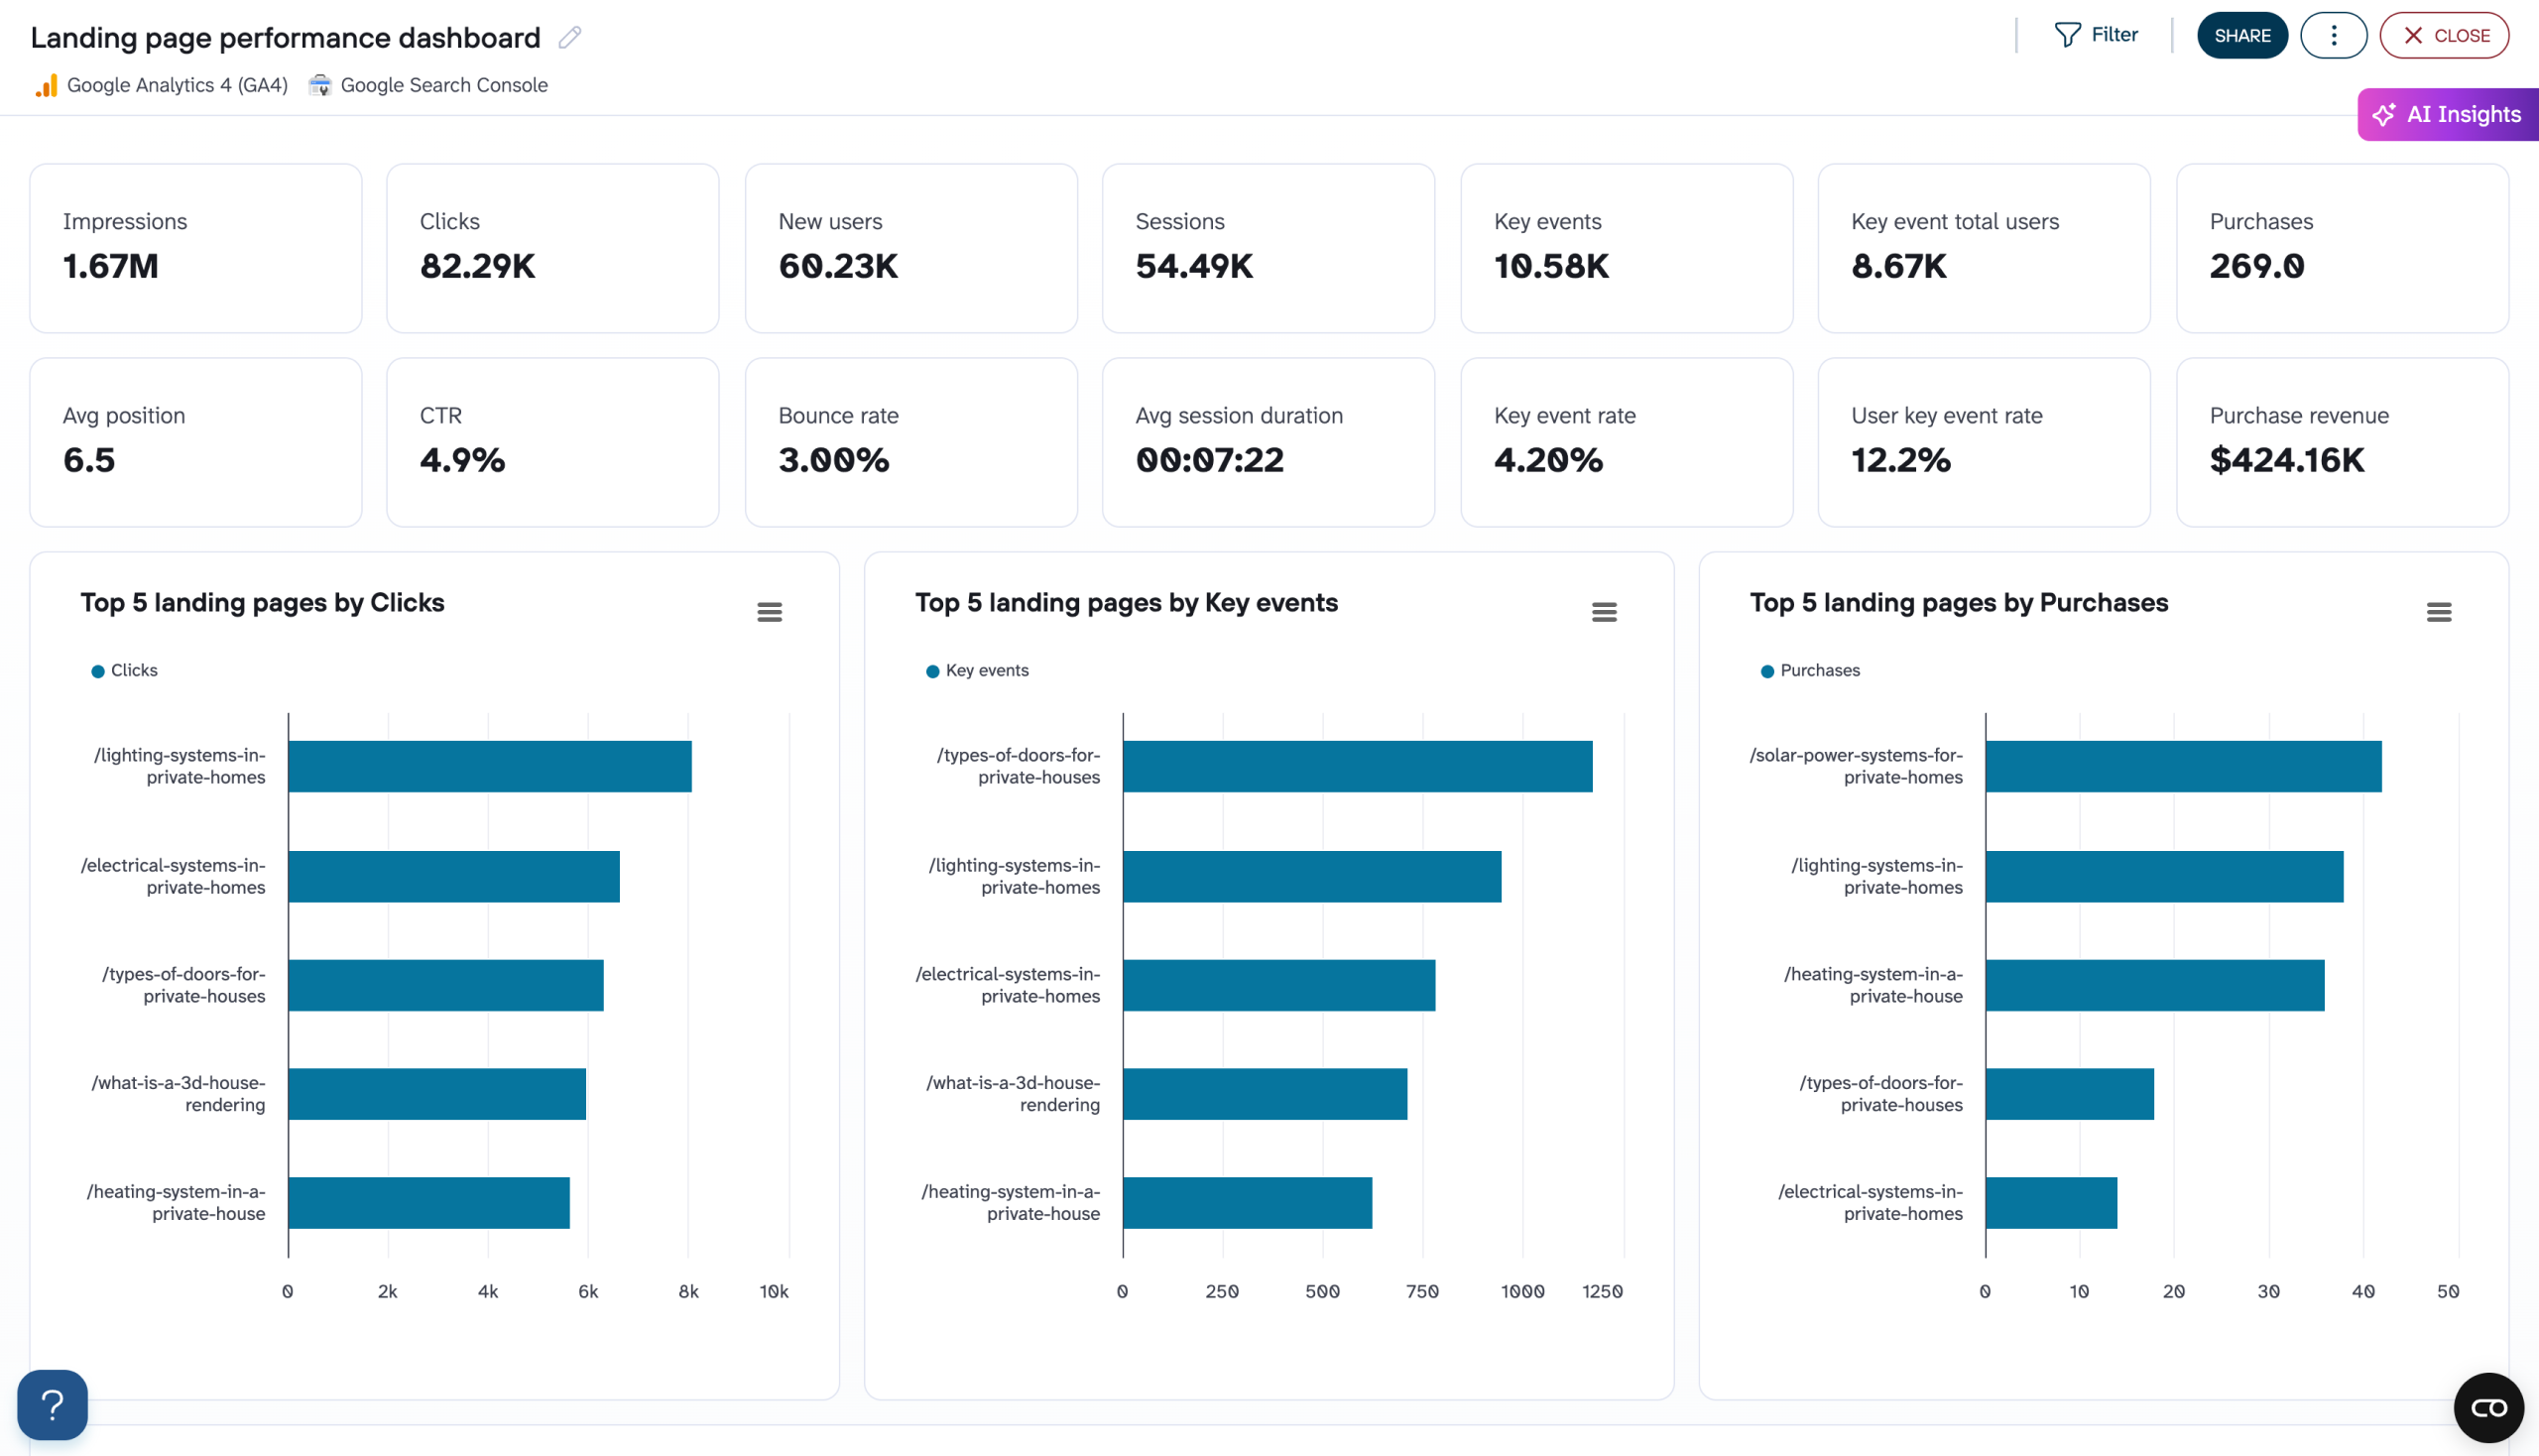
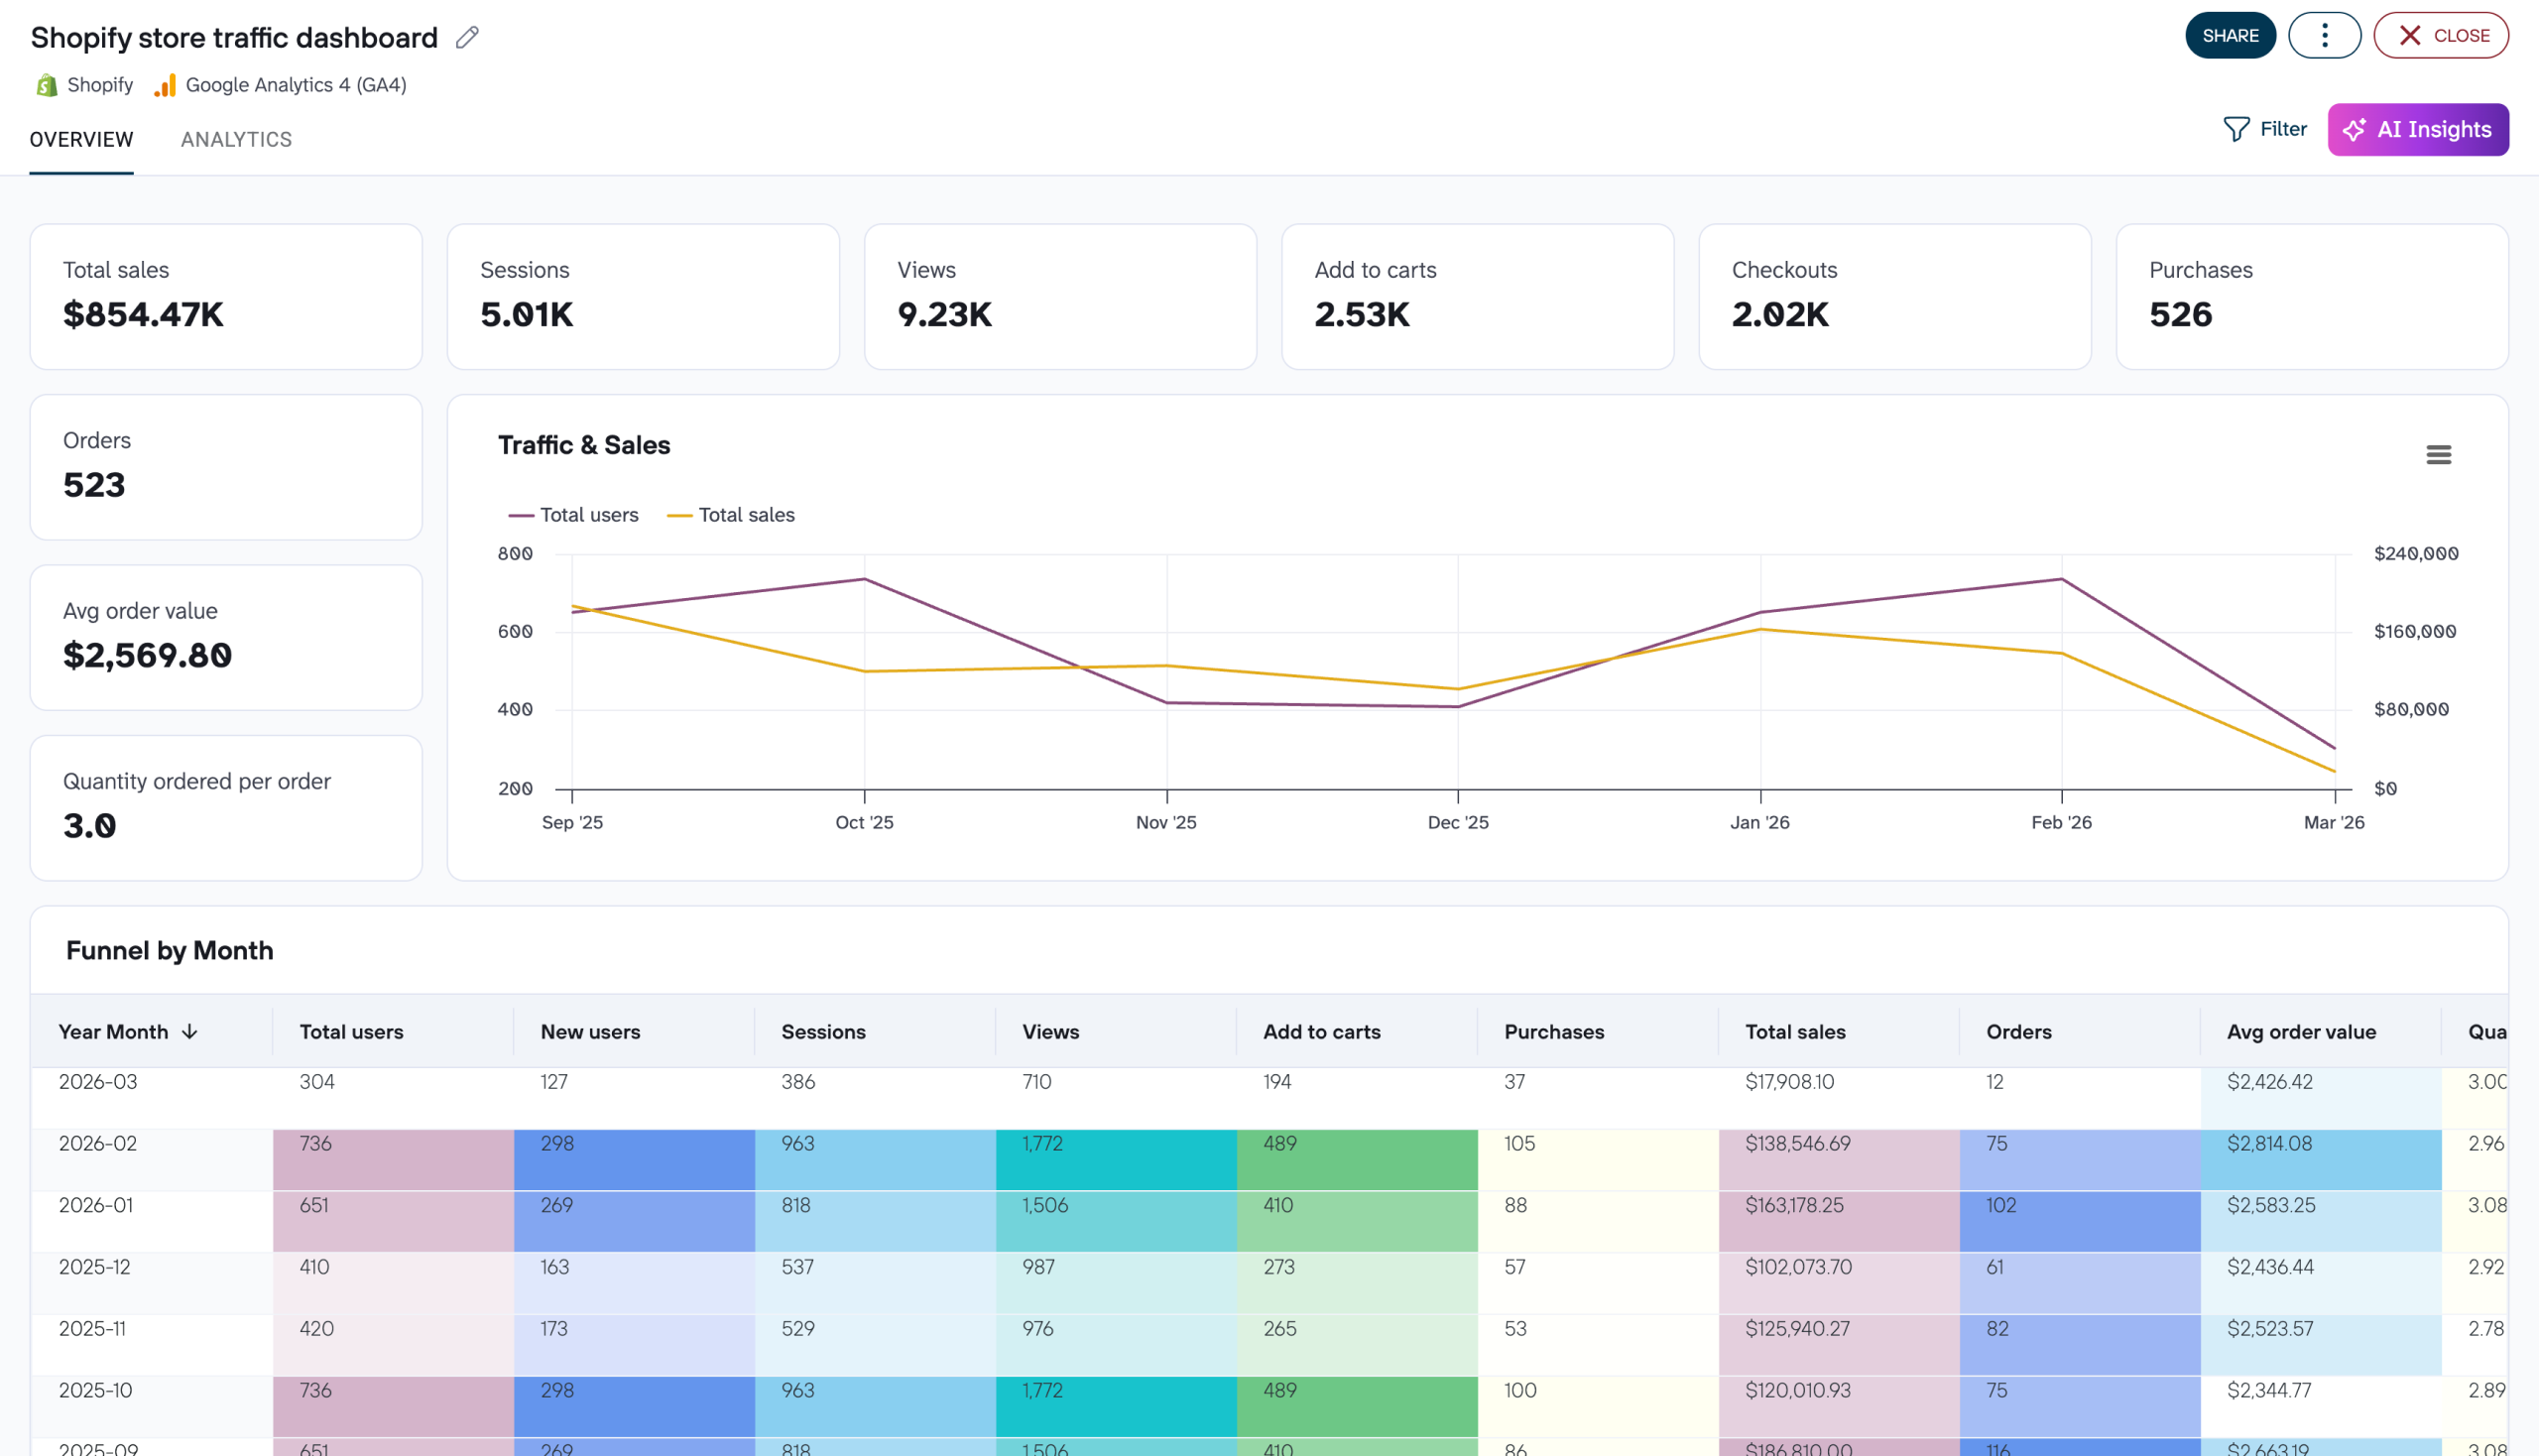
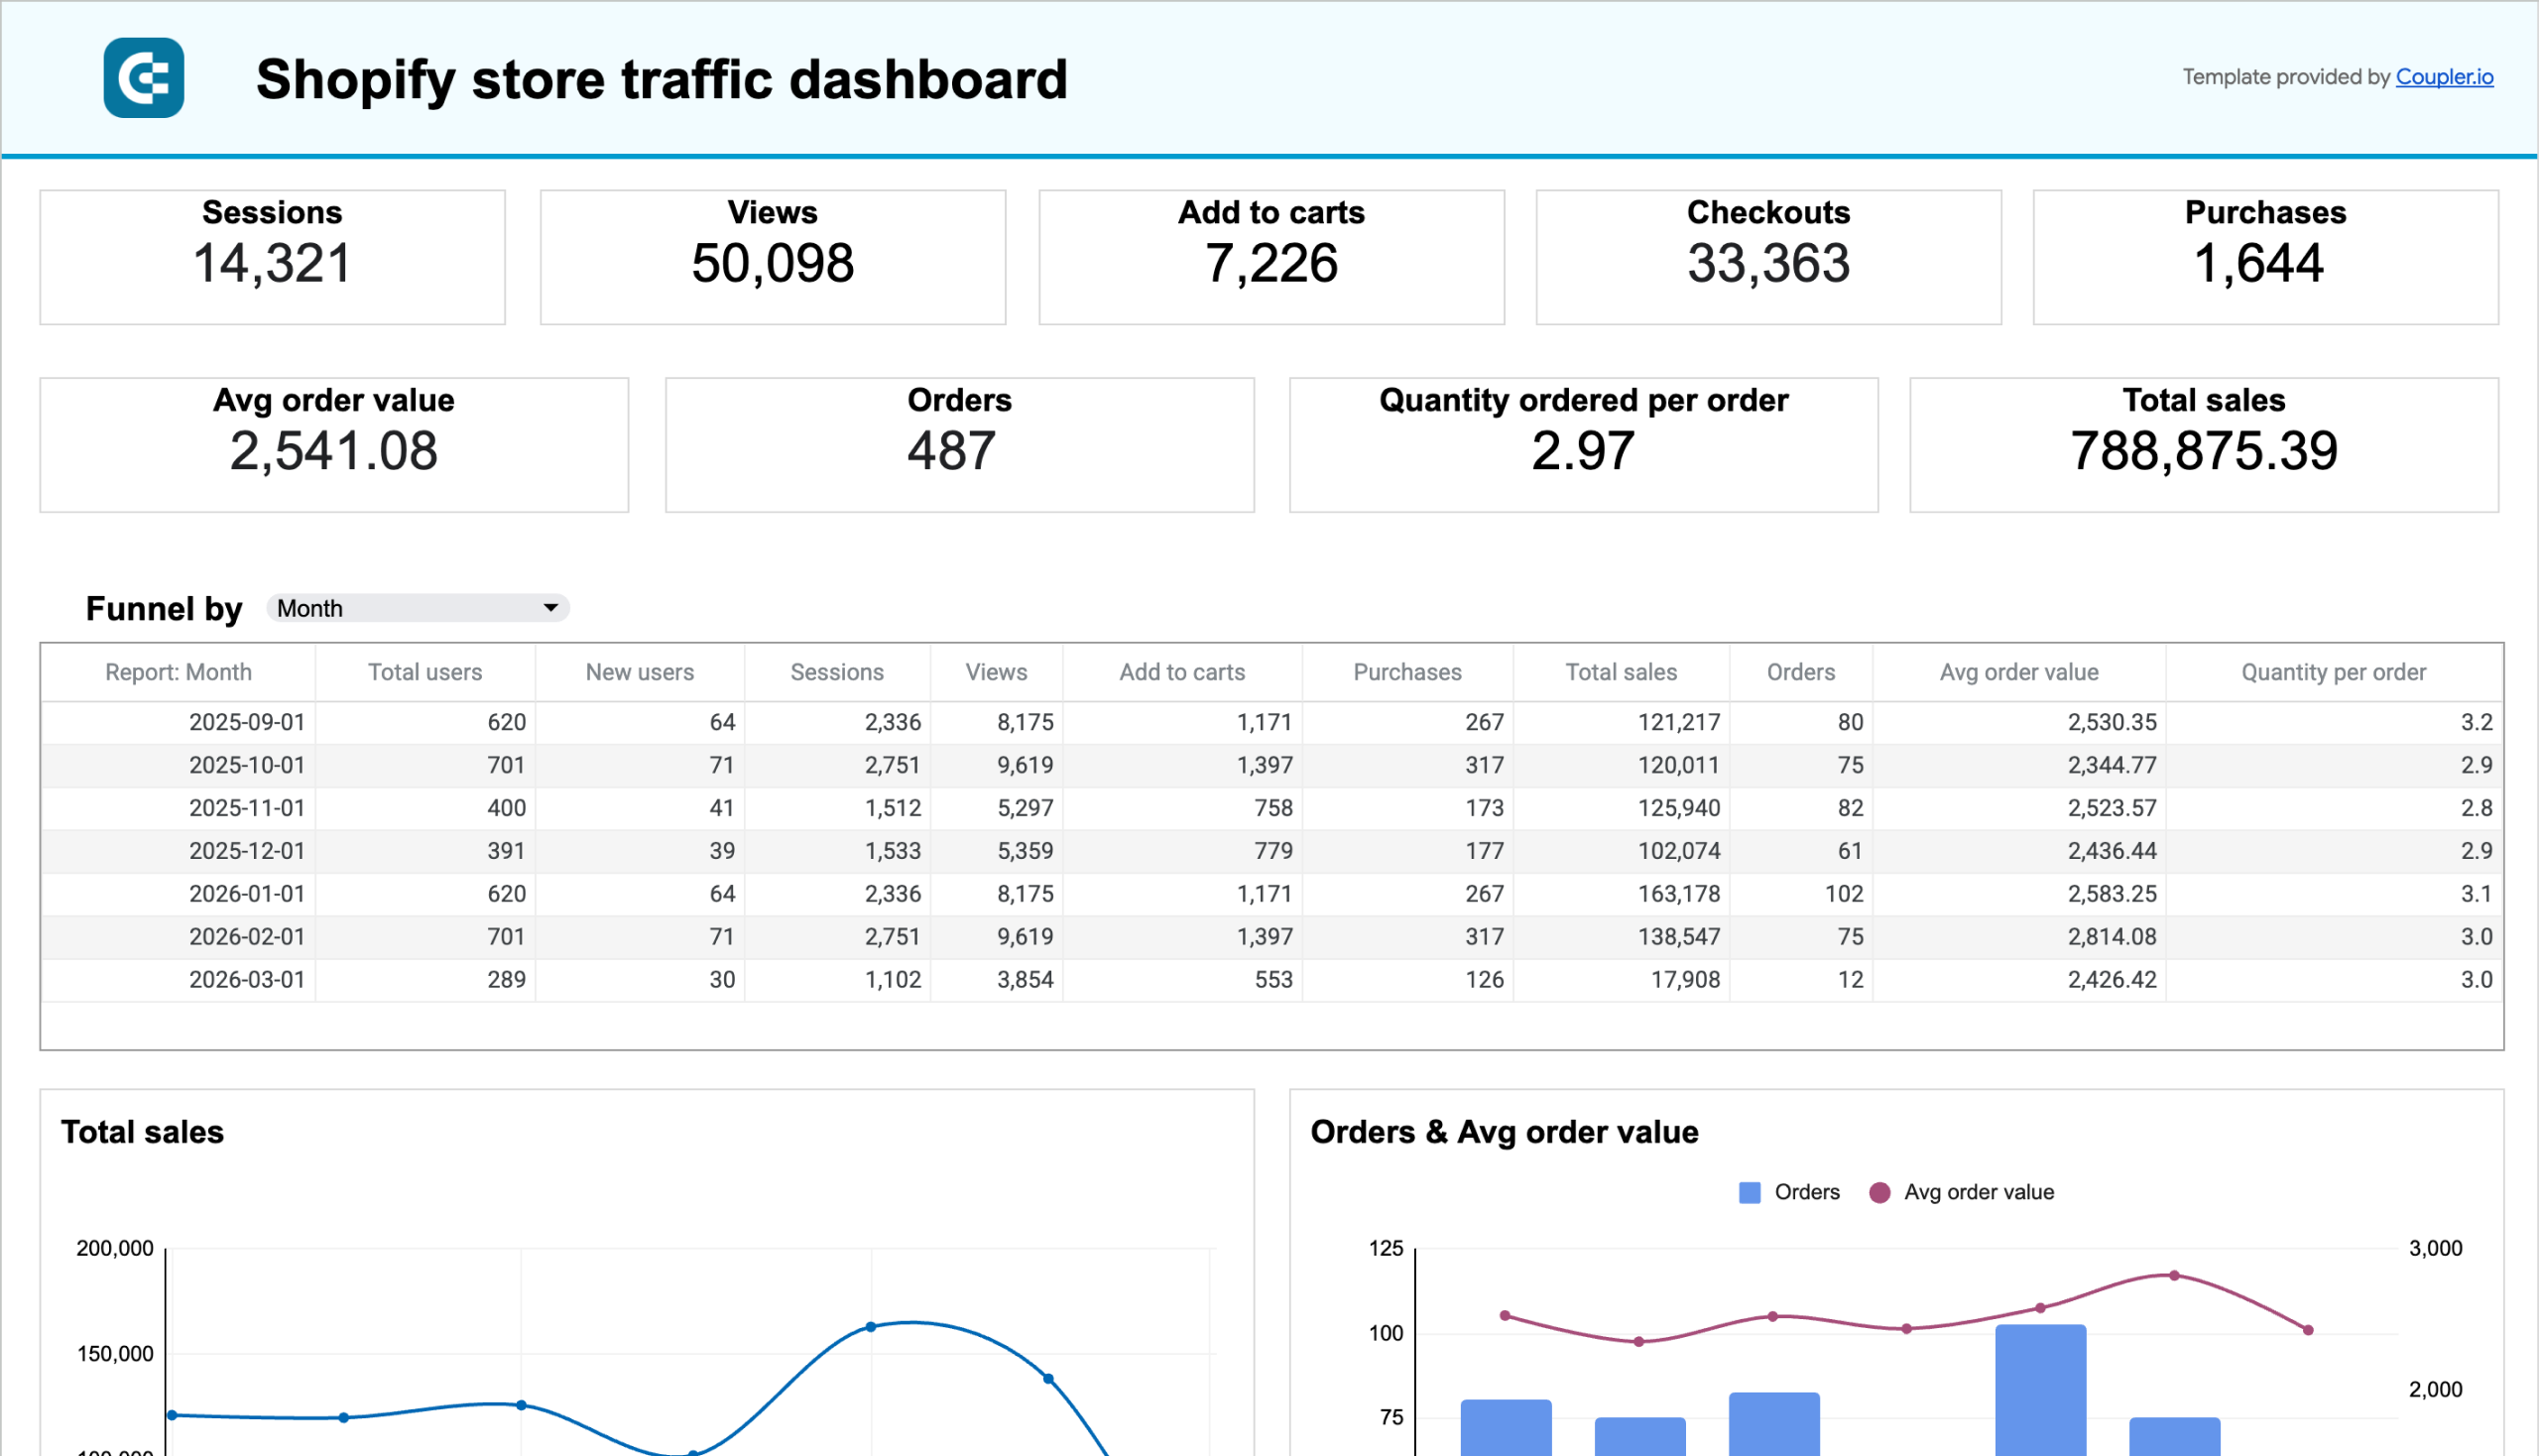
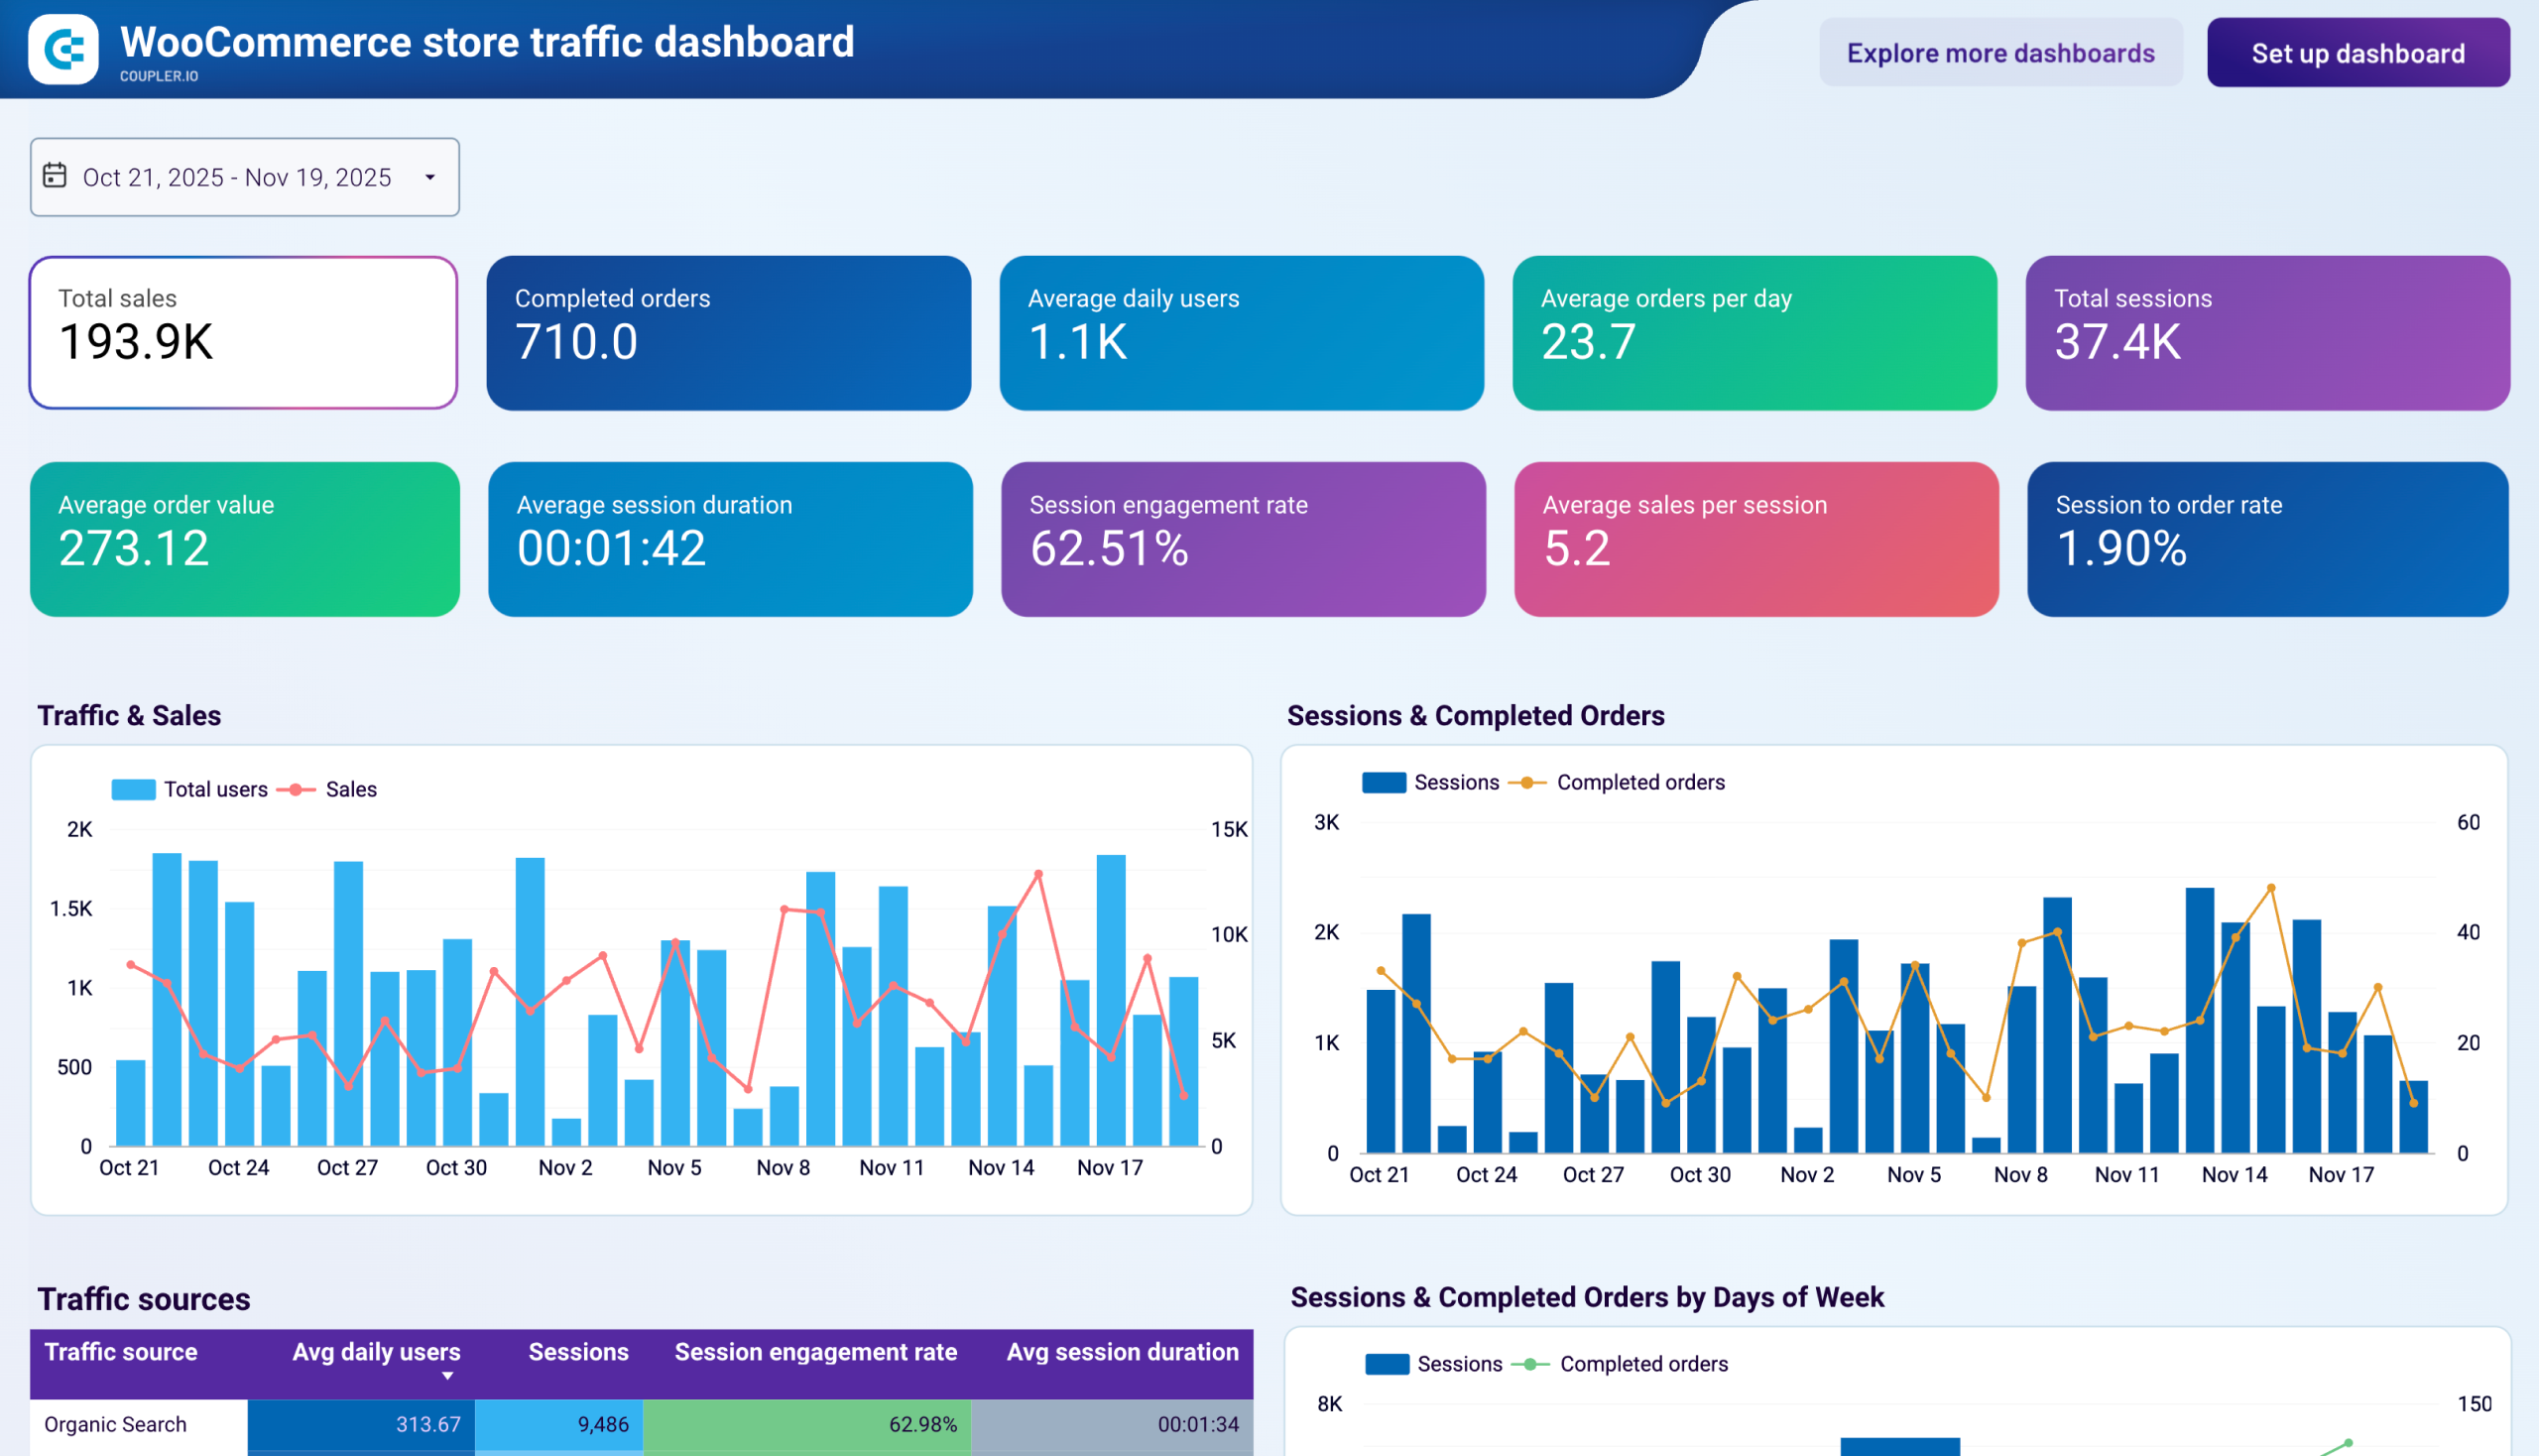
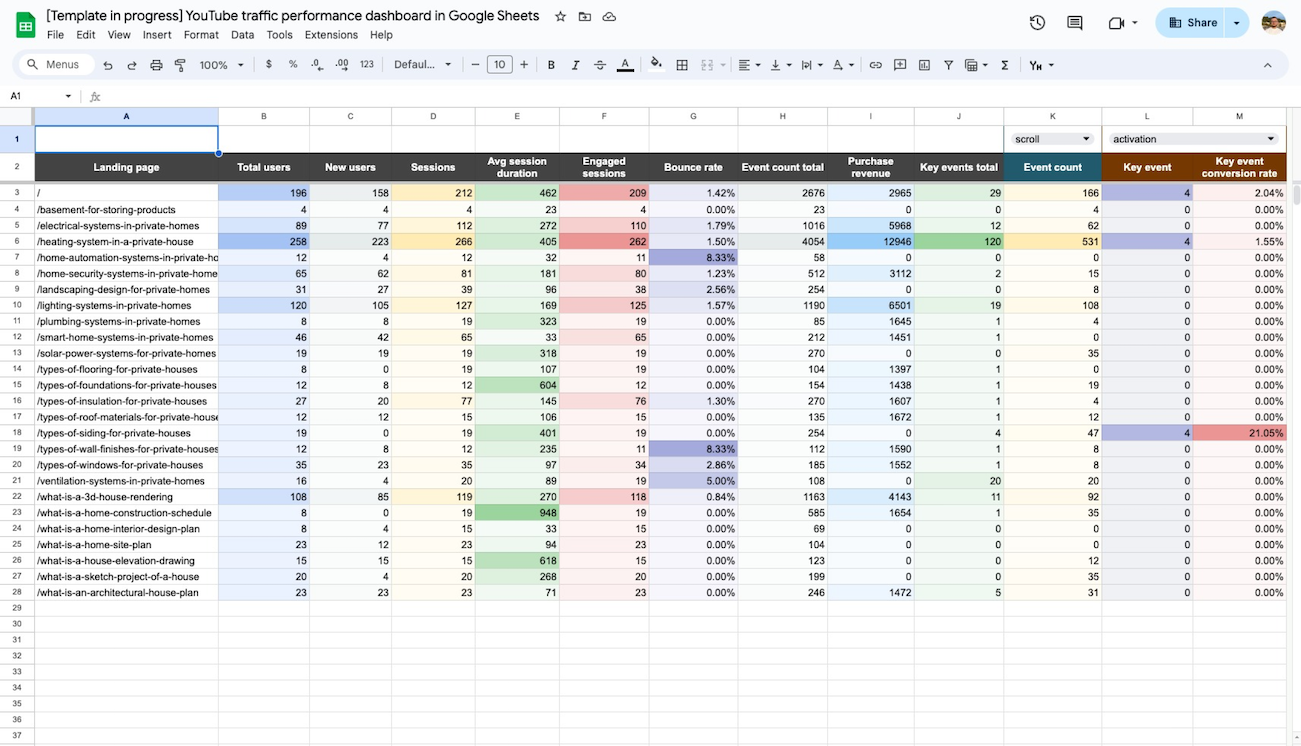
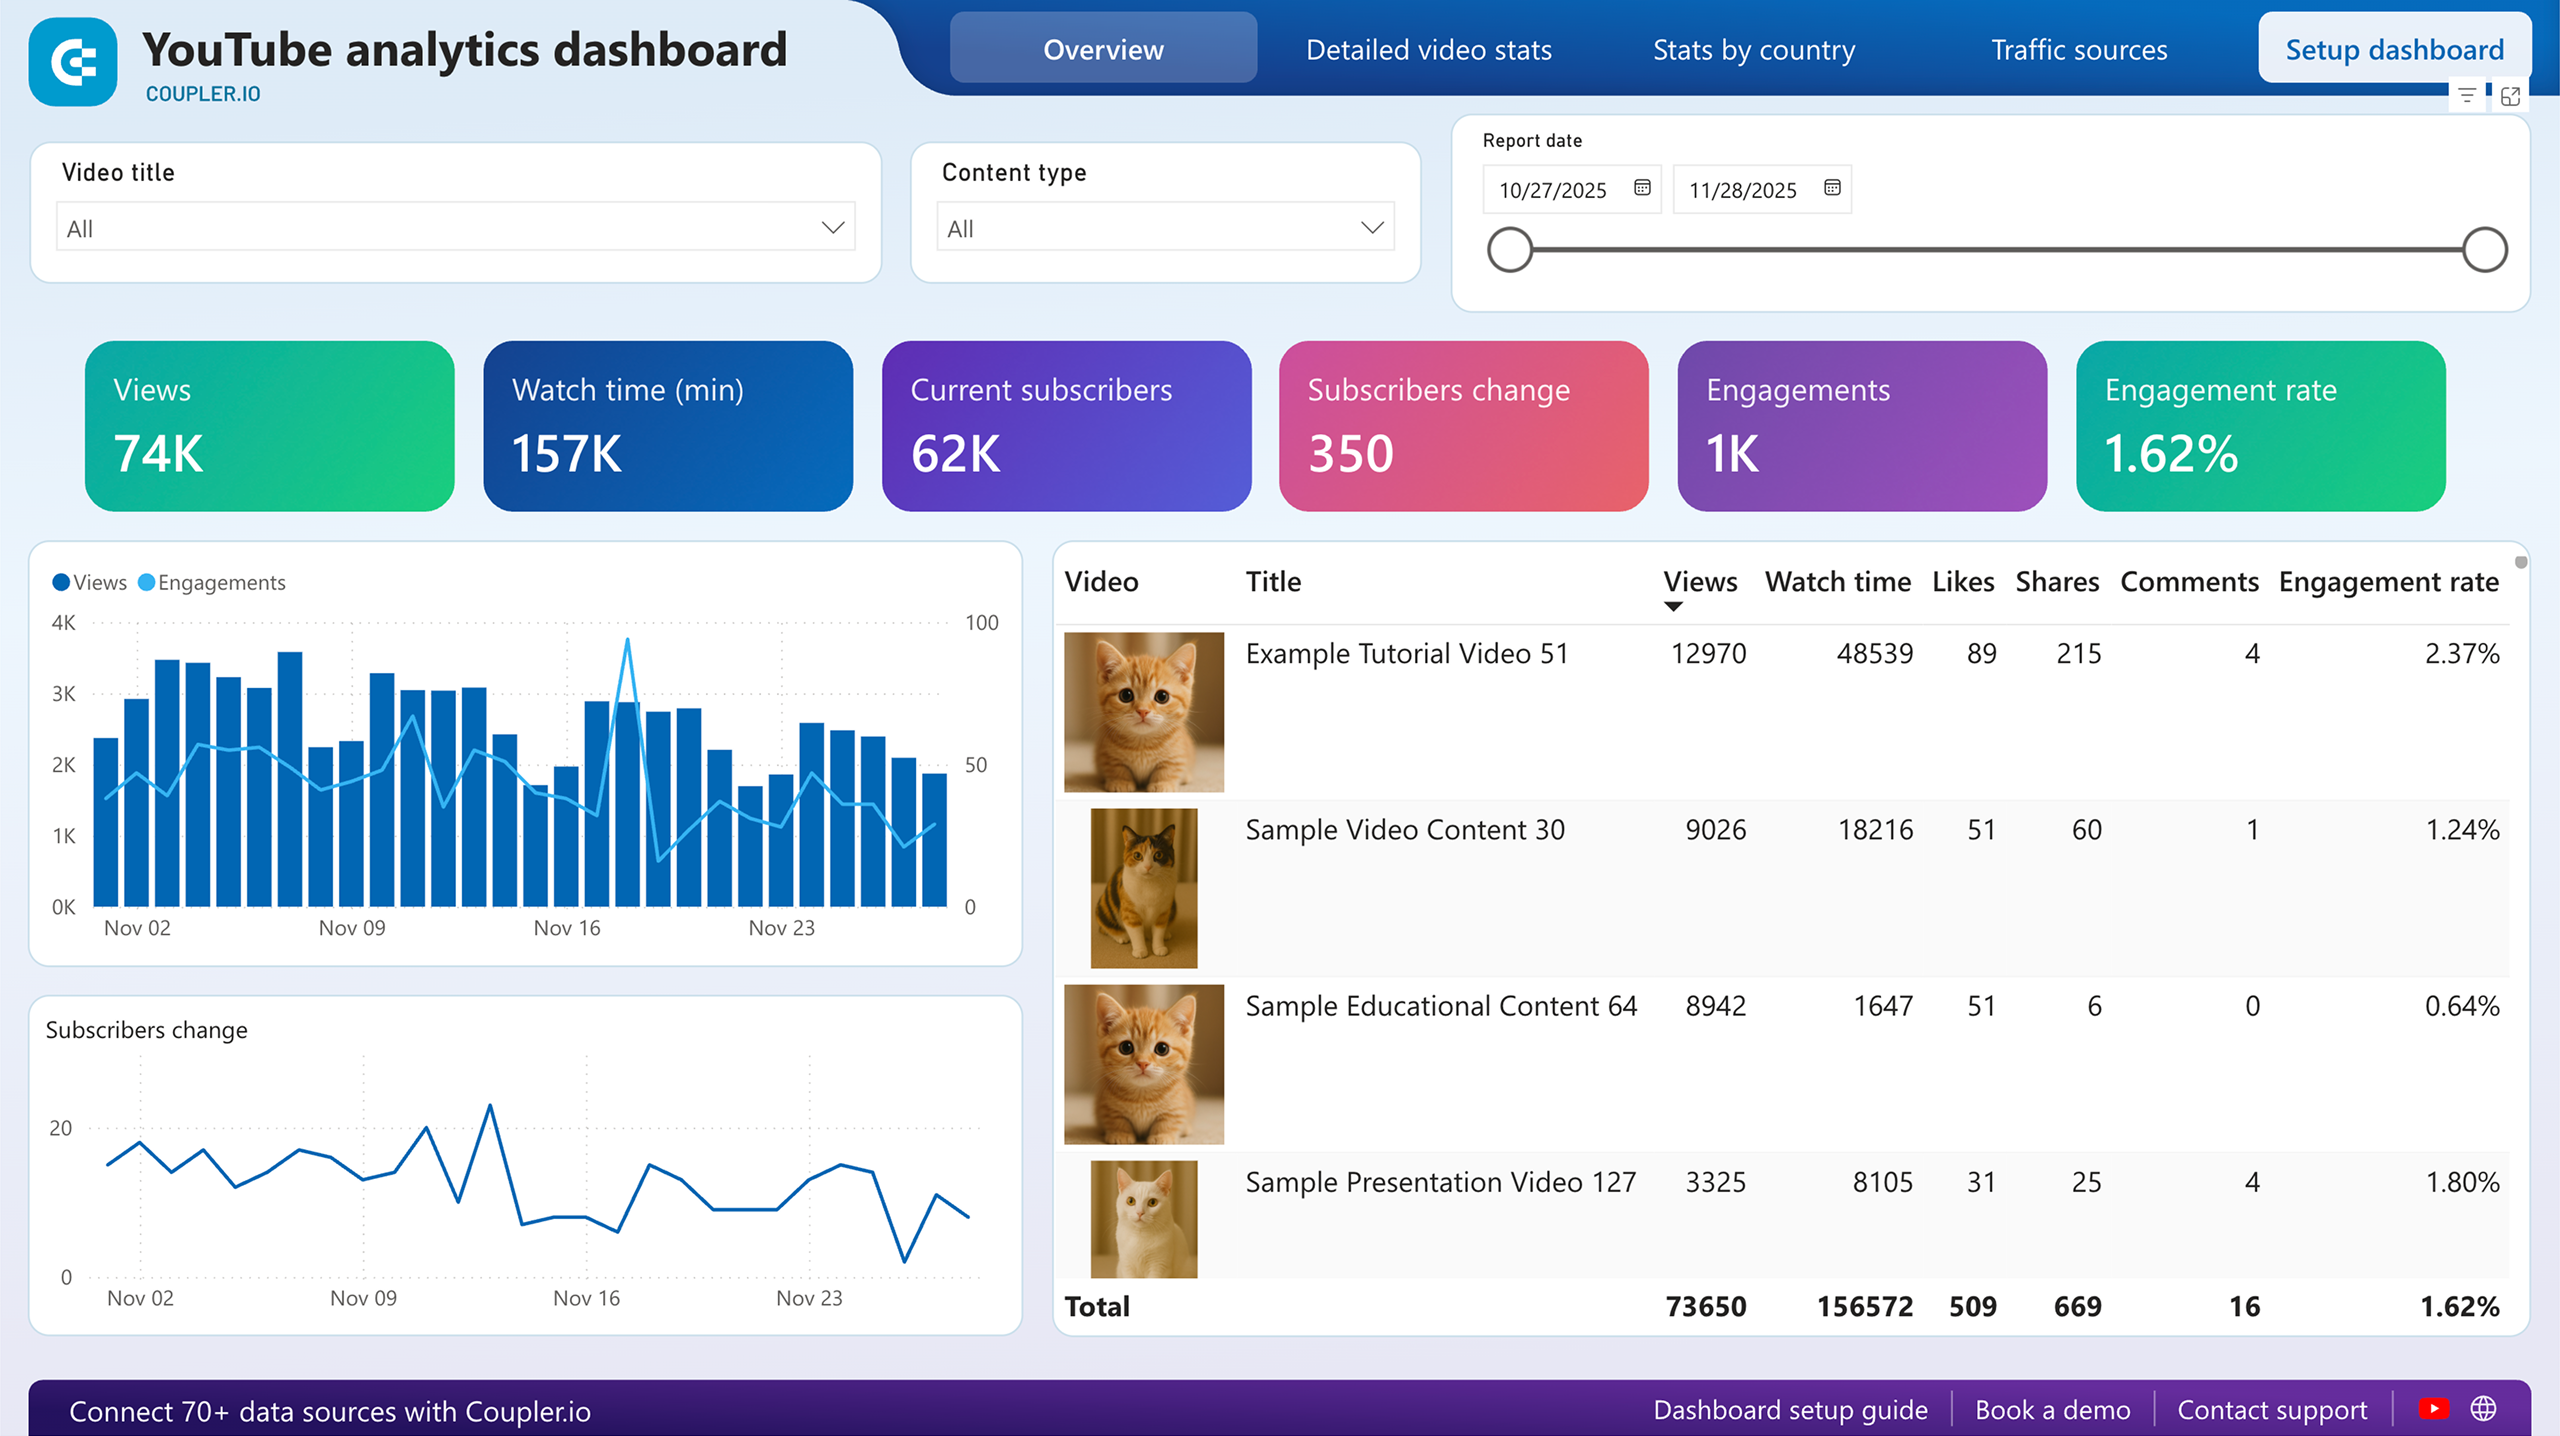
Web Analytics dashboards
Derive insights into traffic, user behavior, and conversions of your websites. Use the web analytics dashboards to overview page performance, analyze user flows, and track key events. Power your decisions with data to optimize your website and achieve your digital marketing goals.
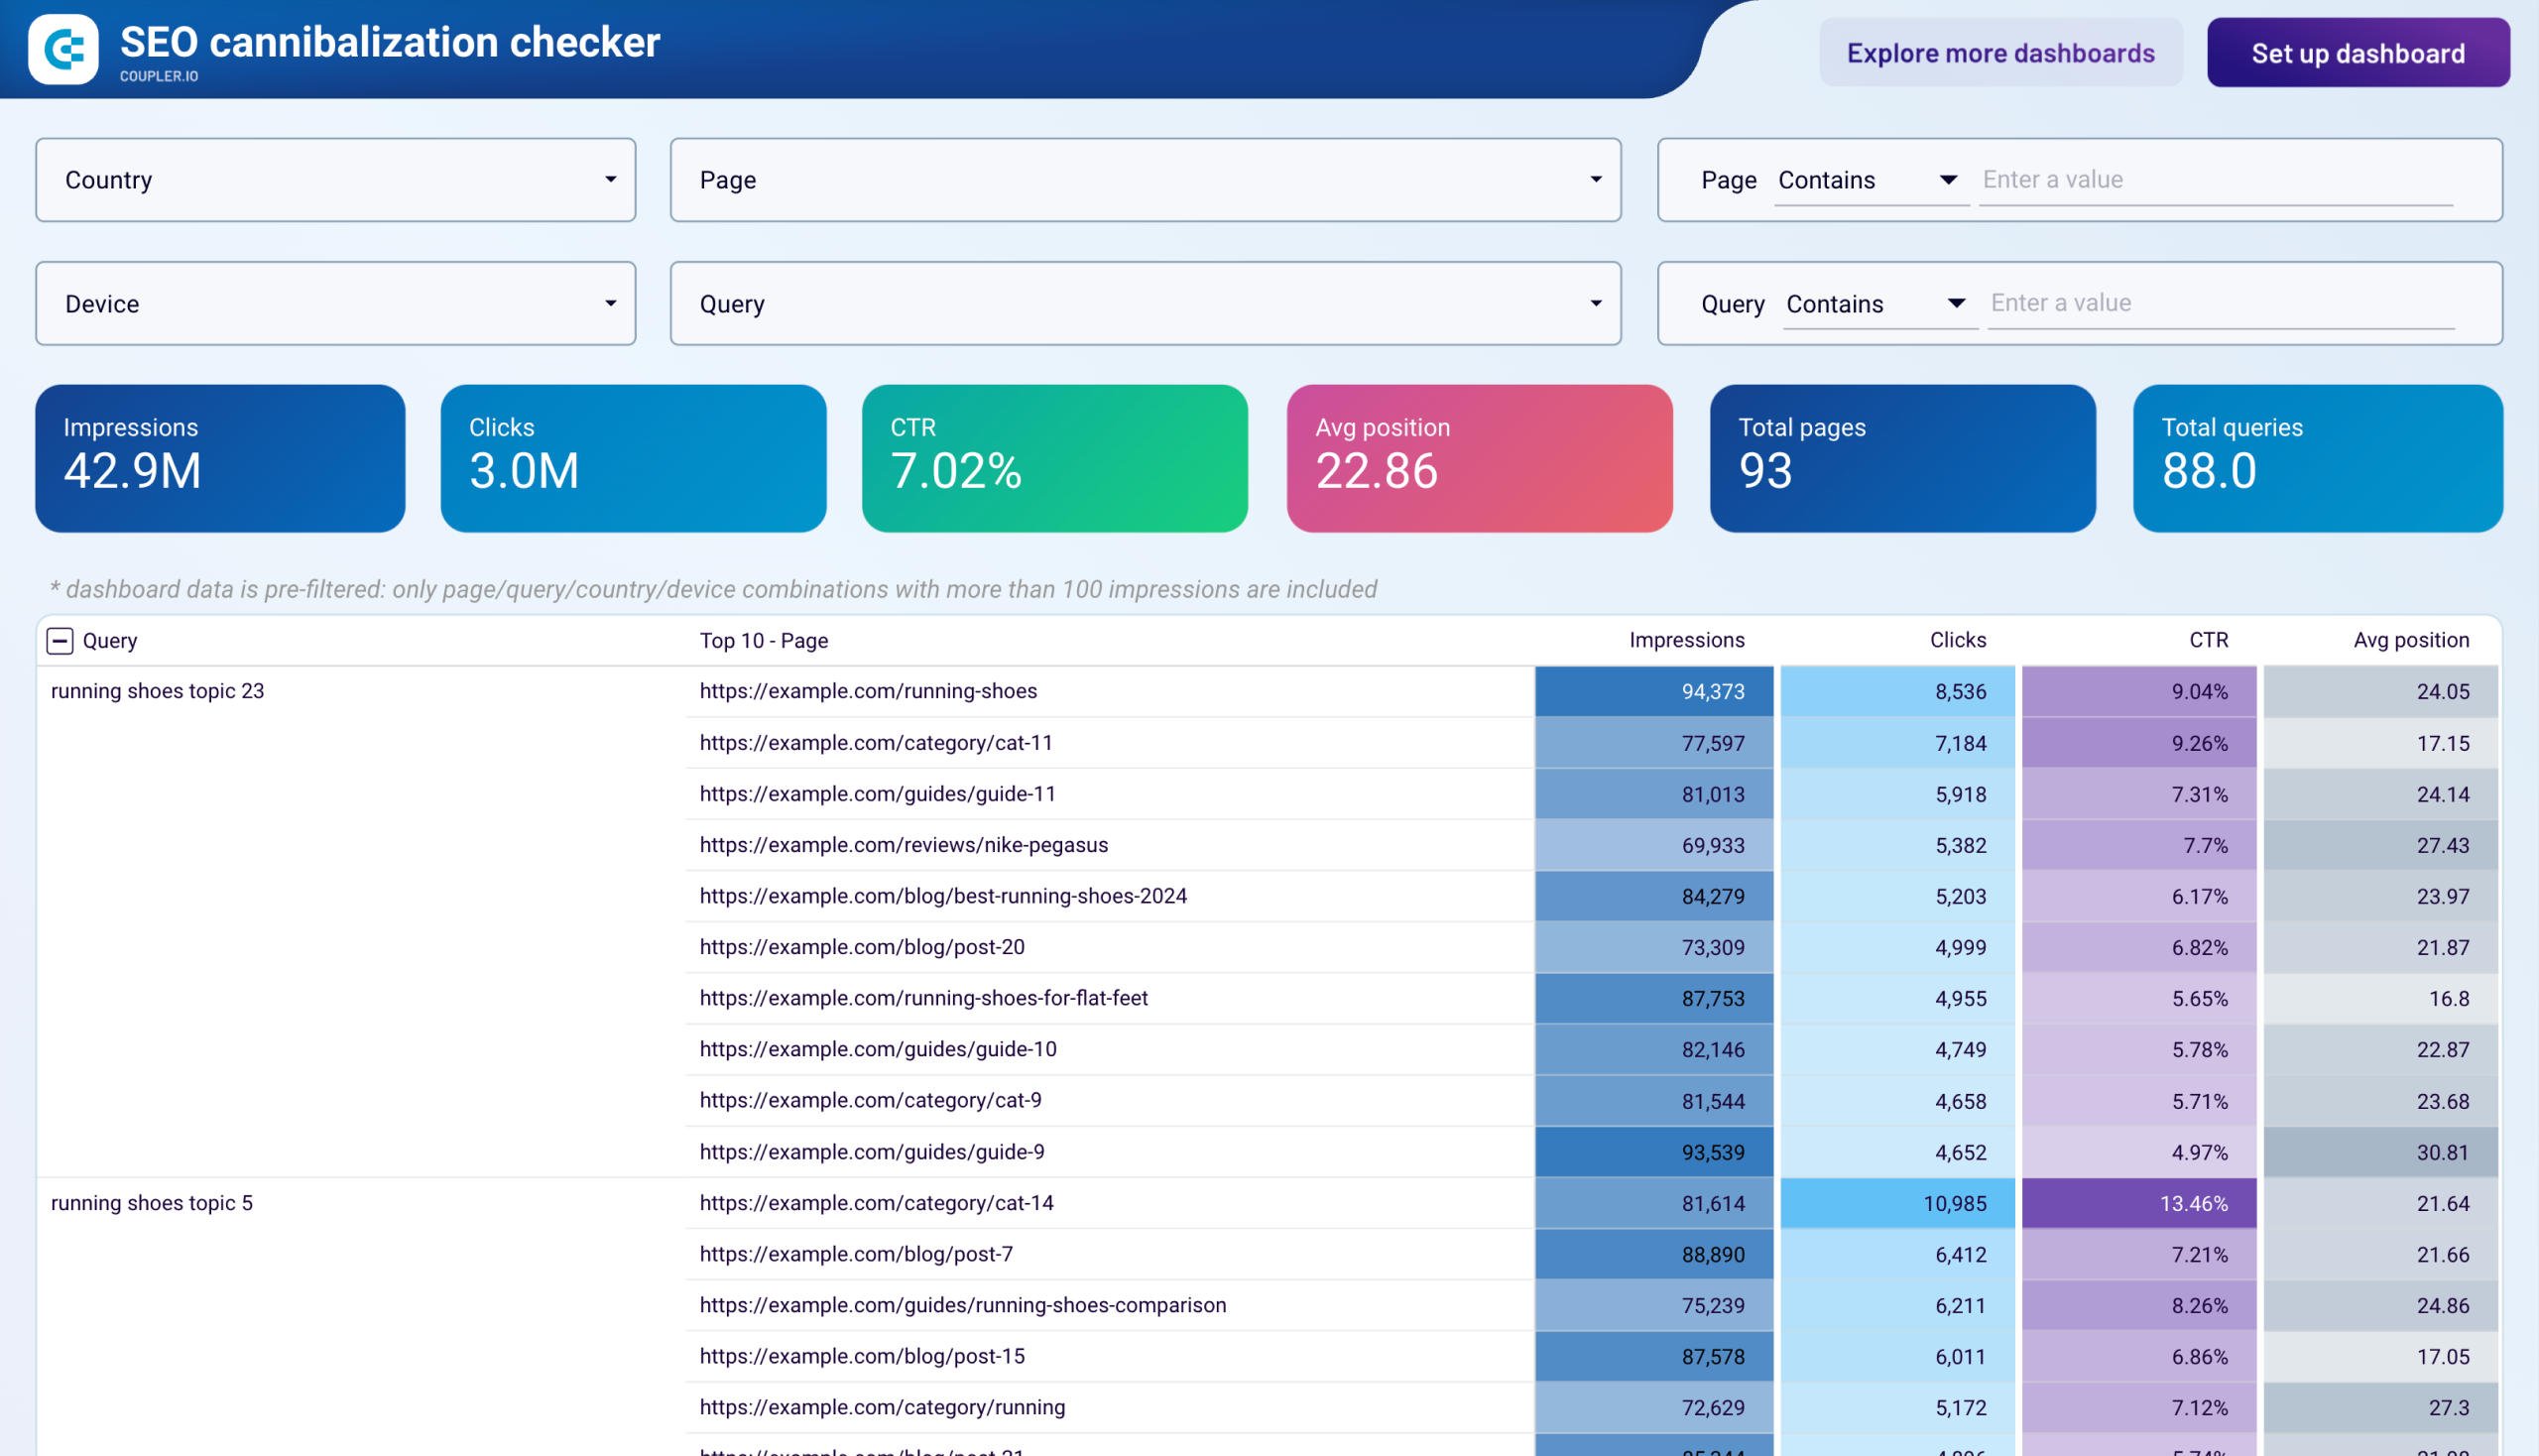
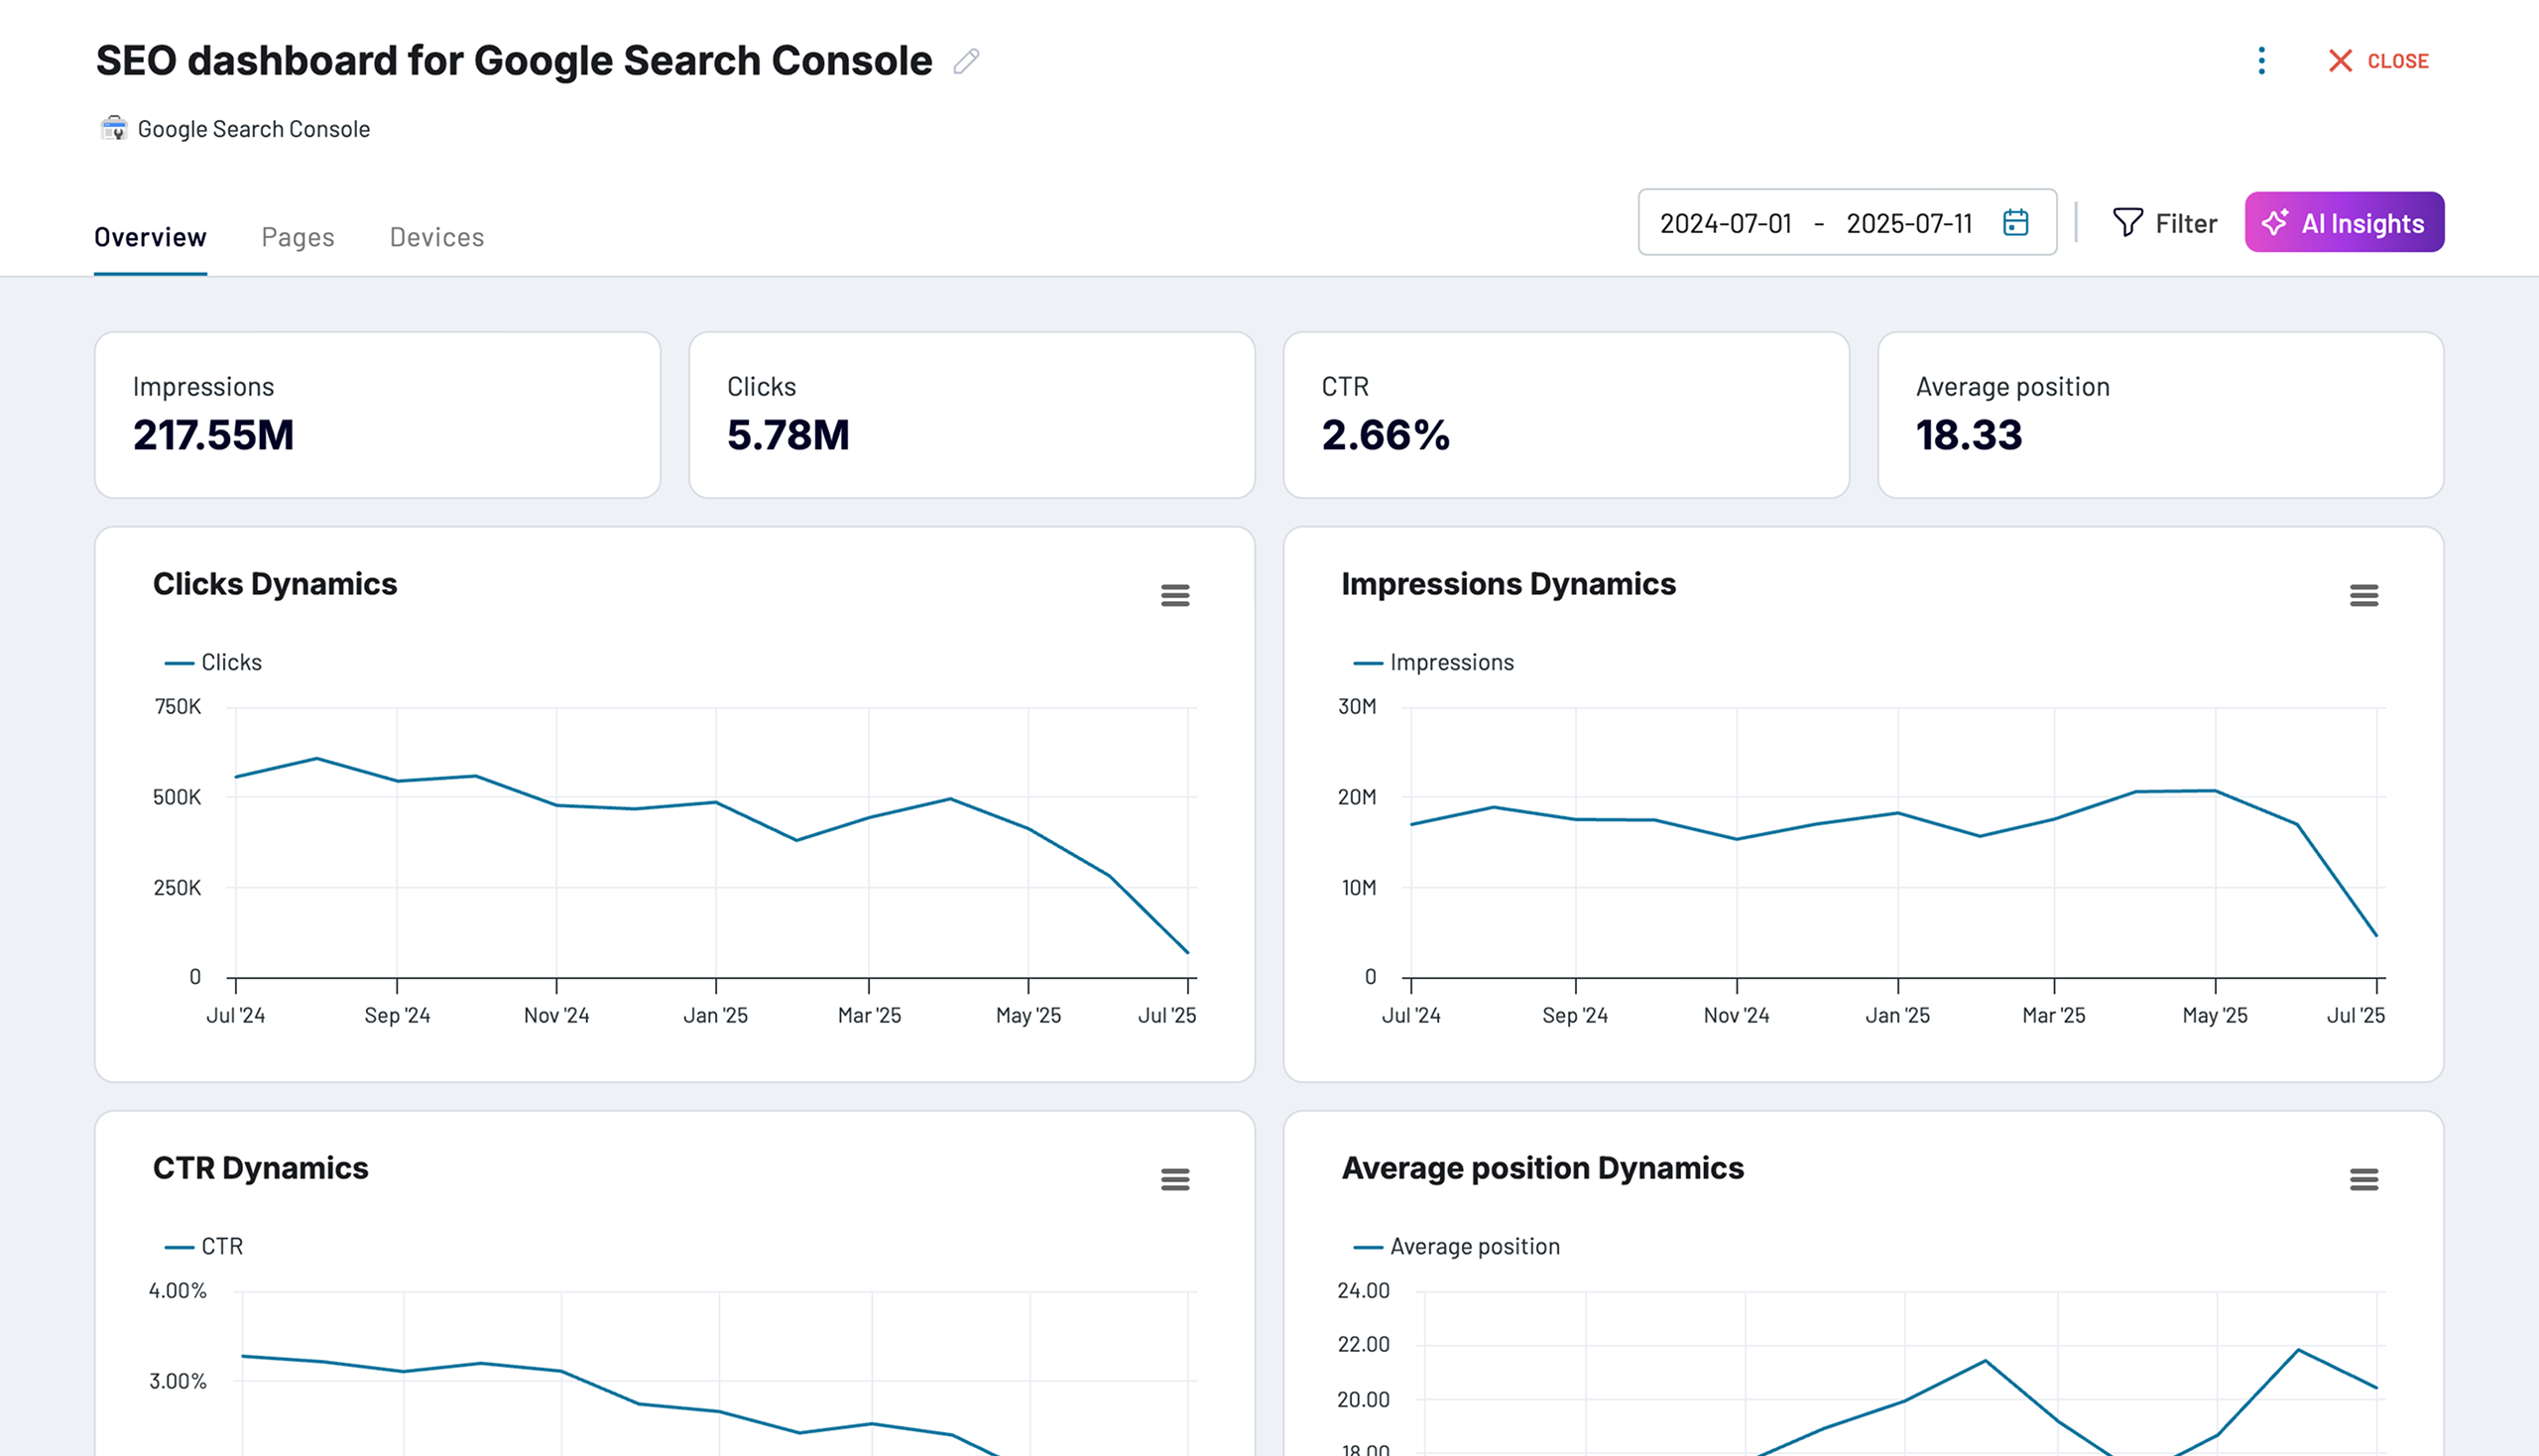
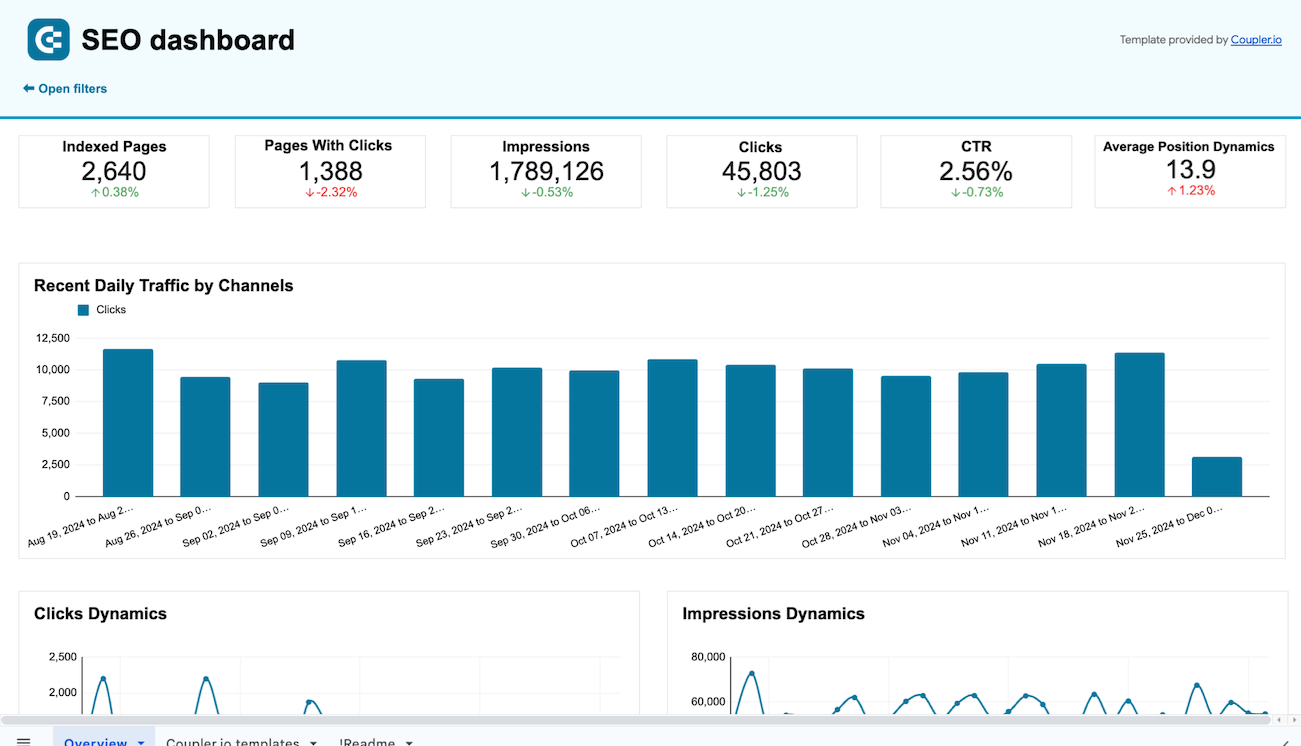
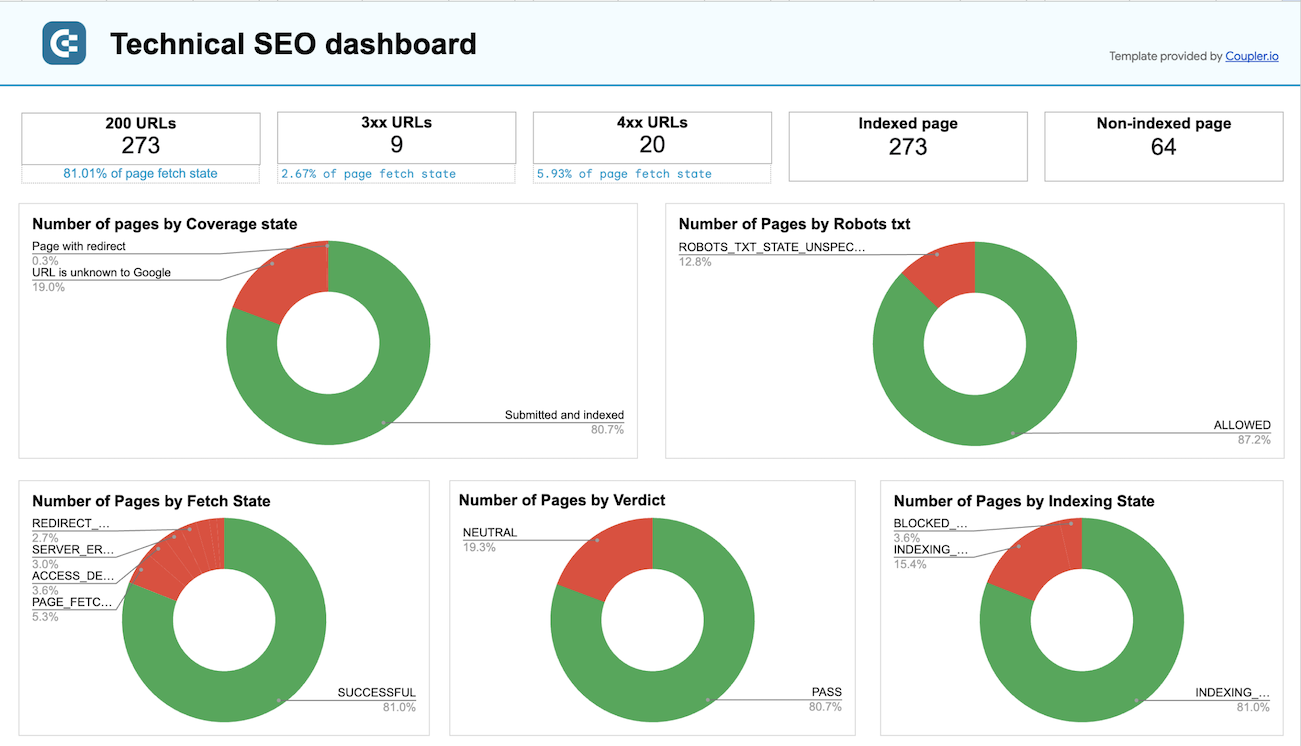
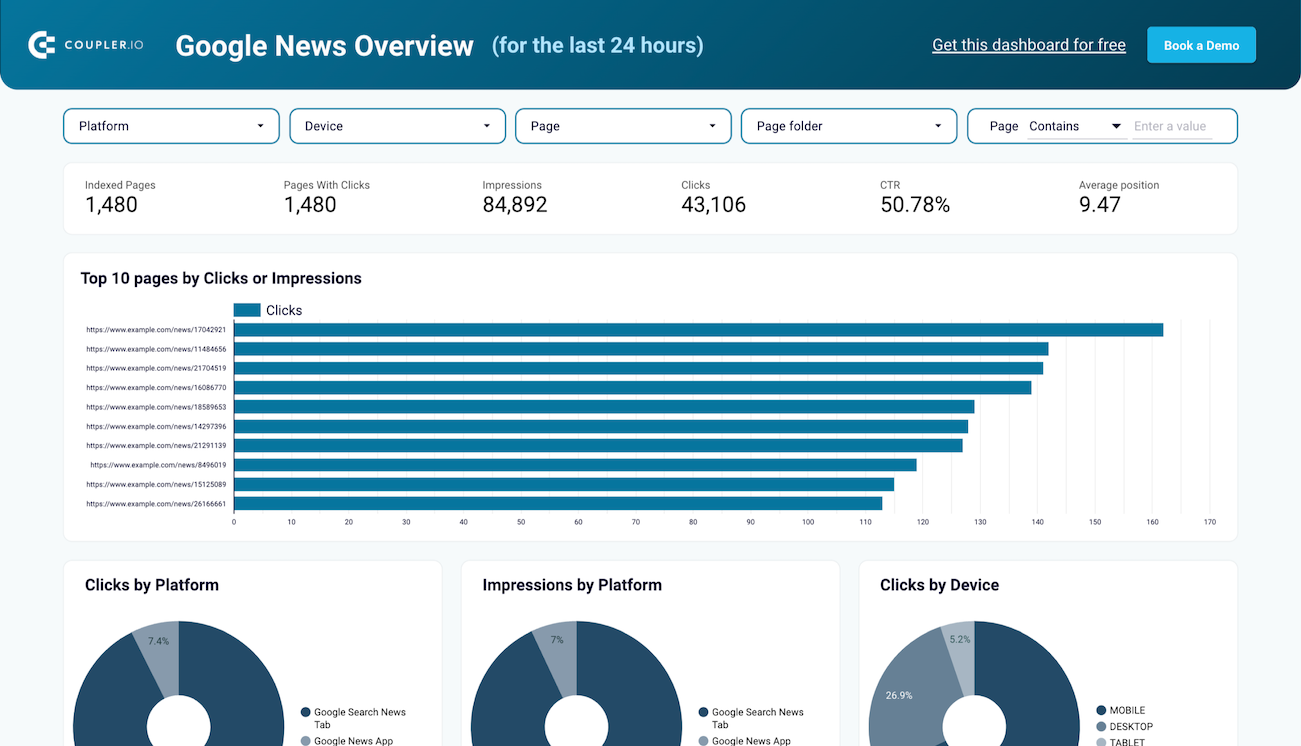
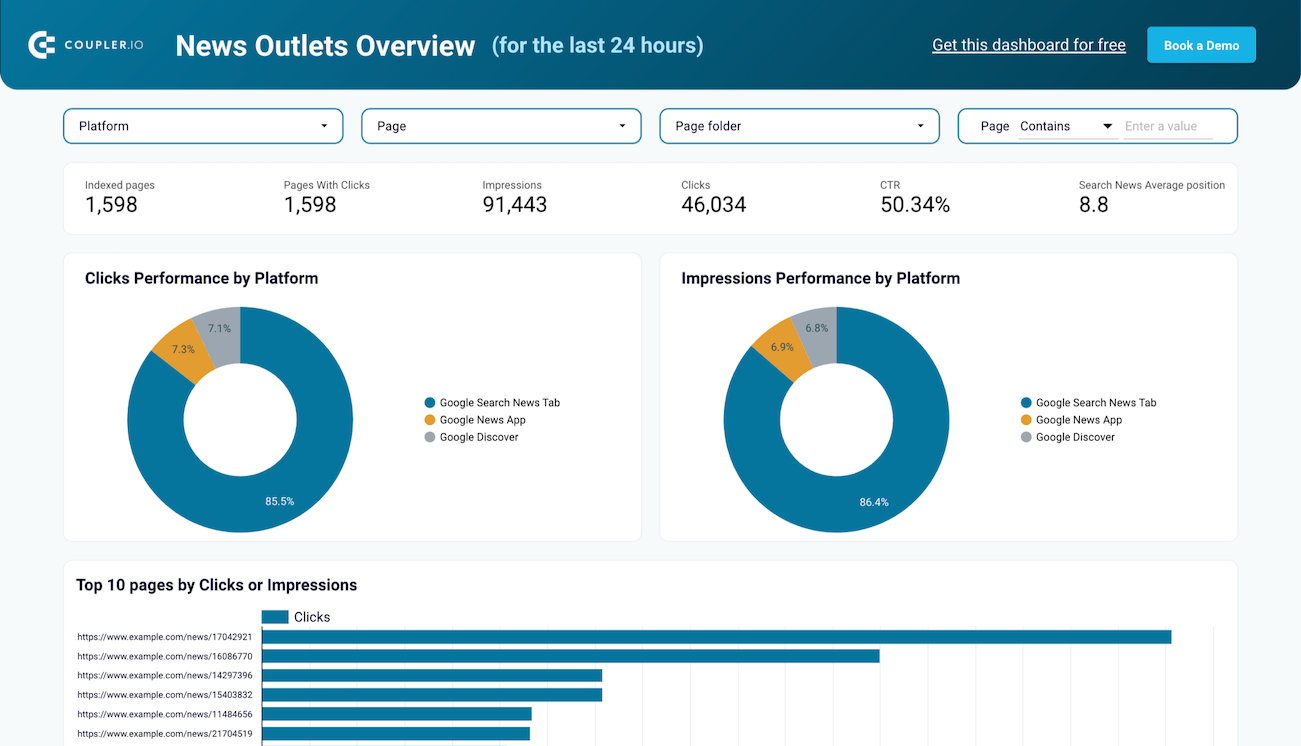
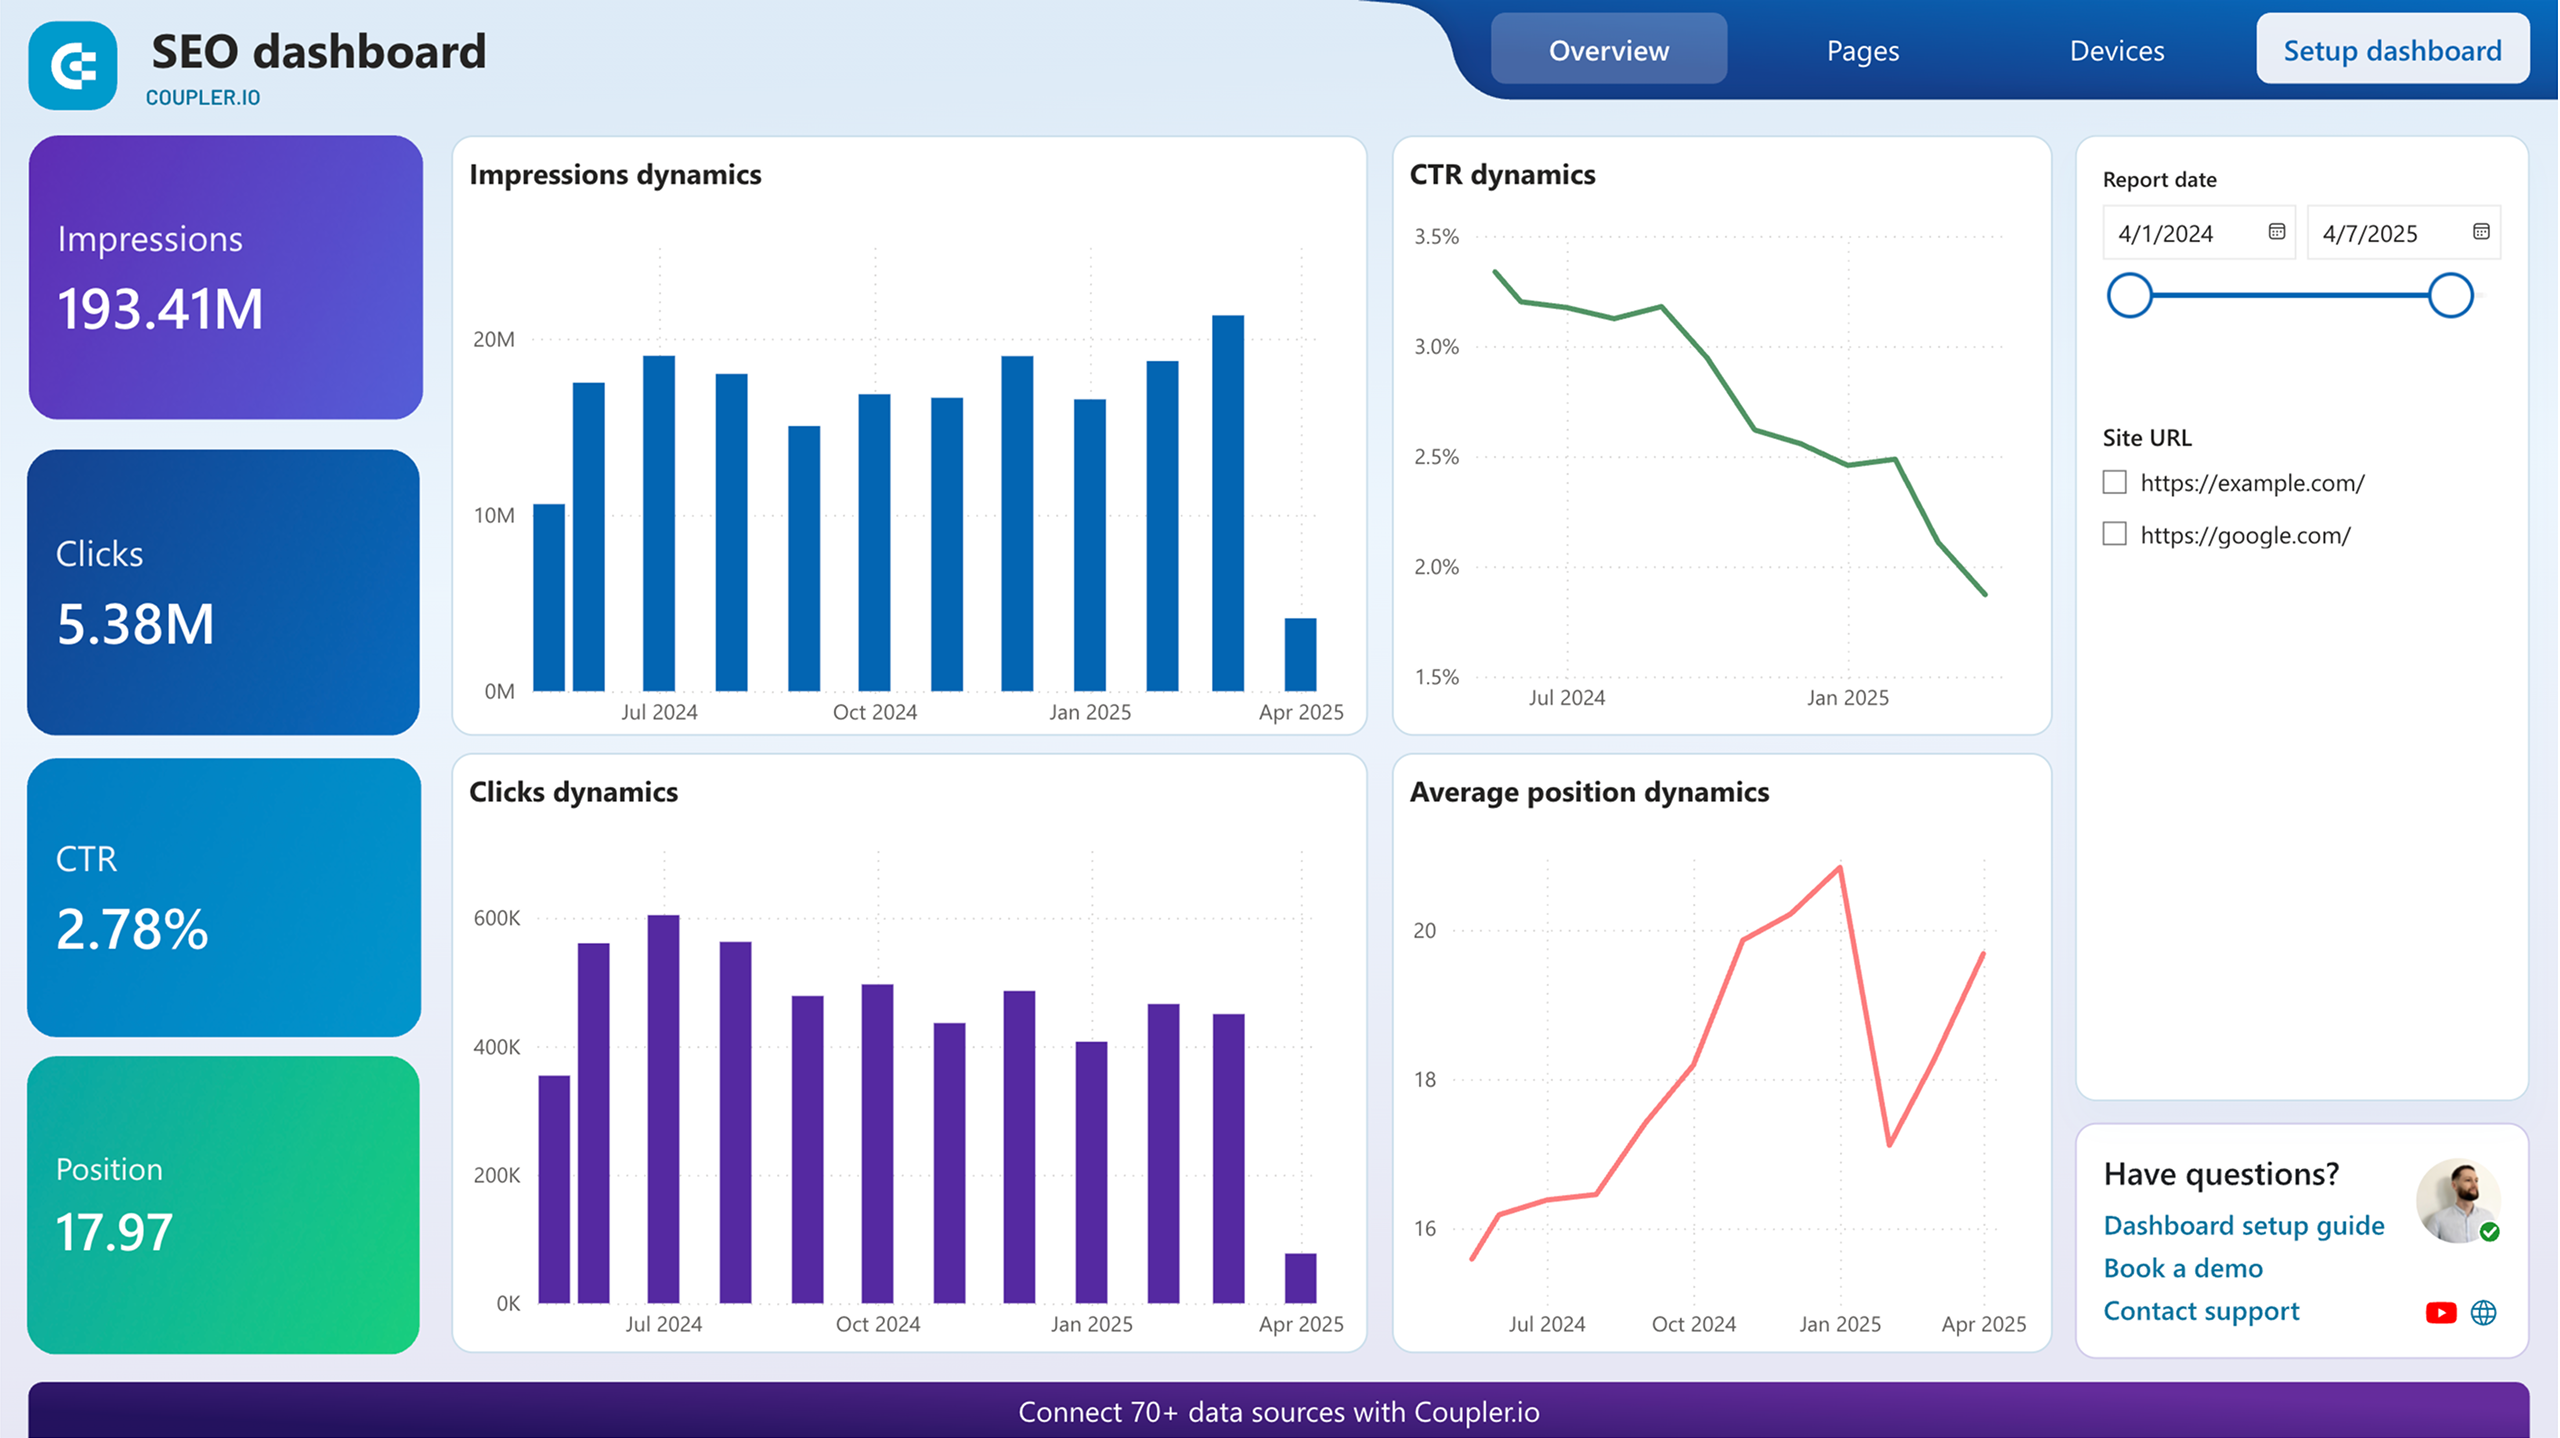
SEO dashboards
Track your organic search performance, monitor keyword rankings, and analyze technical SEO metrics. These marketing dashboard templates let you analyze search visibility and content performance. Use these insights to optimize your website's search engine rankings effectively.
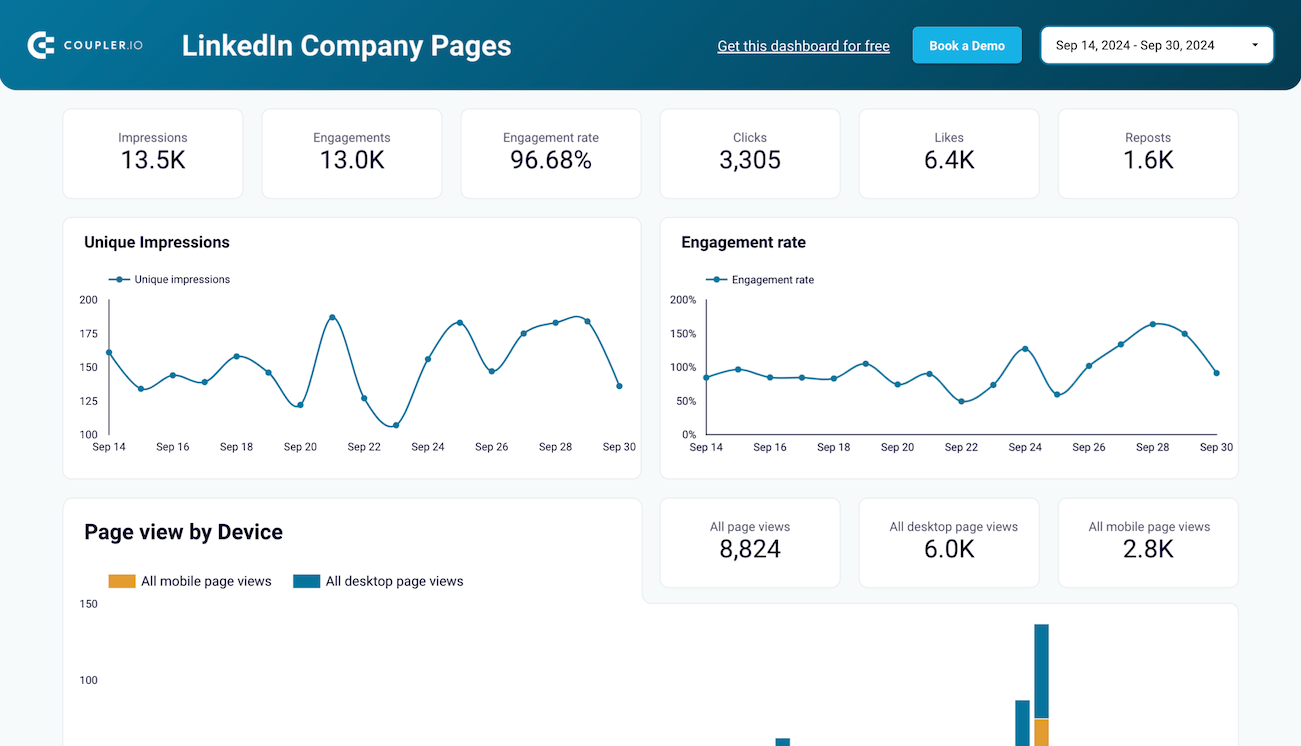
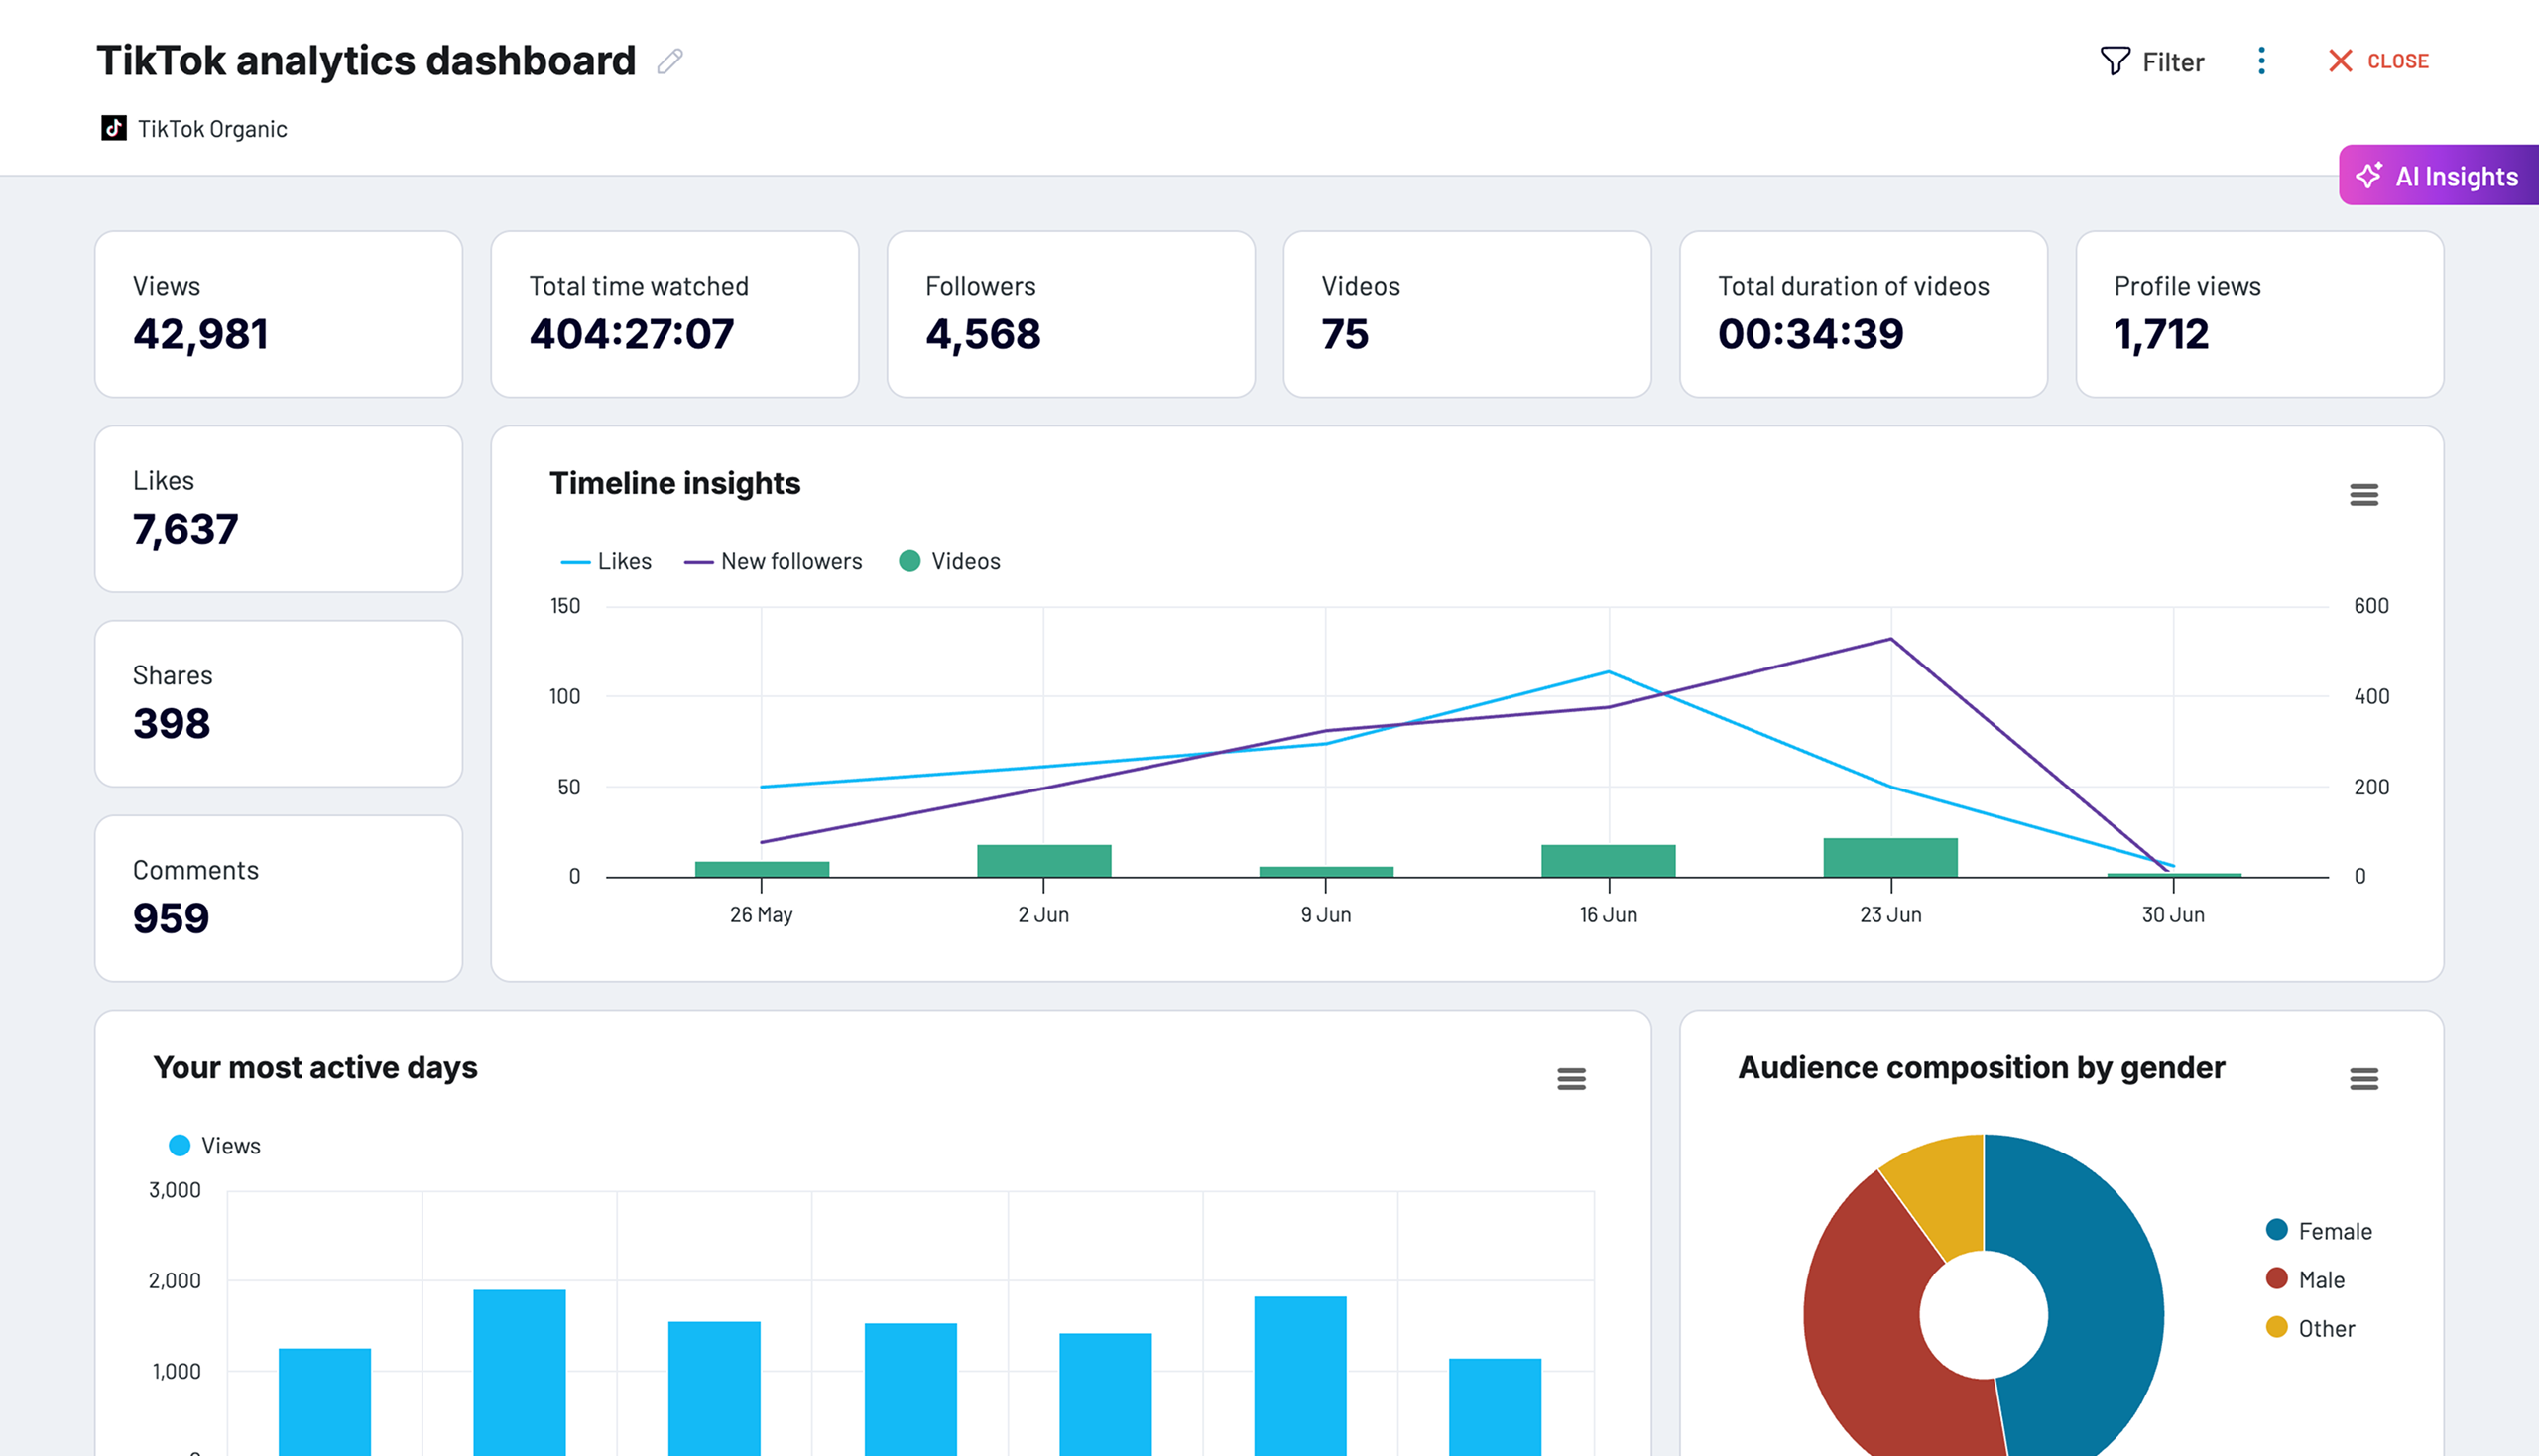
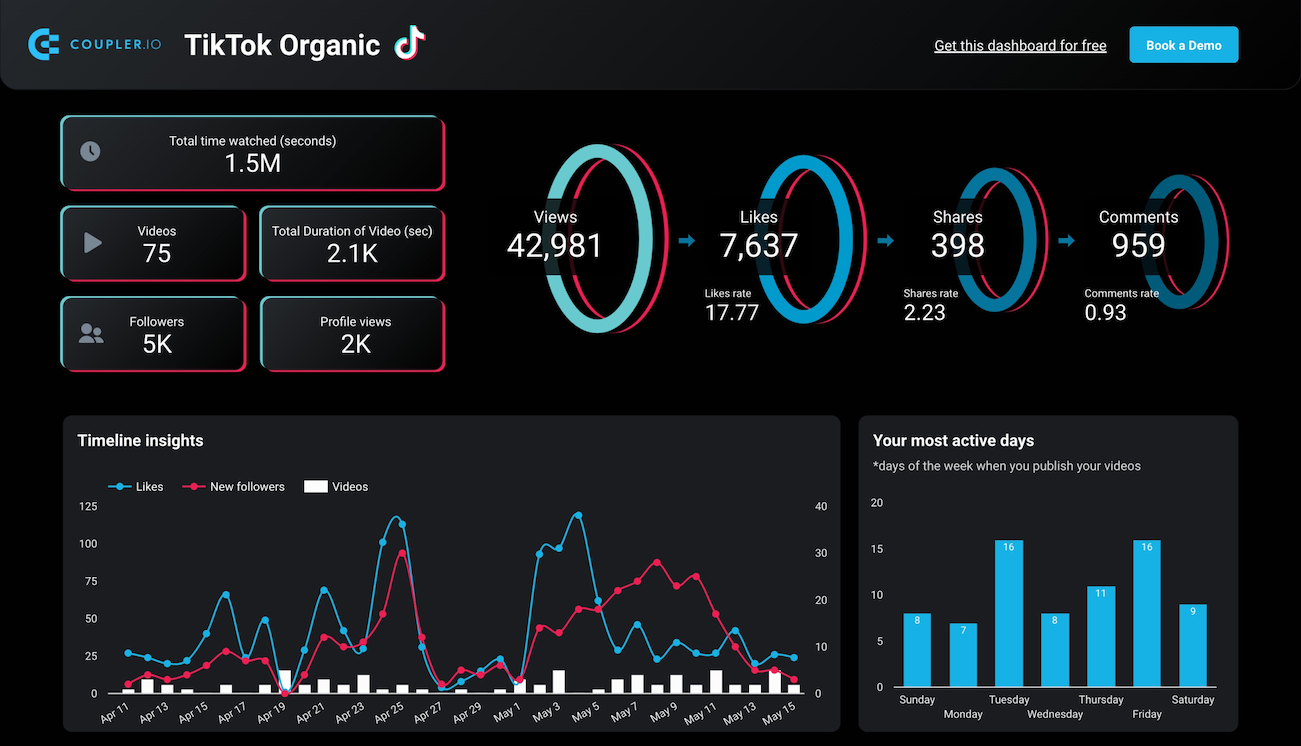
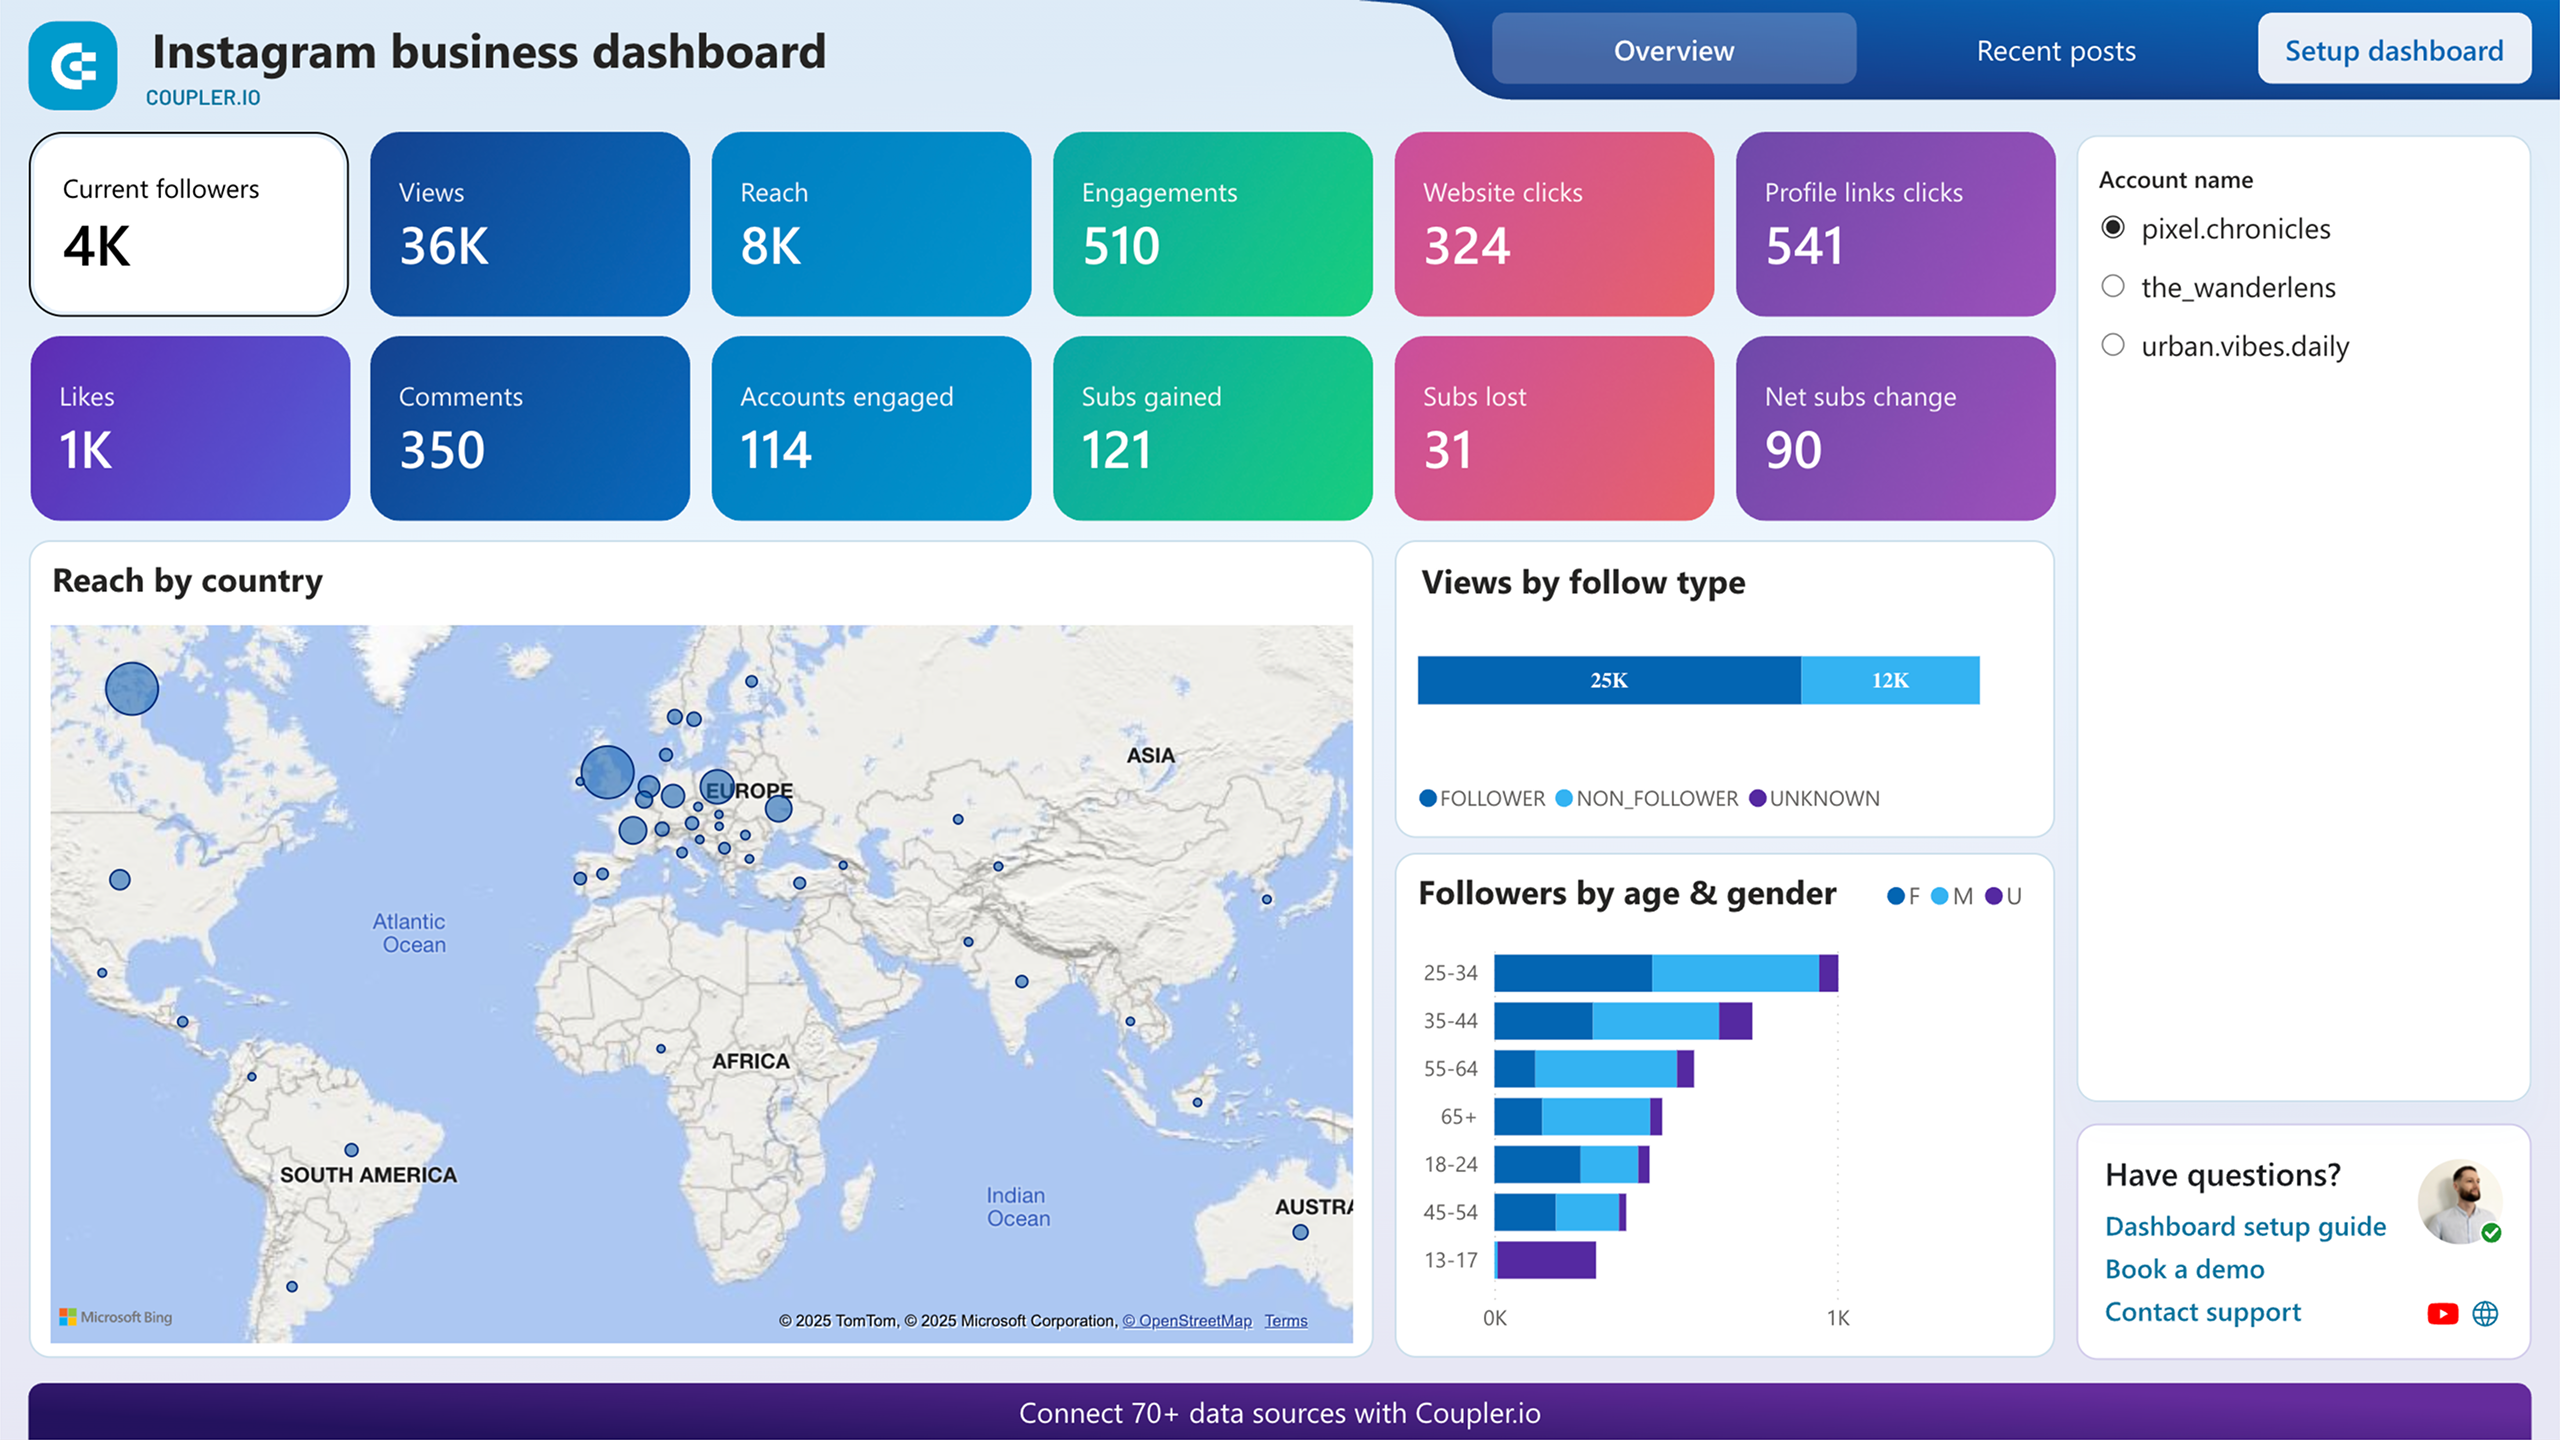
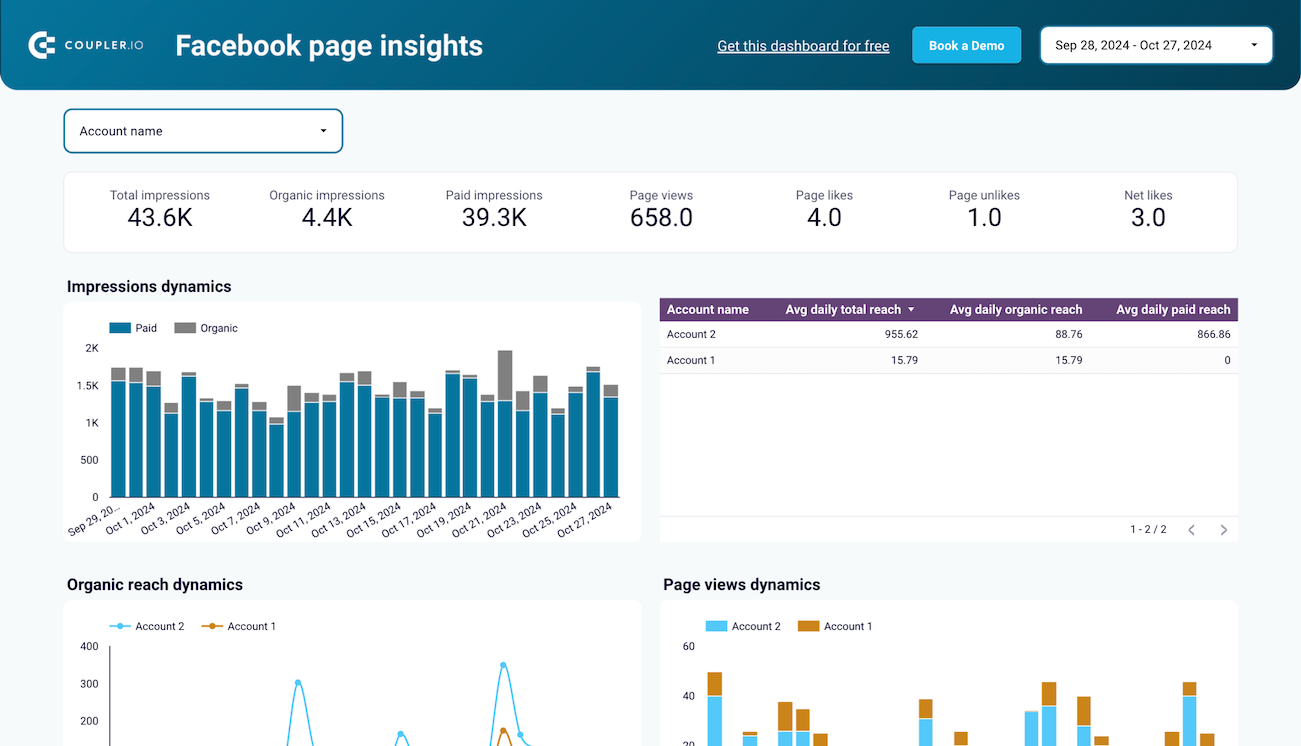
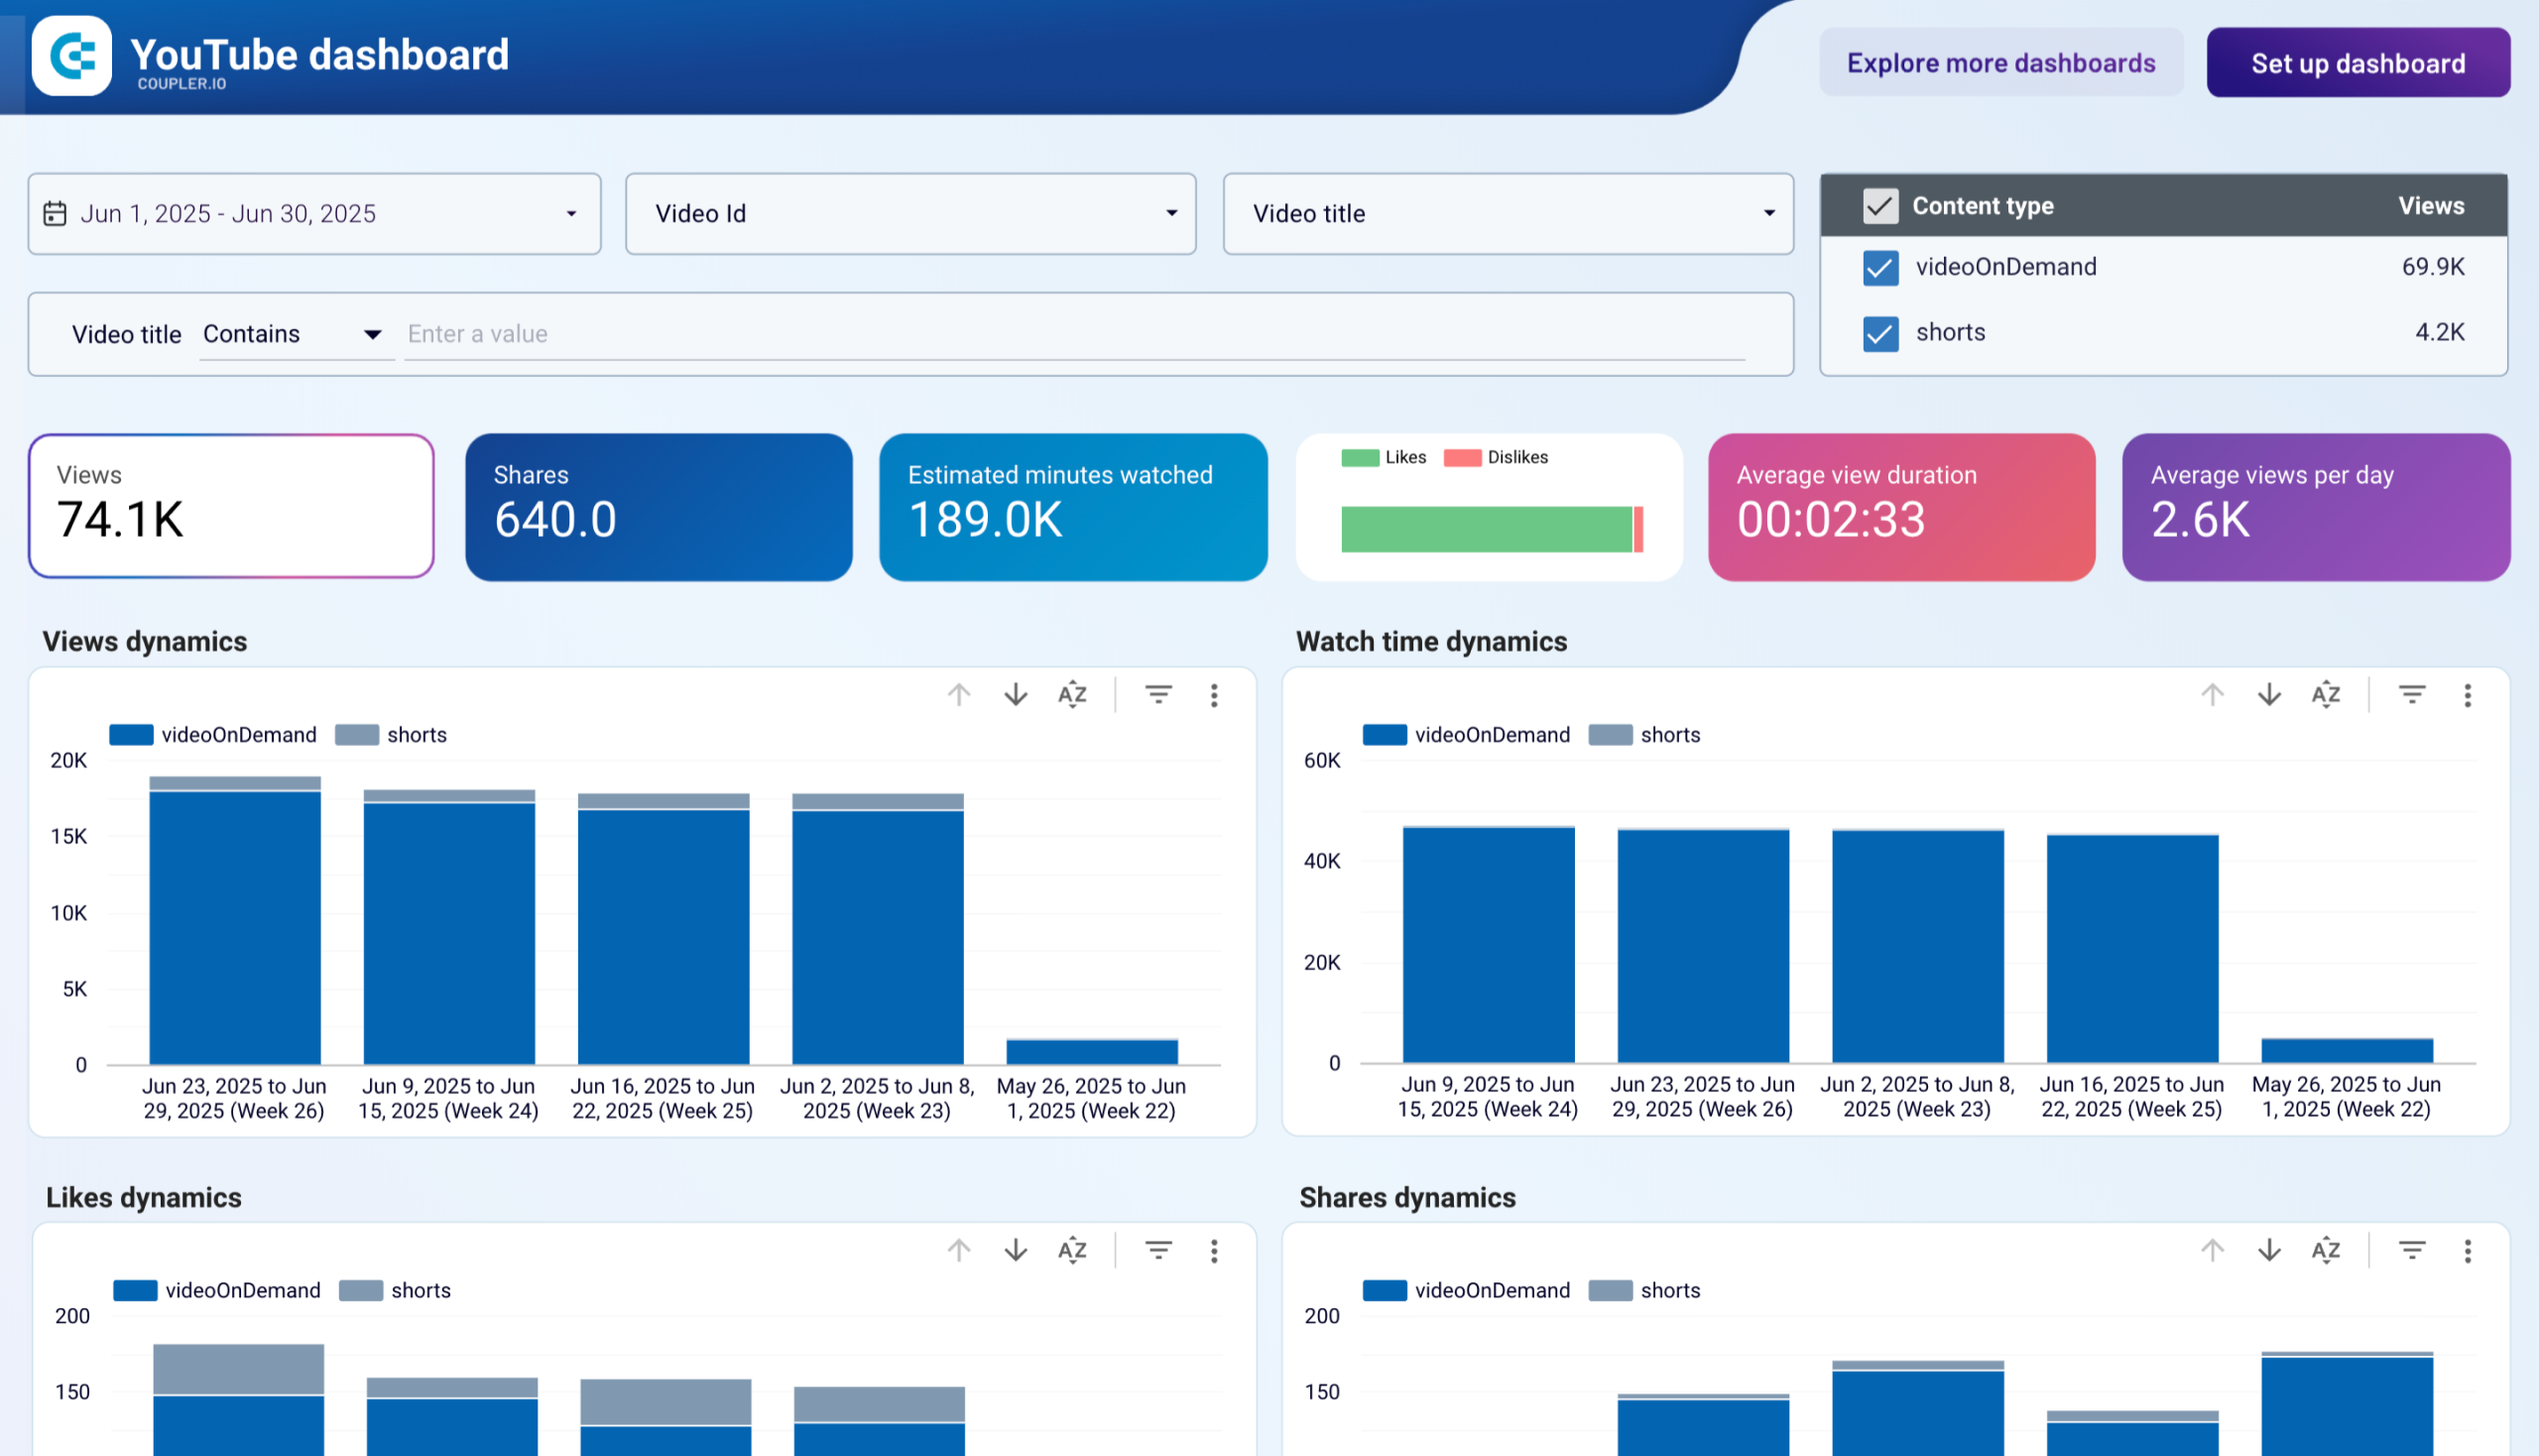
Social Media dashboards
Monitor engagement of your posts, growth of followers, and content performance across your social platforms. Use the marketing dashboards to measure audience interaction and optimize content strategy. Based on this data, you can ensure your social media efforts will be successful.
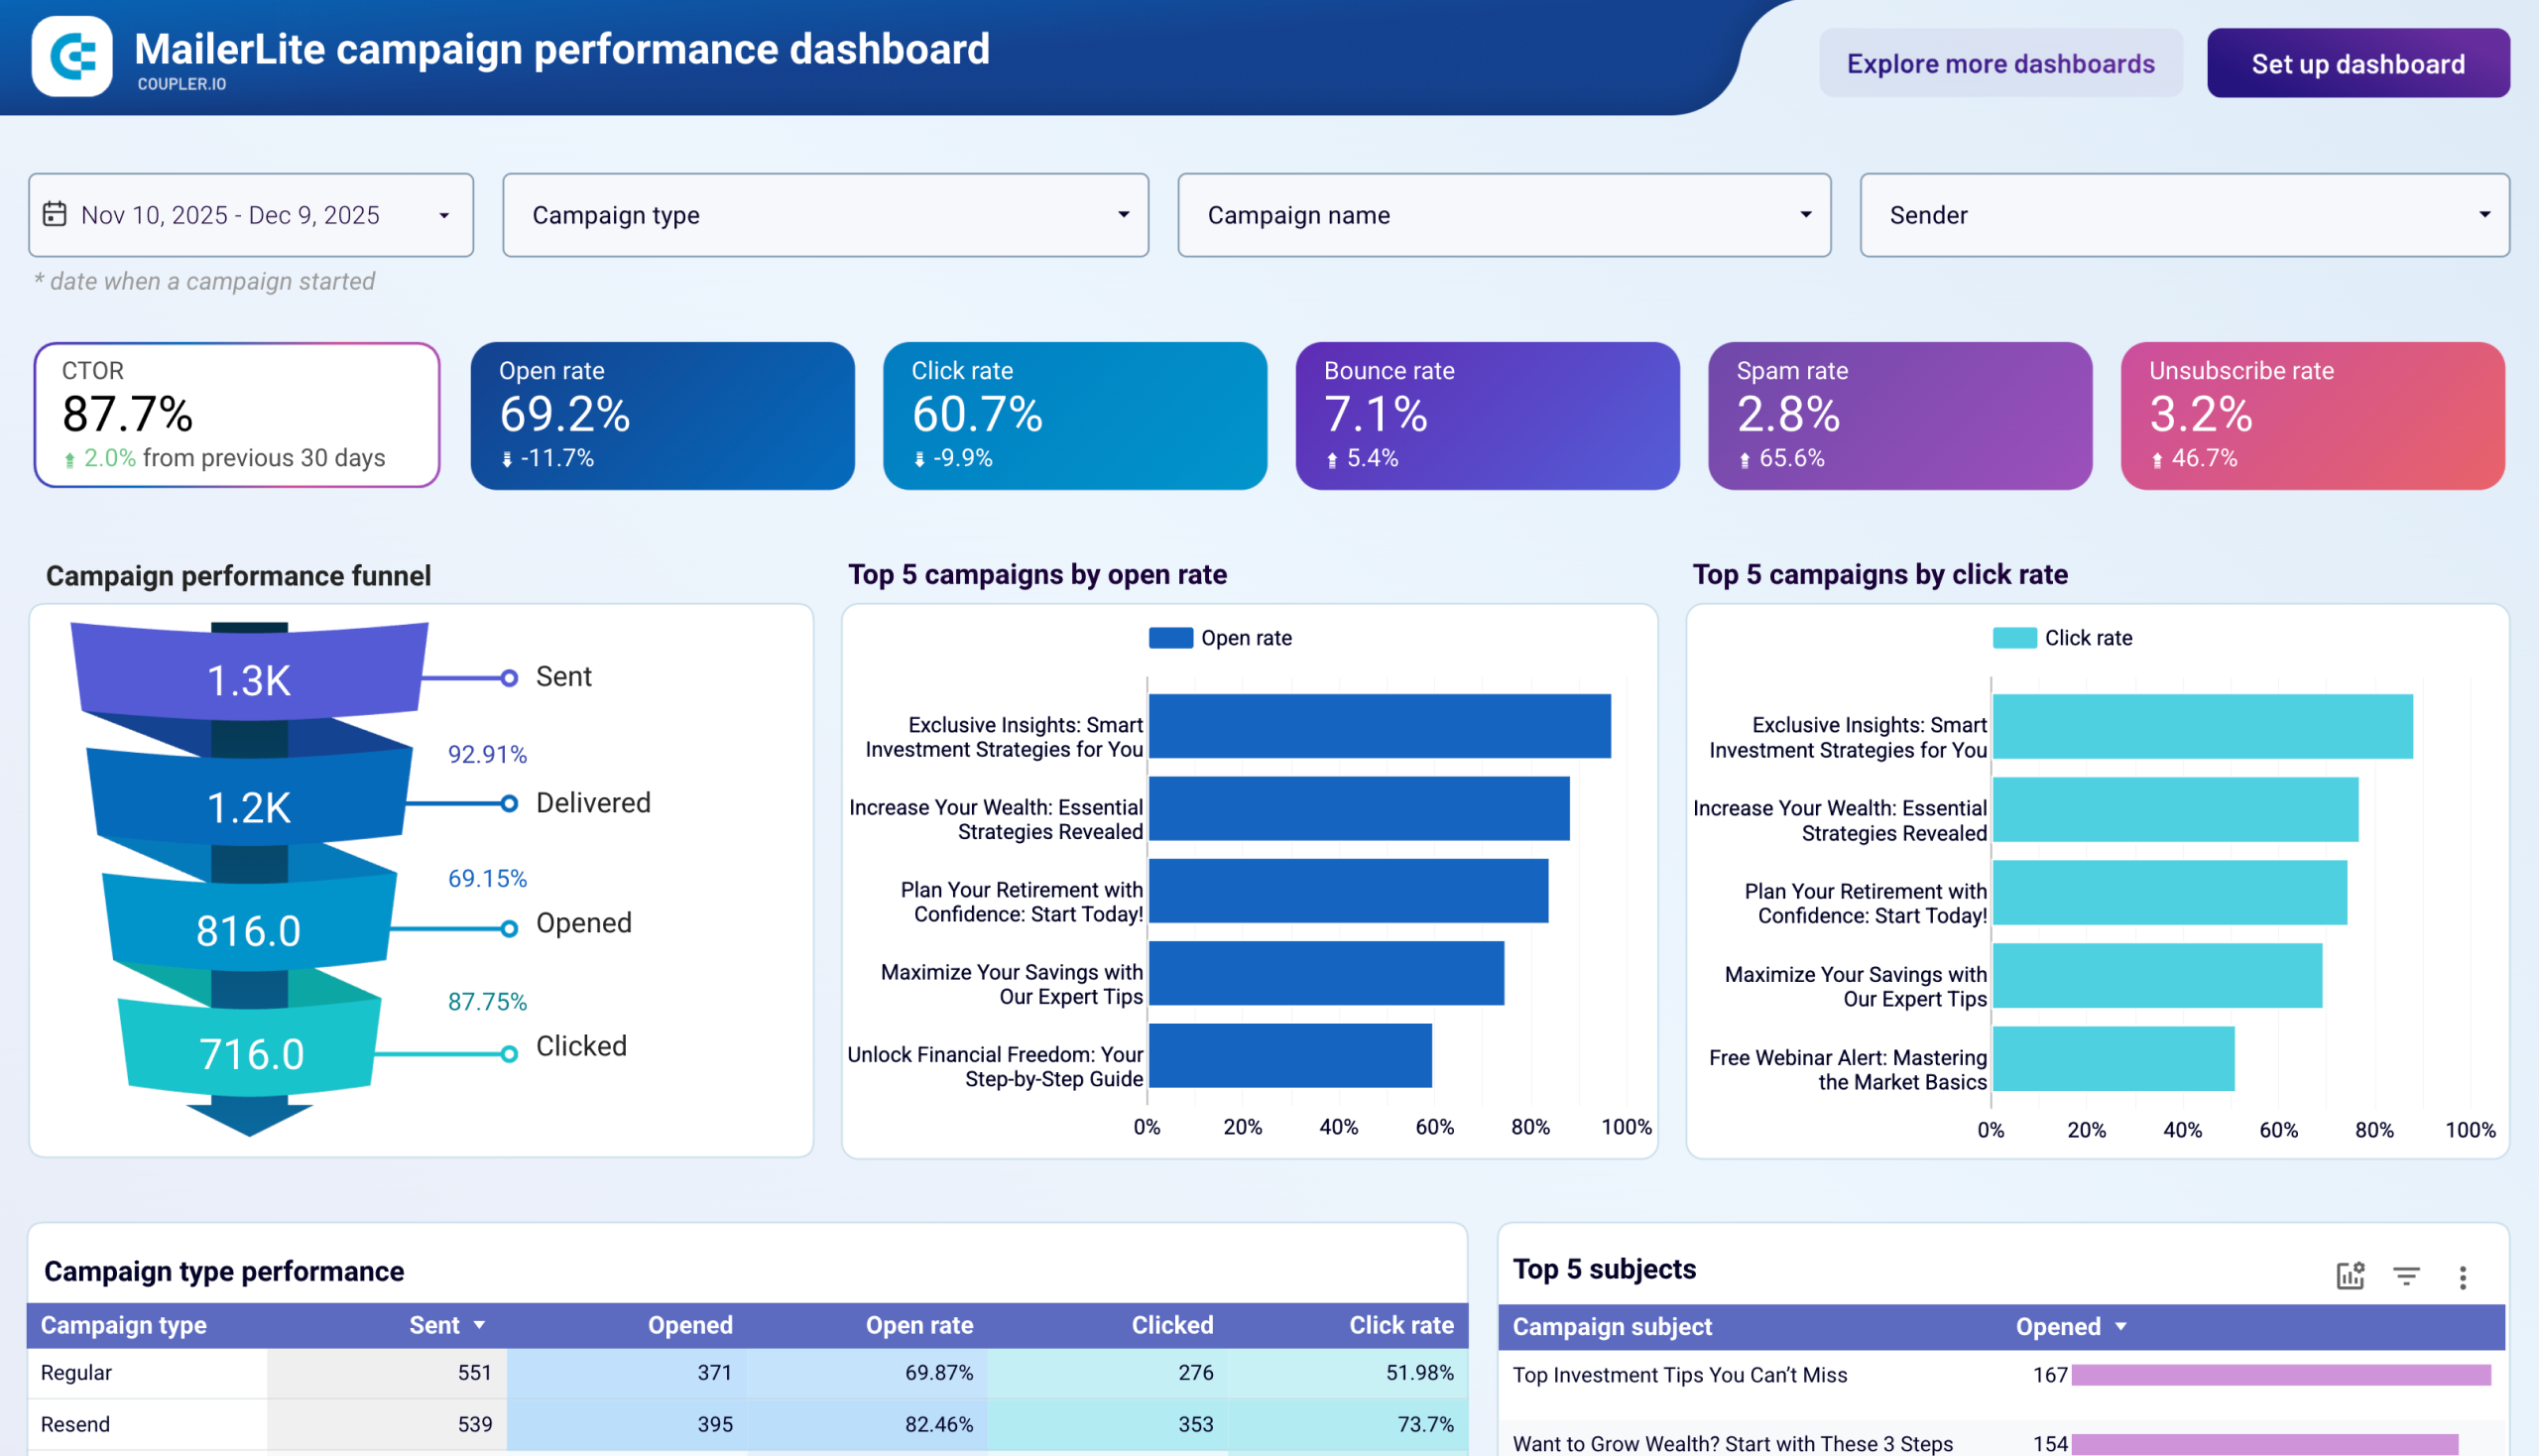
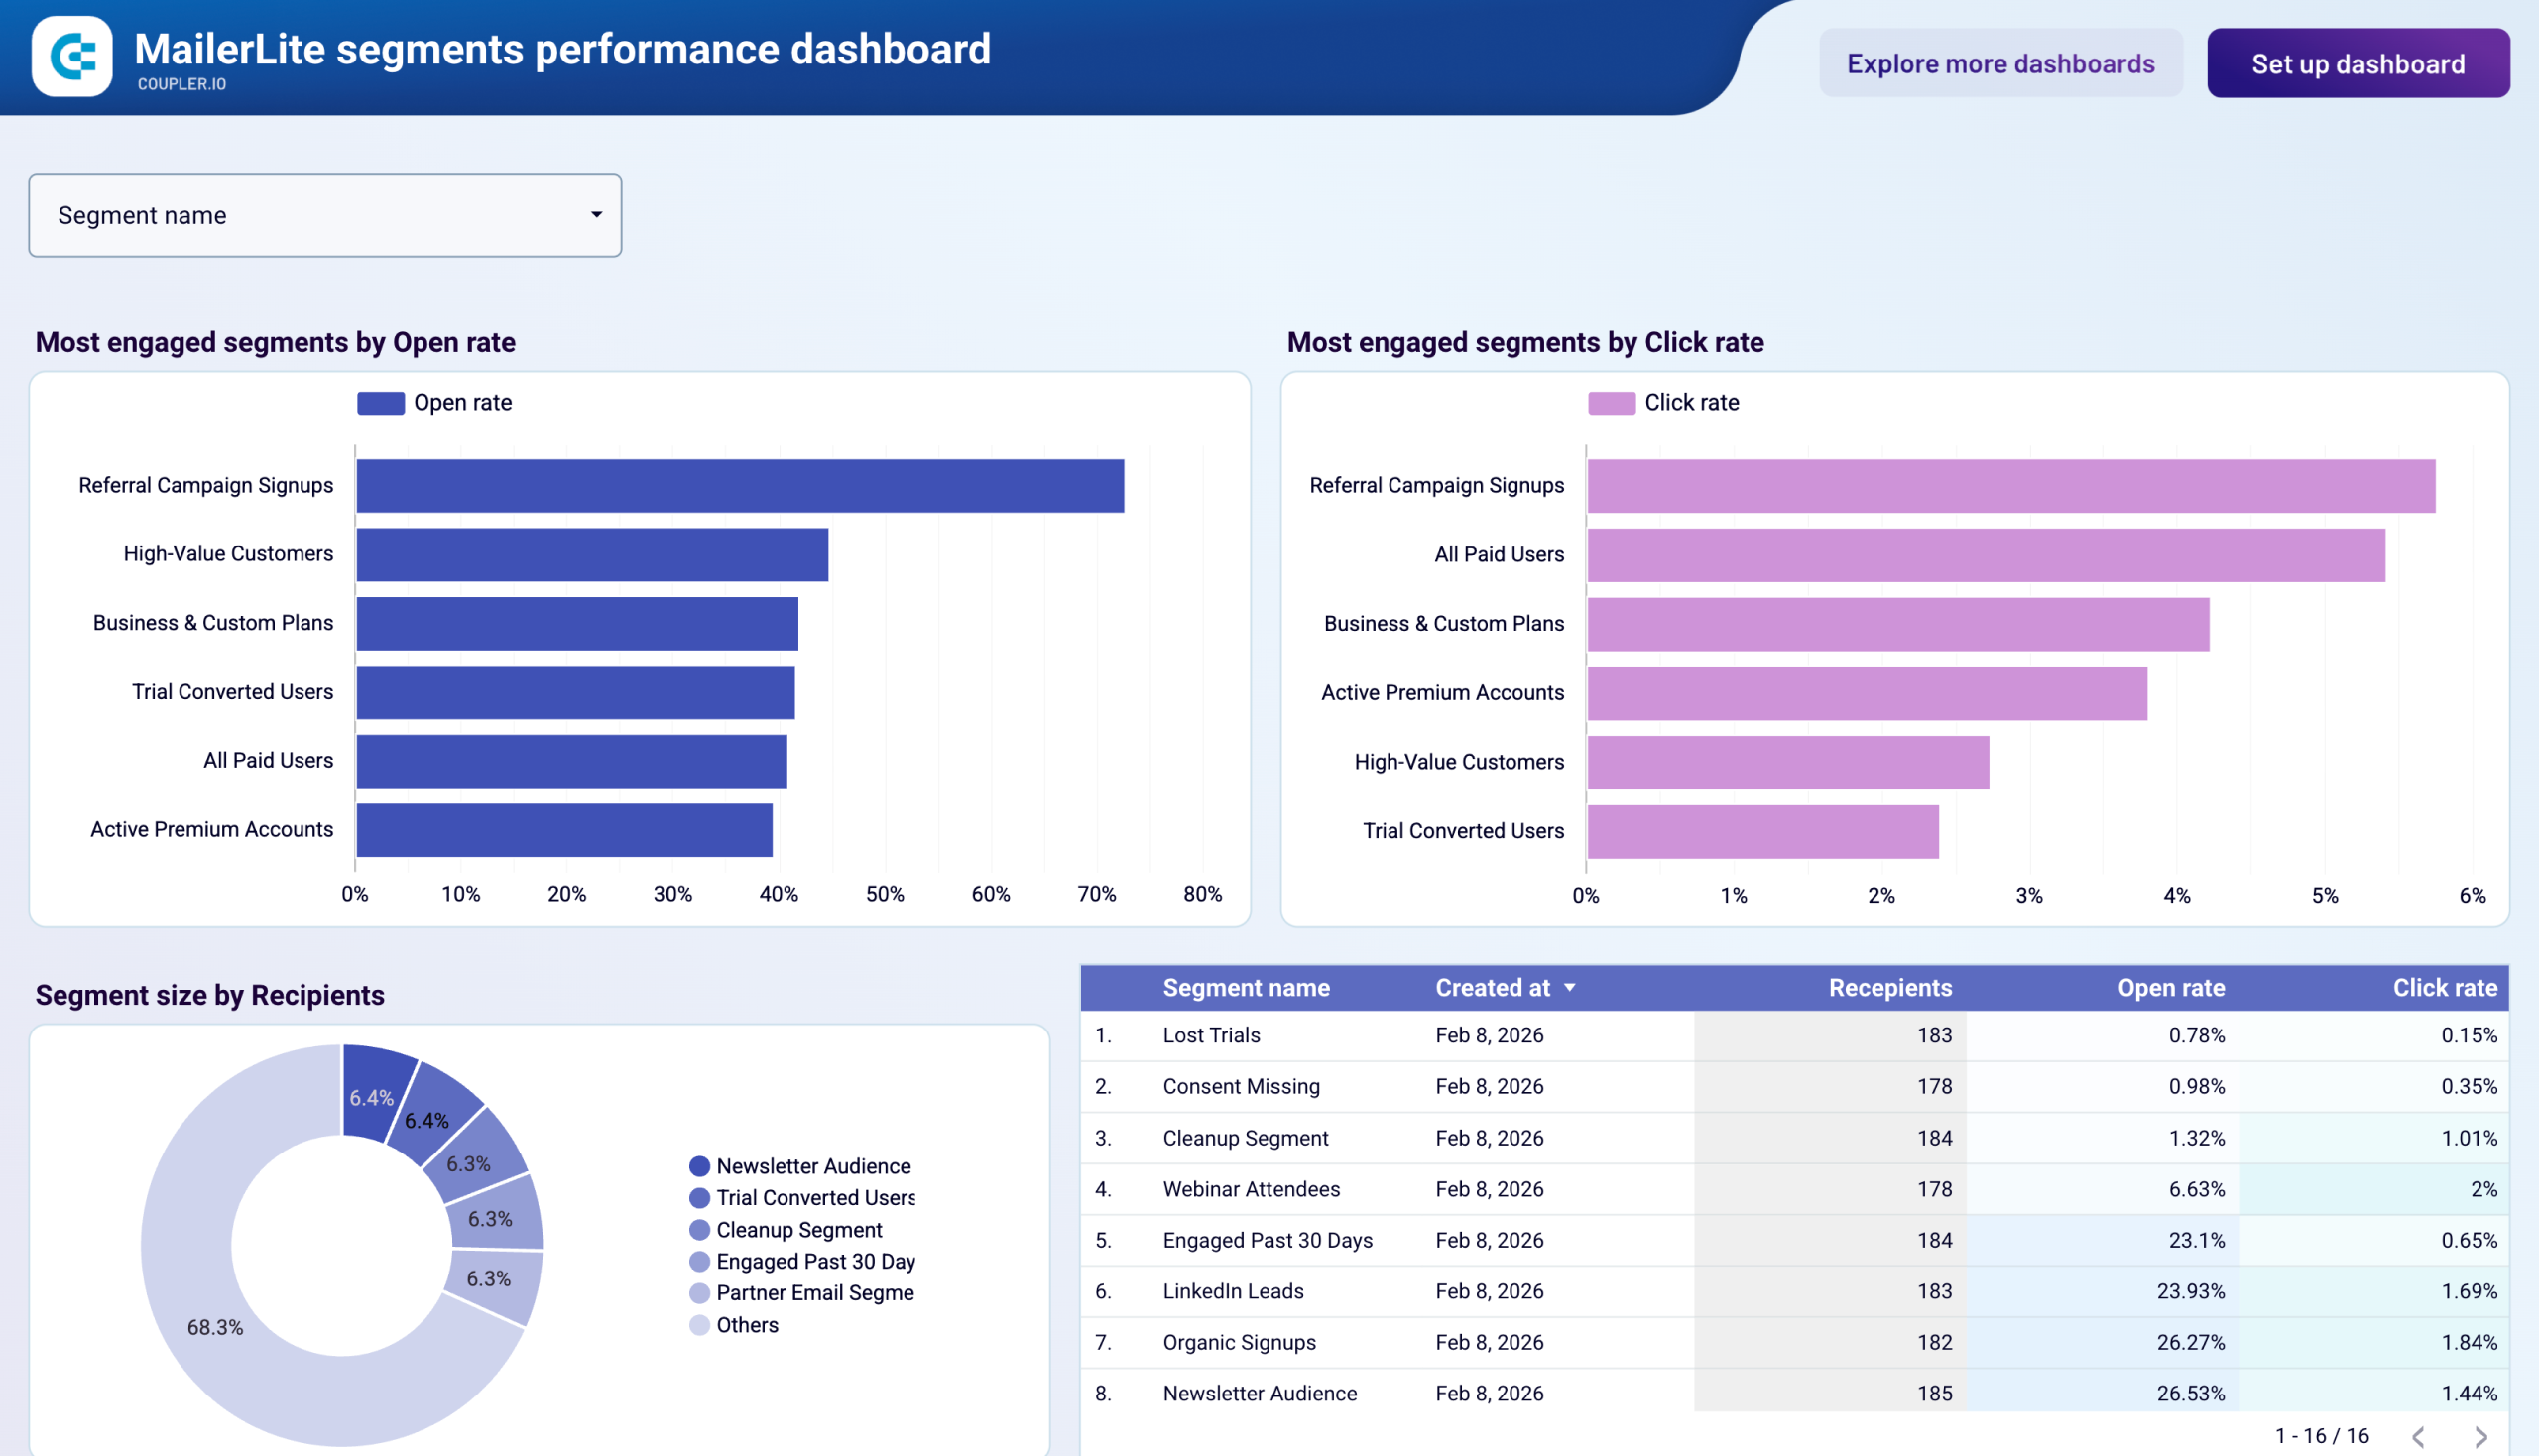
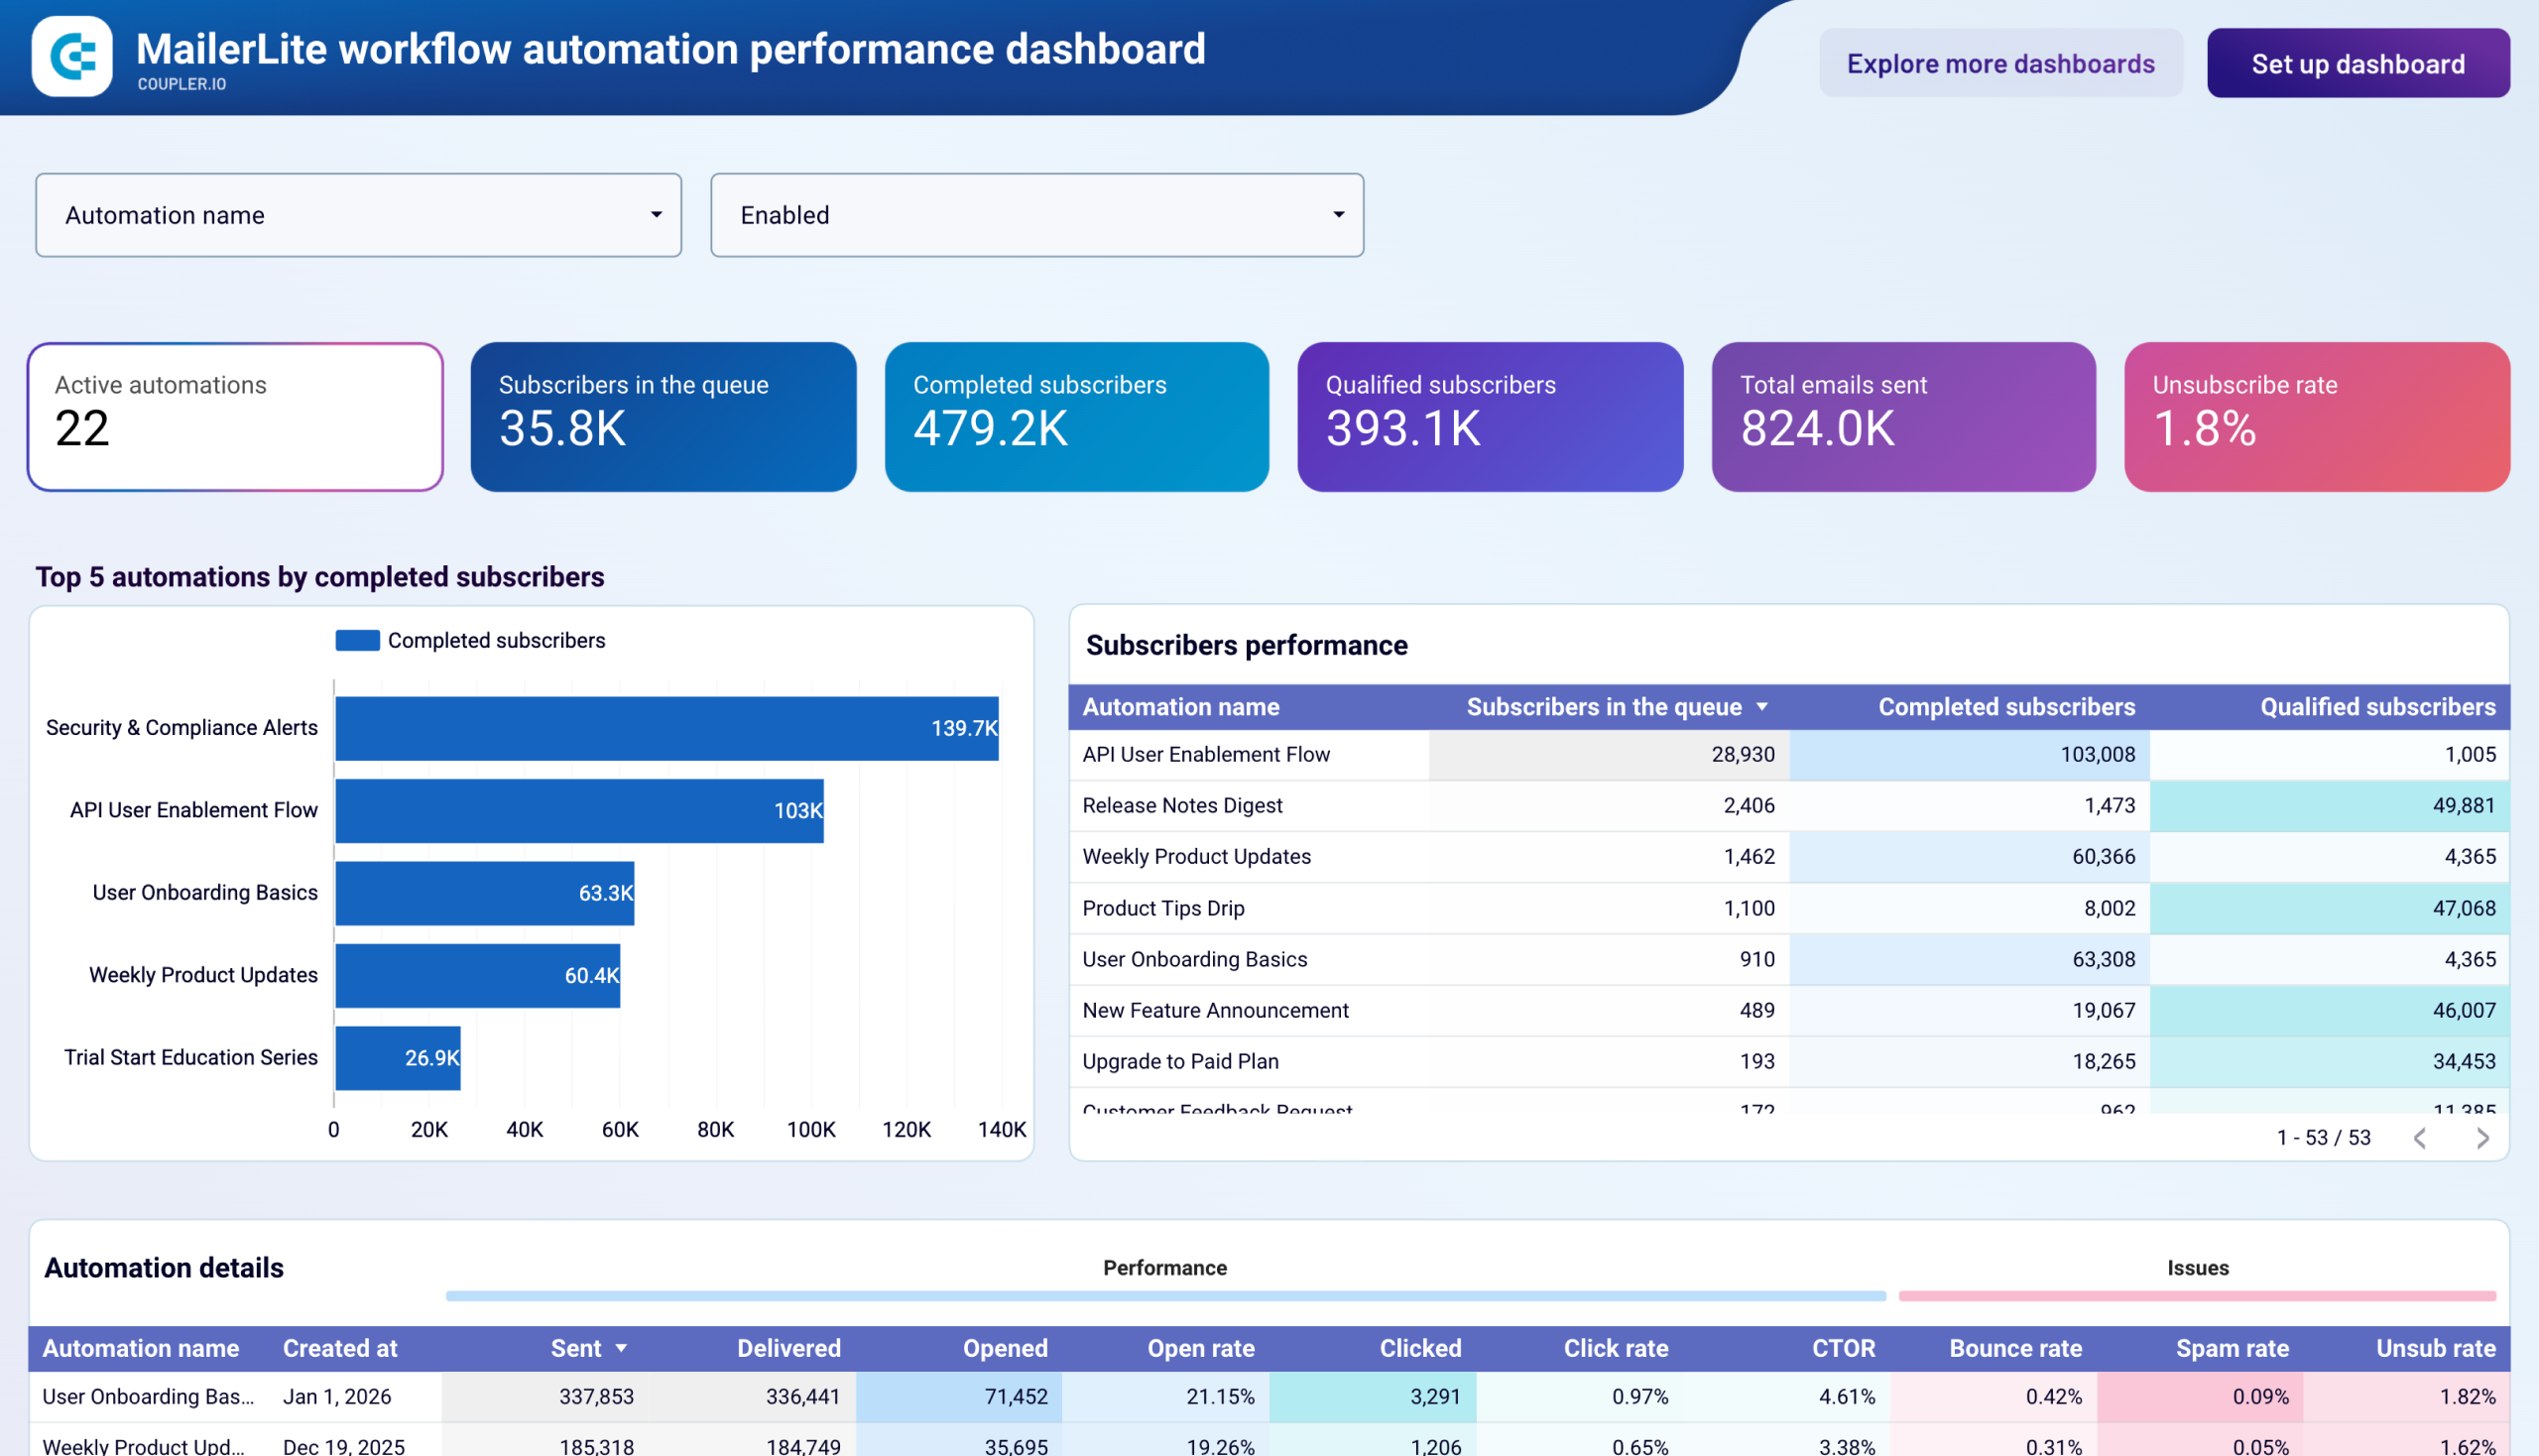
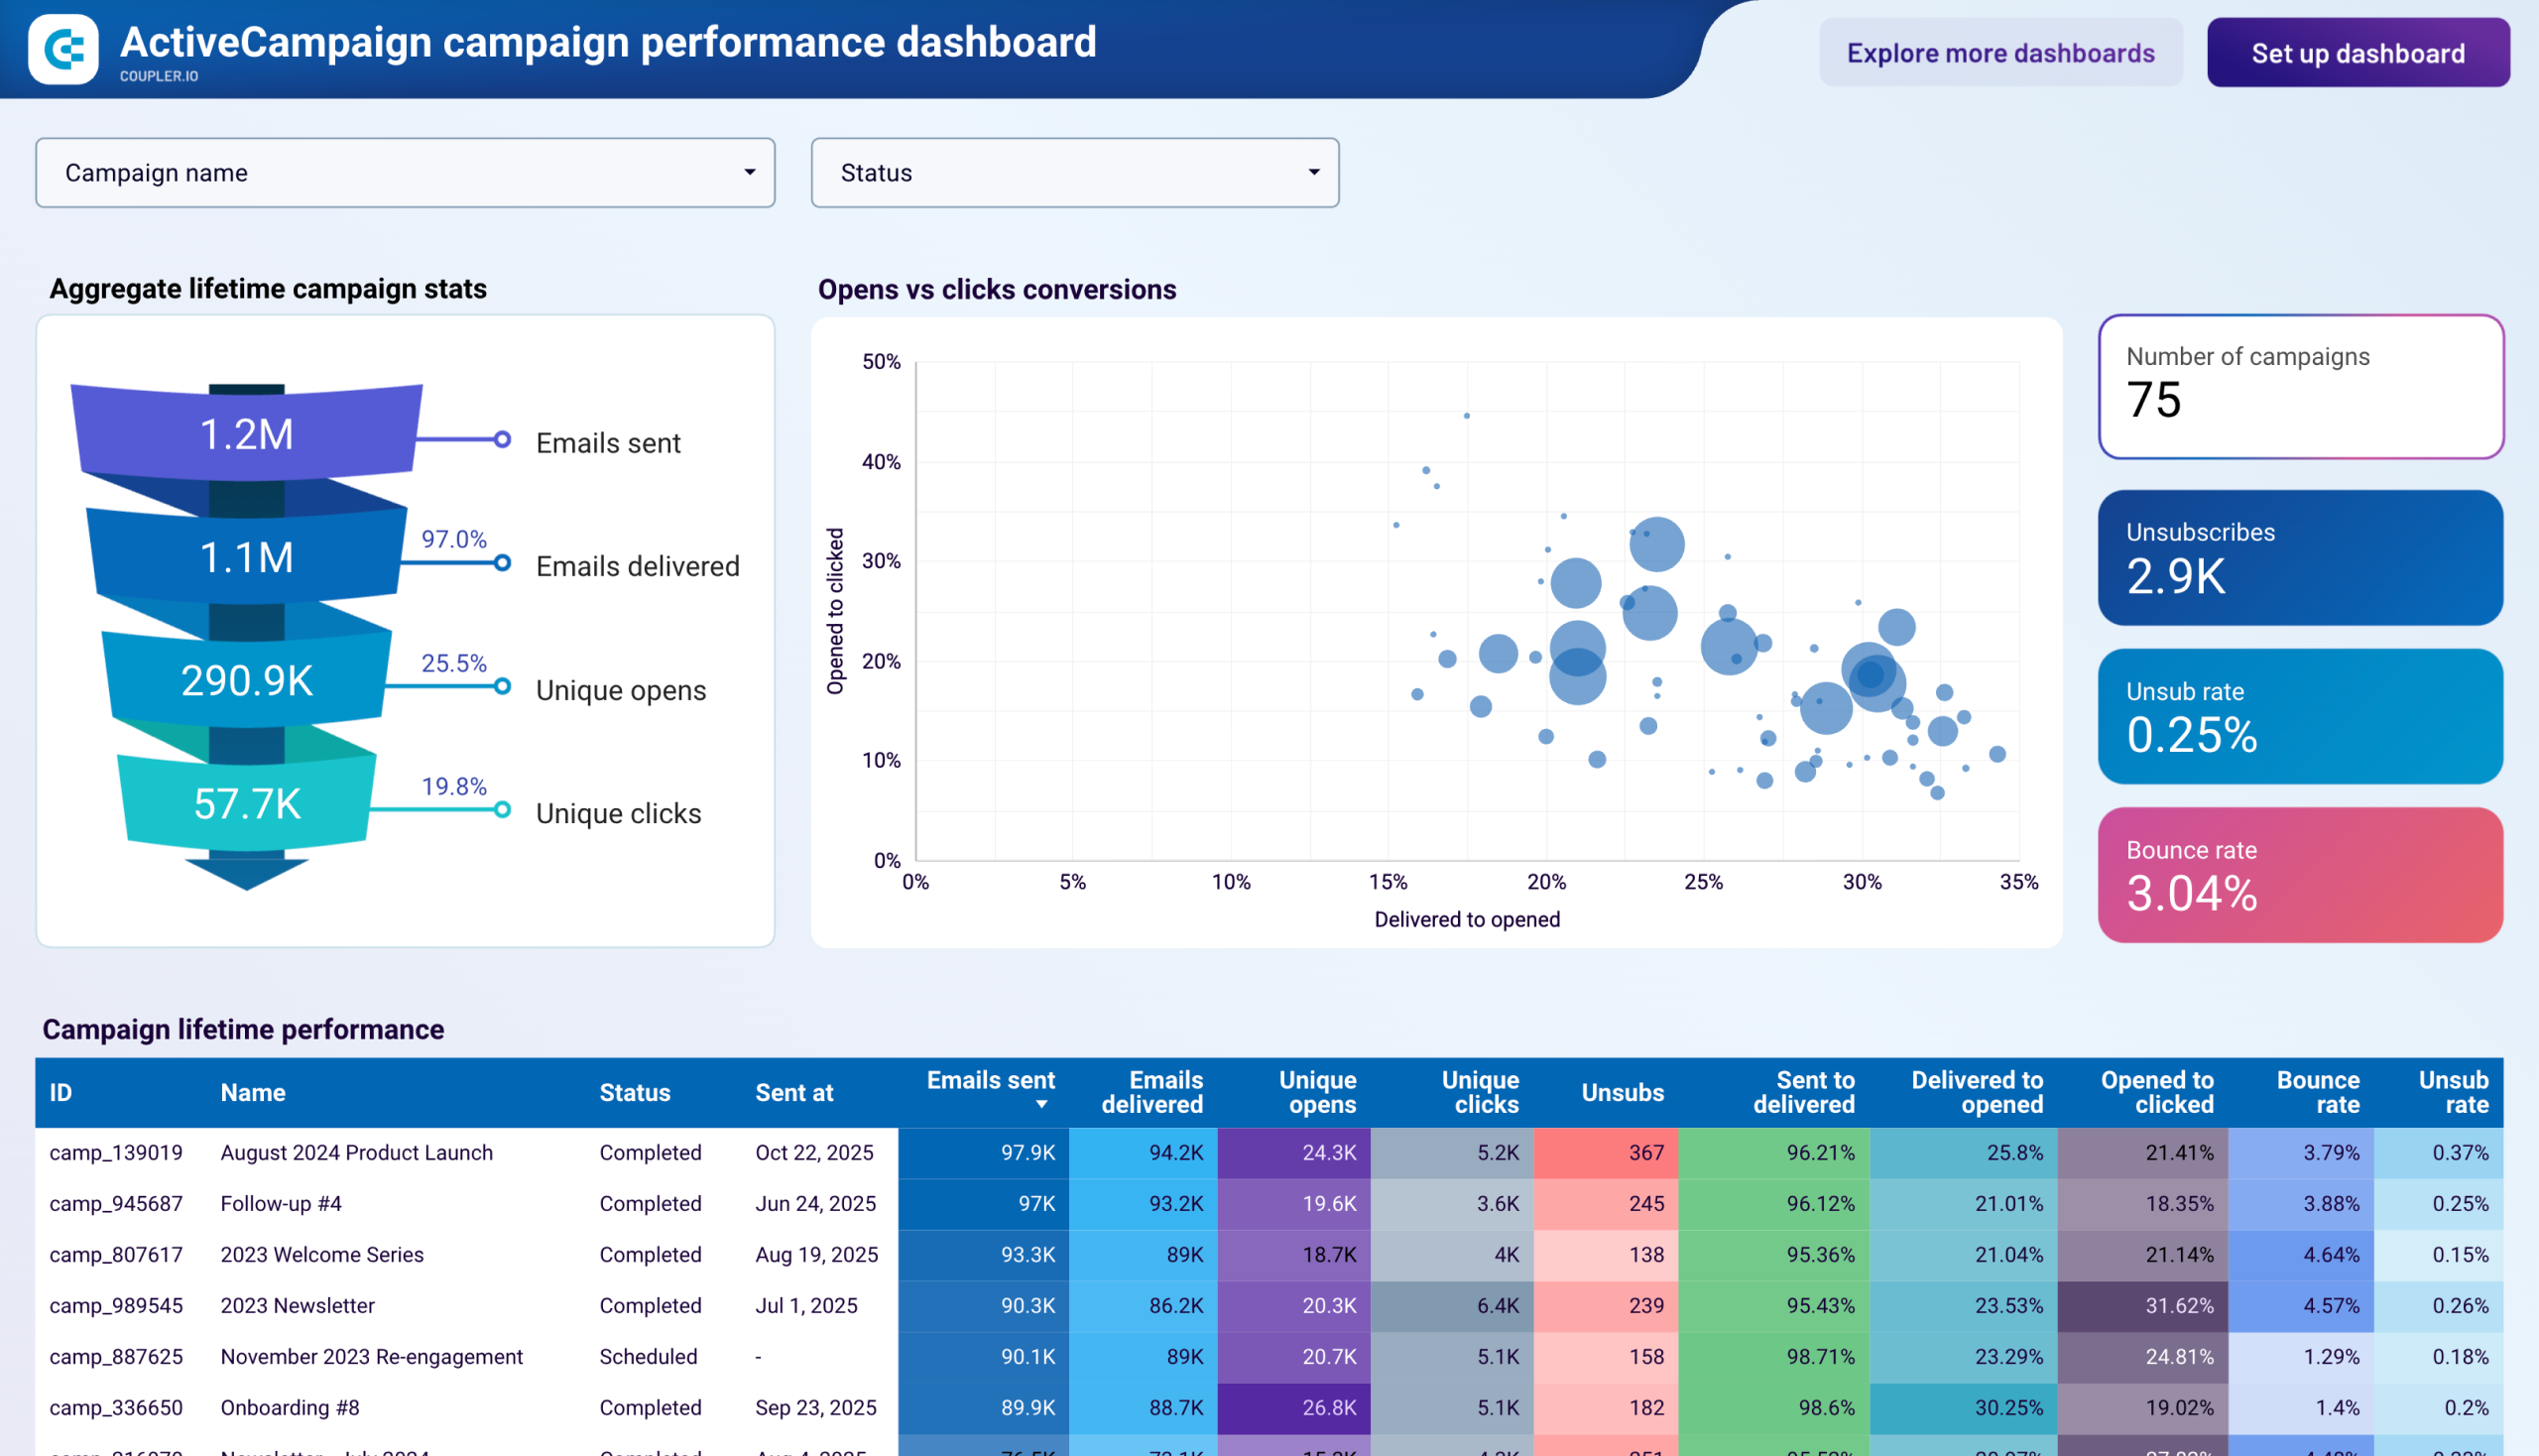
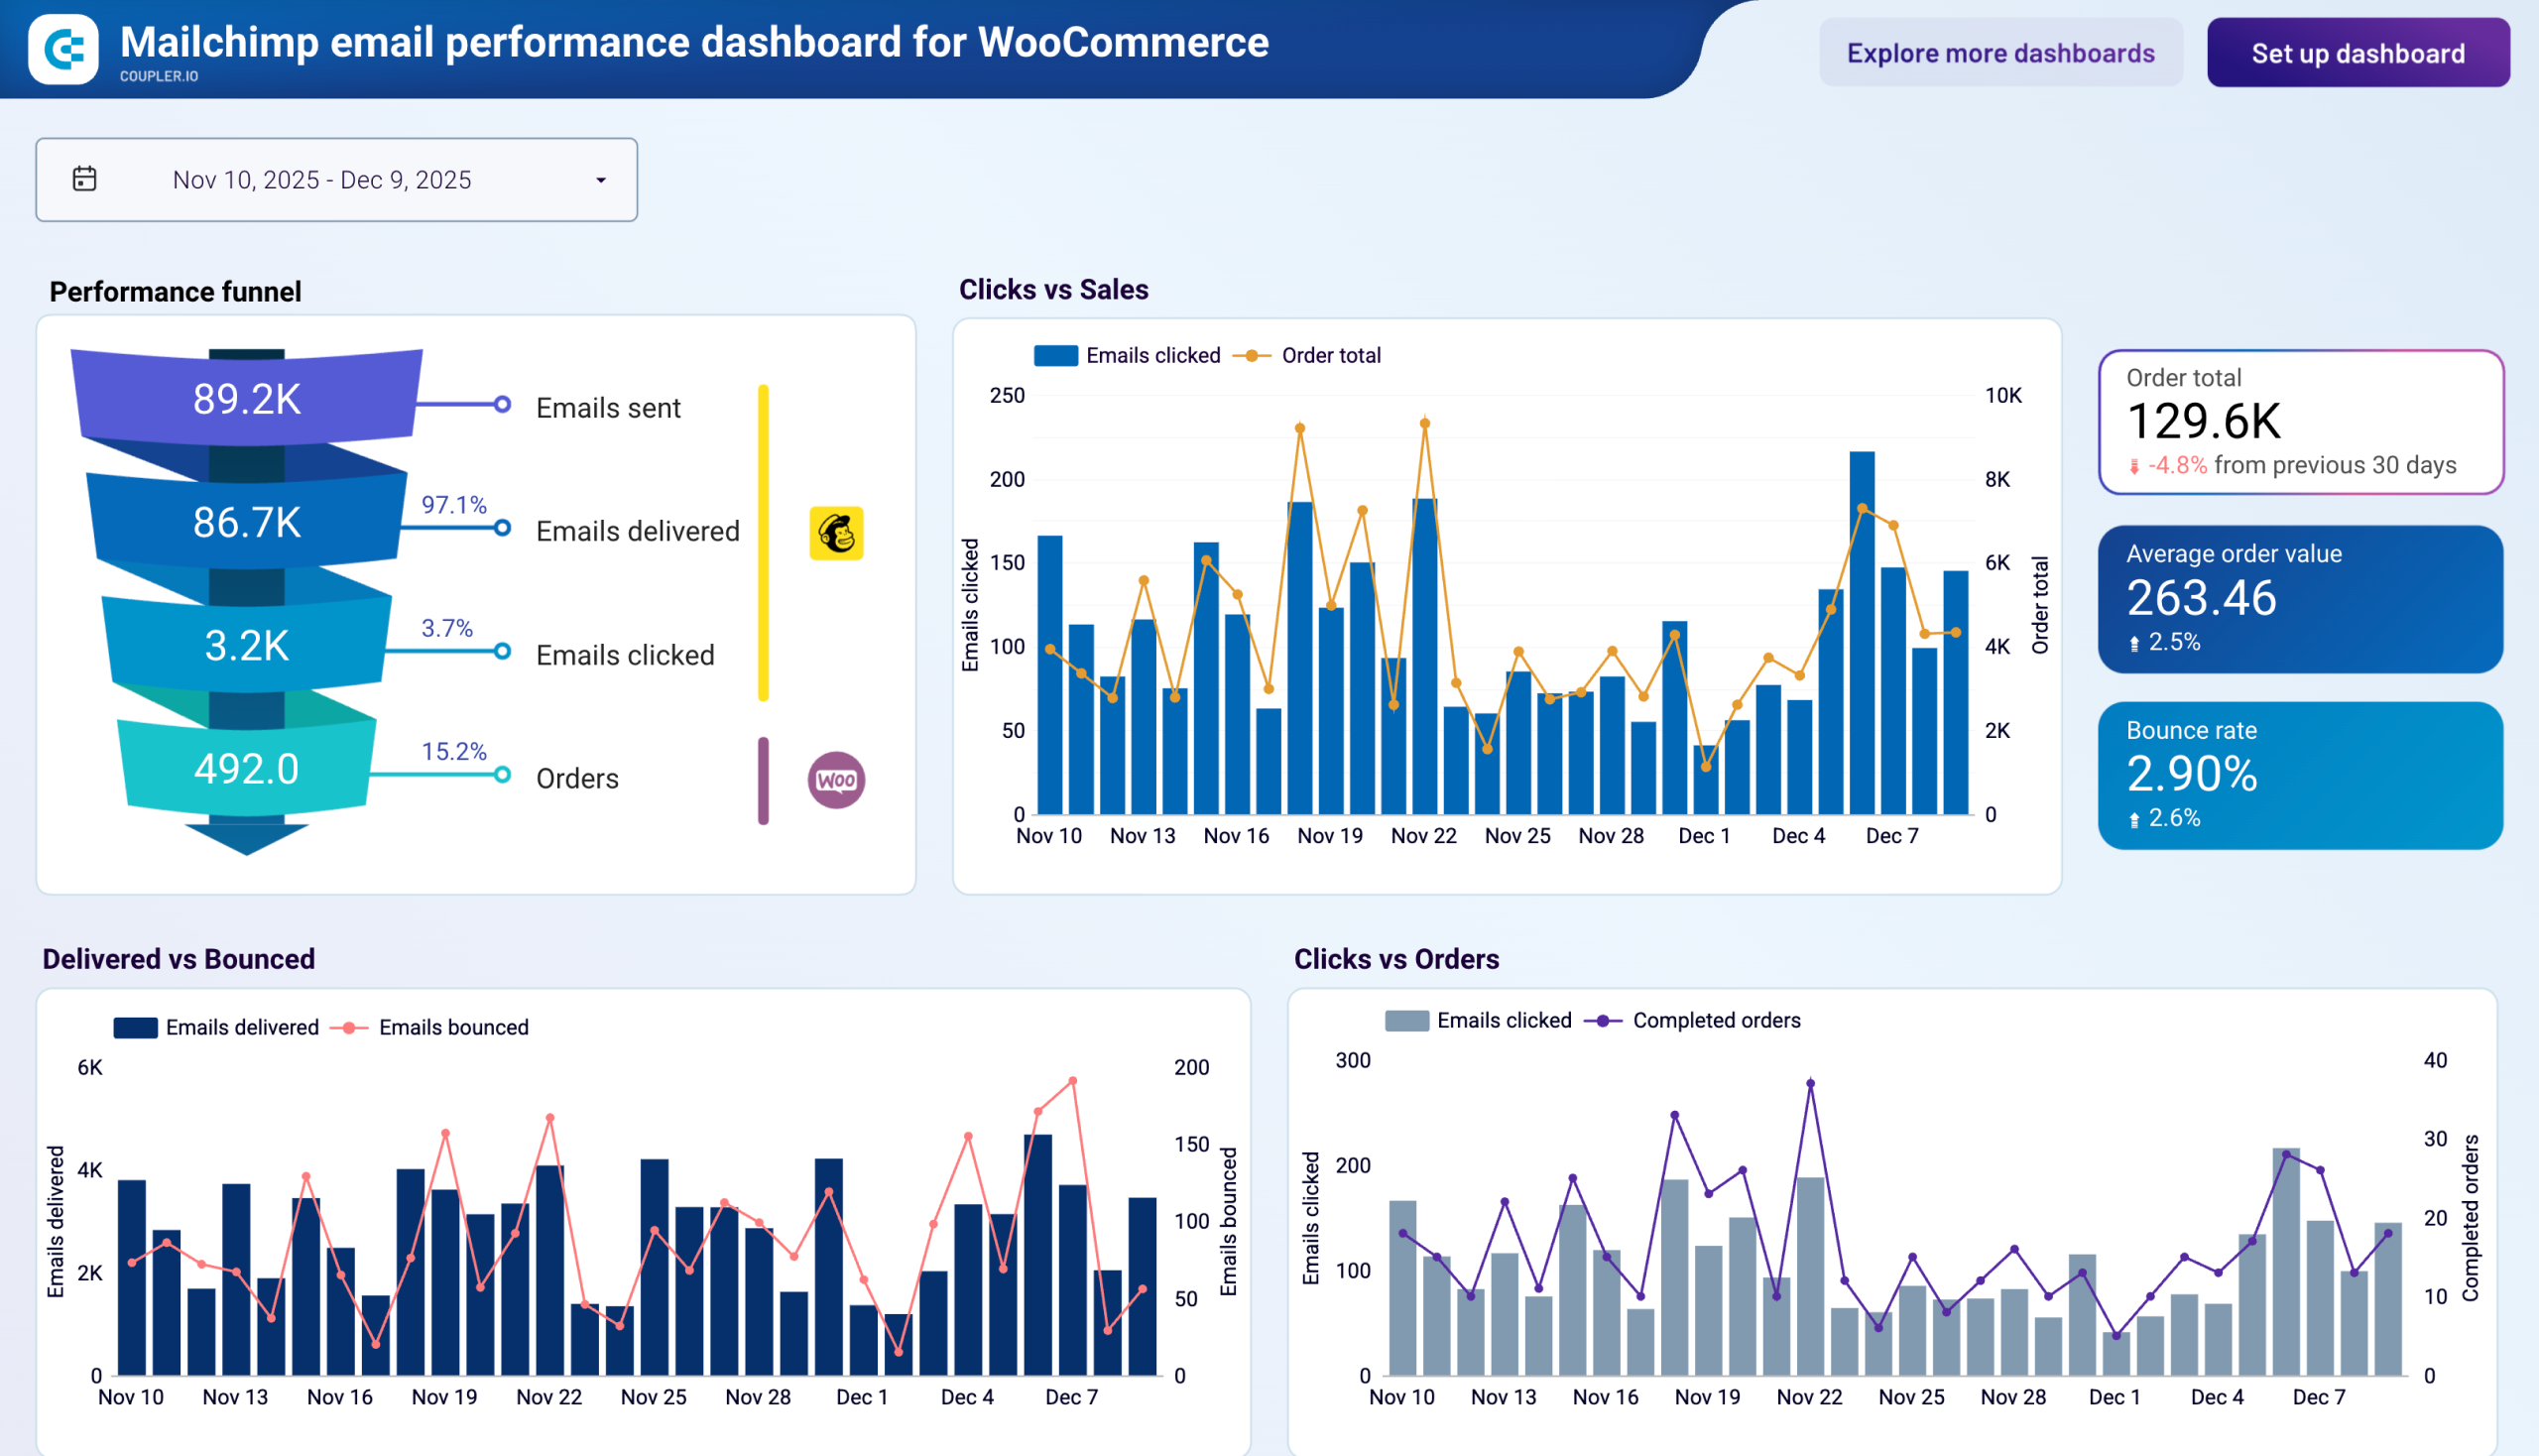
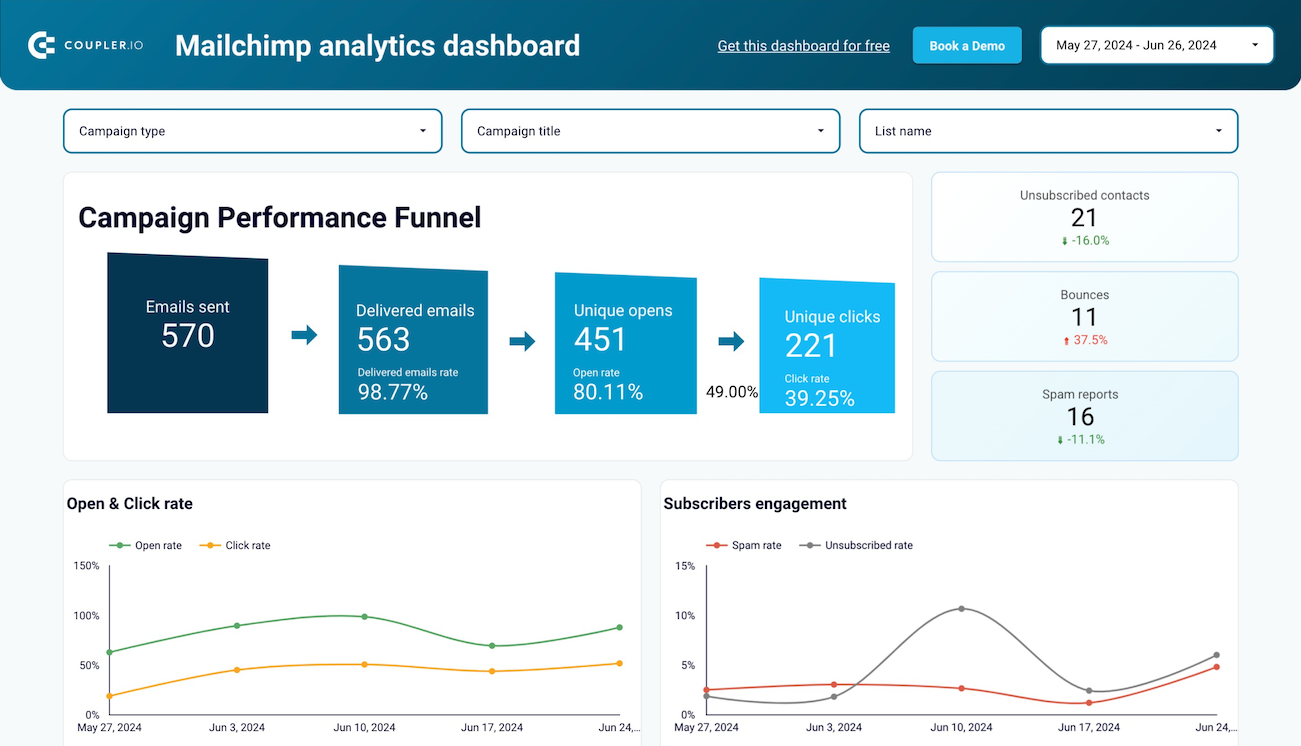
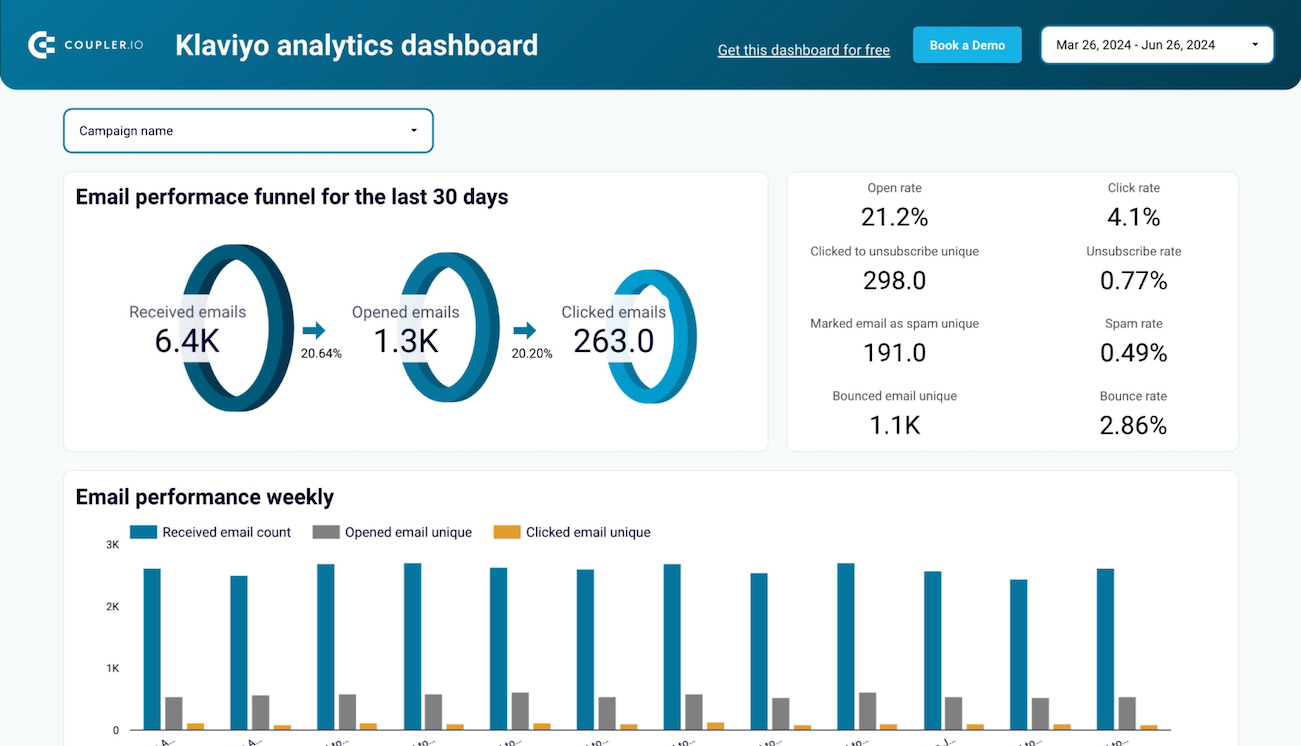
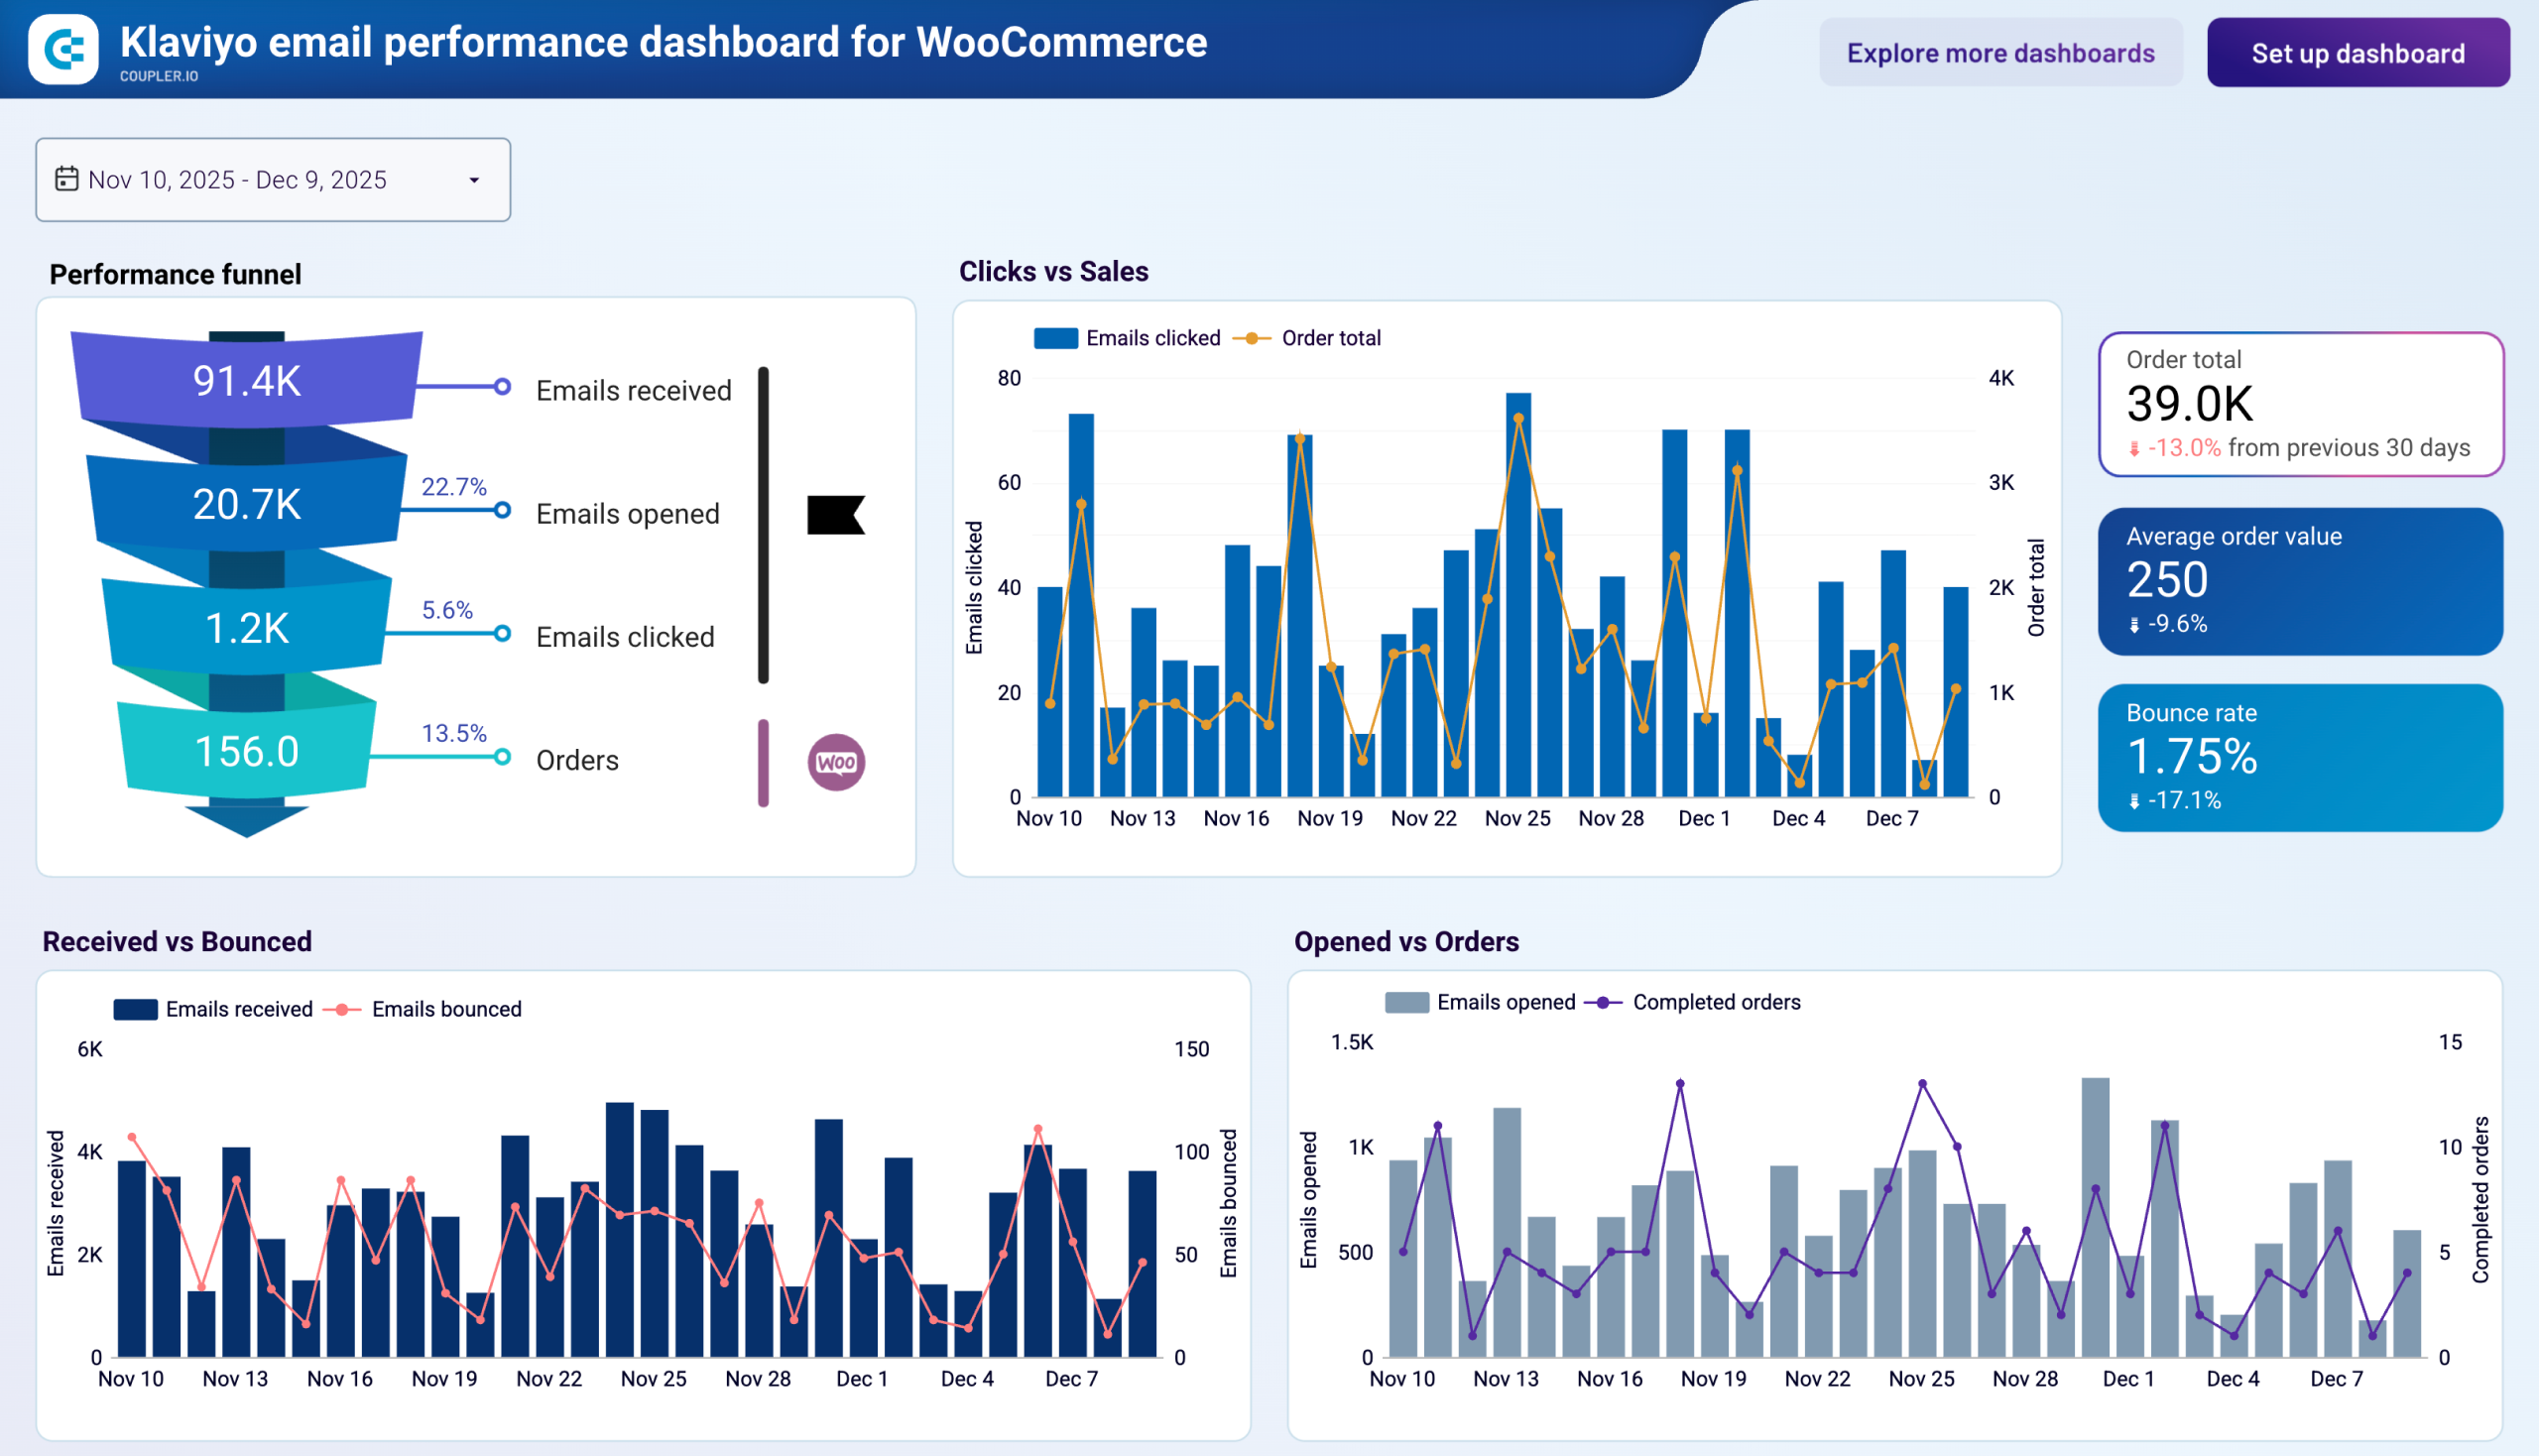
Email Marketing dashboards
Track open & click-through rates, conversions, and other performance metrics of your email campaigns. The dashboard templates are useful for analyzing your email marketing efforts and revealing bottlenecks and failures. Use these insights to achieve better outcomes.
Marketing KPI dashboards
Get an overview of all your marketing performance in one place. Our dashboards allow you to track ROI, customer acquisition cost, conversion rate, and other essential metrics. With this data by hand, you can analyze campaign performance and measure overall marketing effectiveness.
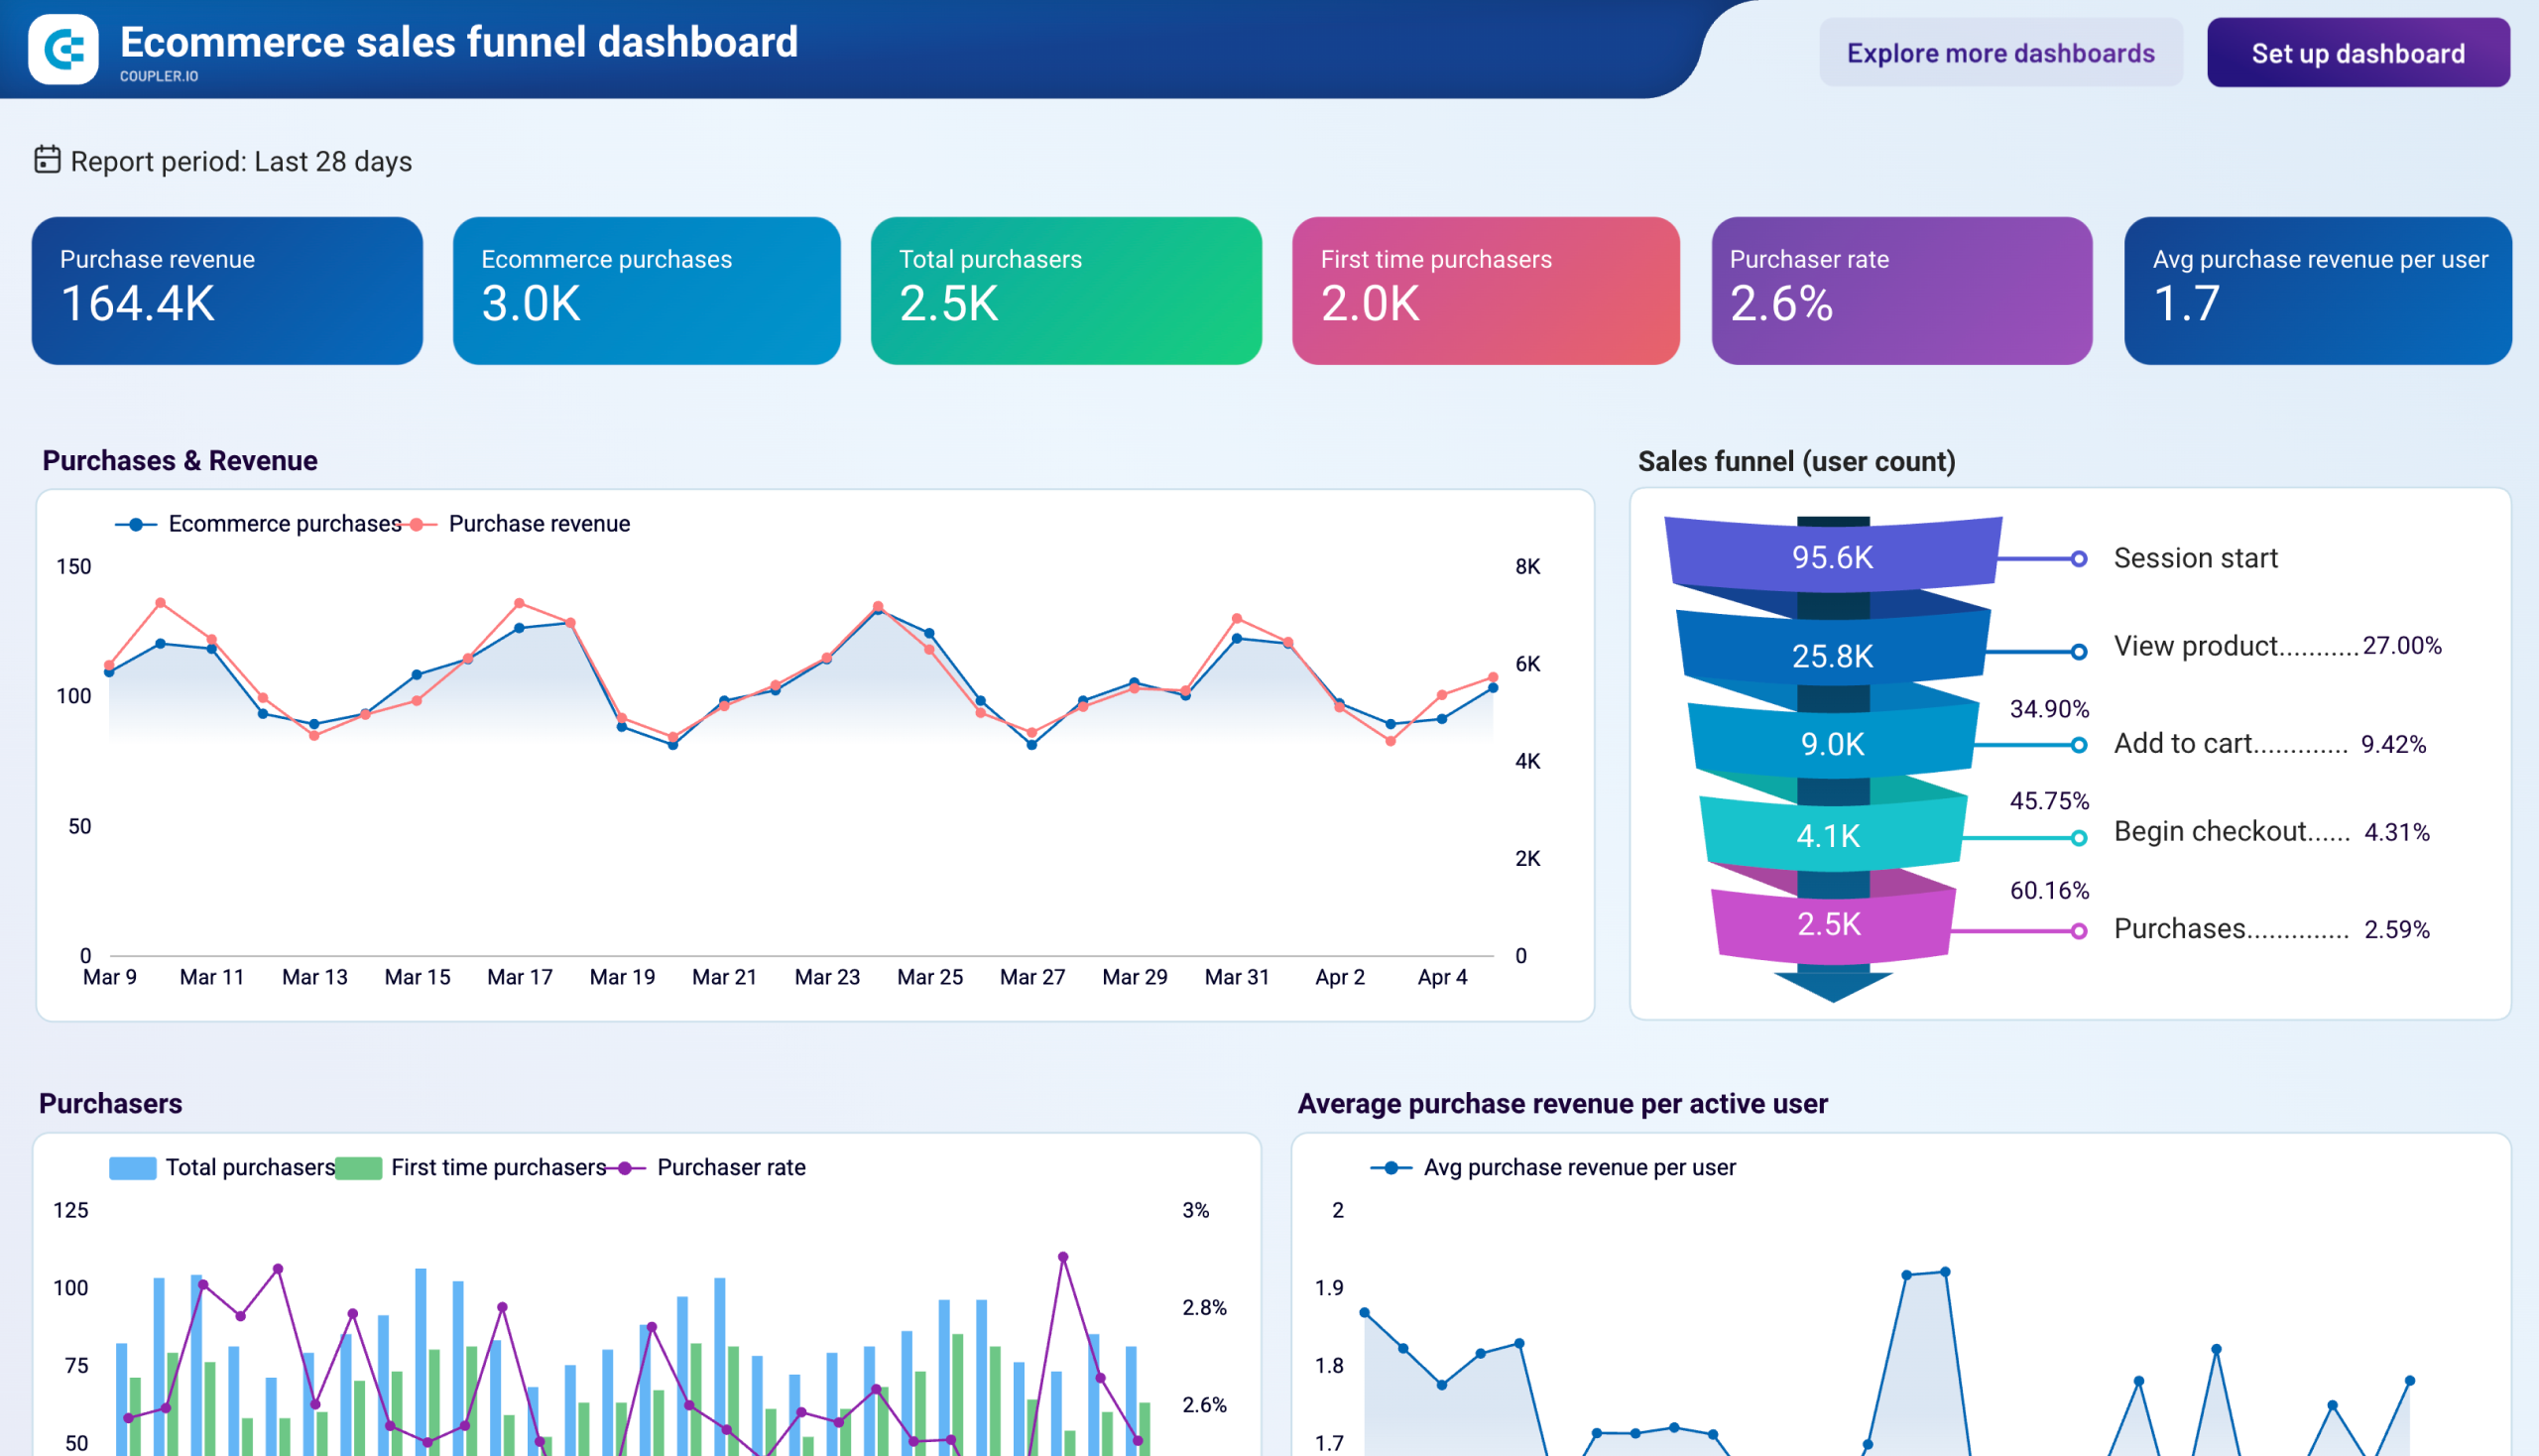
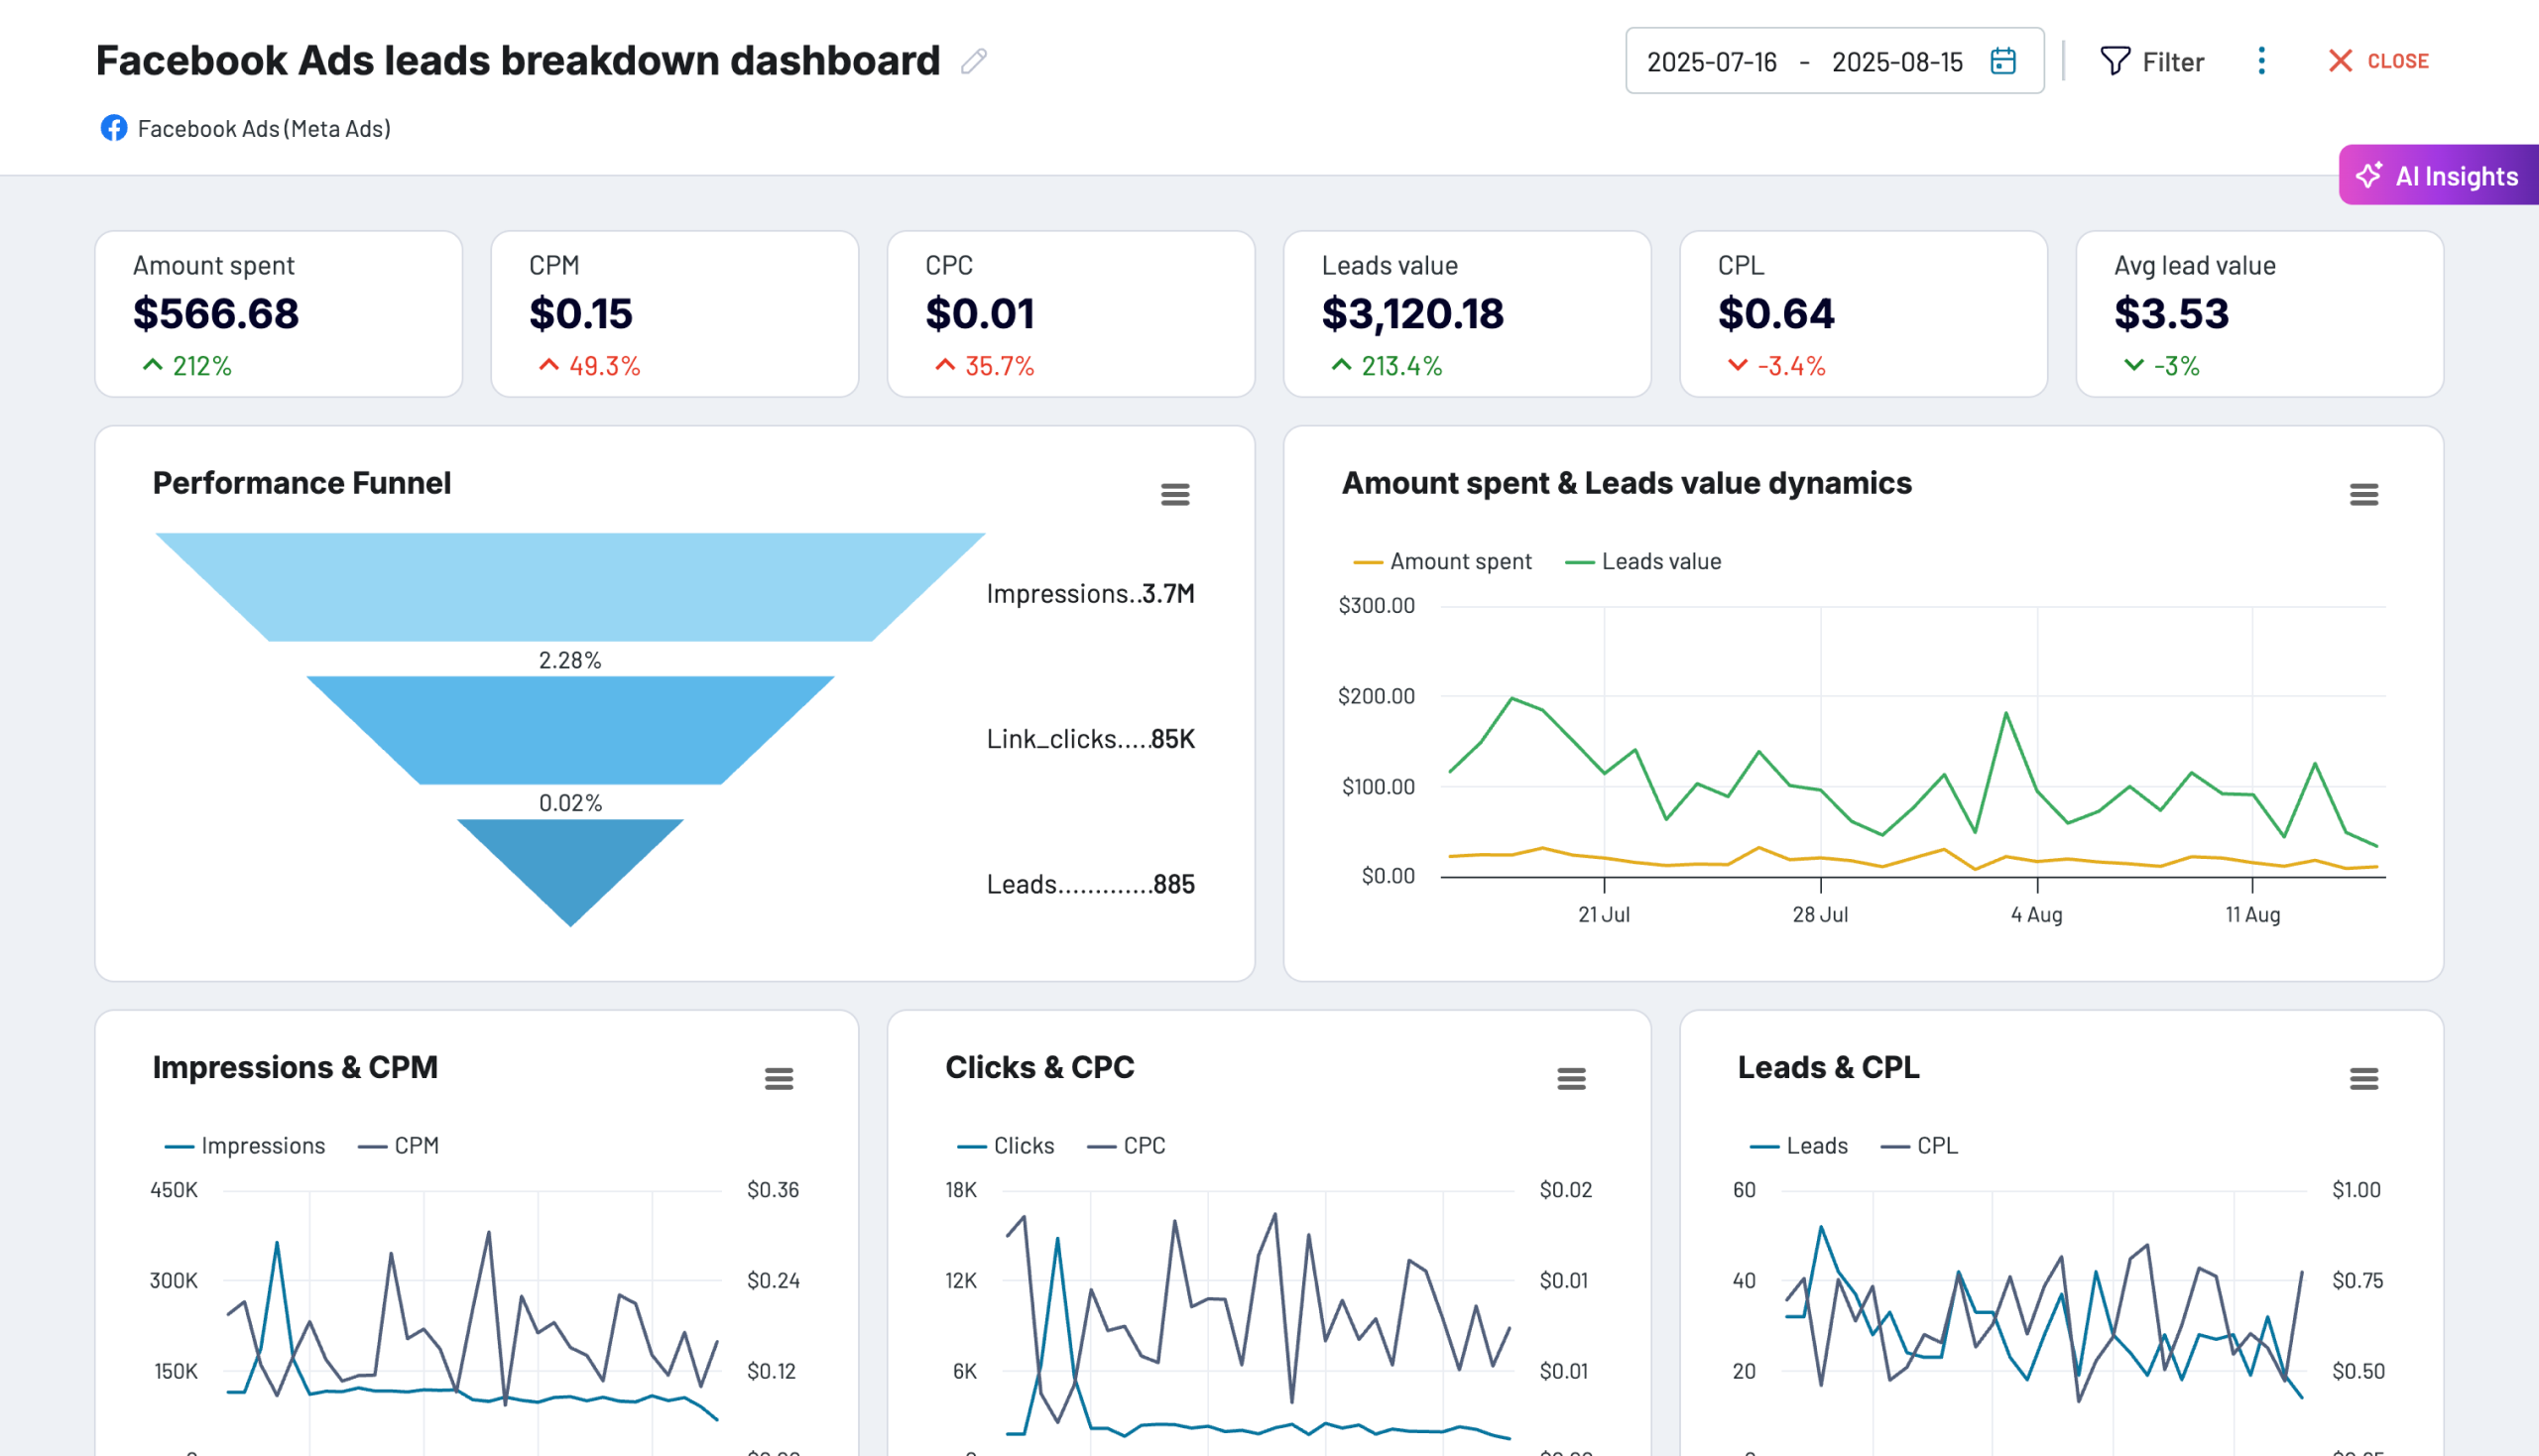
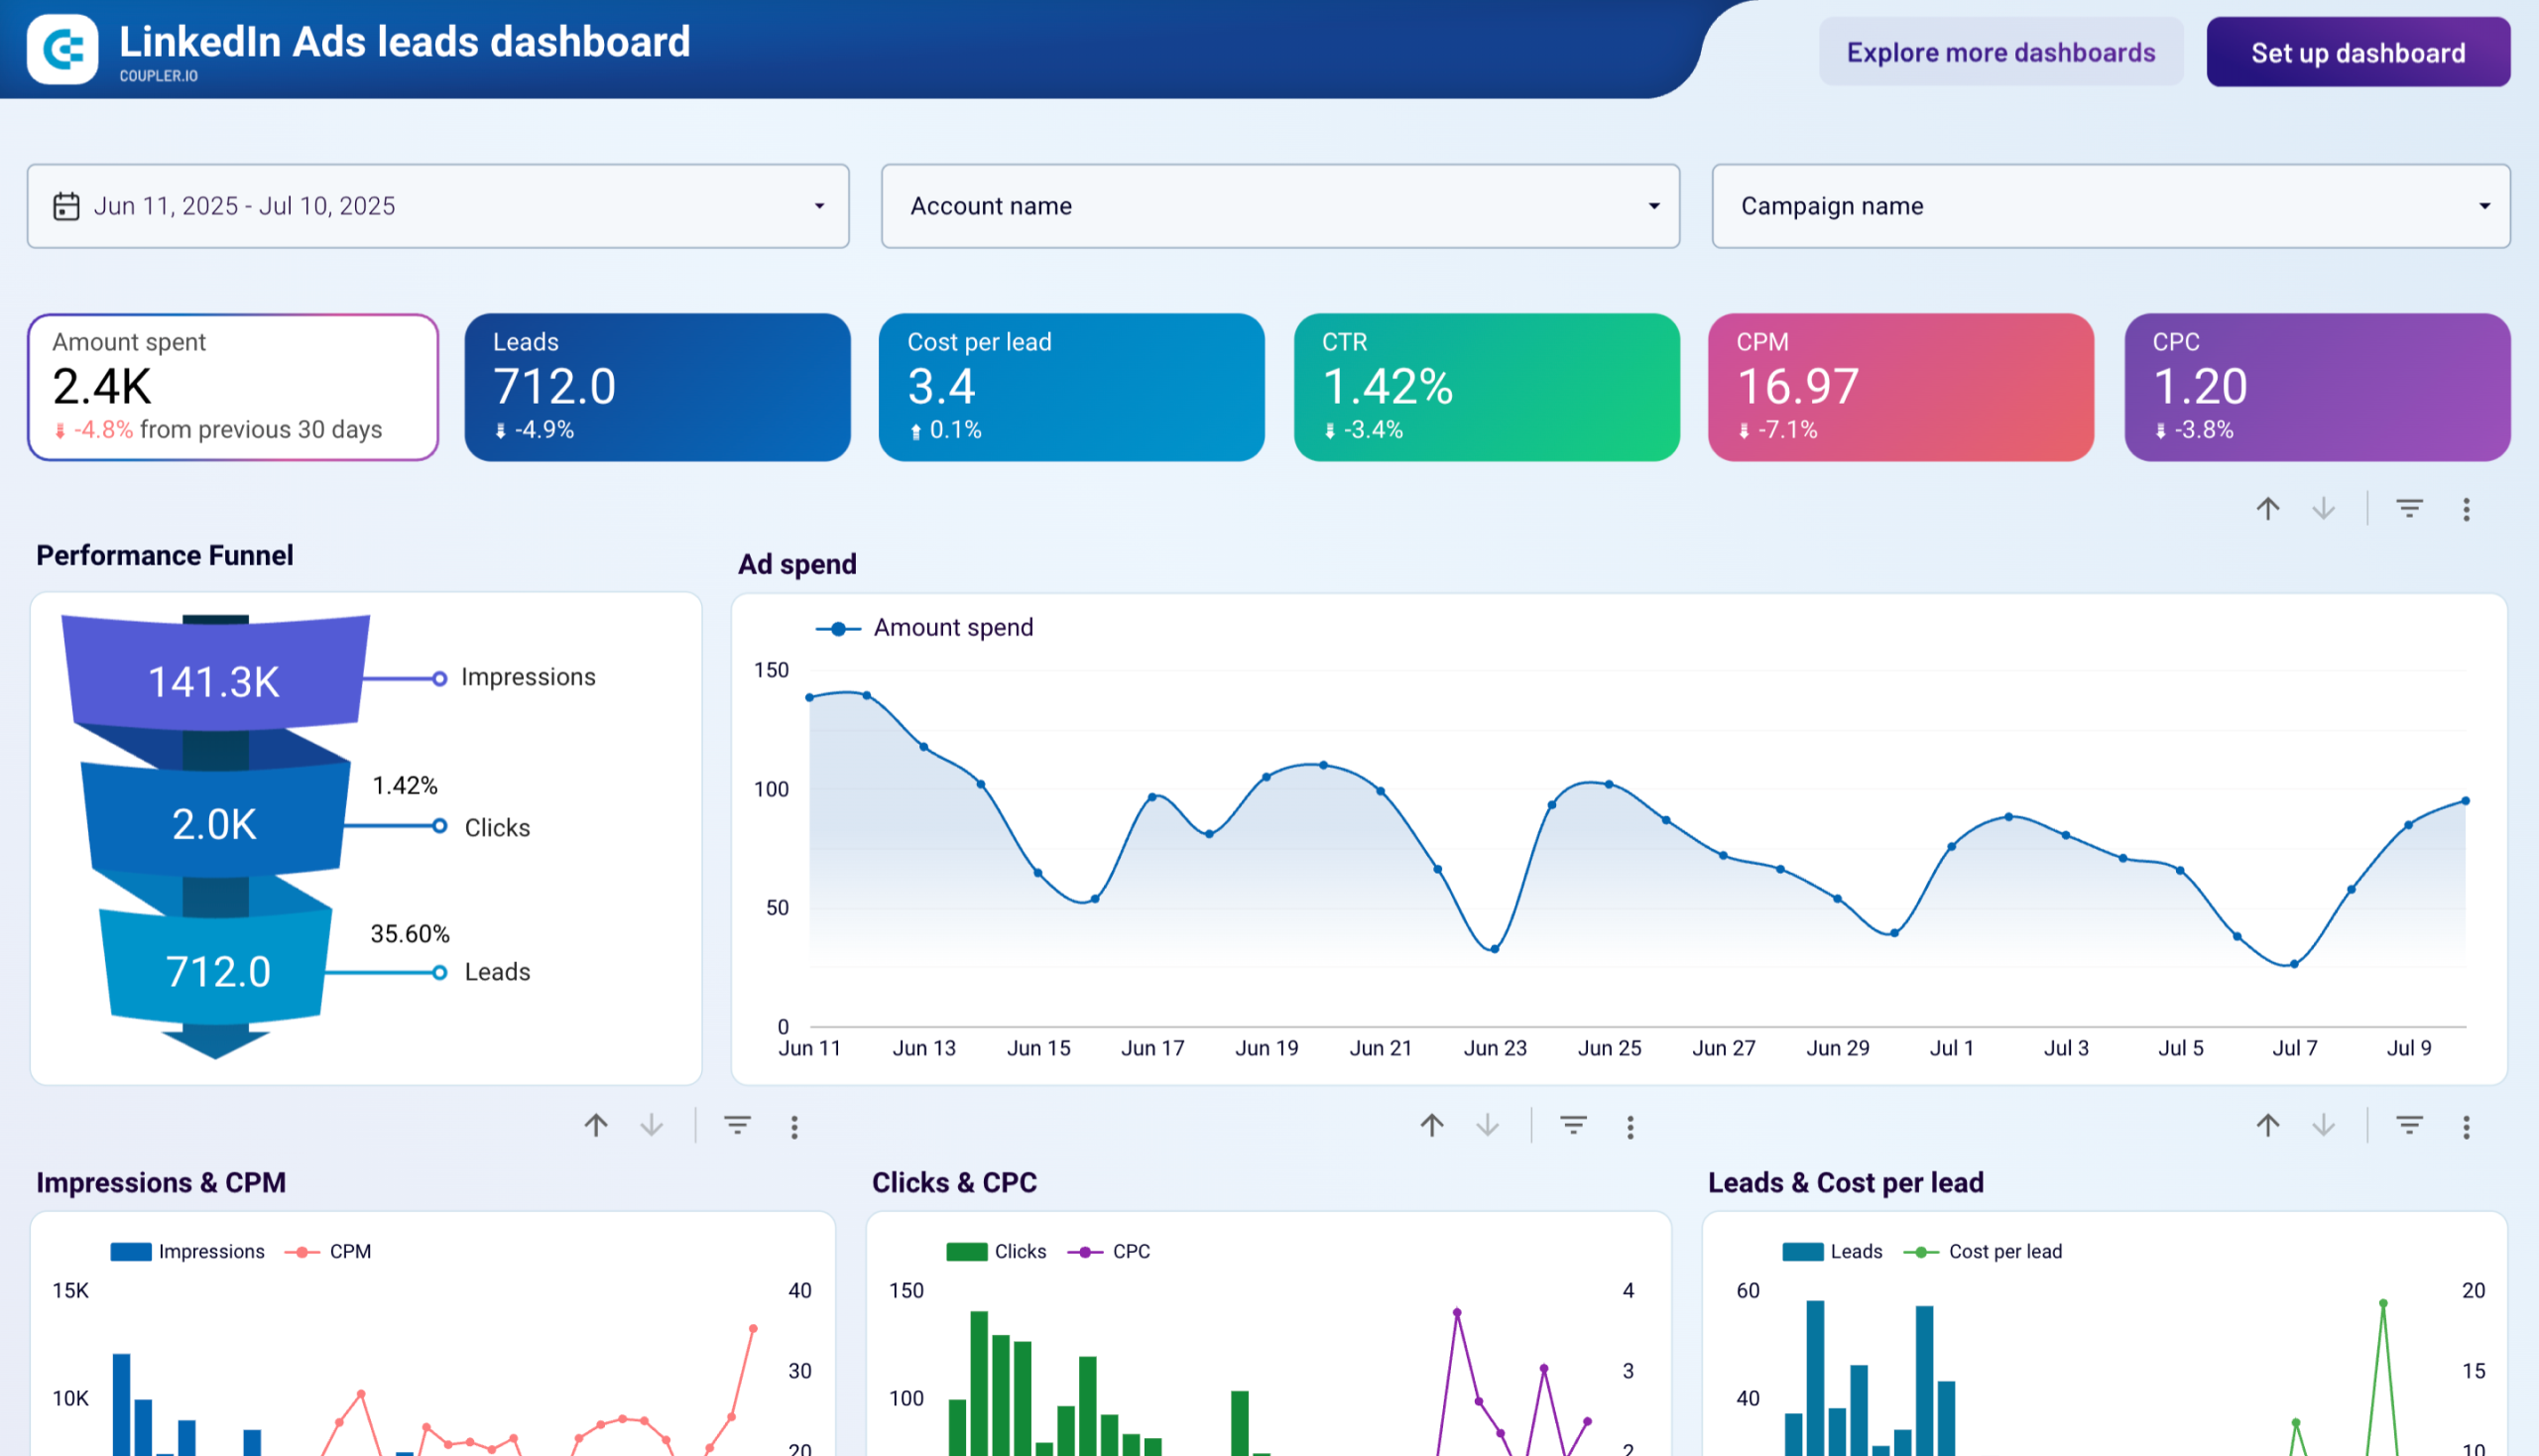
Lead Generation dashboards
Monitor lead acquisition channels and analyze lead quality and conversions with our marketing dashboards. They enable you to derive insights into your lead-generation efforts. Focus on driving high-quality leads and improving conversion rates with a data-driven approach.
Choose your Marketing dashboard template to kick off
What is a marketing dashboard?
Marketing dashboards enable marketers to monitor and optimize their efforts and investments, such as budget allocation, time spending, and channel prioritization. You can make data-driven decisions quickly and share your results with stakeholders effortlessly. Coupler.io offers custom marketing dashboards available as templates. These ready-to-use dashboards eliminate the need to create them from scratch. Simply connect your marketing data sources using the built-in Coupler.io connector, and get your data visualized in minutes.

What should a marketing reporting dashboard include?
An insightful marketing dashboard must provide access to key performance metrics that evaluate the effectiveness of spending and activities. These metrics include ROI, ROAS, customer acquisition costs, conversion rates, and so on. With this data, you can measure the direct business impact of your marketing efforts.
Another vital component is channel analytics. You should see how each marketing channel is performing, including website traffic patterns, social media engagement levels, email campaign results, paid advertising performance, and more. Having all these insights in one place enables you to optimize your channel activities and budget allocation.
For maximum effectiveness, marketing reporting dashboards should provide detailed customer insights and campaign performance metrics. Customer insights should include behavior patterns, demographic data, and engagement history, while campaign performance should track goal completions, attribution data, and audience response rates. Clear visualizations and drill-down options make it easier for you to identify trends and act on insights quickly.
How to create marketing dashboards from templates?
