Instagram business dashboard examples and reporting templates
Consolidate followers, reach, engagement metrics, and profile interactions in one automated view with our Instagram business dashboard template. Connect your Instagram account through Coupler.io to transform raw data into actionable insights that inform your content strategy and audience growth efforts.
Specifically visualized for

Looker Studio

Power BI

Sources used
-
 Instagram Insights
Key metrics:
- Followers
- Views
- Reach
- Engagements
- Likes
- Comments
- Website clicks
- Profile link clicks
Three challenges our Instagram Business dashboard template helps resolve
- Scattered metrics across multiple screens: Instead of navigating through various tabs in Instagram Insights, access all performance data—from views to profile interactions—in one centralized view that saves time and provides context for decision-making..
- Limited visibility into profile interaction patterns: Understand how users engage with your business profile beyond post engagement by tracking website clicks, direction requests, phone calls, and text messages that indicate real purchase intent or customer interest.
- Difficulty identifying content patterns that drive results: Connect post performance with reach metrics and engagement data to quickly spot which content formats, topics, or posting strategies consistently deliver higher visibility and audience interaction across your Instagram presence.
What you will learn from the Instagram business dashboard
You can use this Instagram business dashboard template to monitor your account performance and understand how your audience engages with your content. Simply connect your Instagram Business account through Coupler.io, and you'll learn:
- Which content formats drive the highest reach? Track reach by media type to identify whether photos, videos, carousels, or reels resonate most with your audience. Understanding media-specific performance helps you allocate creative resources toward content formats that maximize visibility and engagement.
- How are followers interacting with your business profile? Monitor the four main interaction types—website clicks, get directions clicks, phone calls, and text messages—to understand how Instagram drives real business actions. These metrics reveal whether your profile effectively converts social engagement into tangible customer actions.
- What demographic groups constitute your audience? Analyze follower demographics to understand the age, gender, and location breakdown of your audience. This insight enables you to create content that speaks directly to your core followers and refine targeting strategies for future growth.
- Which posts generate the most engagement? Review performance analysis of all posts showing reach, comments, likes, and shares in one table. Identifying top-performing content helps you replicate successful approaches and understand what topics, formats, or posting times work best for your audience.
What reports you get with our Instagram Business dashboards
A meaningful Instagram business dashboard should consolidate engagement metrics, audience insights, and business conversion data to provide a complete view of your account performance. While native Instagram Insights offers basic analytics, an automated dashboard brings together multiple data points that reveal patterns, trends, and opportunities for growth. The following reports transform raw Instagram data into strategic insights.
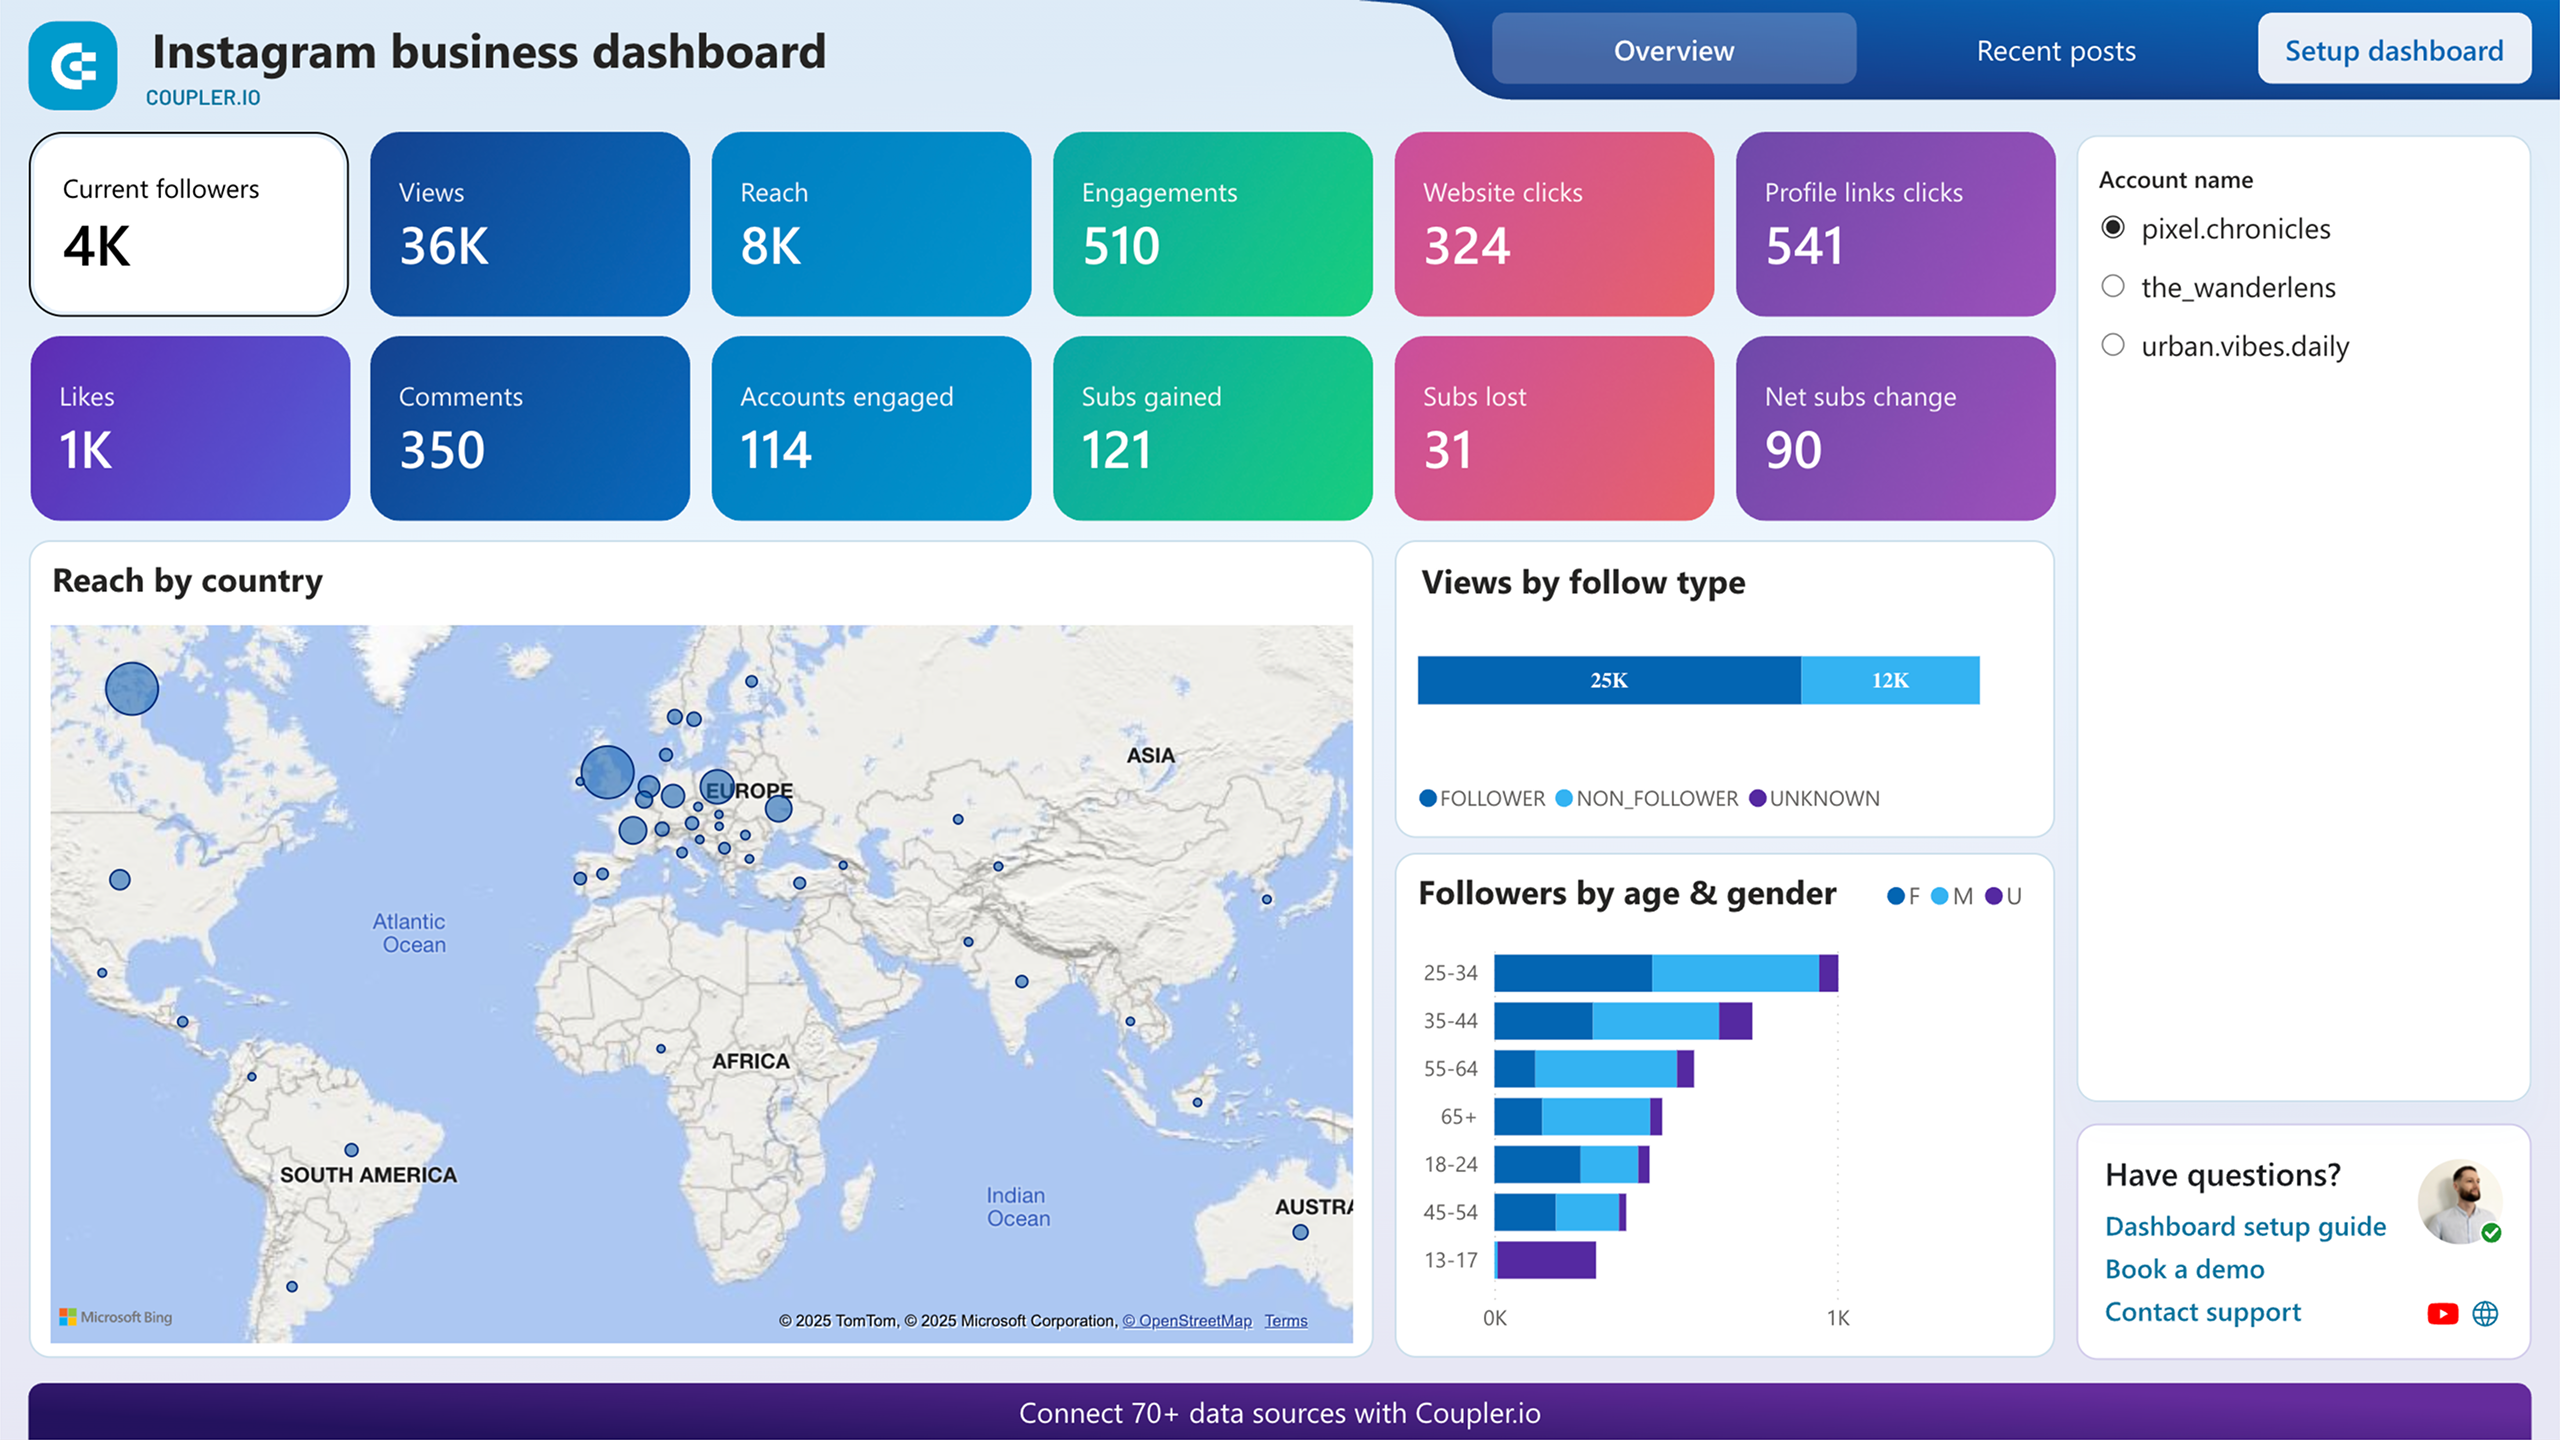
Account performance overview with key metrics
The Instagram Insights dashboard displays all critical metrics in one view: followers, reach, likes, shares, comments, and profile interactions, including website clicks, get direction clicks, phone call clicks, and text message clicks. This consolidated scorecard eliminates the need to navigate through multiple screens in Instagram's native interface. By presenting total interactions alongside individual metric breakdowns, you can quickly assess overall account health and identify metrics that need attention. The overview helps answer fundamental questions about account growth velocity, content visibility, and audience engagement levels without requiring complex data analysis.
Follower demographics breakdown
Understanding audience composition enables targeted content strategies that resonate with your core followers. The follower demographics chart visualizes your audience by age, gender, and location, revealing who actually engages with your content versus who you think you're reaching. This report helps identify gaps between your intended audience and actual followers, informing both content creation and paid advertising targeting decisions. For businesses running location-based promotions or age-specific product lines, demographic data transforms from interesting statistics into actionable intelligence that drives campaign strategy and resource allocation.
Profile interaction dynamics by click type
The profile interaction report tracks four business-critical actions: website clicks, get directions requests, phone calls, and text messages. Unlike post engagement metrics that measure social activity, these interactions indicate genuine business interest and purchase intent. Monitoring interaction dynamics over time reveals which call-to-action placements work best, when users are most likely to take business actions, and how profile optimization affects conversion rates. This report bridges the gap between social engagement and business outcomes, demonstrating Instagram's tangible impact on customer acquisition and revenue generation beyond vanity metrics like likes and comments.
Content performance analysis by media type and individual posts
Reach by media type shows performance differences between photos, videos, carousels, and reels, helping you allocate creative resources toward formats that maximize visibility. The detailed post performance table provides reach, comments, likes, shares, and engagement rate for each piece of content, enabling pattern recognition across successful posts. This analysis answers critical questions about content strategy: Do longer captions perform better? Which topics drive the most saves? What posting times generate higher reach? By connecting content characteristics with performance outcomes, you can replicate successful approaches and eliminate underperforming tactics based on actual data rather than assumptions.
How to create an Instagram Business reporting dashboard?
Step 1
1
Go to the tab where you can see instructions on how to set up the Instagram Business dashboard template.
Step 2
2
Click the button to set up the Coupler.io connector for your Instagram Business account.
Step 3
3
Follow the instructions to prepare and load data to the dashboard.
Step 4
4
Go back to Coupler.io to configure the schedule for the data refresh of your Instagram Business reporting dashboard.
