GitHub Connector
Integrate GitHub with spreadsheets, data warehouses, or BI tools to build up a reliable reporting system for efficient decision-making. Get an all-in-one solution to gather, transform, understand and automate your GitHub data without any hassle.


How to set up your GitHub integration
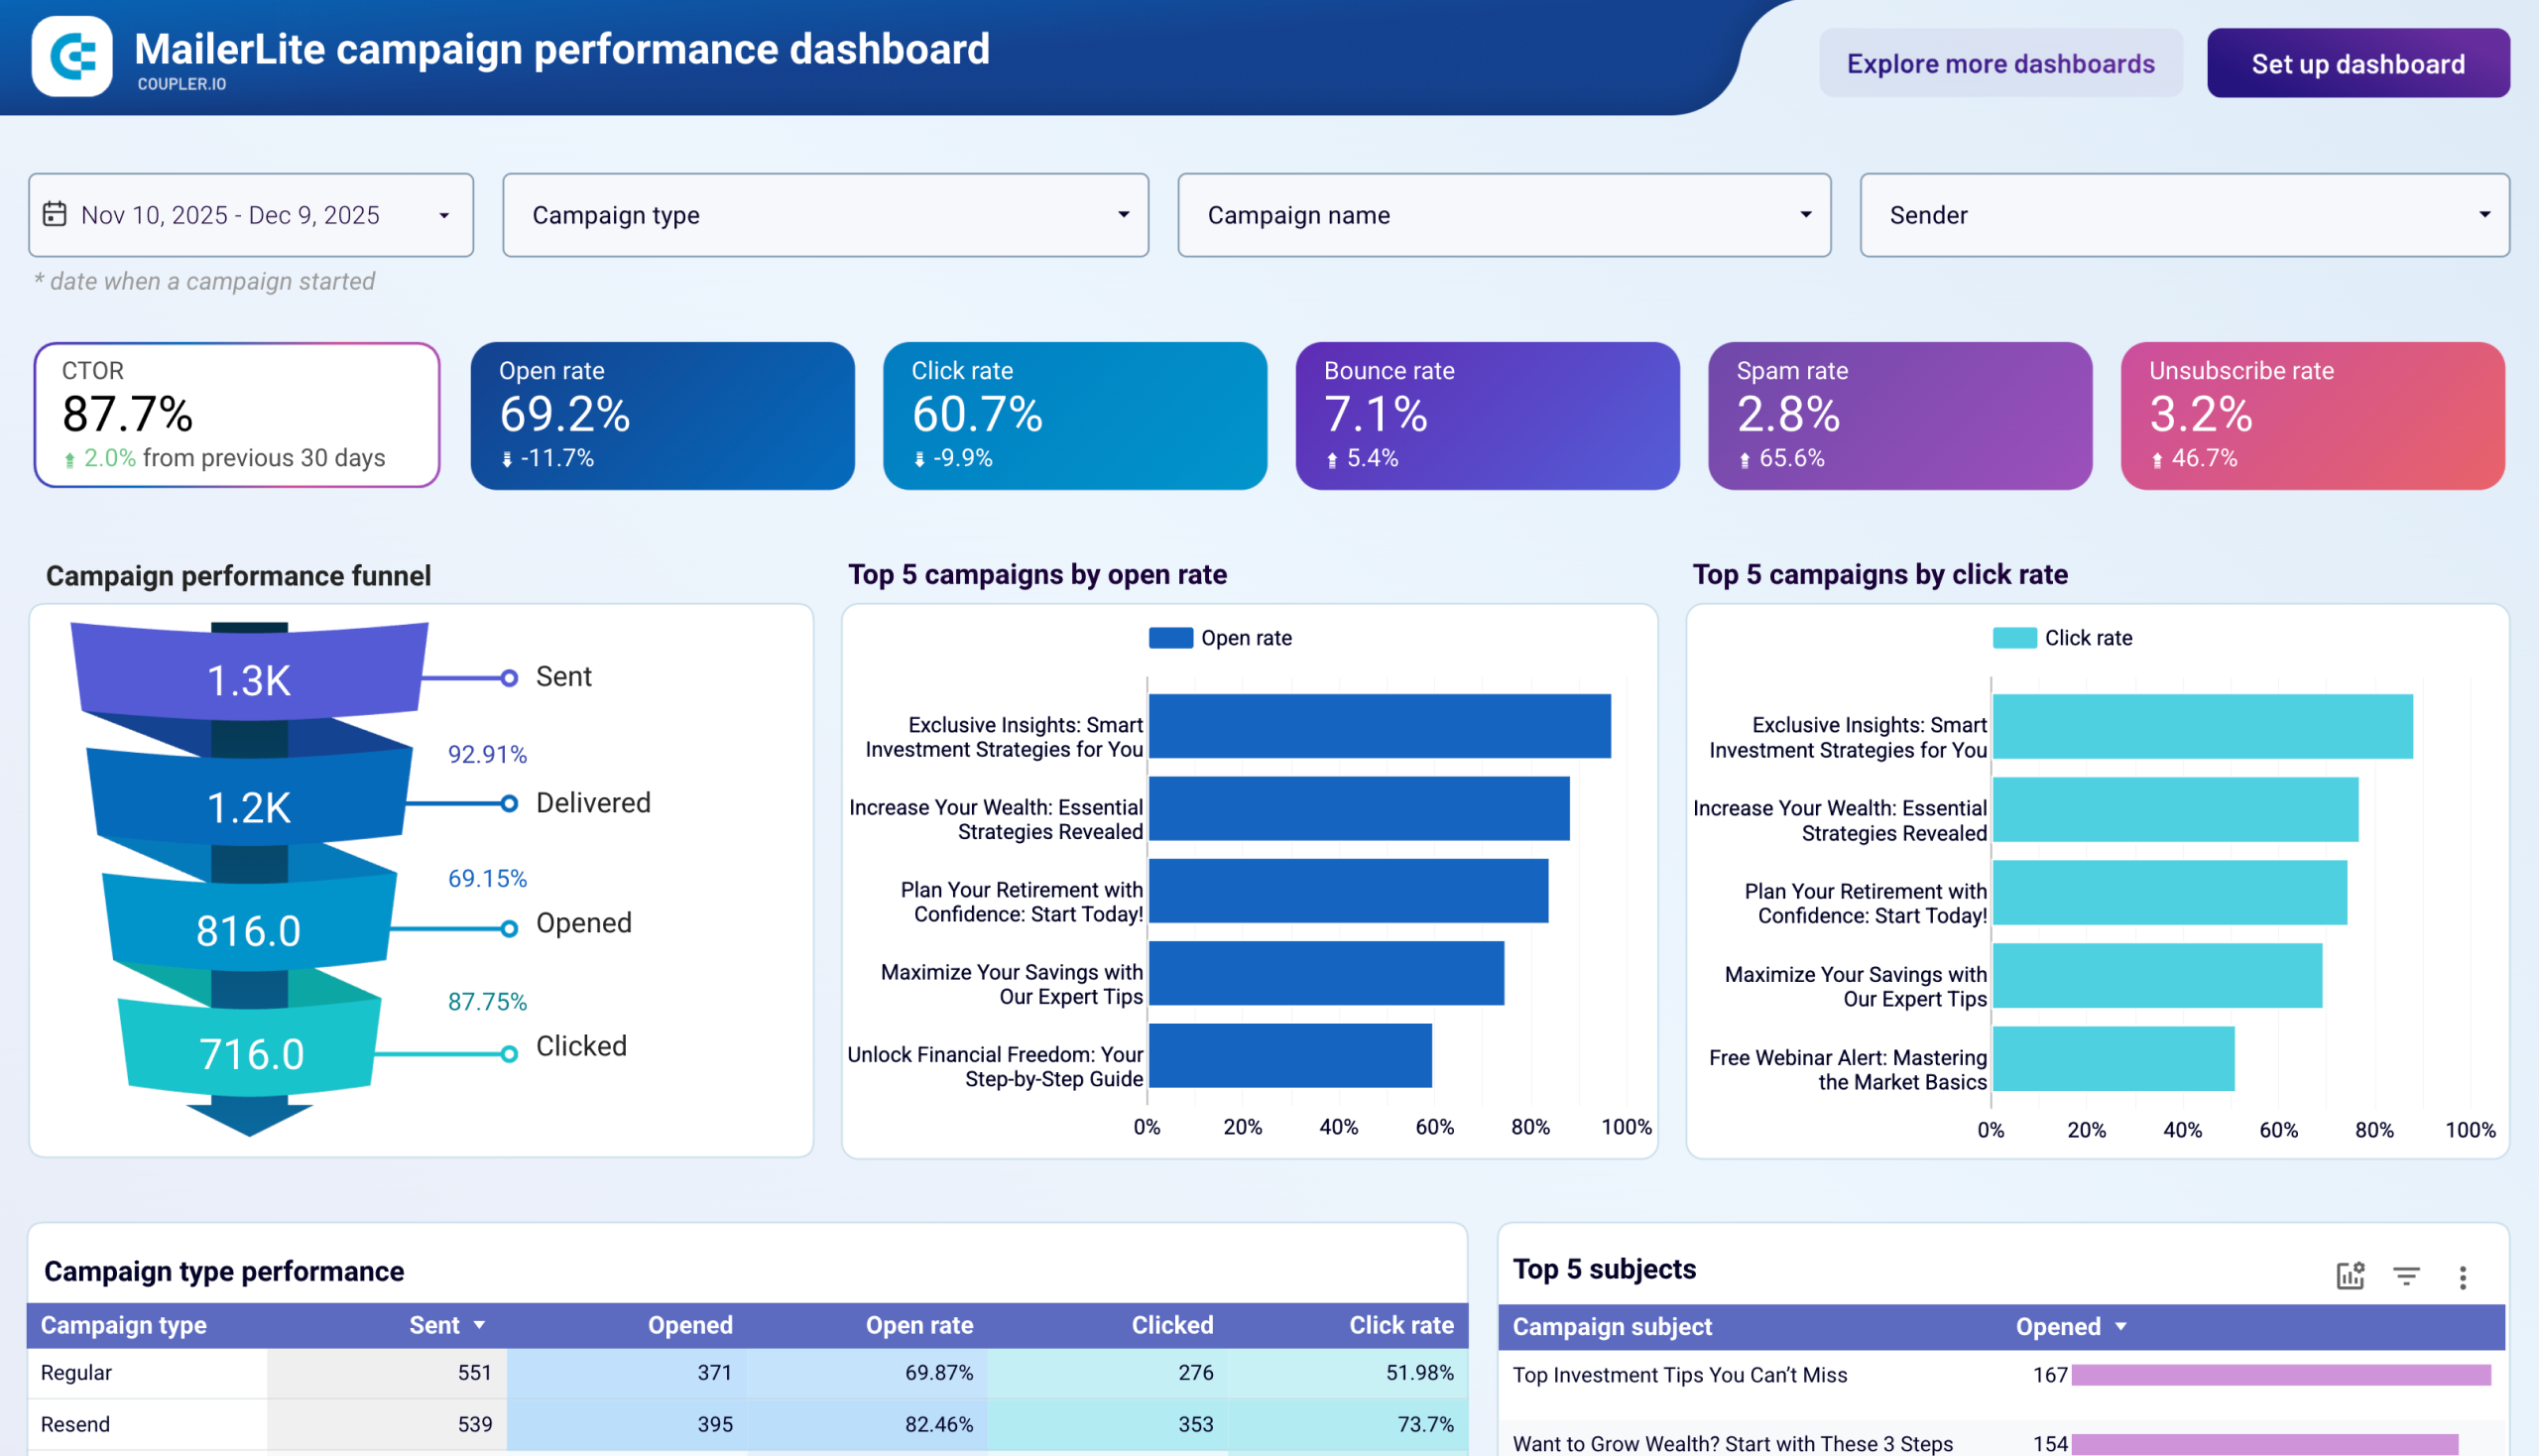
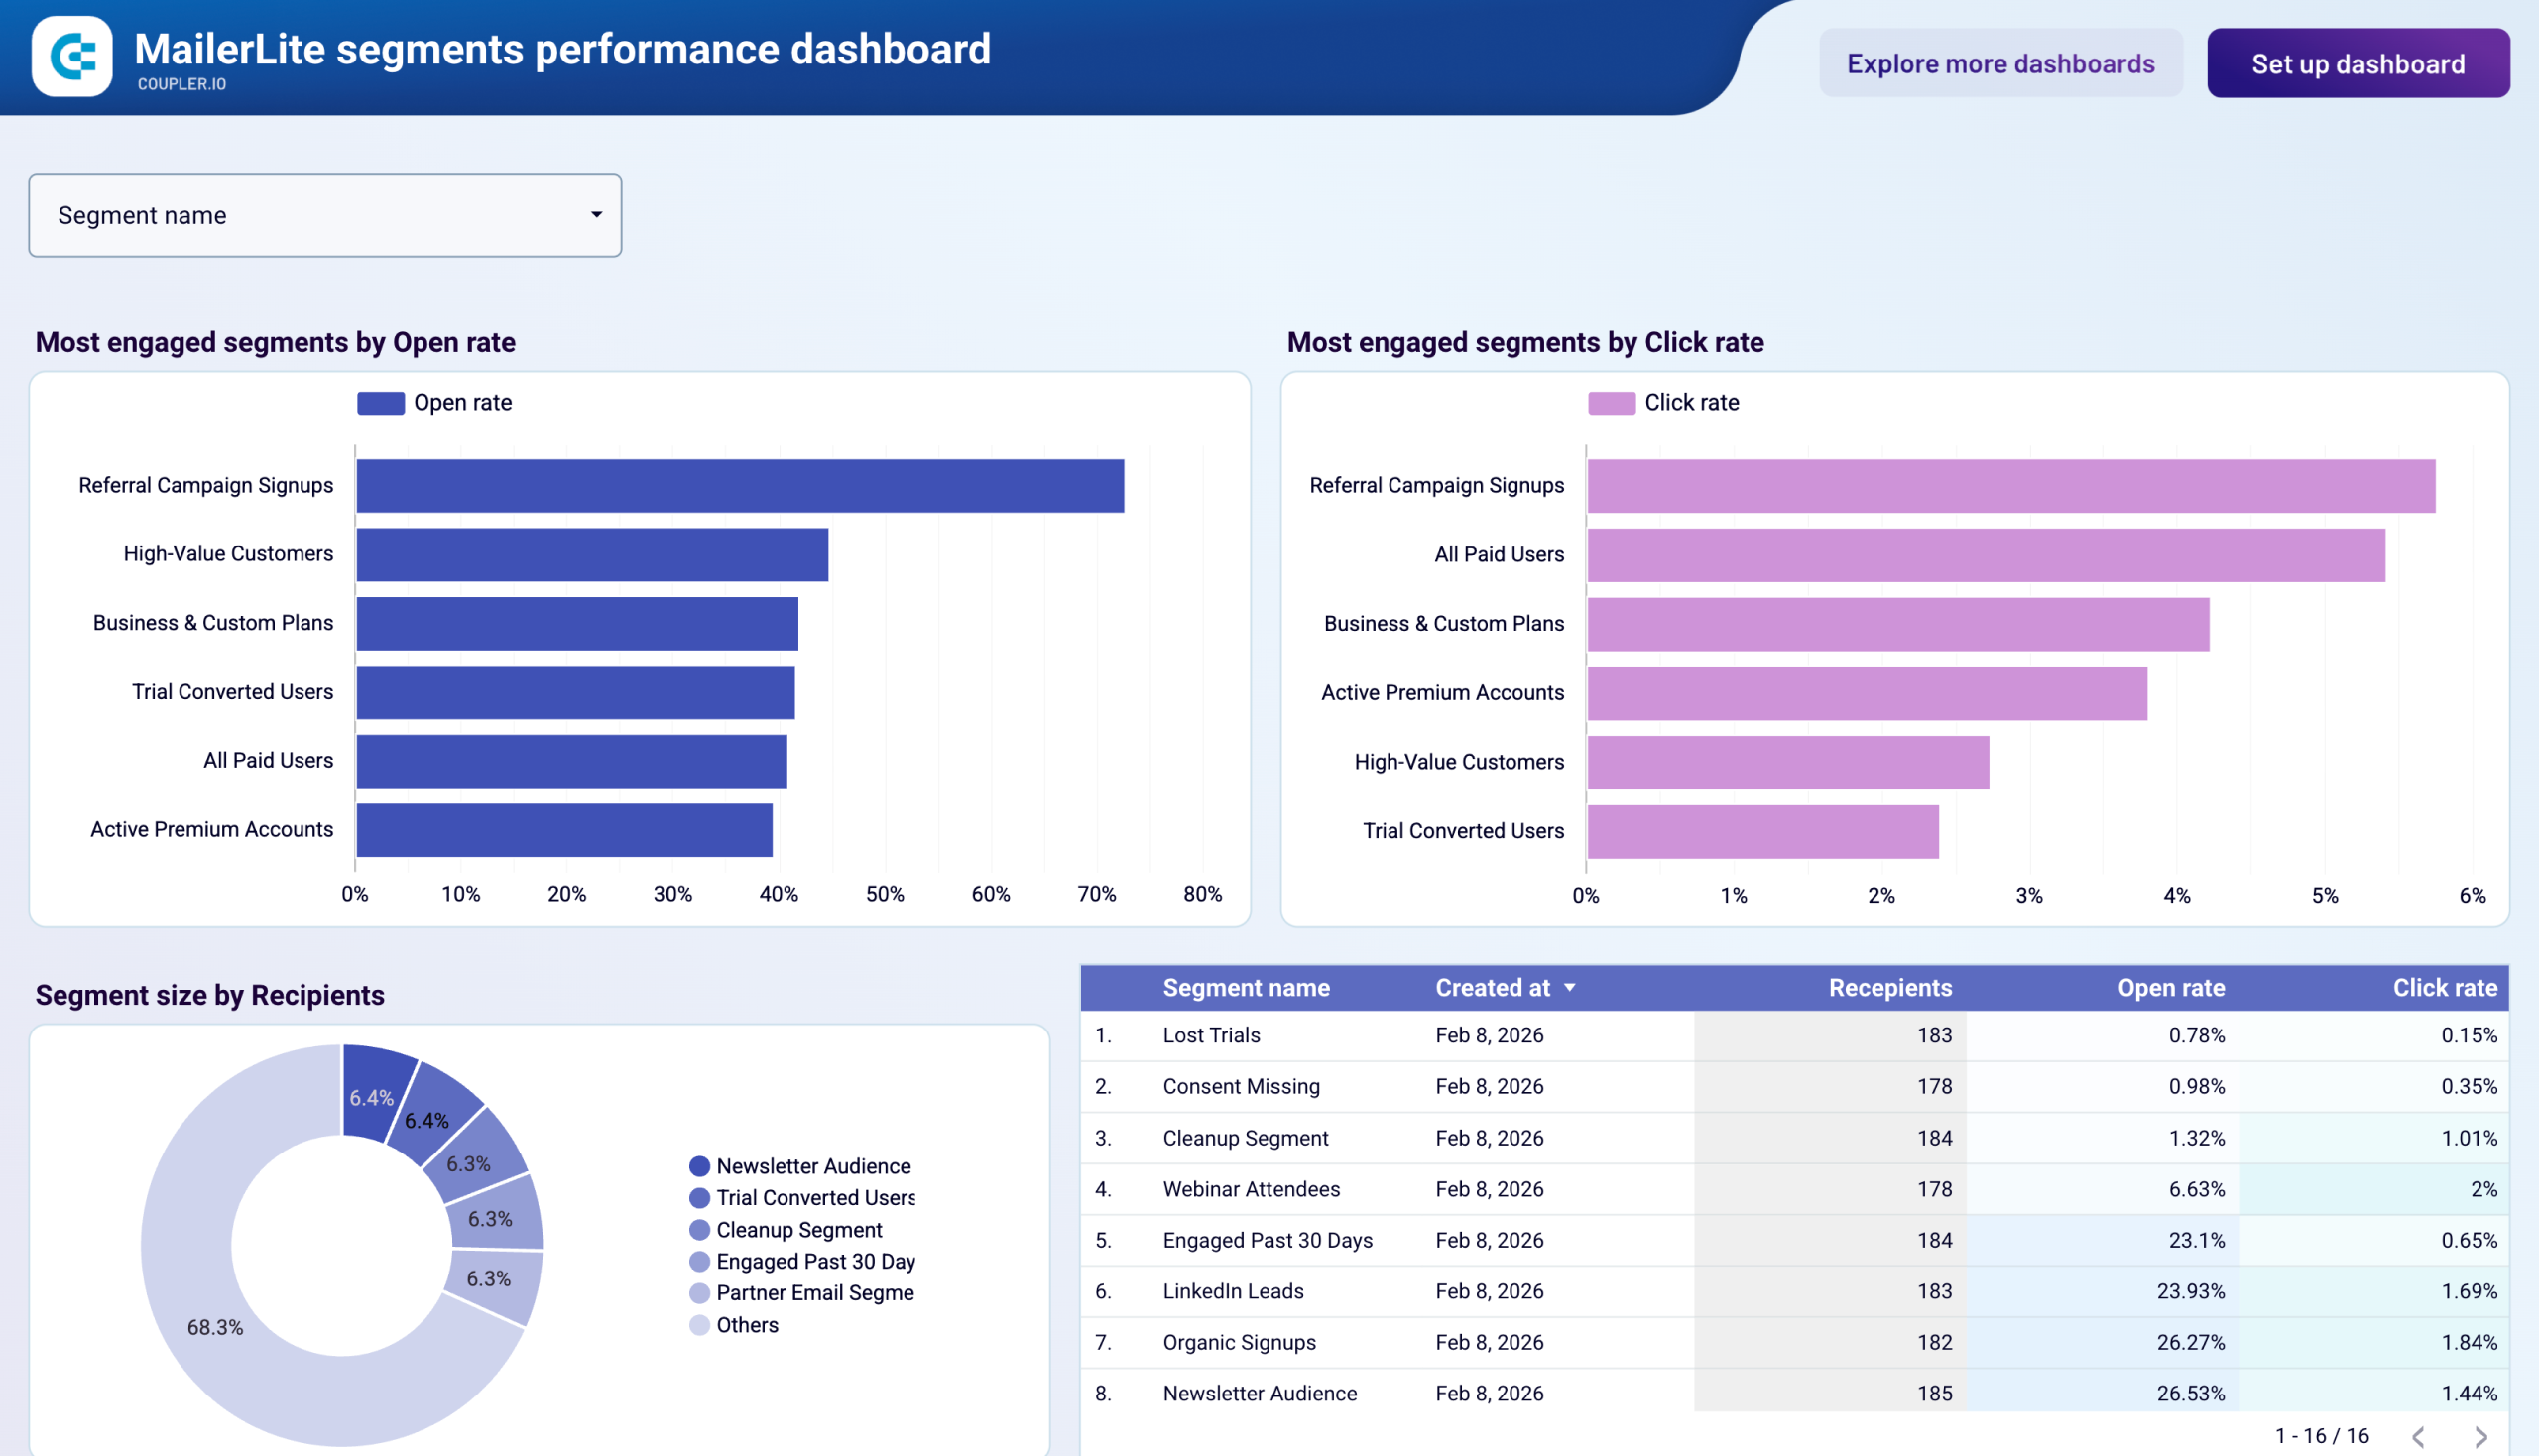
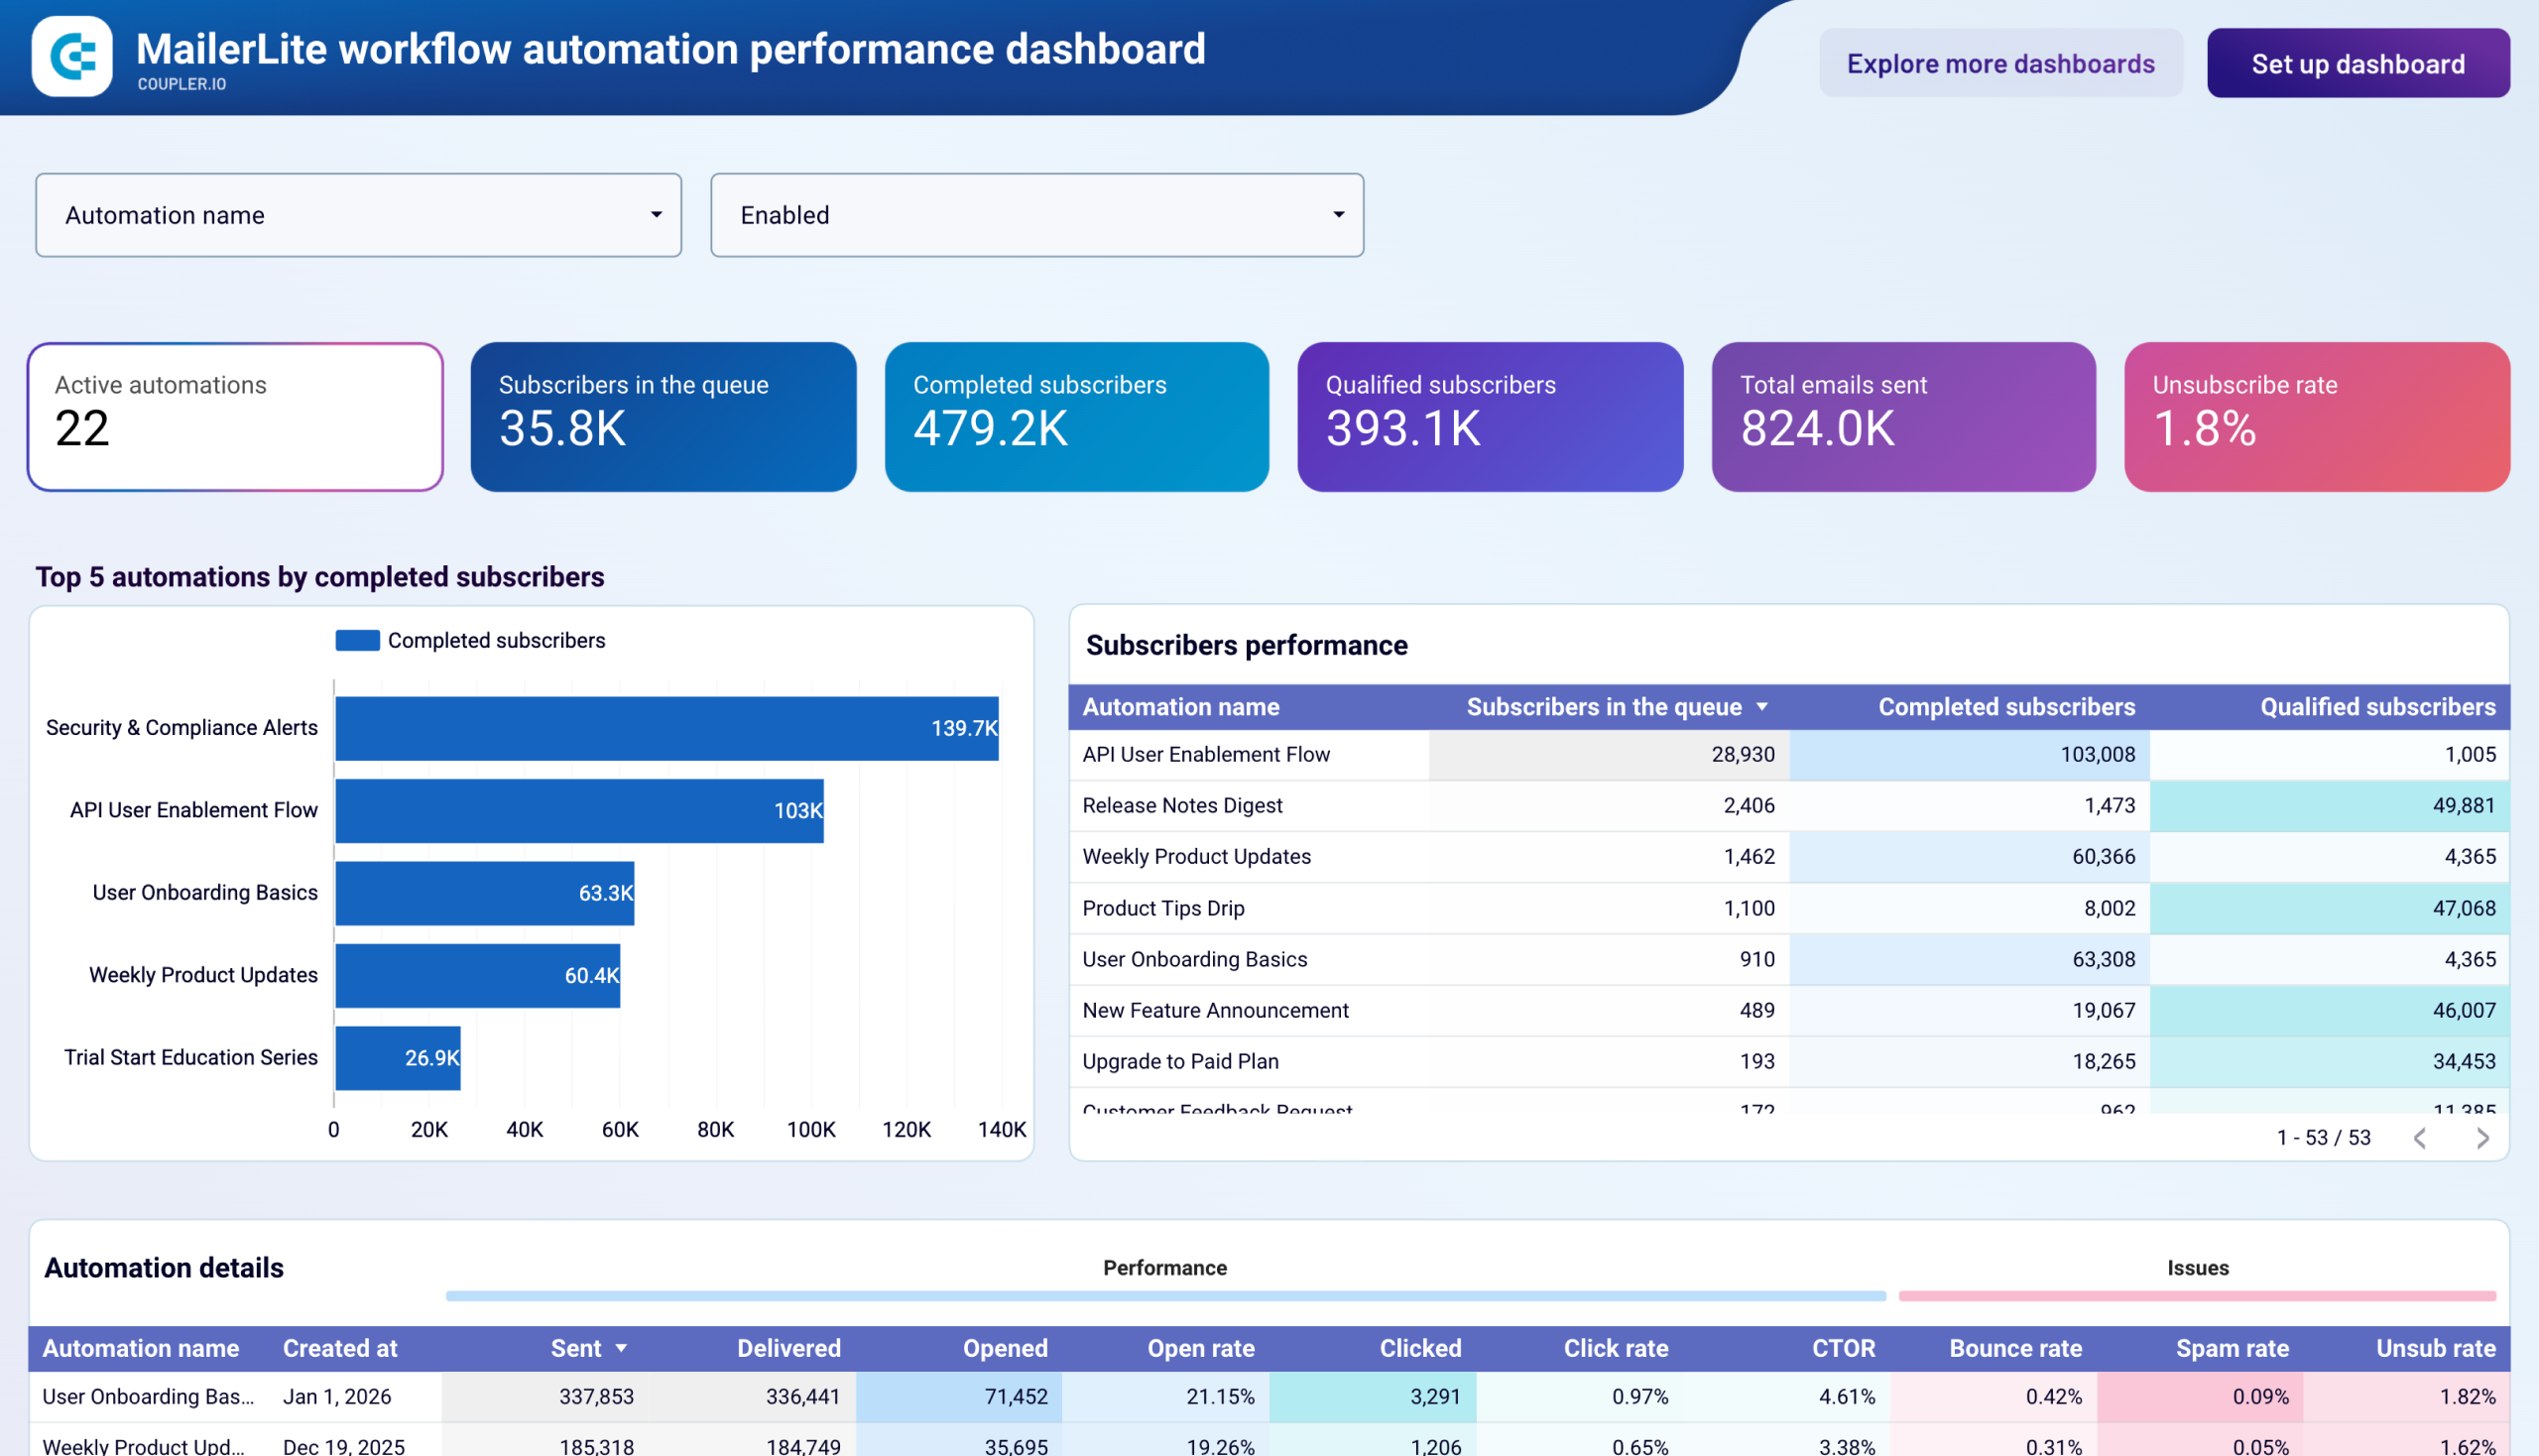
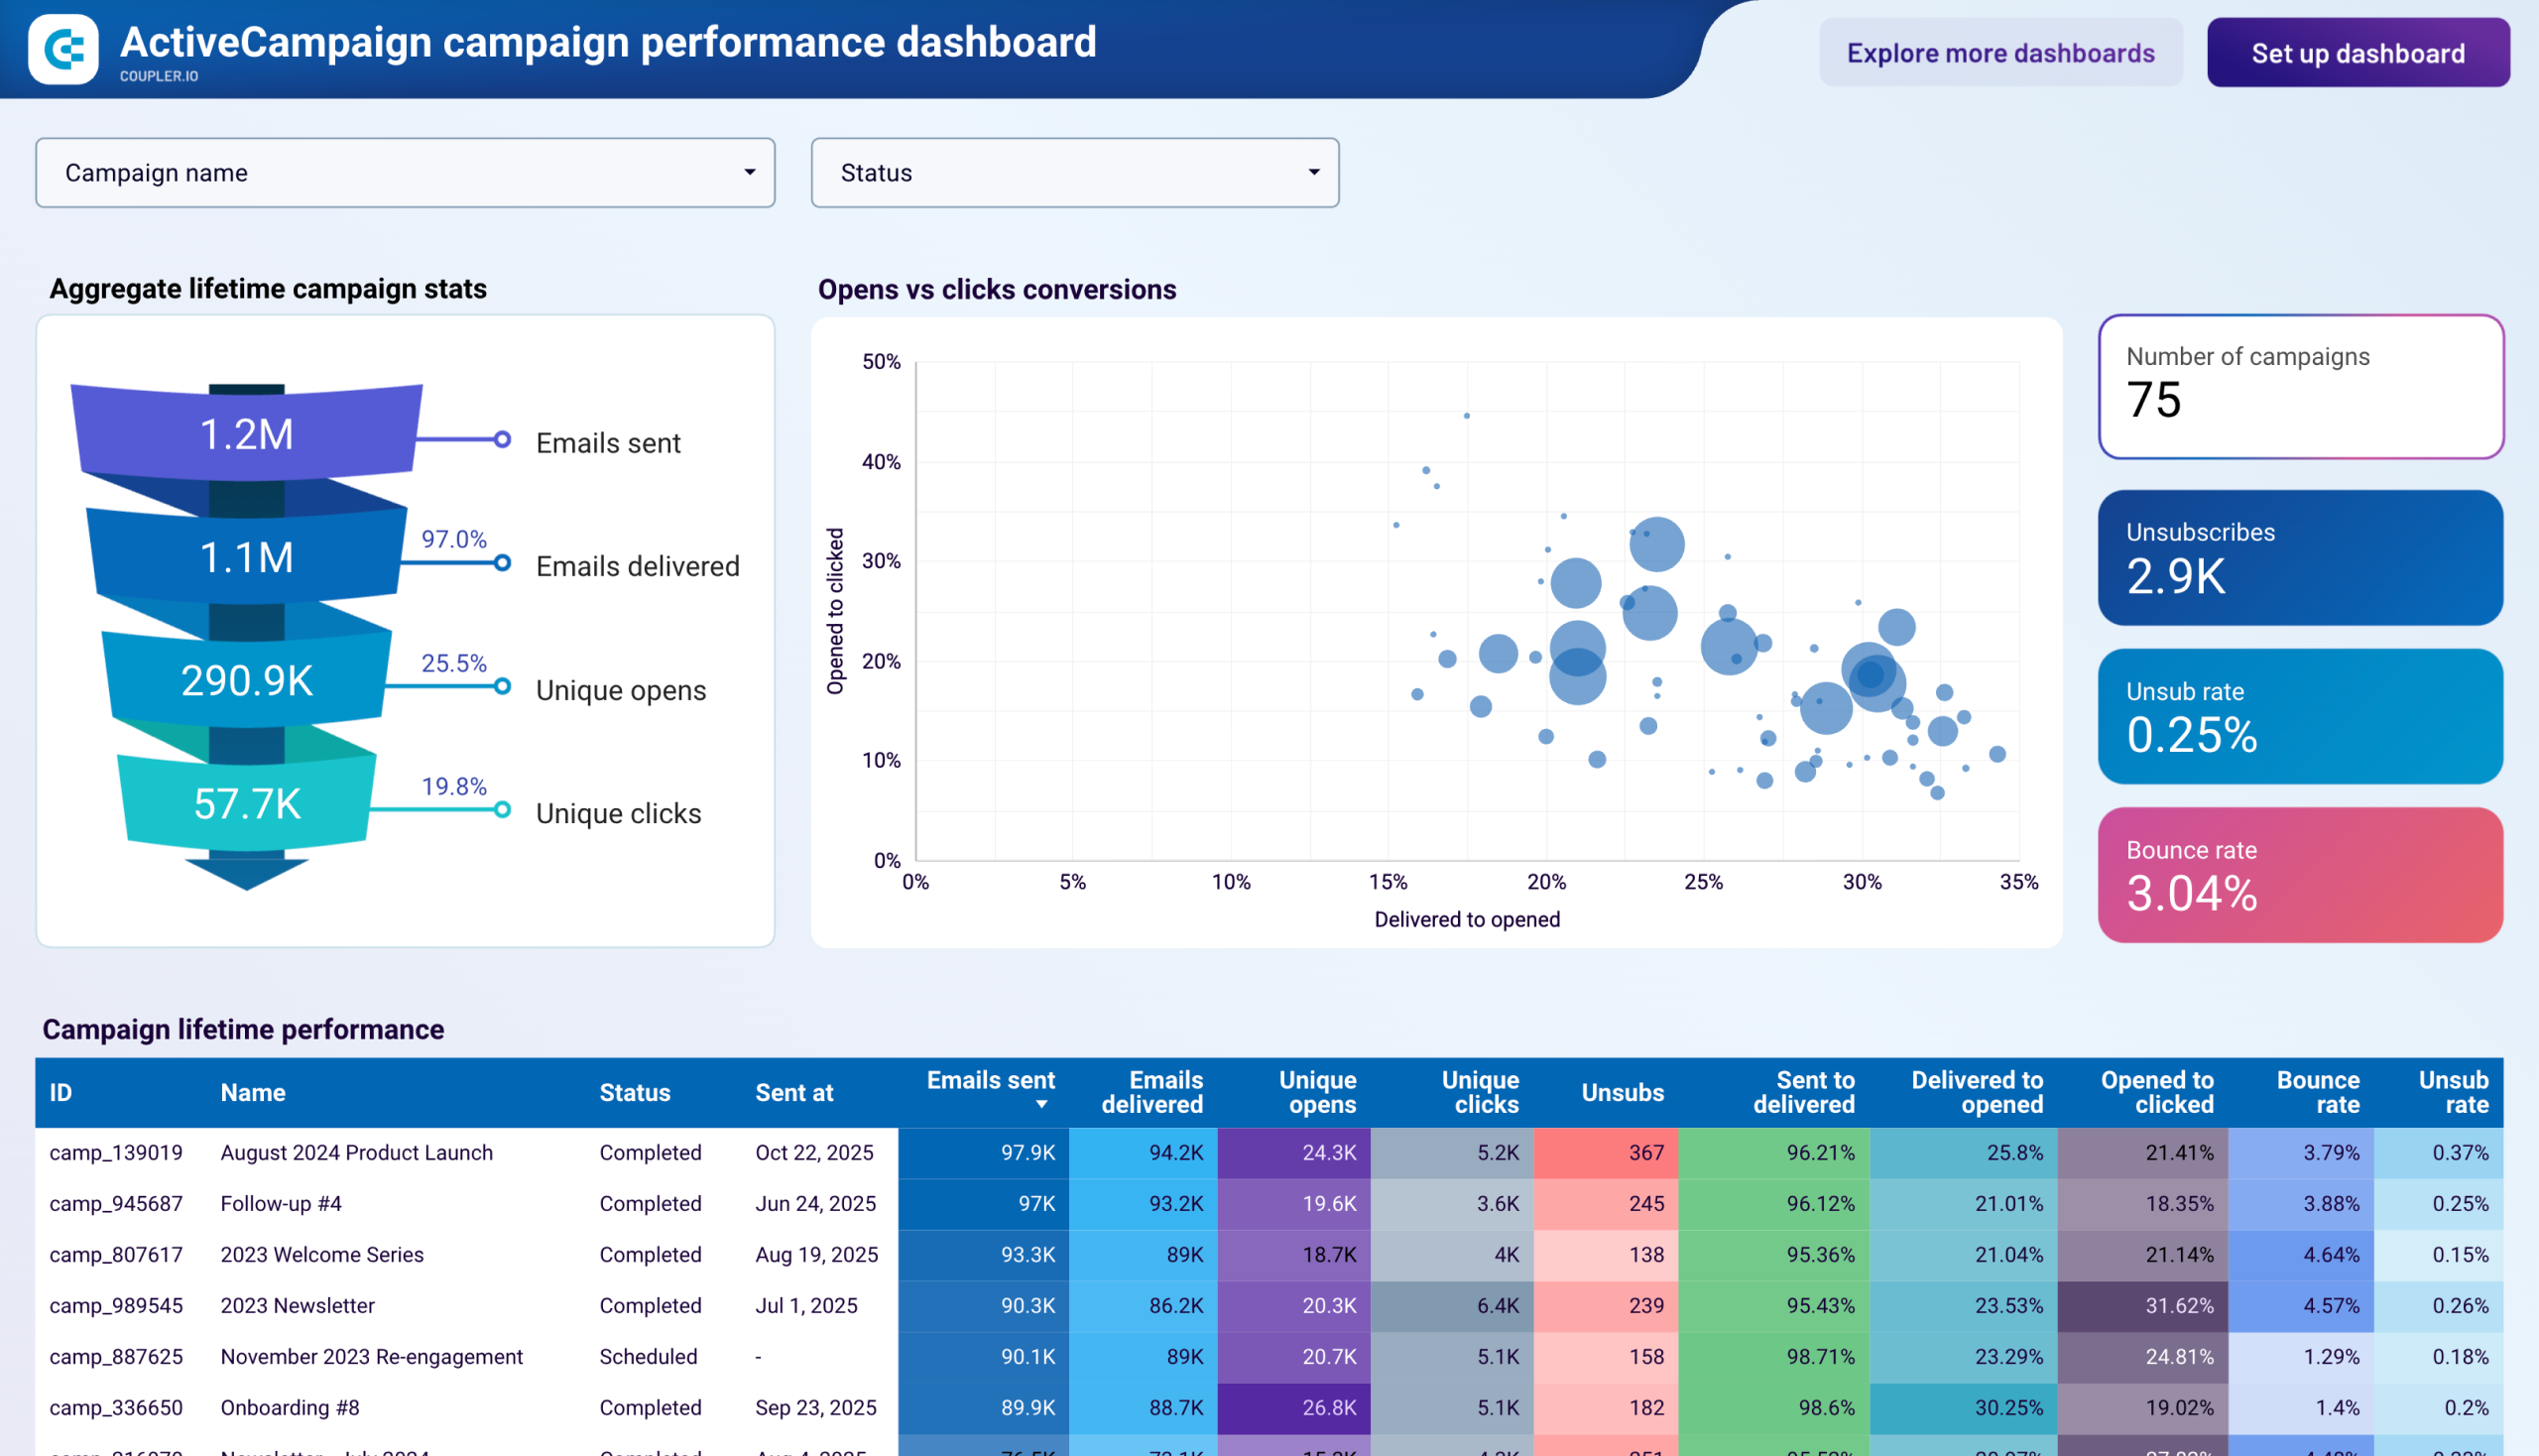
Analyze your GitHub data easier
Collect data on a scheduled basis and blend it with information exported from other applications.

Manage and create new columns, apply filters, and perform other data transformations before loading it into the destination.

Get analysis-ready data with Coupler.io and build dashboards using Looker Studio or other BI tools in minutes.

Schedule the refresh of your GitHub data and build triggered automation sequences using incoming and outgoing webhooks.

Integrate GitHub with these destinations


What data you can export from GitHub?
-
Issue timeline eventsTimeline events for issues including status changes, comments, and other activities
-
AssigneesUsers who can be assigned to issues and pull requests in repositories
-
BranchesRepository branches including default and feature branches
-
CollaboratorsUsers with collaborative access to repositories
-
CommentsComments on issues and commits in repositories
-
Commit comment reactionsReactions (emoji responses) to commit comments
-
Commit commentsComments made on specific commits
-
CommitsIndividual code commits with changes, authors, and metadata
-
Contributor activitiesActivity statistics for repository contributors
-
DeploymentsDeployment records and their status information
-
EventsRepository events including pushes, pulls, and other activities
-
Issue comment reactionsReactions (emoji responses) to issue comments
-
Issue eventsEvents related to issues such as assignments, labels, and status changes
-
Issue labelsLabels used to categorize and organize issues
-
Issue milestonesMilestones that group issues for project tracking
-
Issue reactionsReactions (emoji responses) to issues
-
IssuesBug reports, feature requests, and other tracked items
-
OrganizationsGitHub organizations and their settings
-
Project cardsCards within GitHub project boards
-
Project columnsColumns that organize project boards
-
ProjectsClassic GitHub project boards for organizing work
-
Pull request comment reactionsReactions (emoji responses) to pull request comments
-
Pull request commitsIndividual commits within pull requests
-
Pull request statsStatistics and metrics for pull requests
-
Projects v2sNew GitHub Projects with enhanced features and views
-
Pull requestsCode change proposals for review and merging
-
ReleasesTagged releases with notes and attached assets
-
RepositoriesCode repositories with their settings and metadata
-
Review commentsComments made during pull request code reviews
-
ReviewsCode reviews submitted for pull requests
-
StargazersUsers who have starred repositories
-
TagsGit tags marking specific points in repository history
-
TeamsGroups of organization members with shared permissions
-
Team membersIndividual members belonging to organization teams
-
UsersGitHub user accounts and their profile information
-
WorkflowsGitHub Actions workflow definitions
-
Workflow runsExecutions of GitHub Actions workflows
-
Workflow jobsIndividual jobs within workflow runs
-
Team membershipsMembership details linking users to teams
Coupler.io made it easy to create dashboards and reports from different data sources. The sync is reliable and the user experience is amazing.

Take your reporting to the next level
 Sign Up with Google
 Sign Up with MICROSOFT
 SIGN UP WITH EMAIL
By signing up to Coupler.io, you agree to our Privacy Policy and Terms of Use.
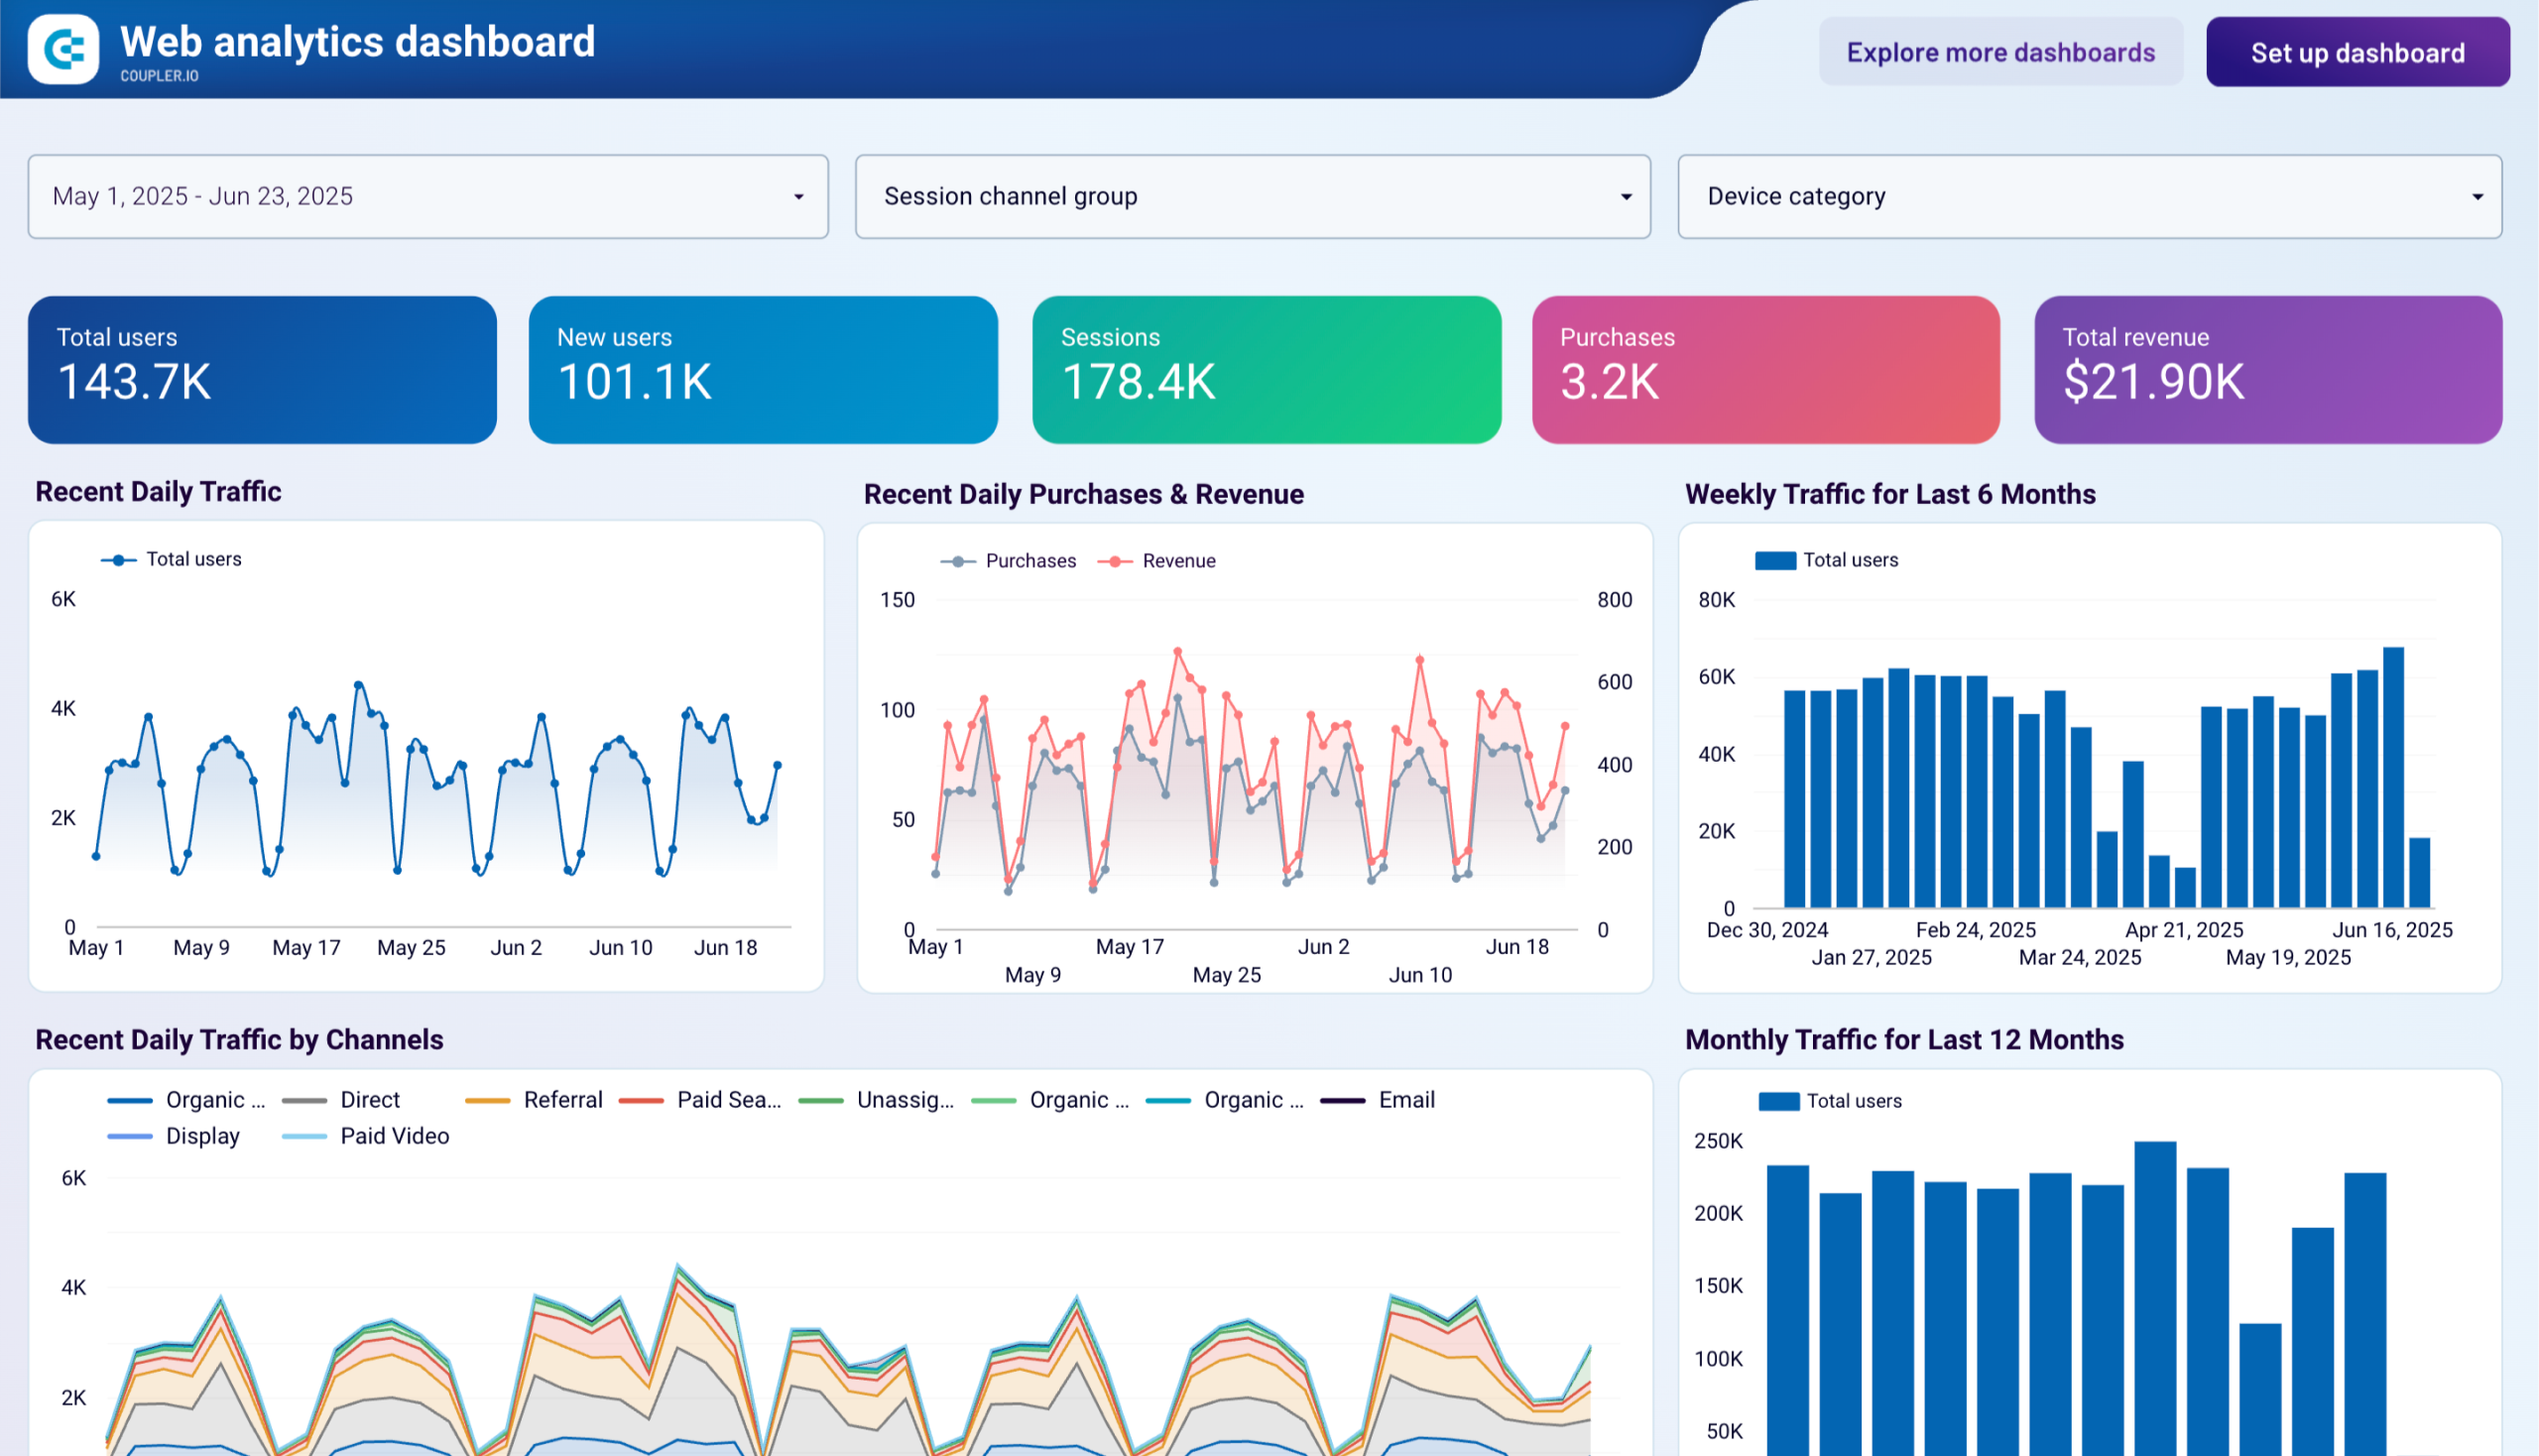
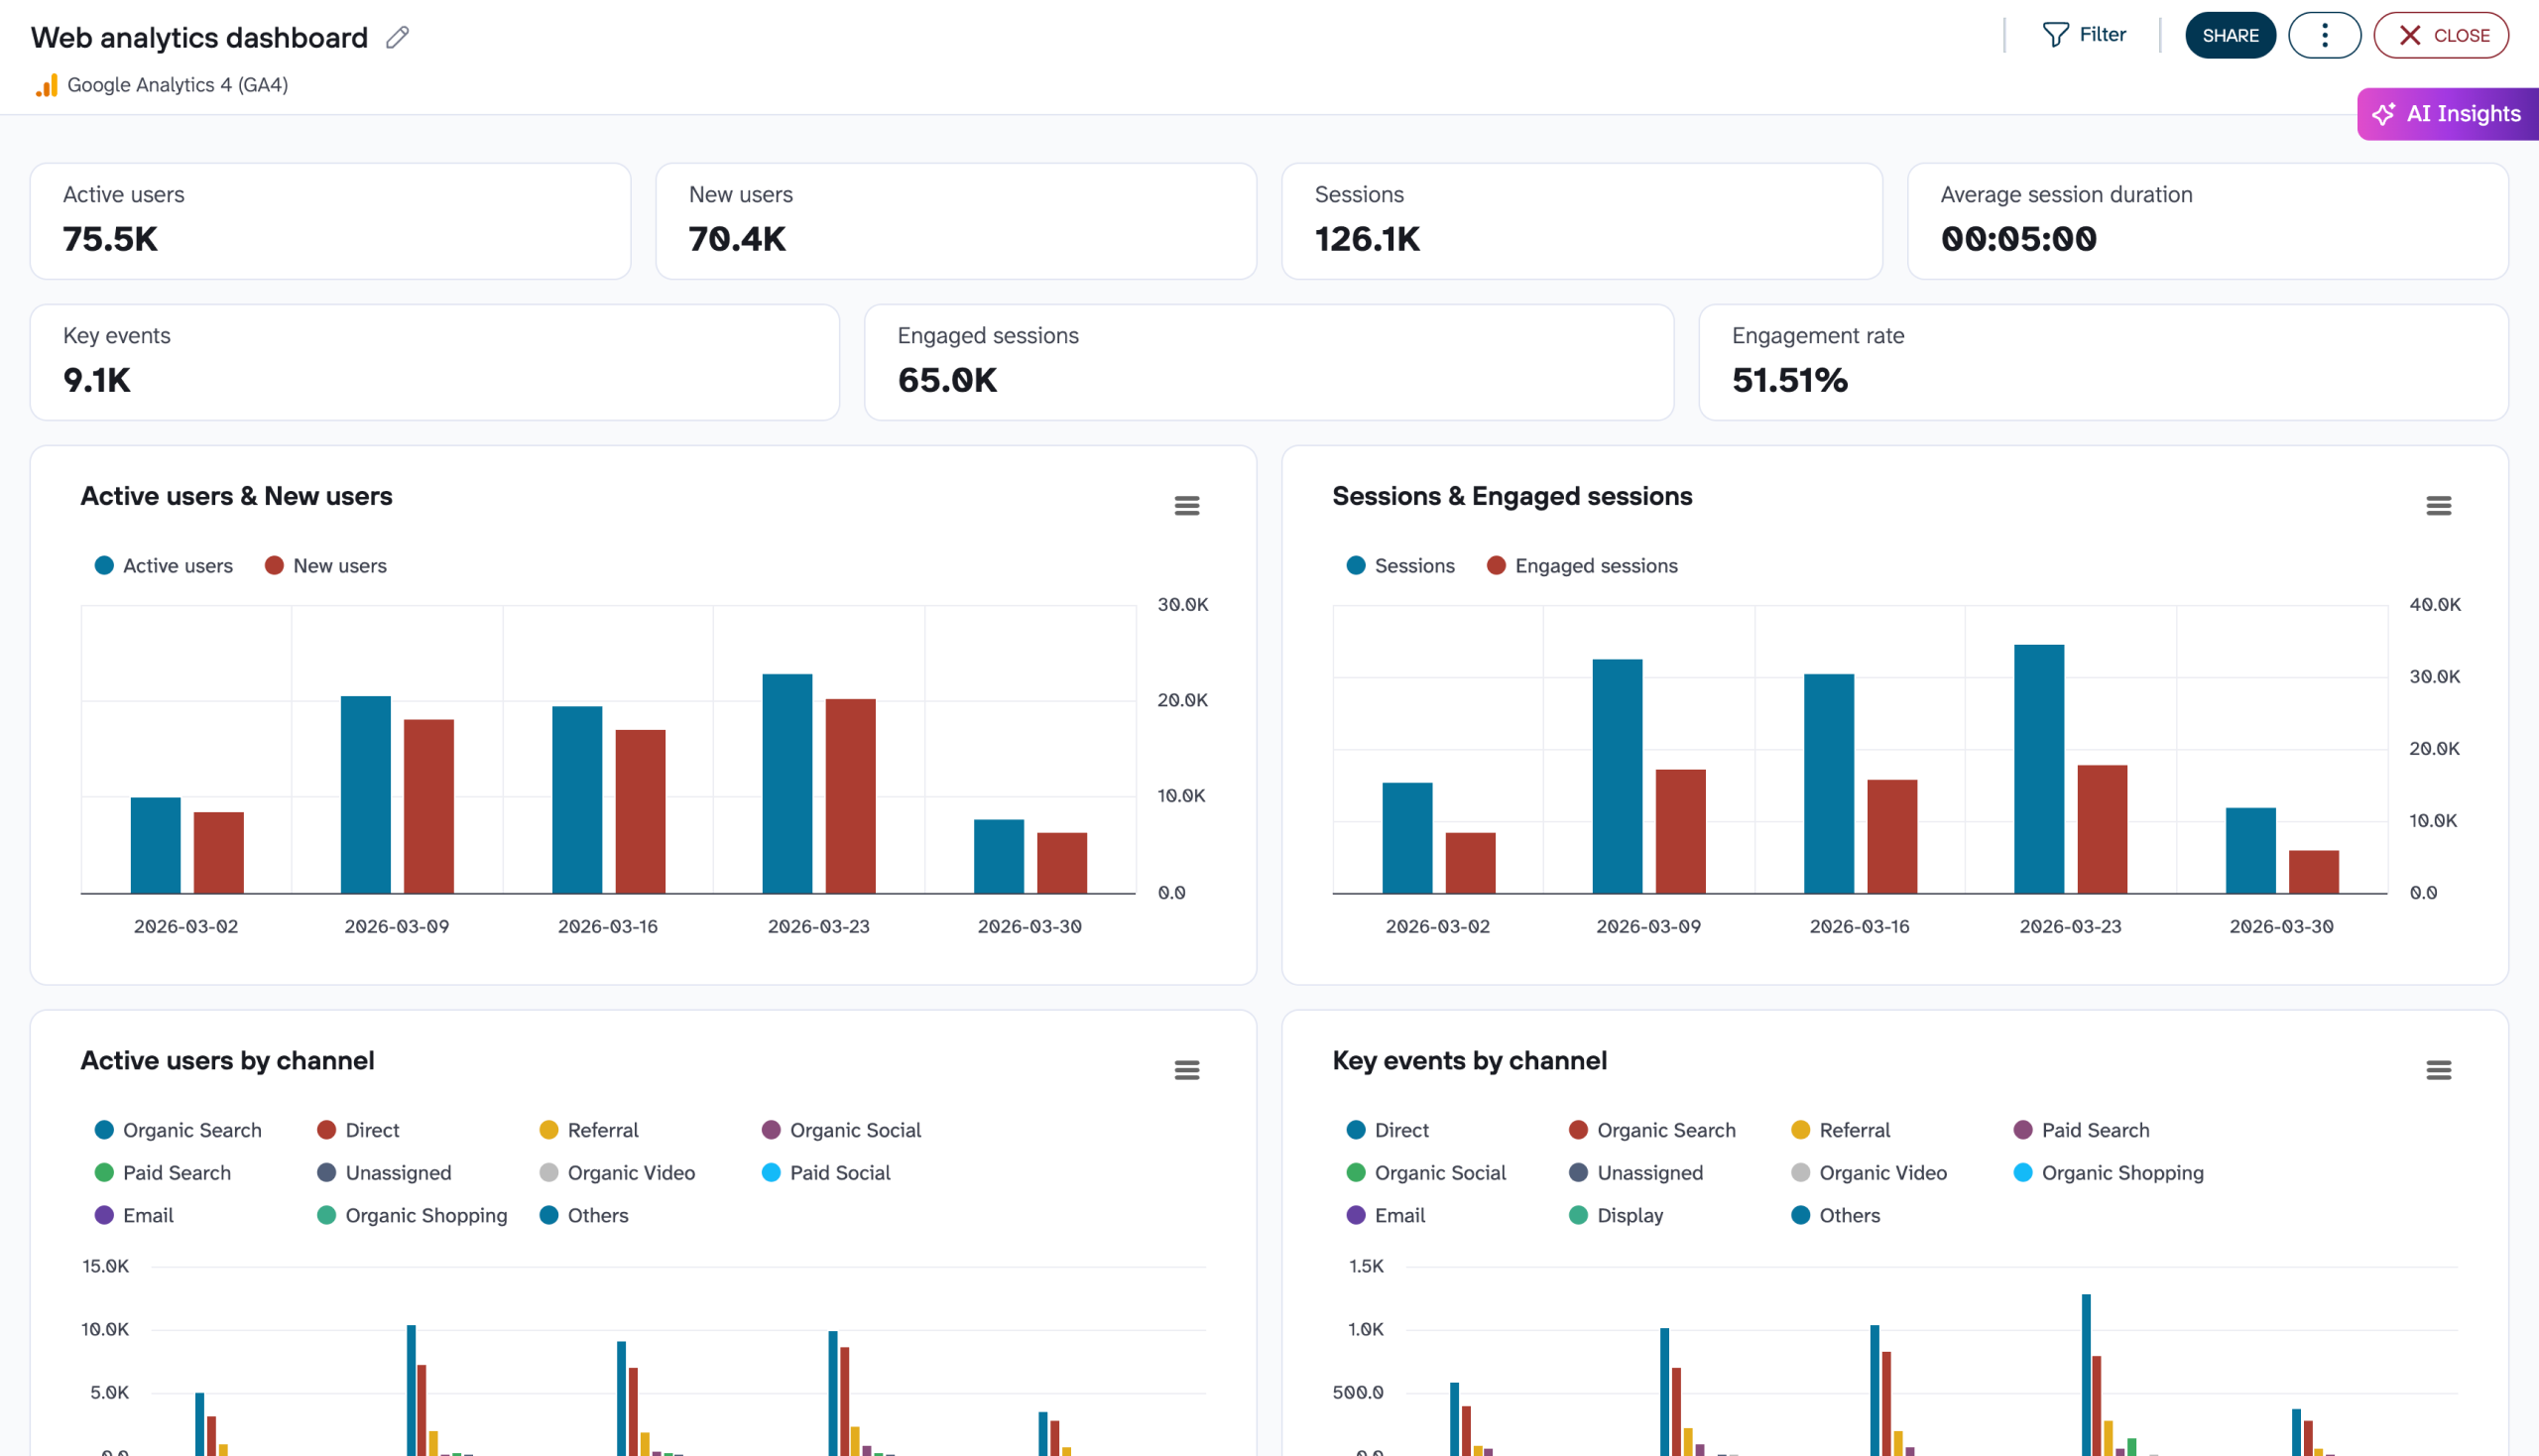
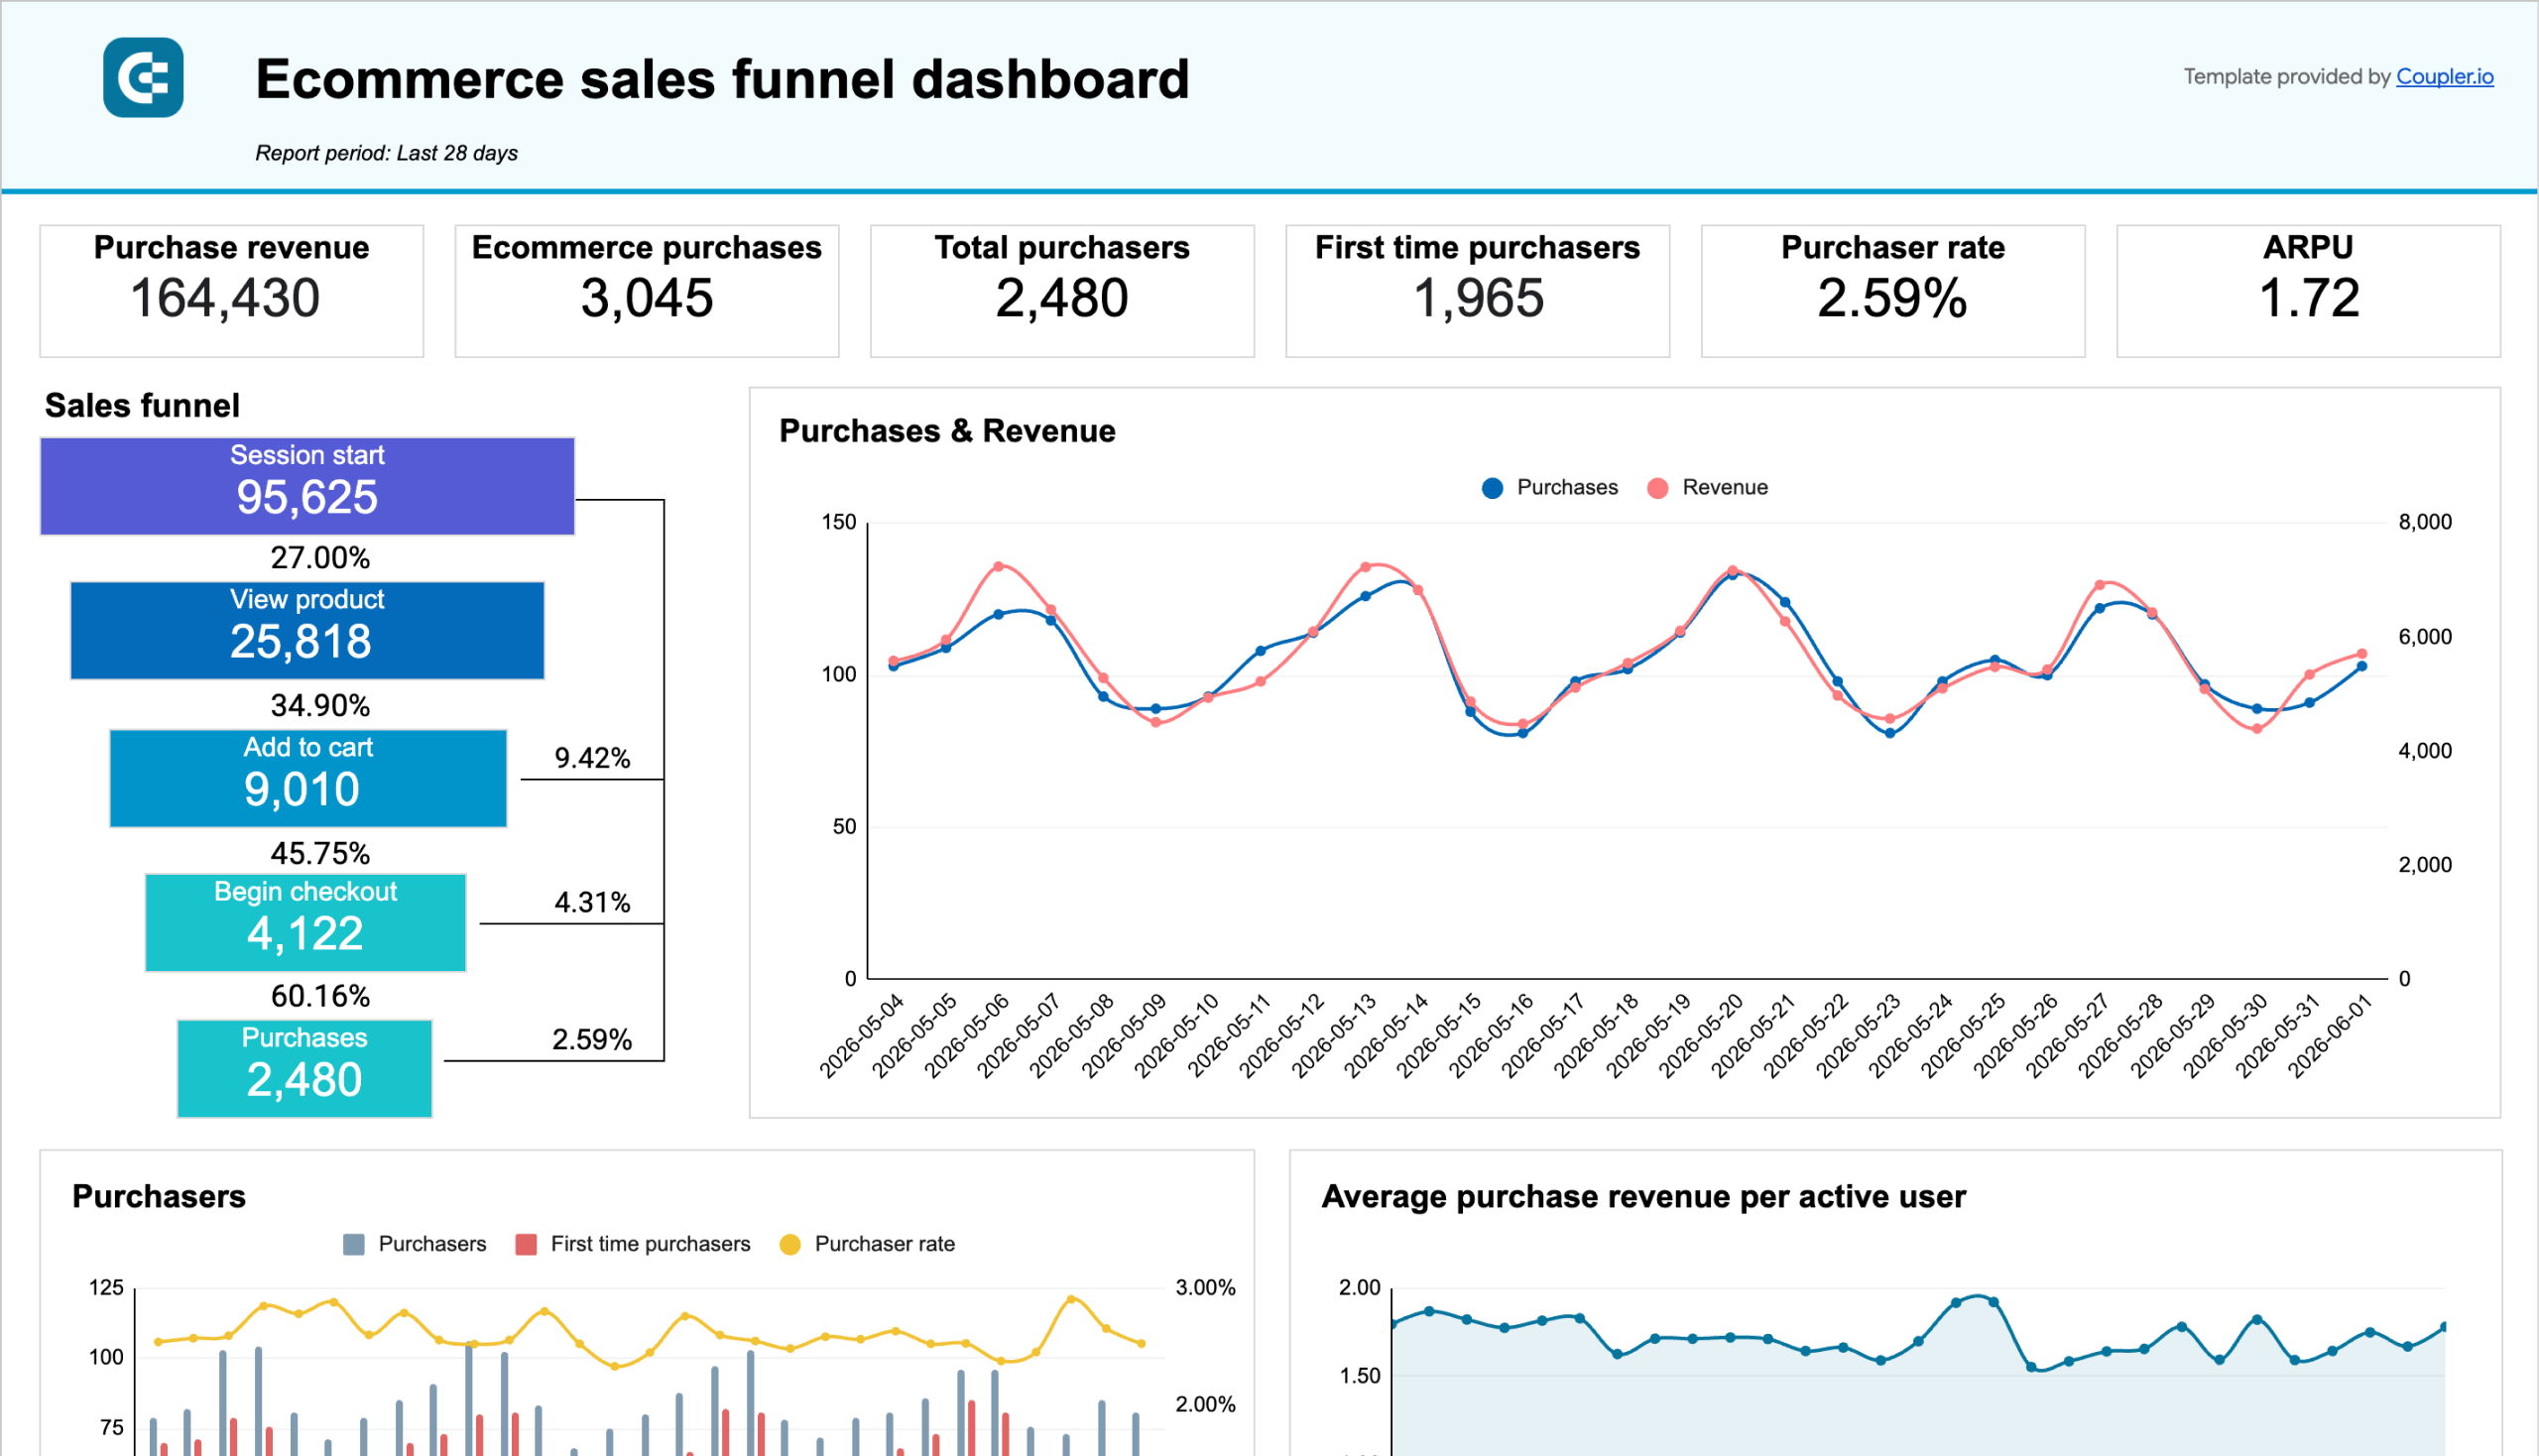
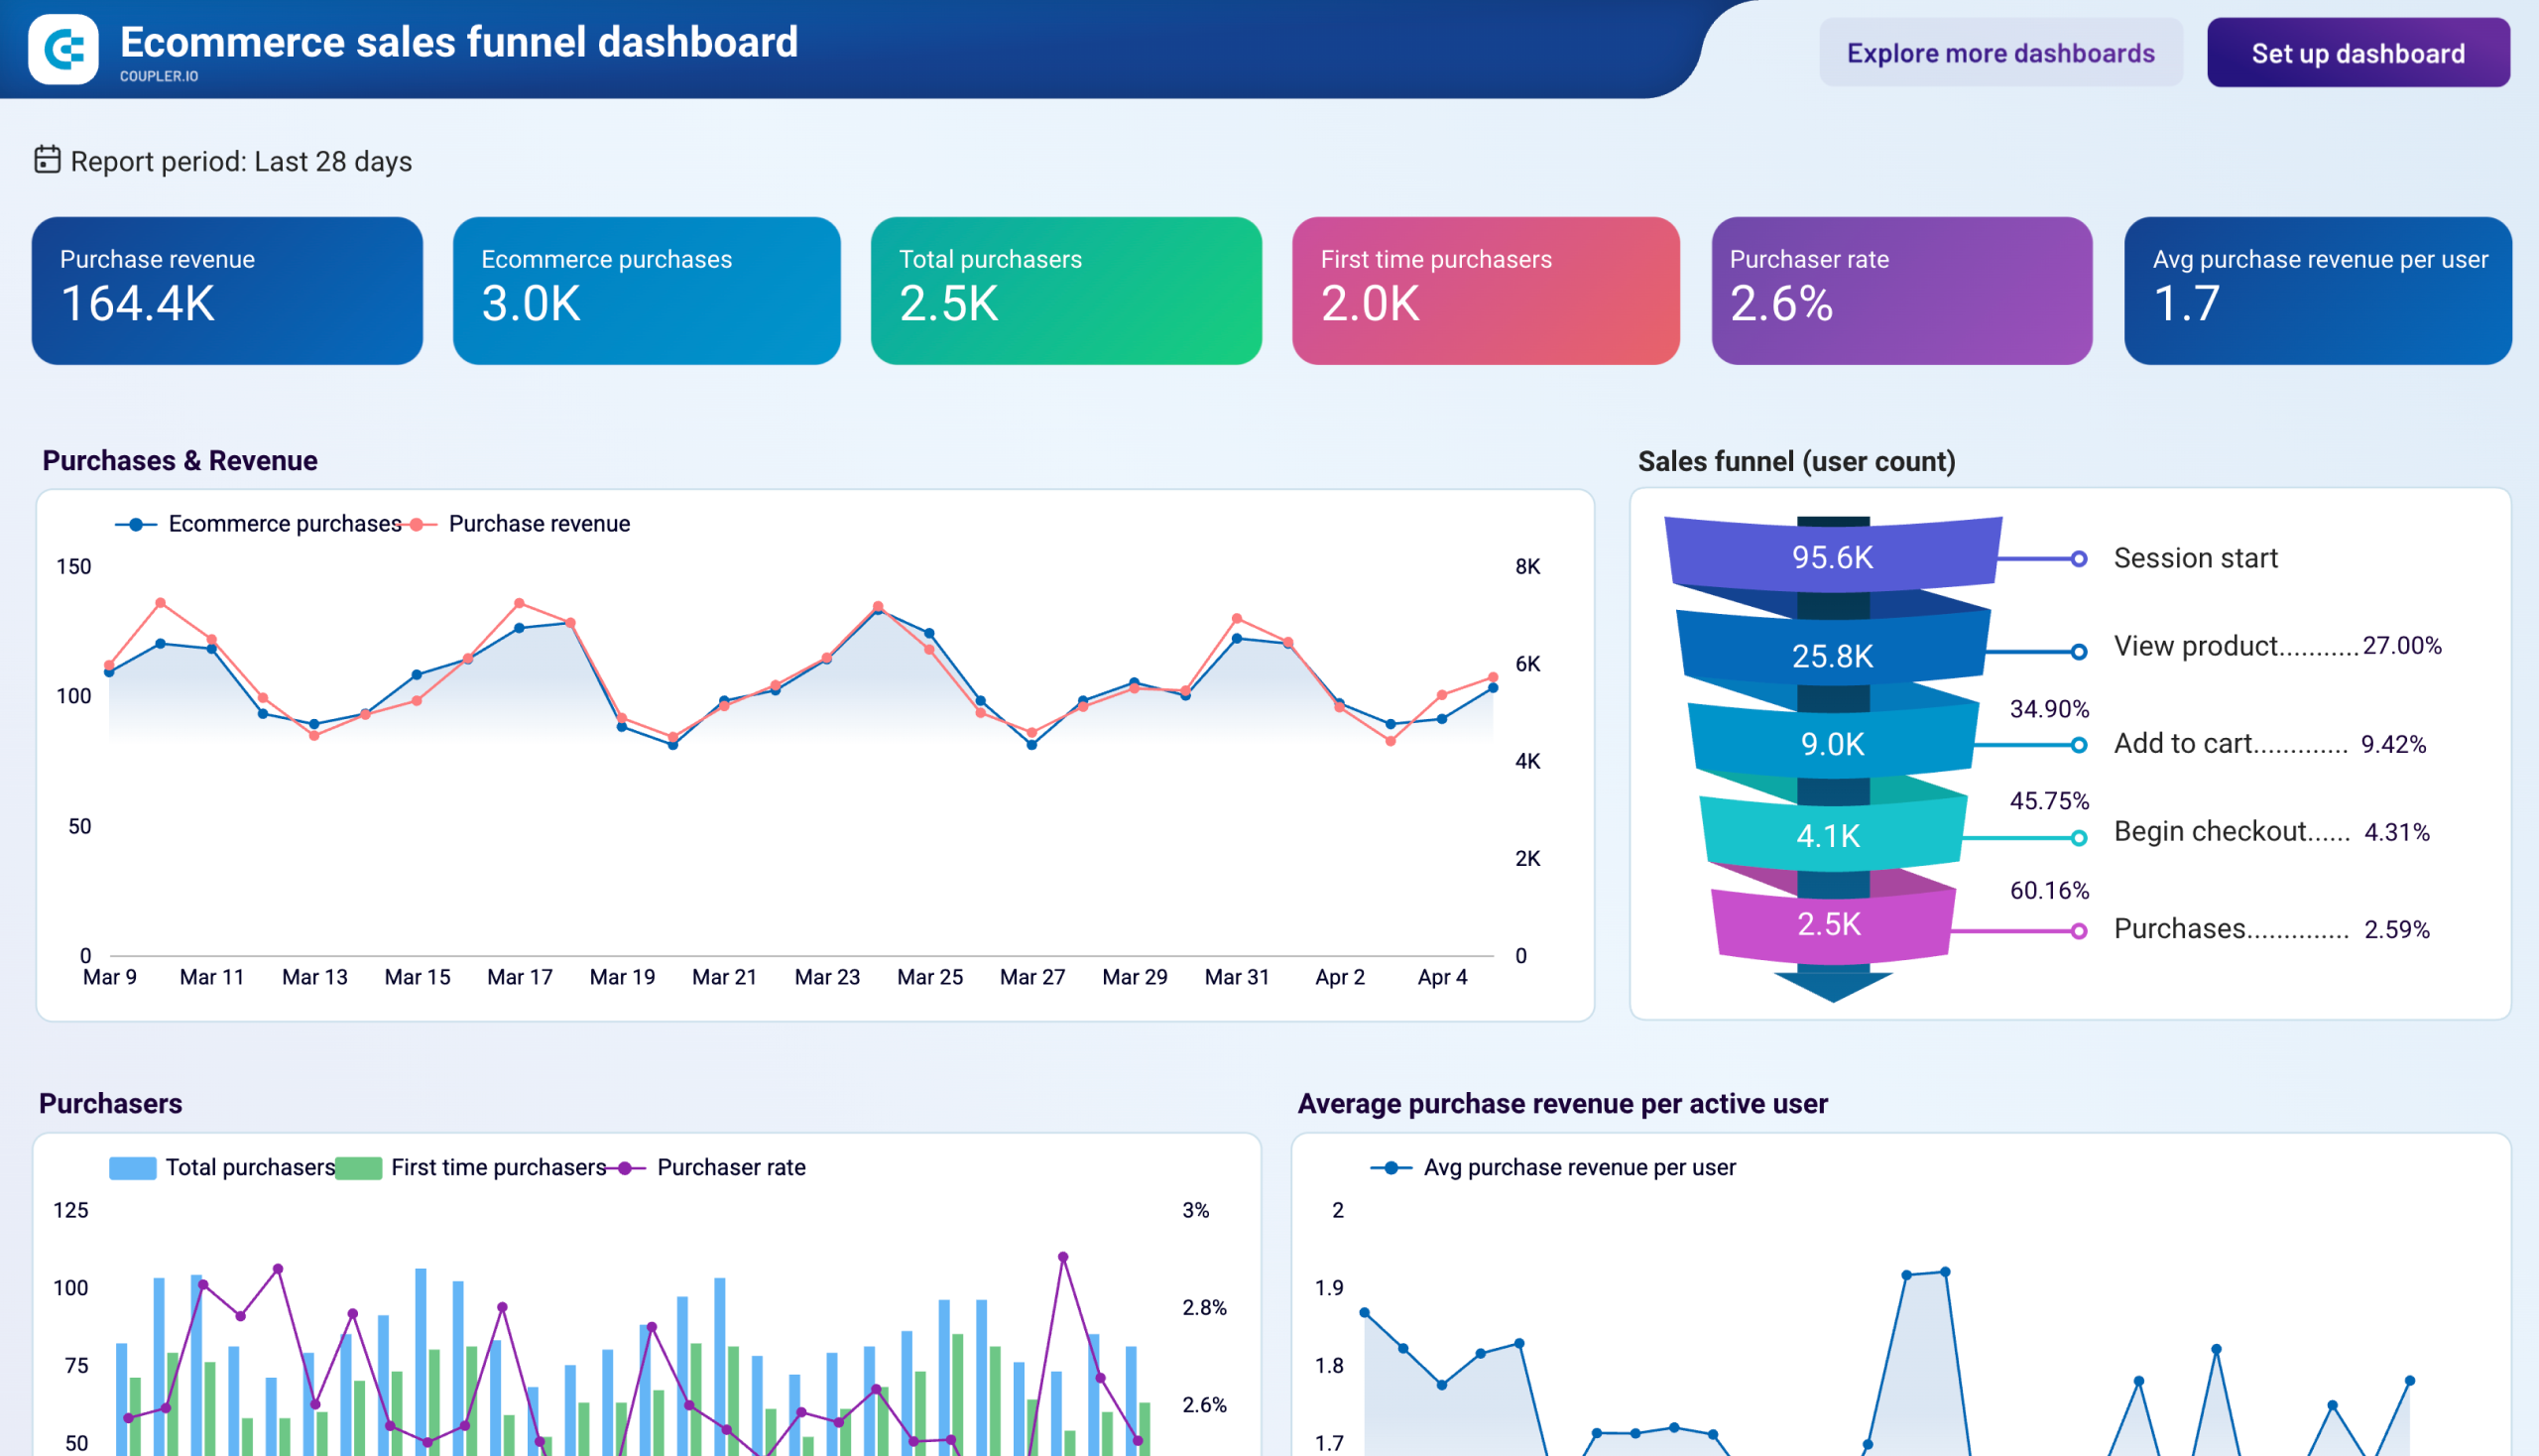
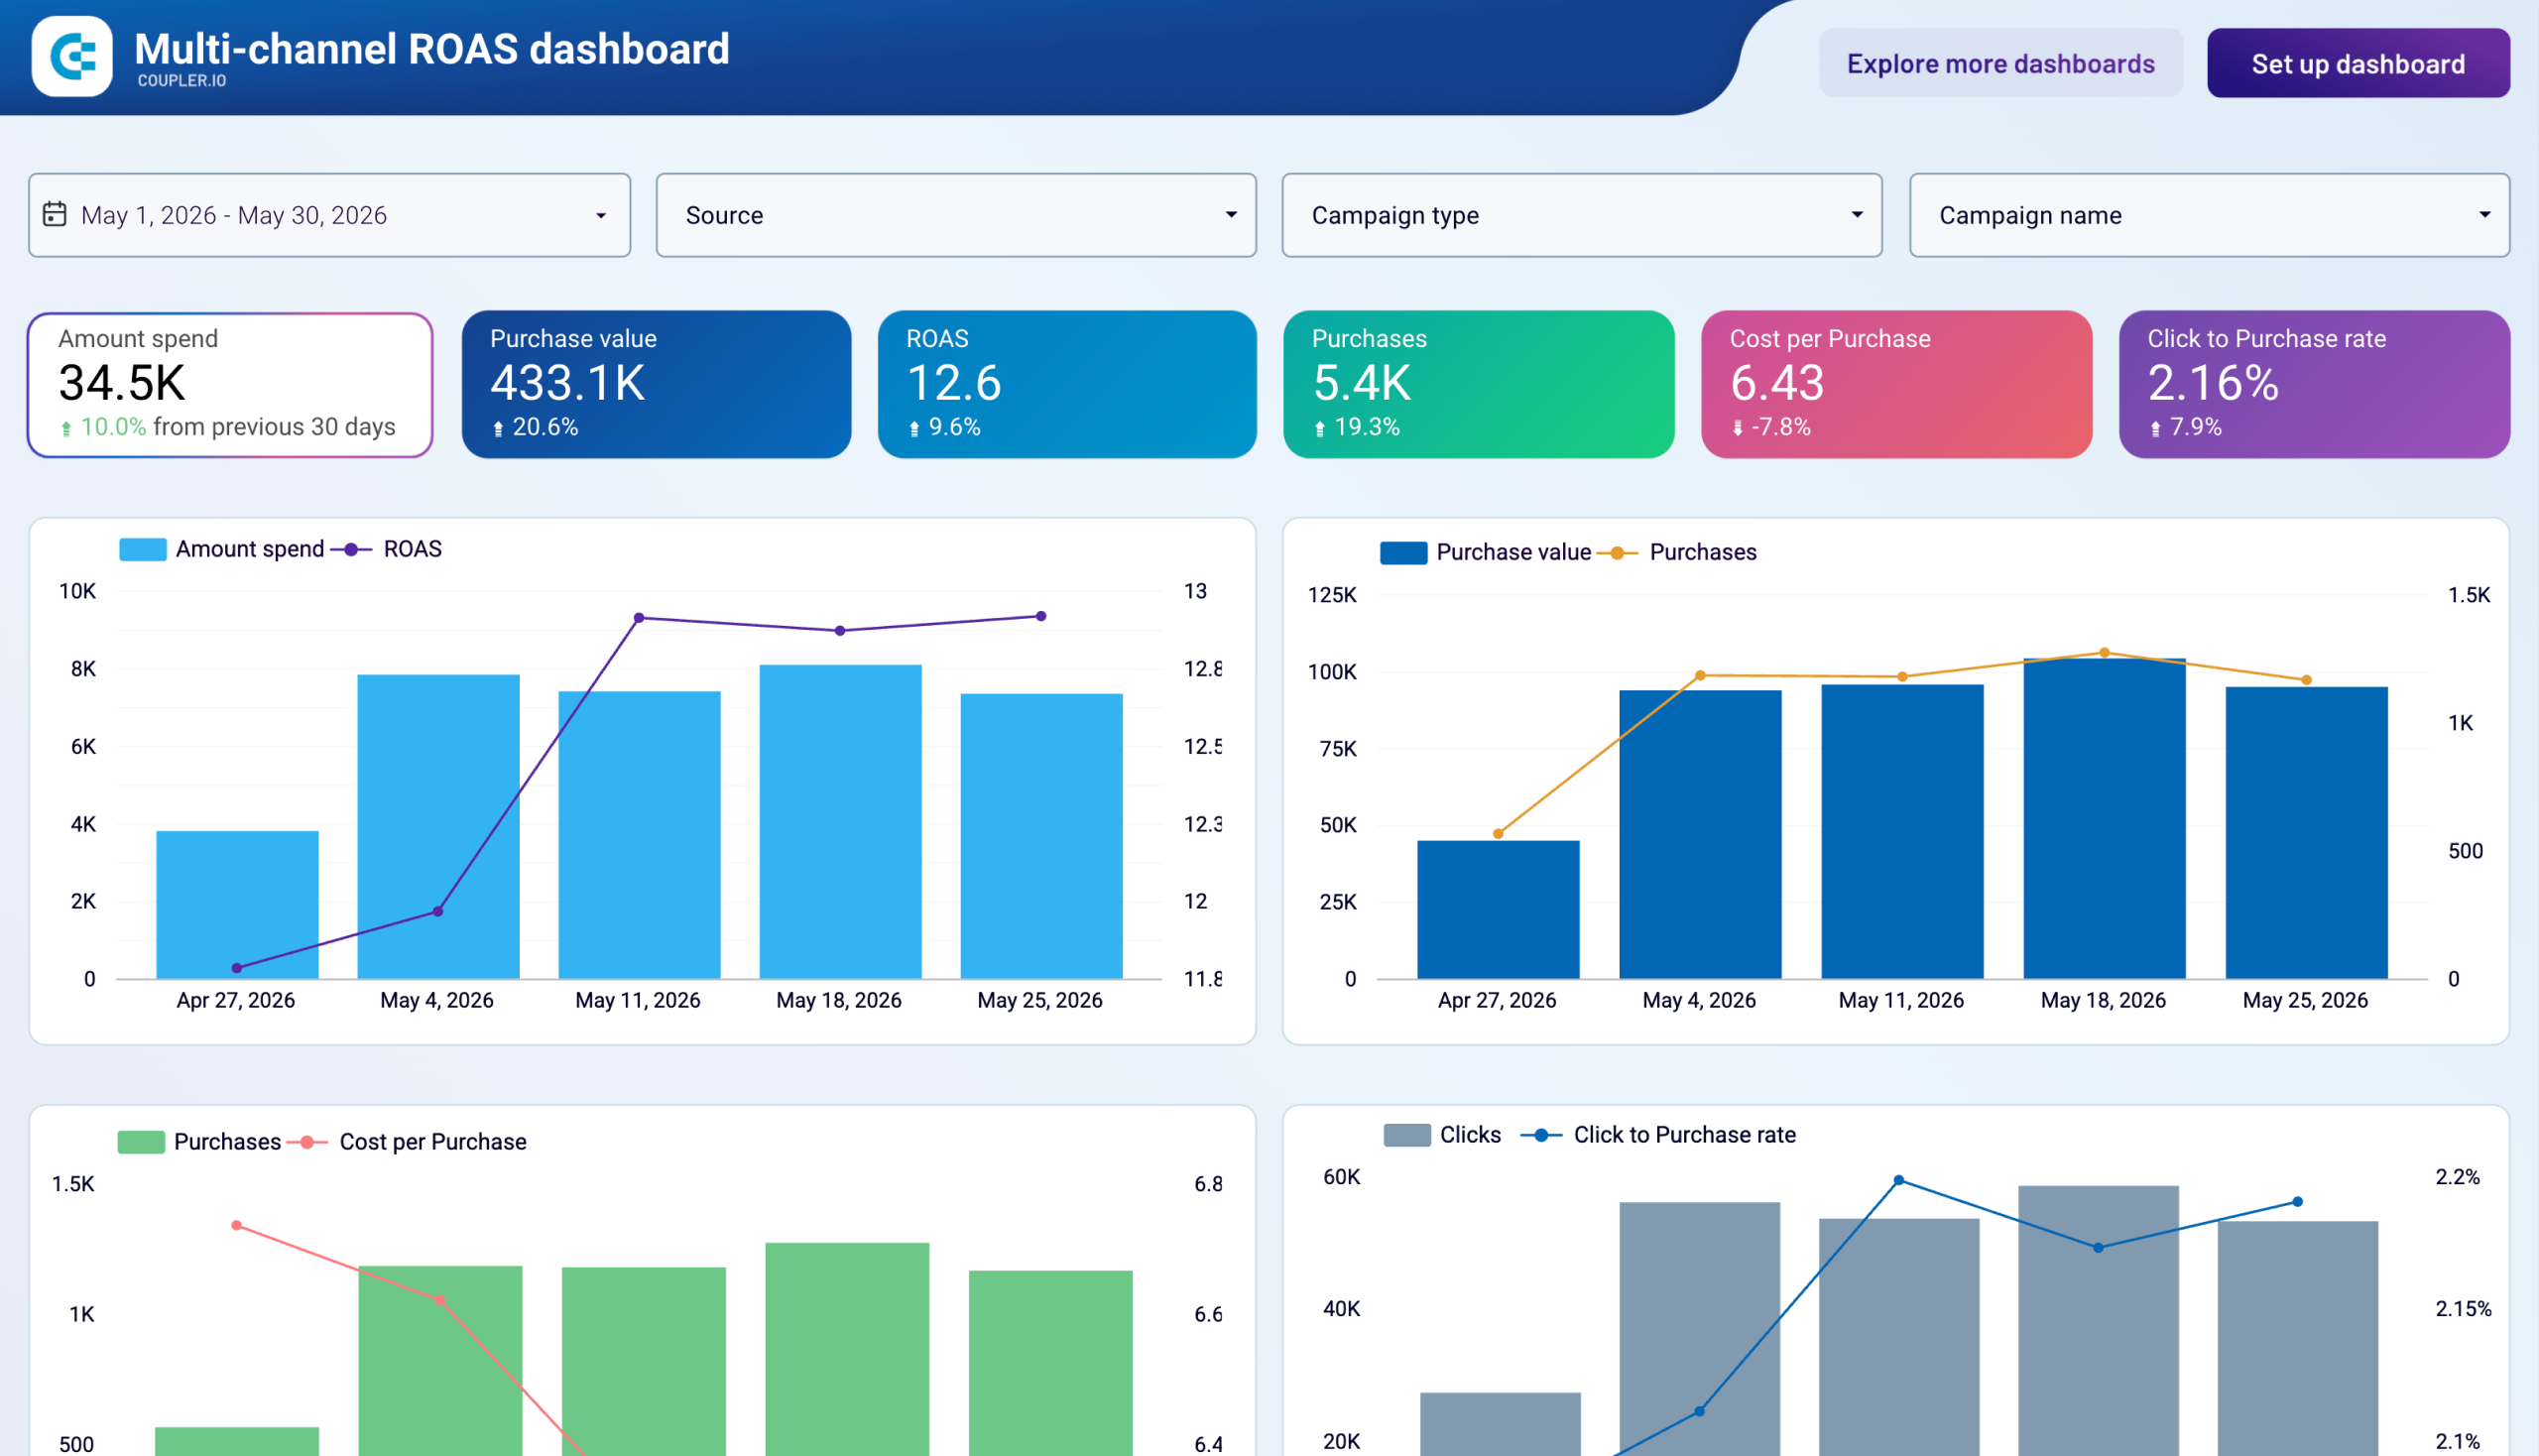
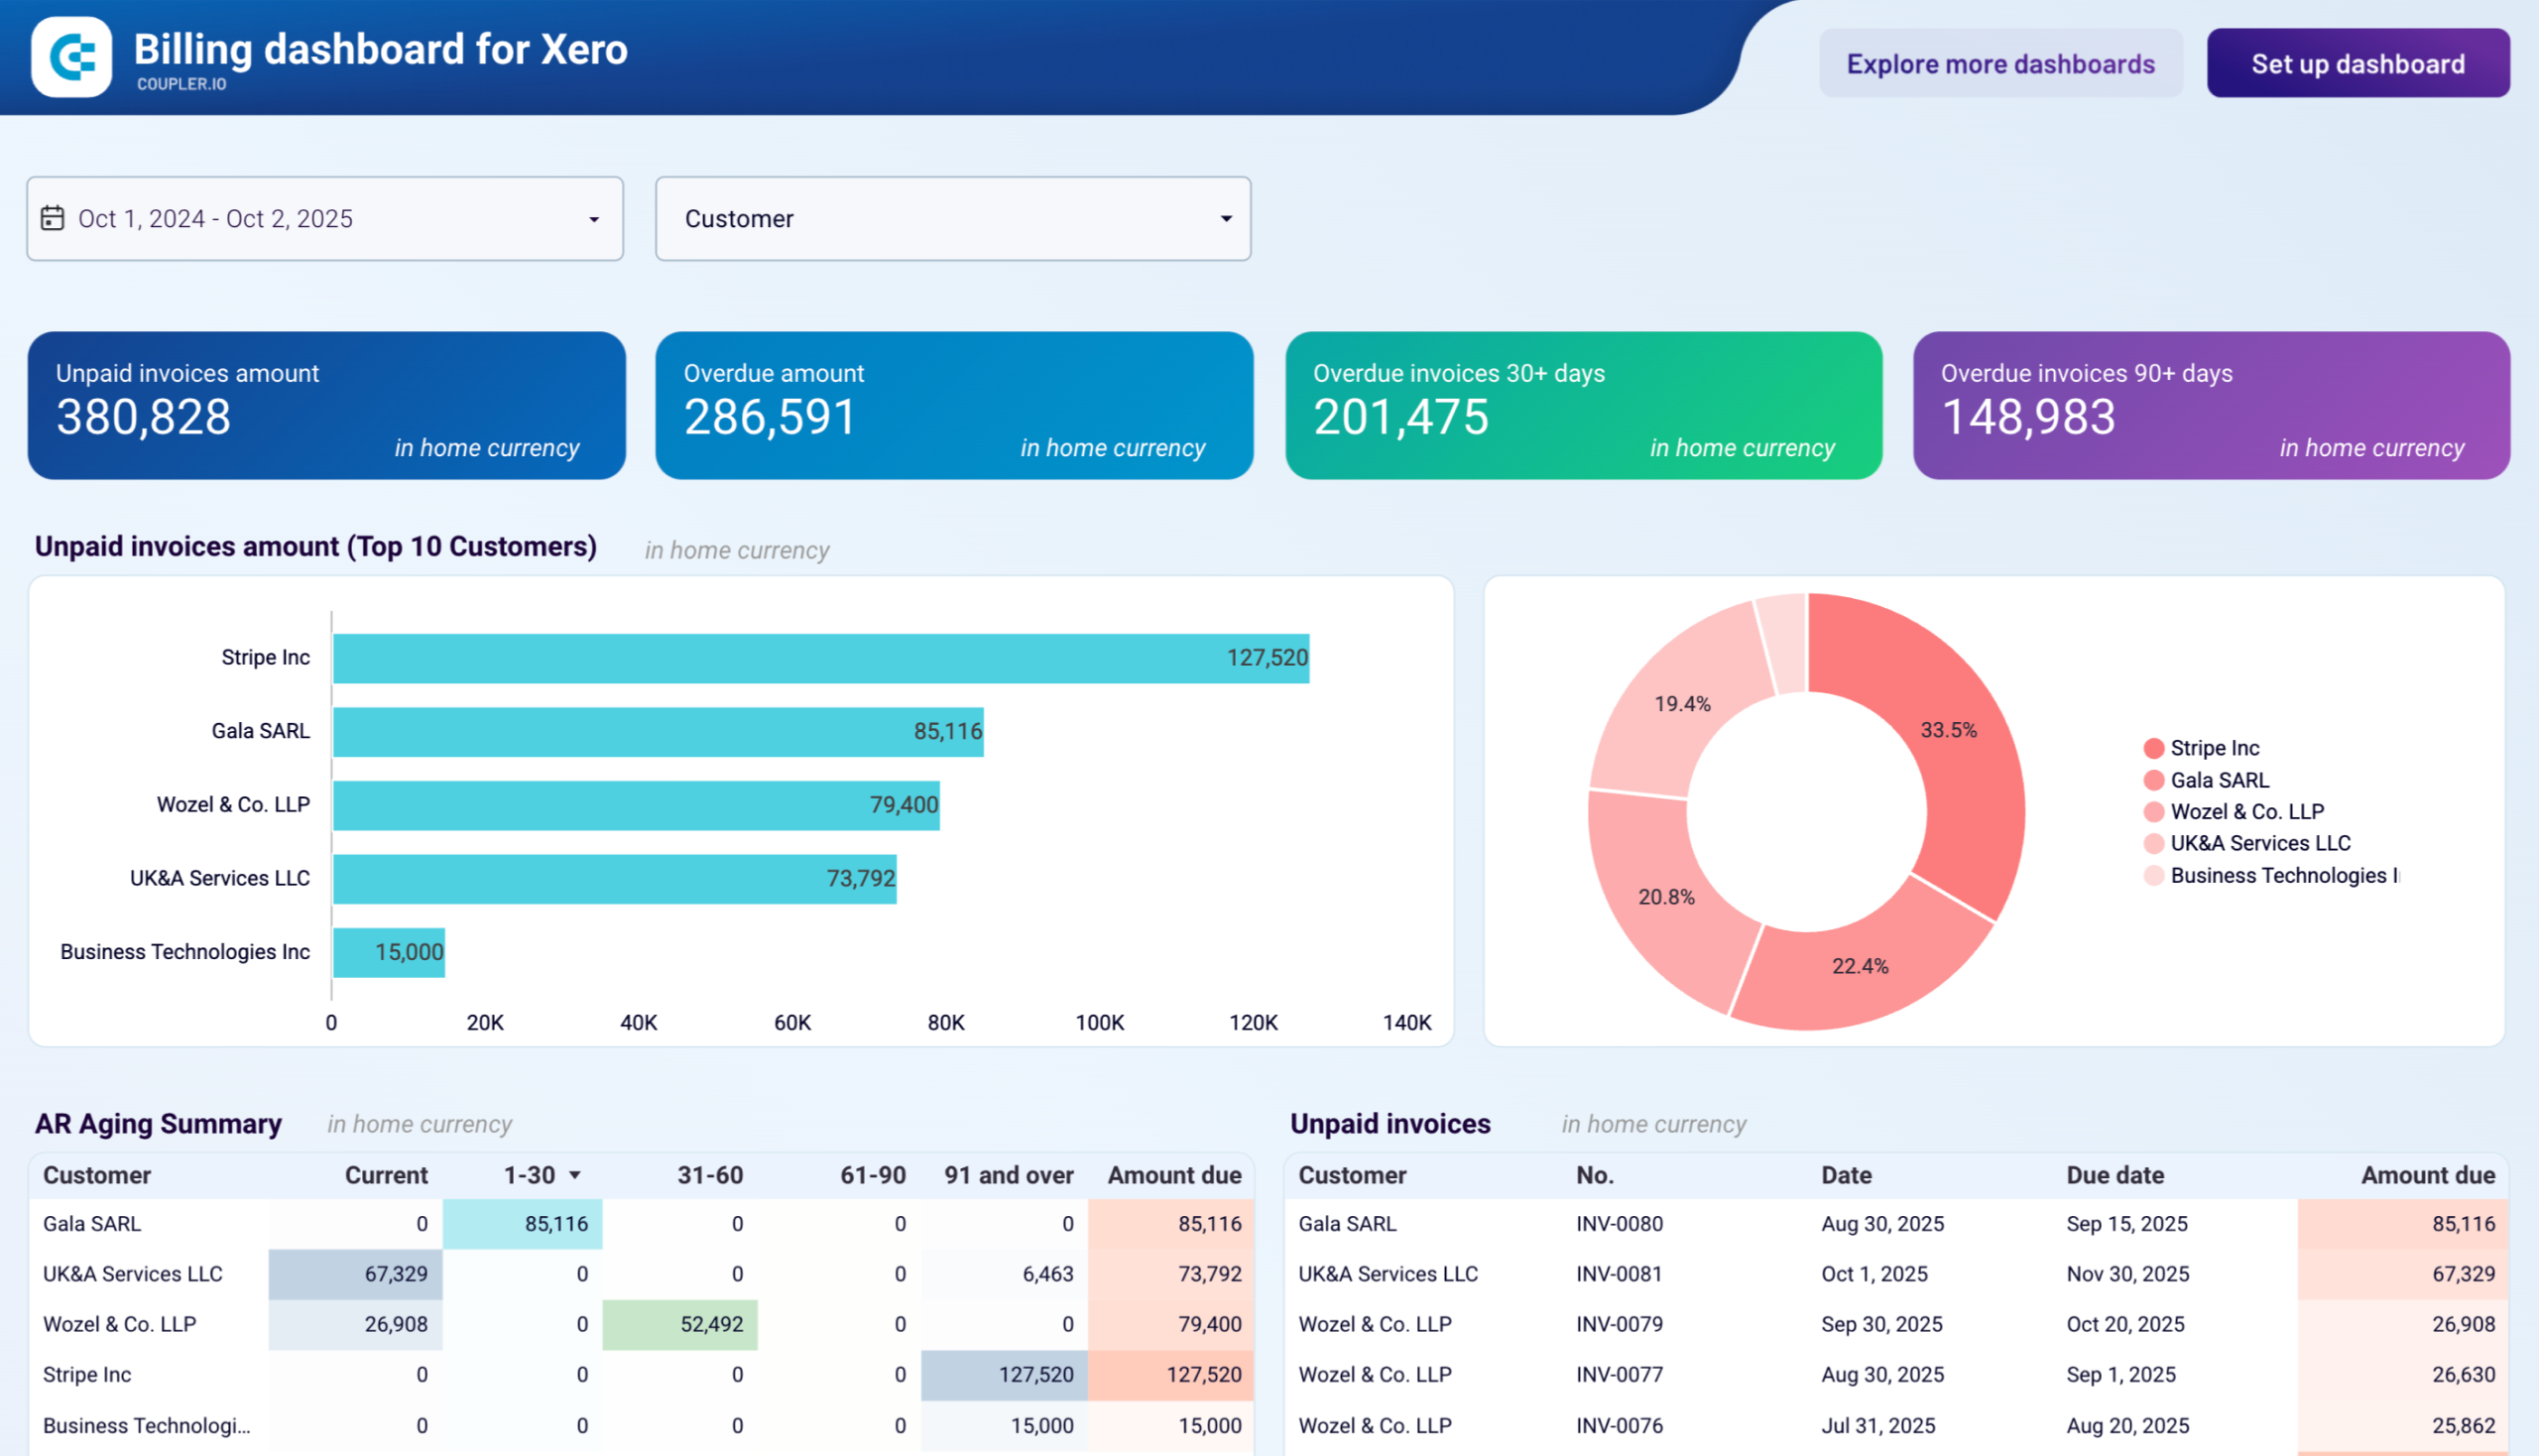
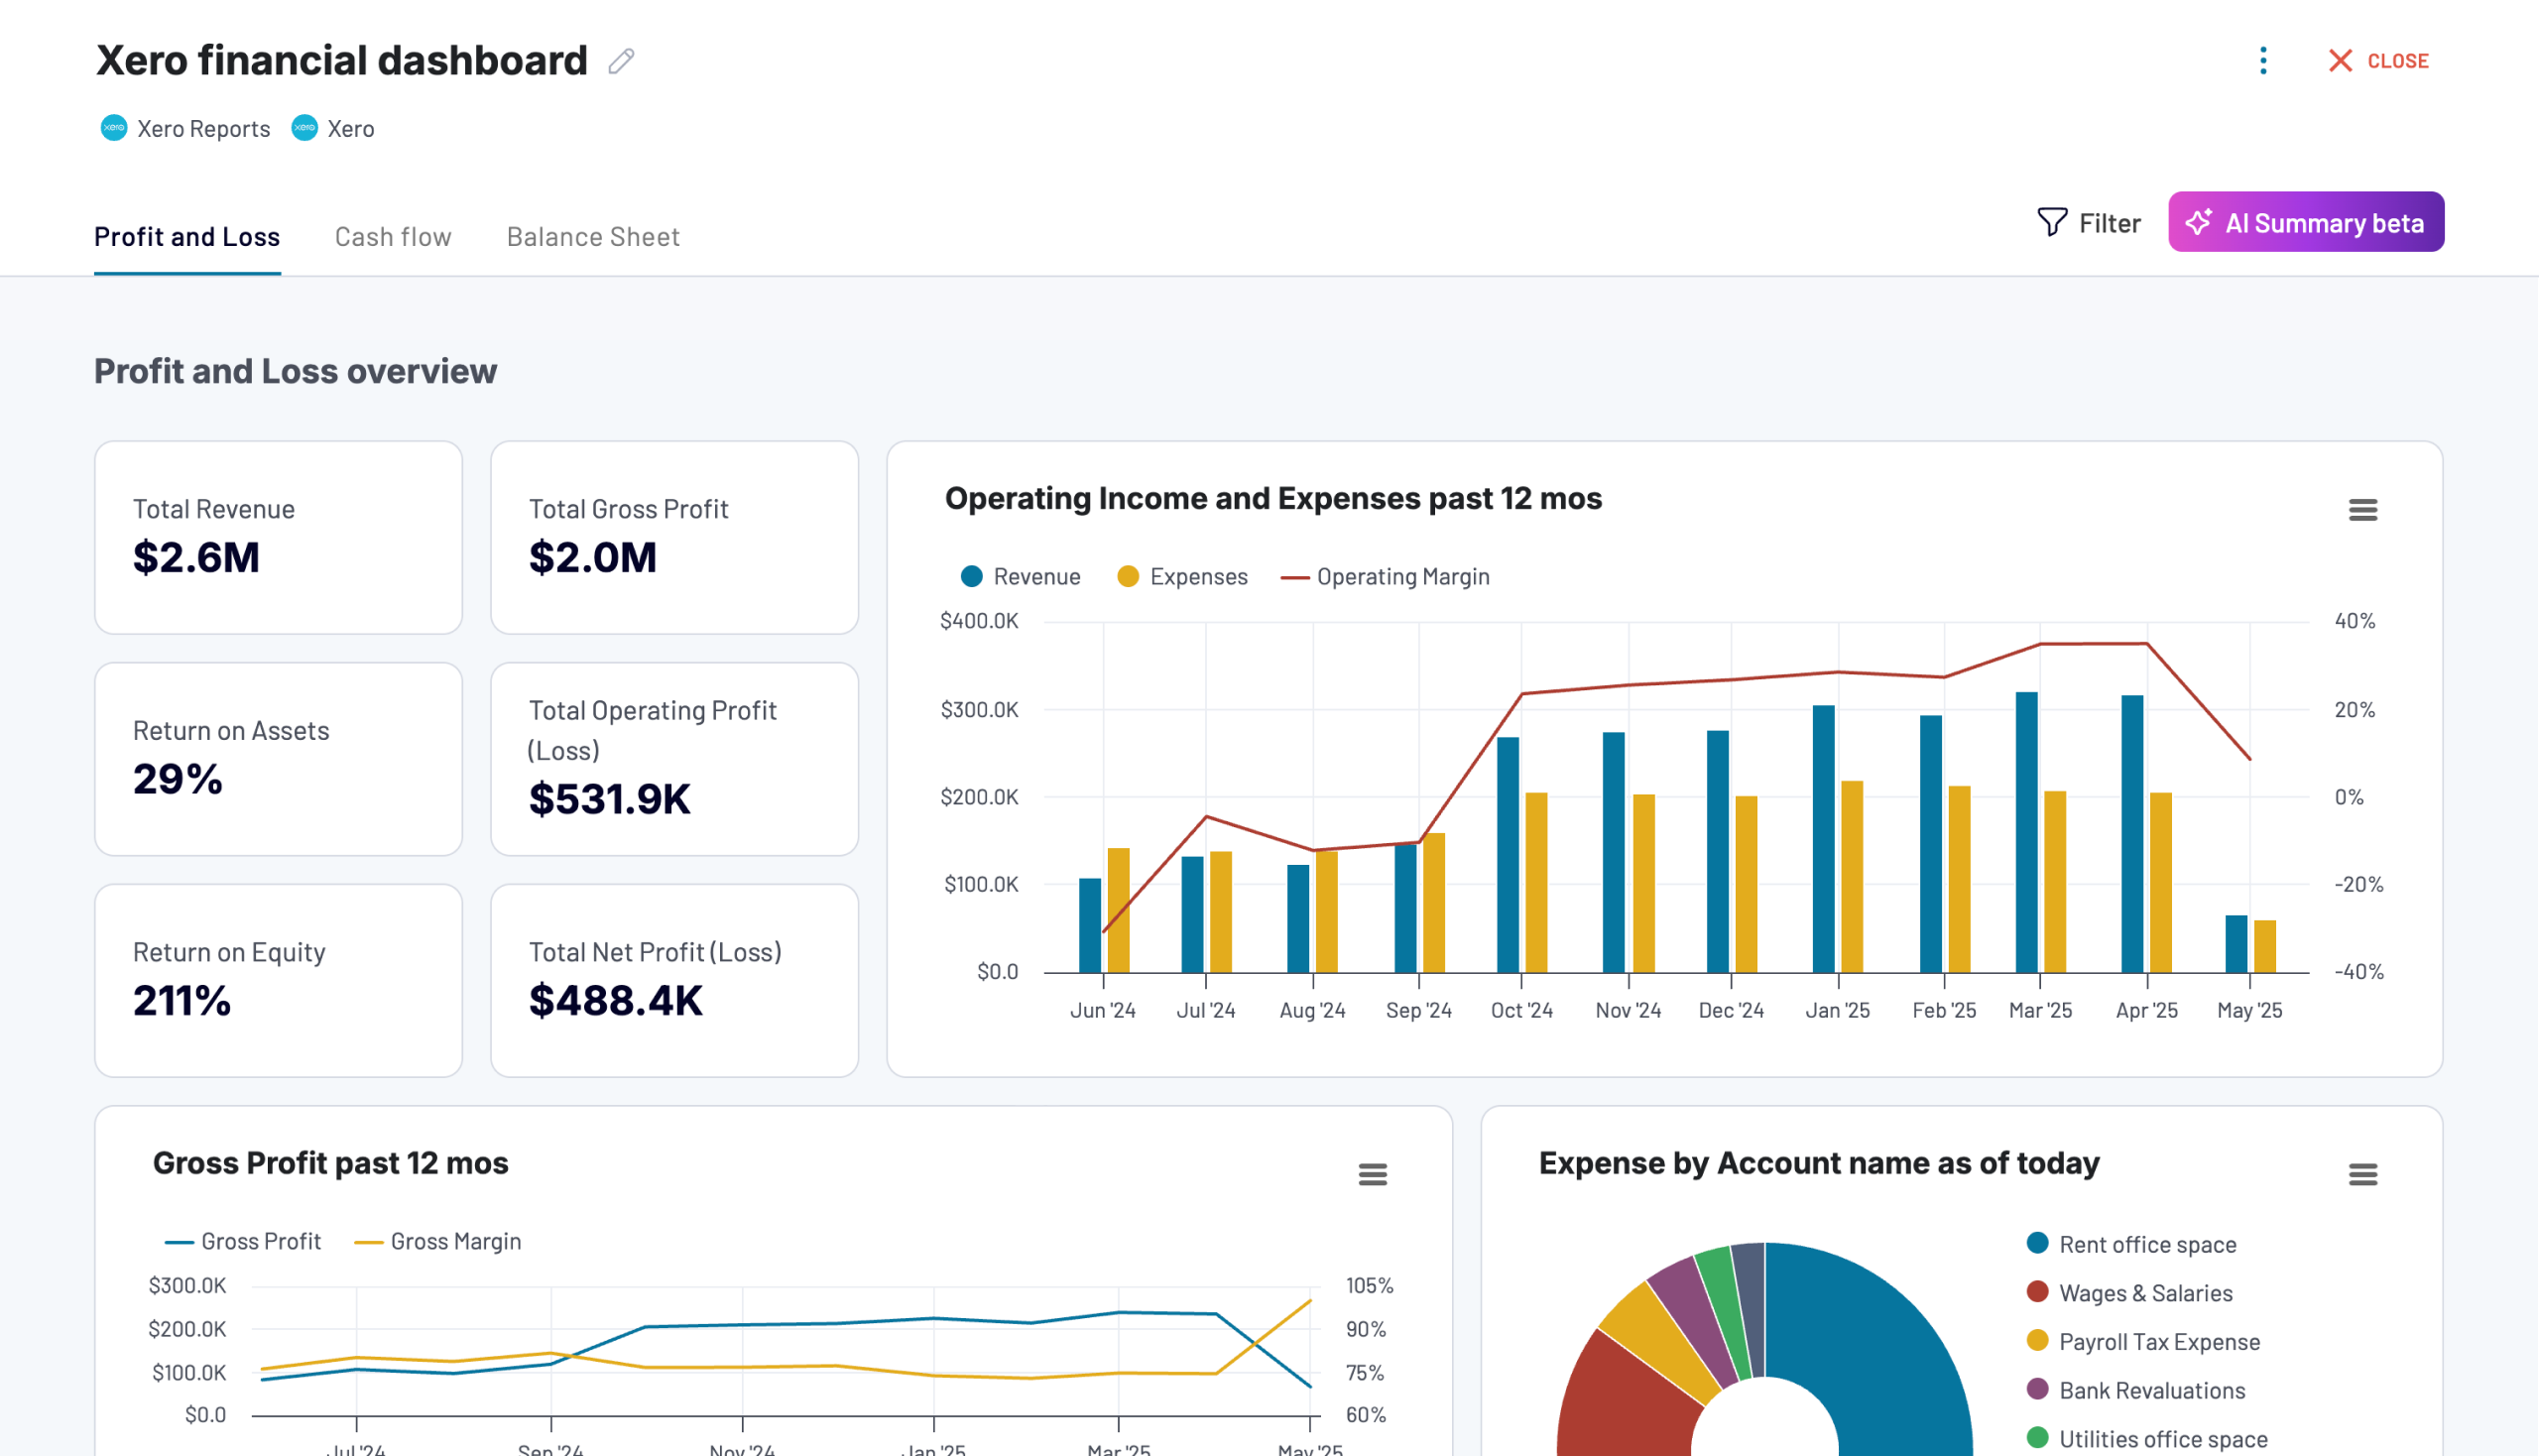
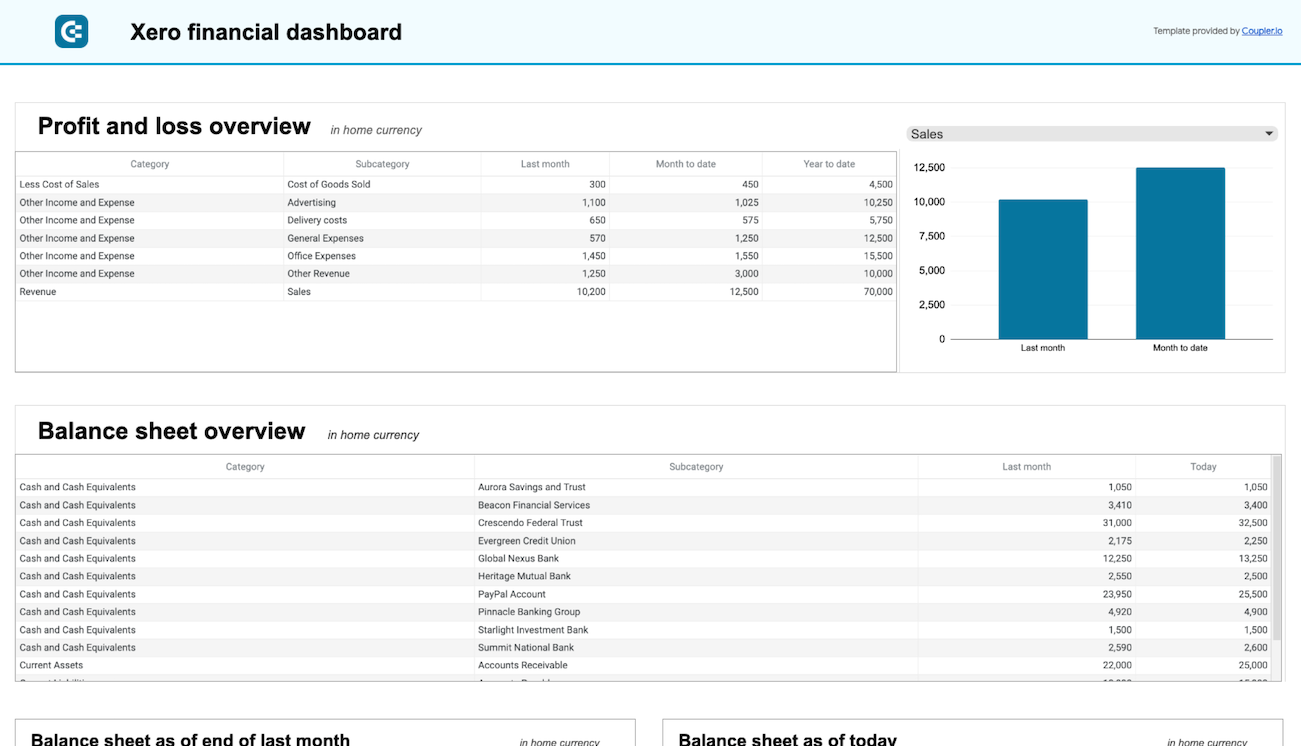
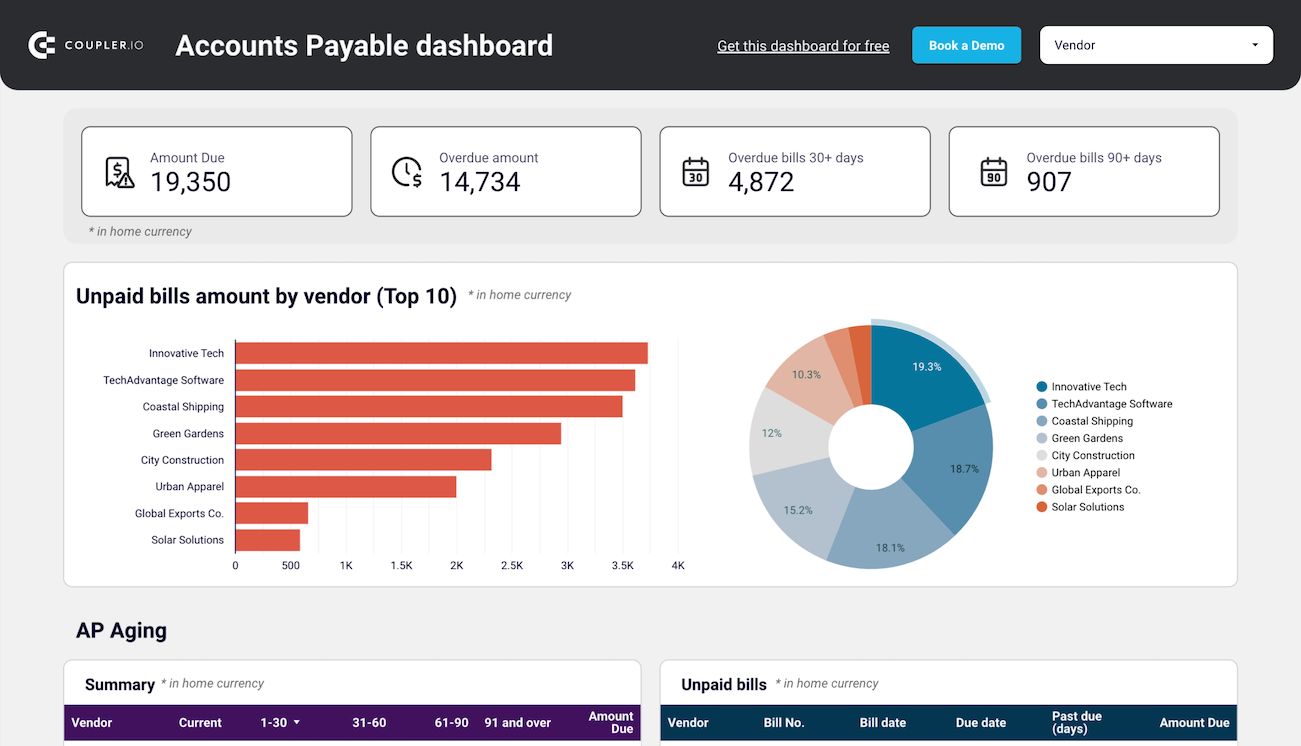
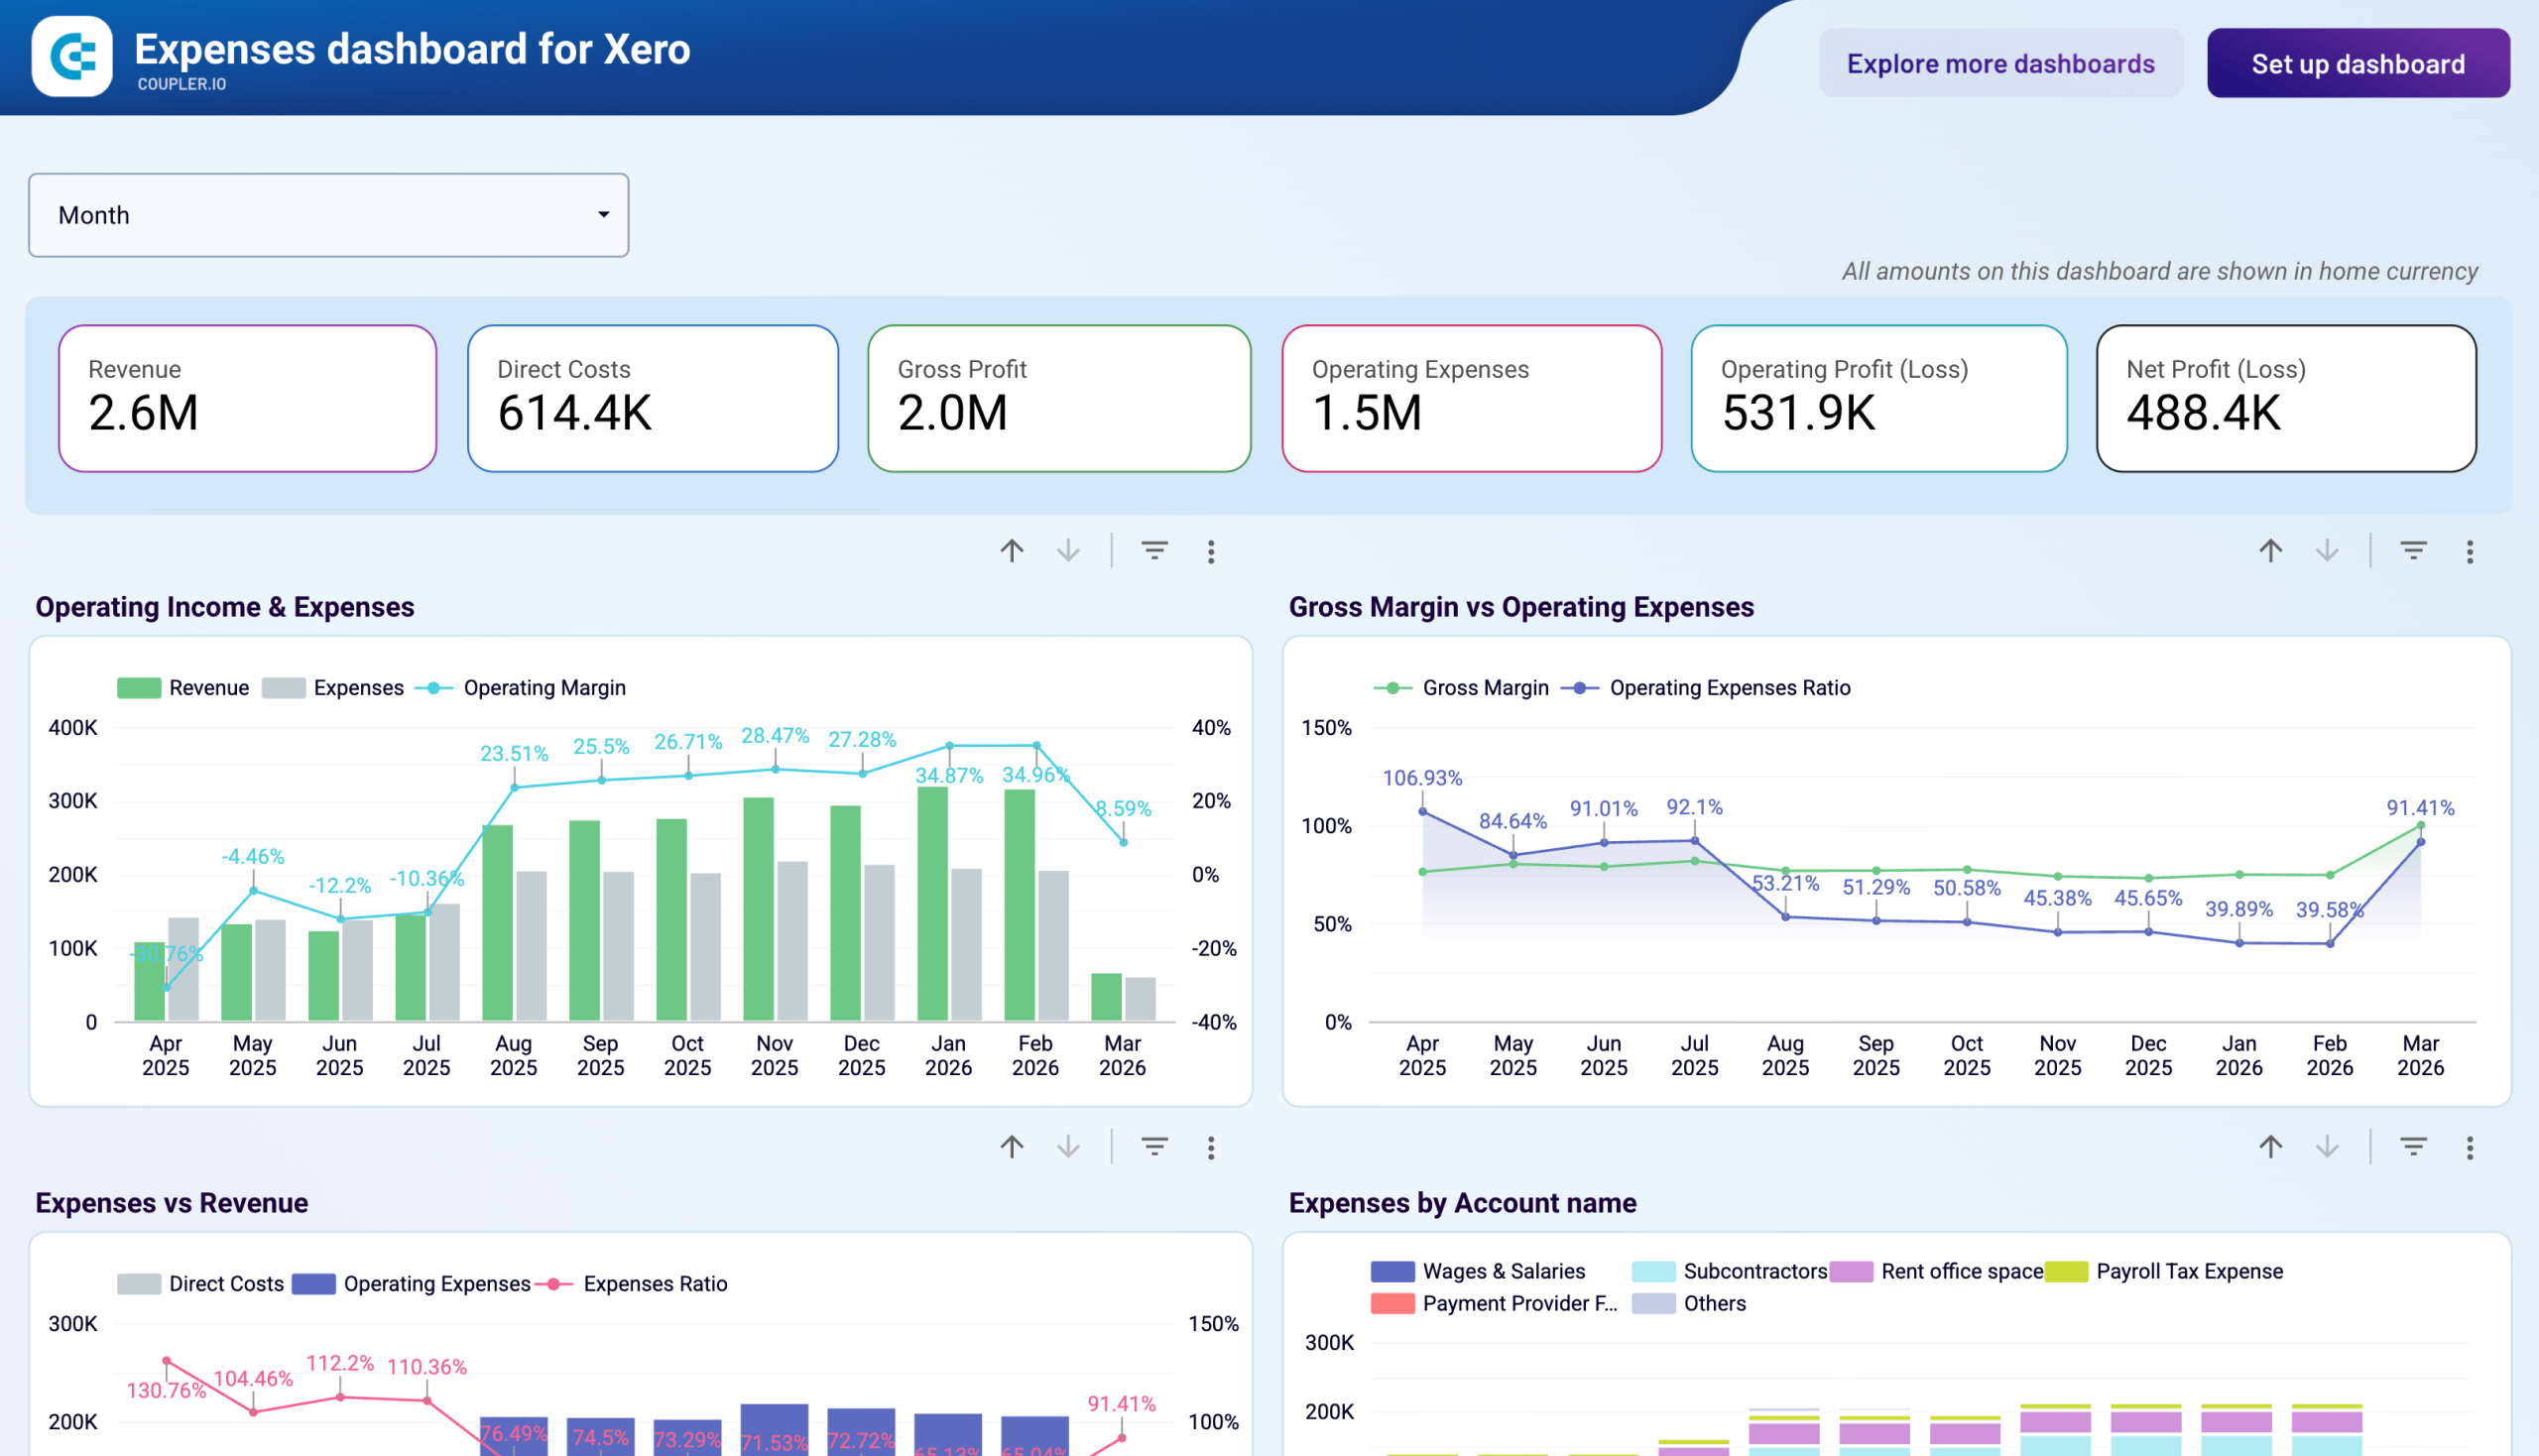
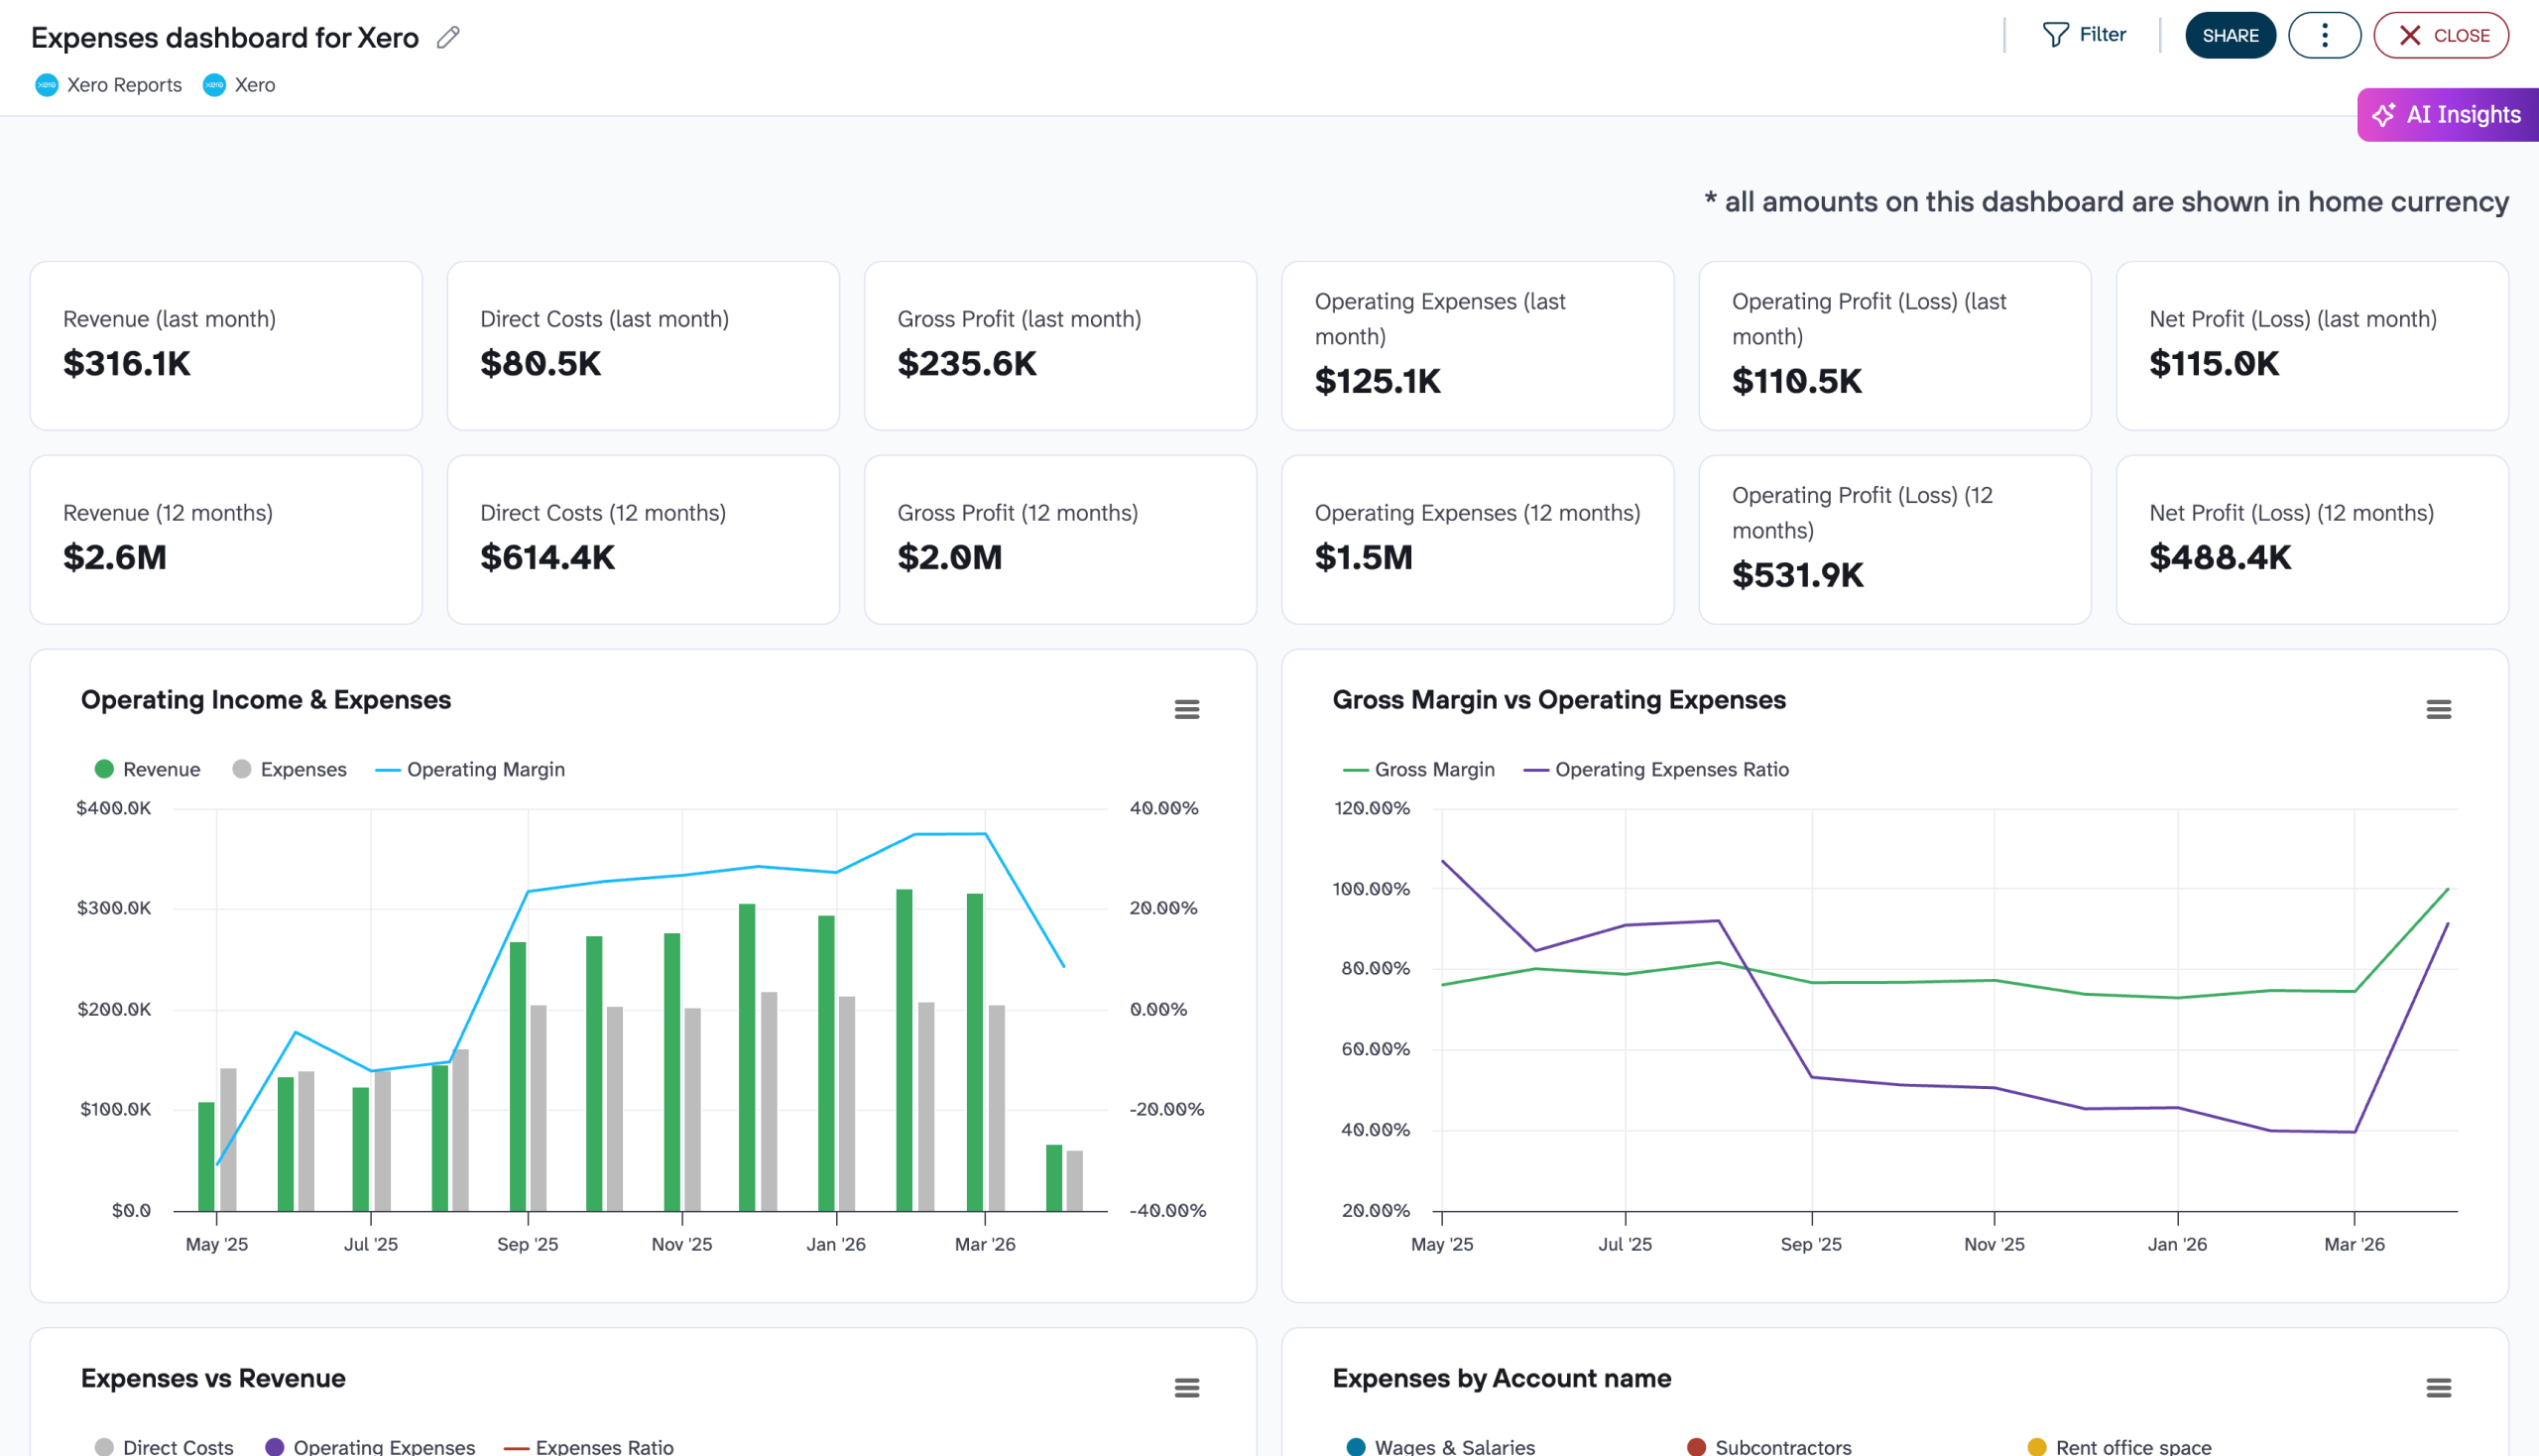
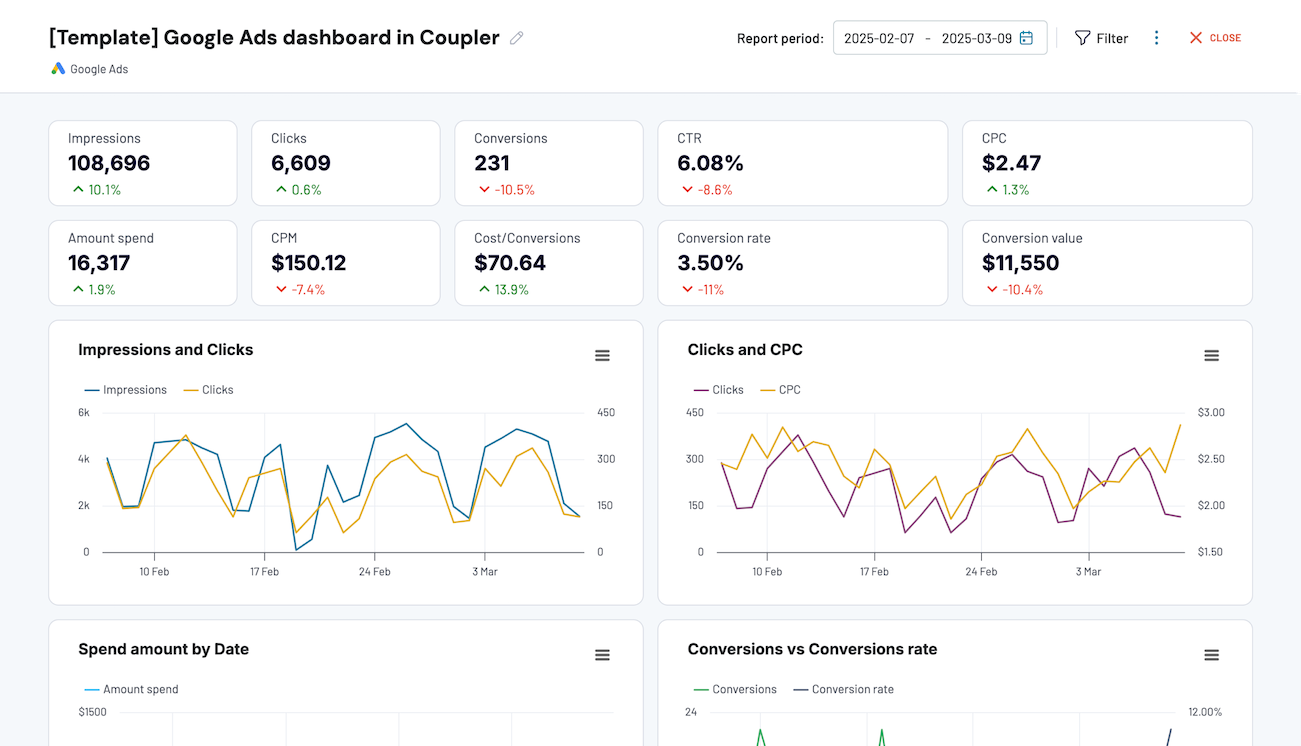
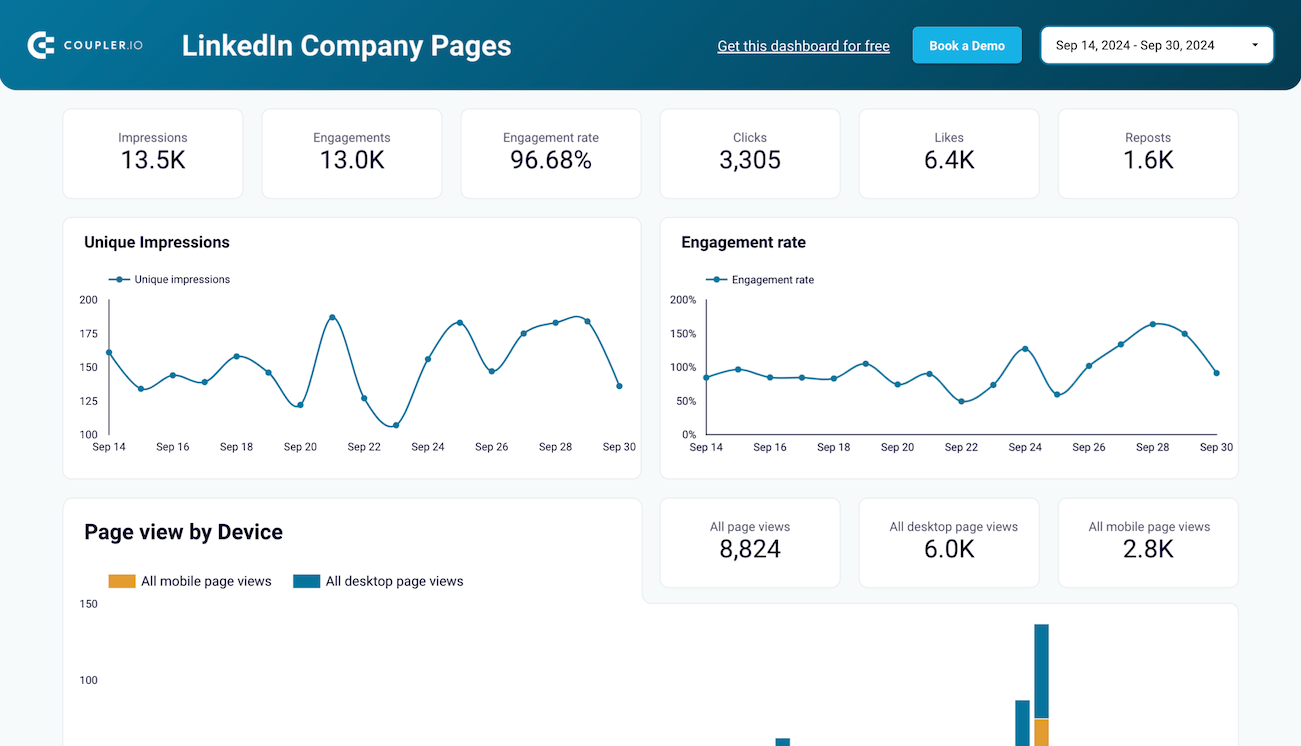
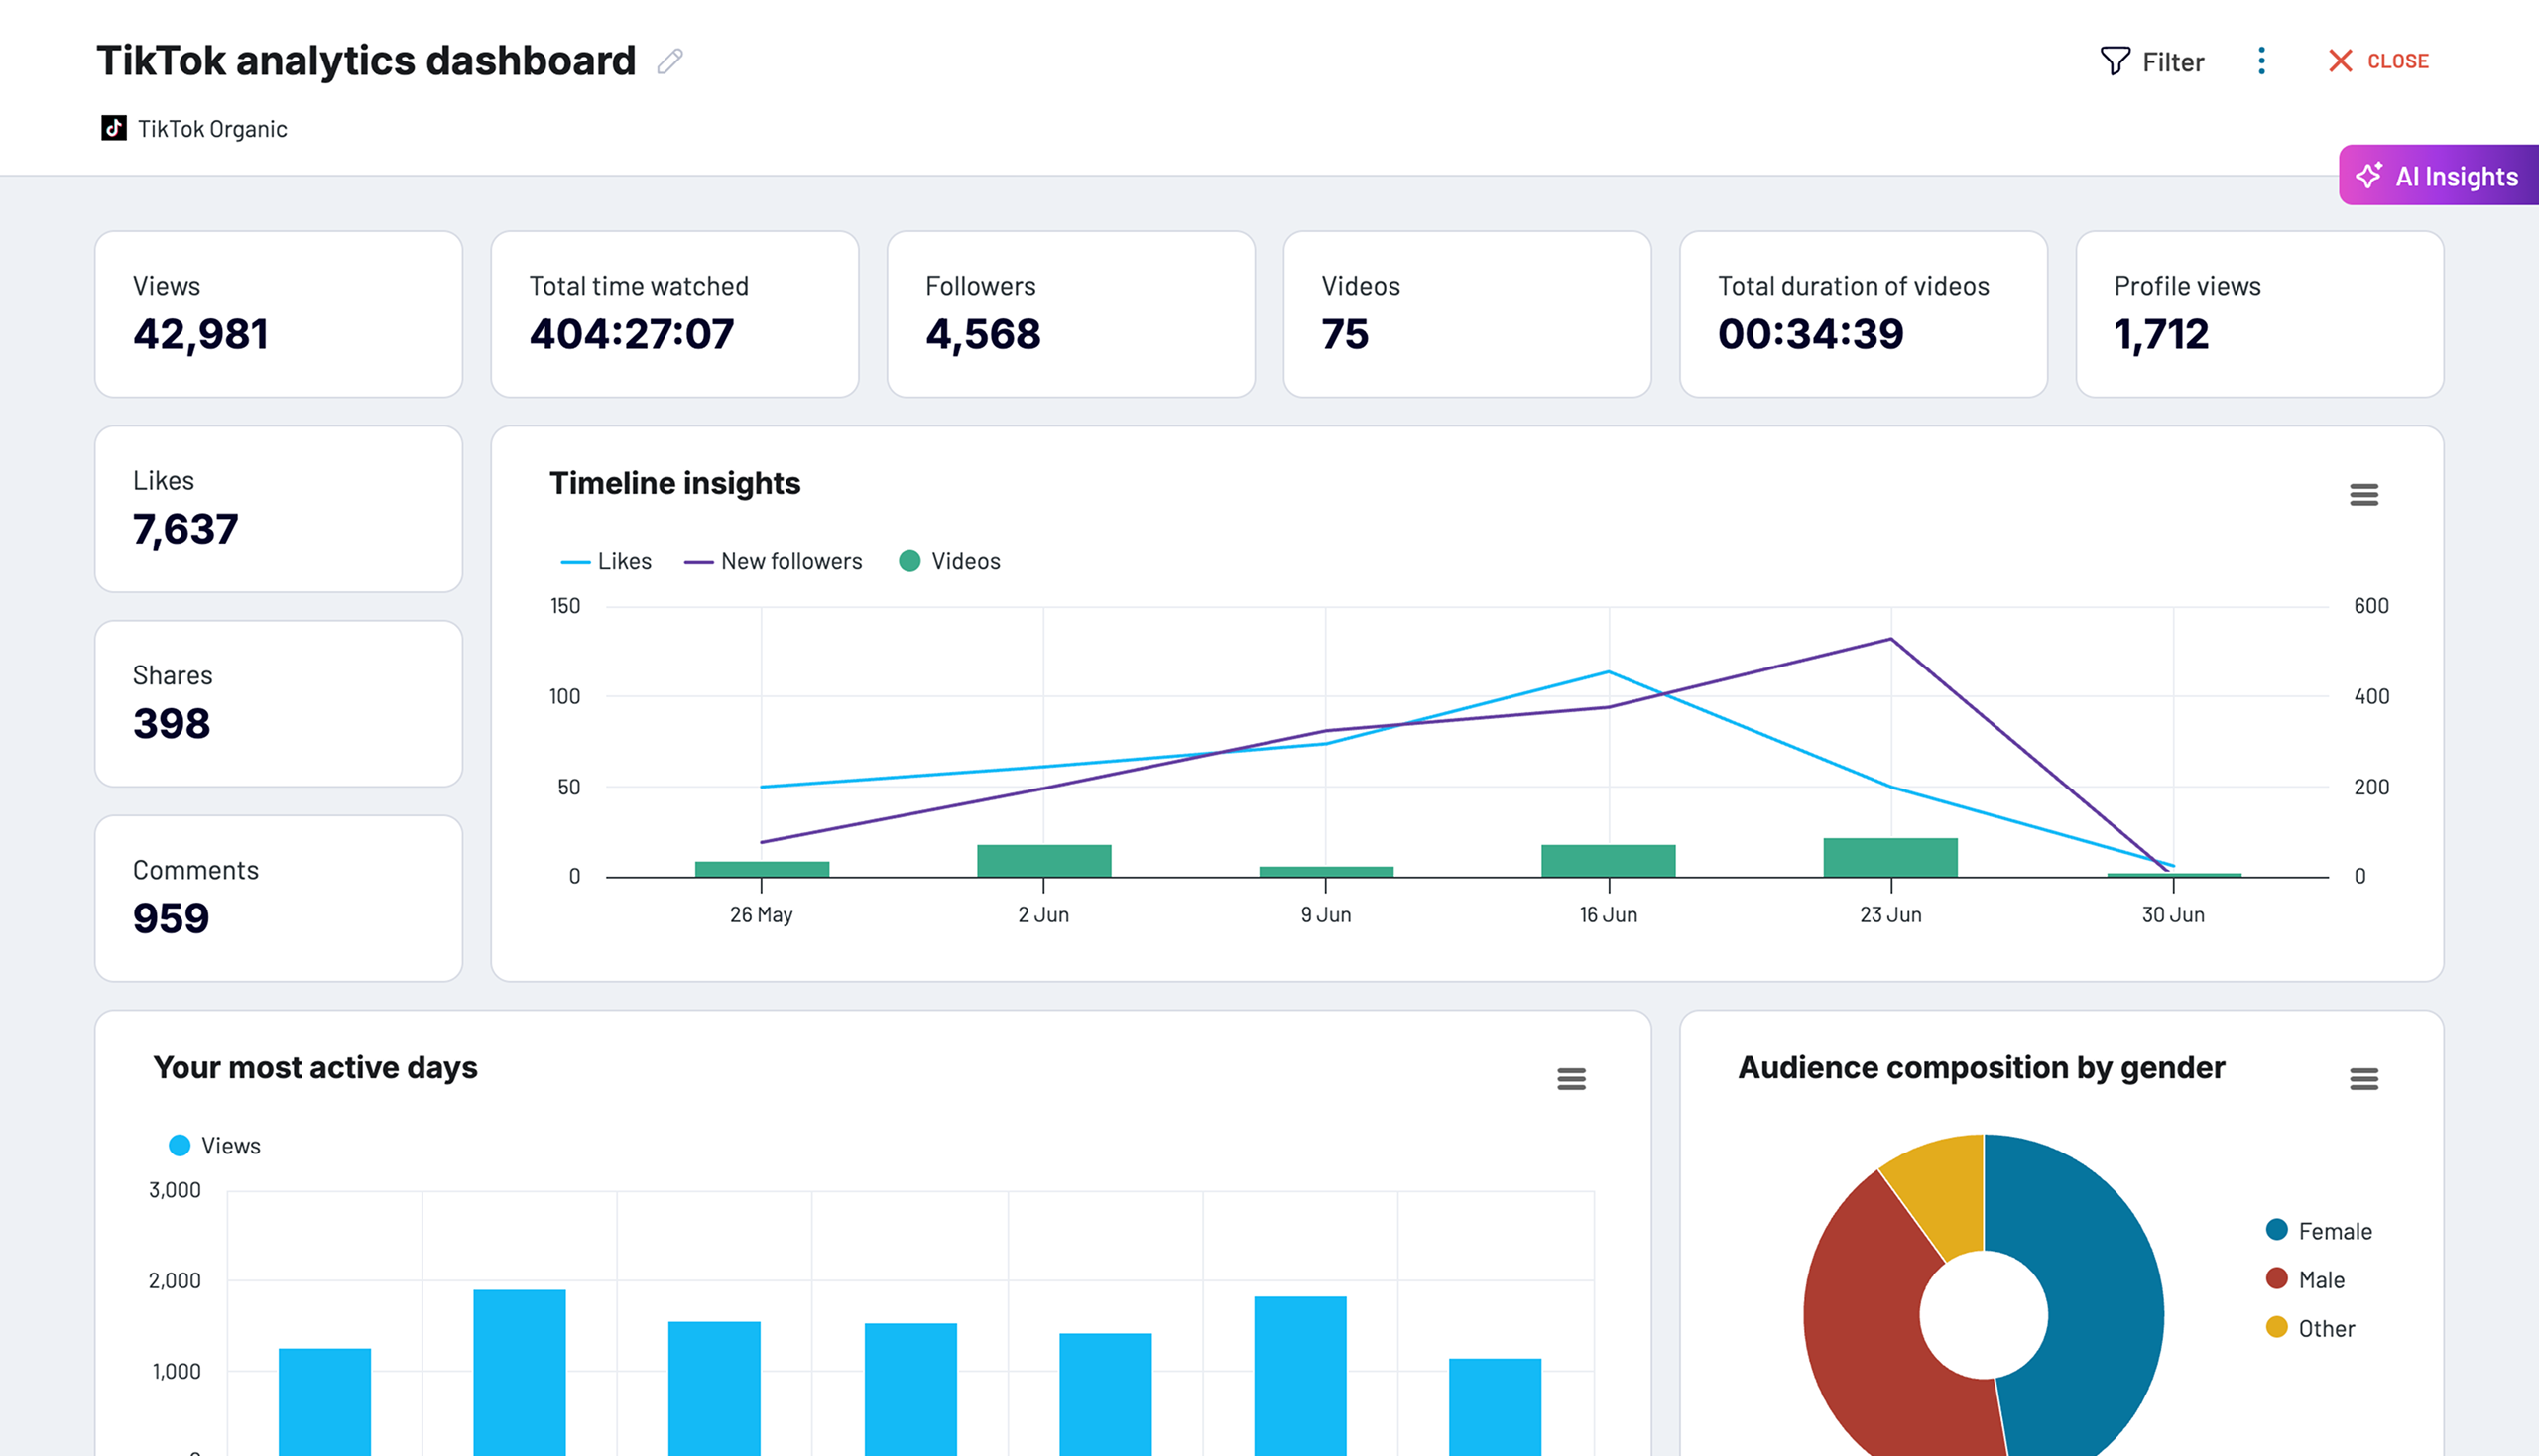
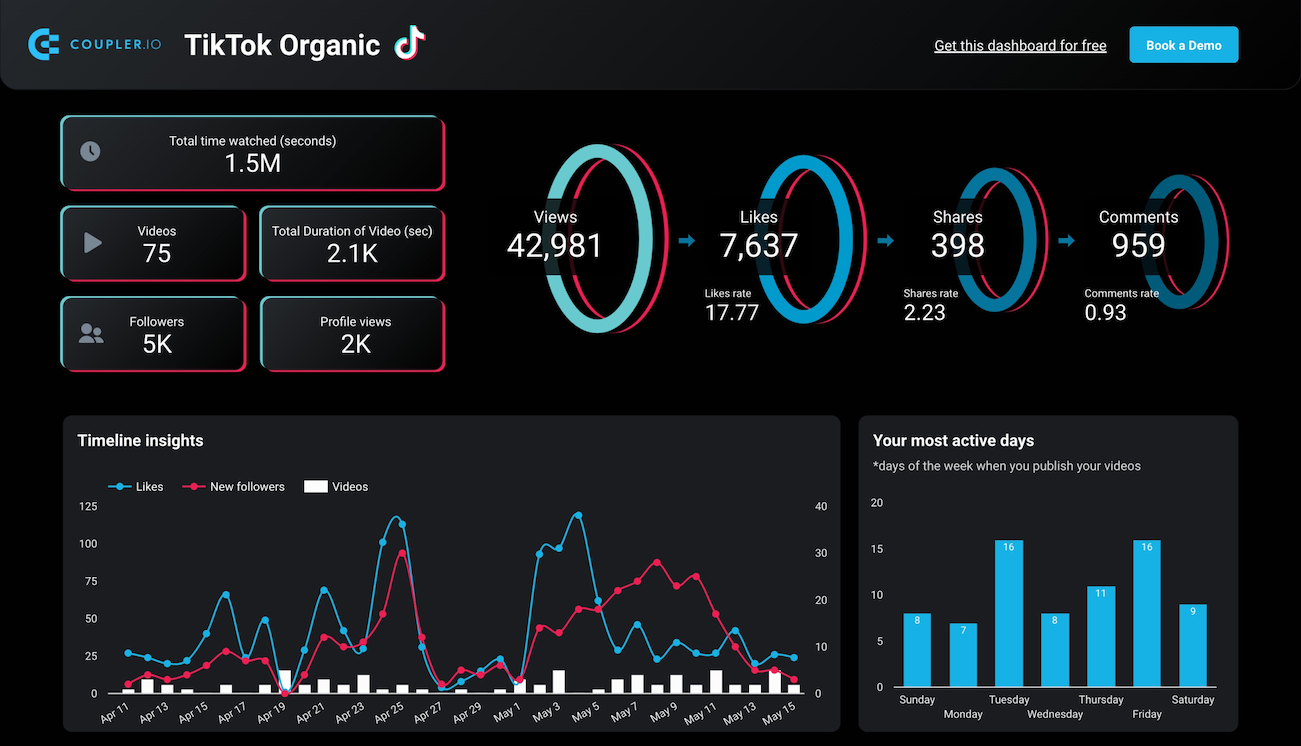
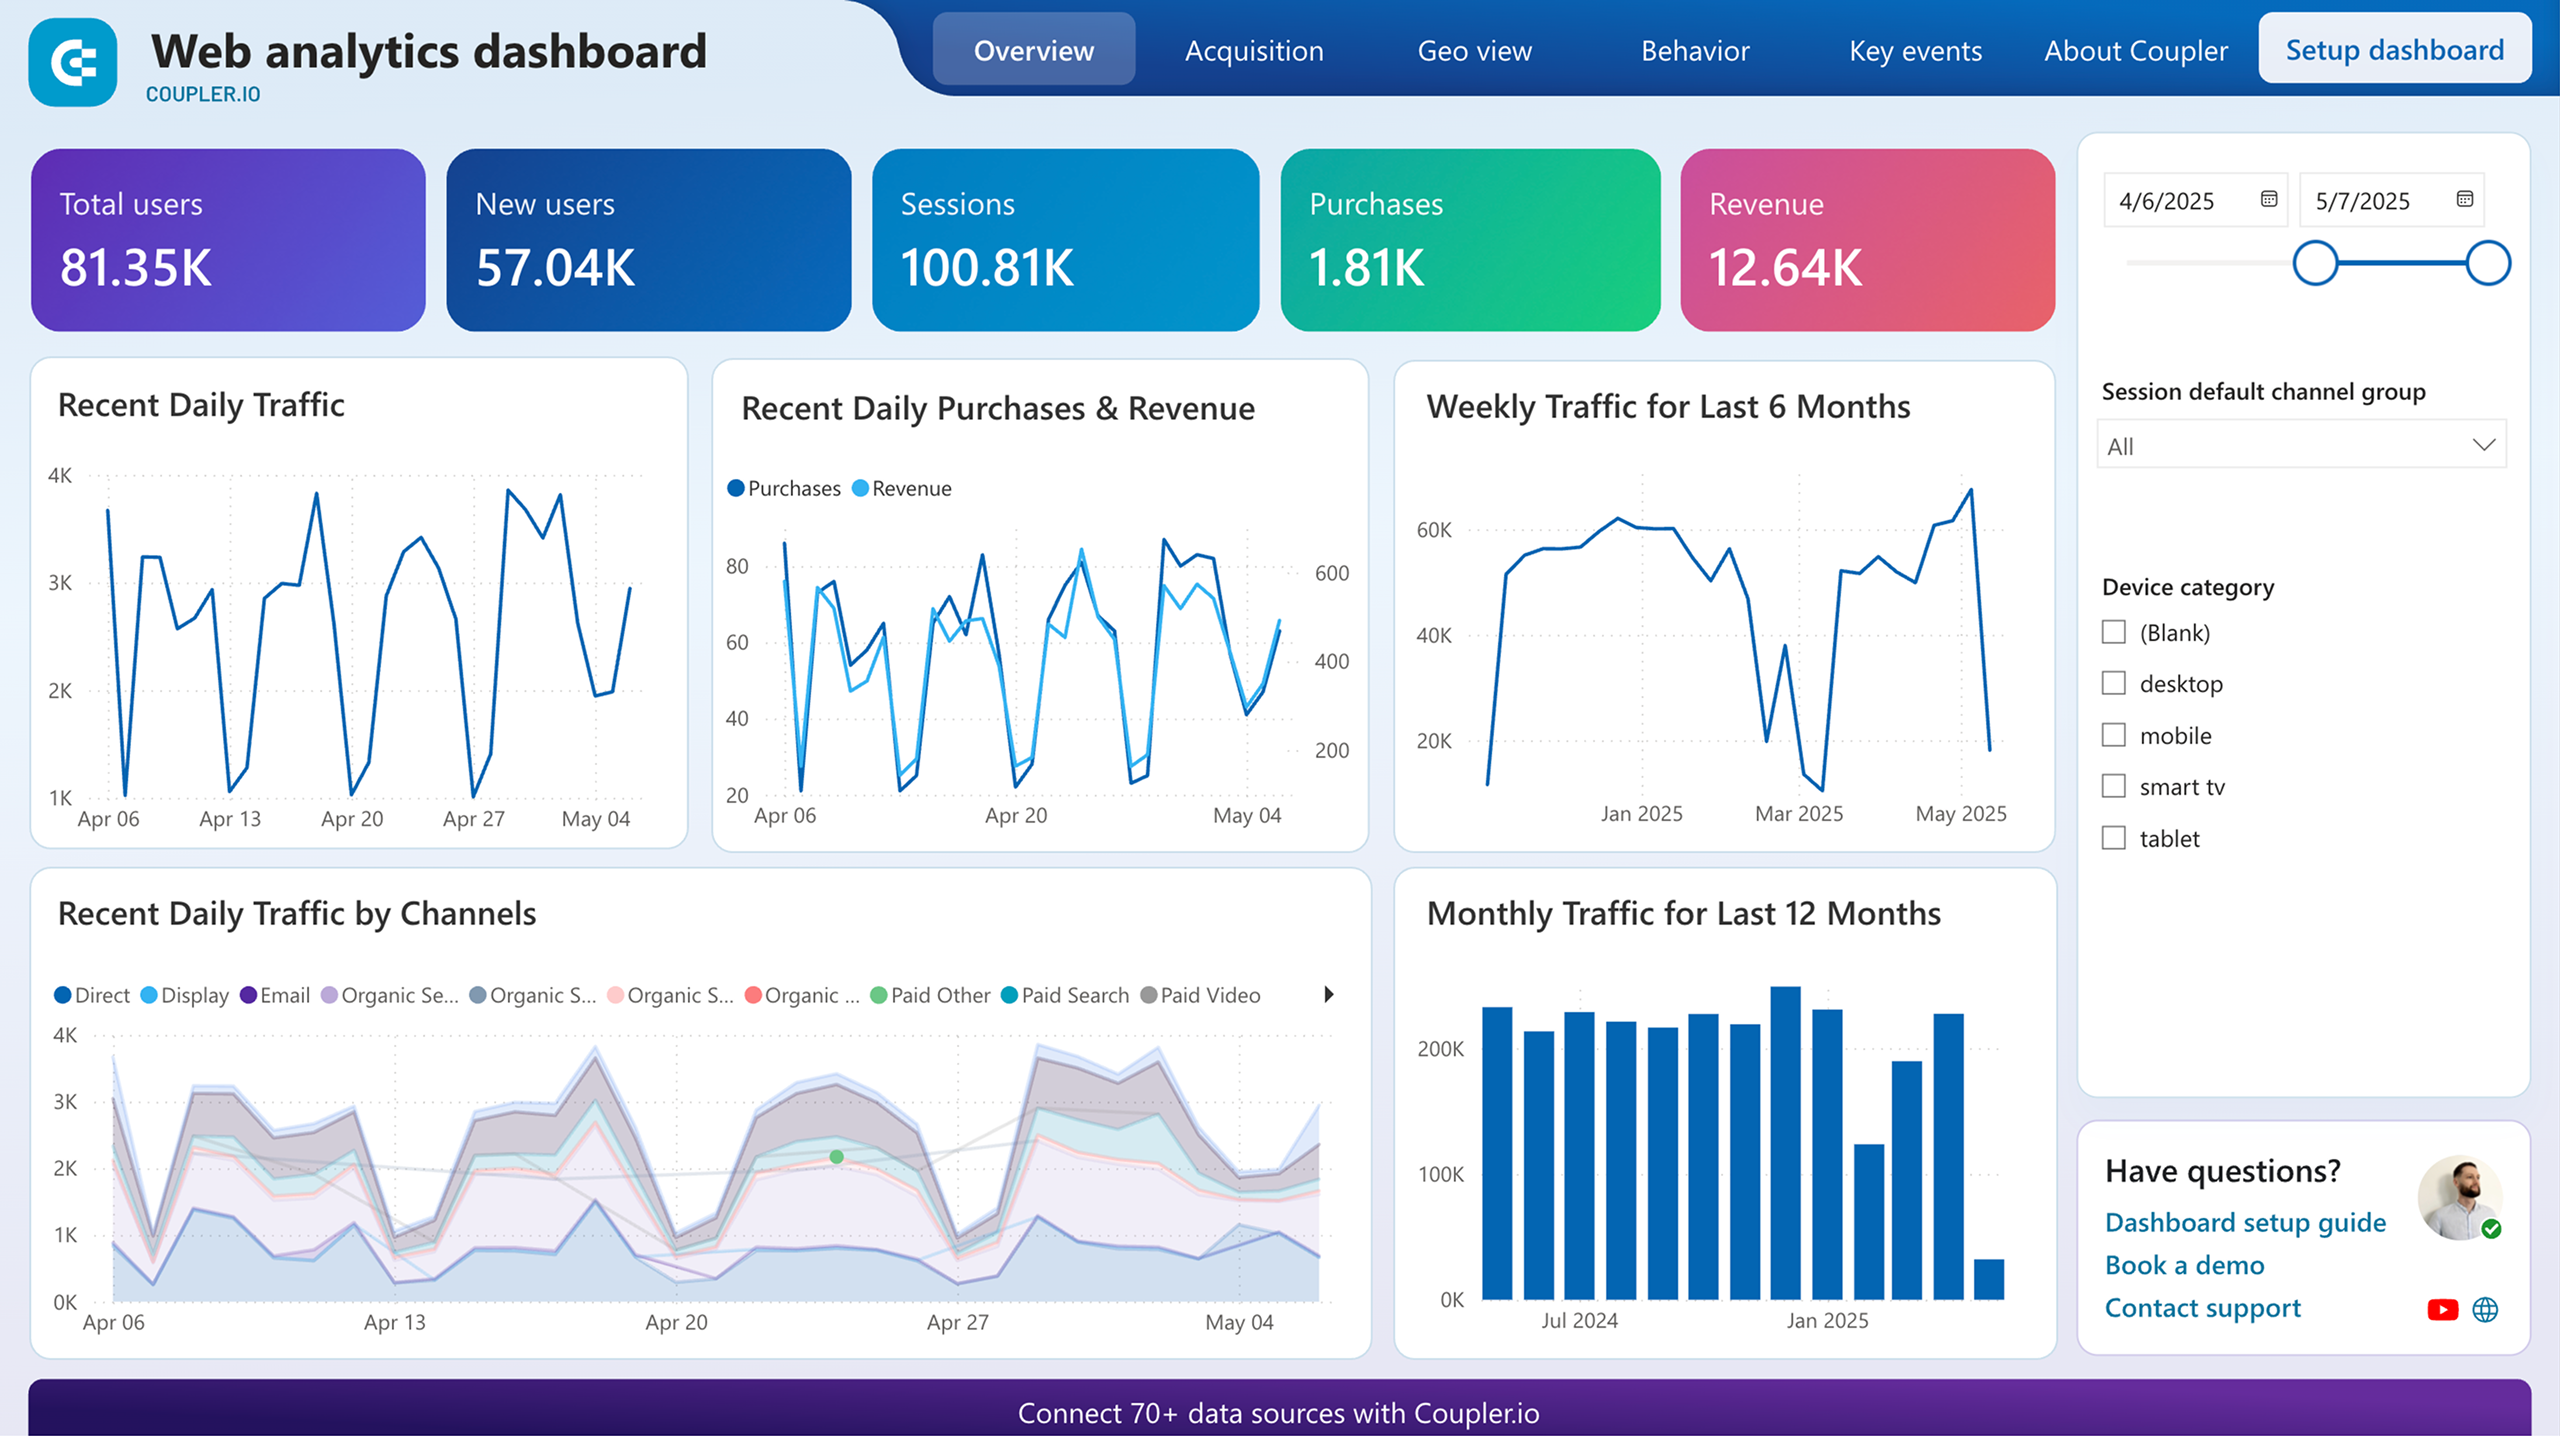
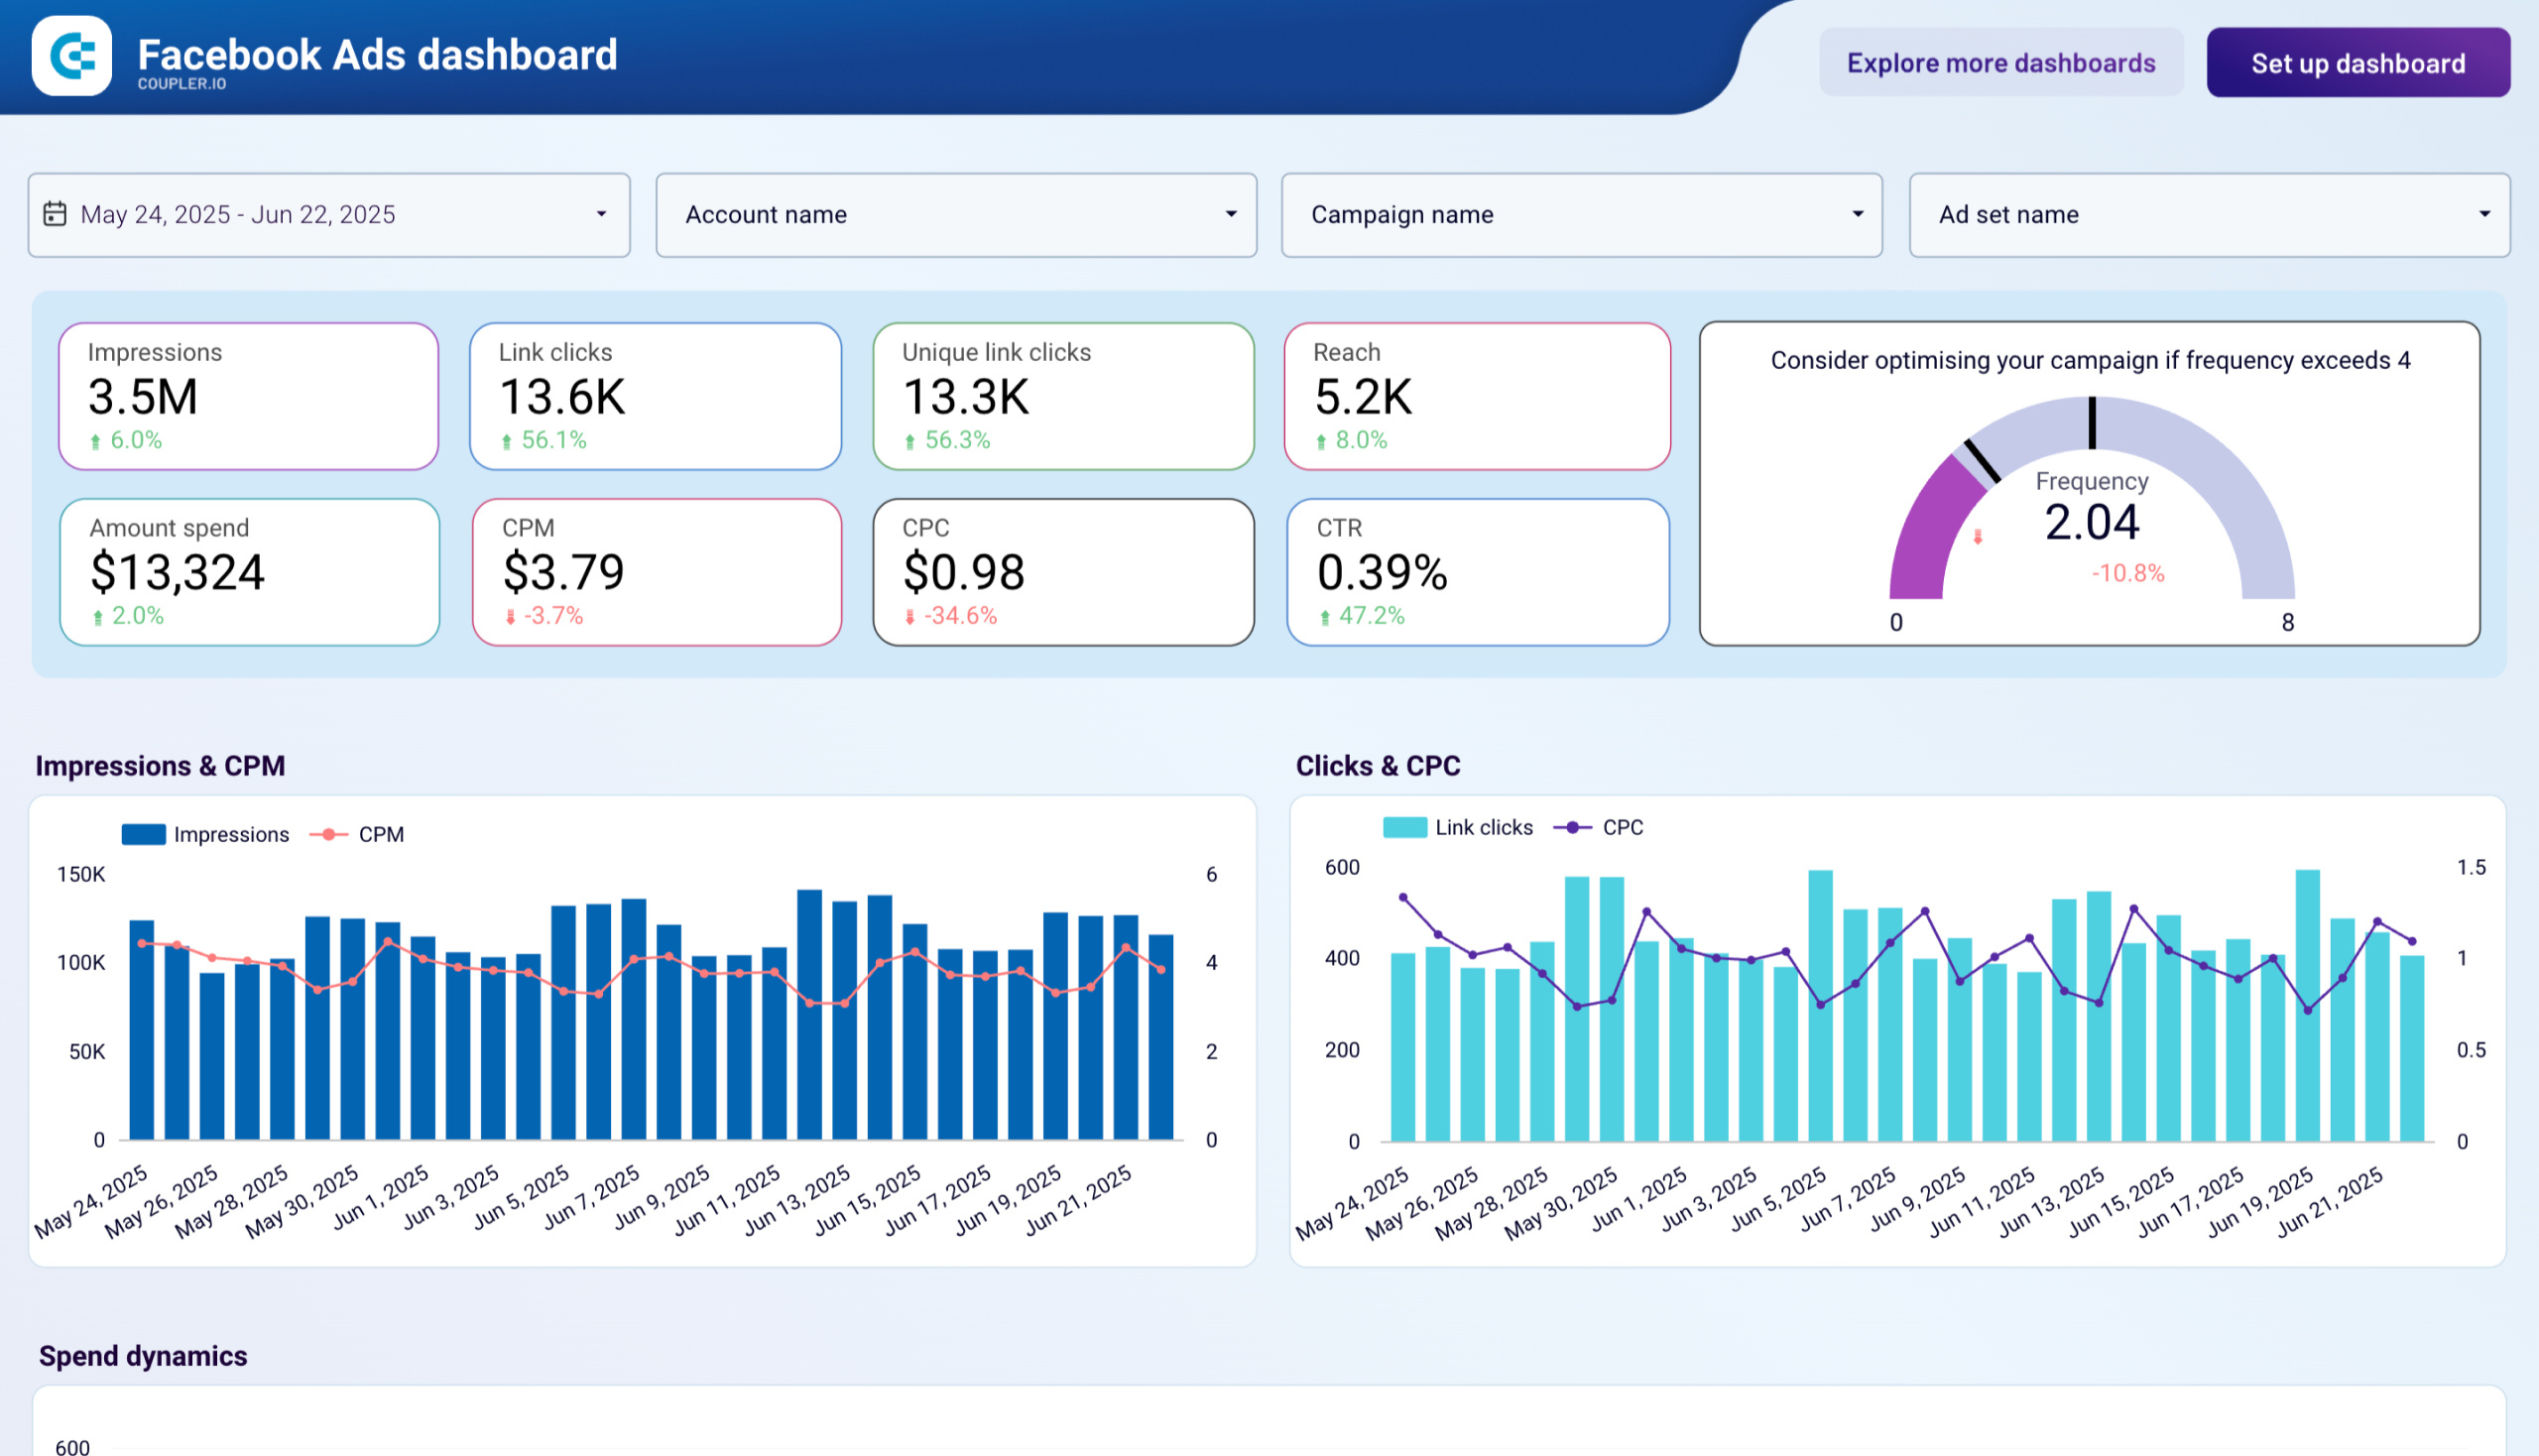
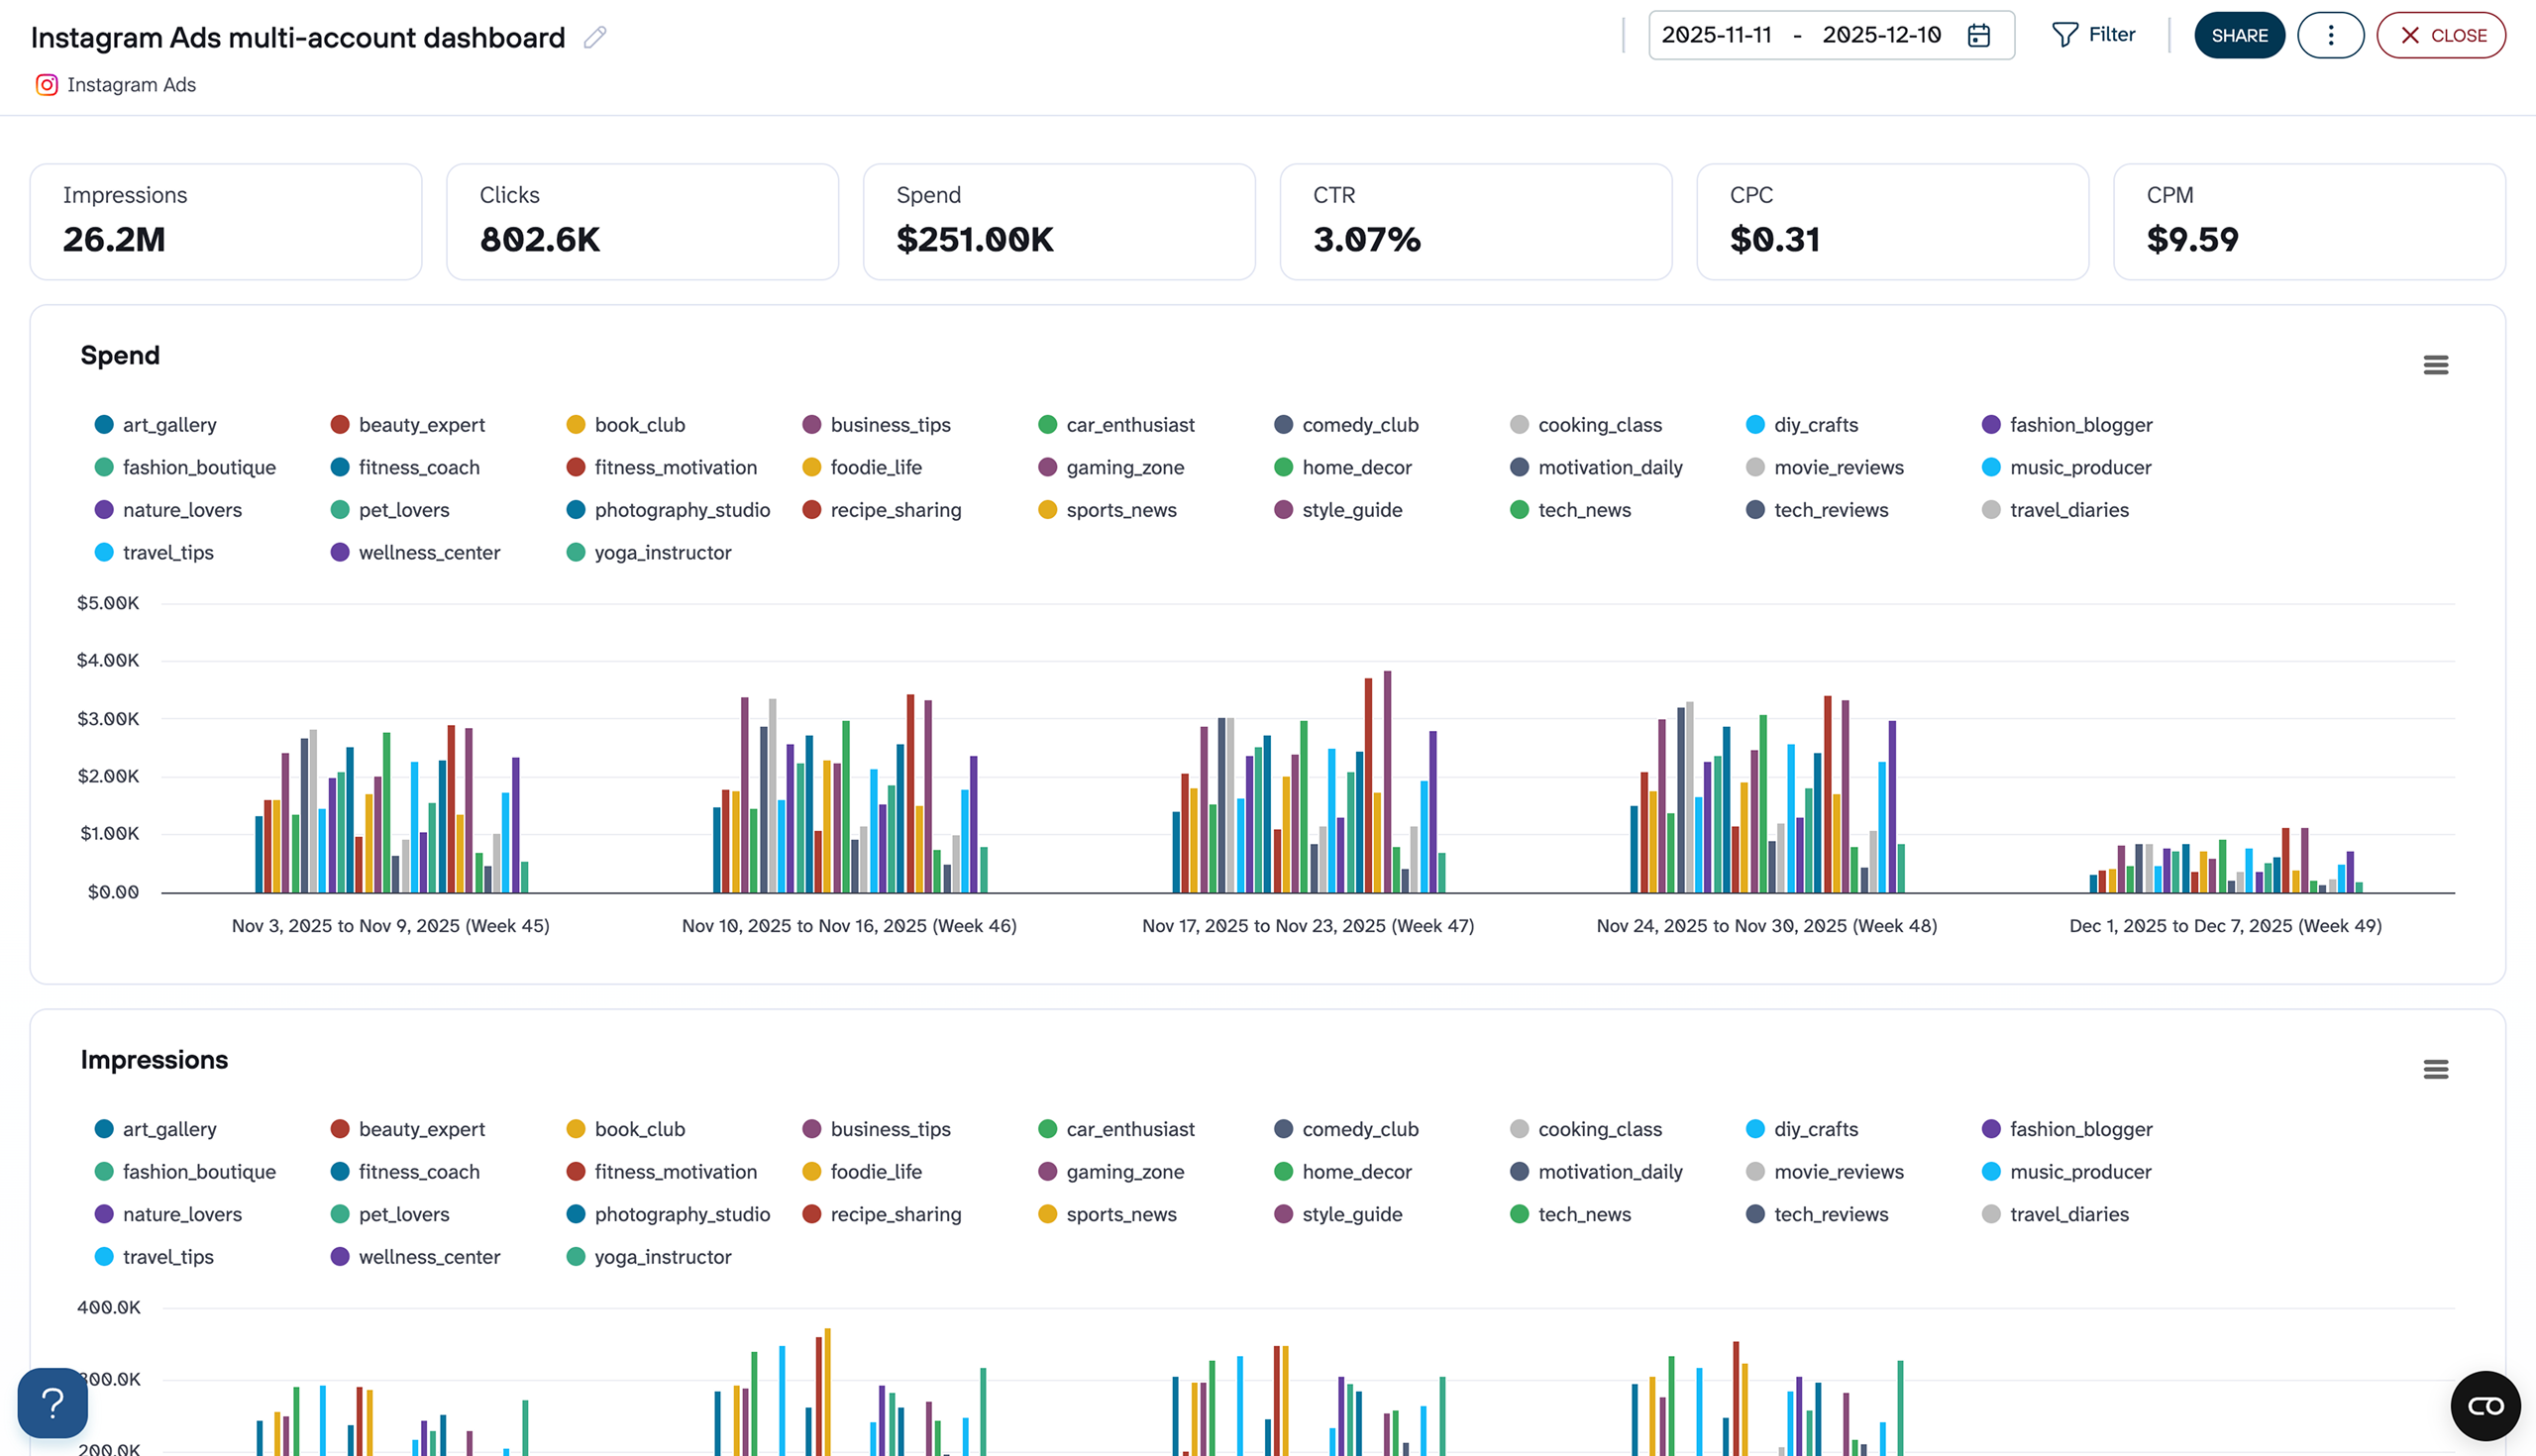
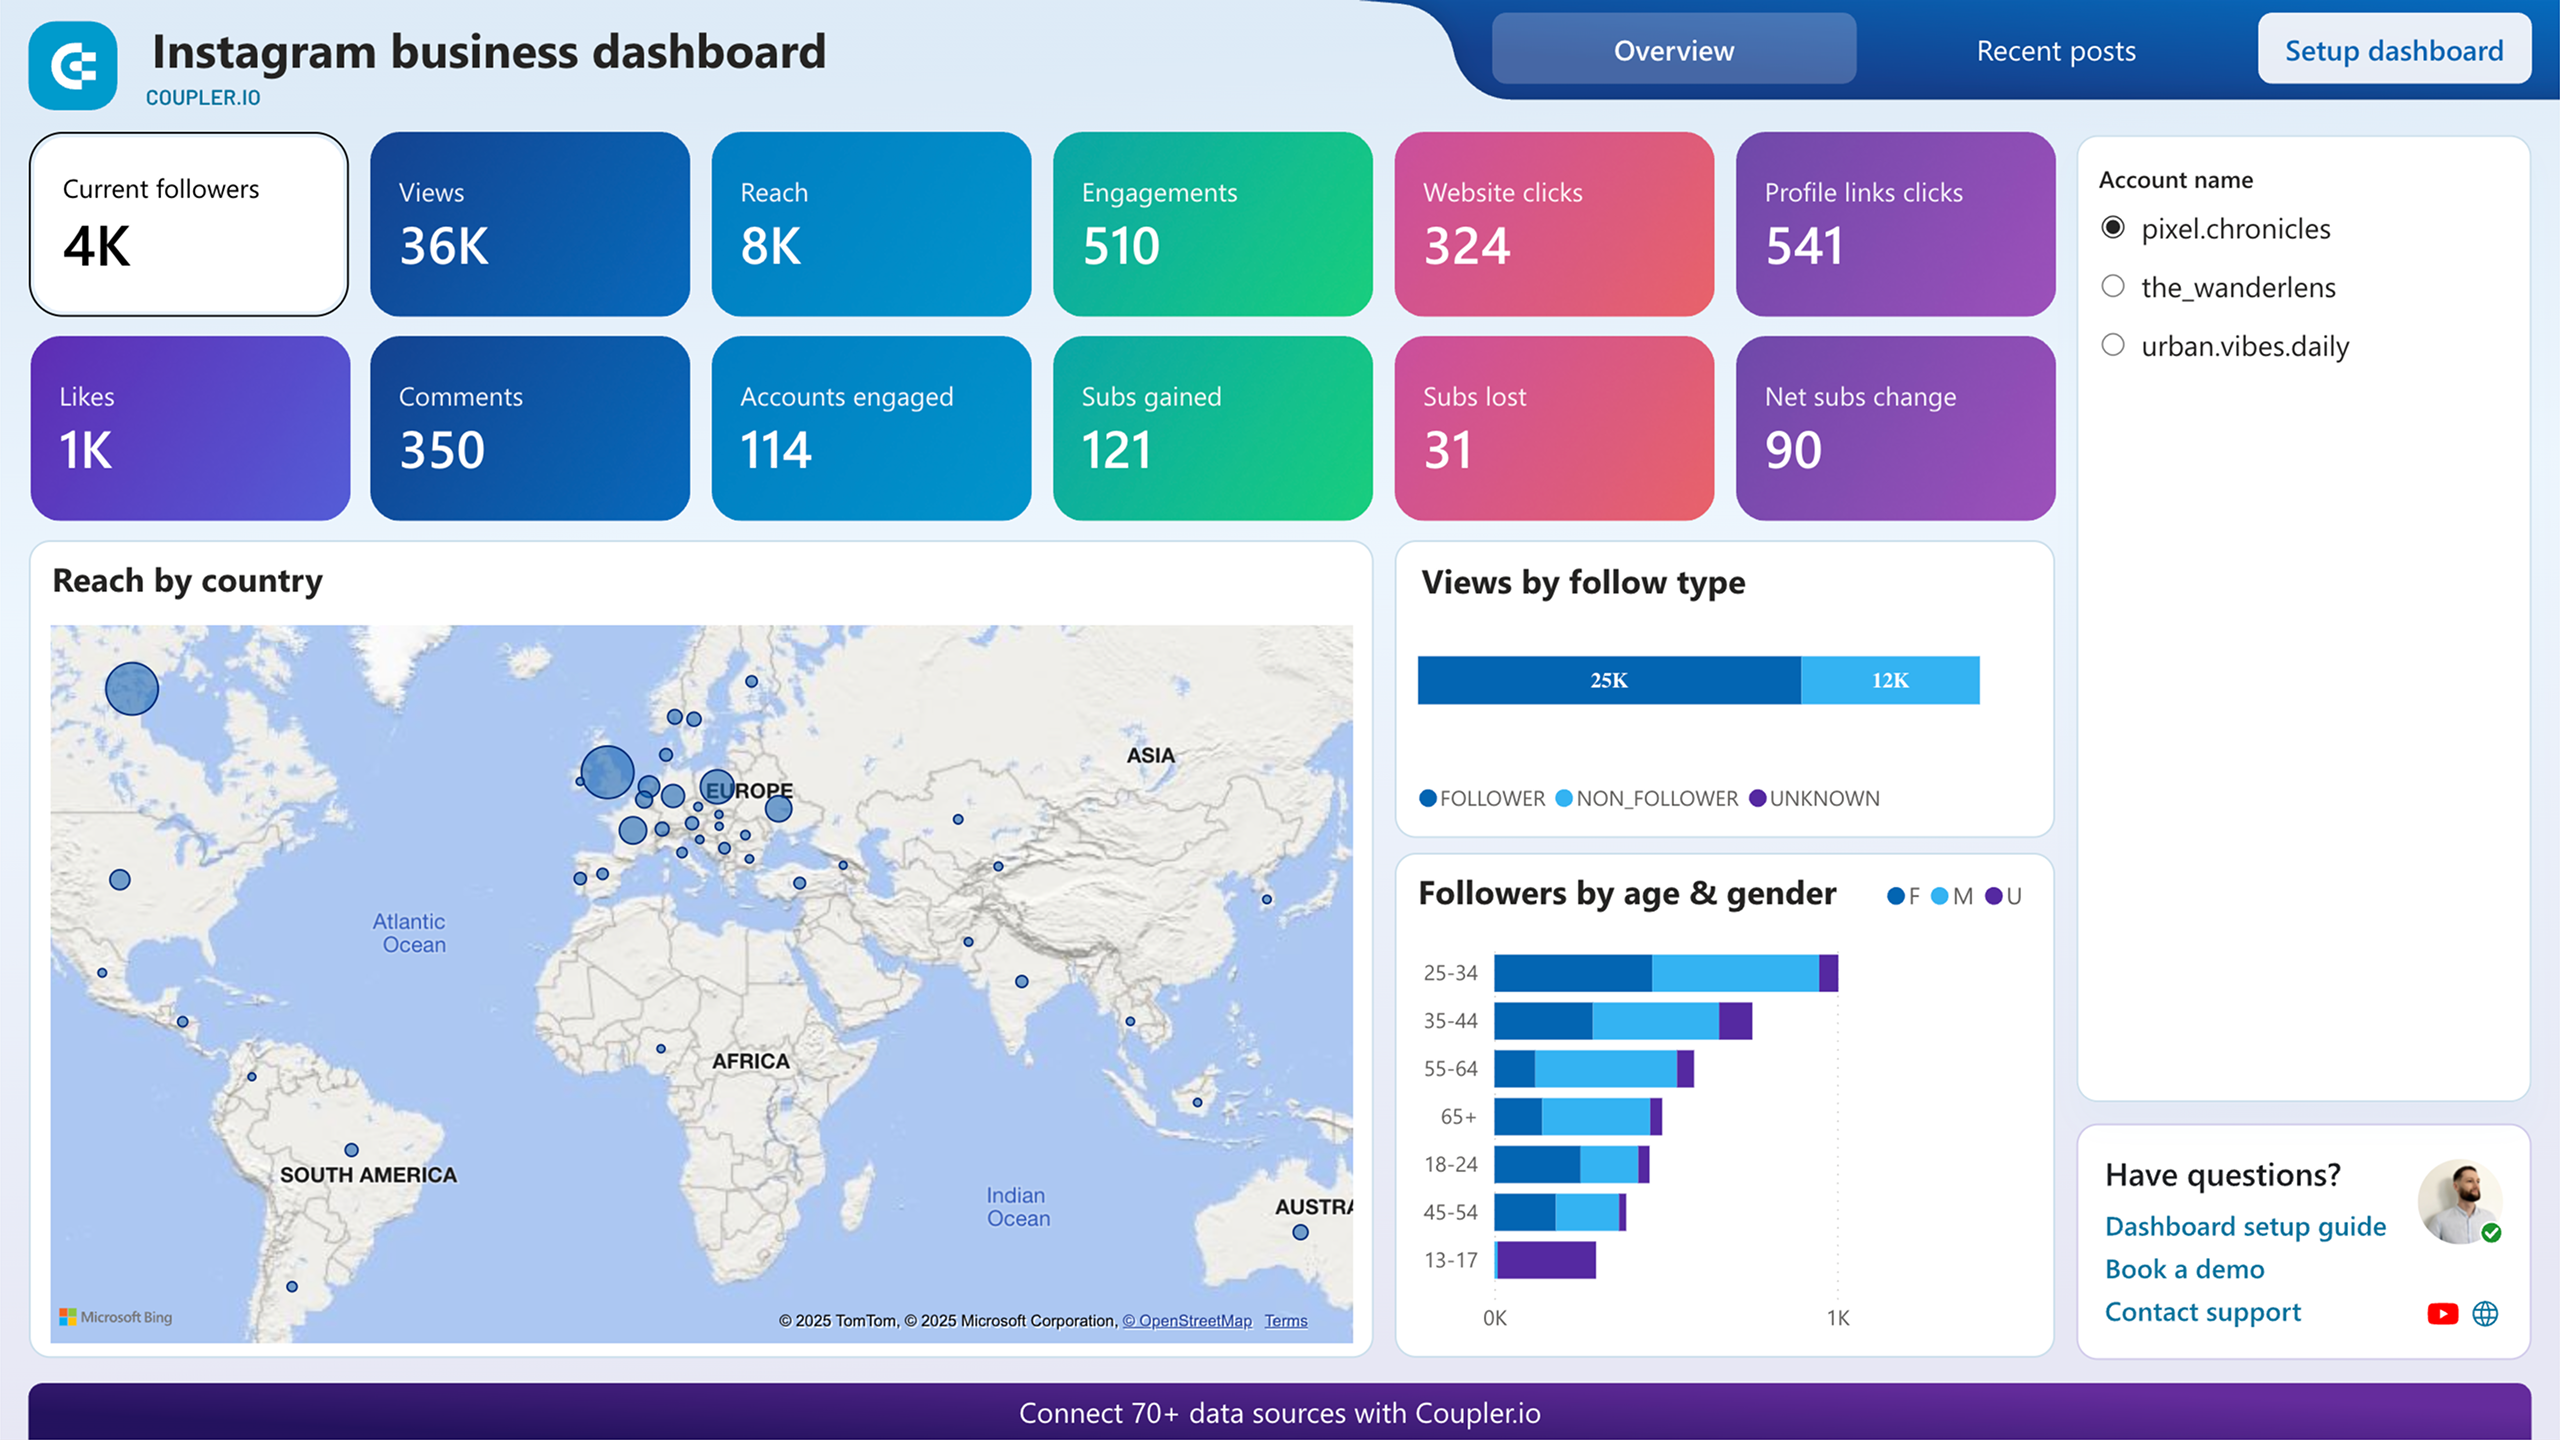
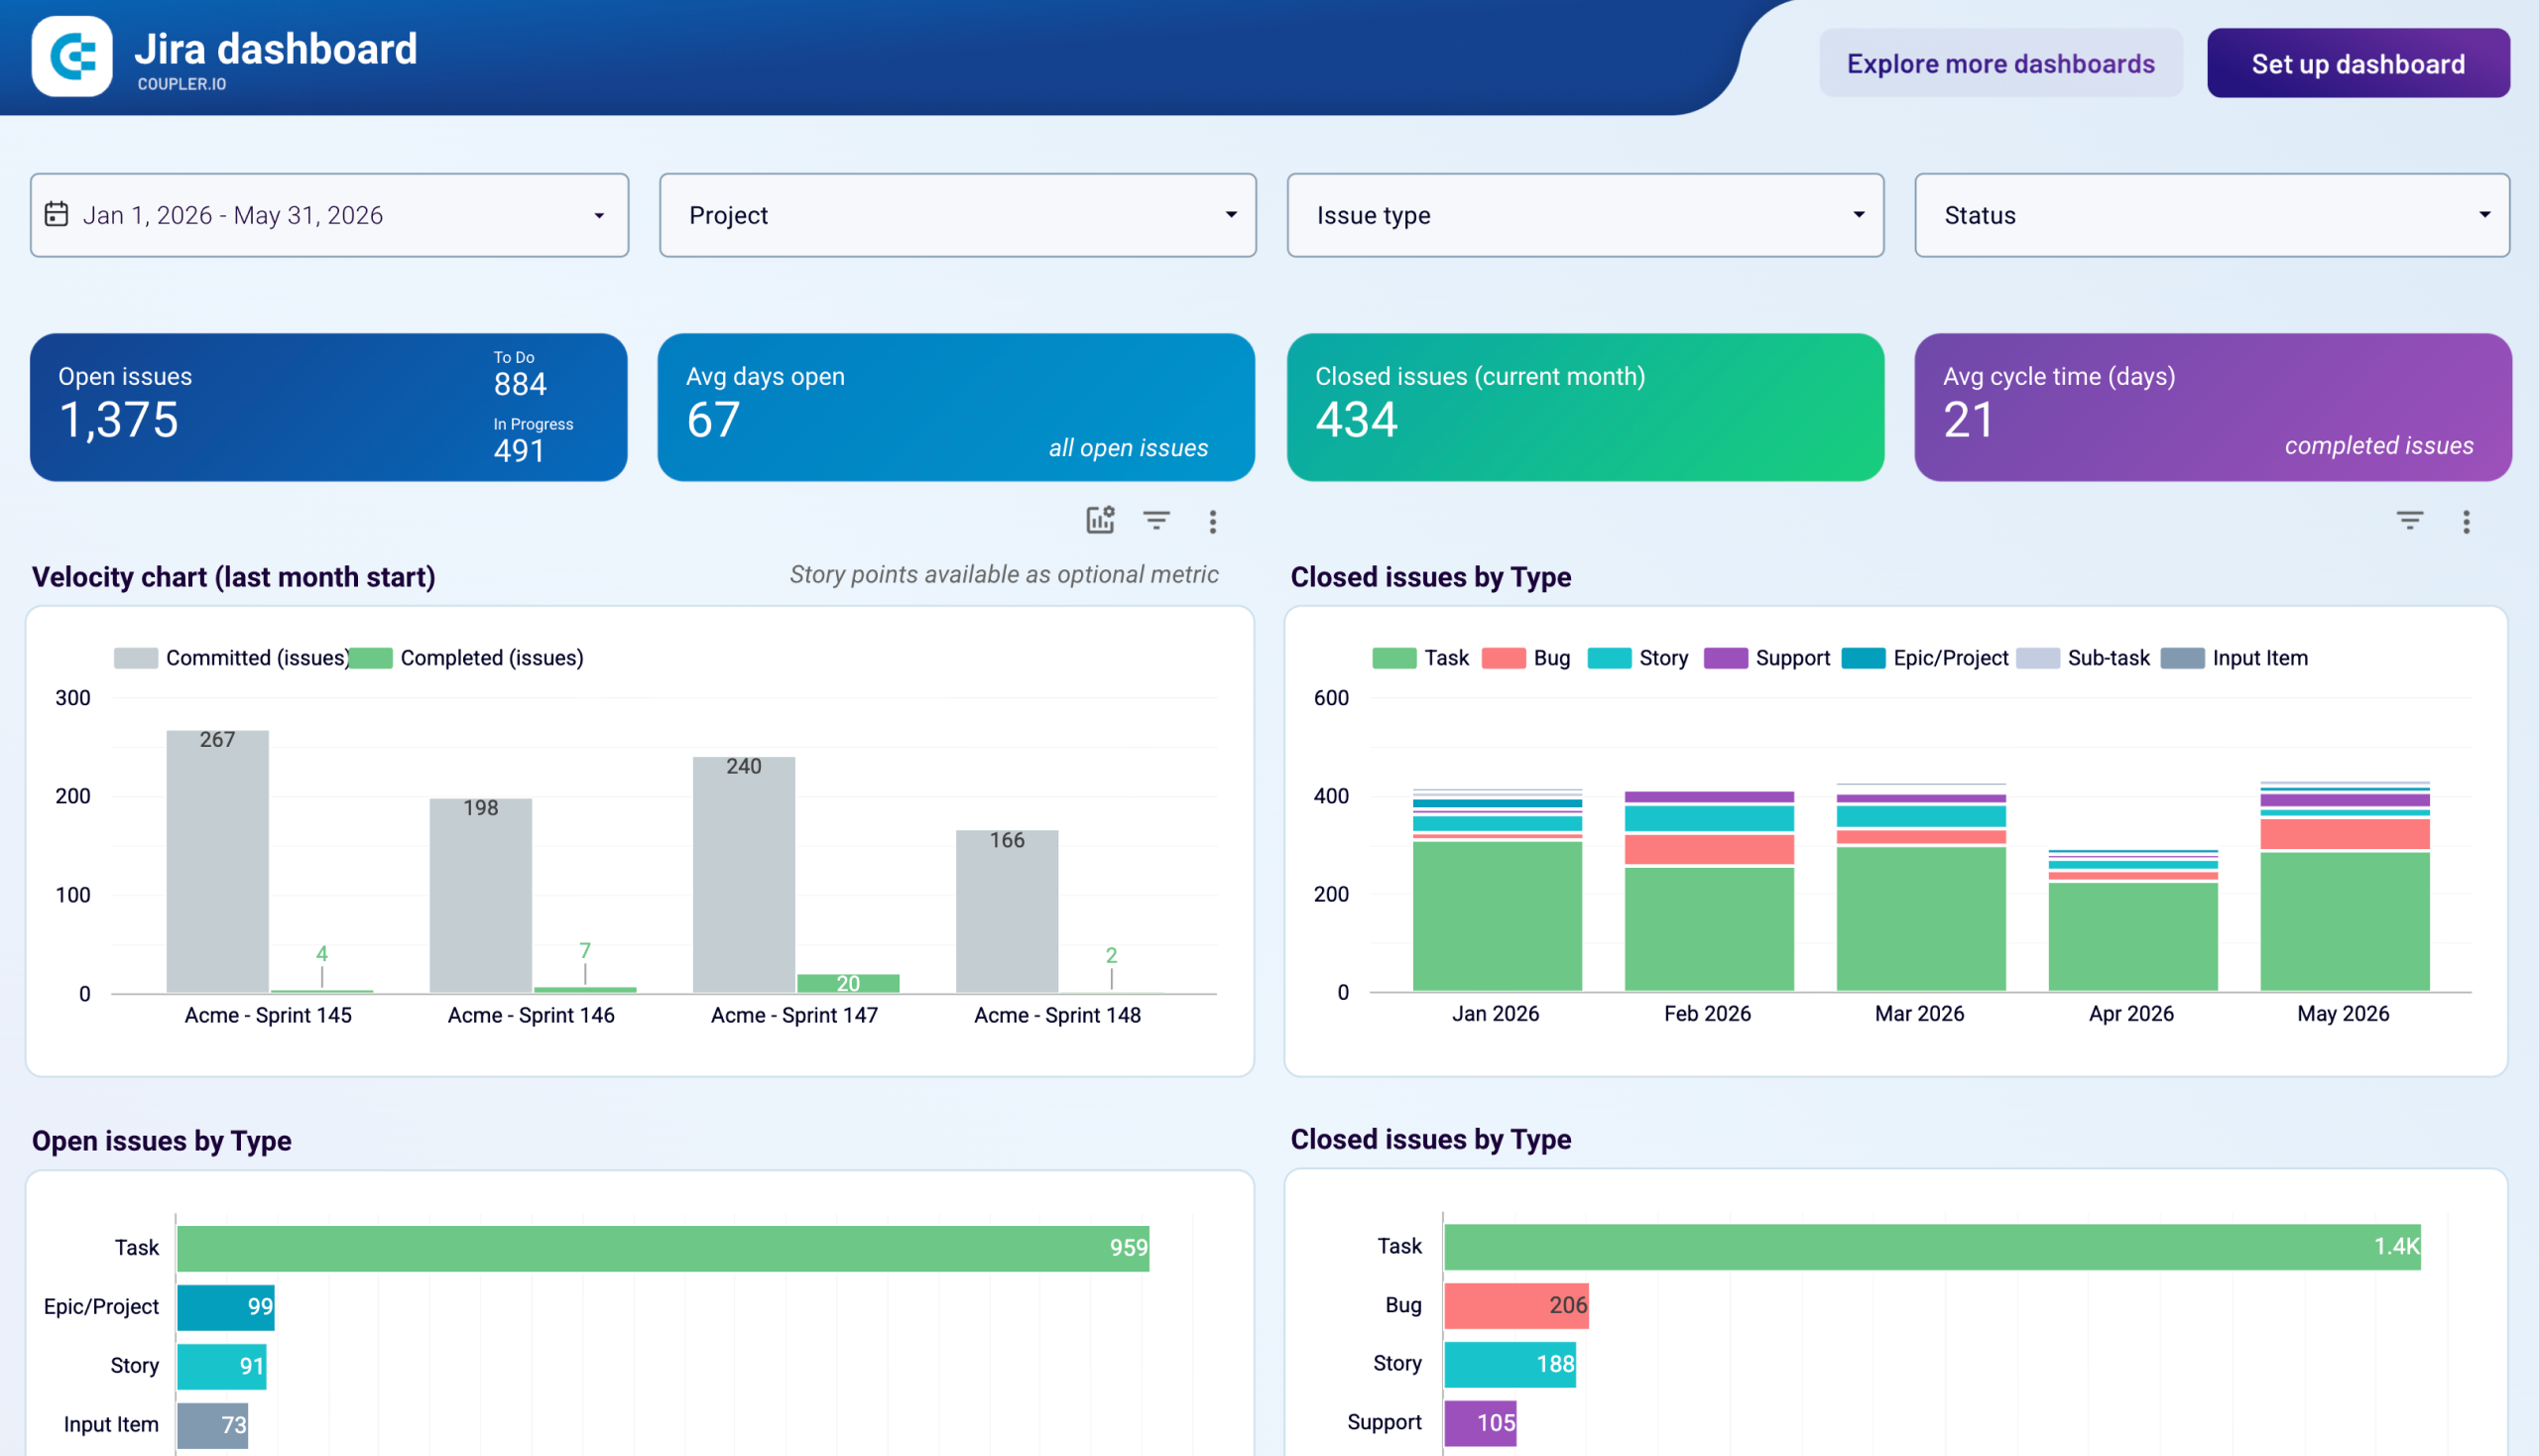
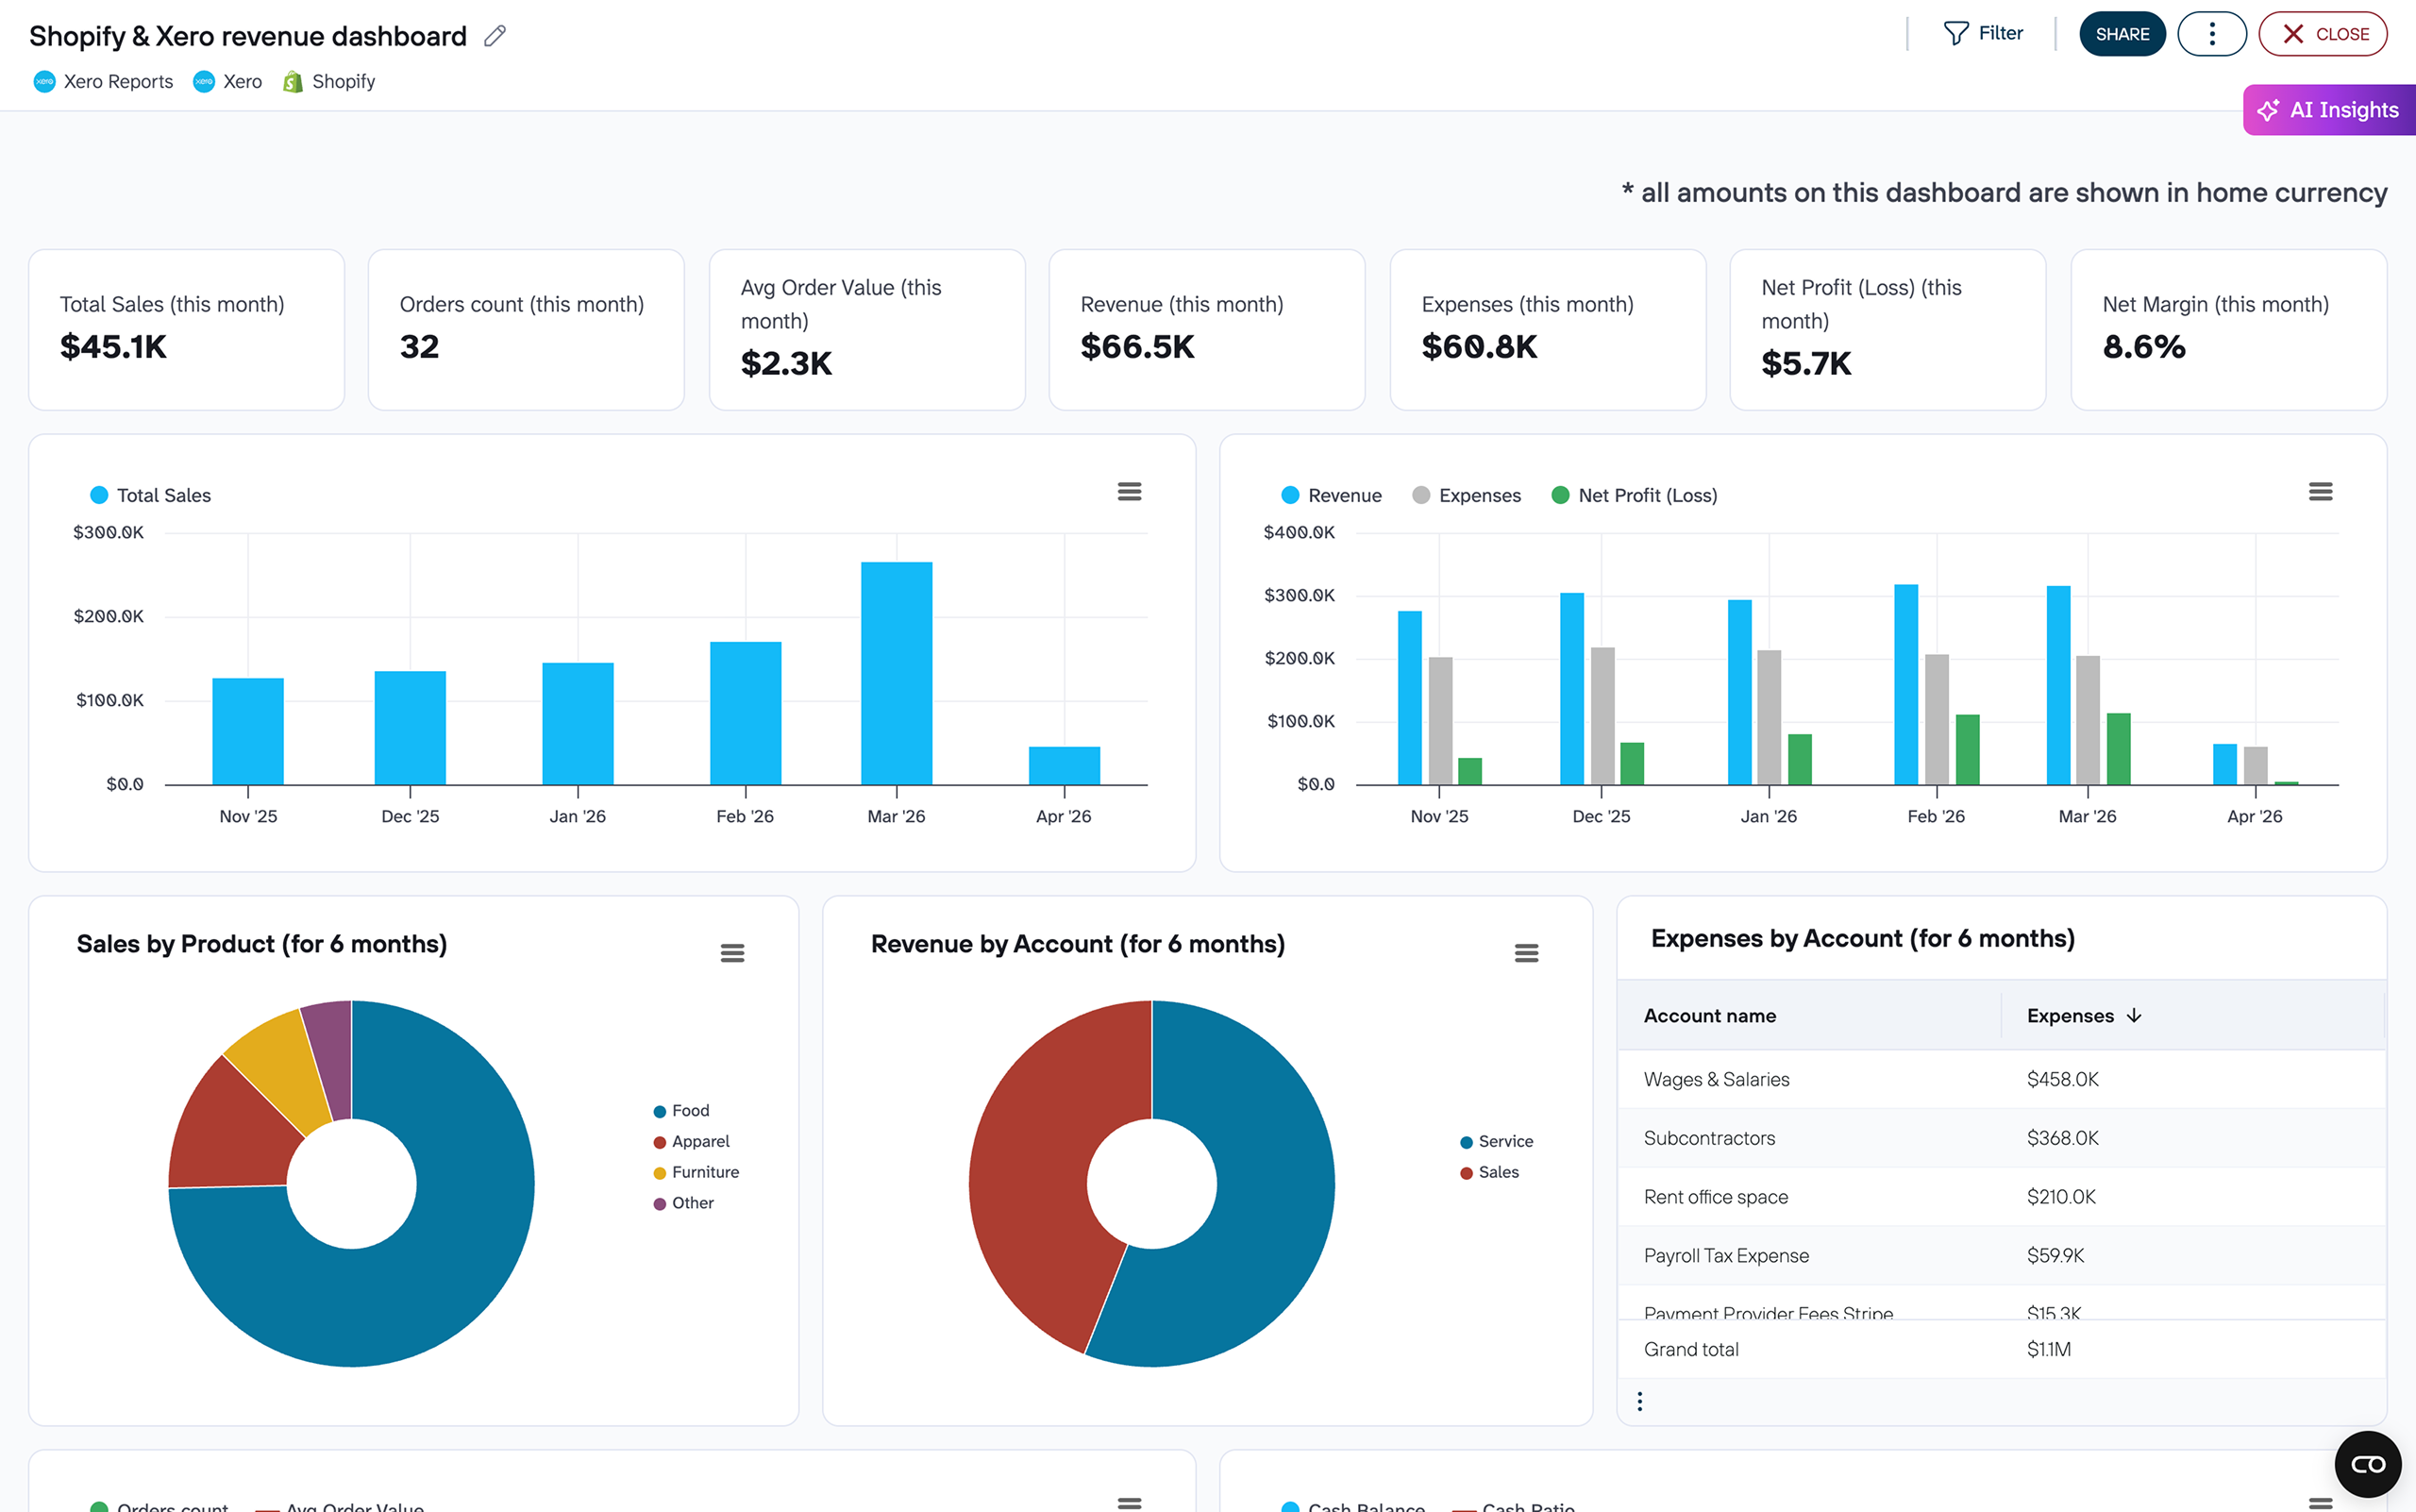
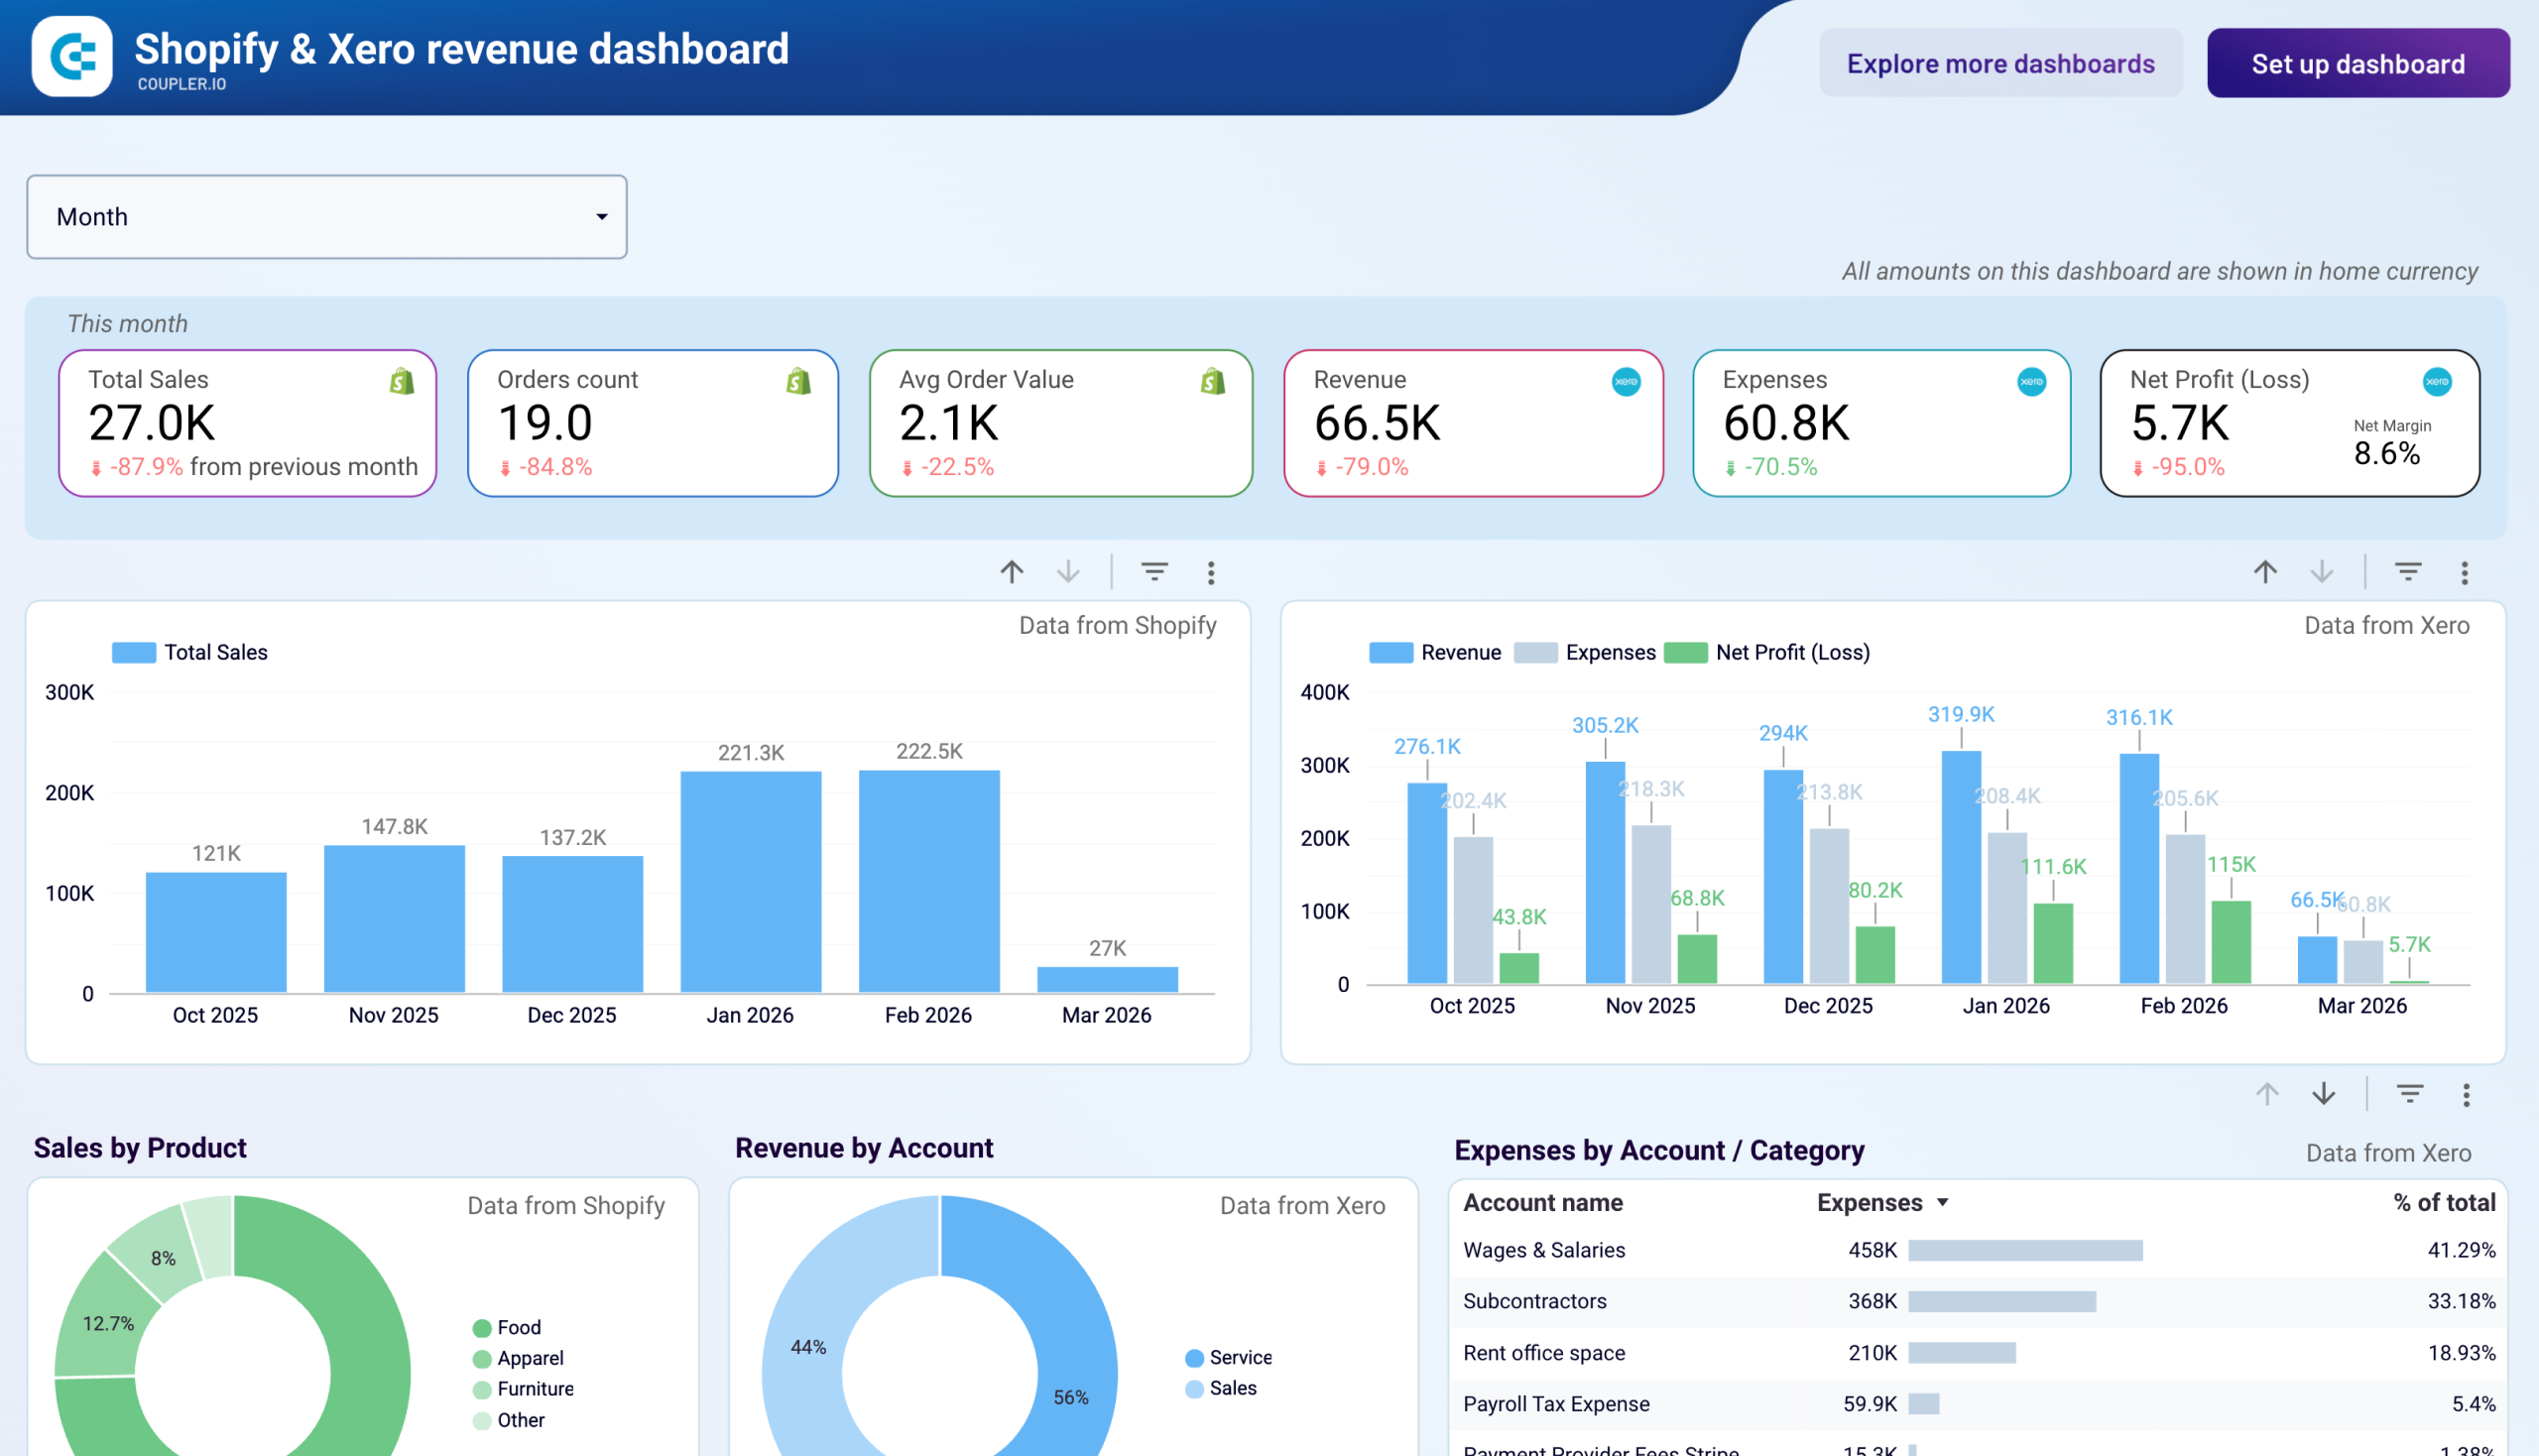
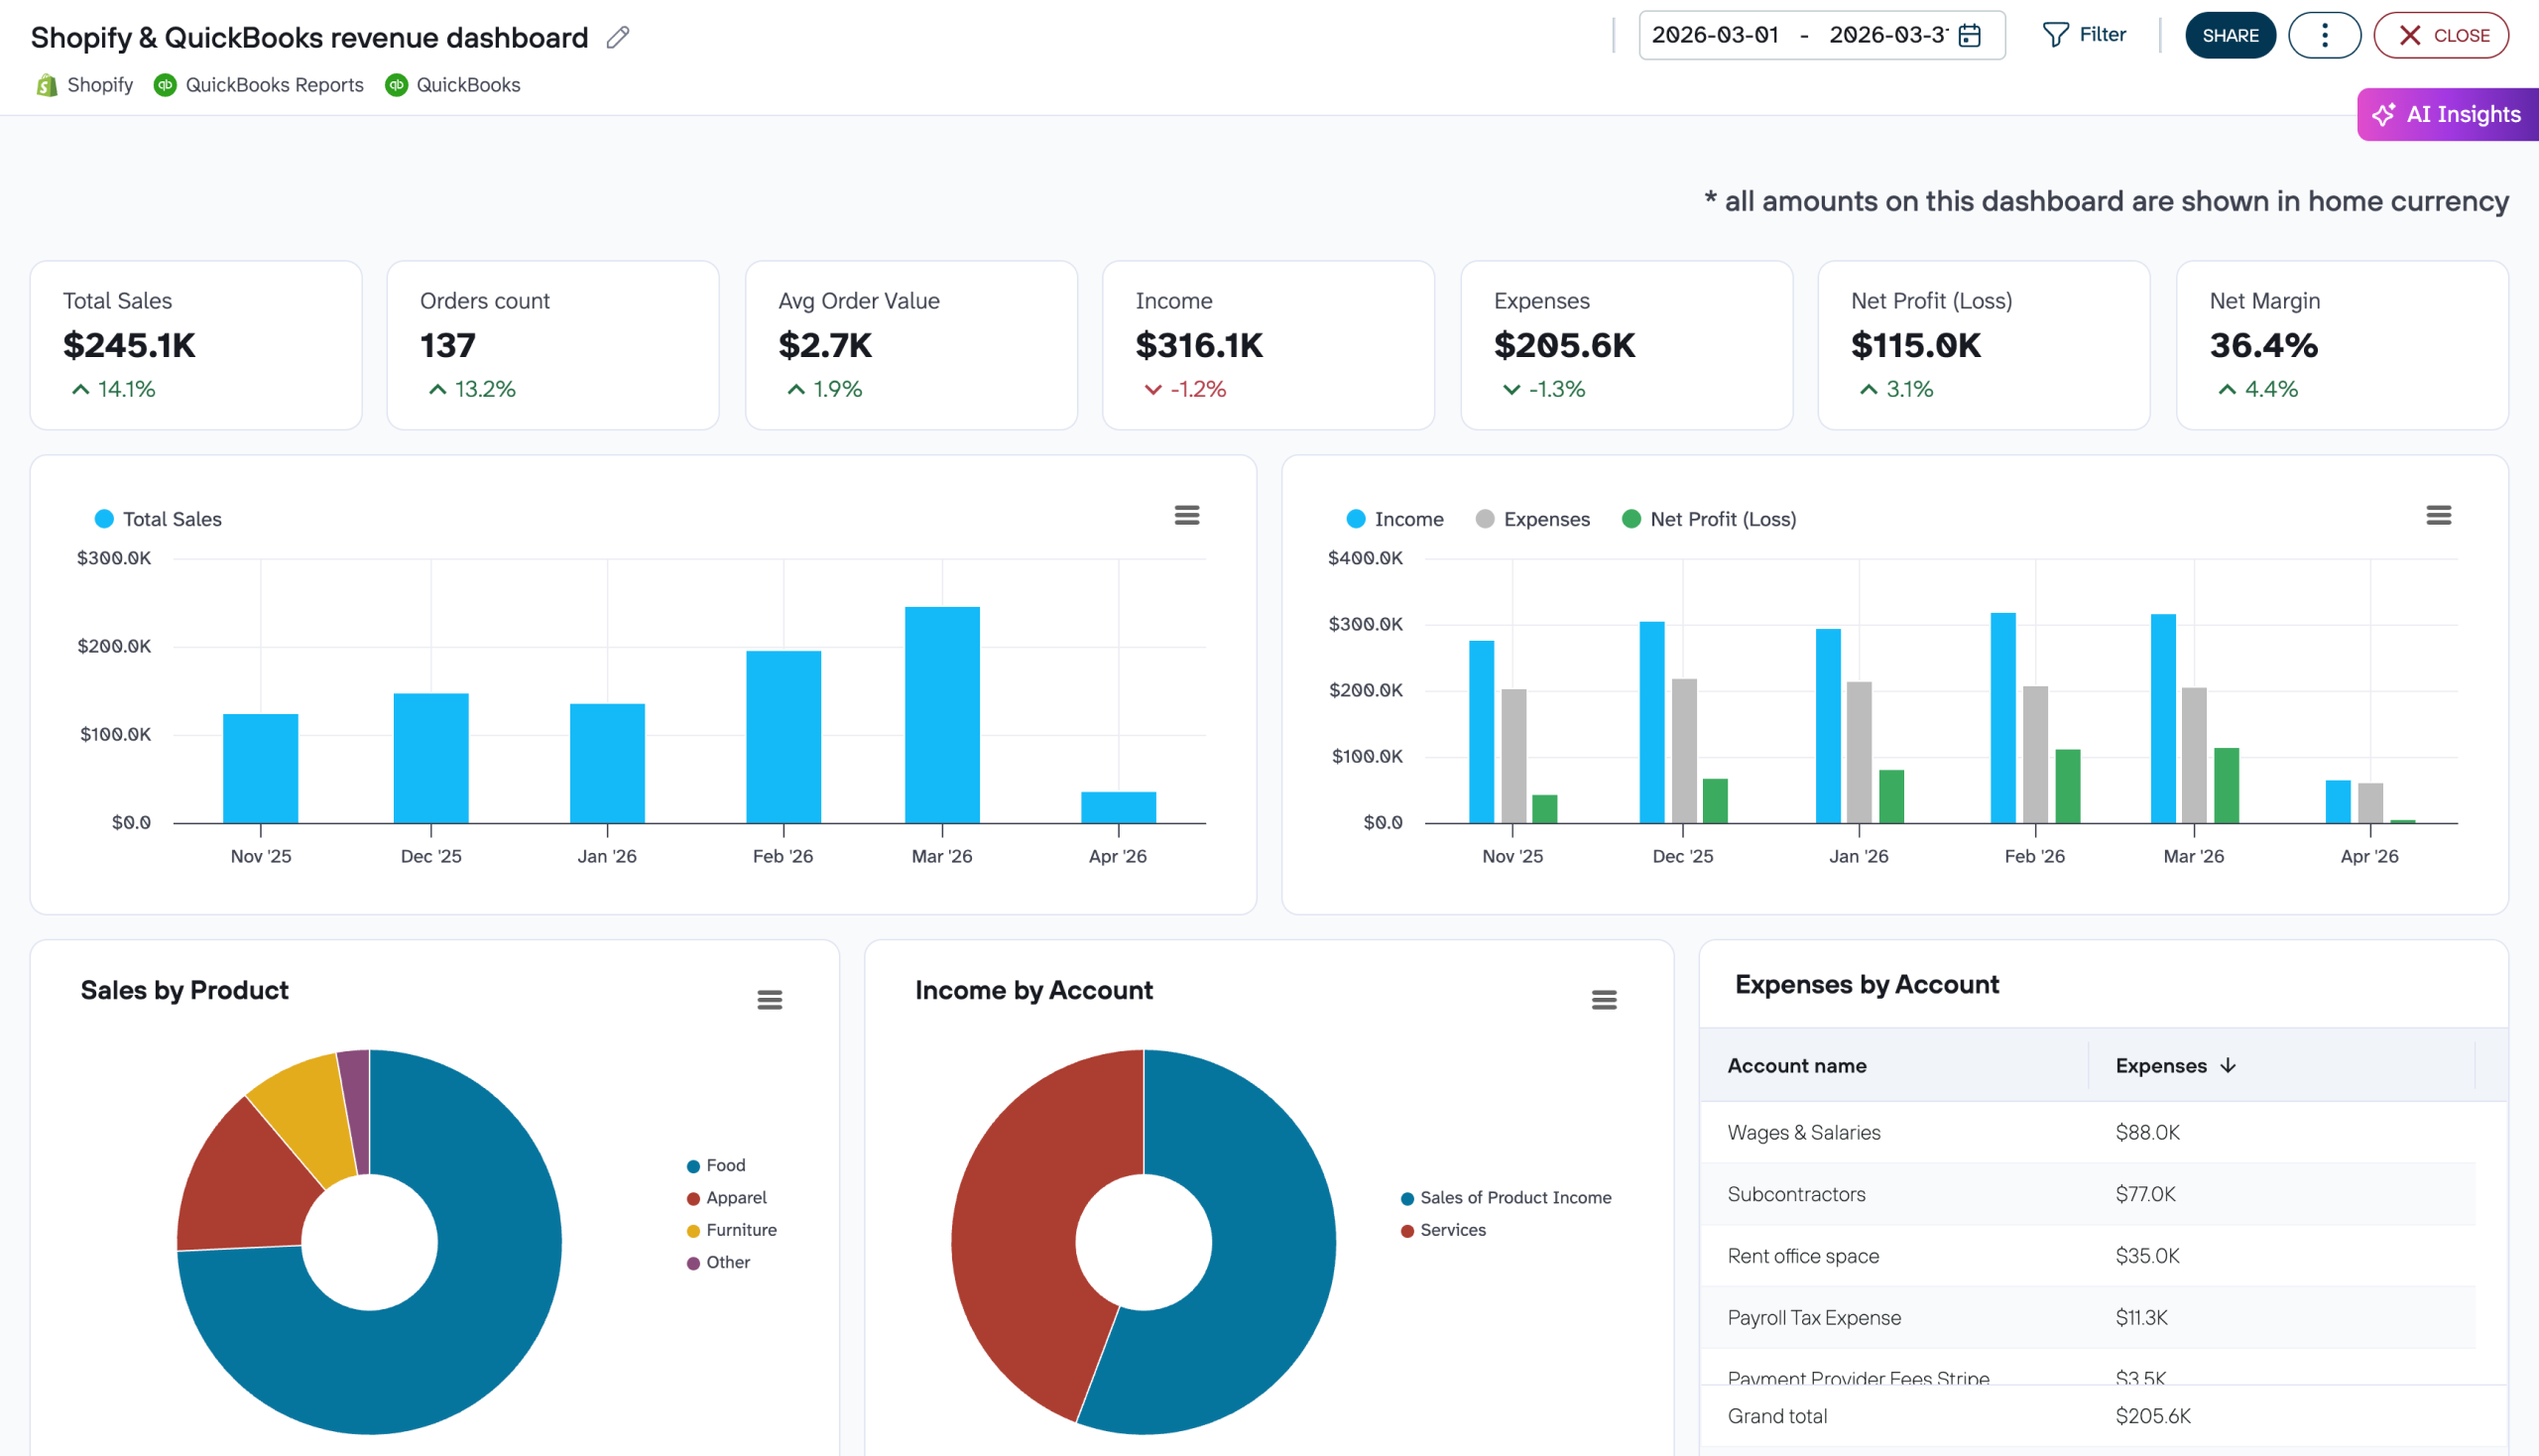
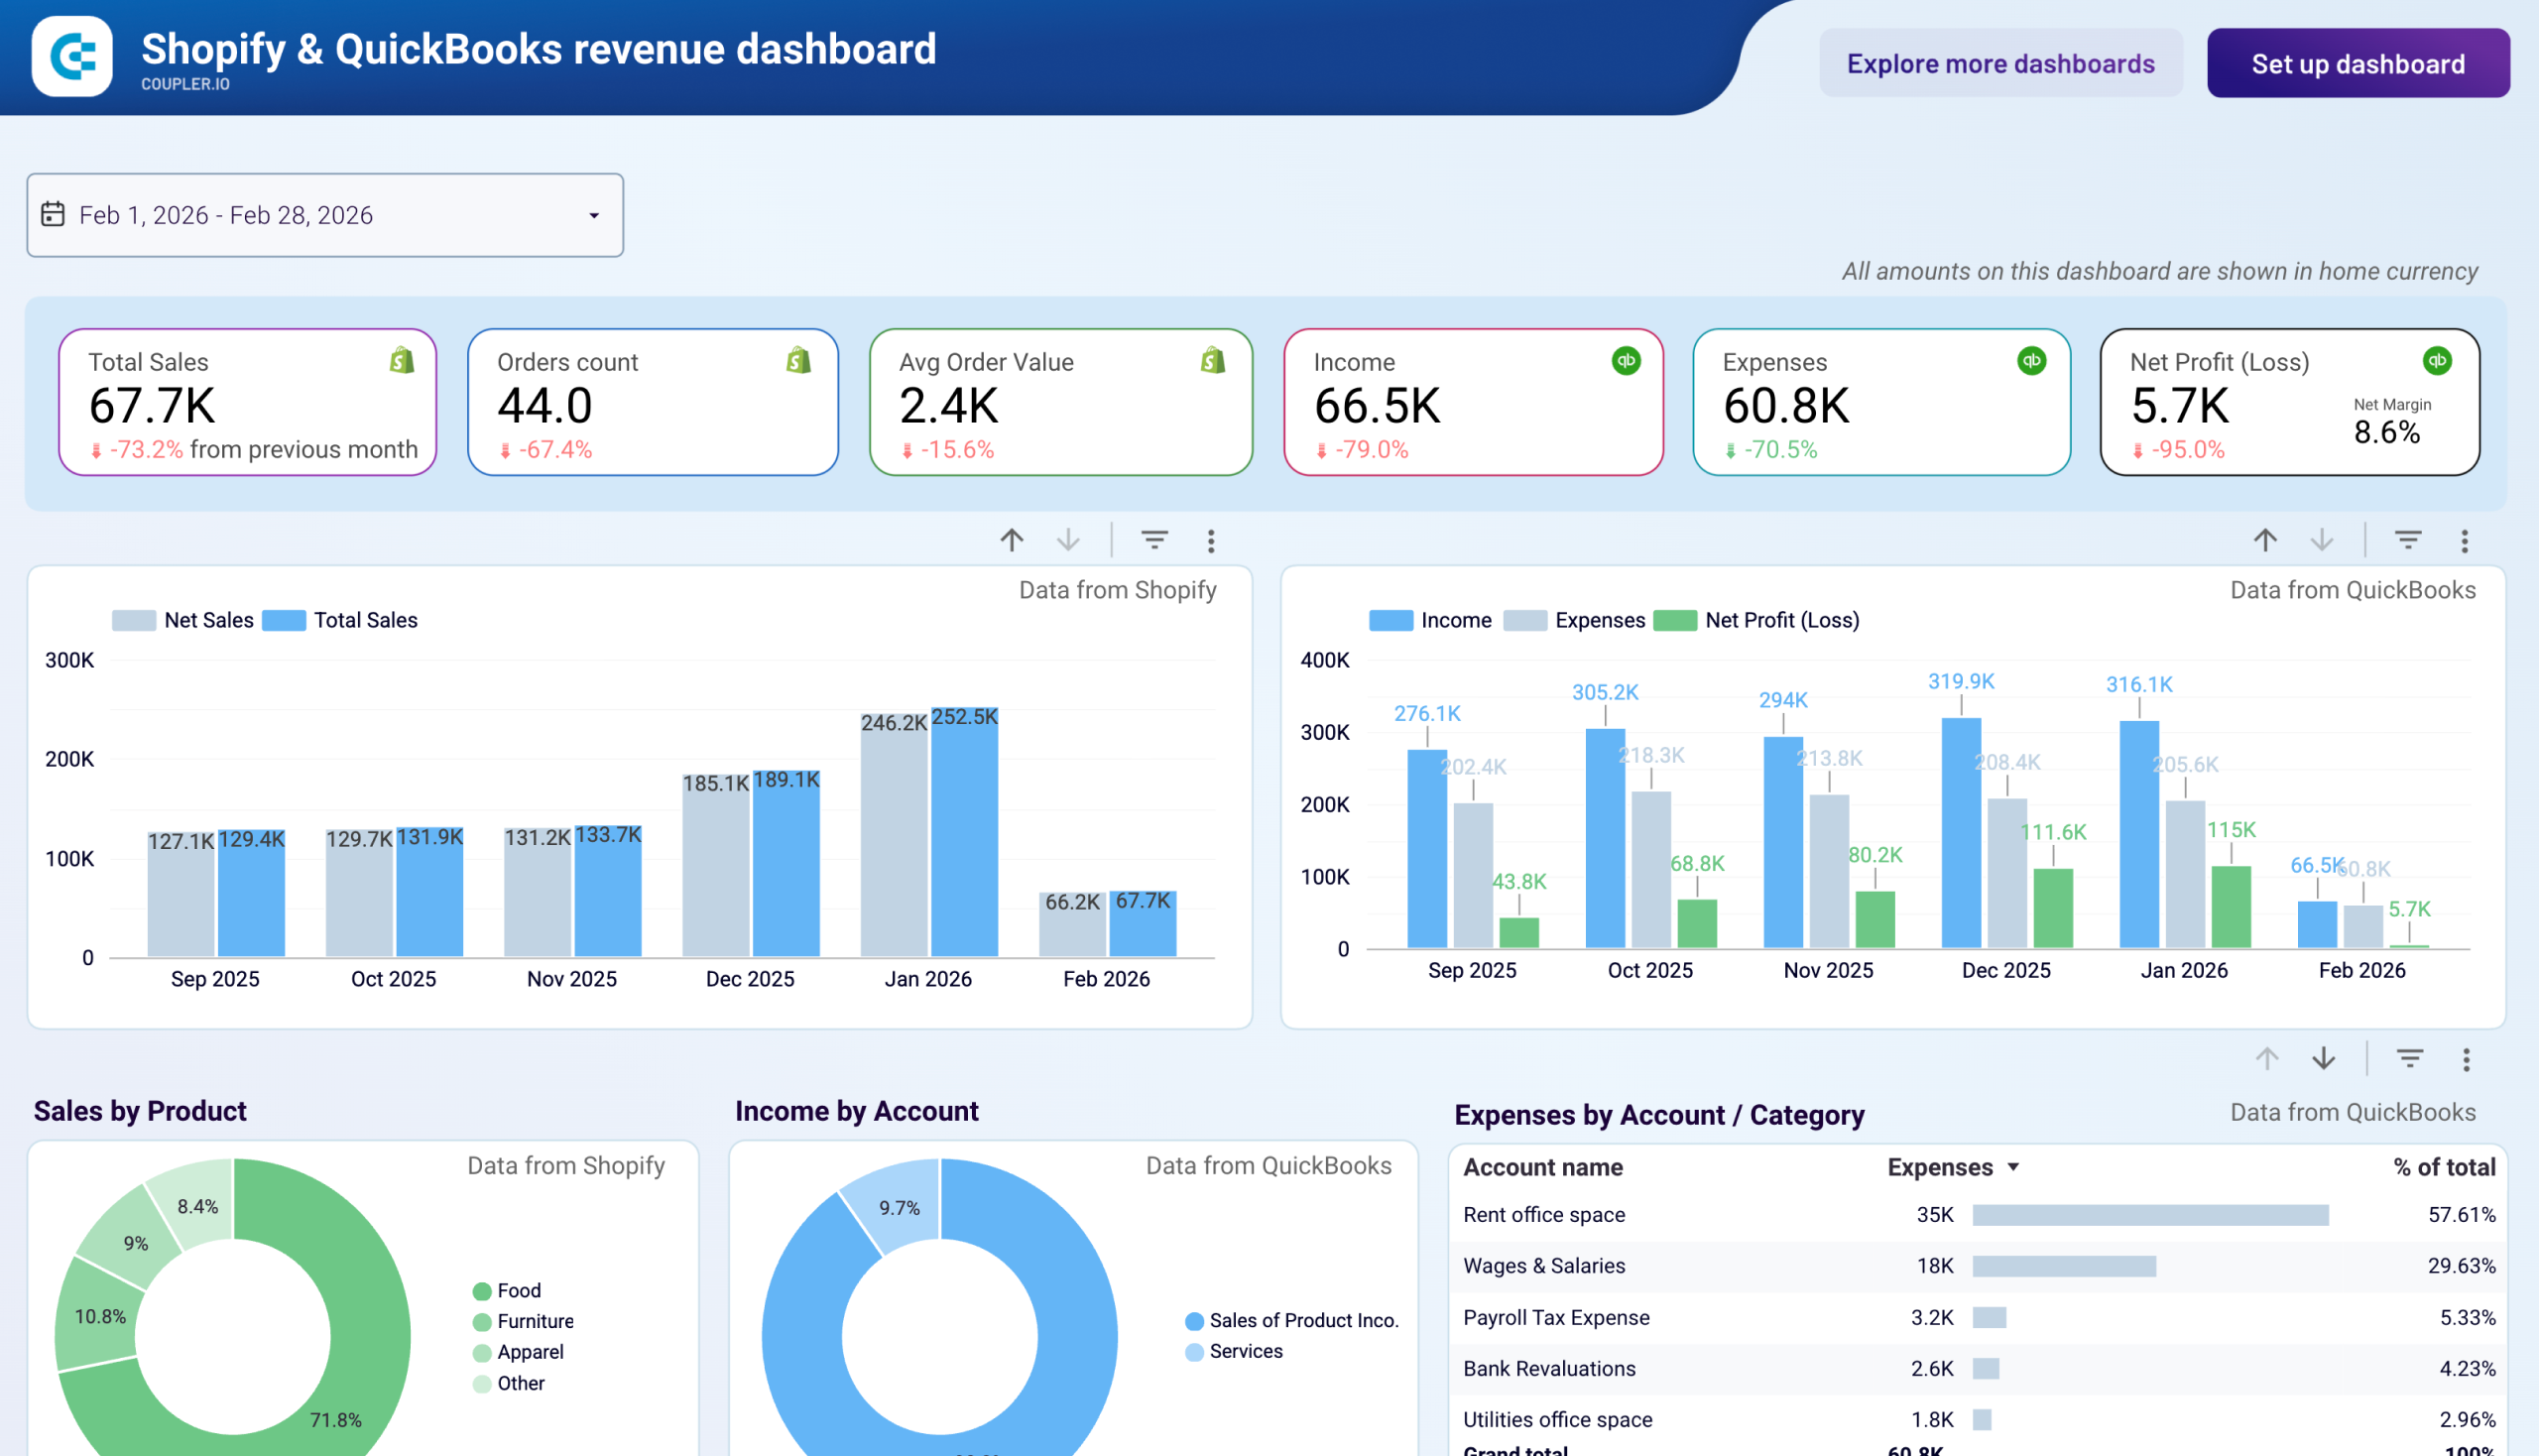
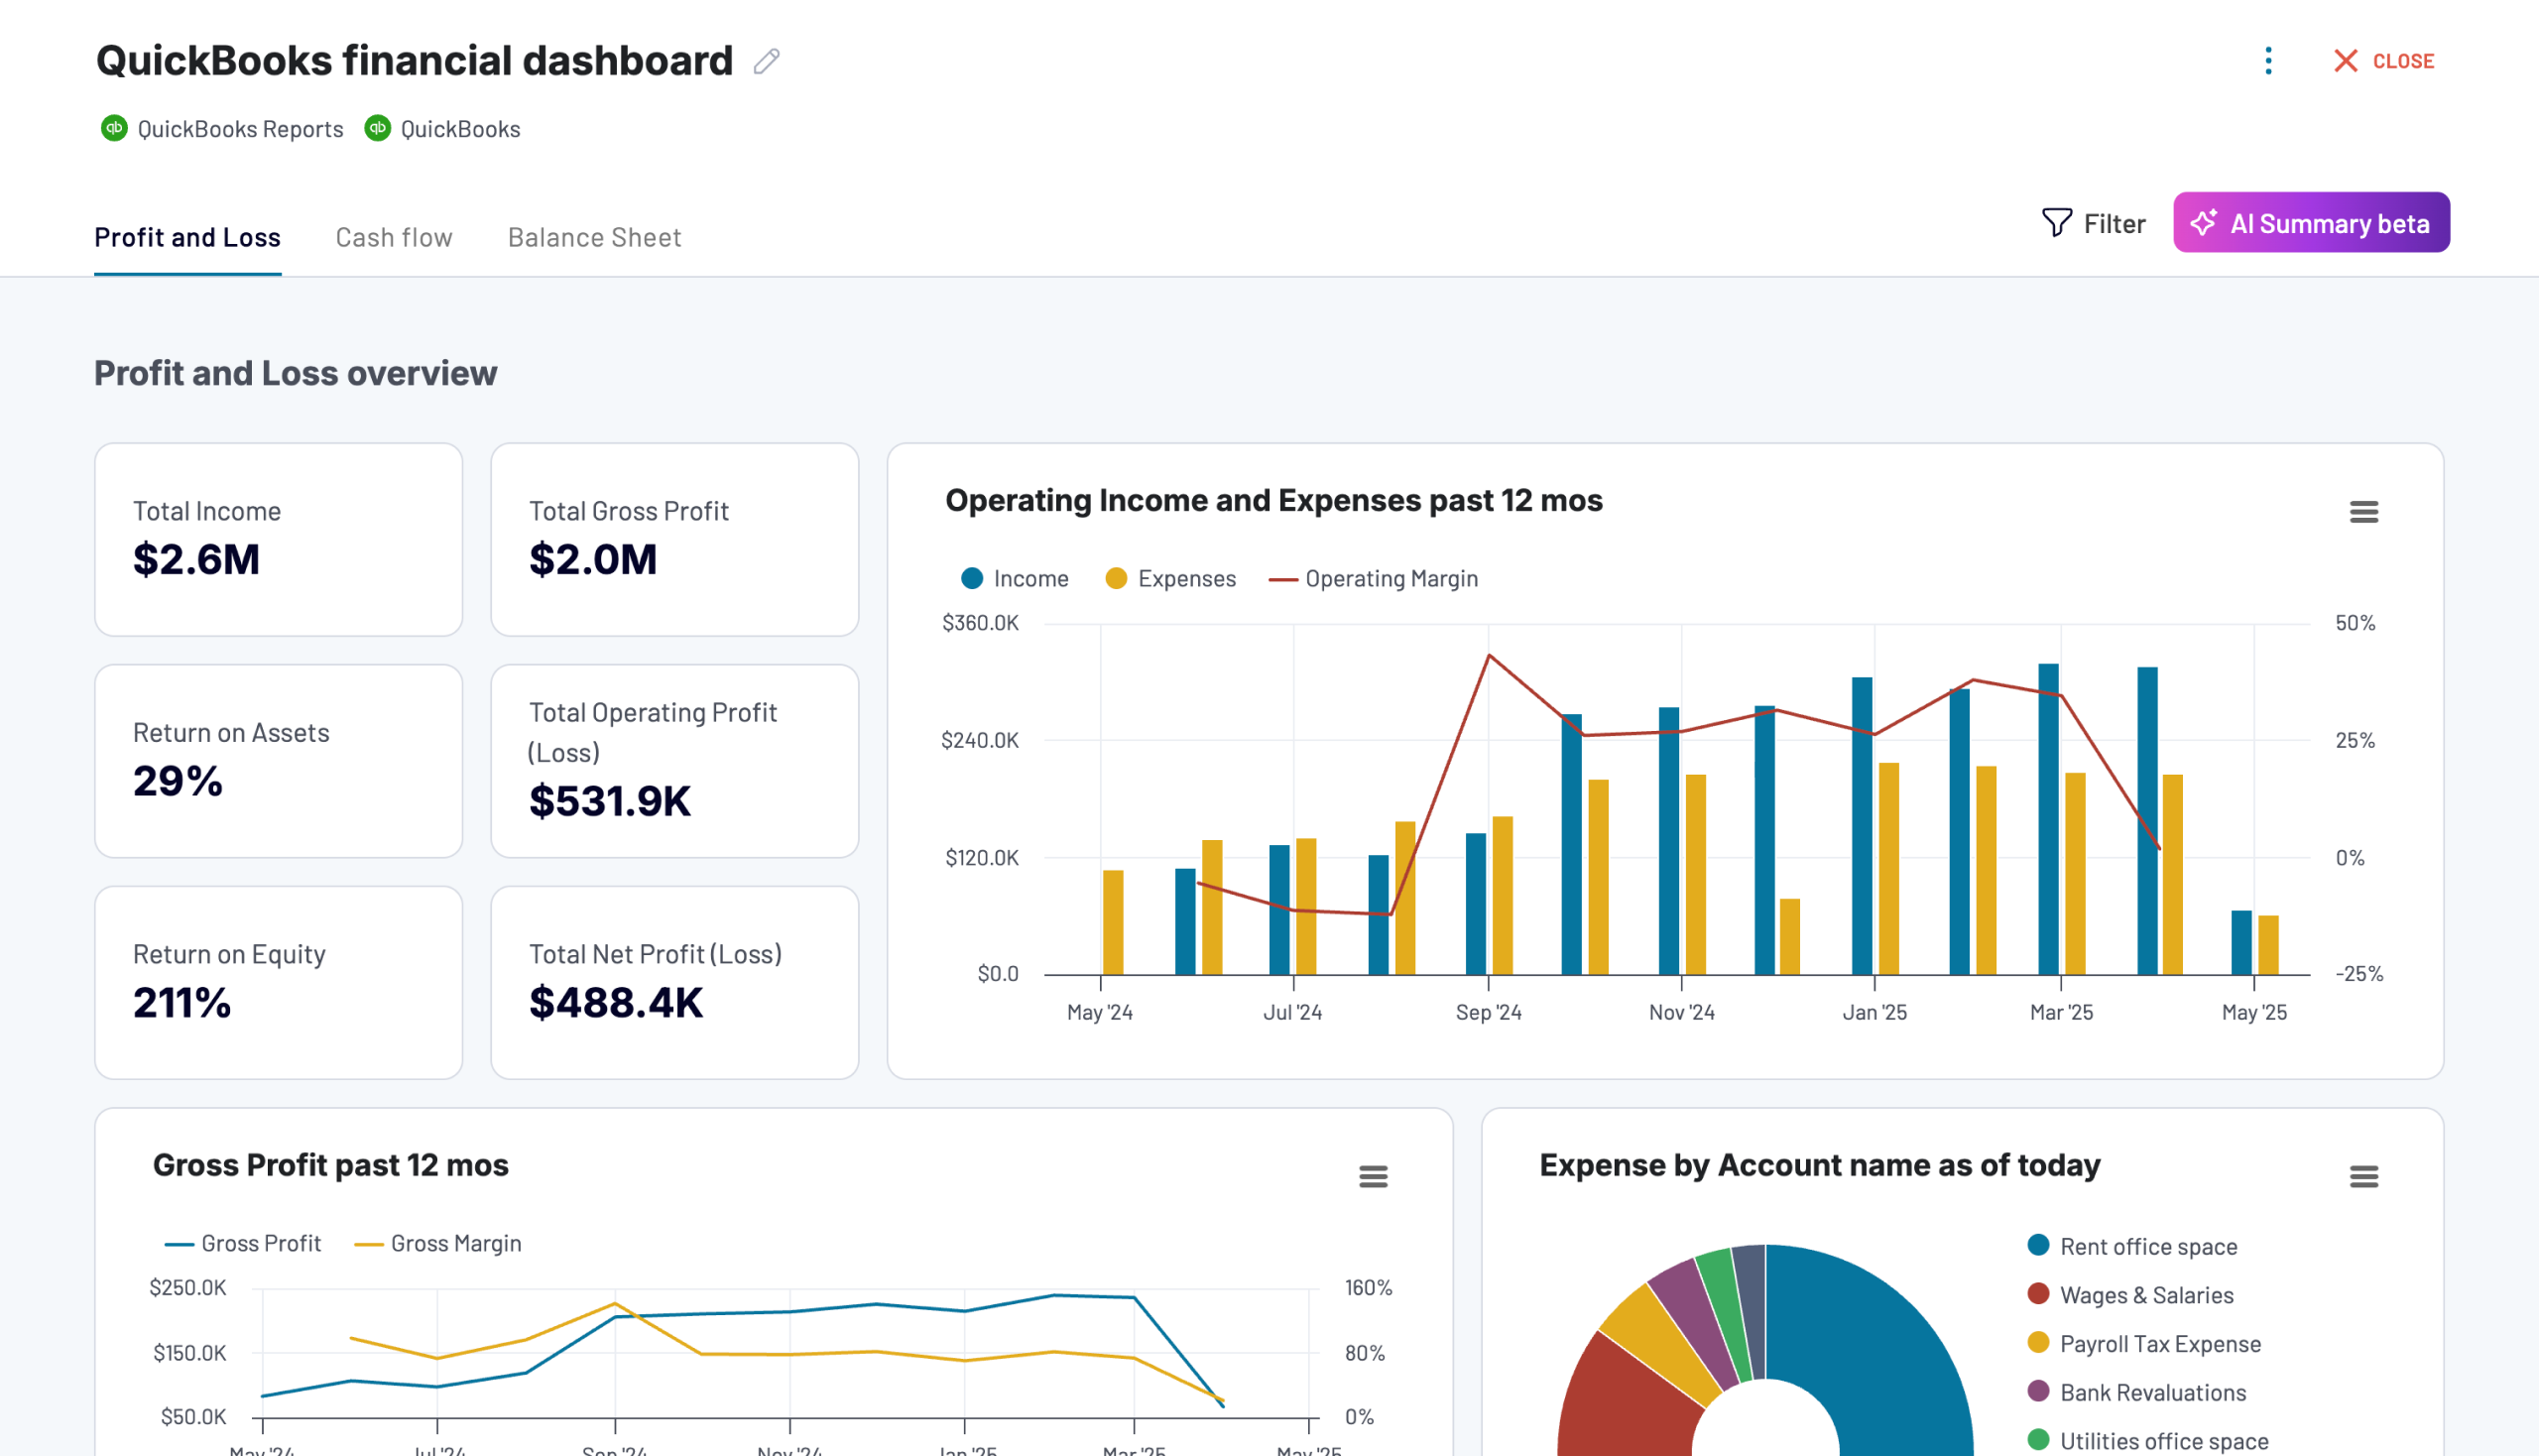
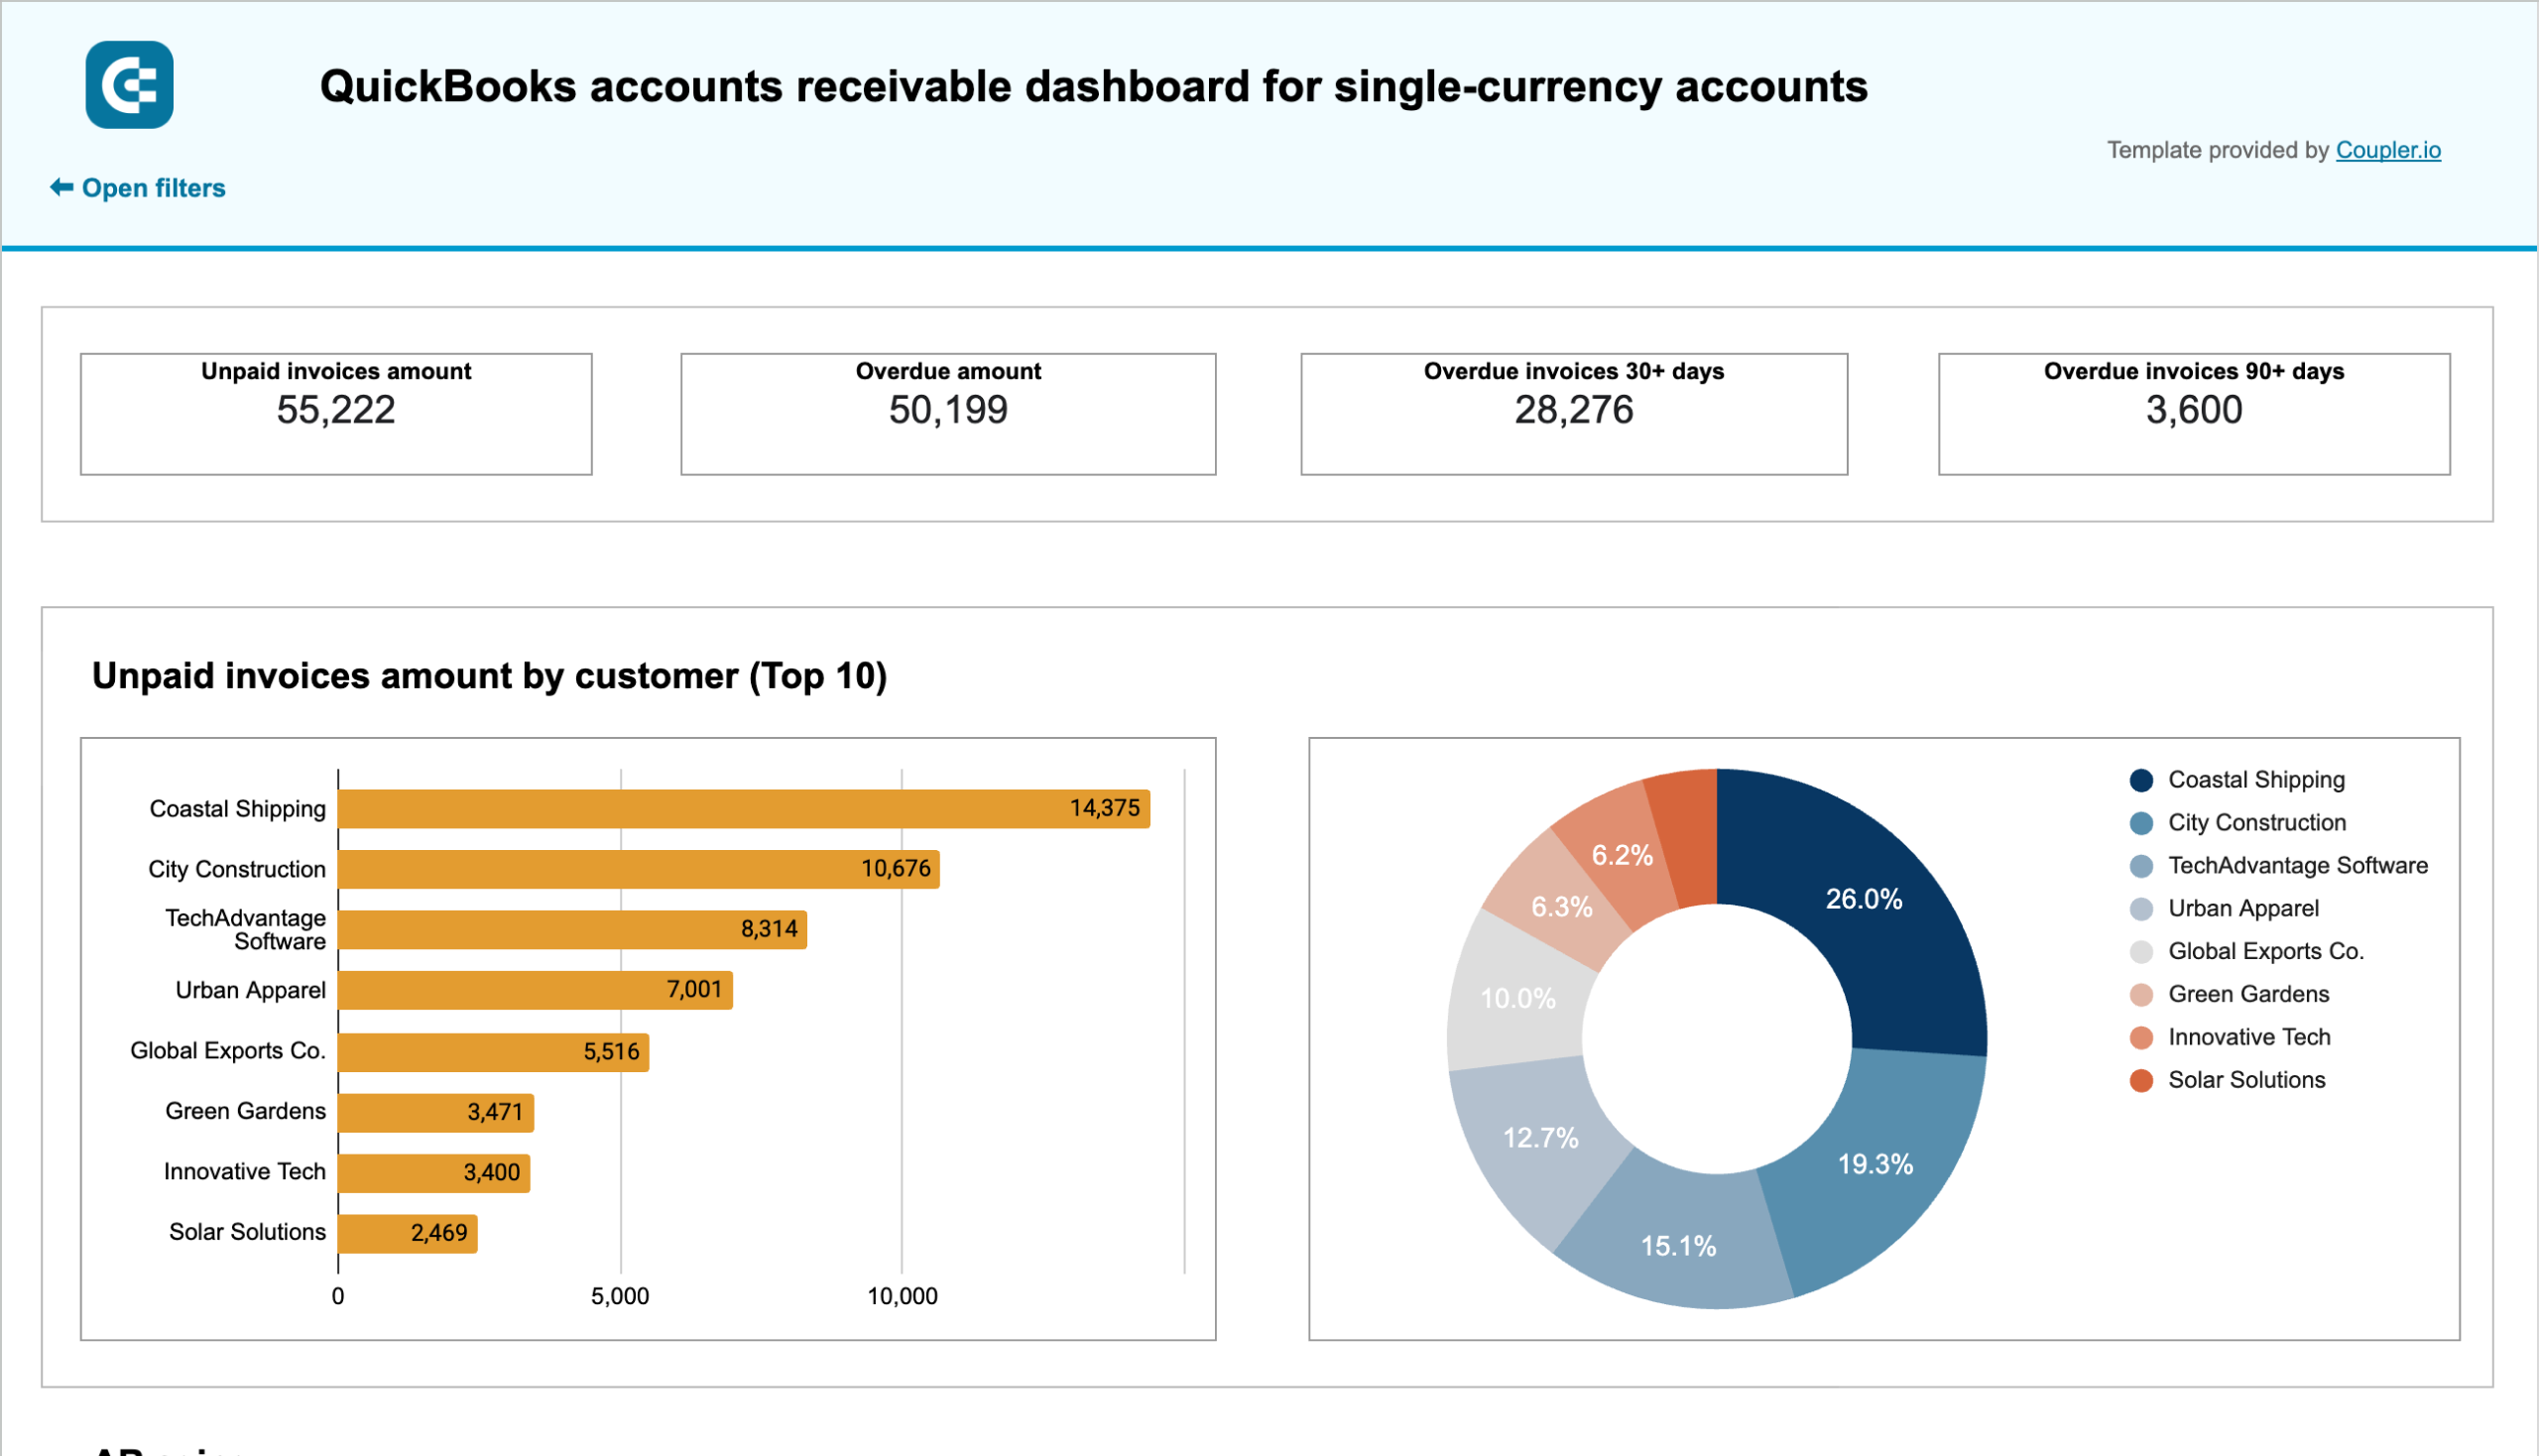
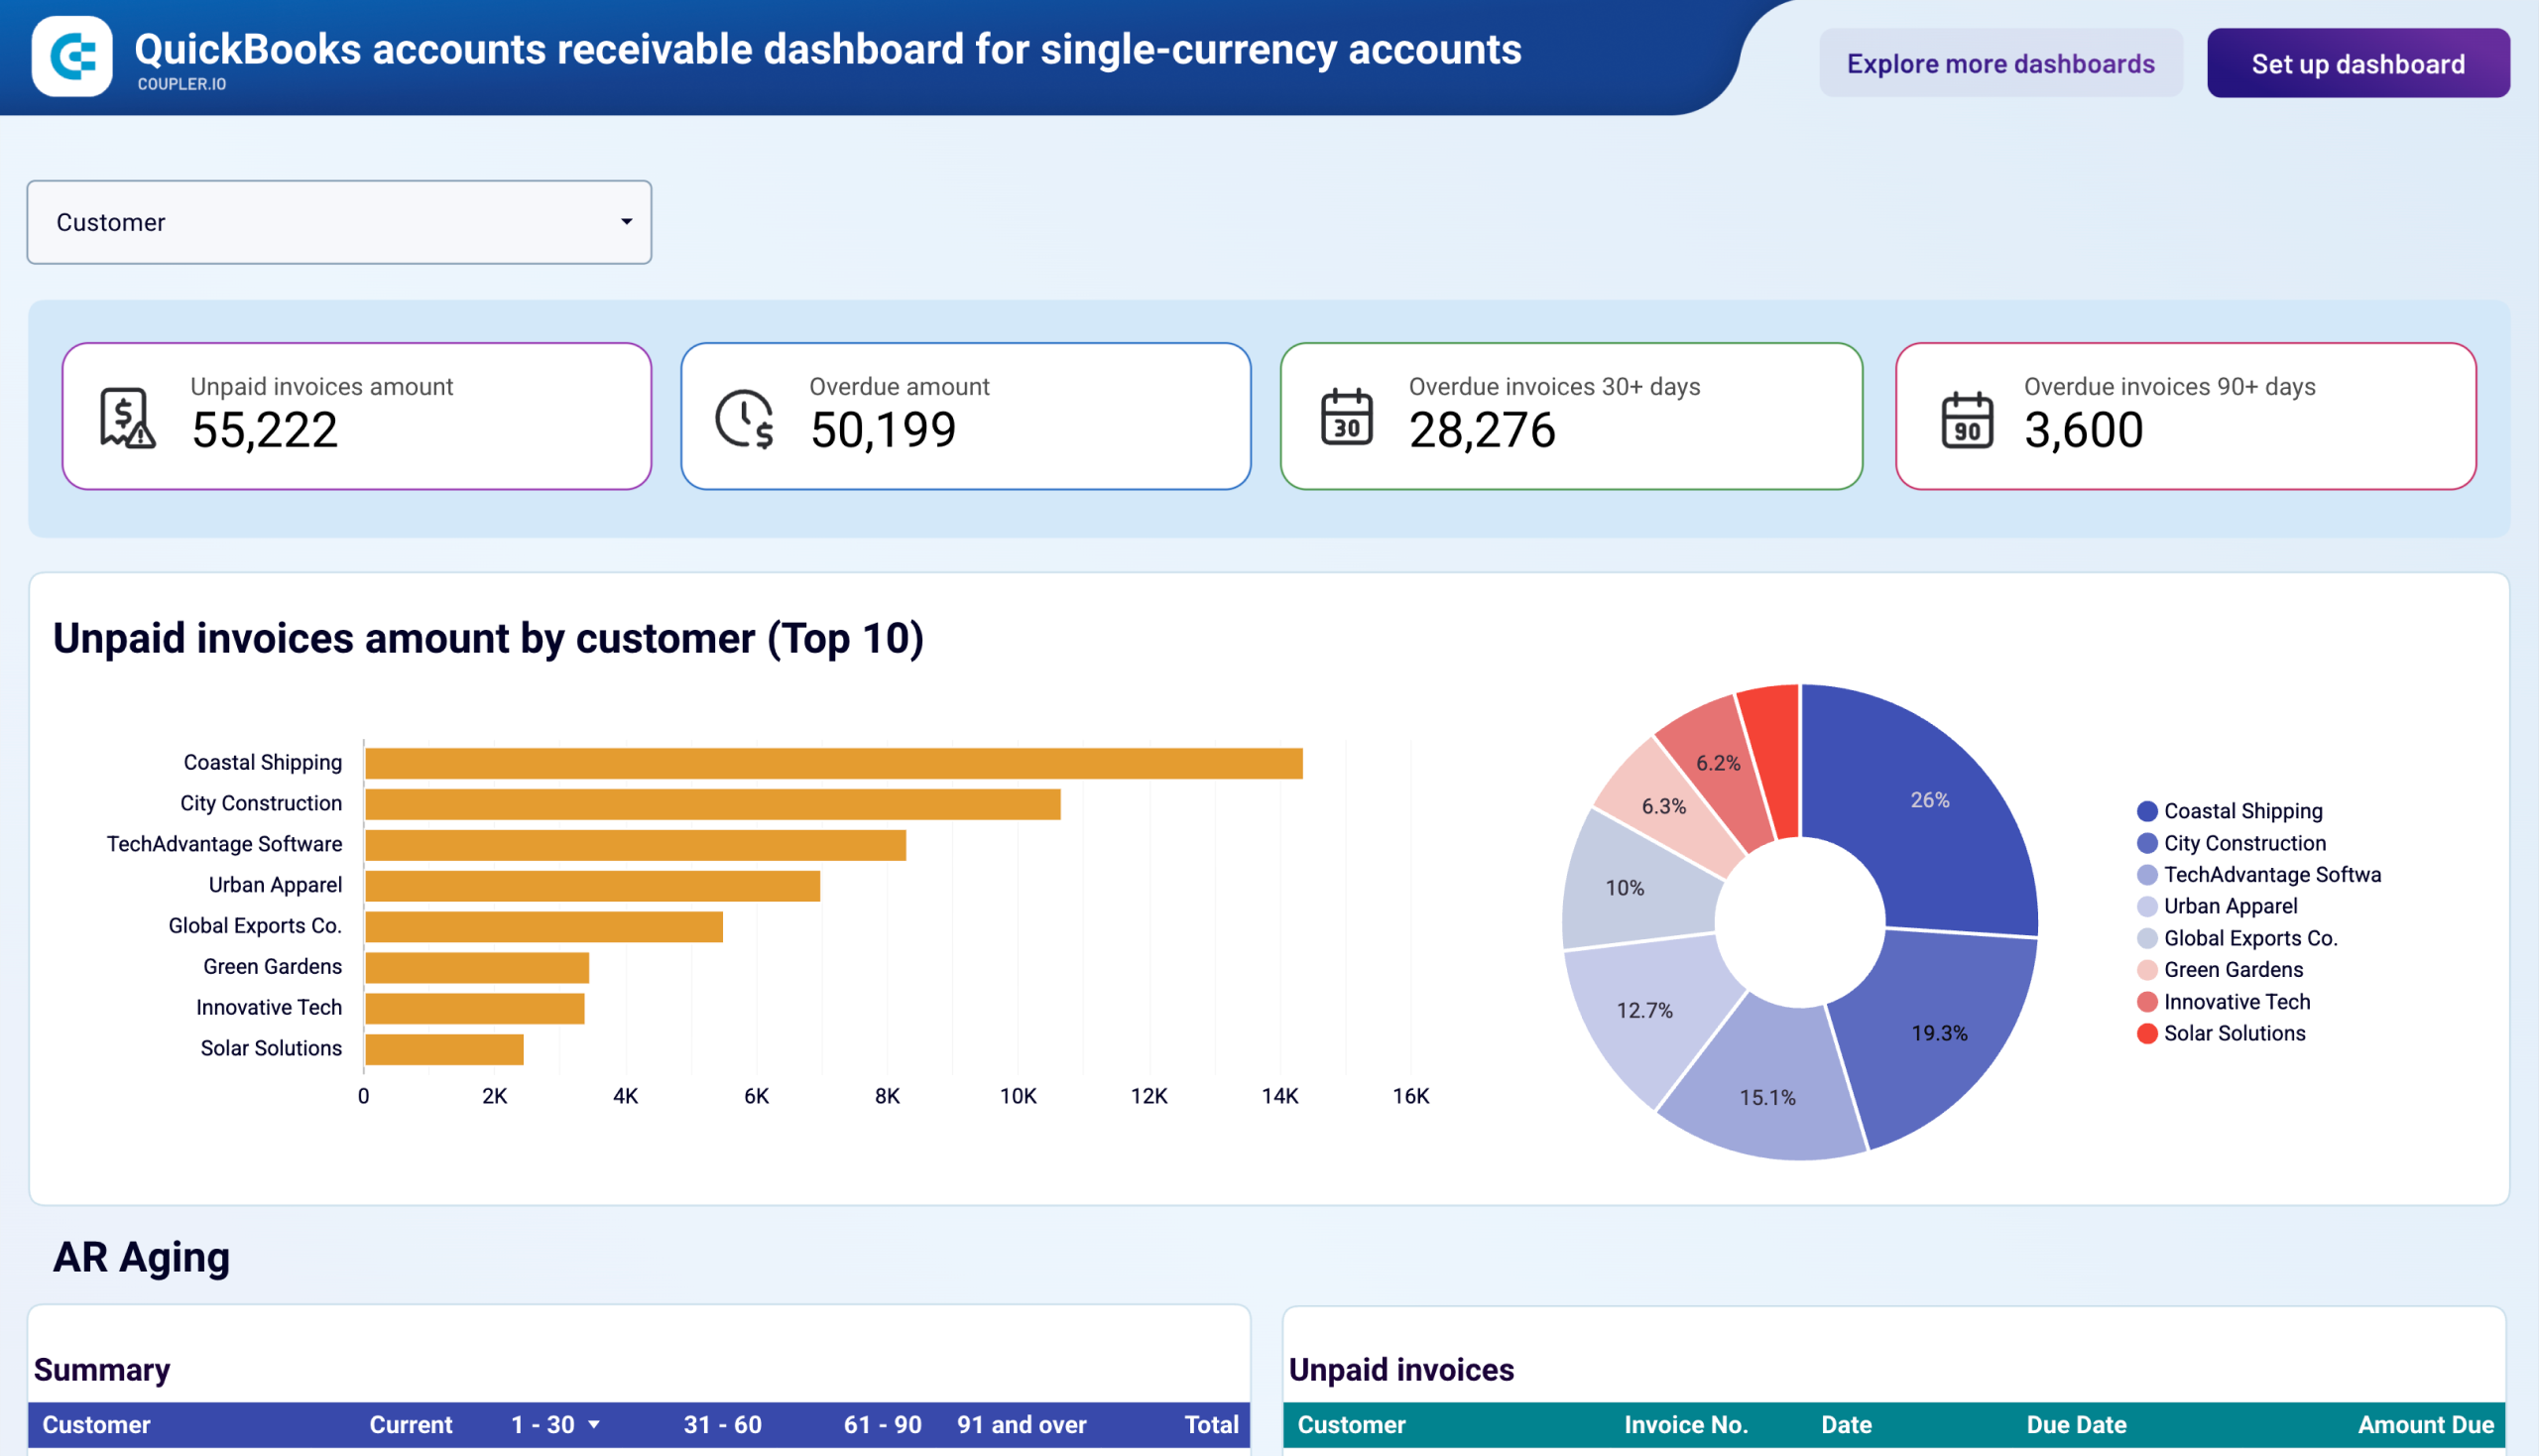
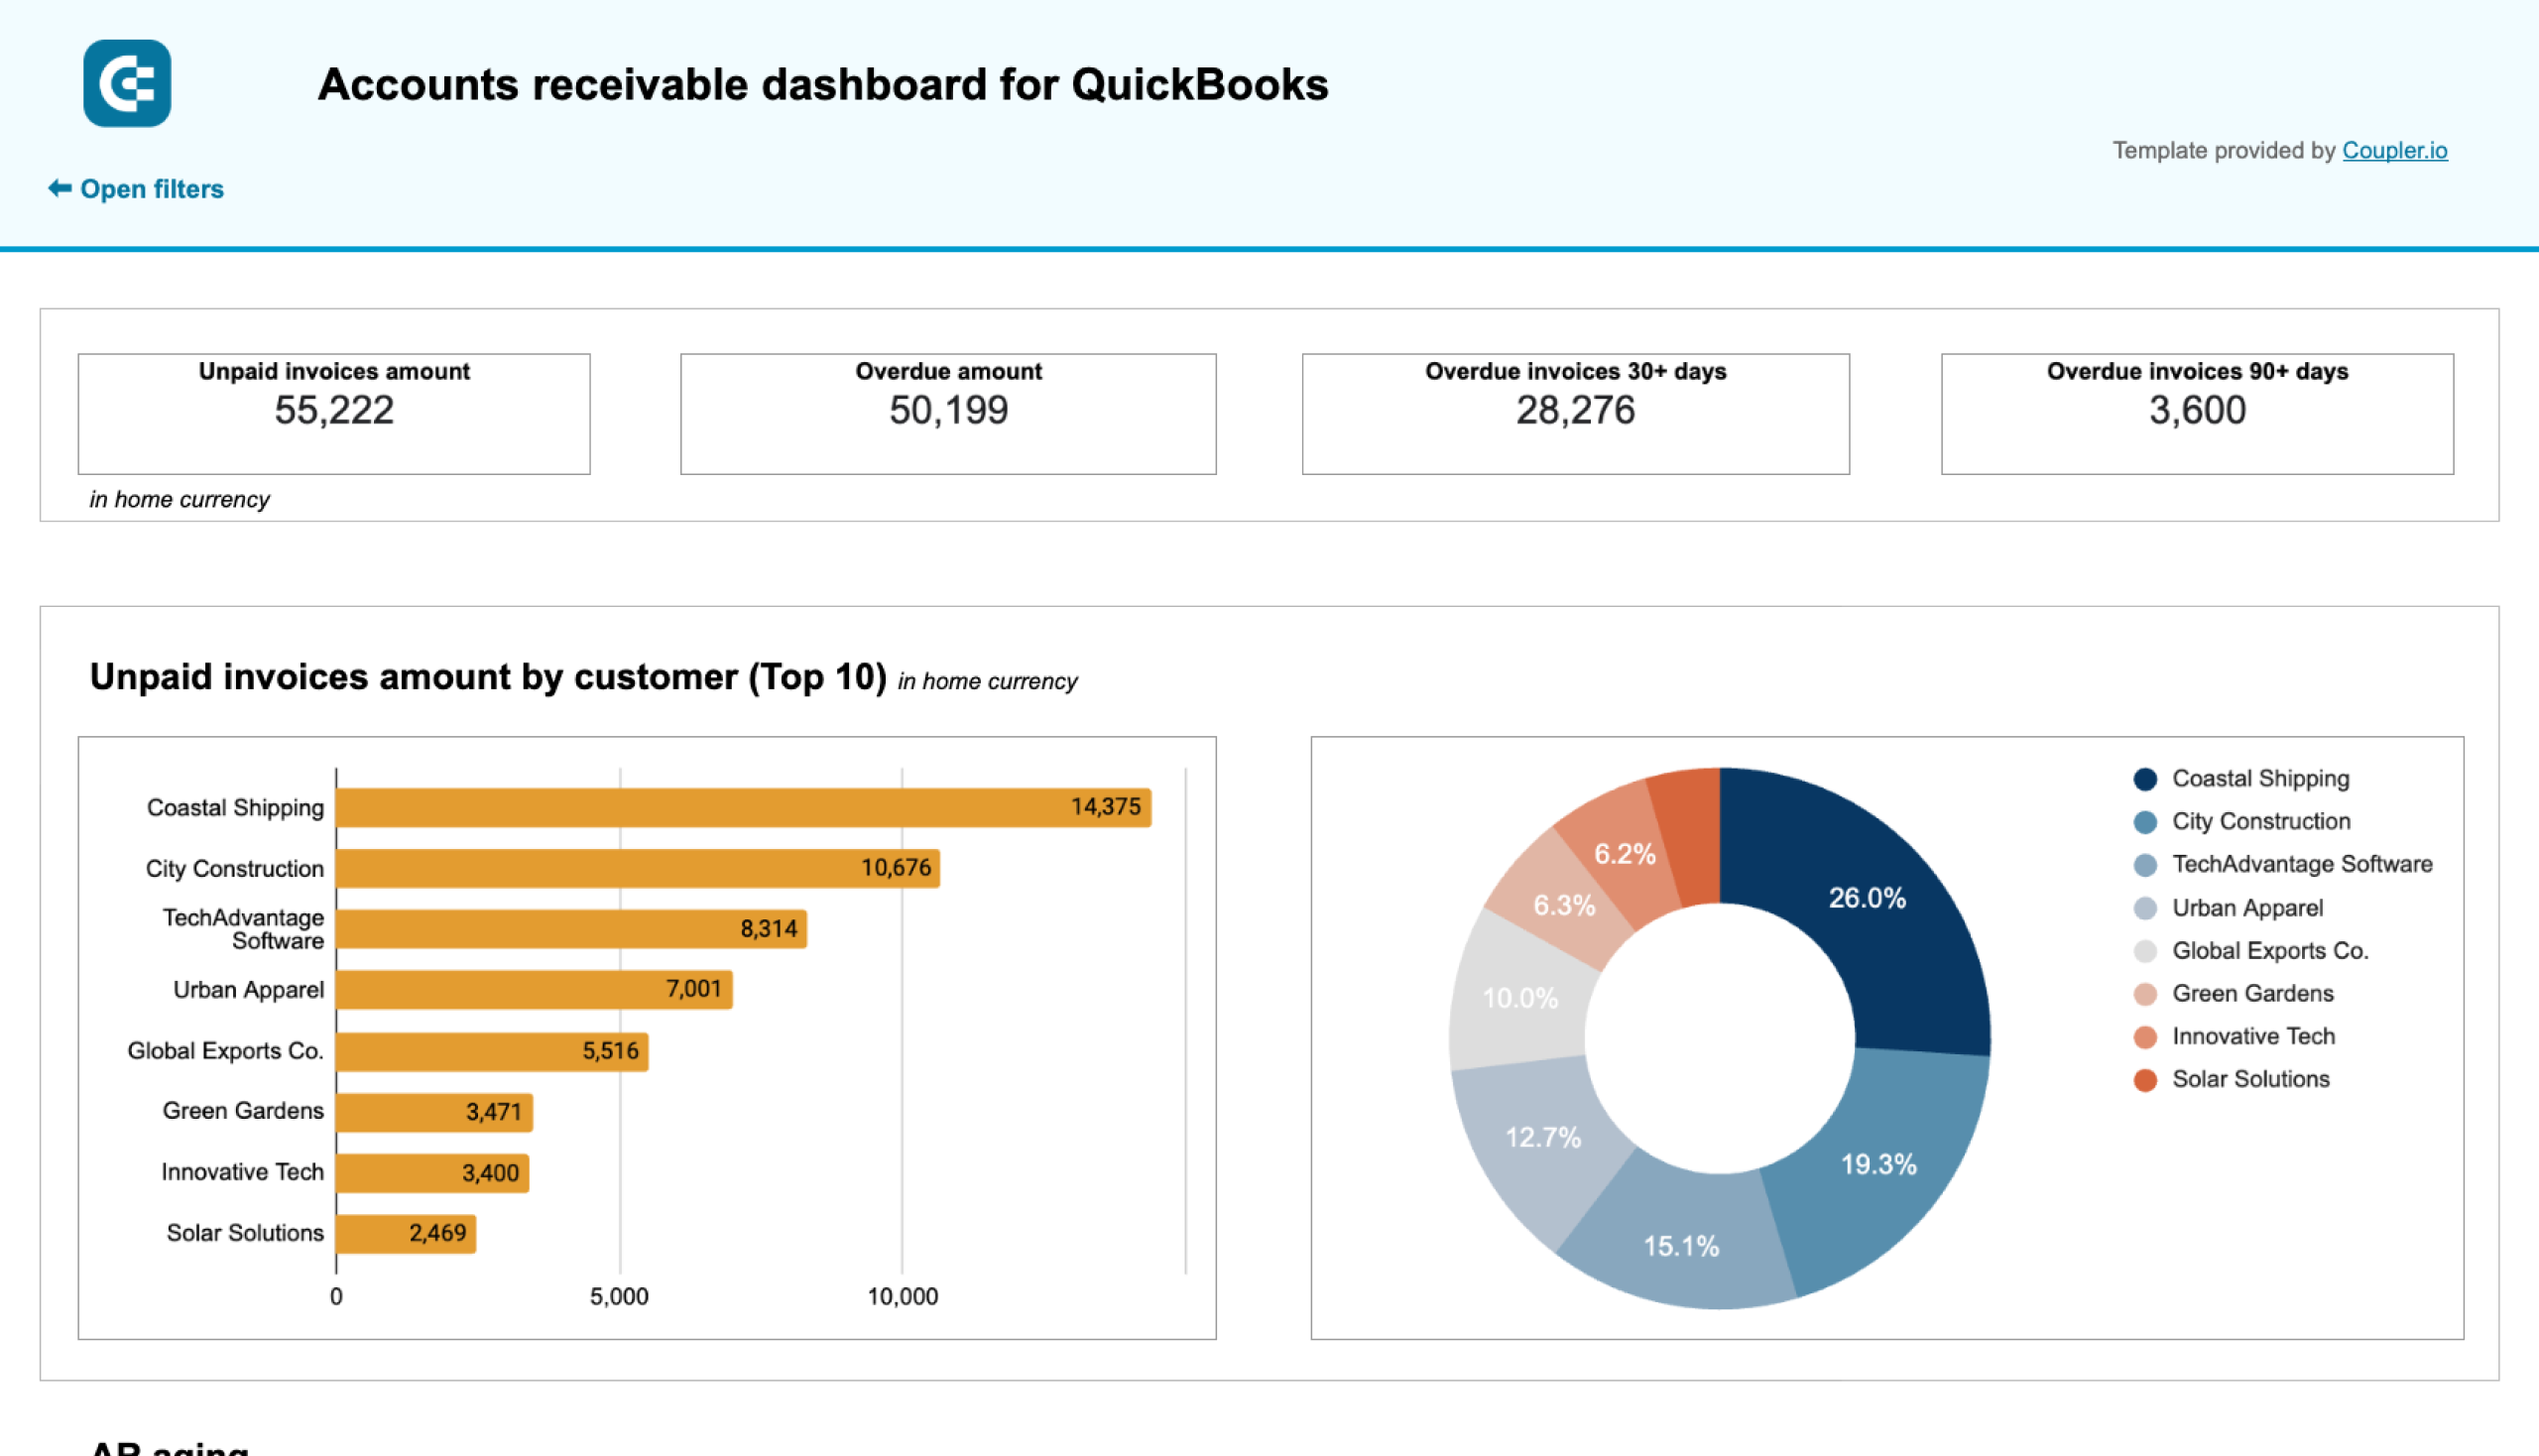
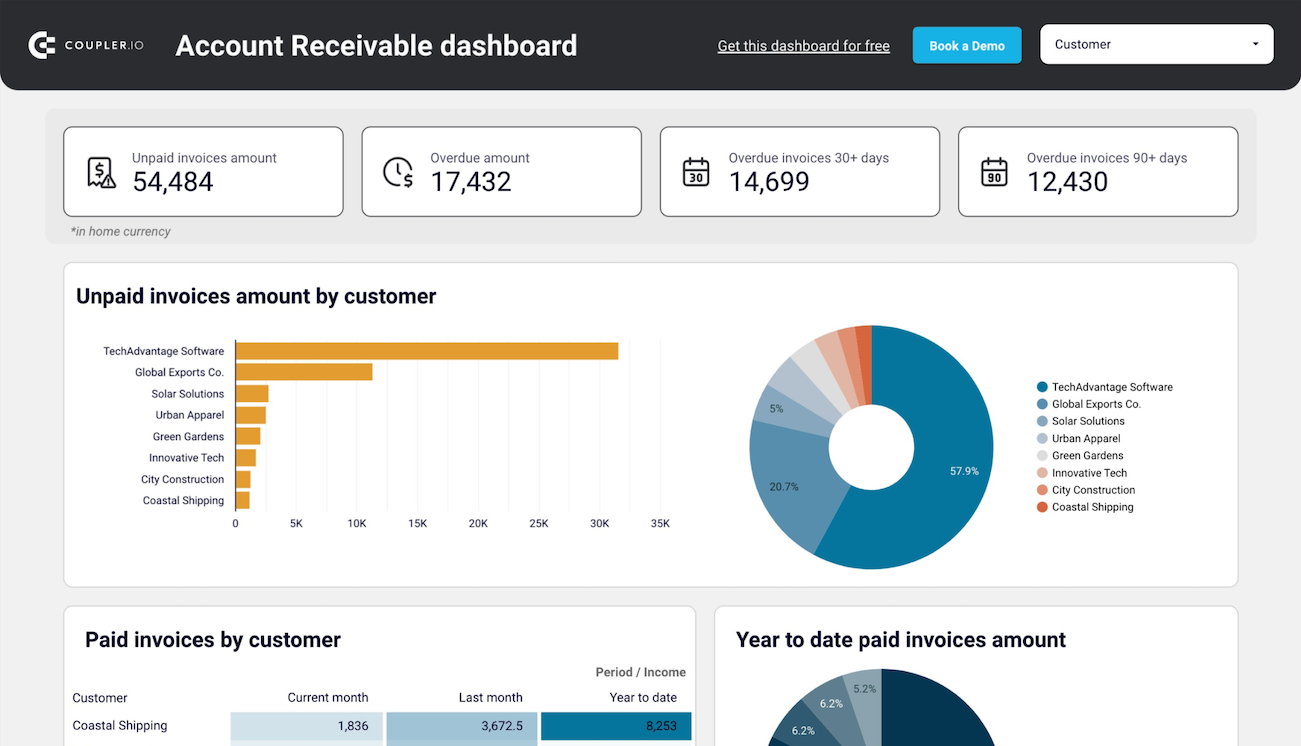
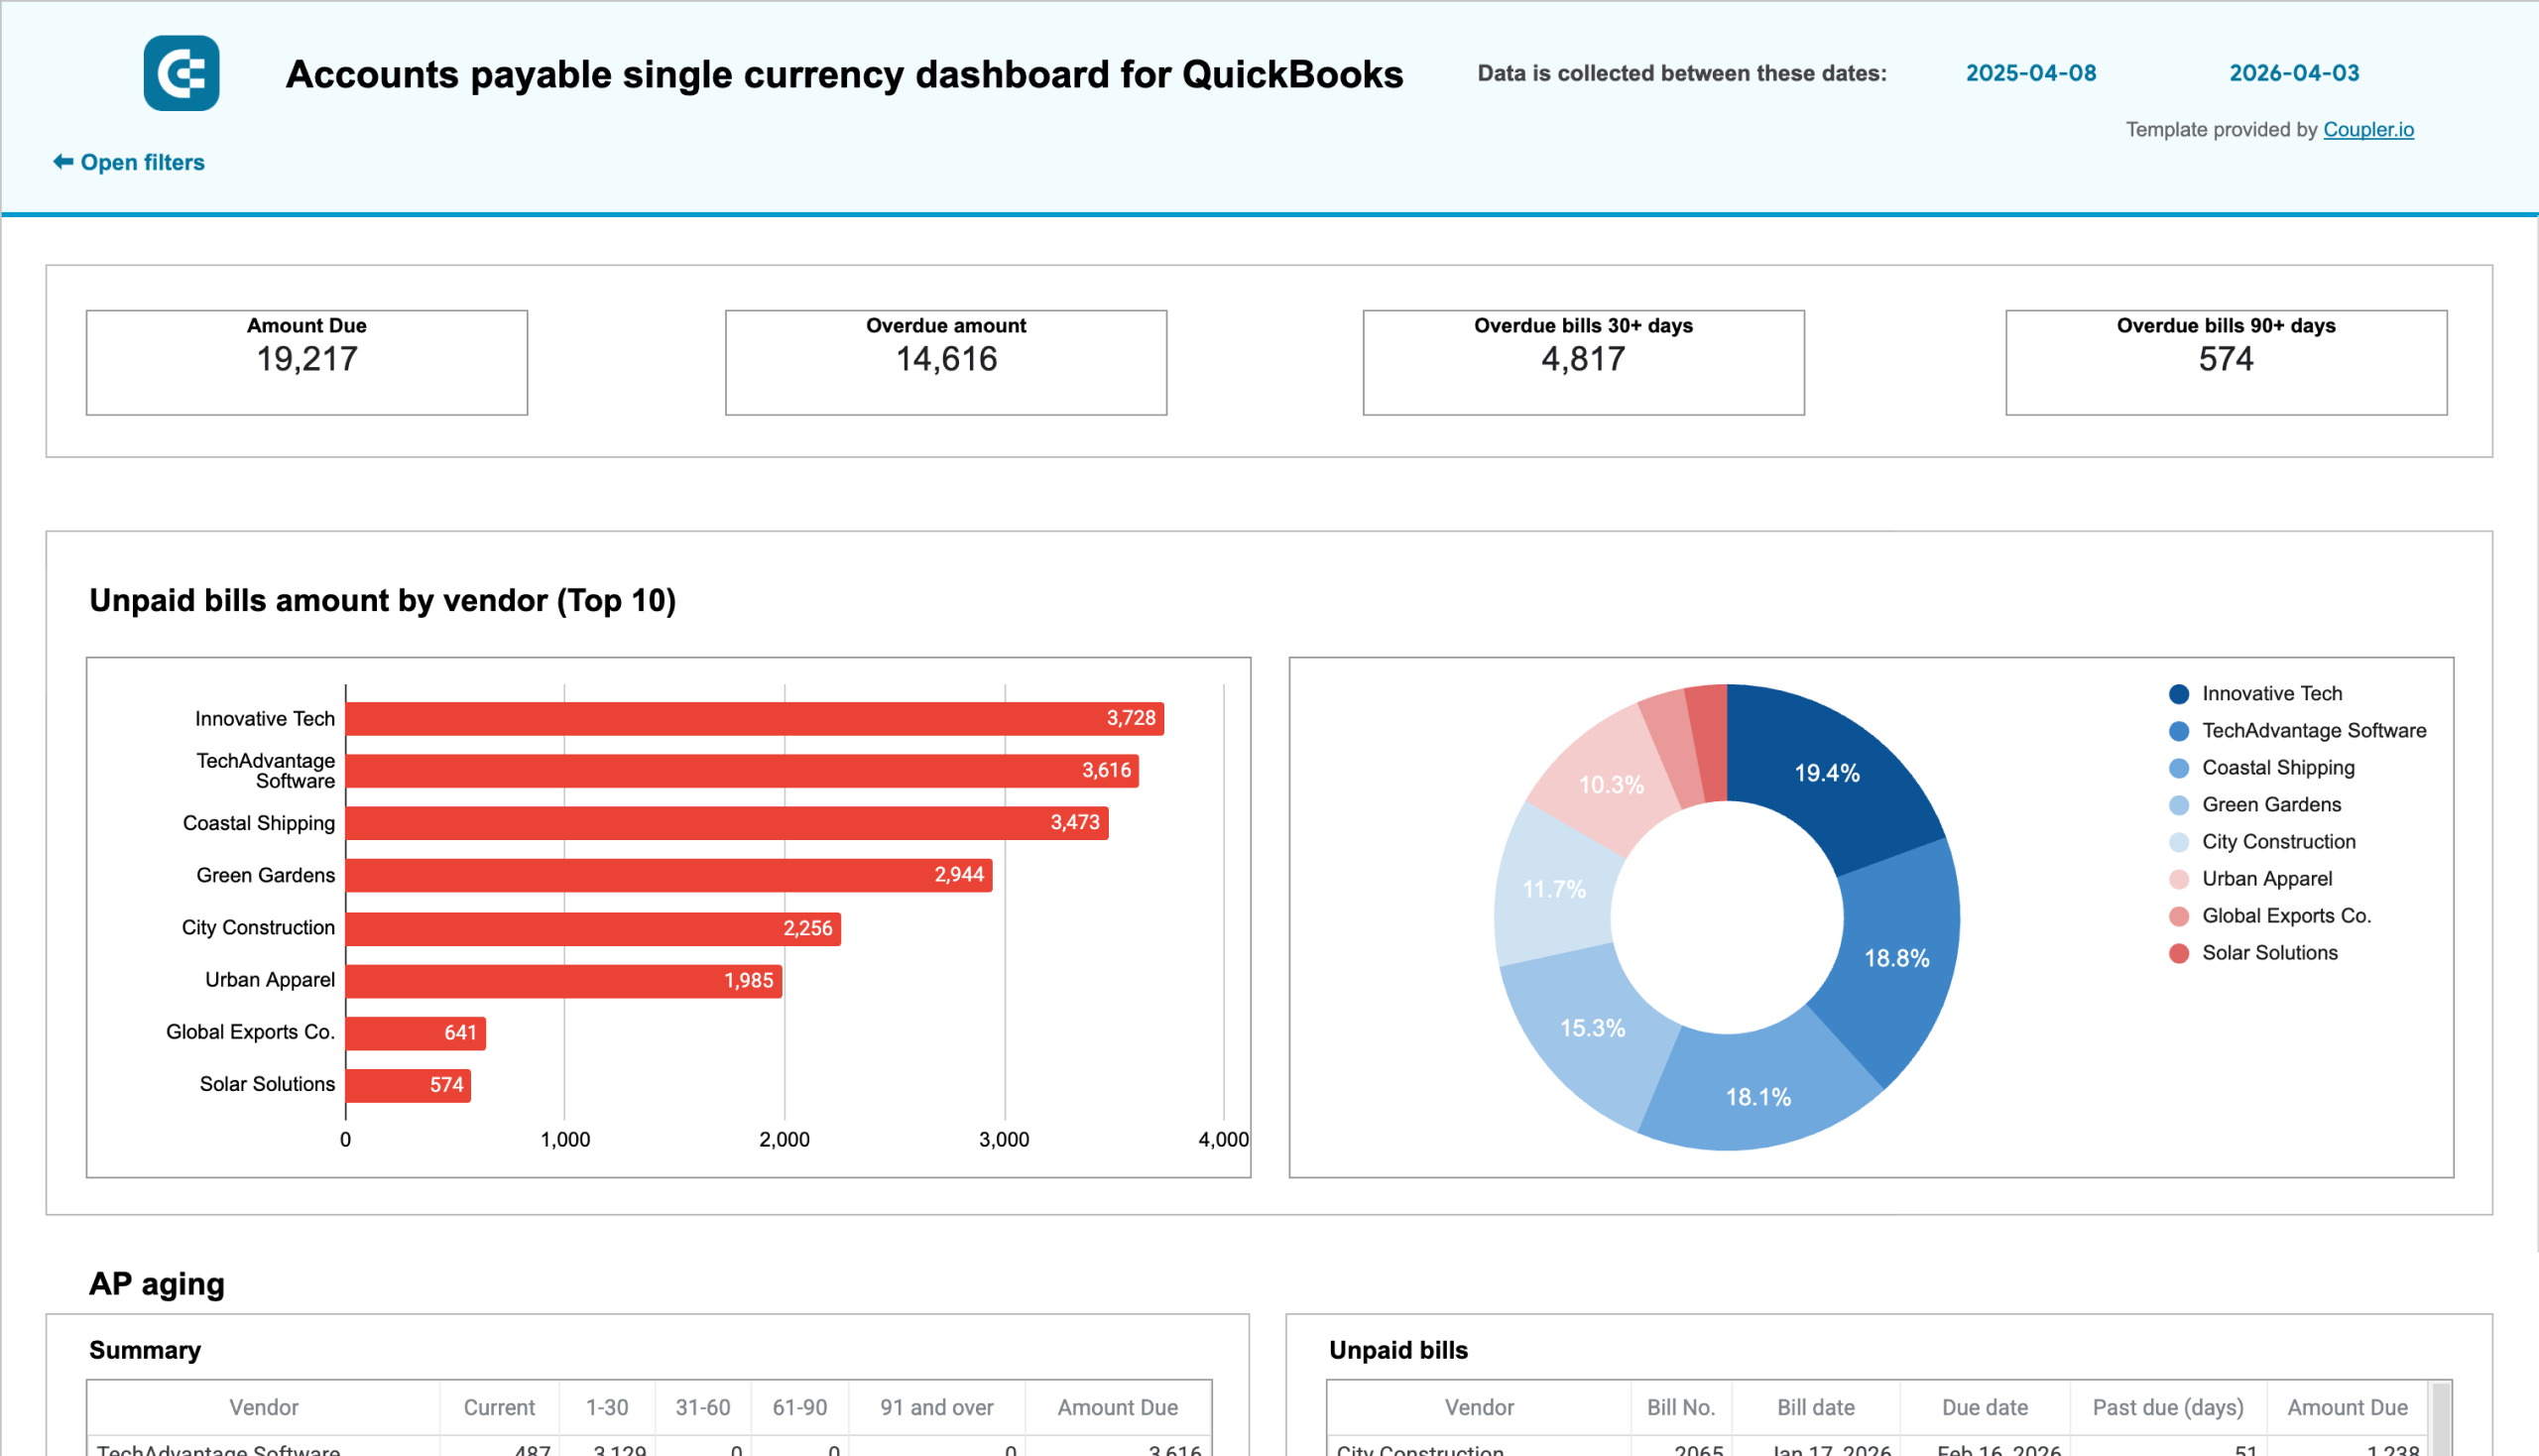
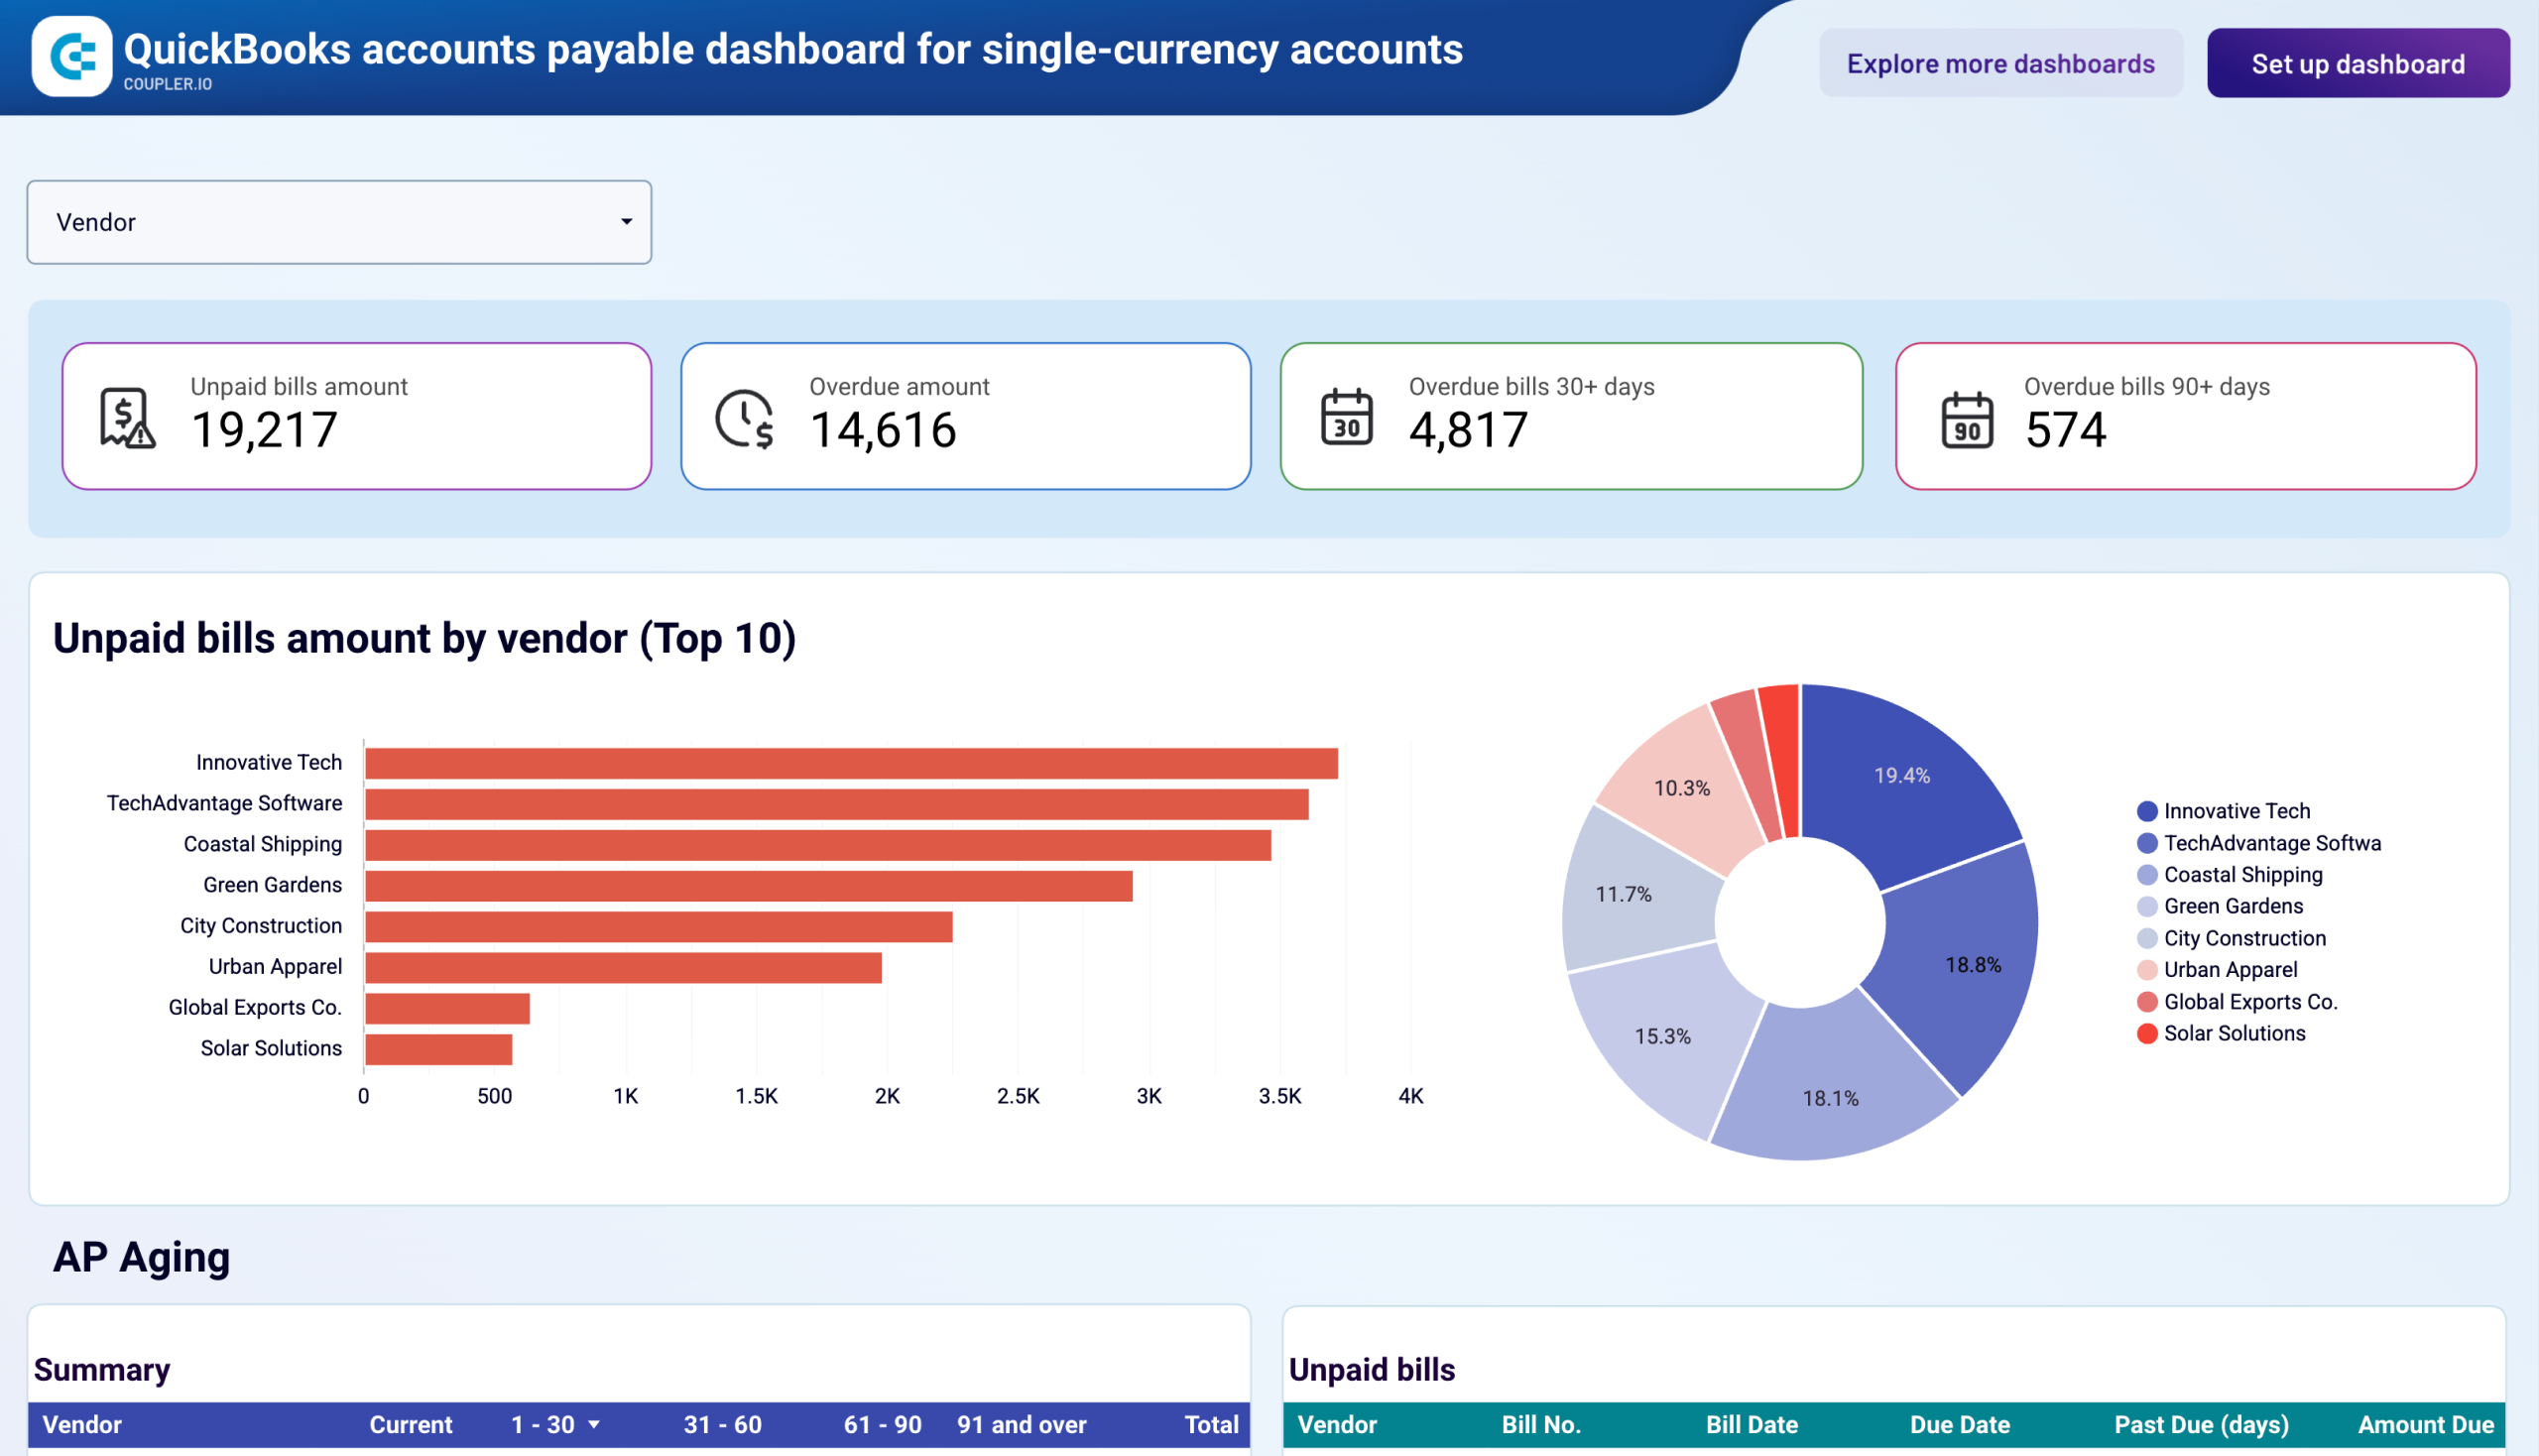
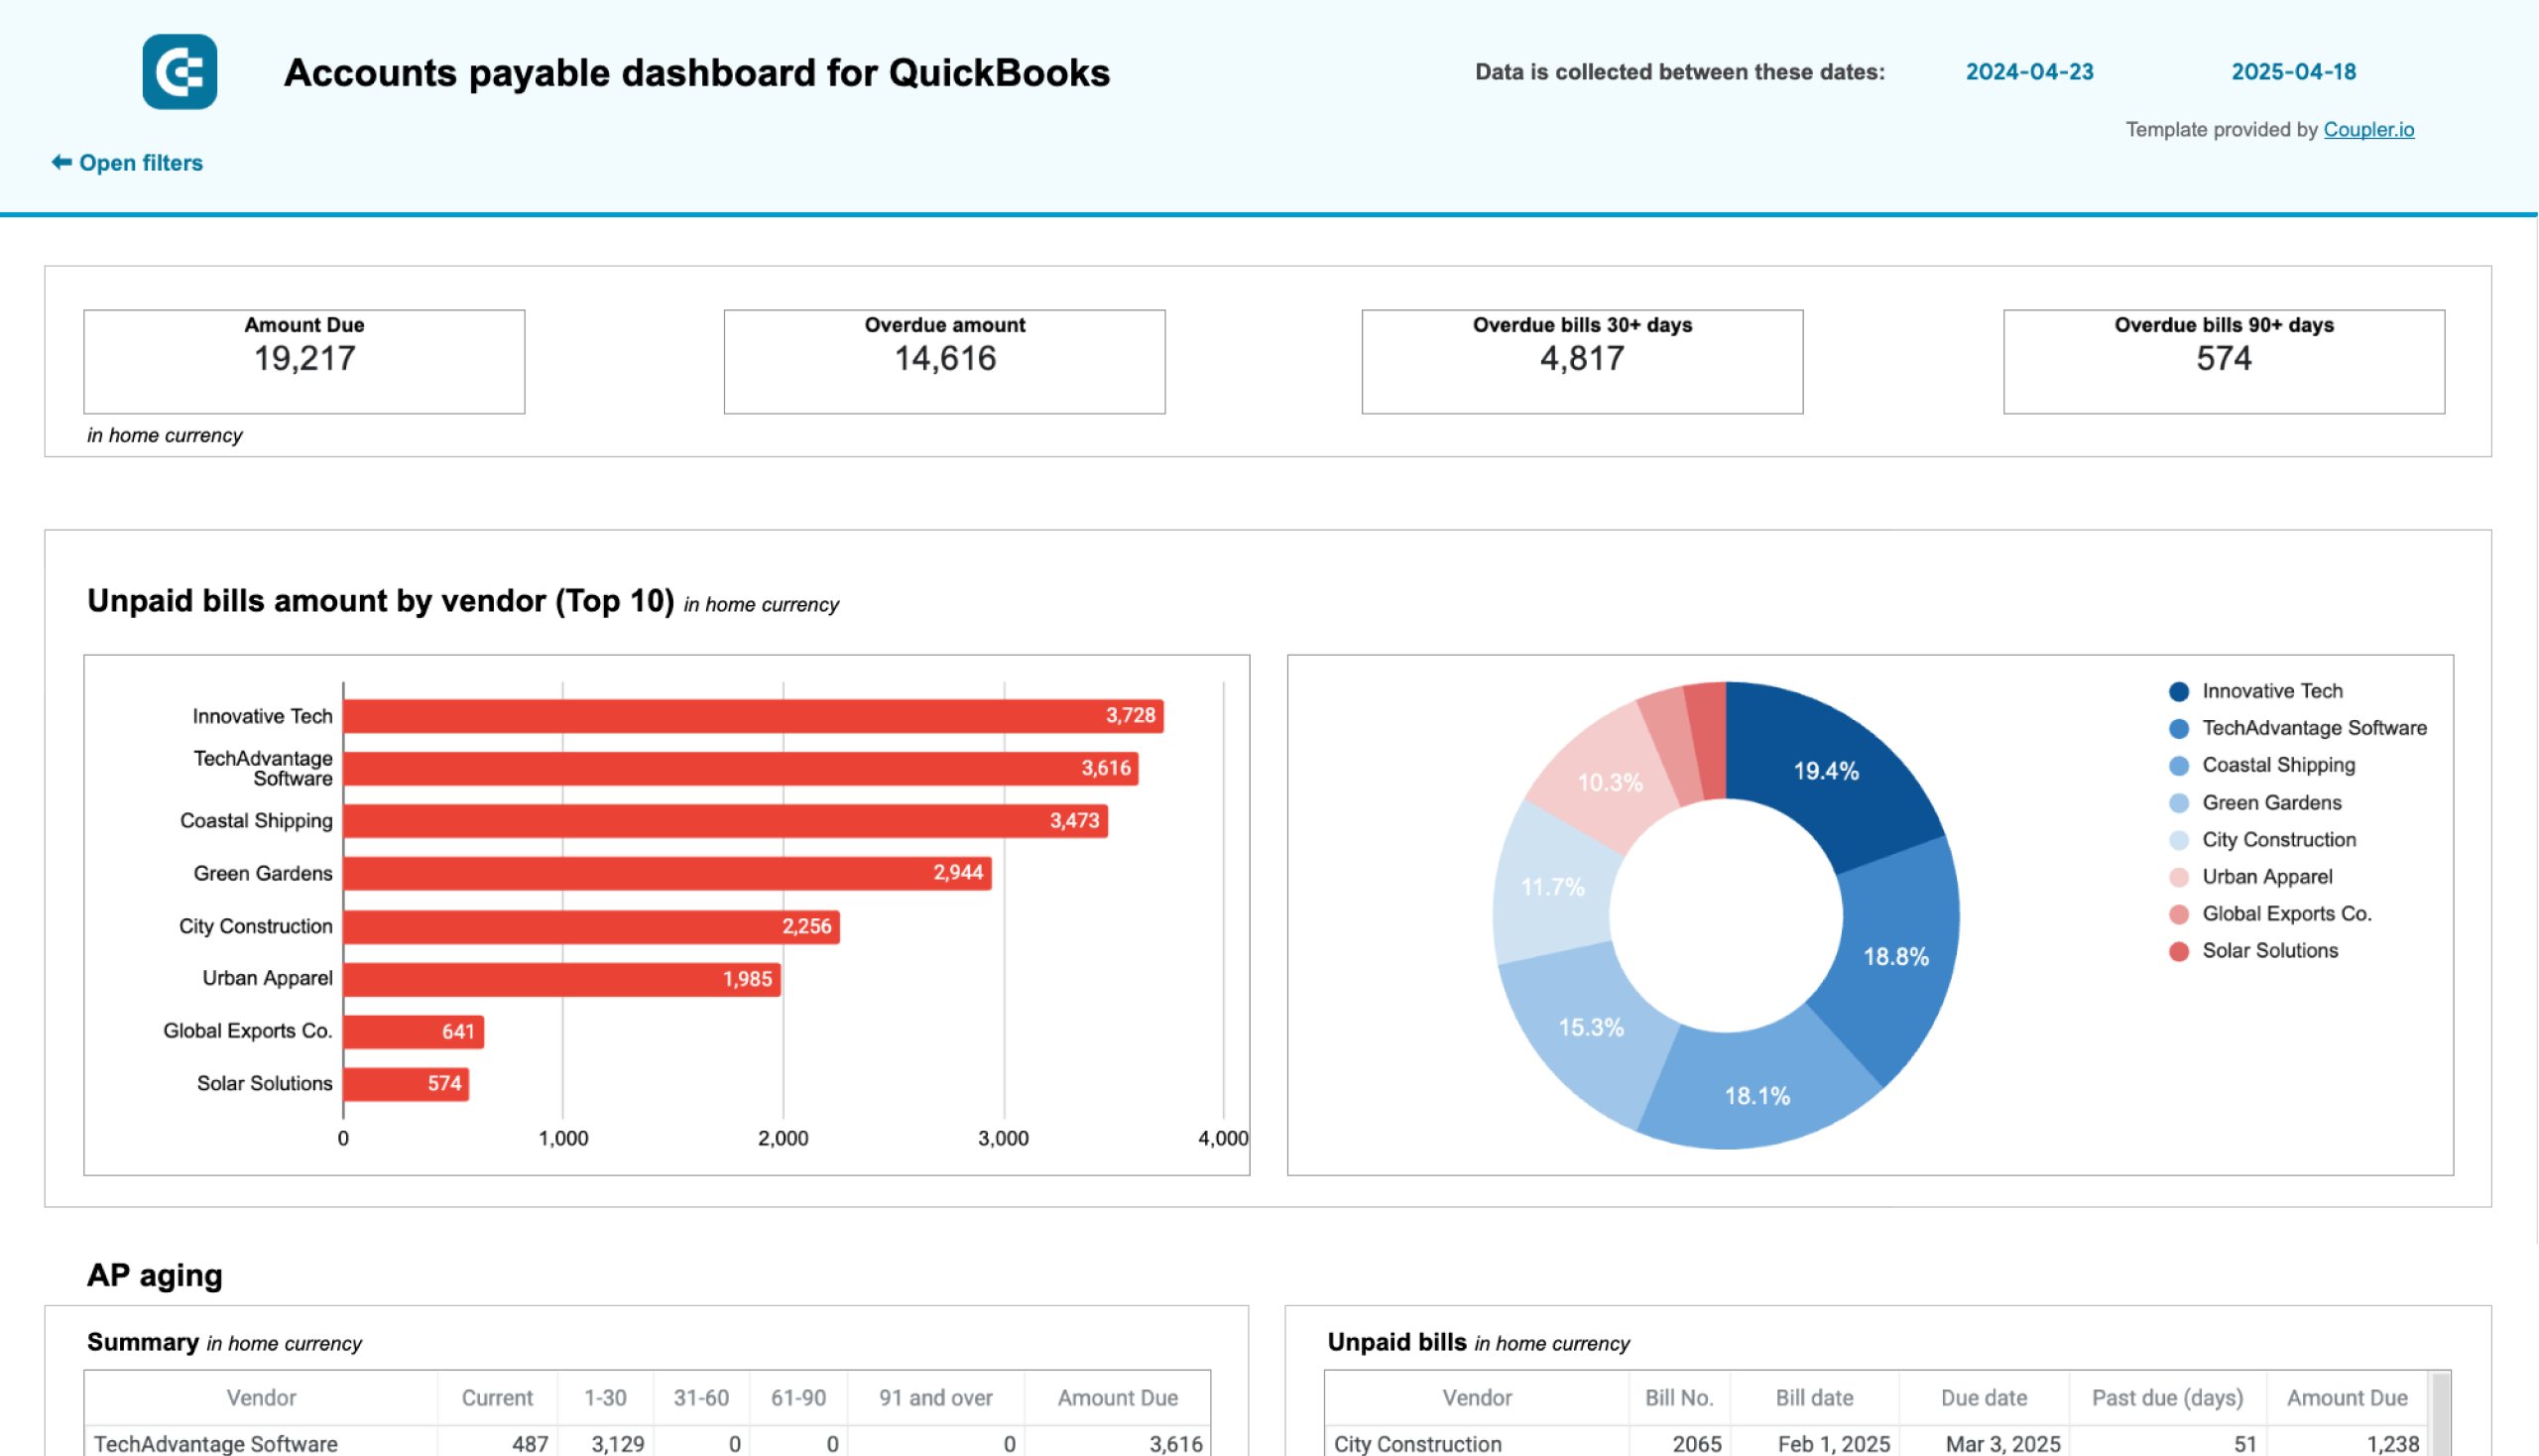
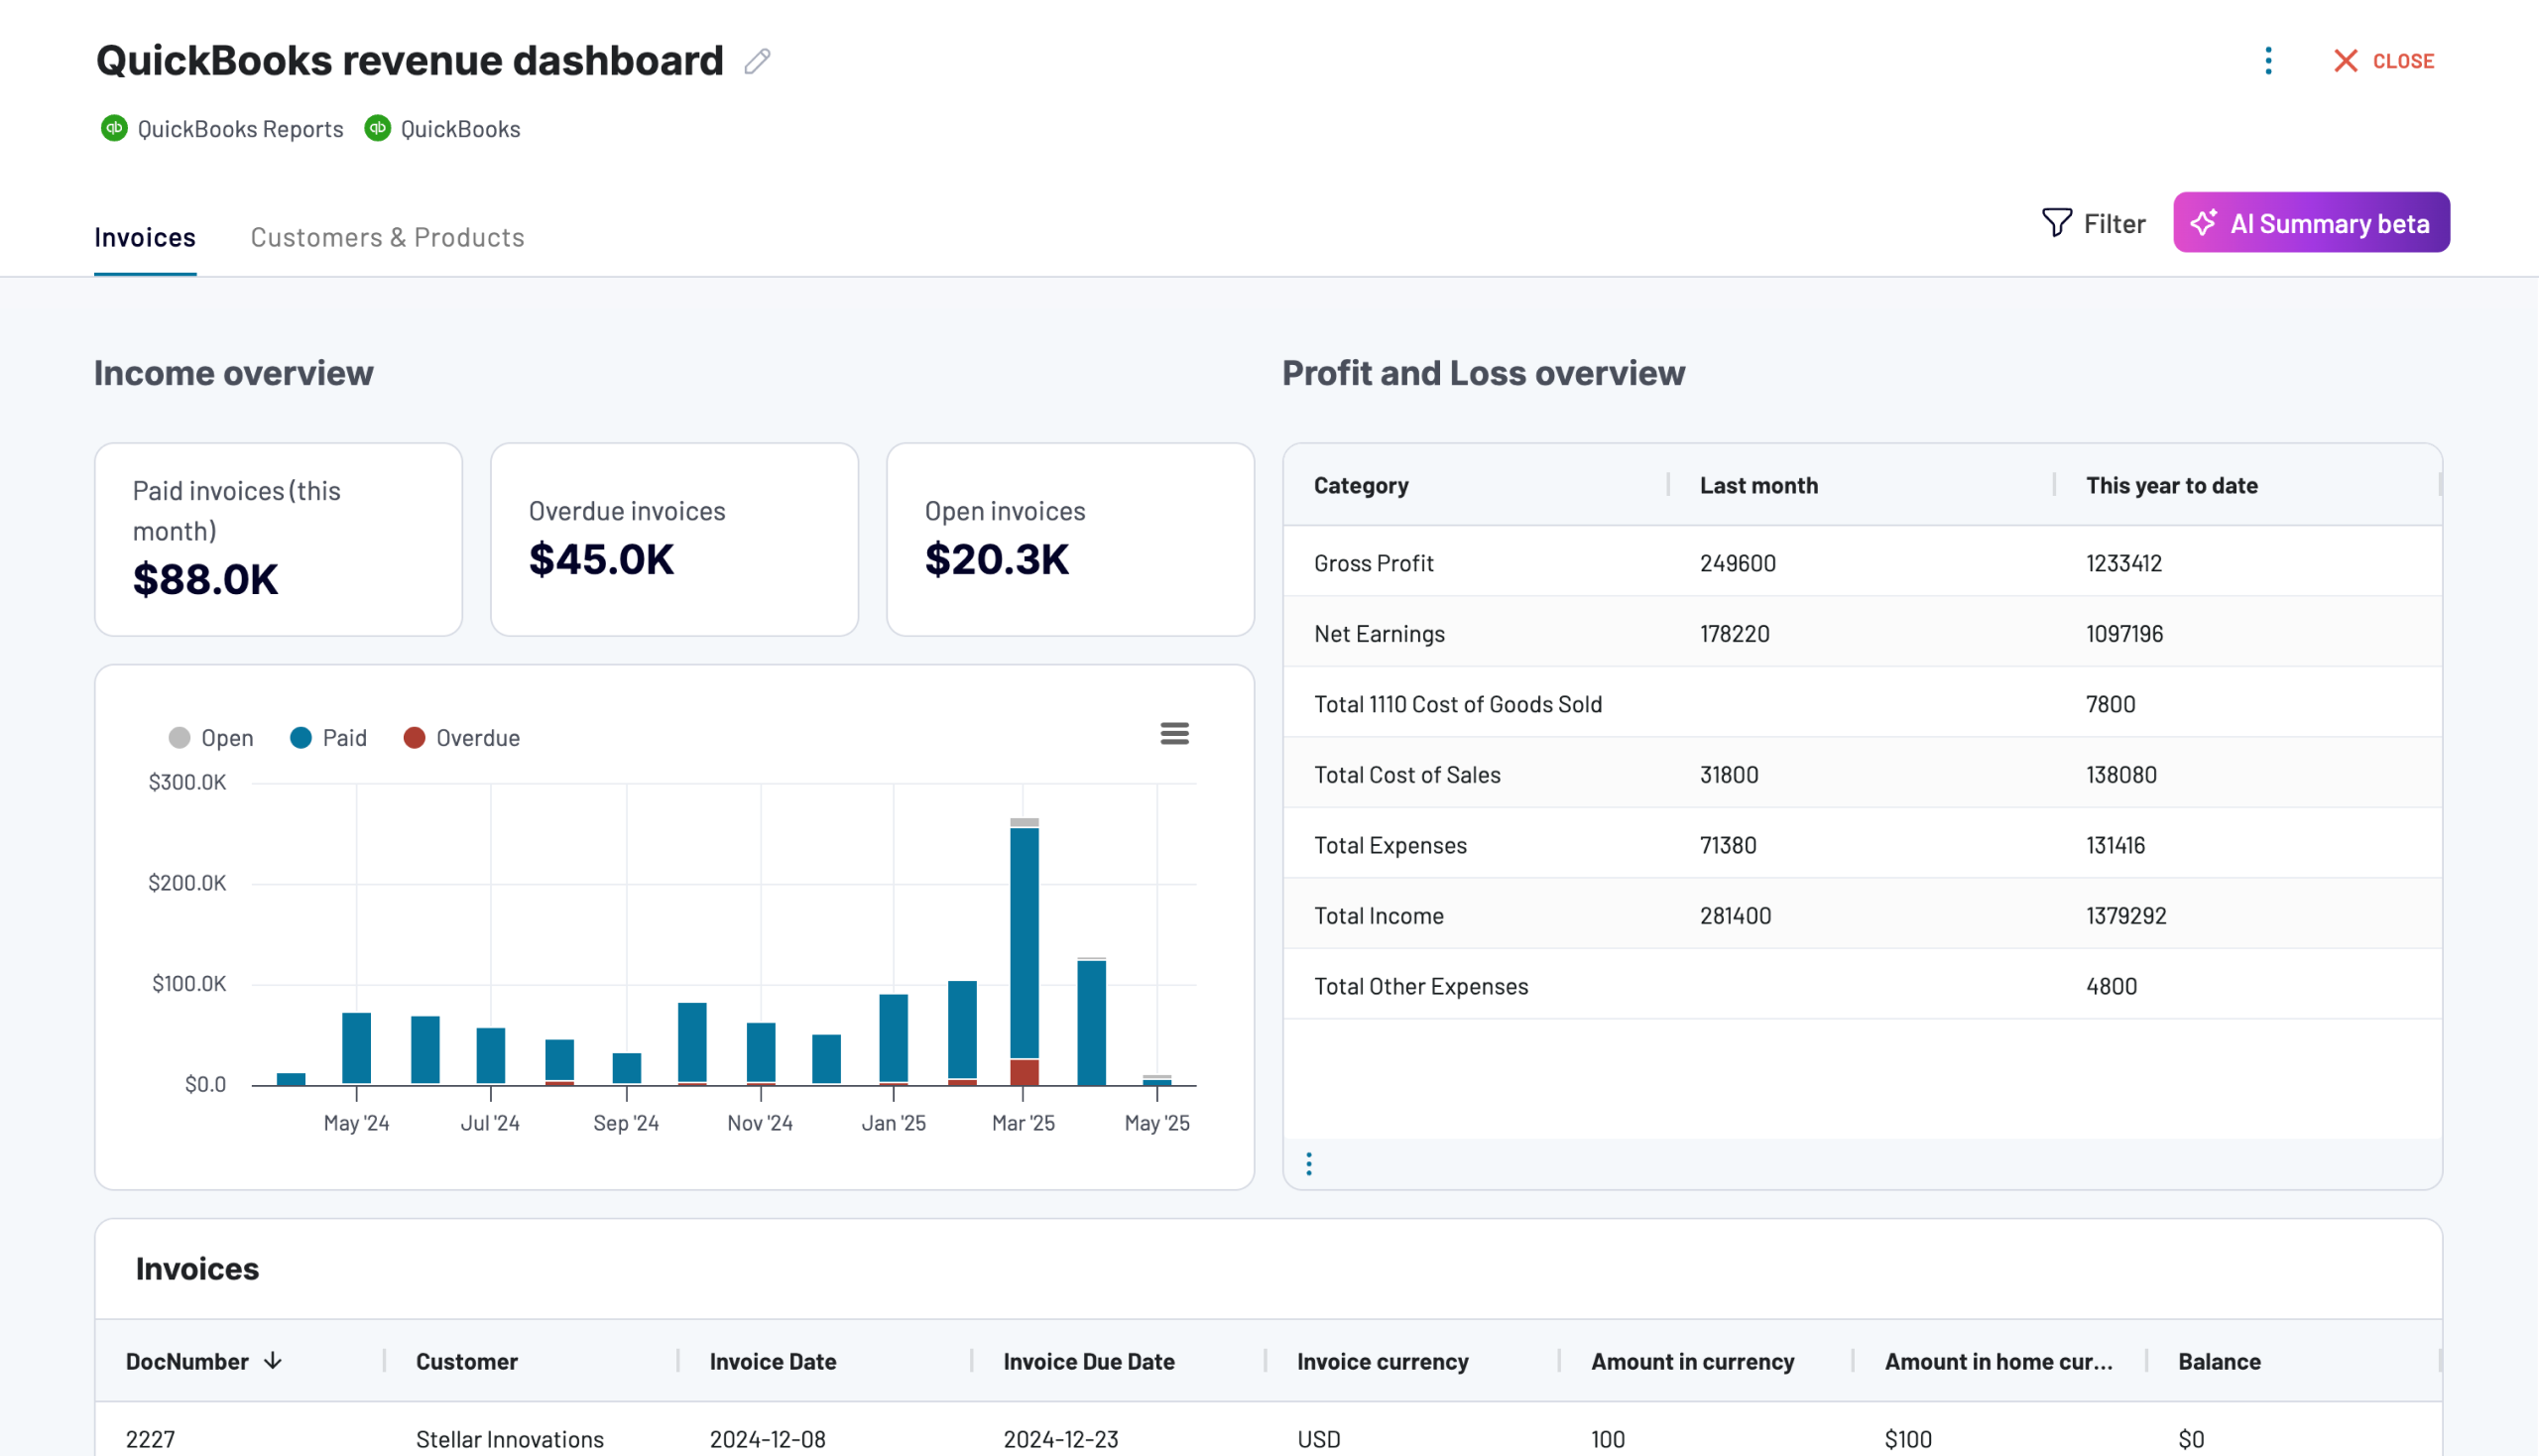
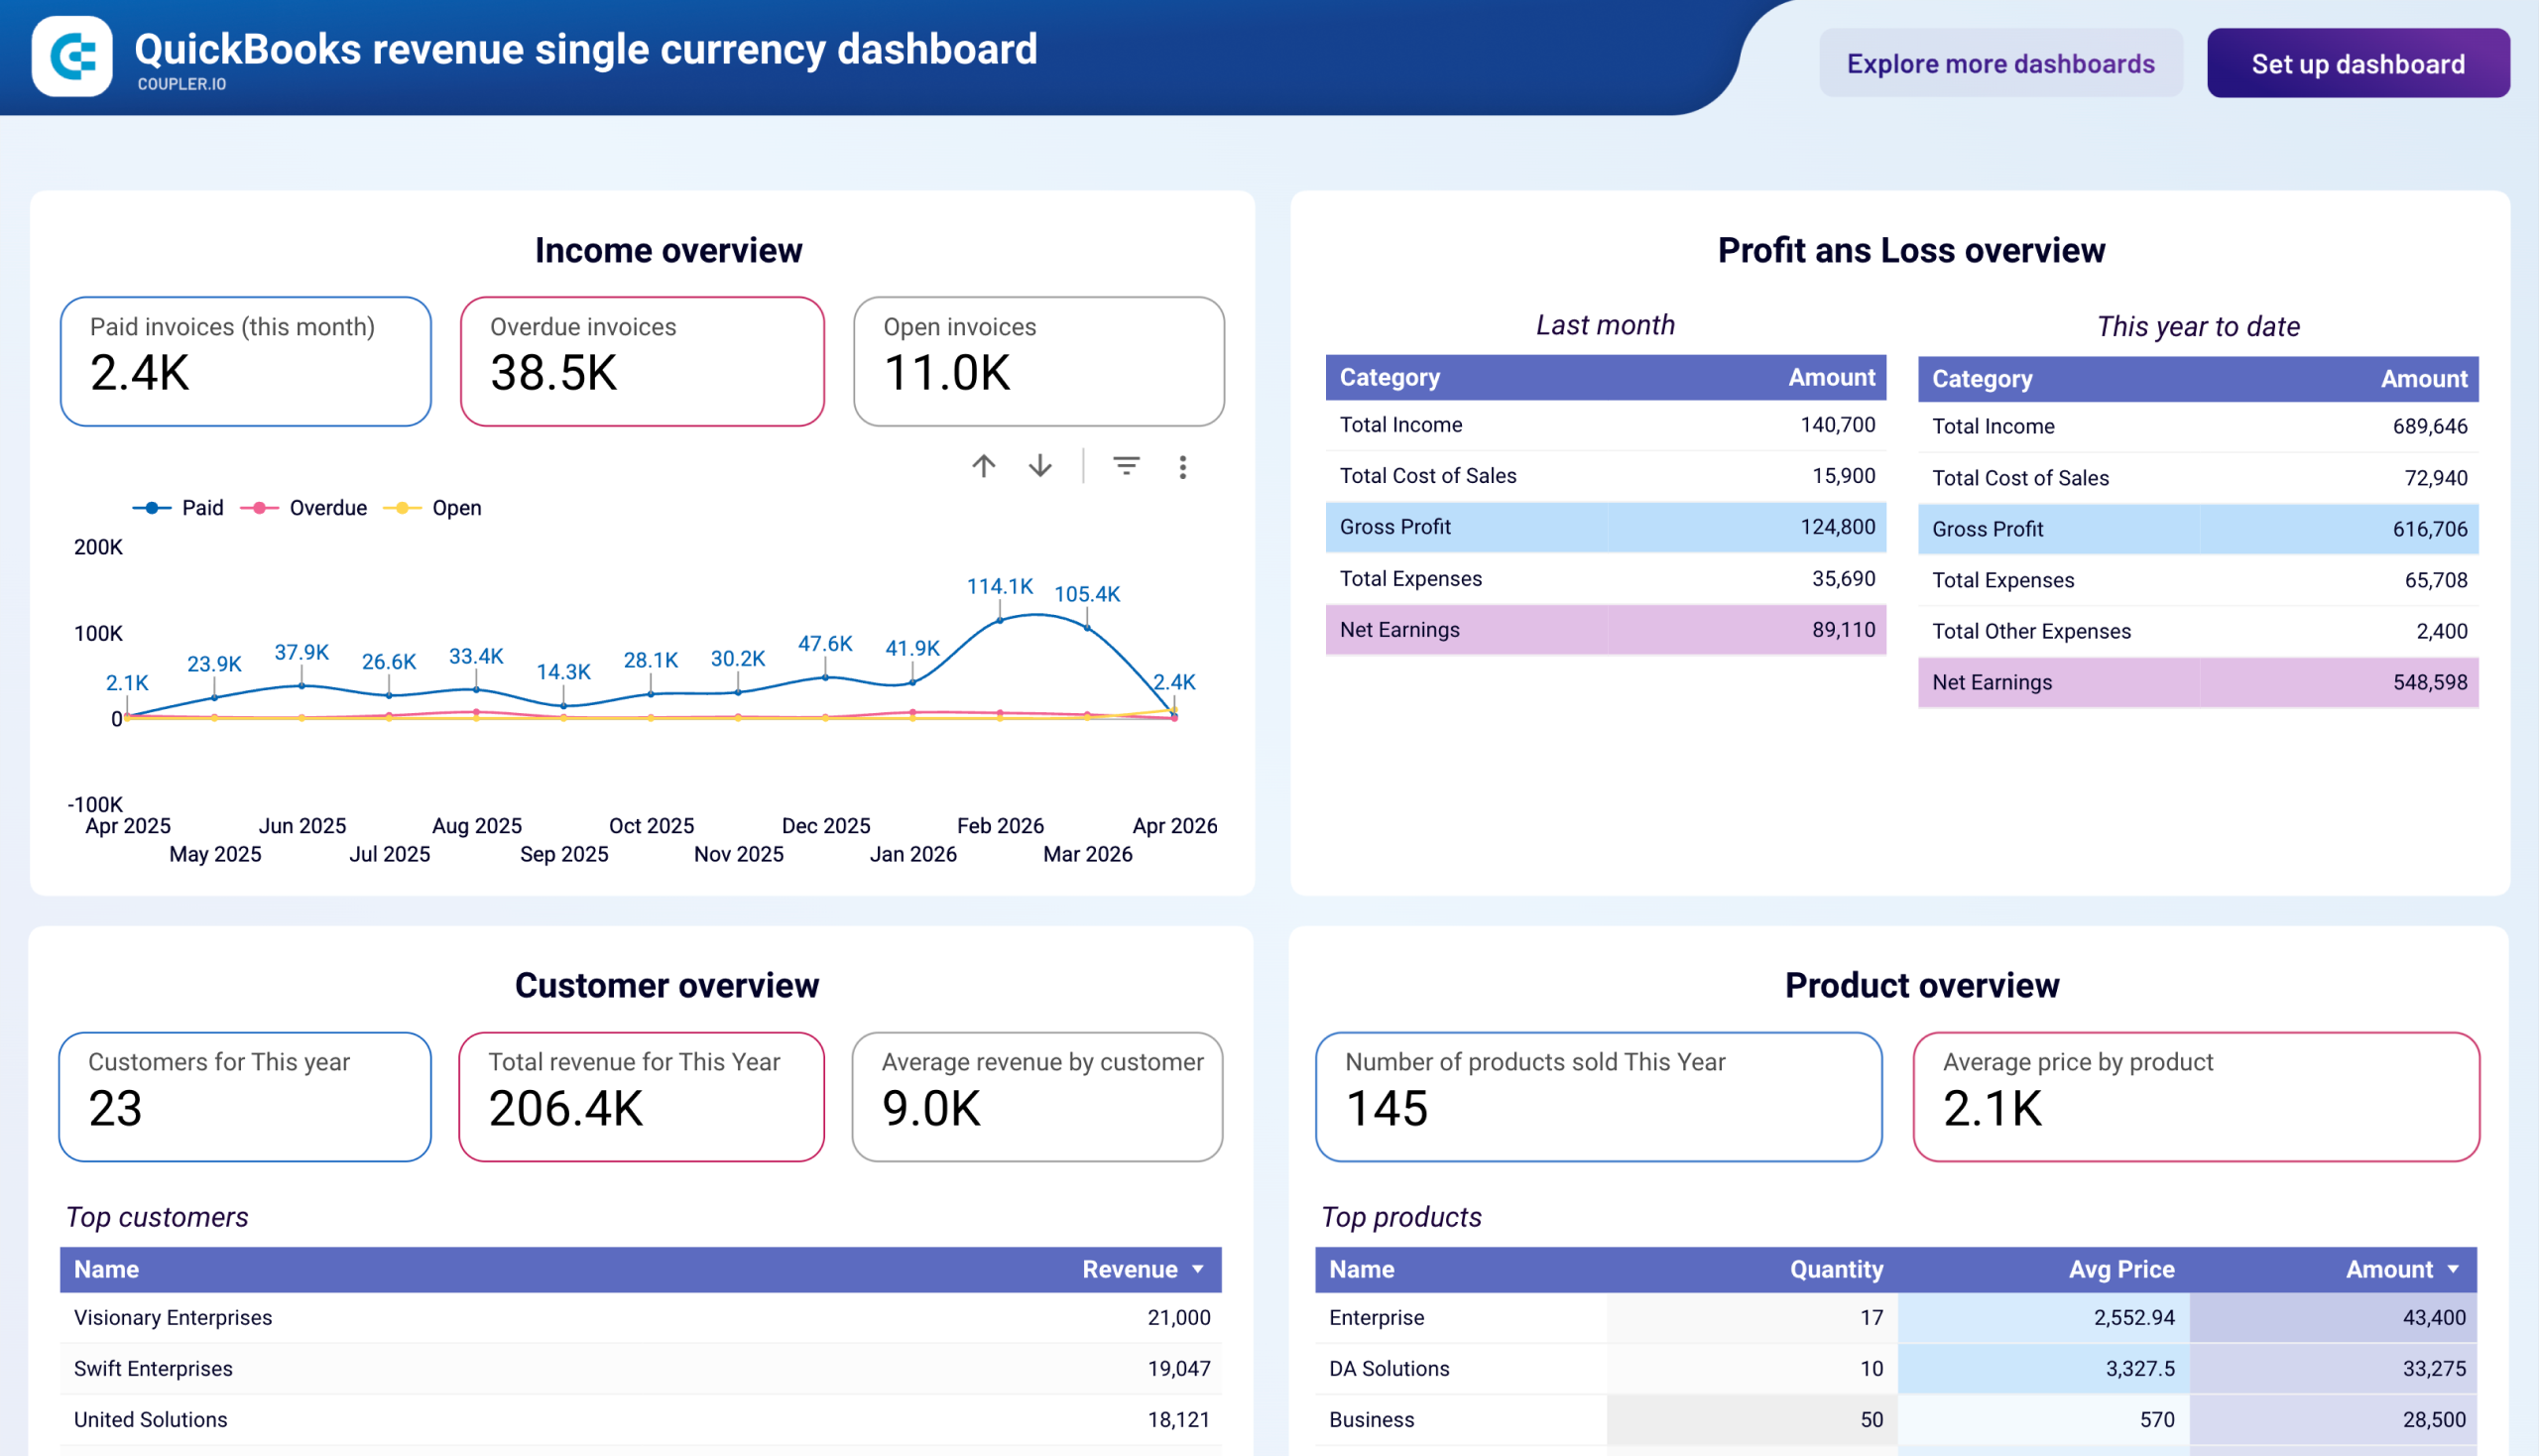
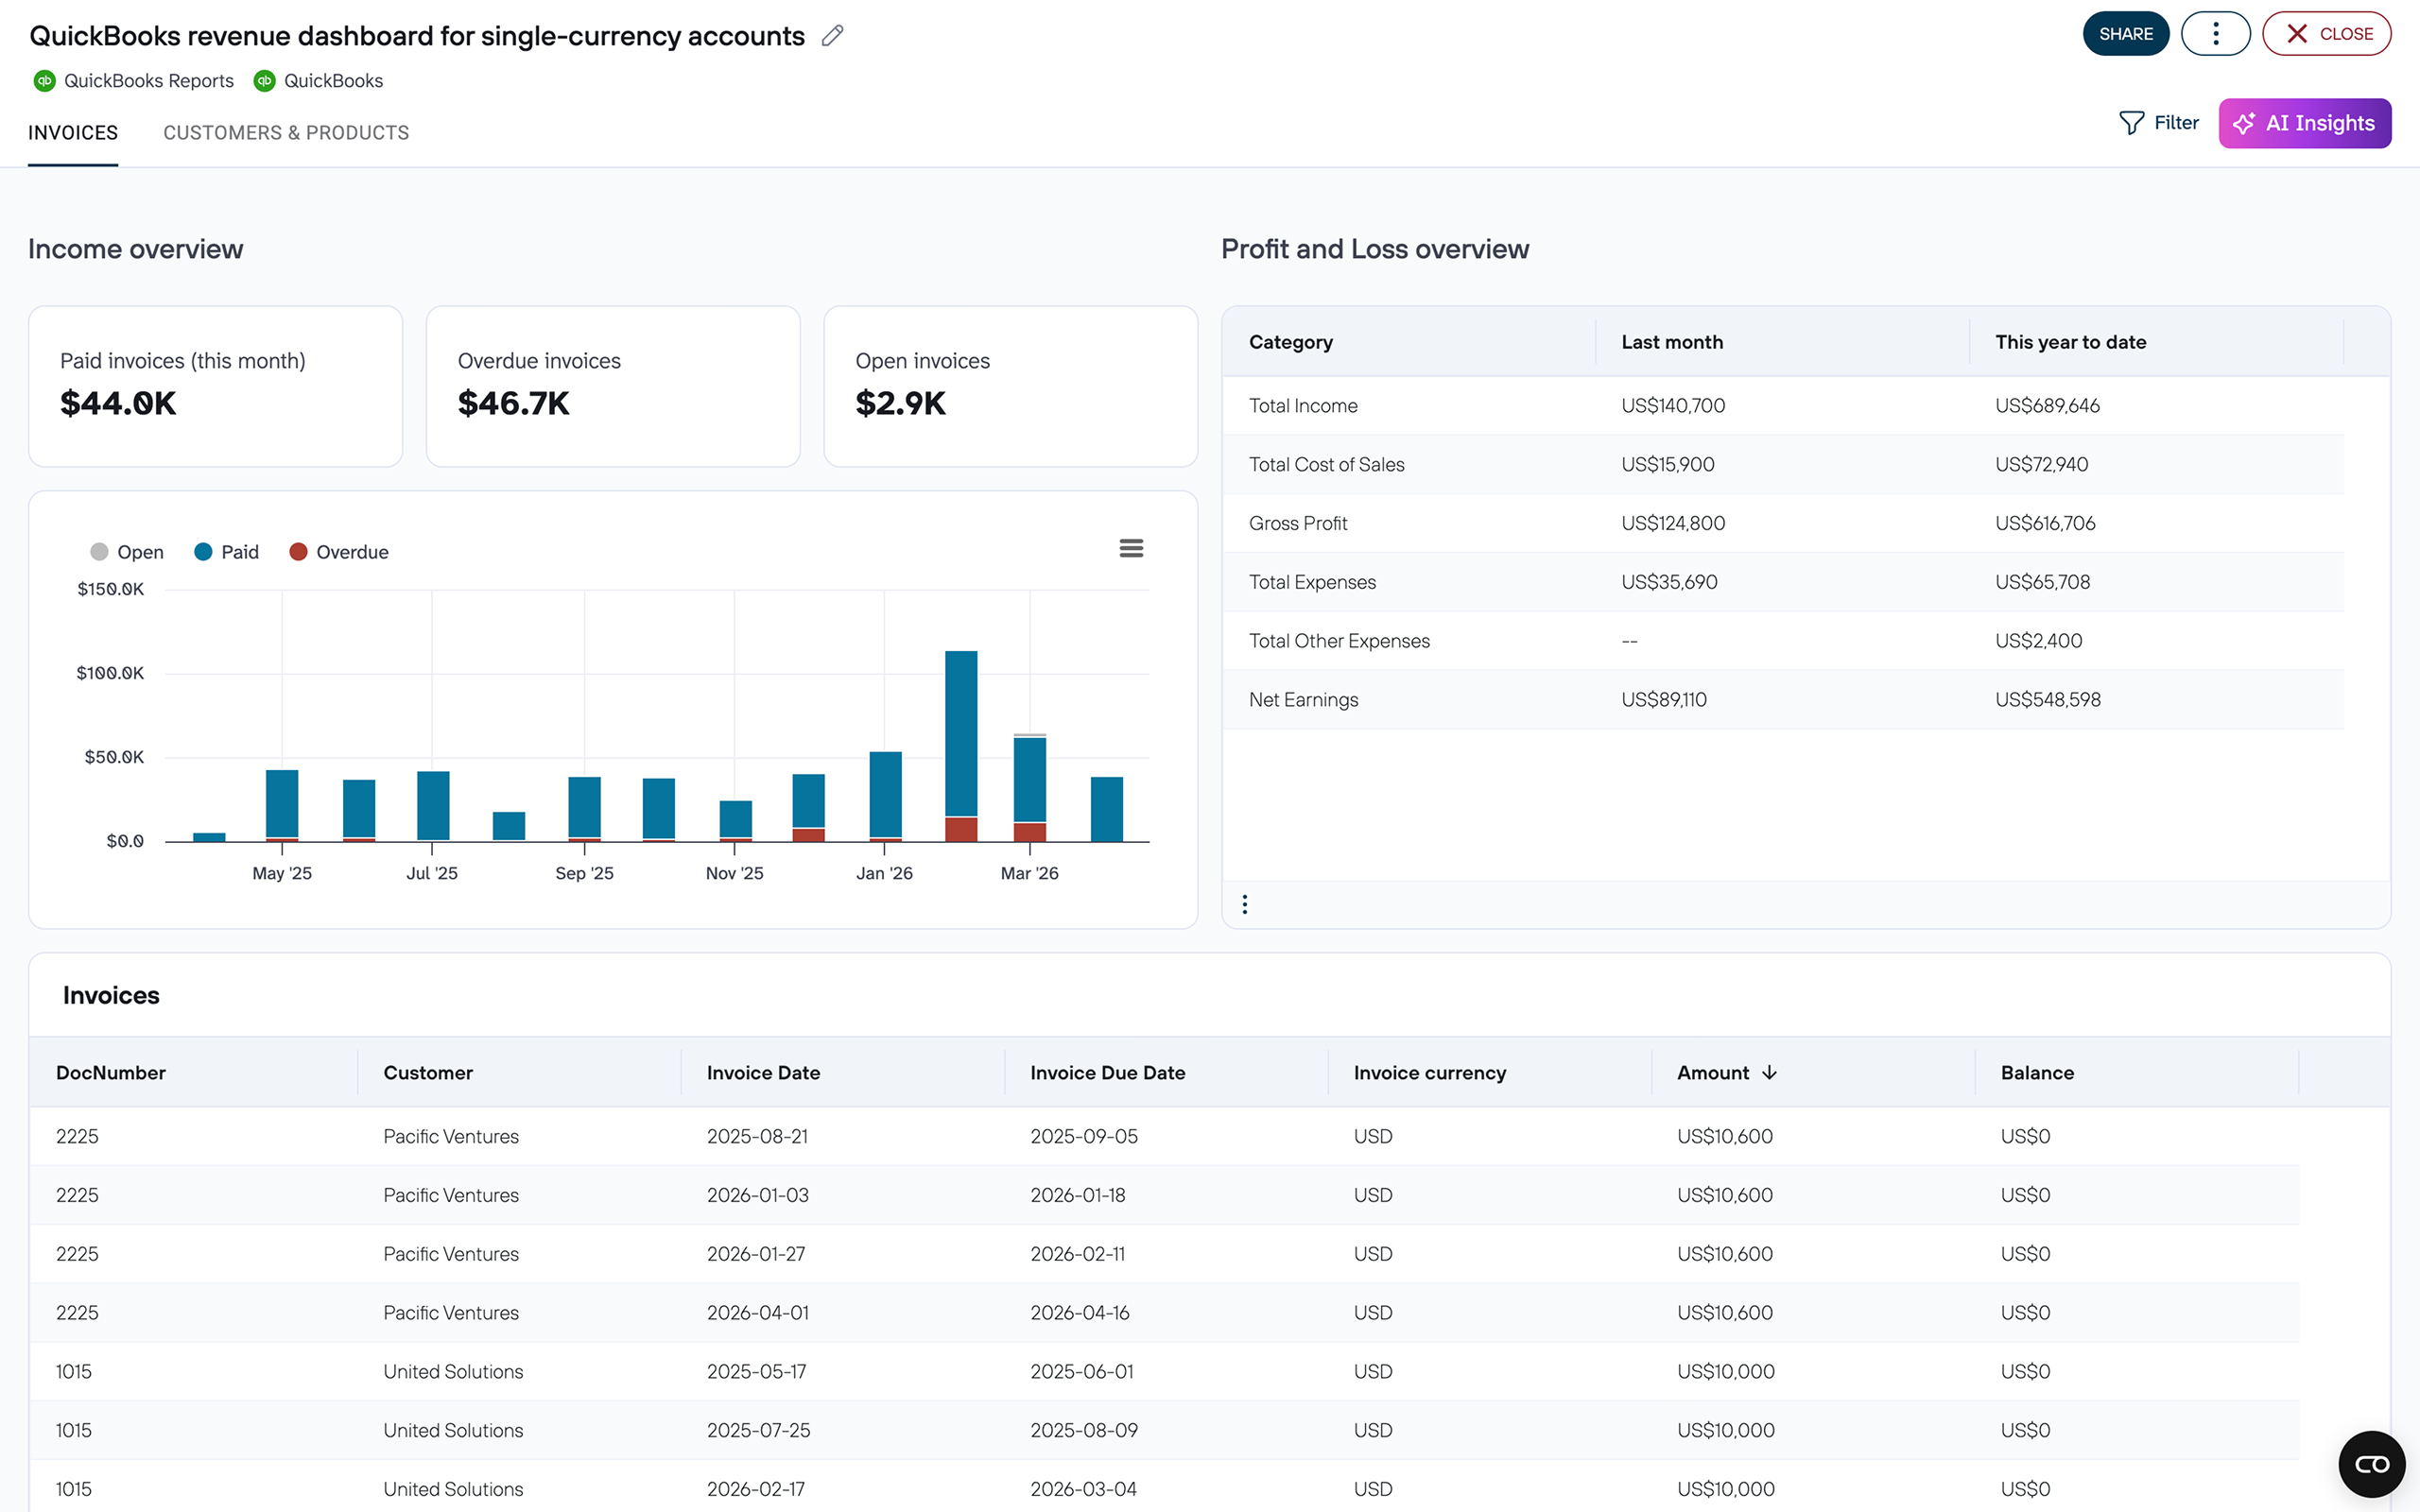
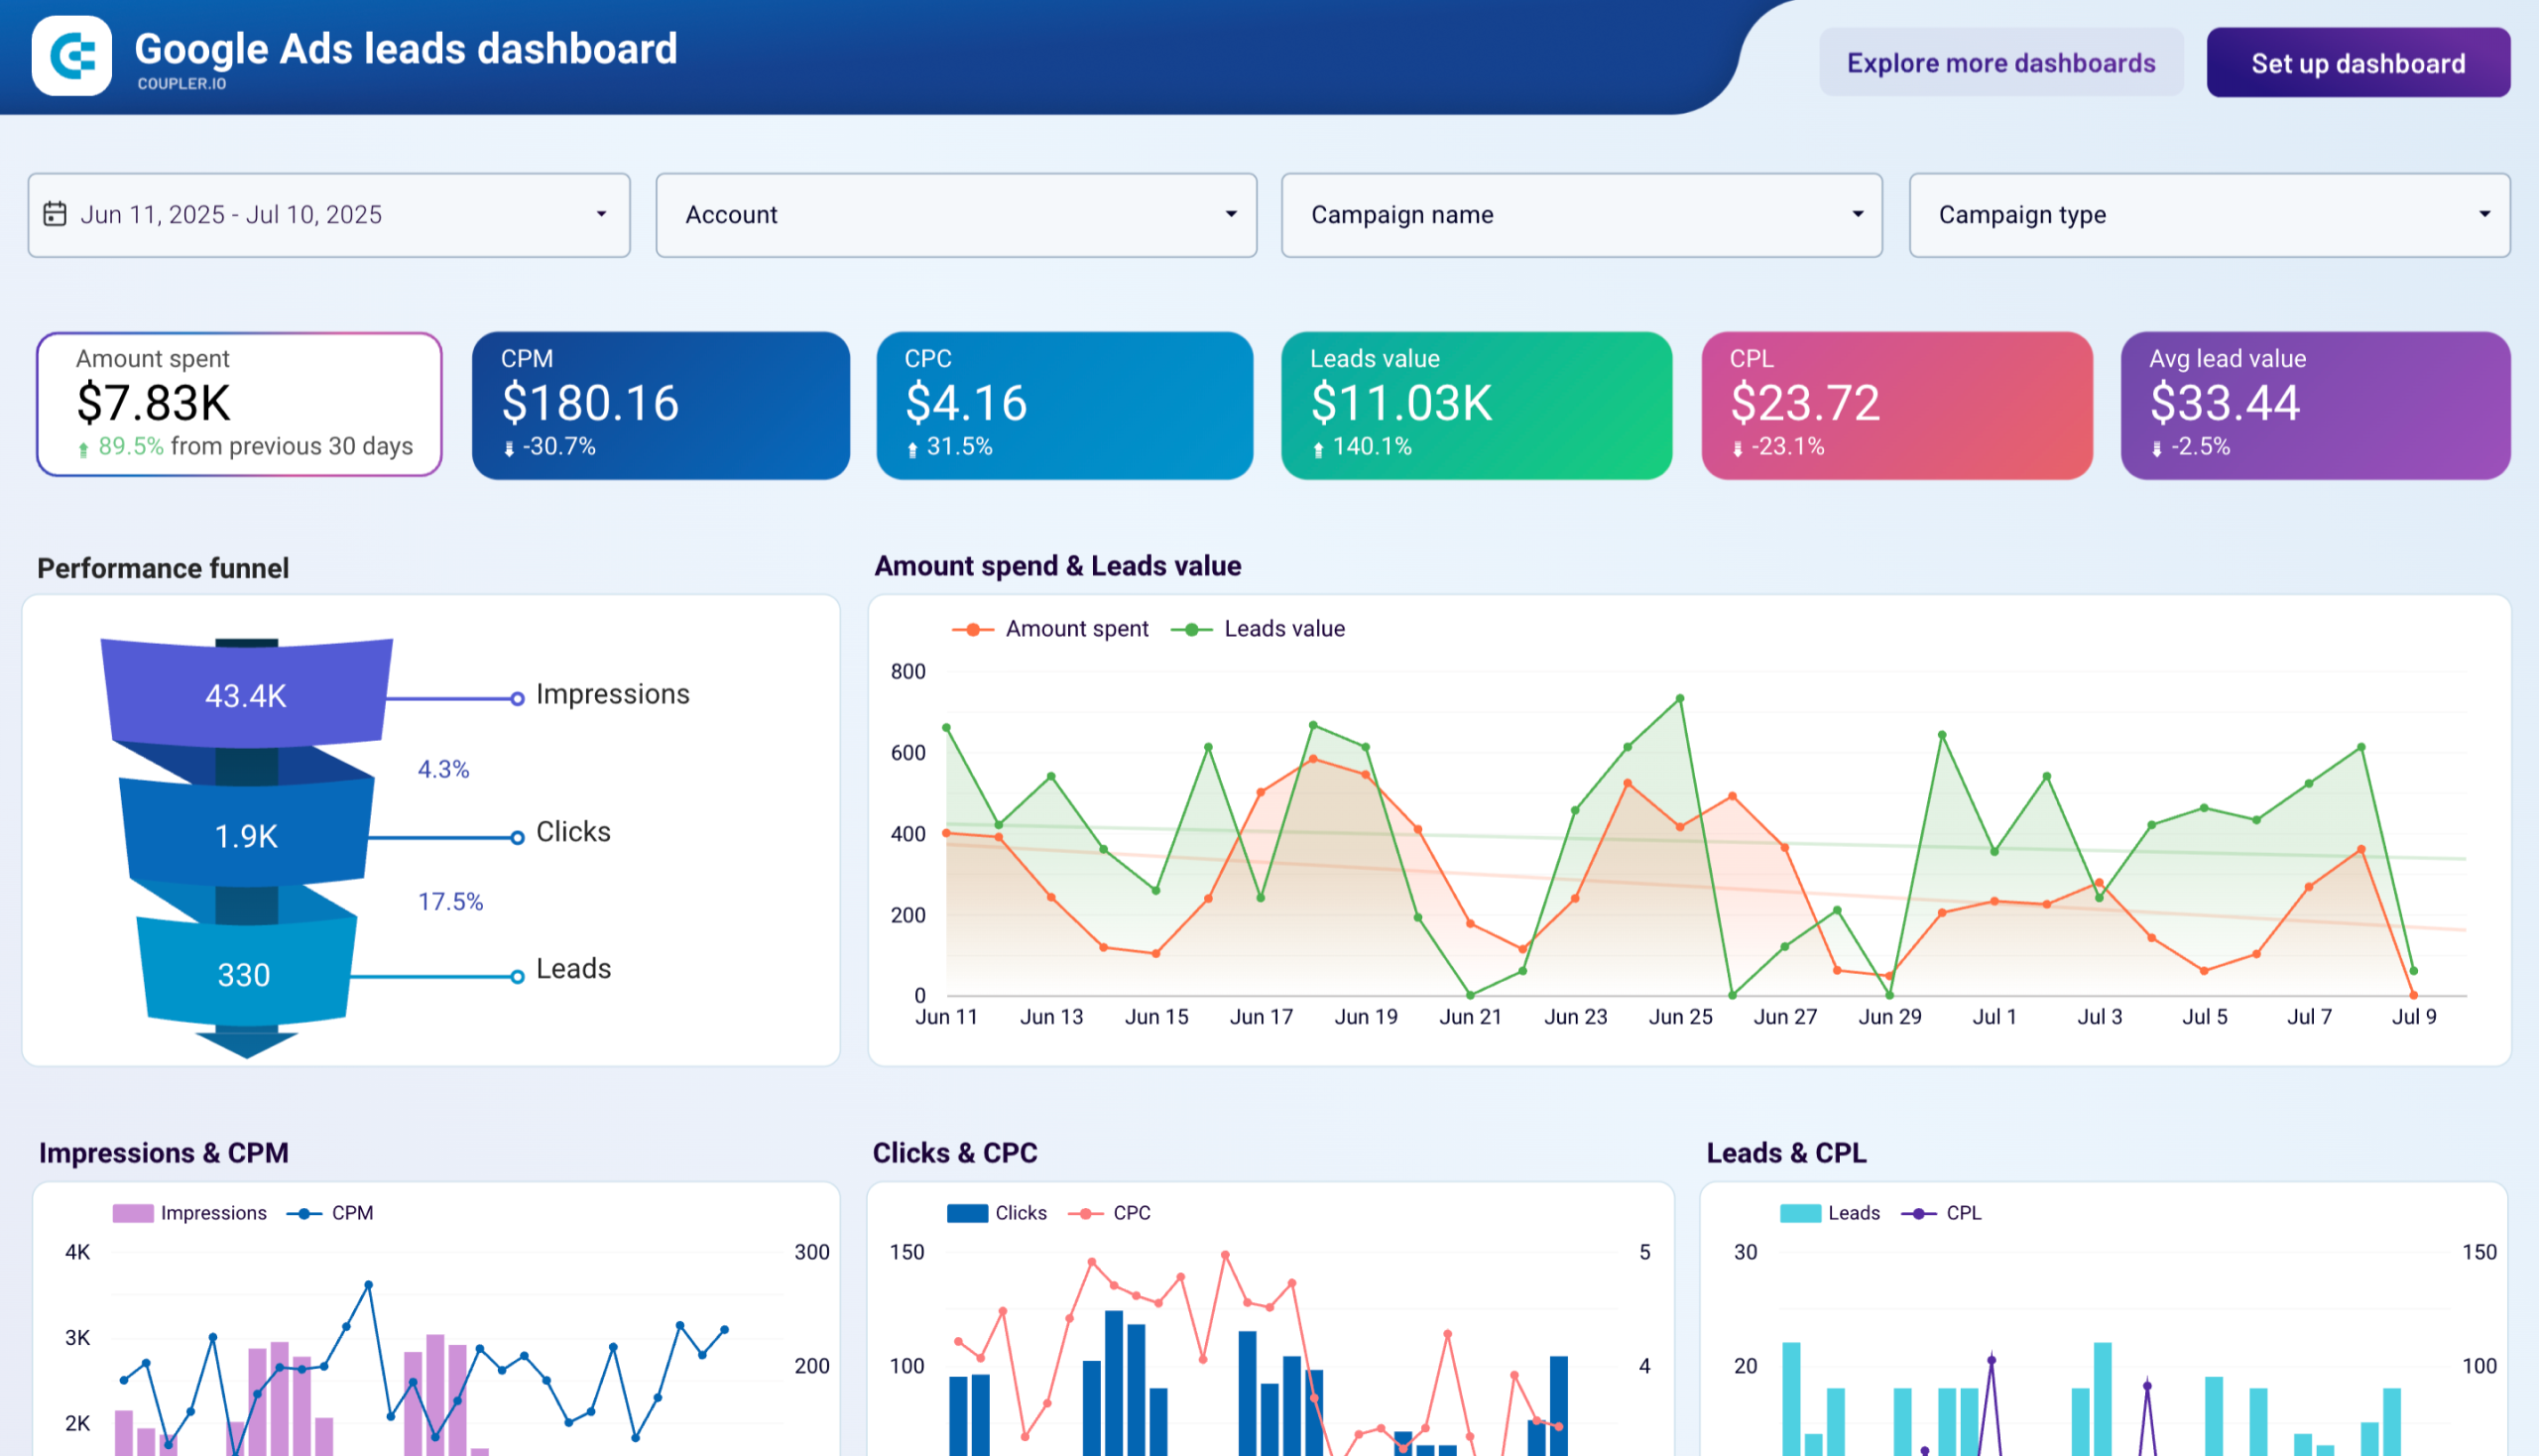
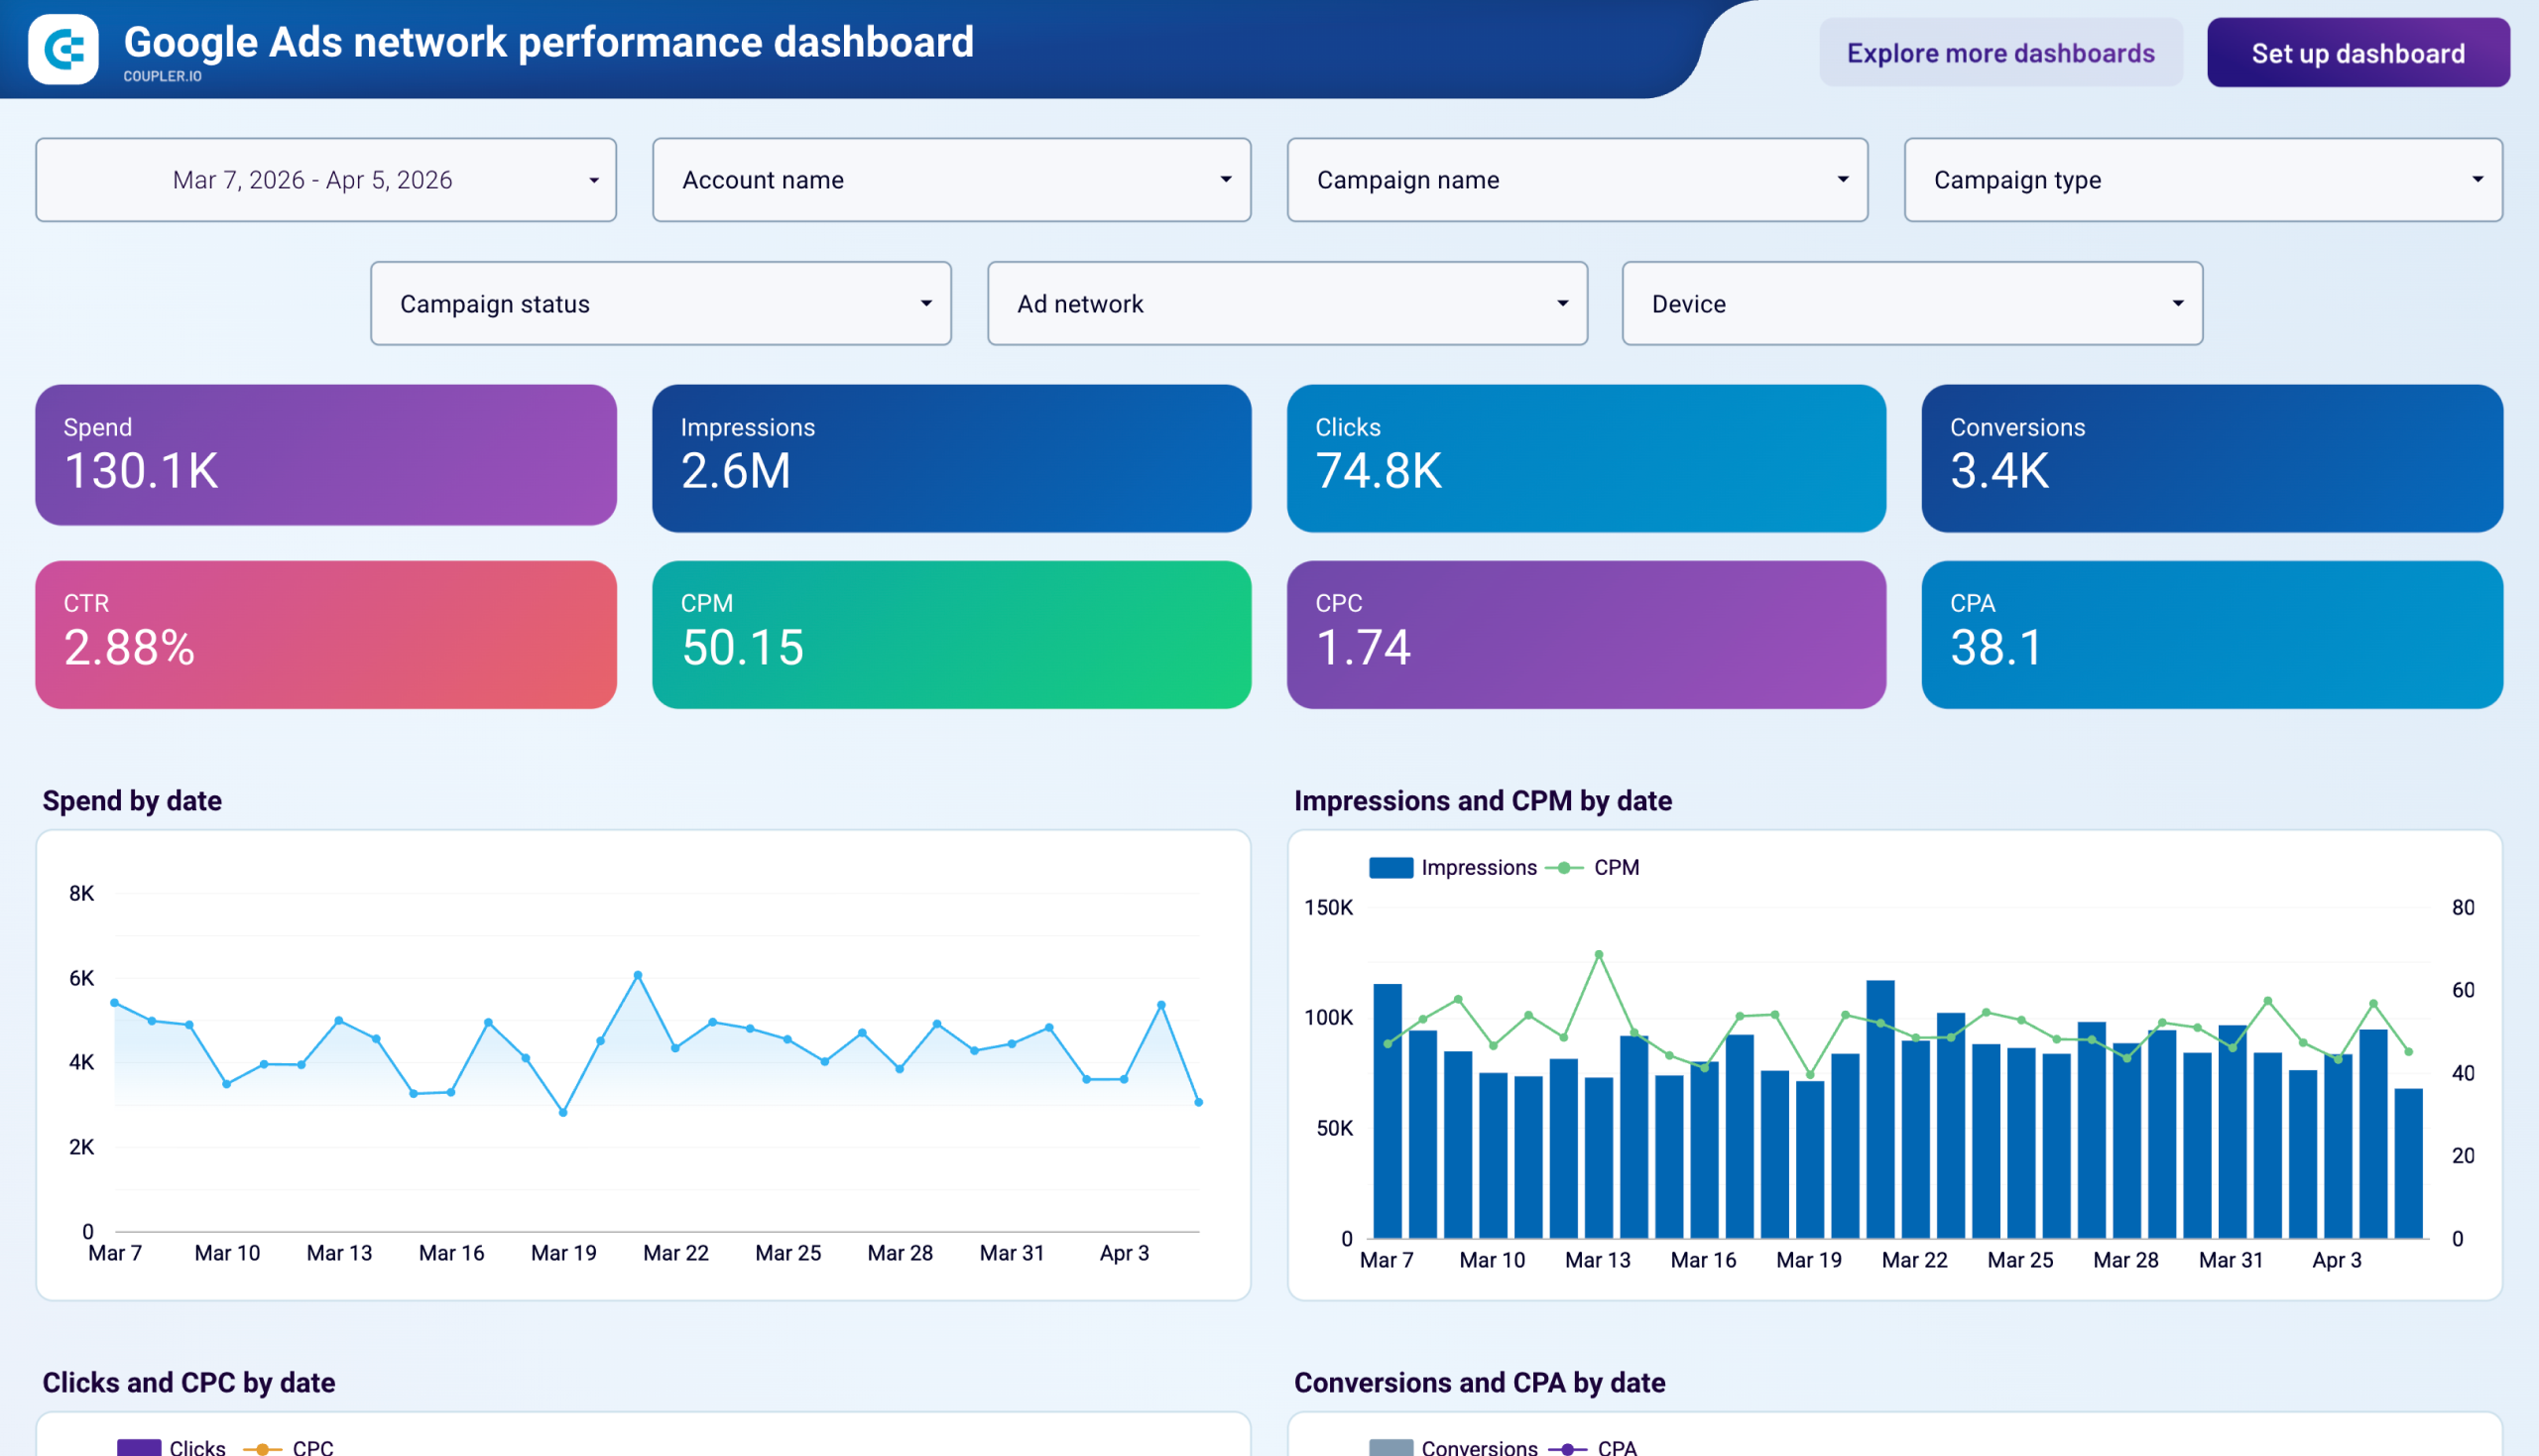
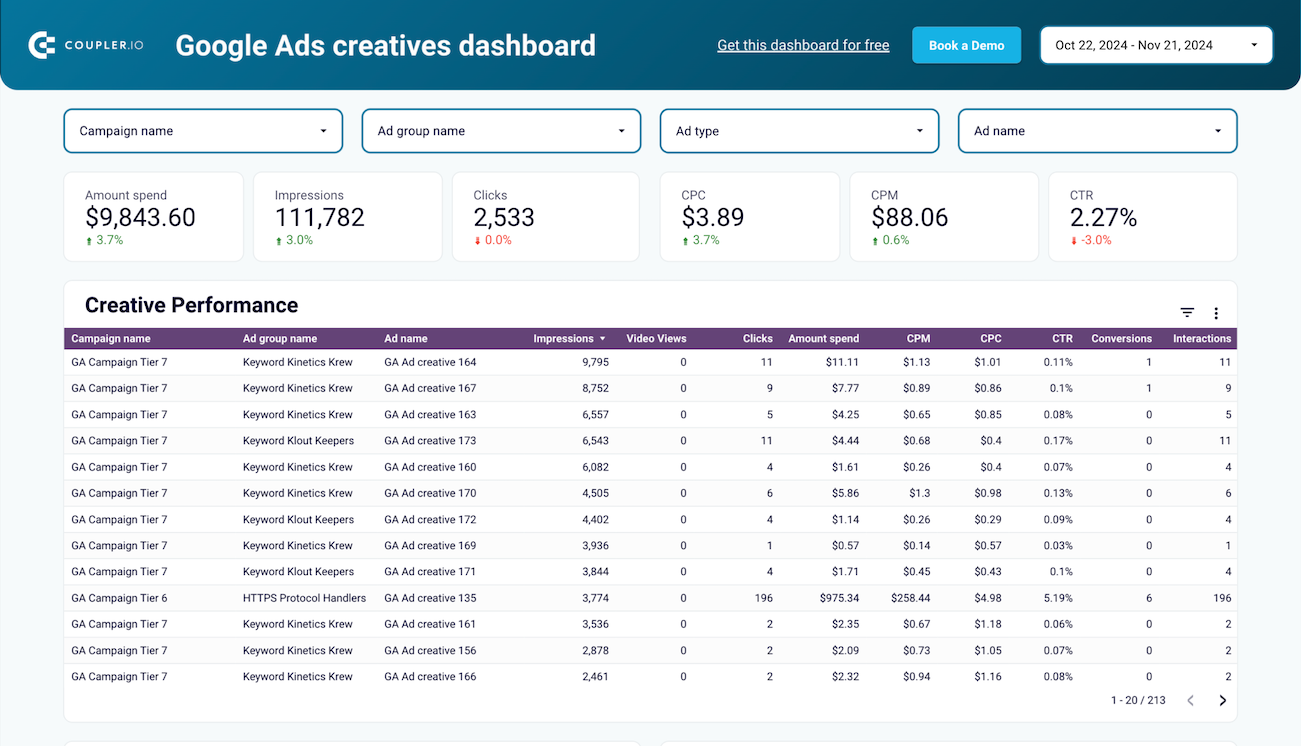
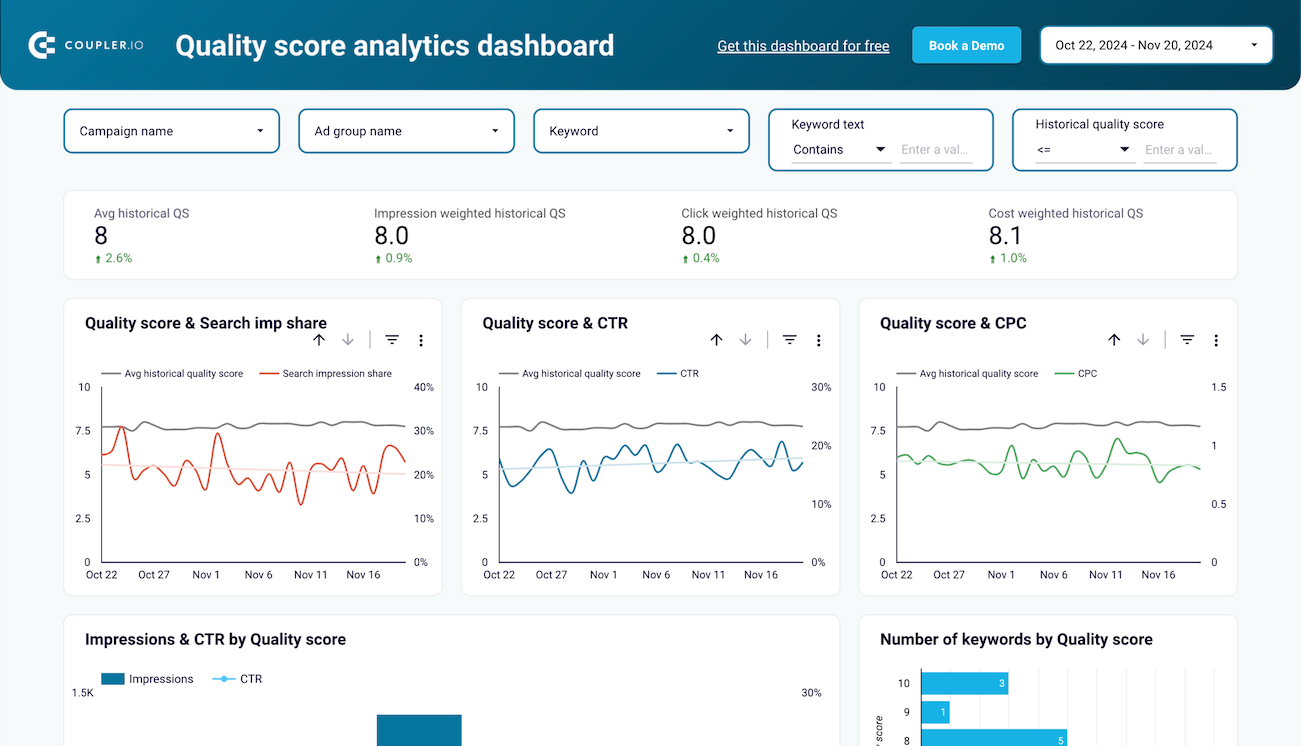
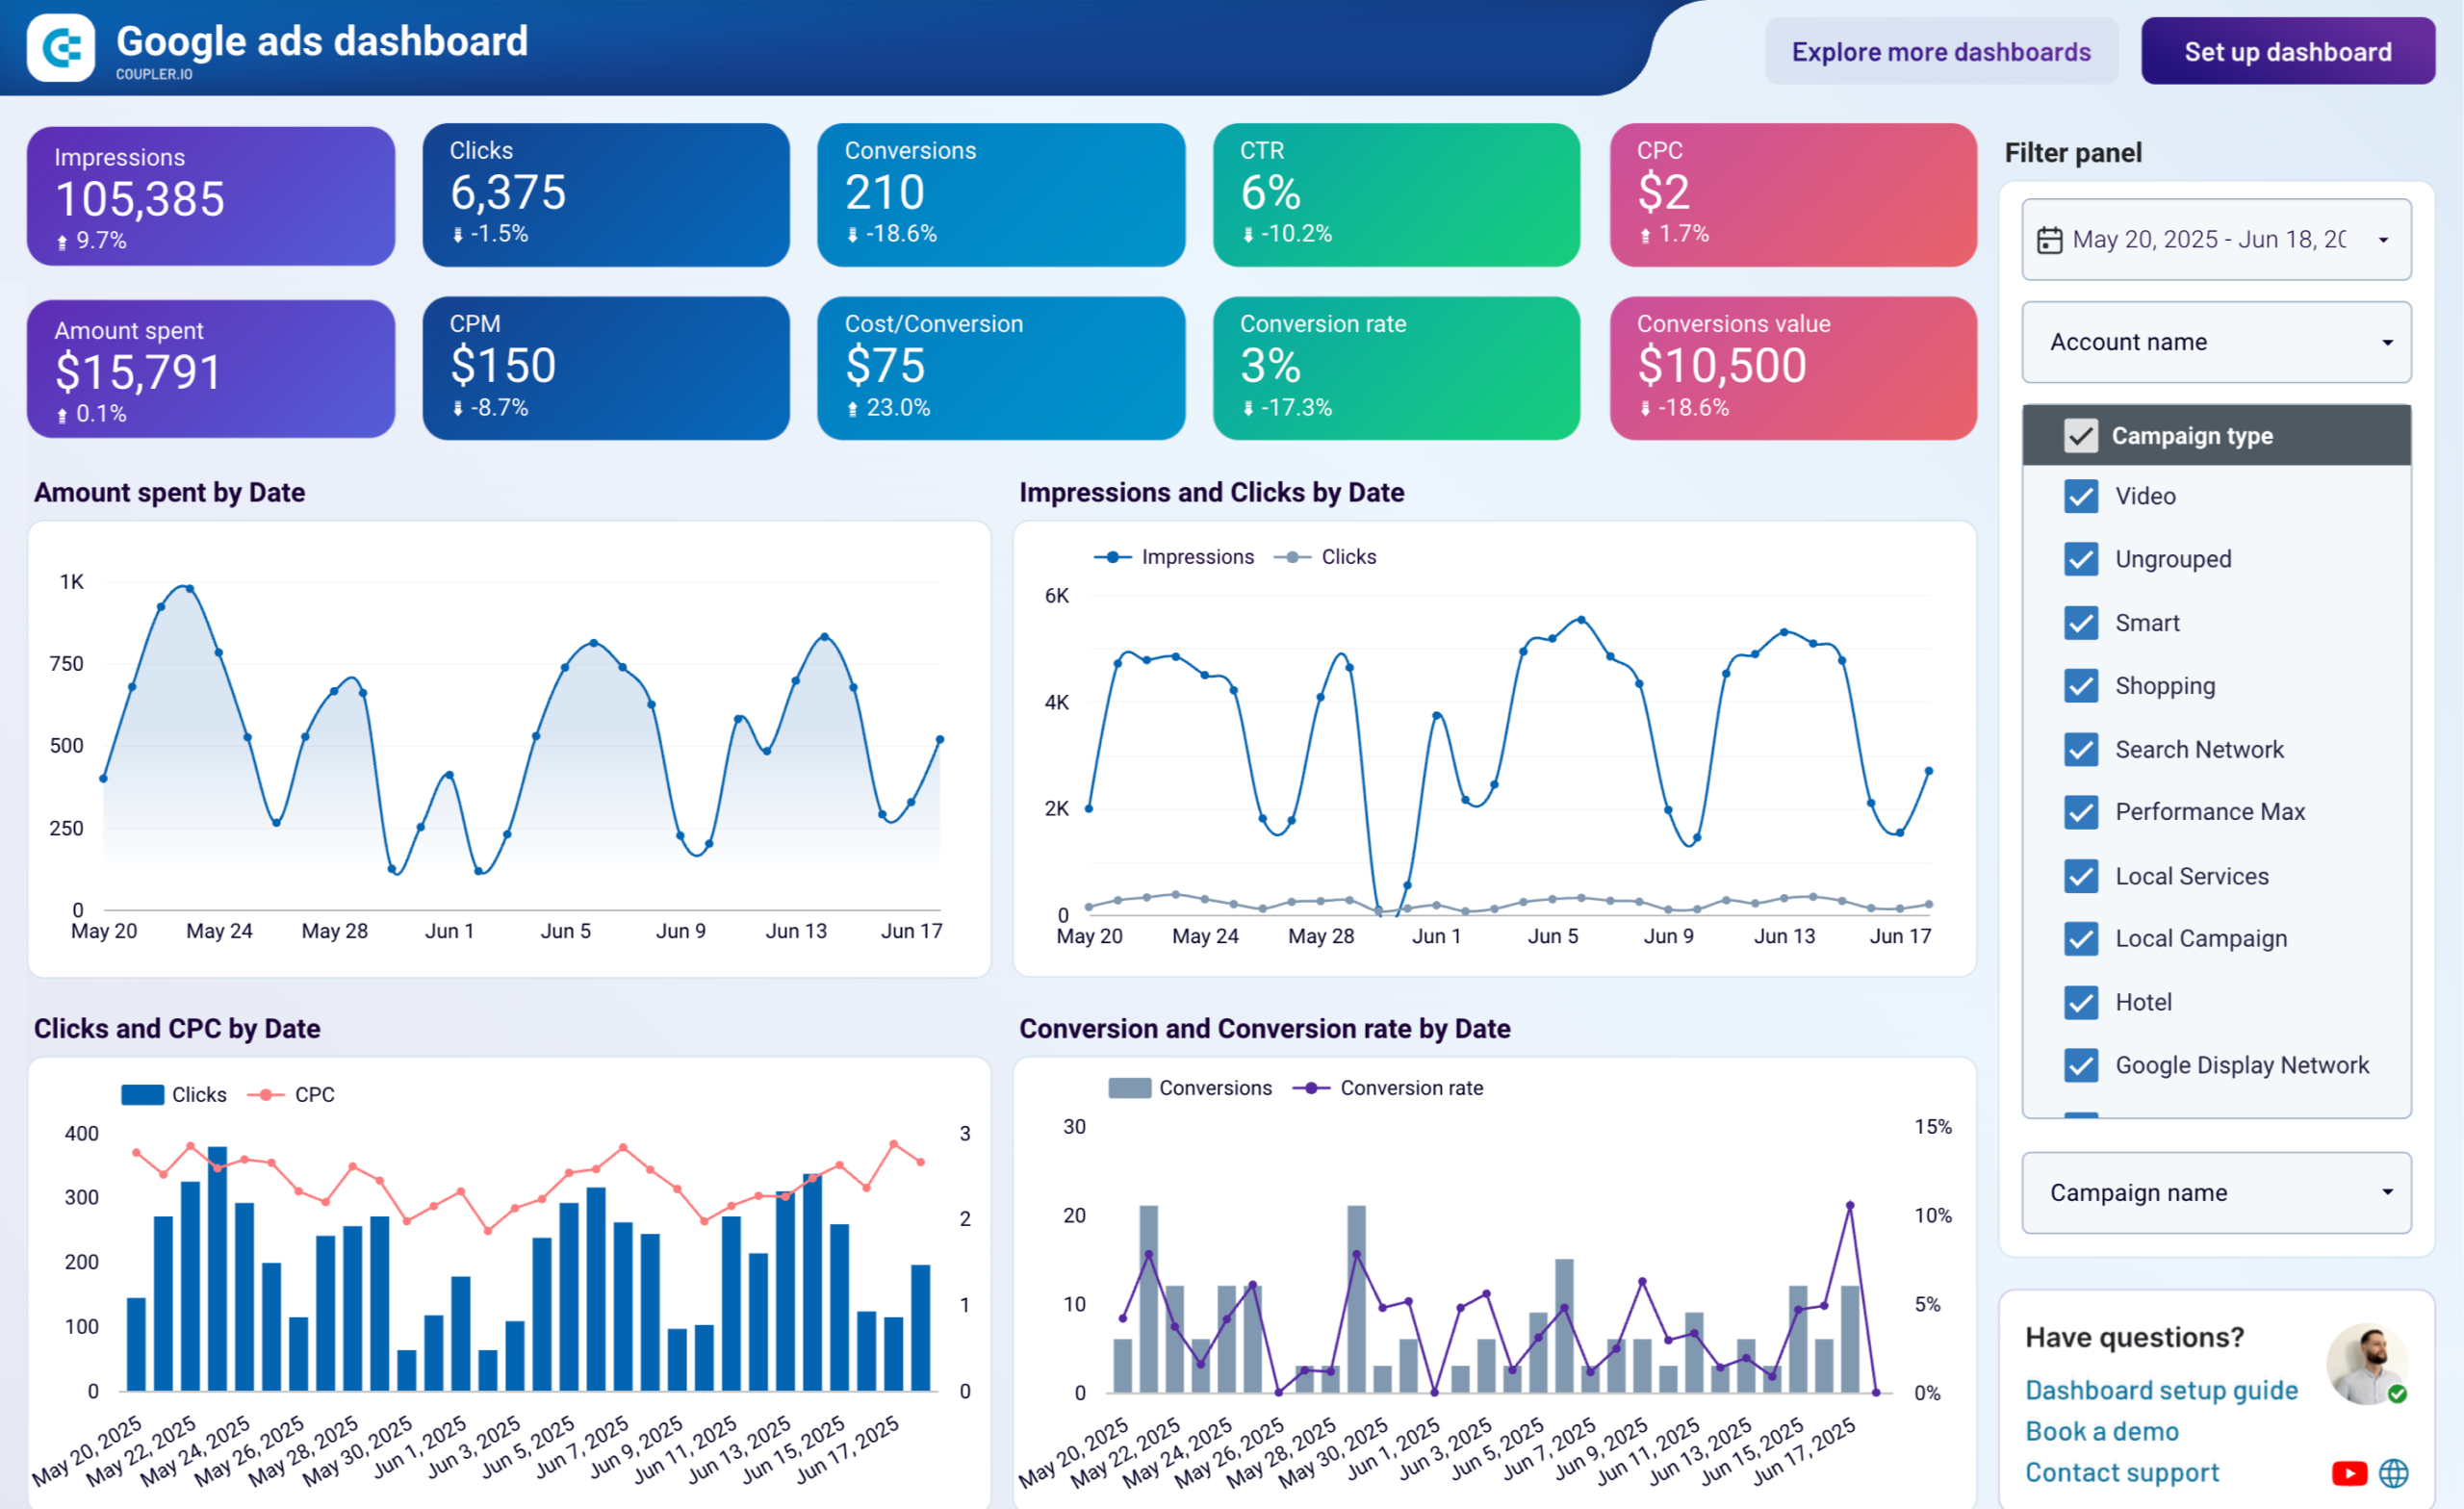
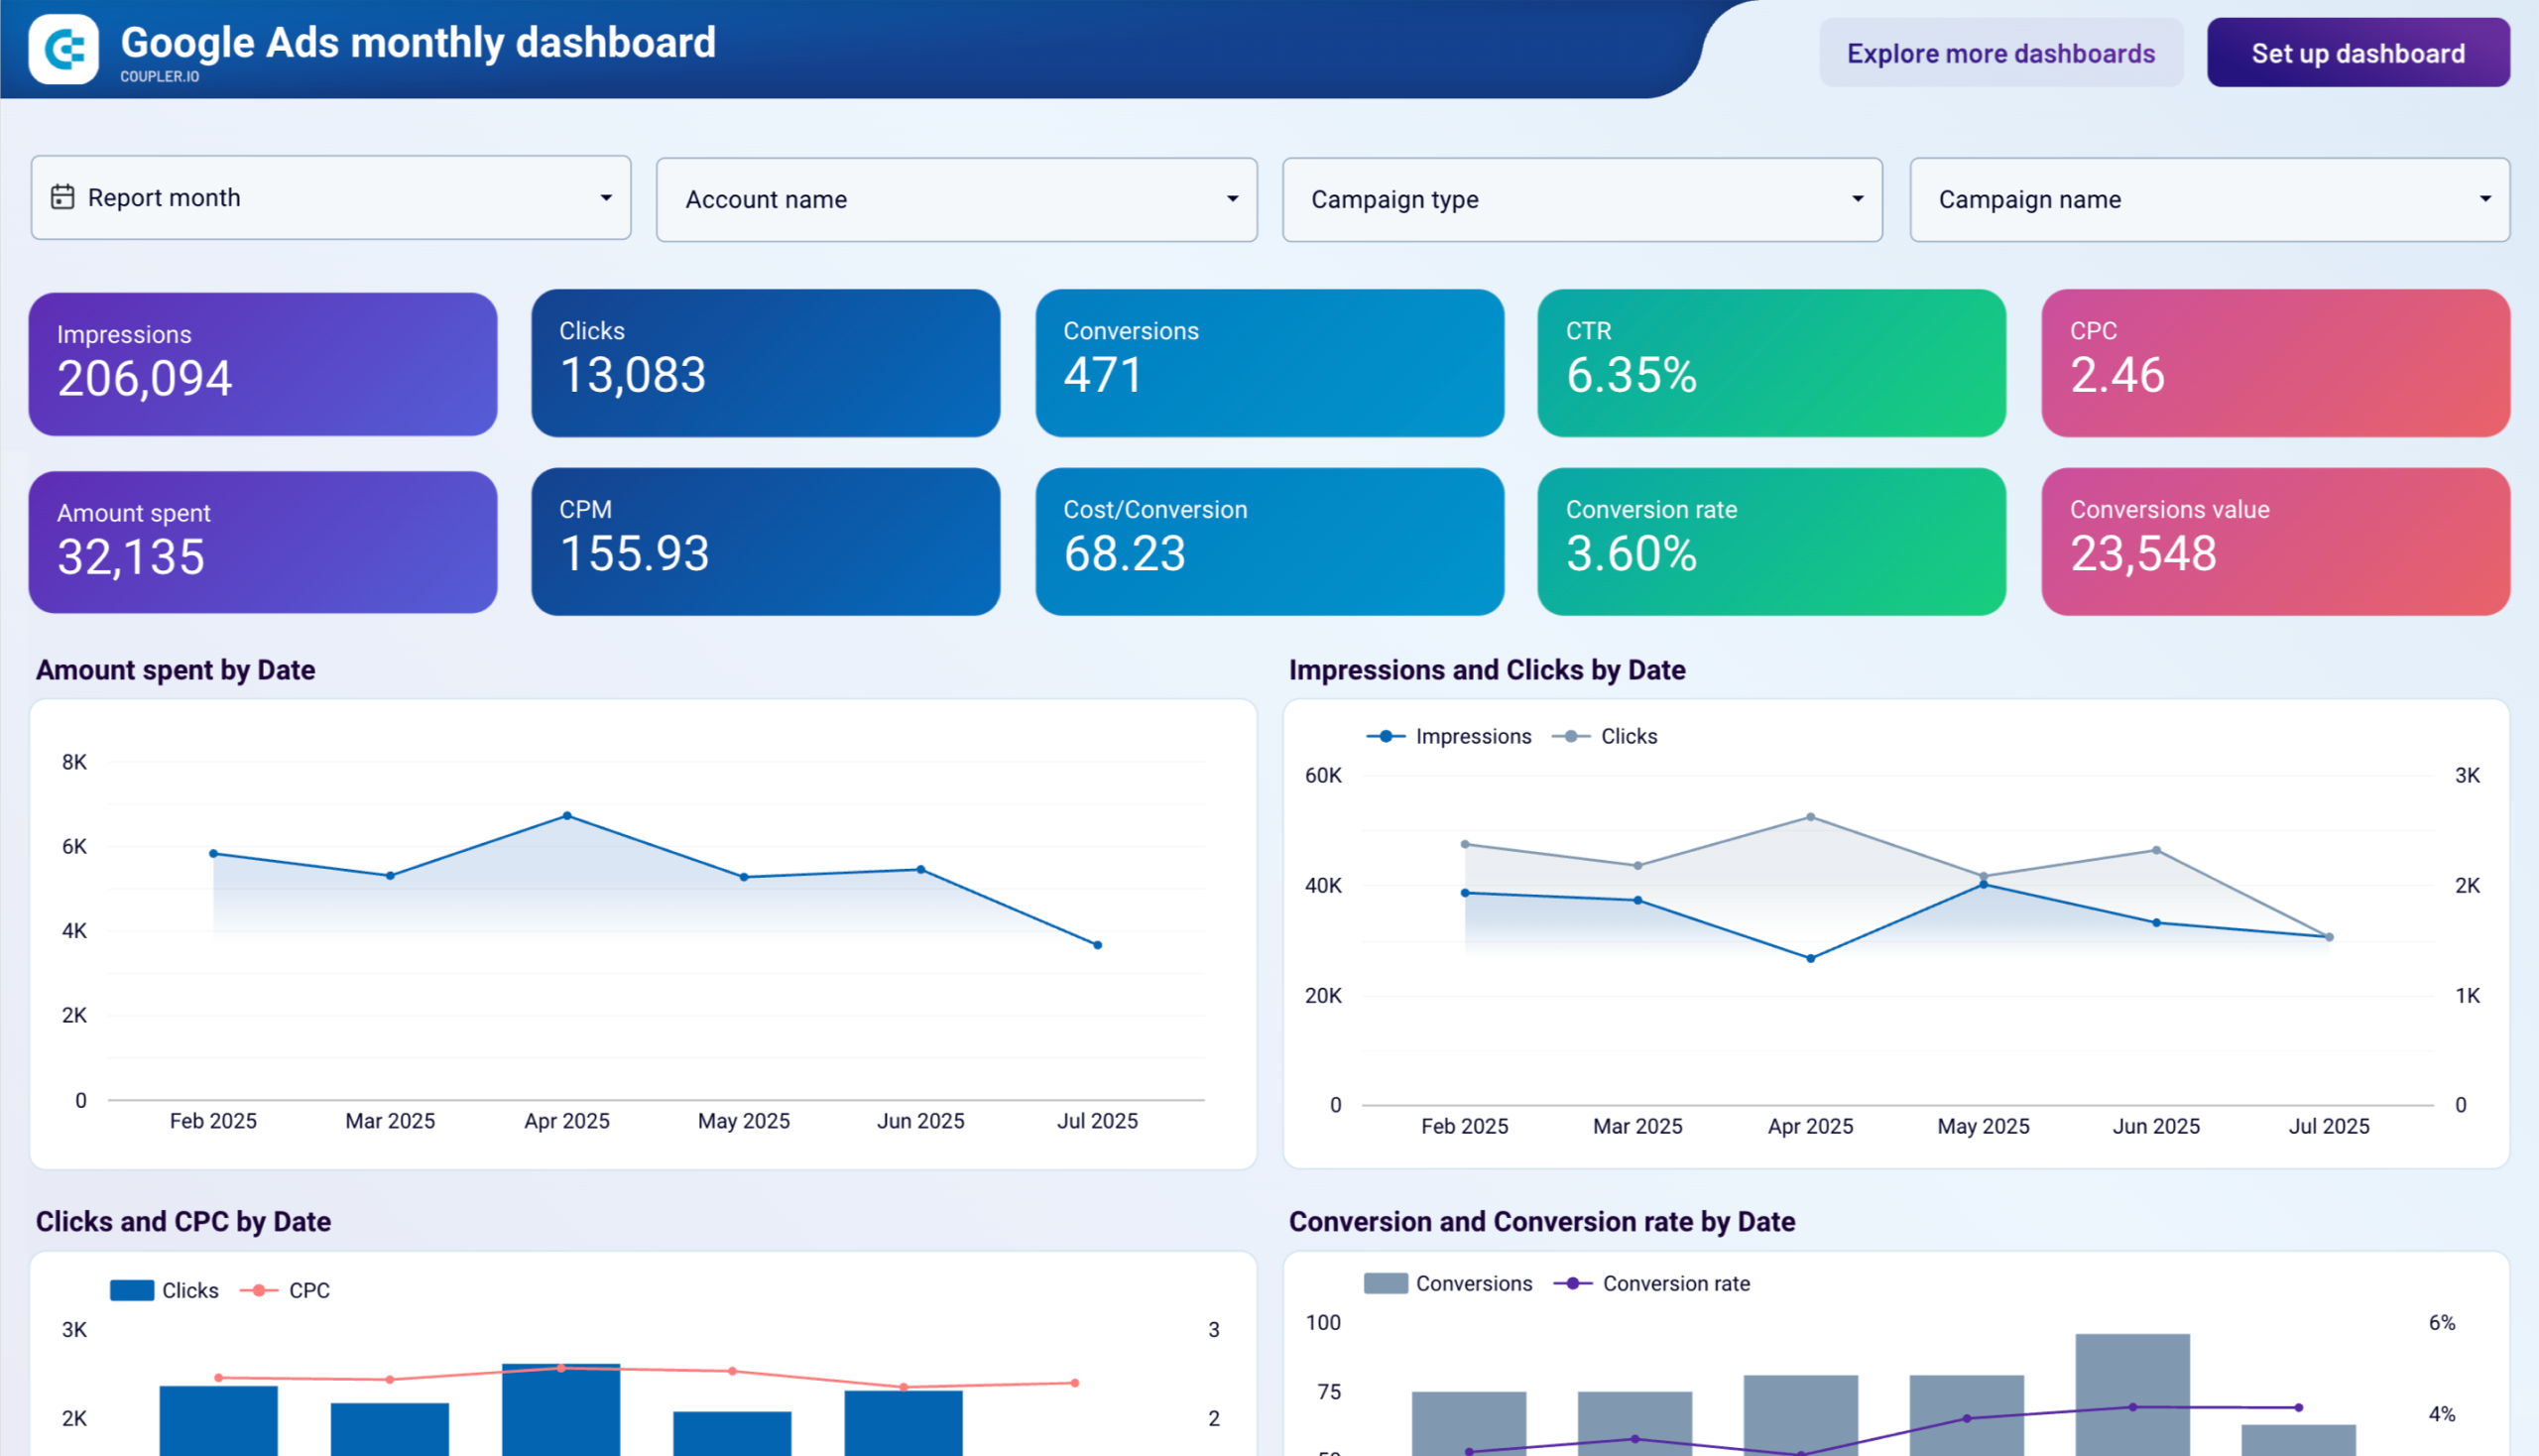
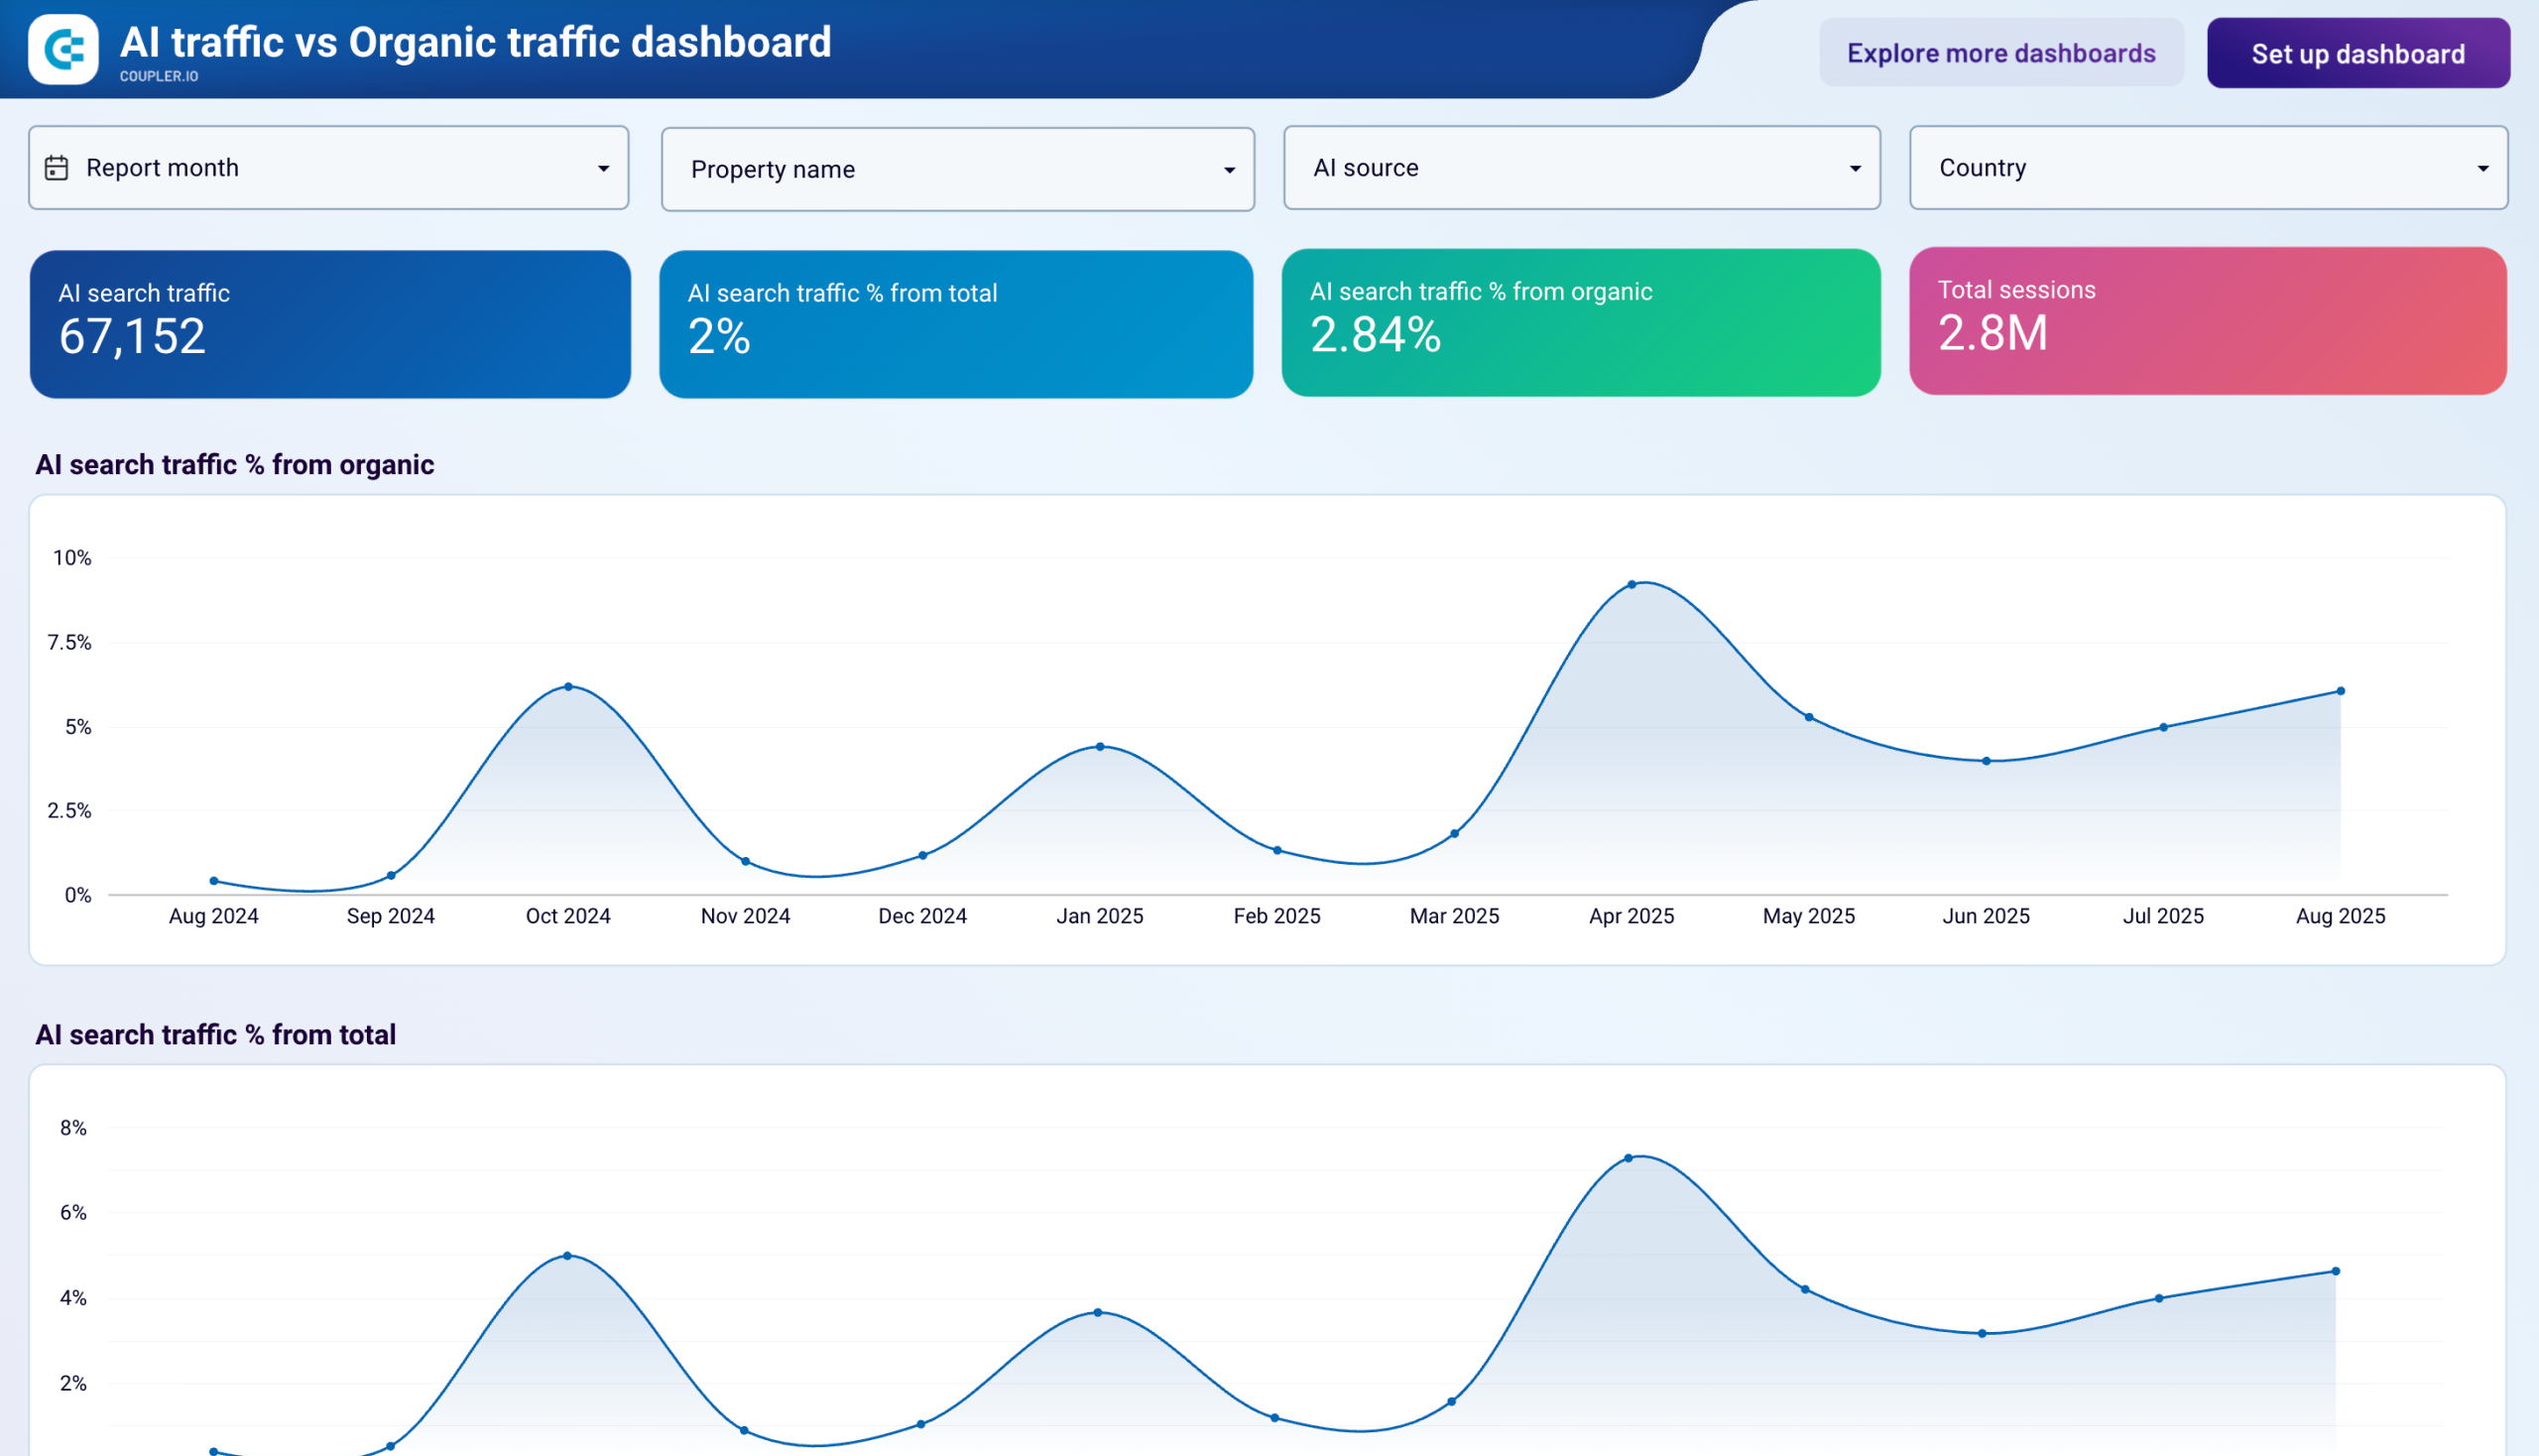
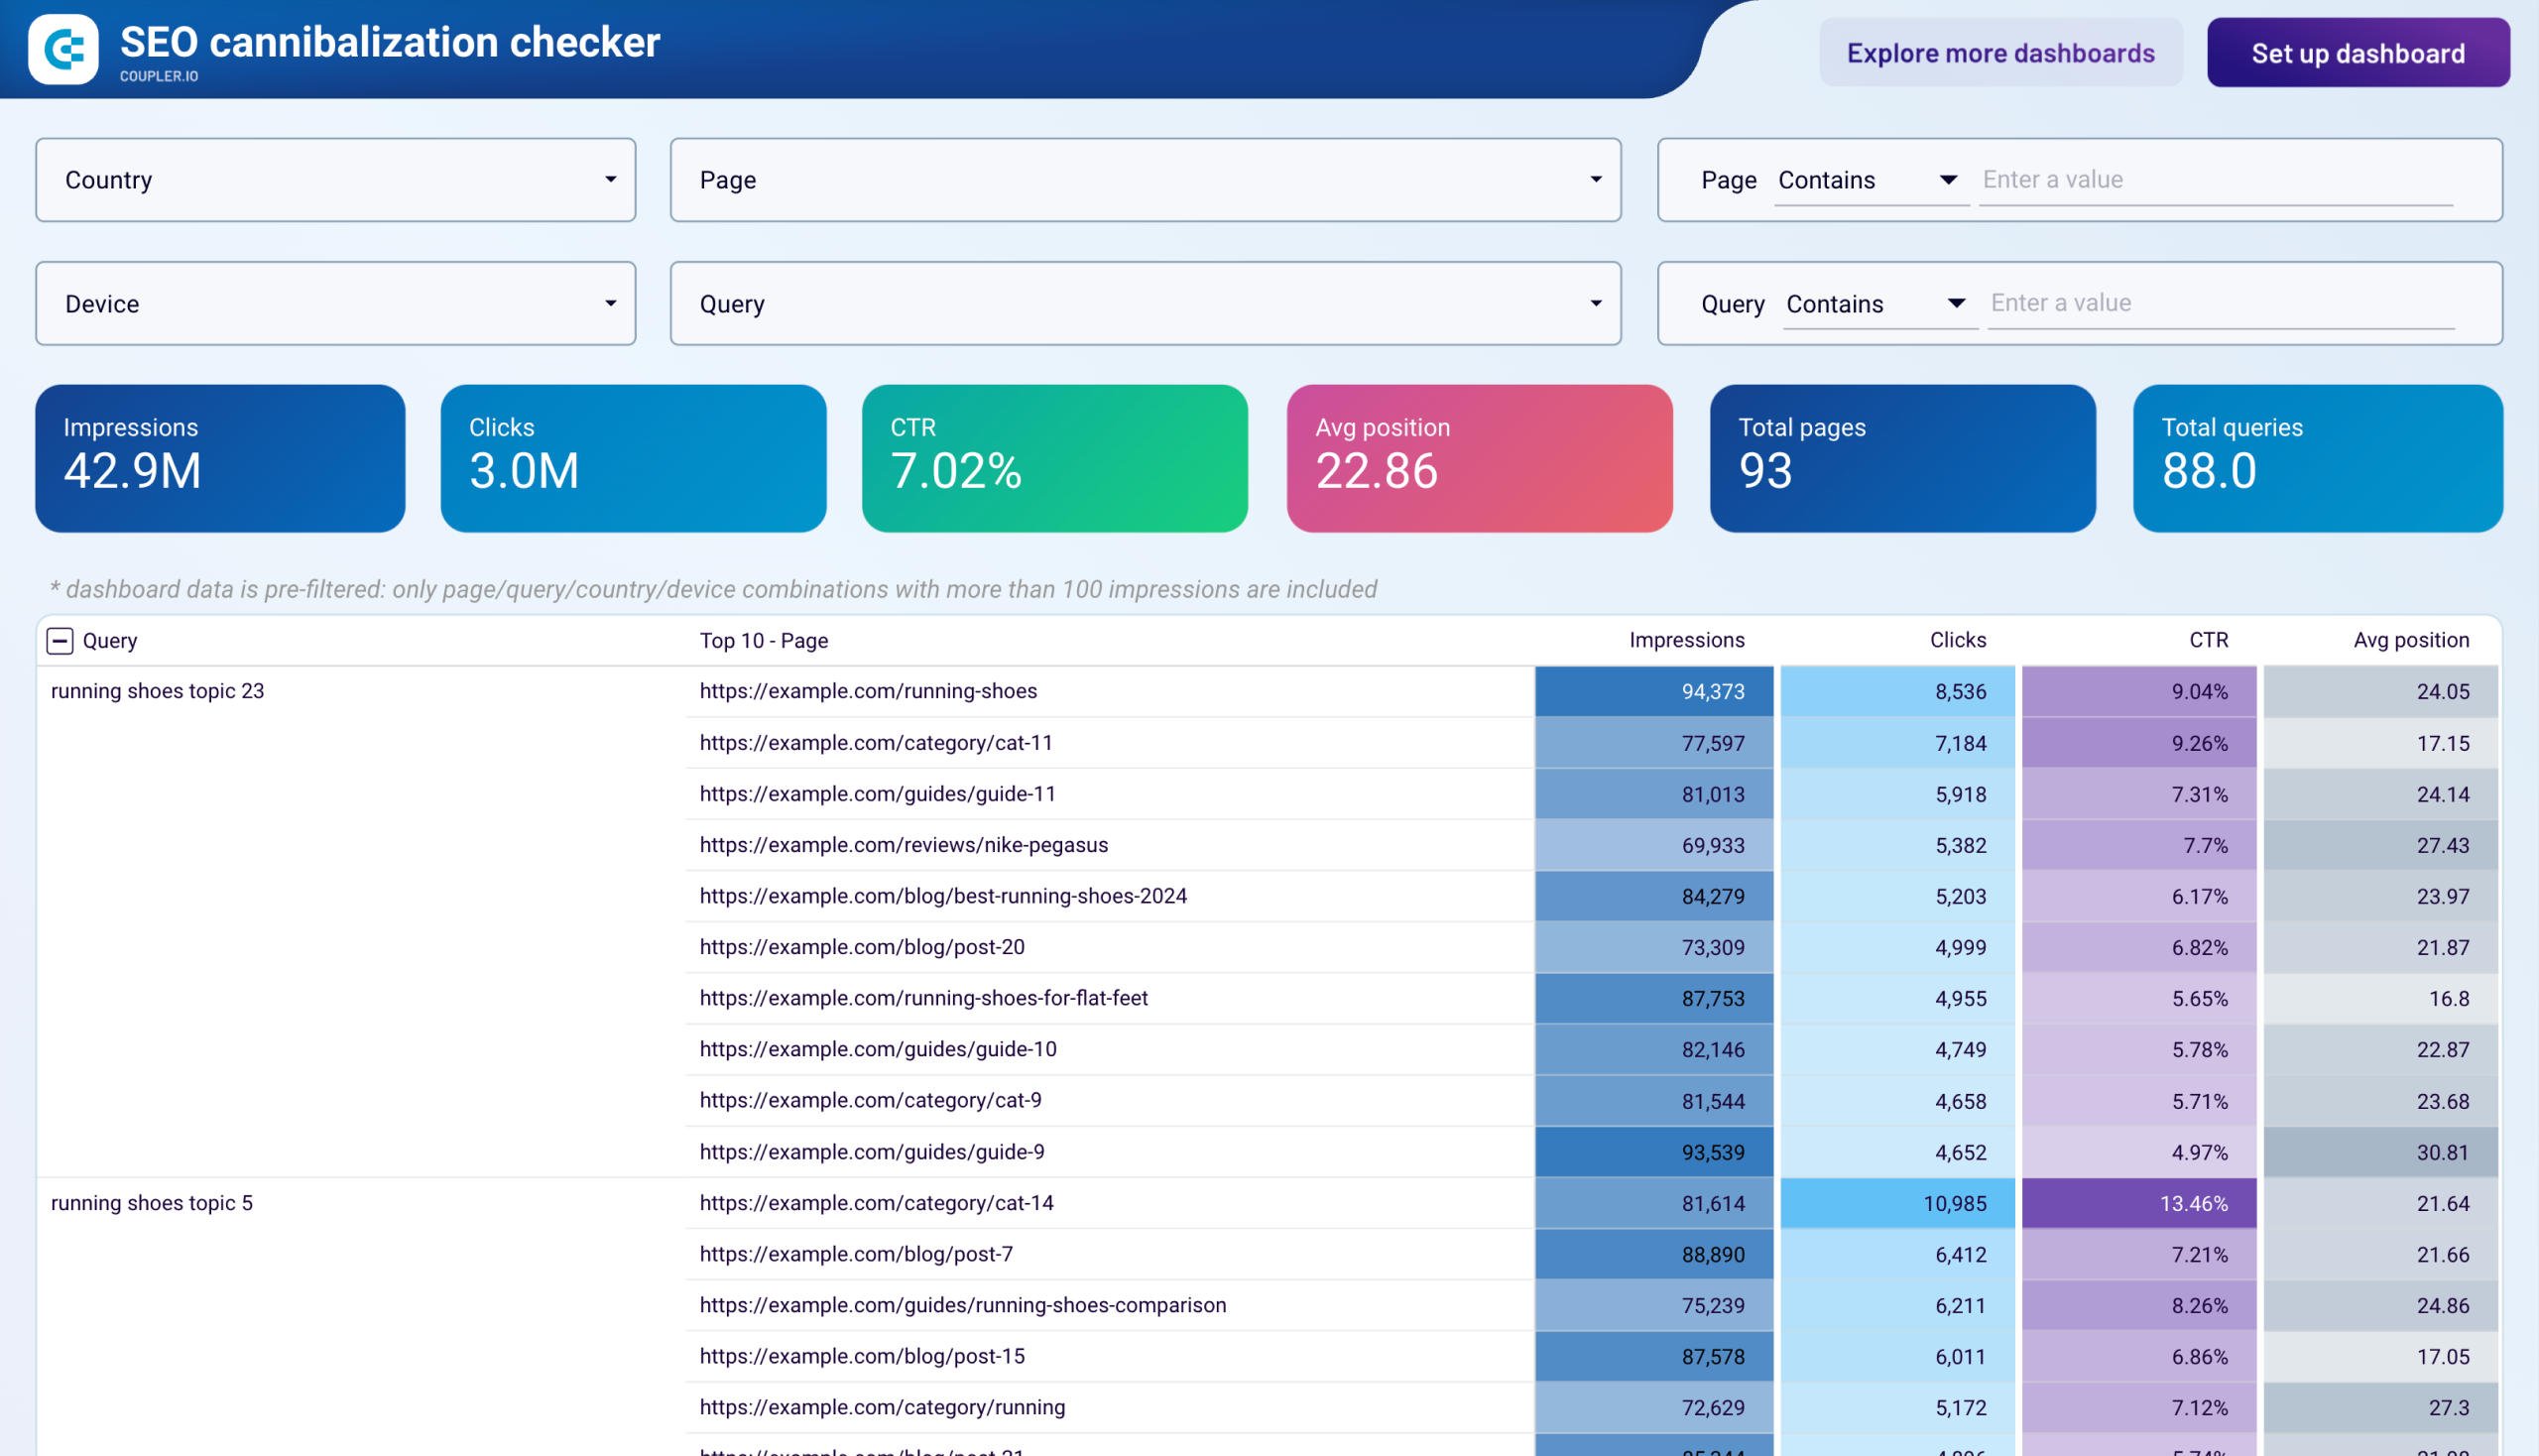
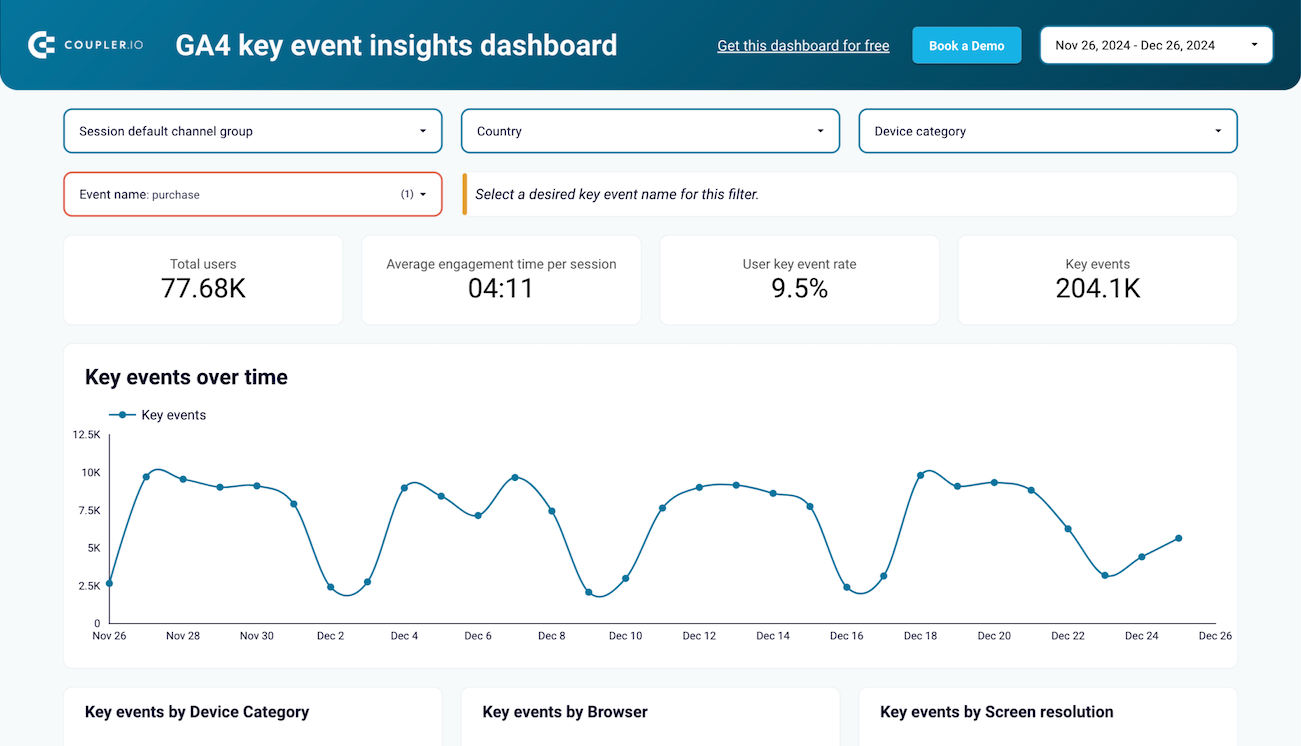
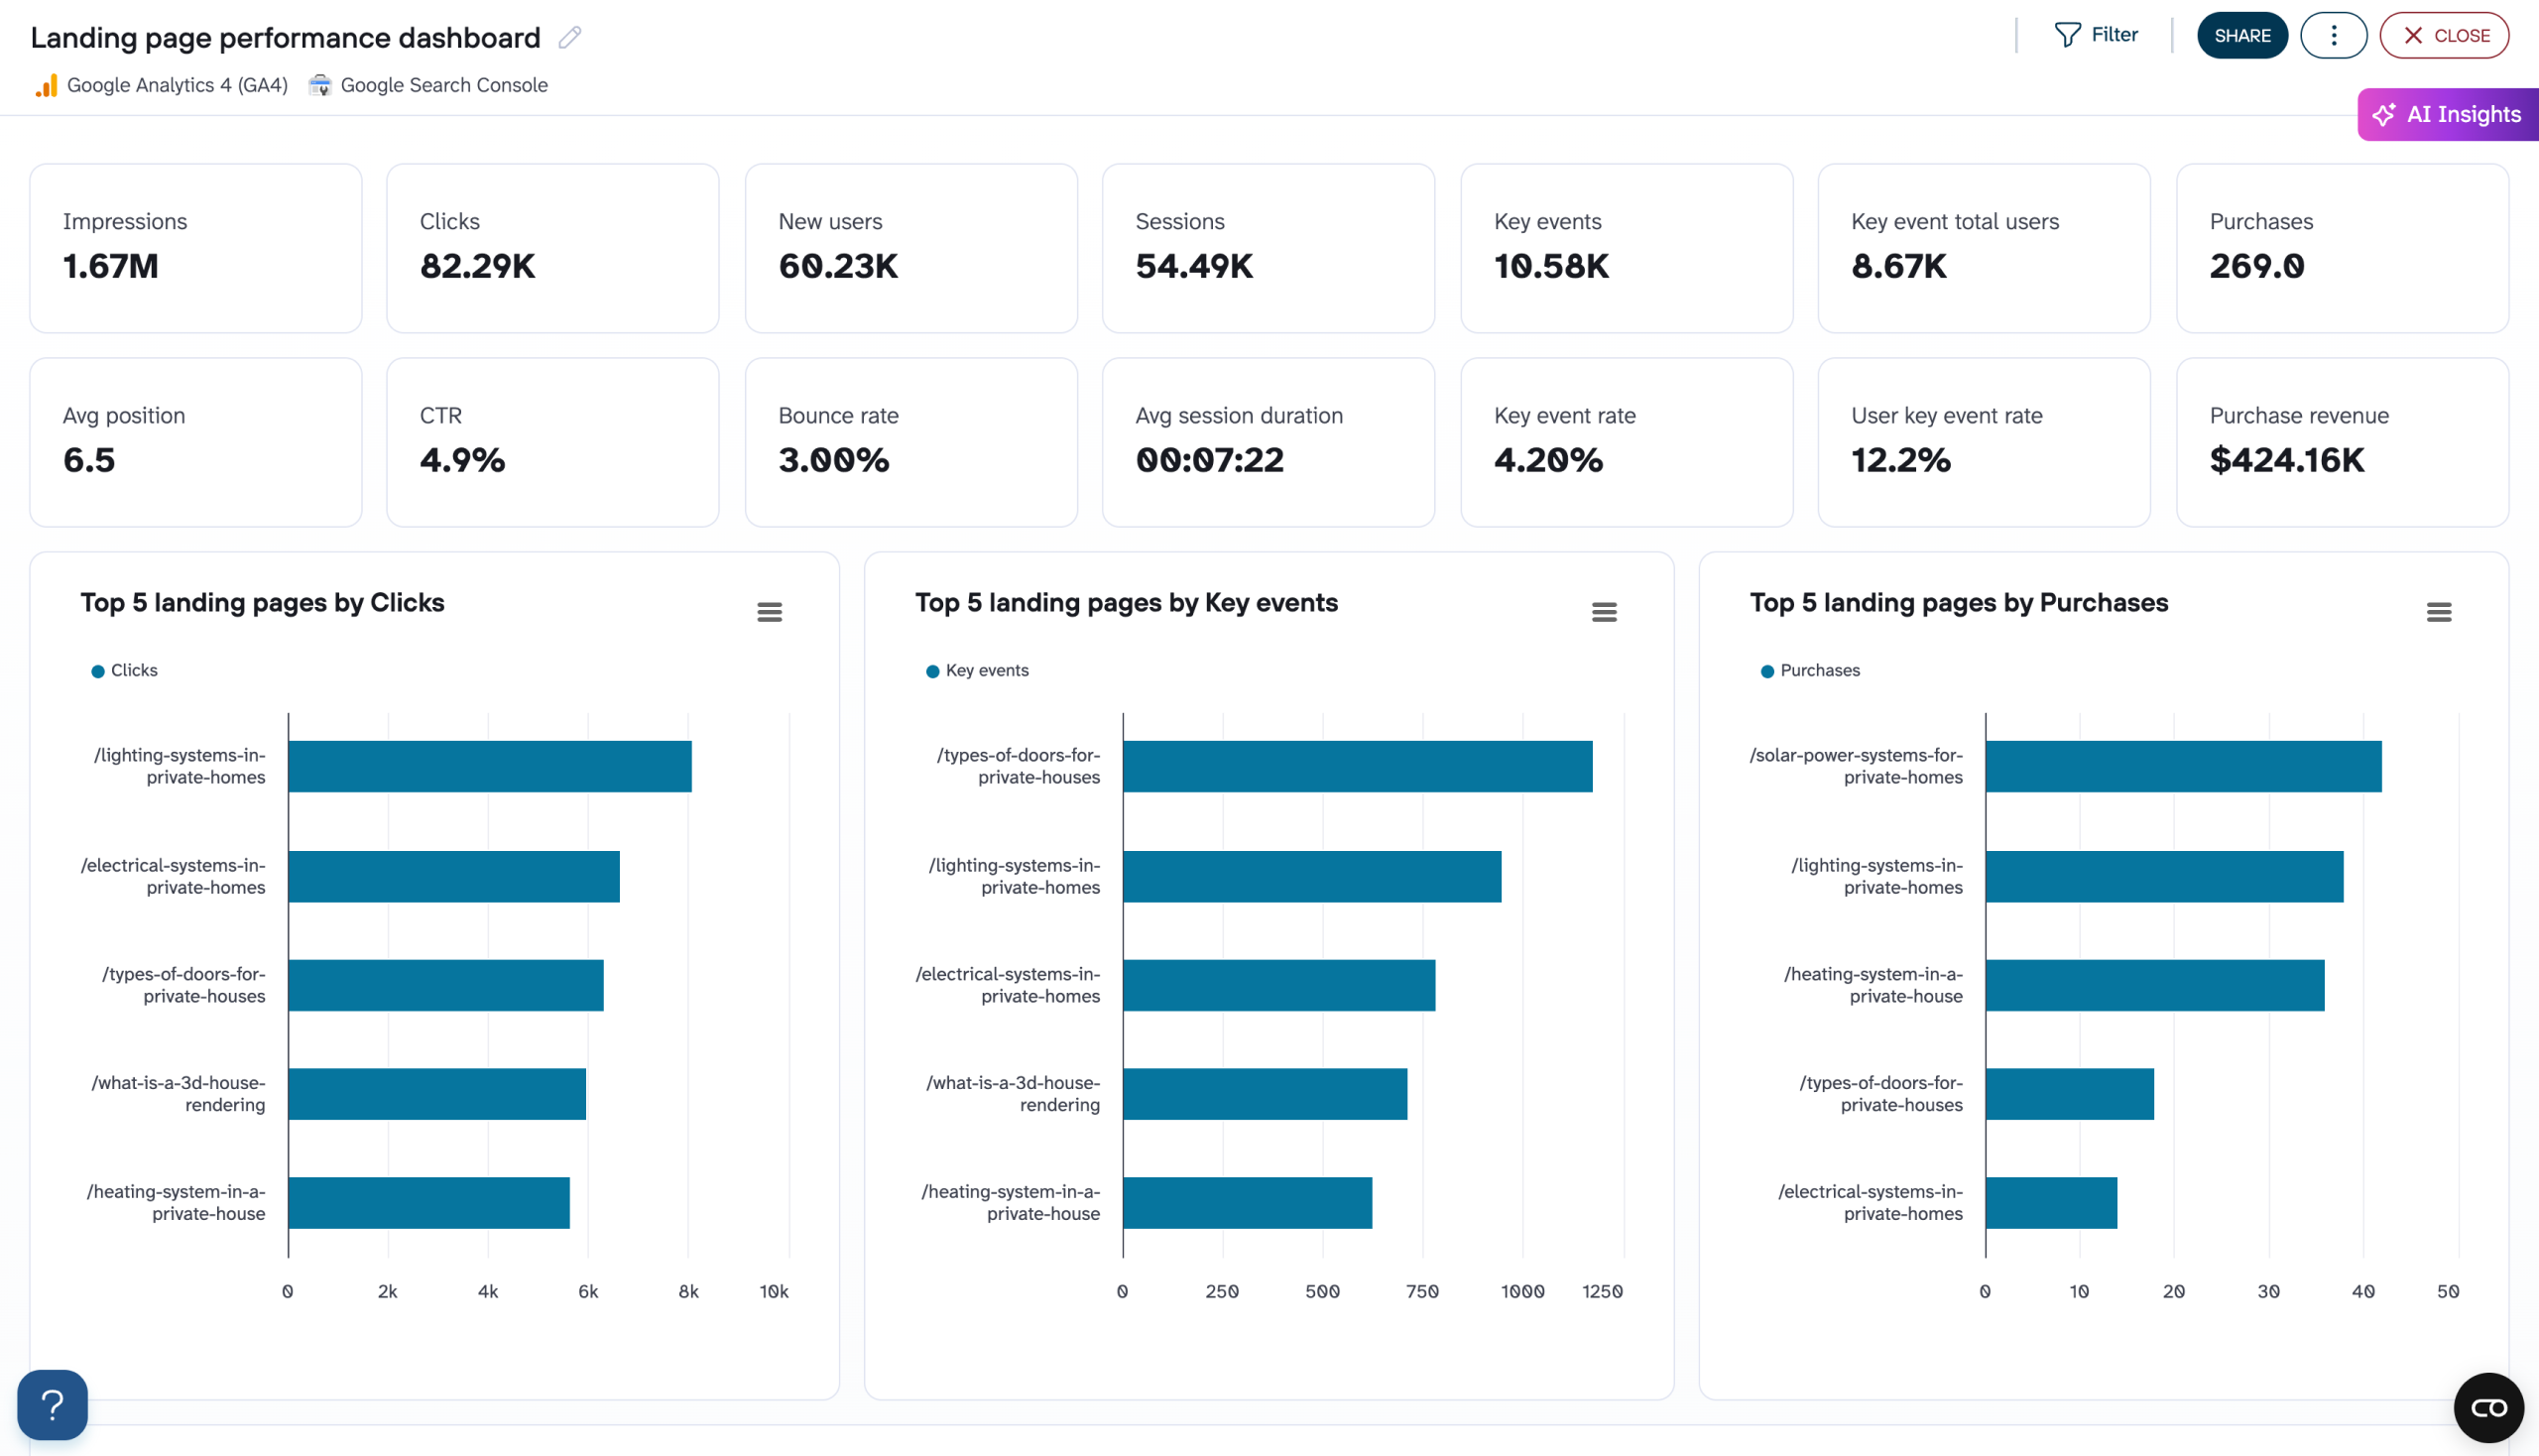
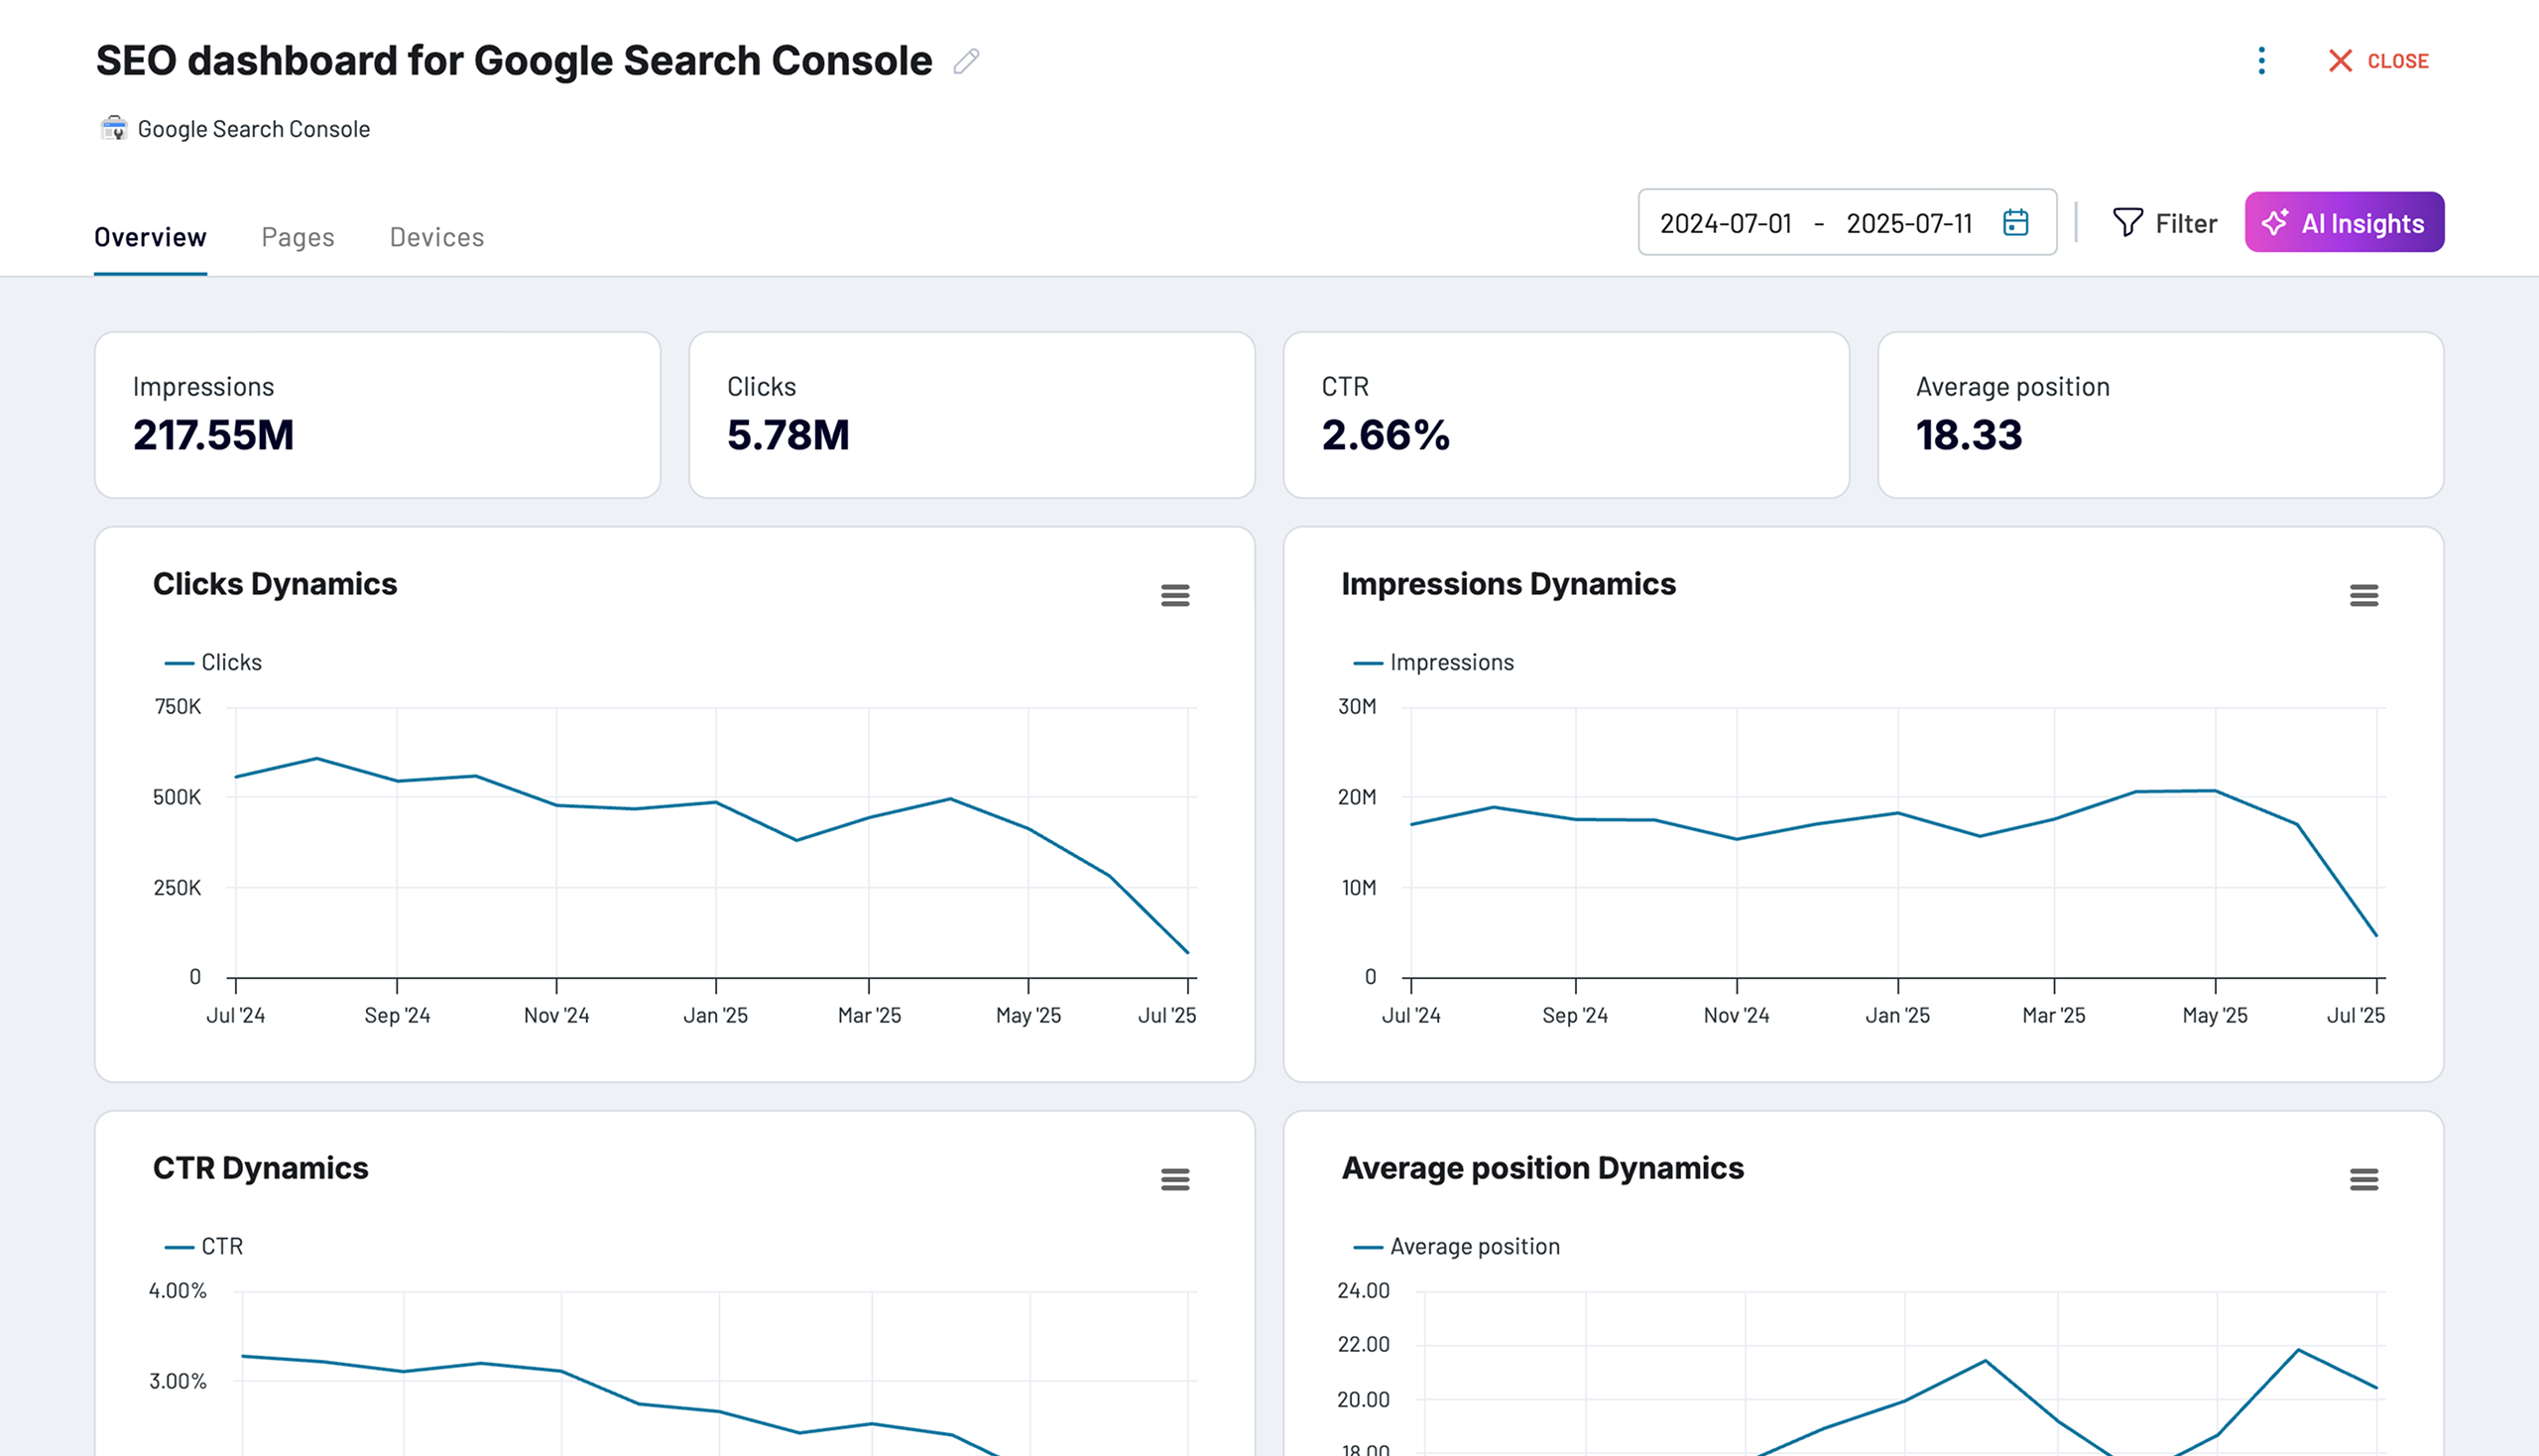
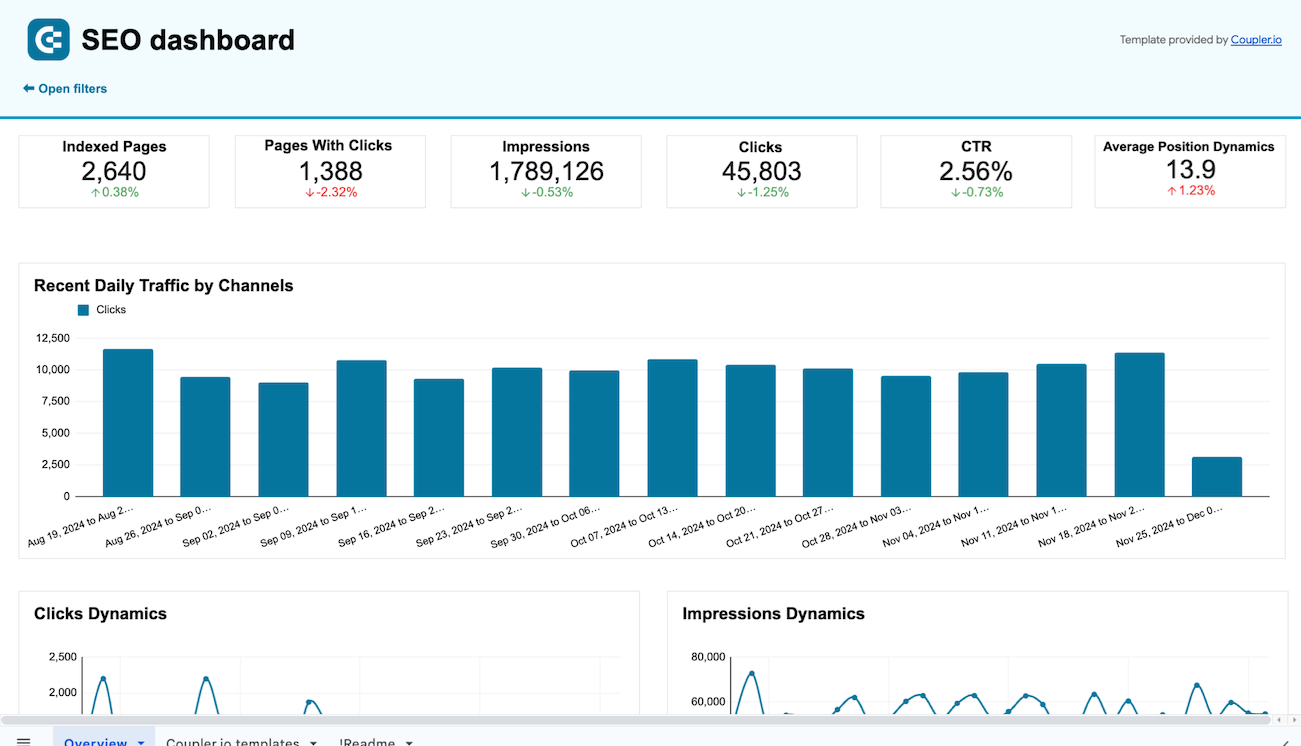
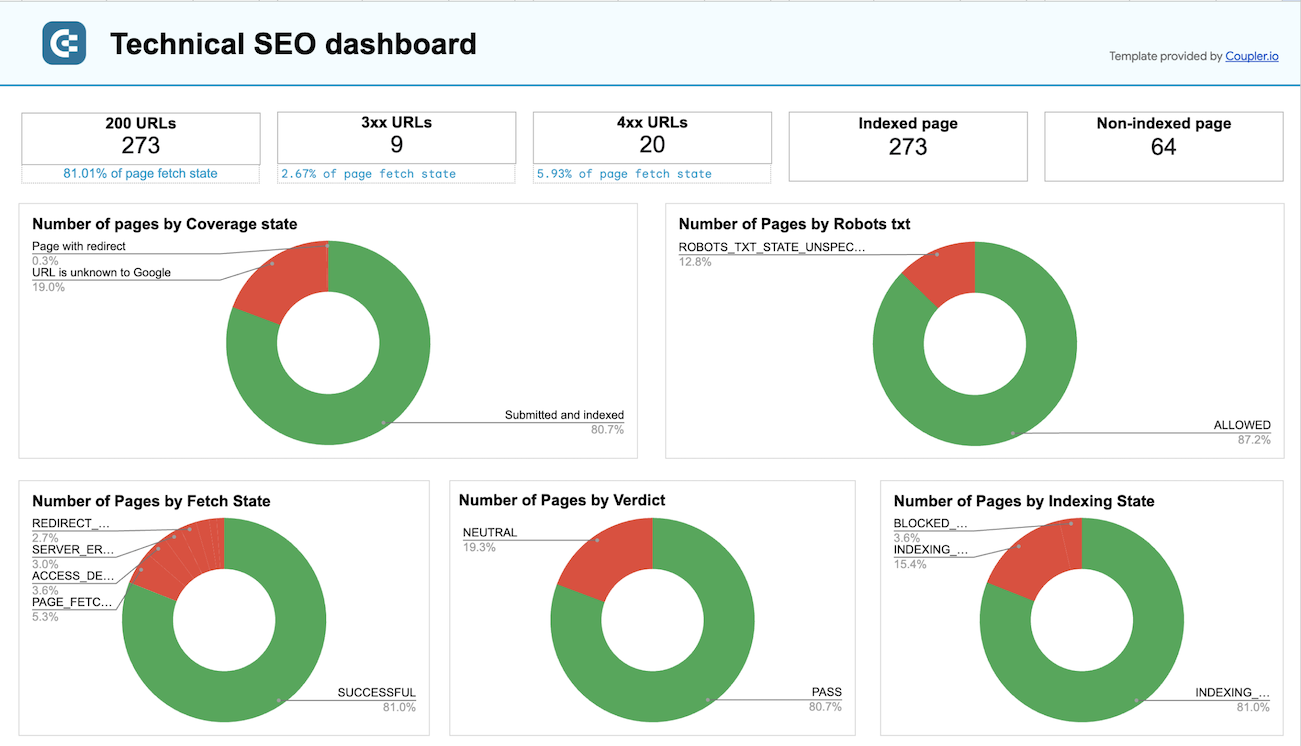
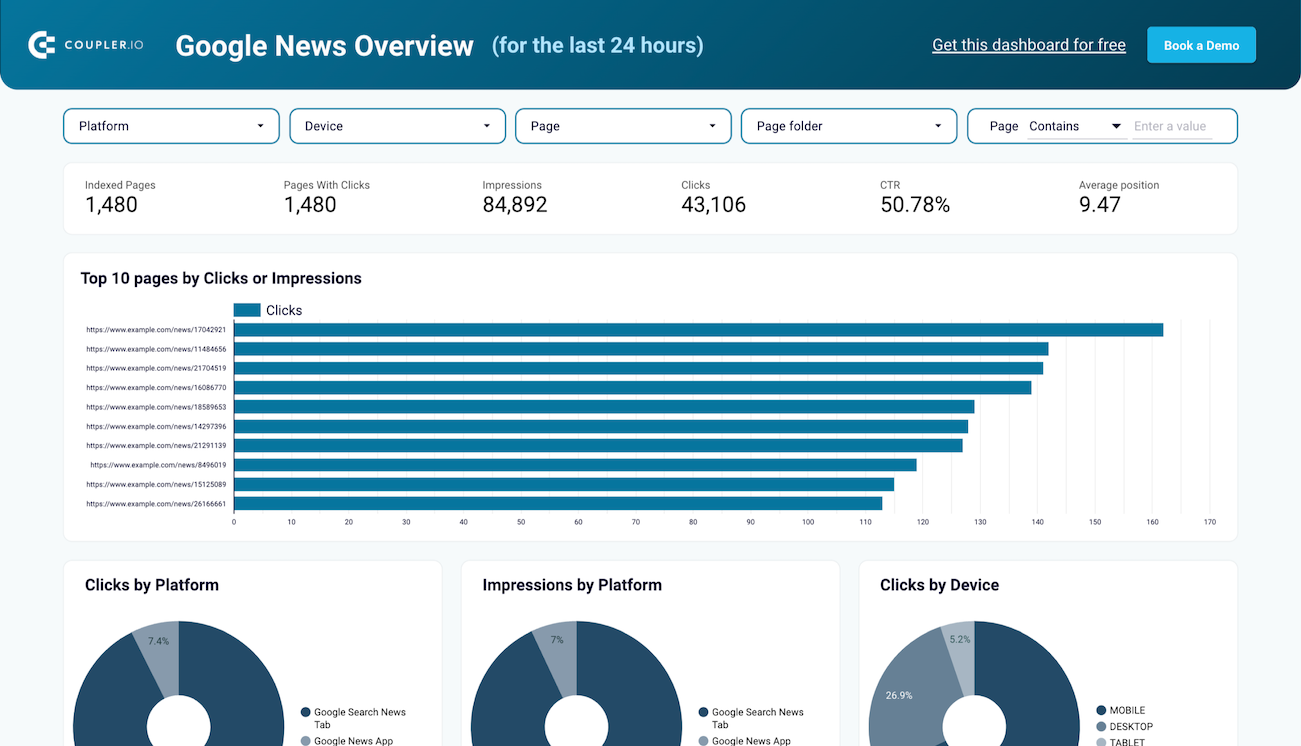
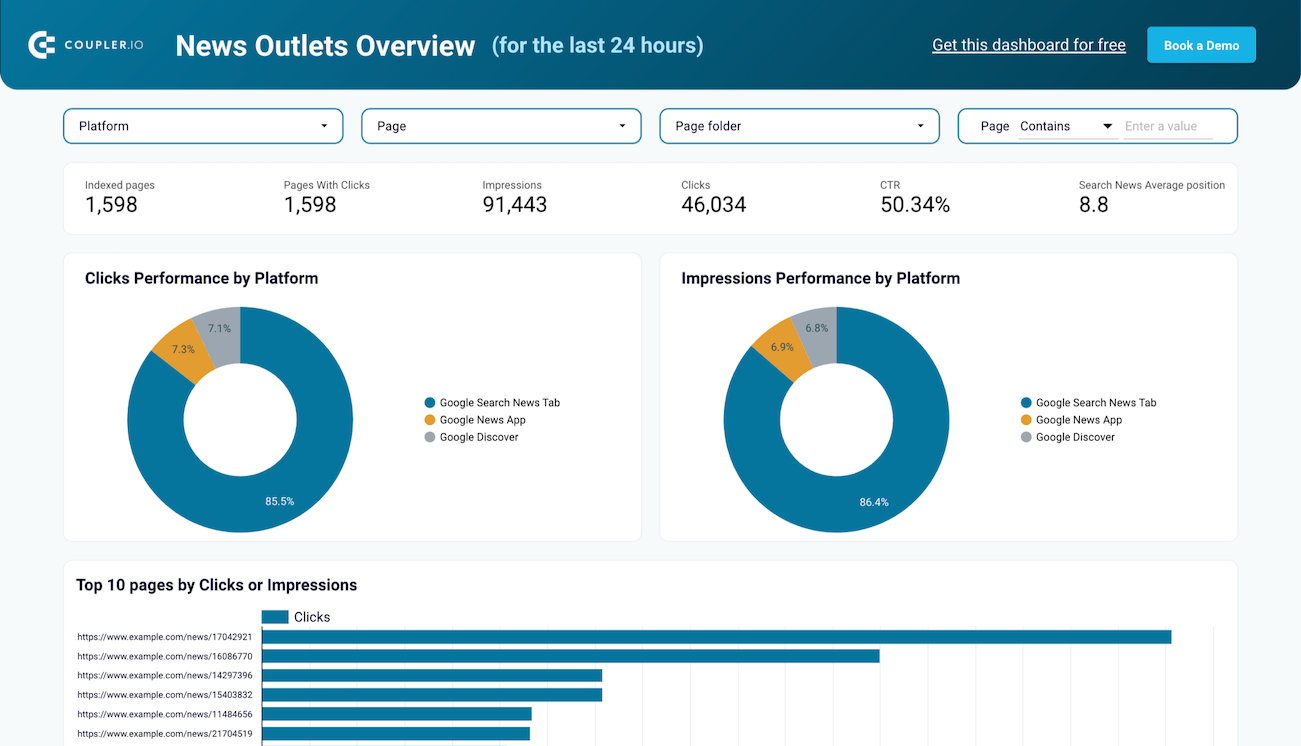
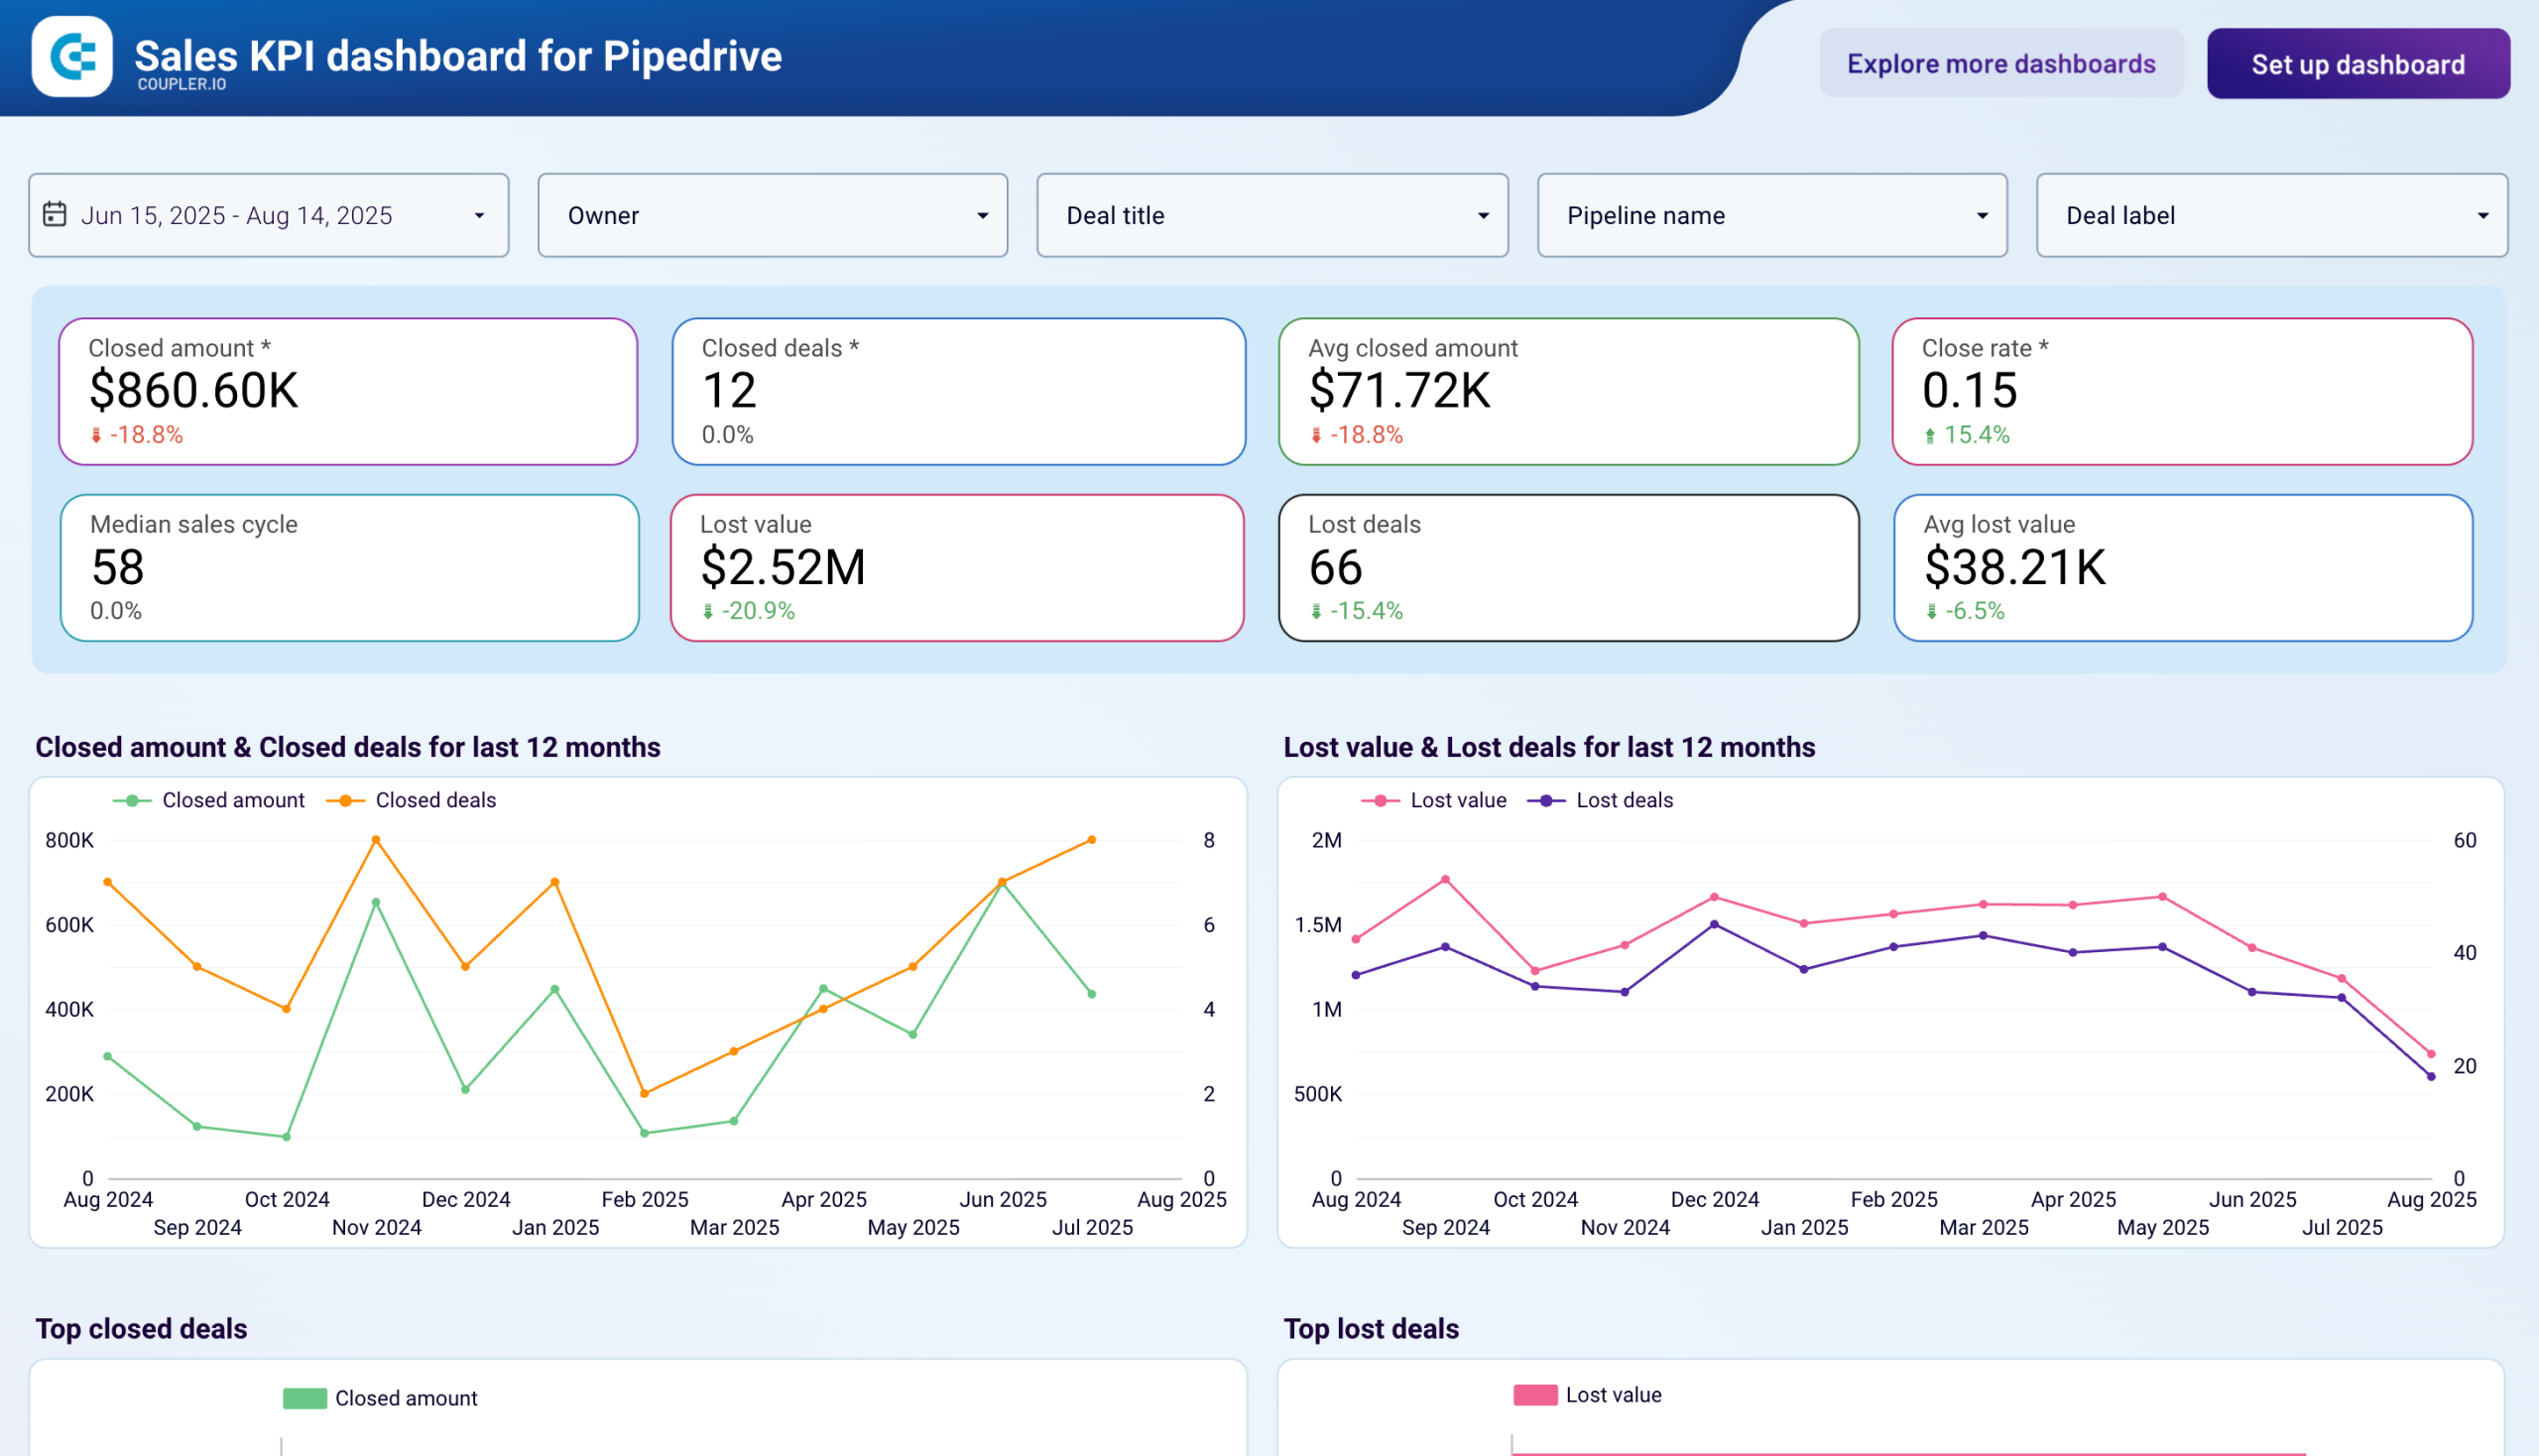
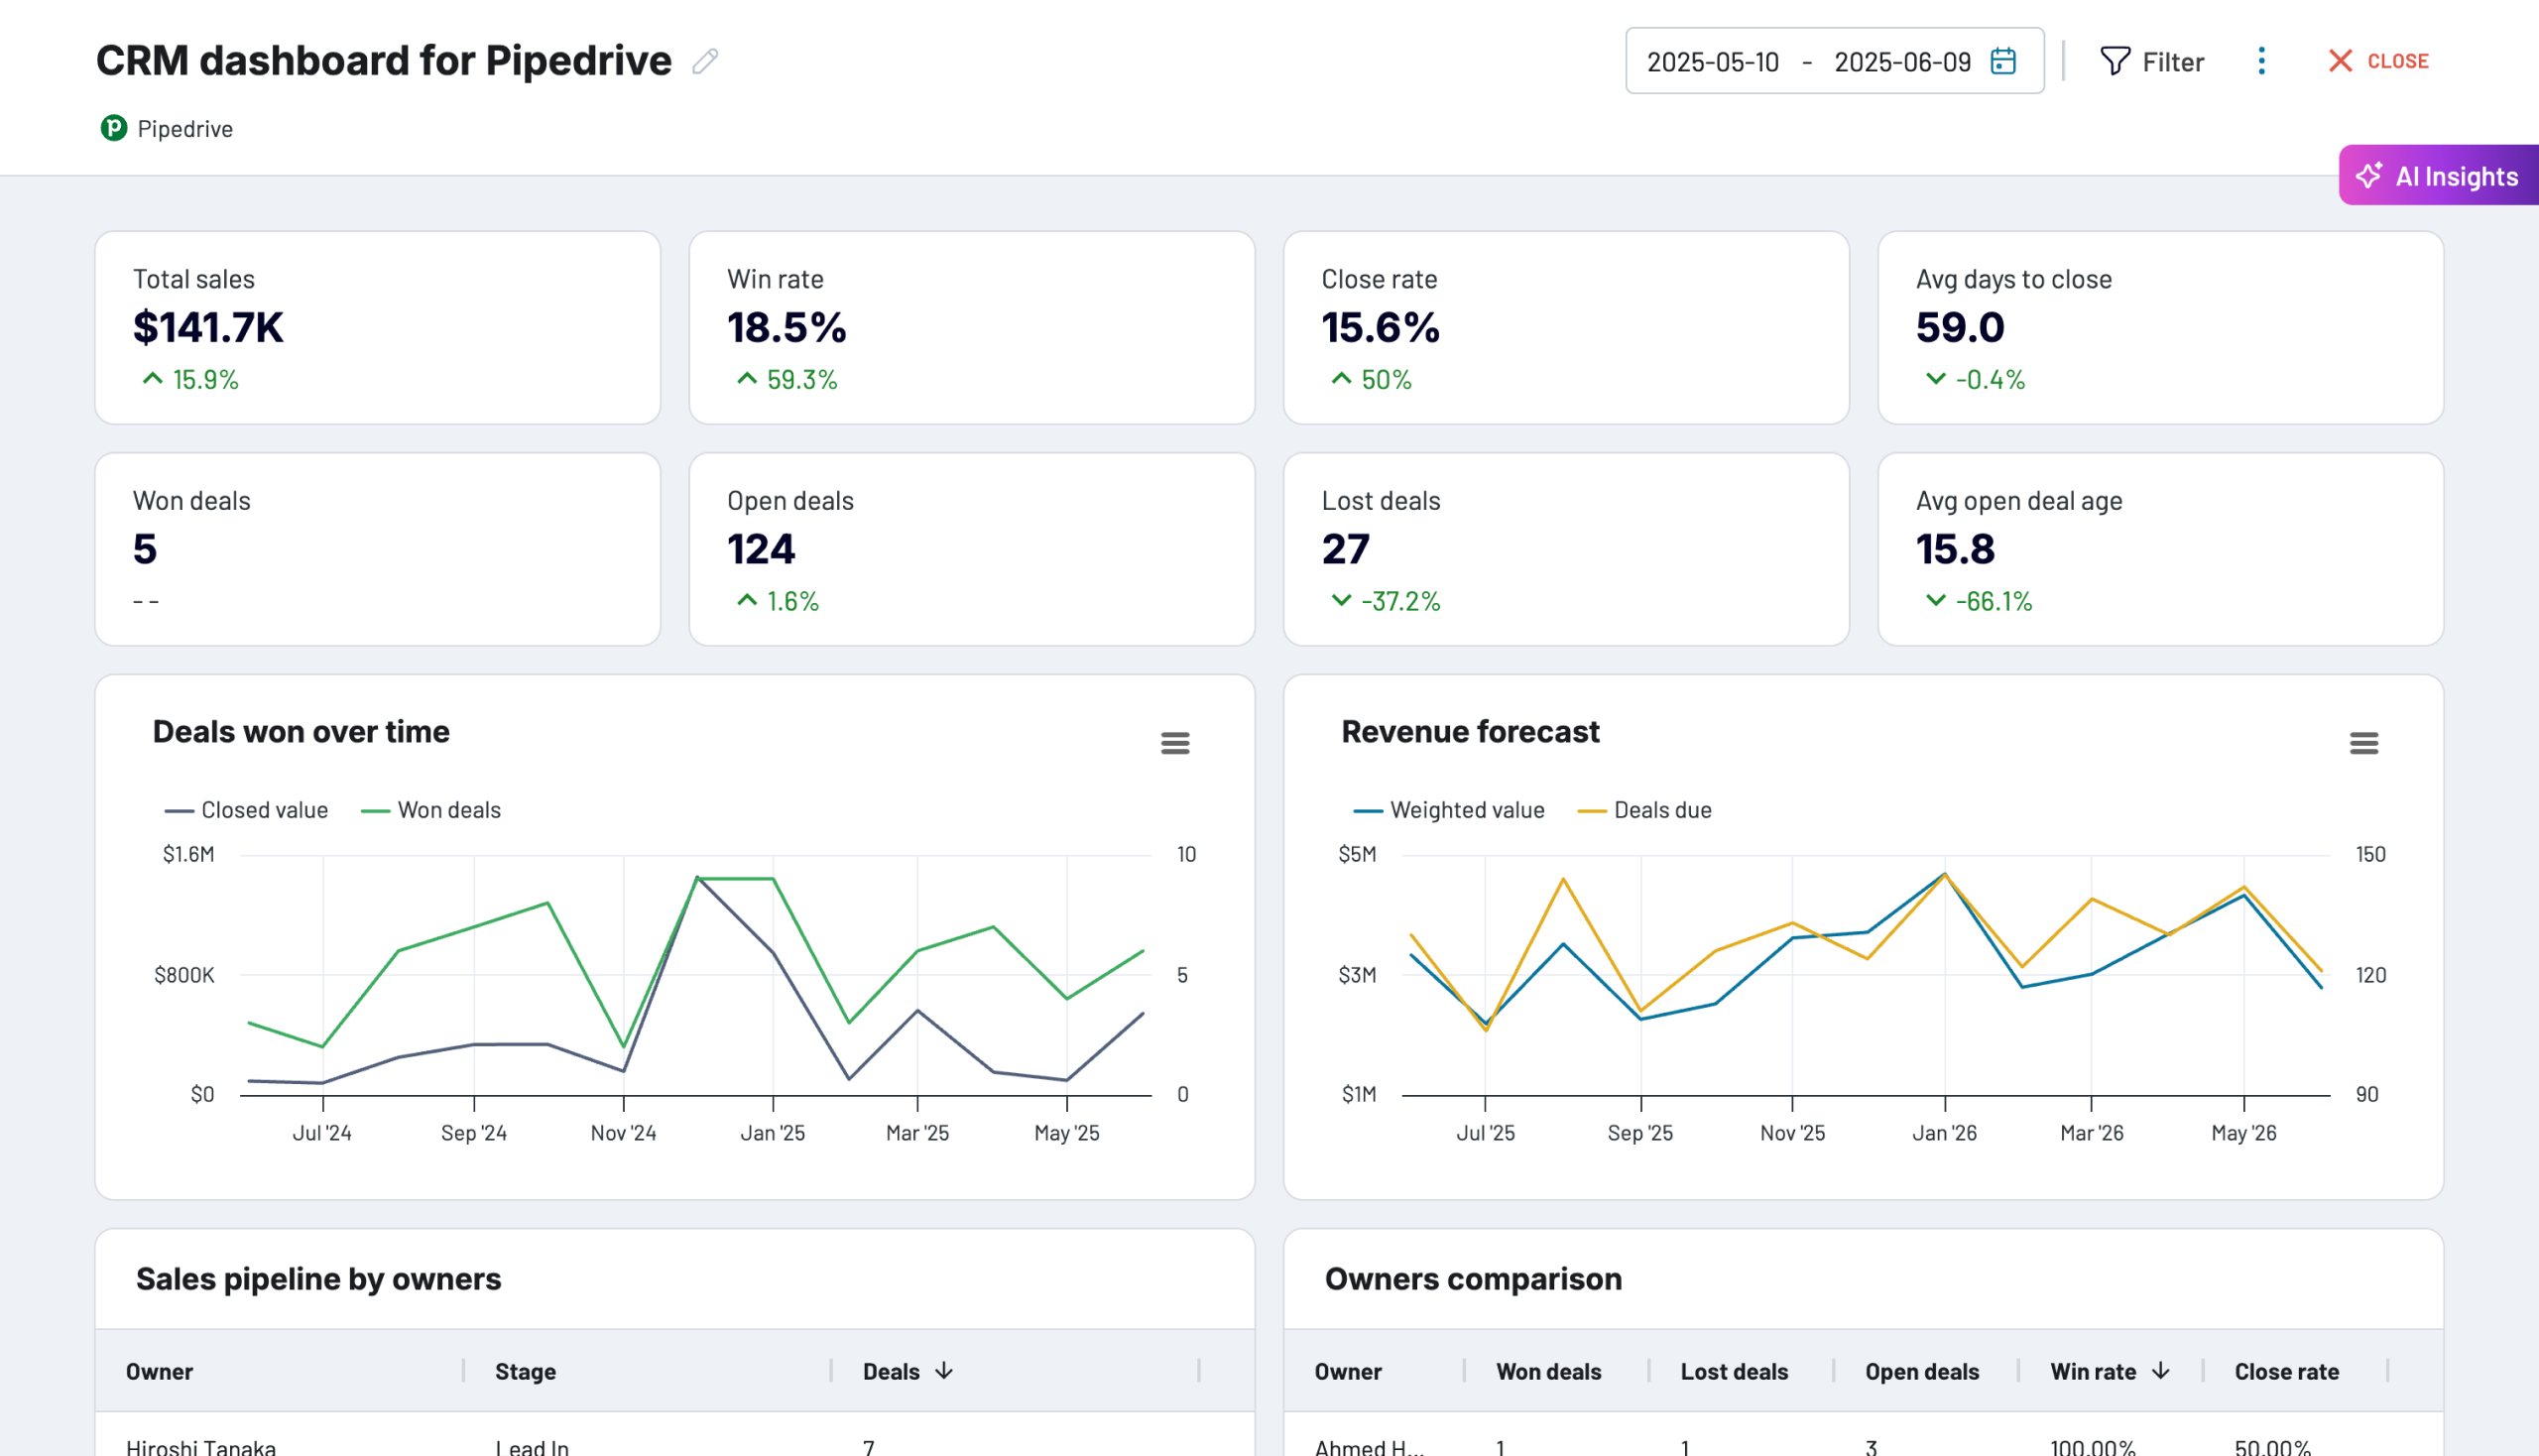
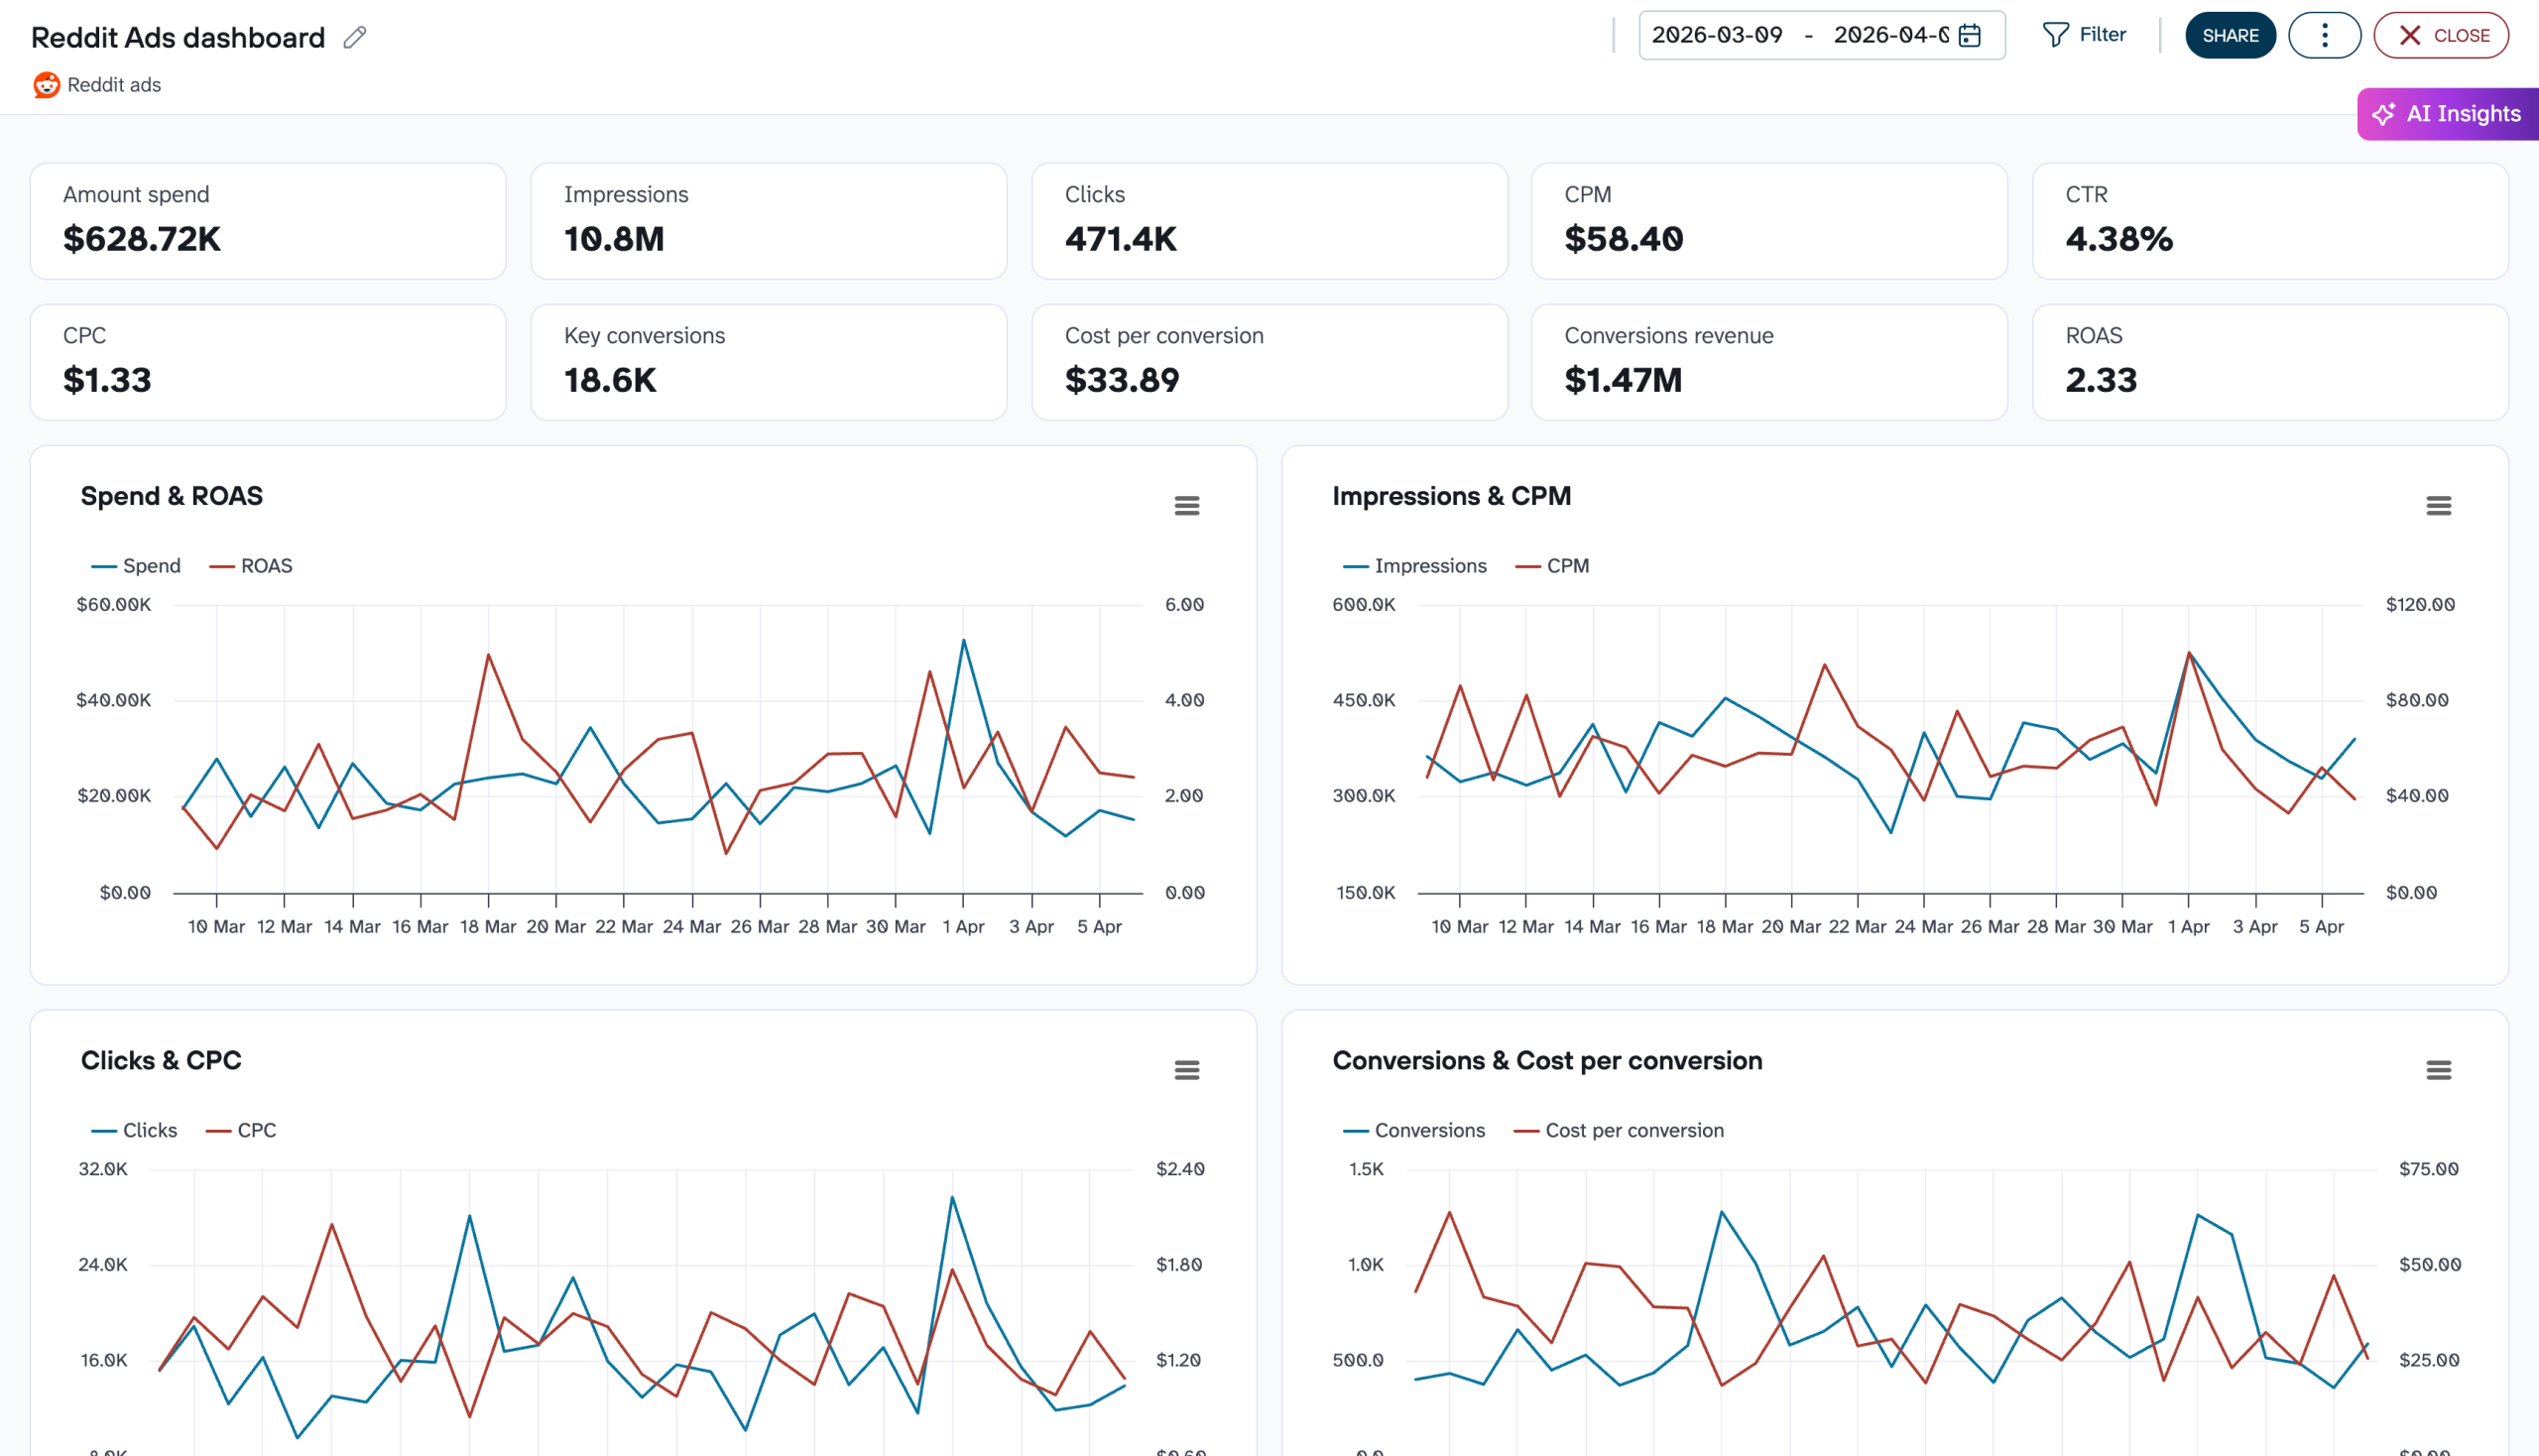
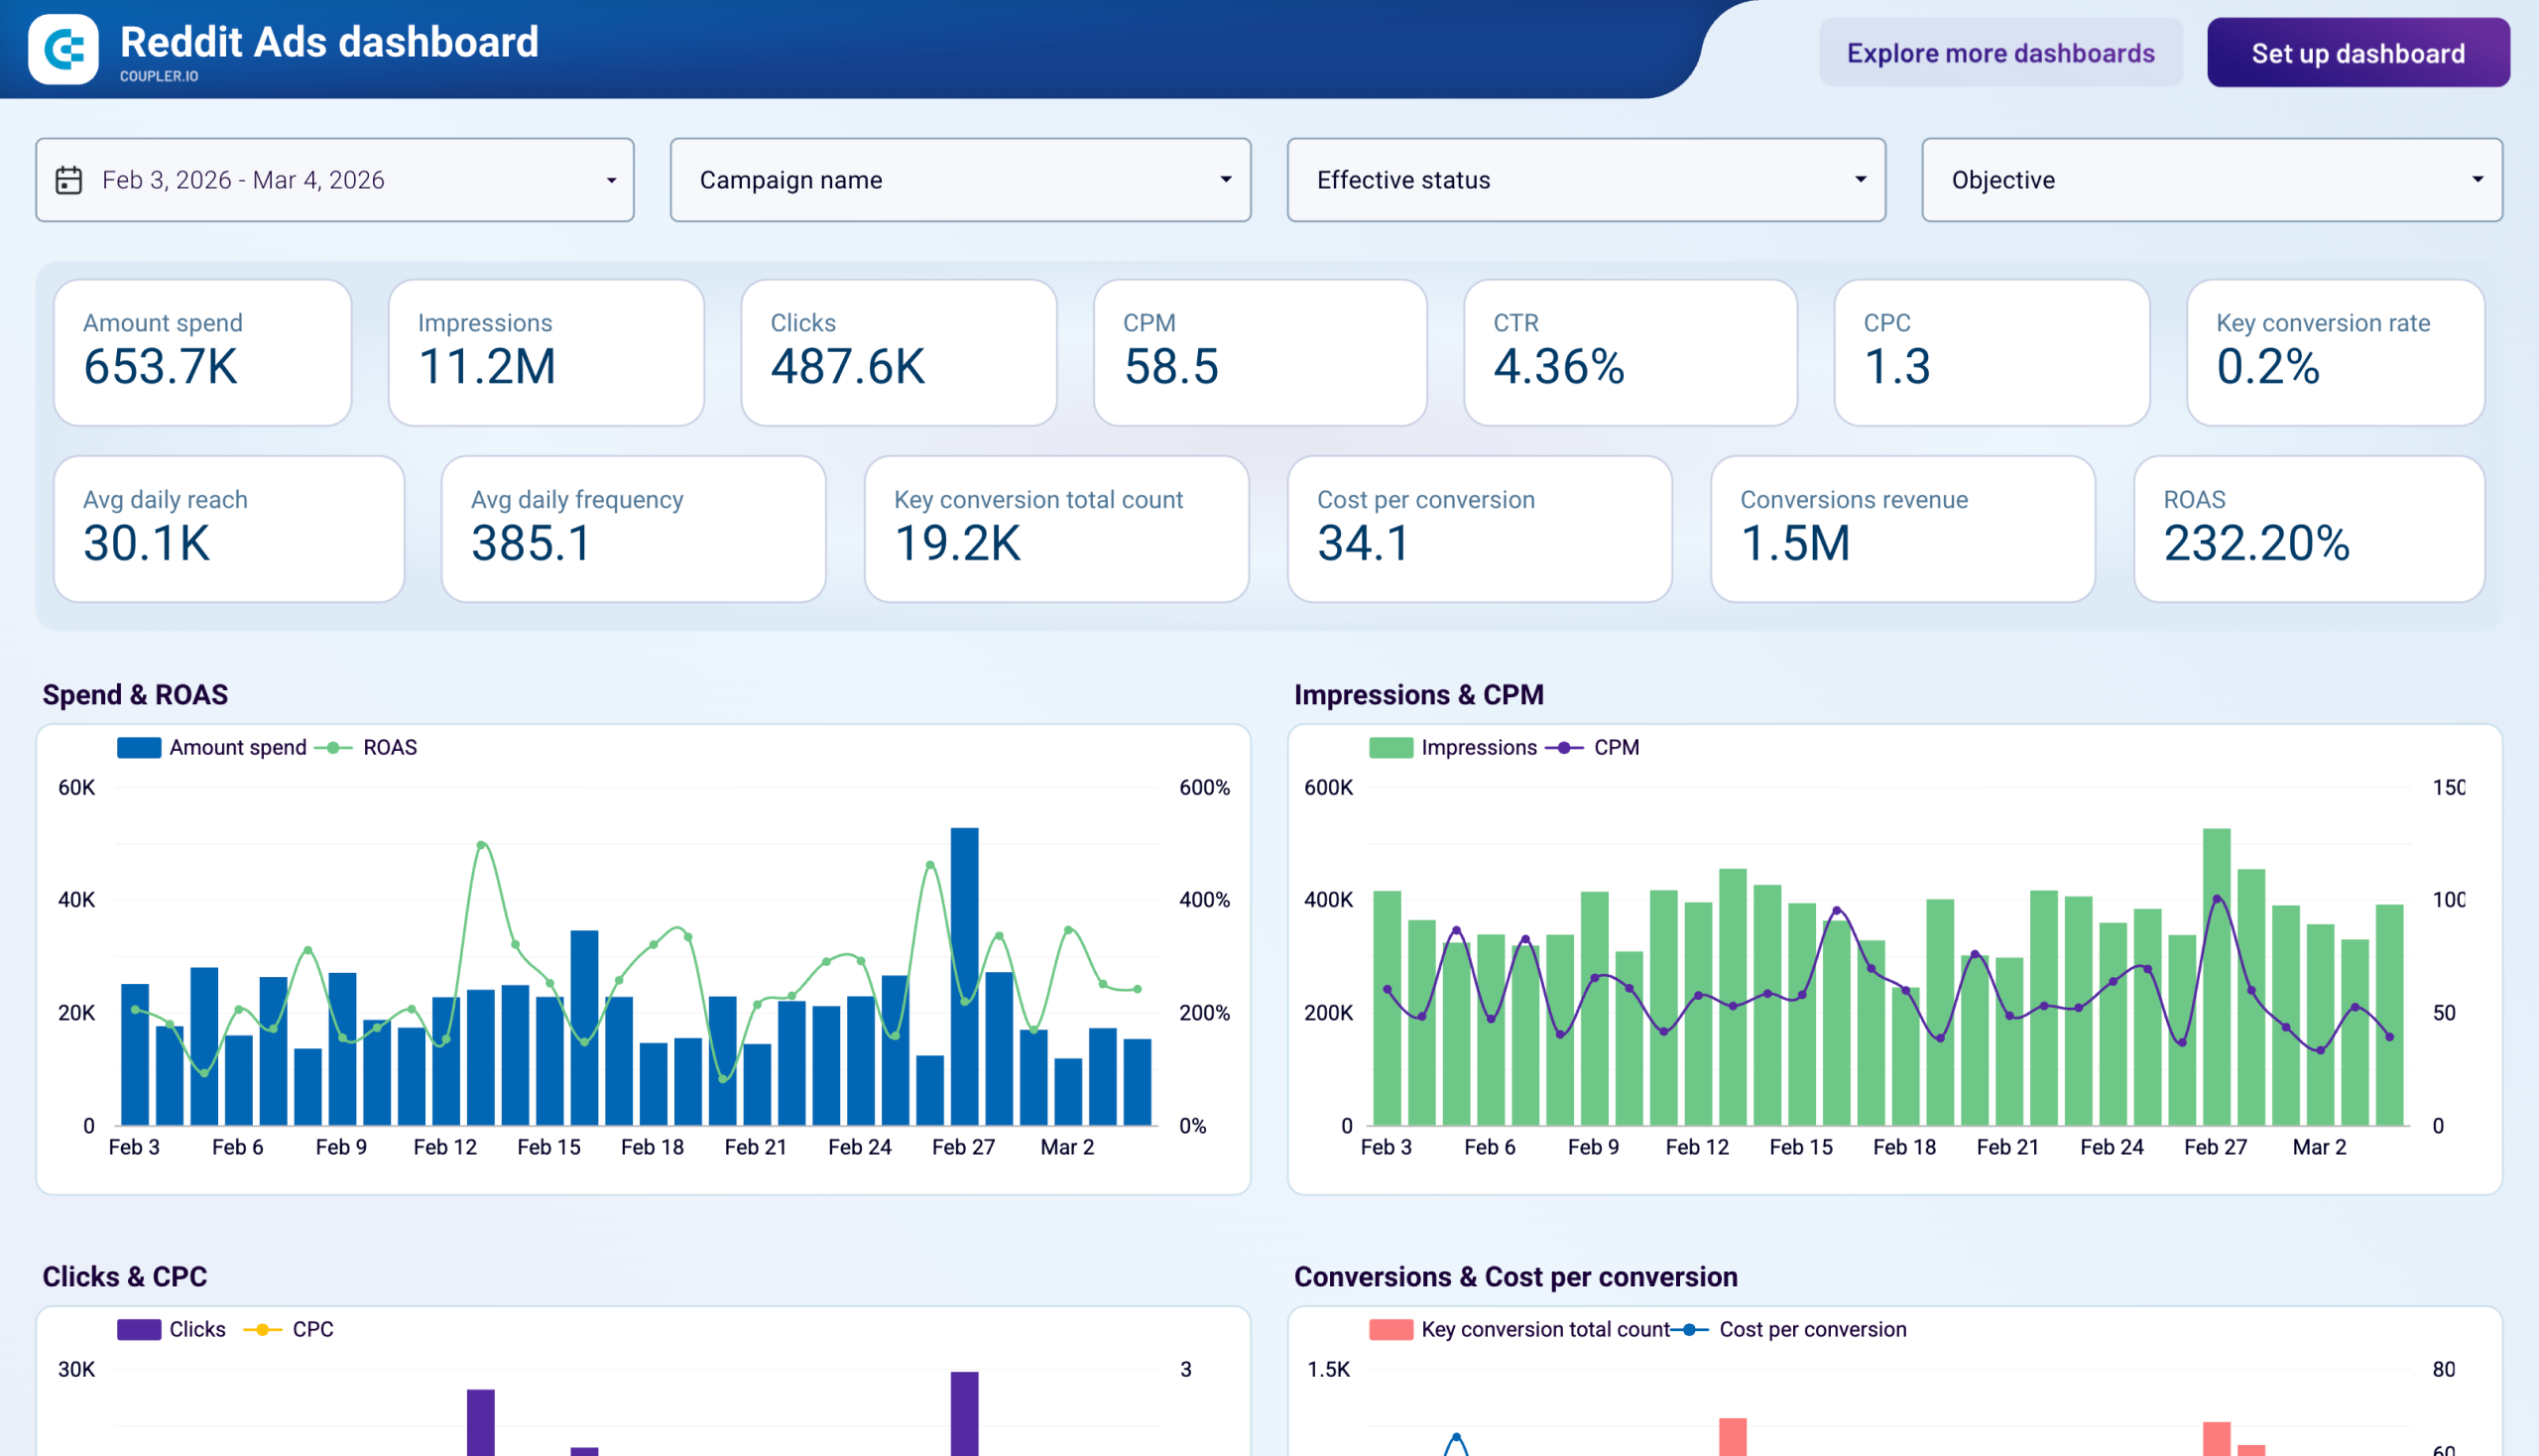
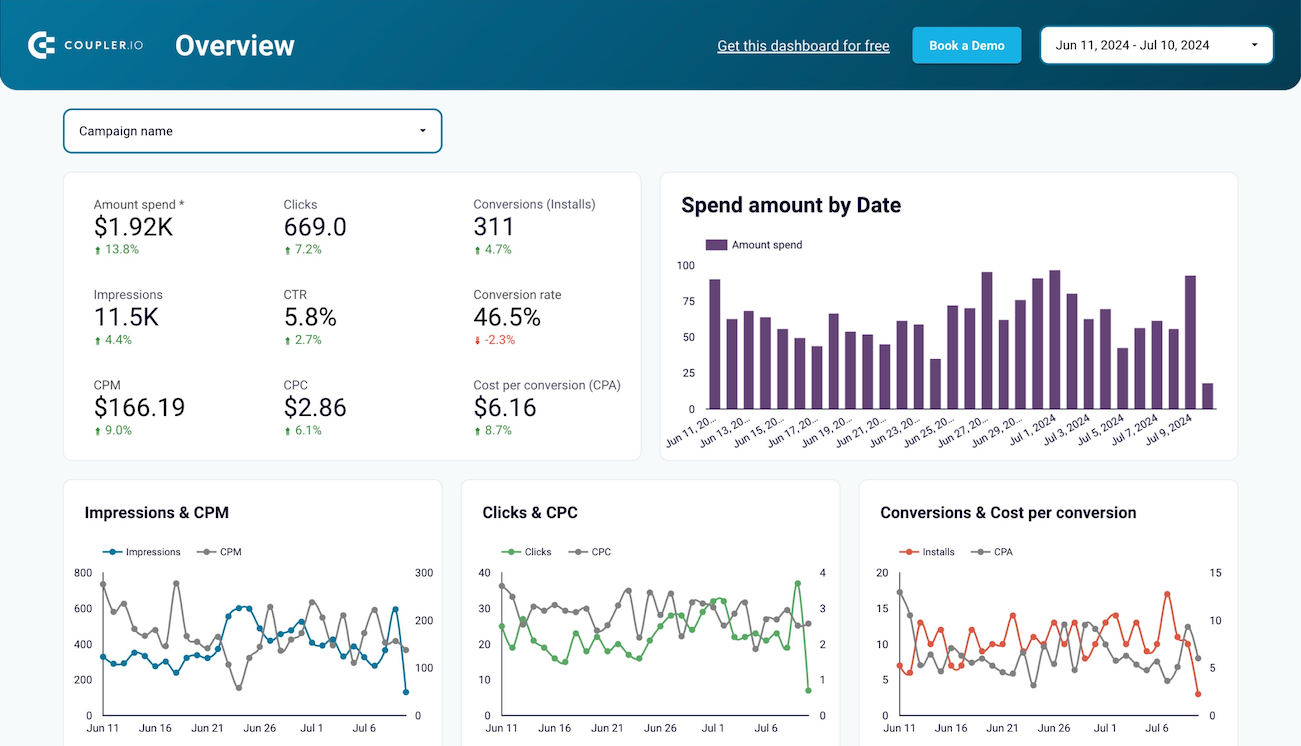
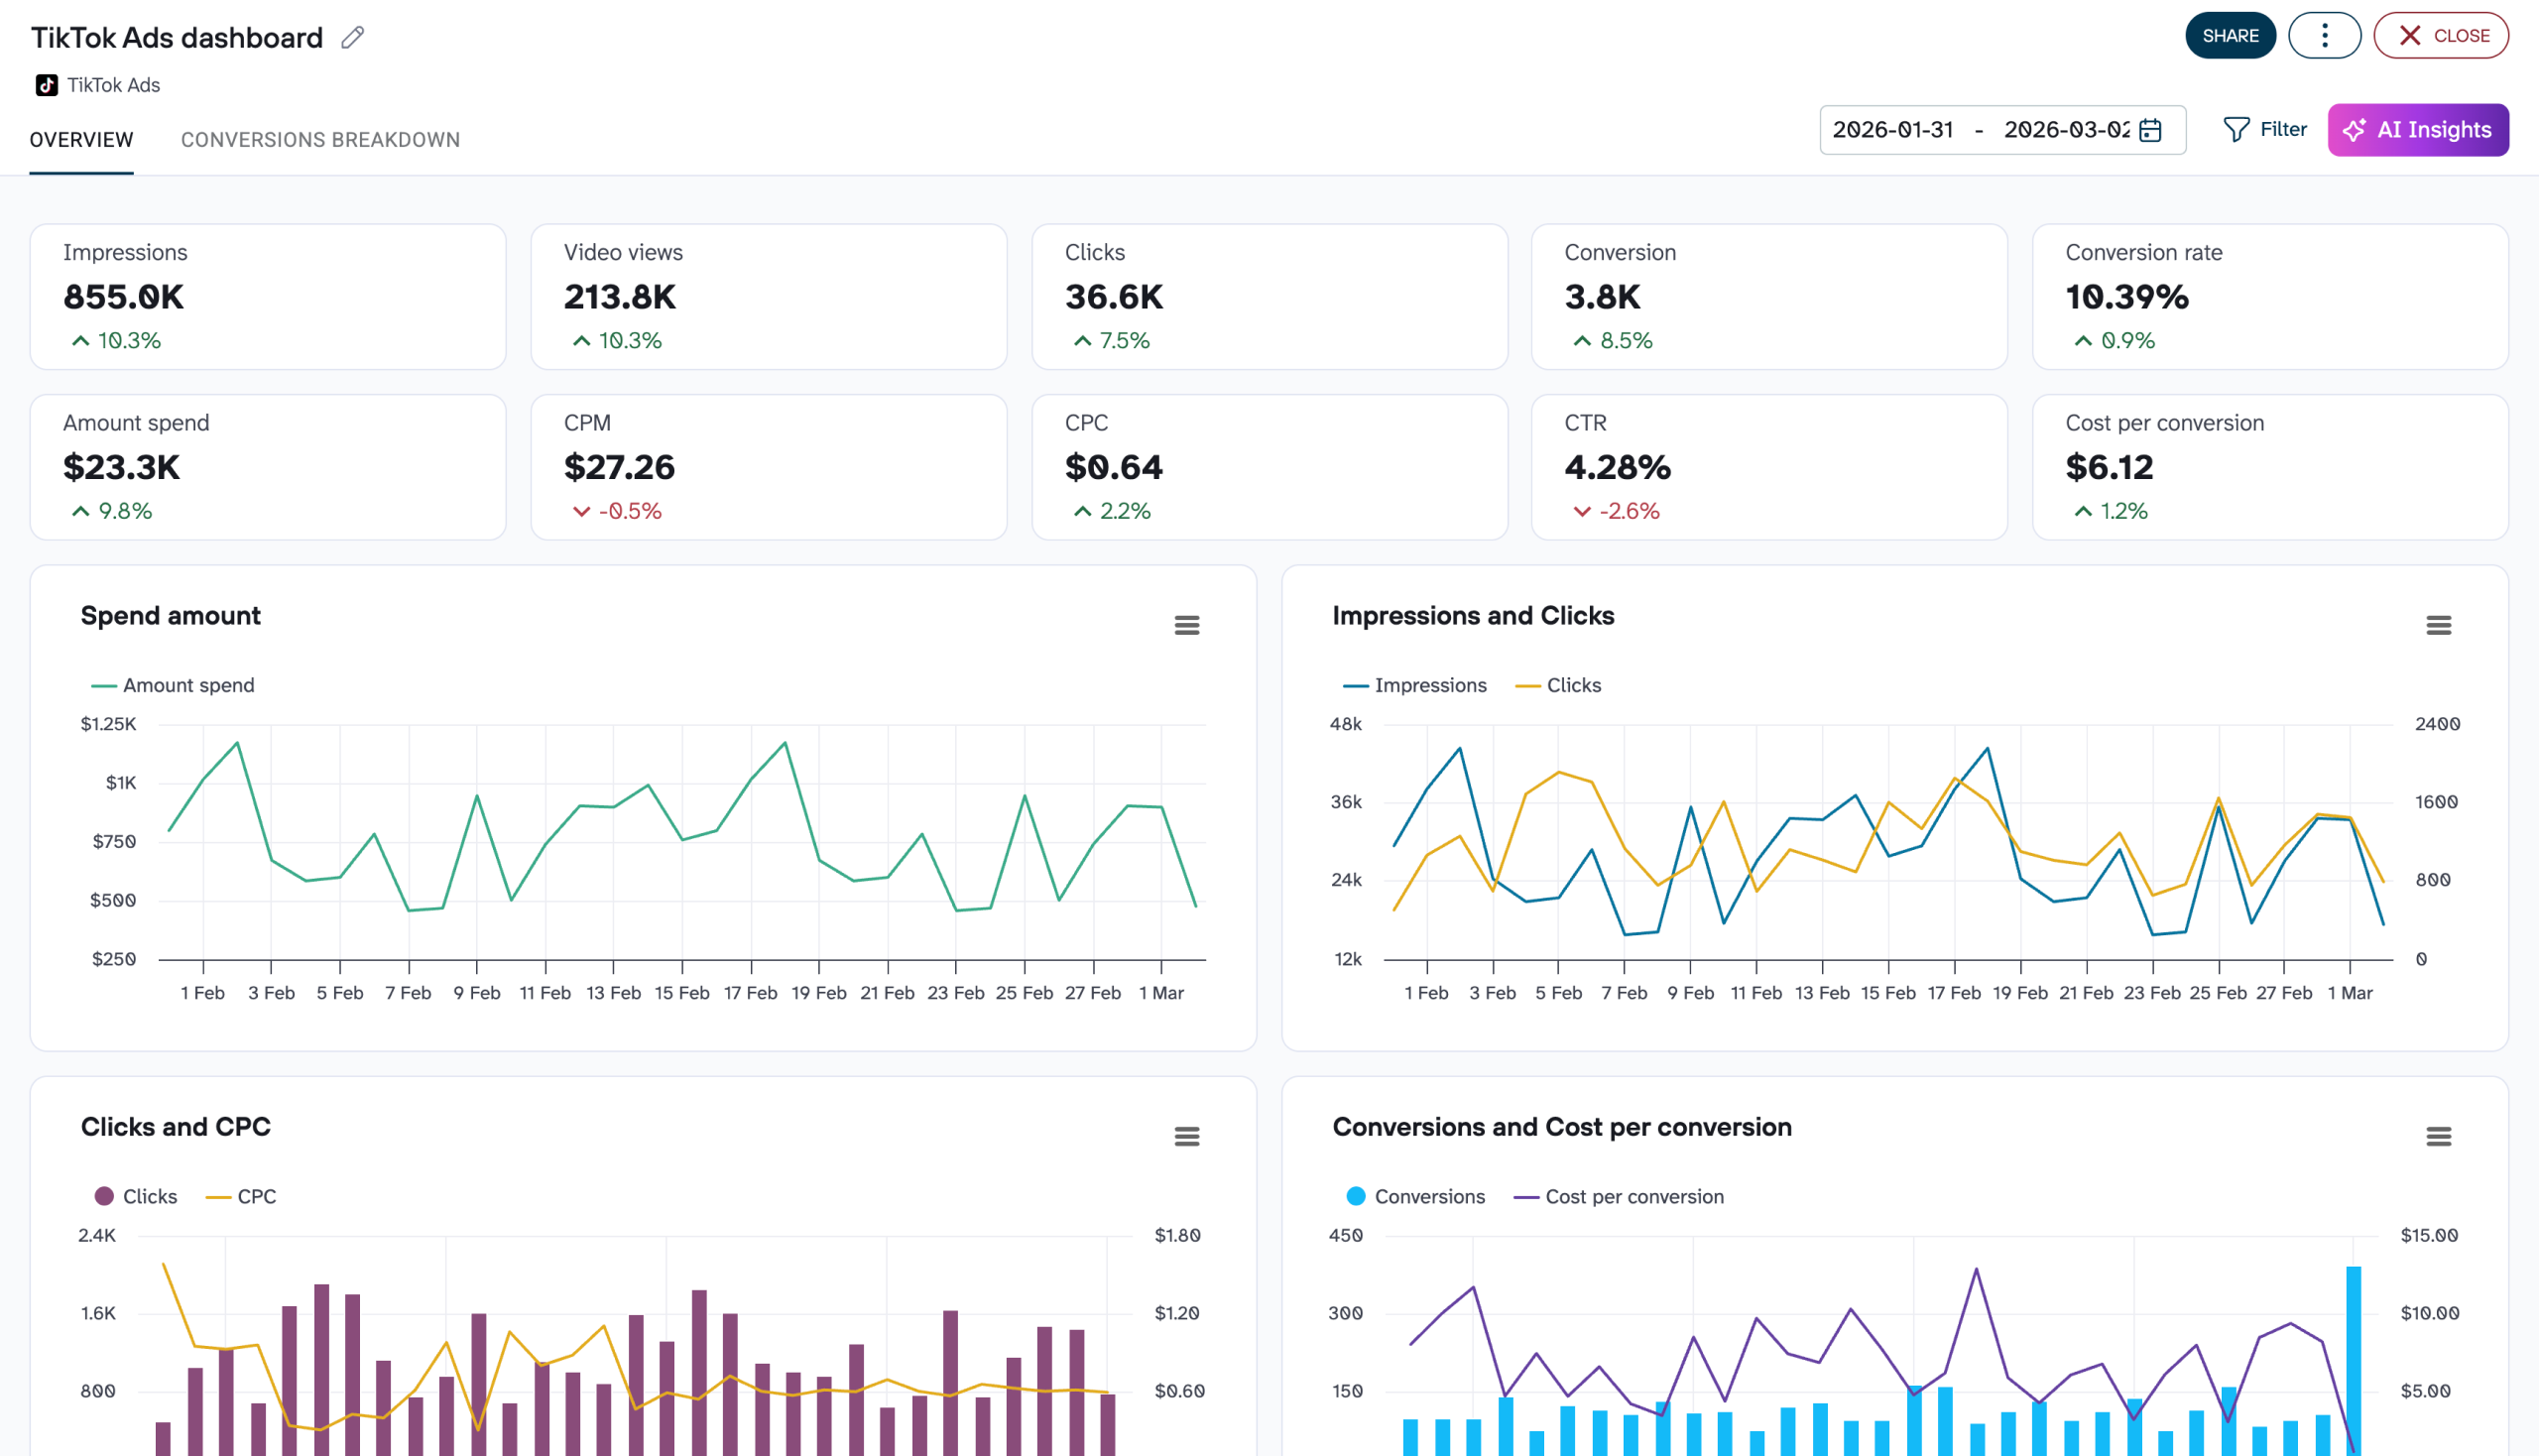
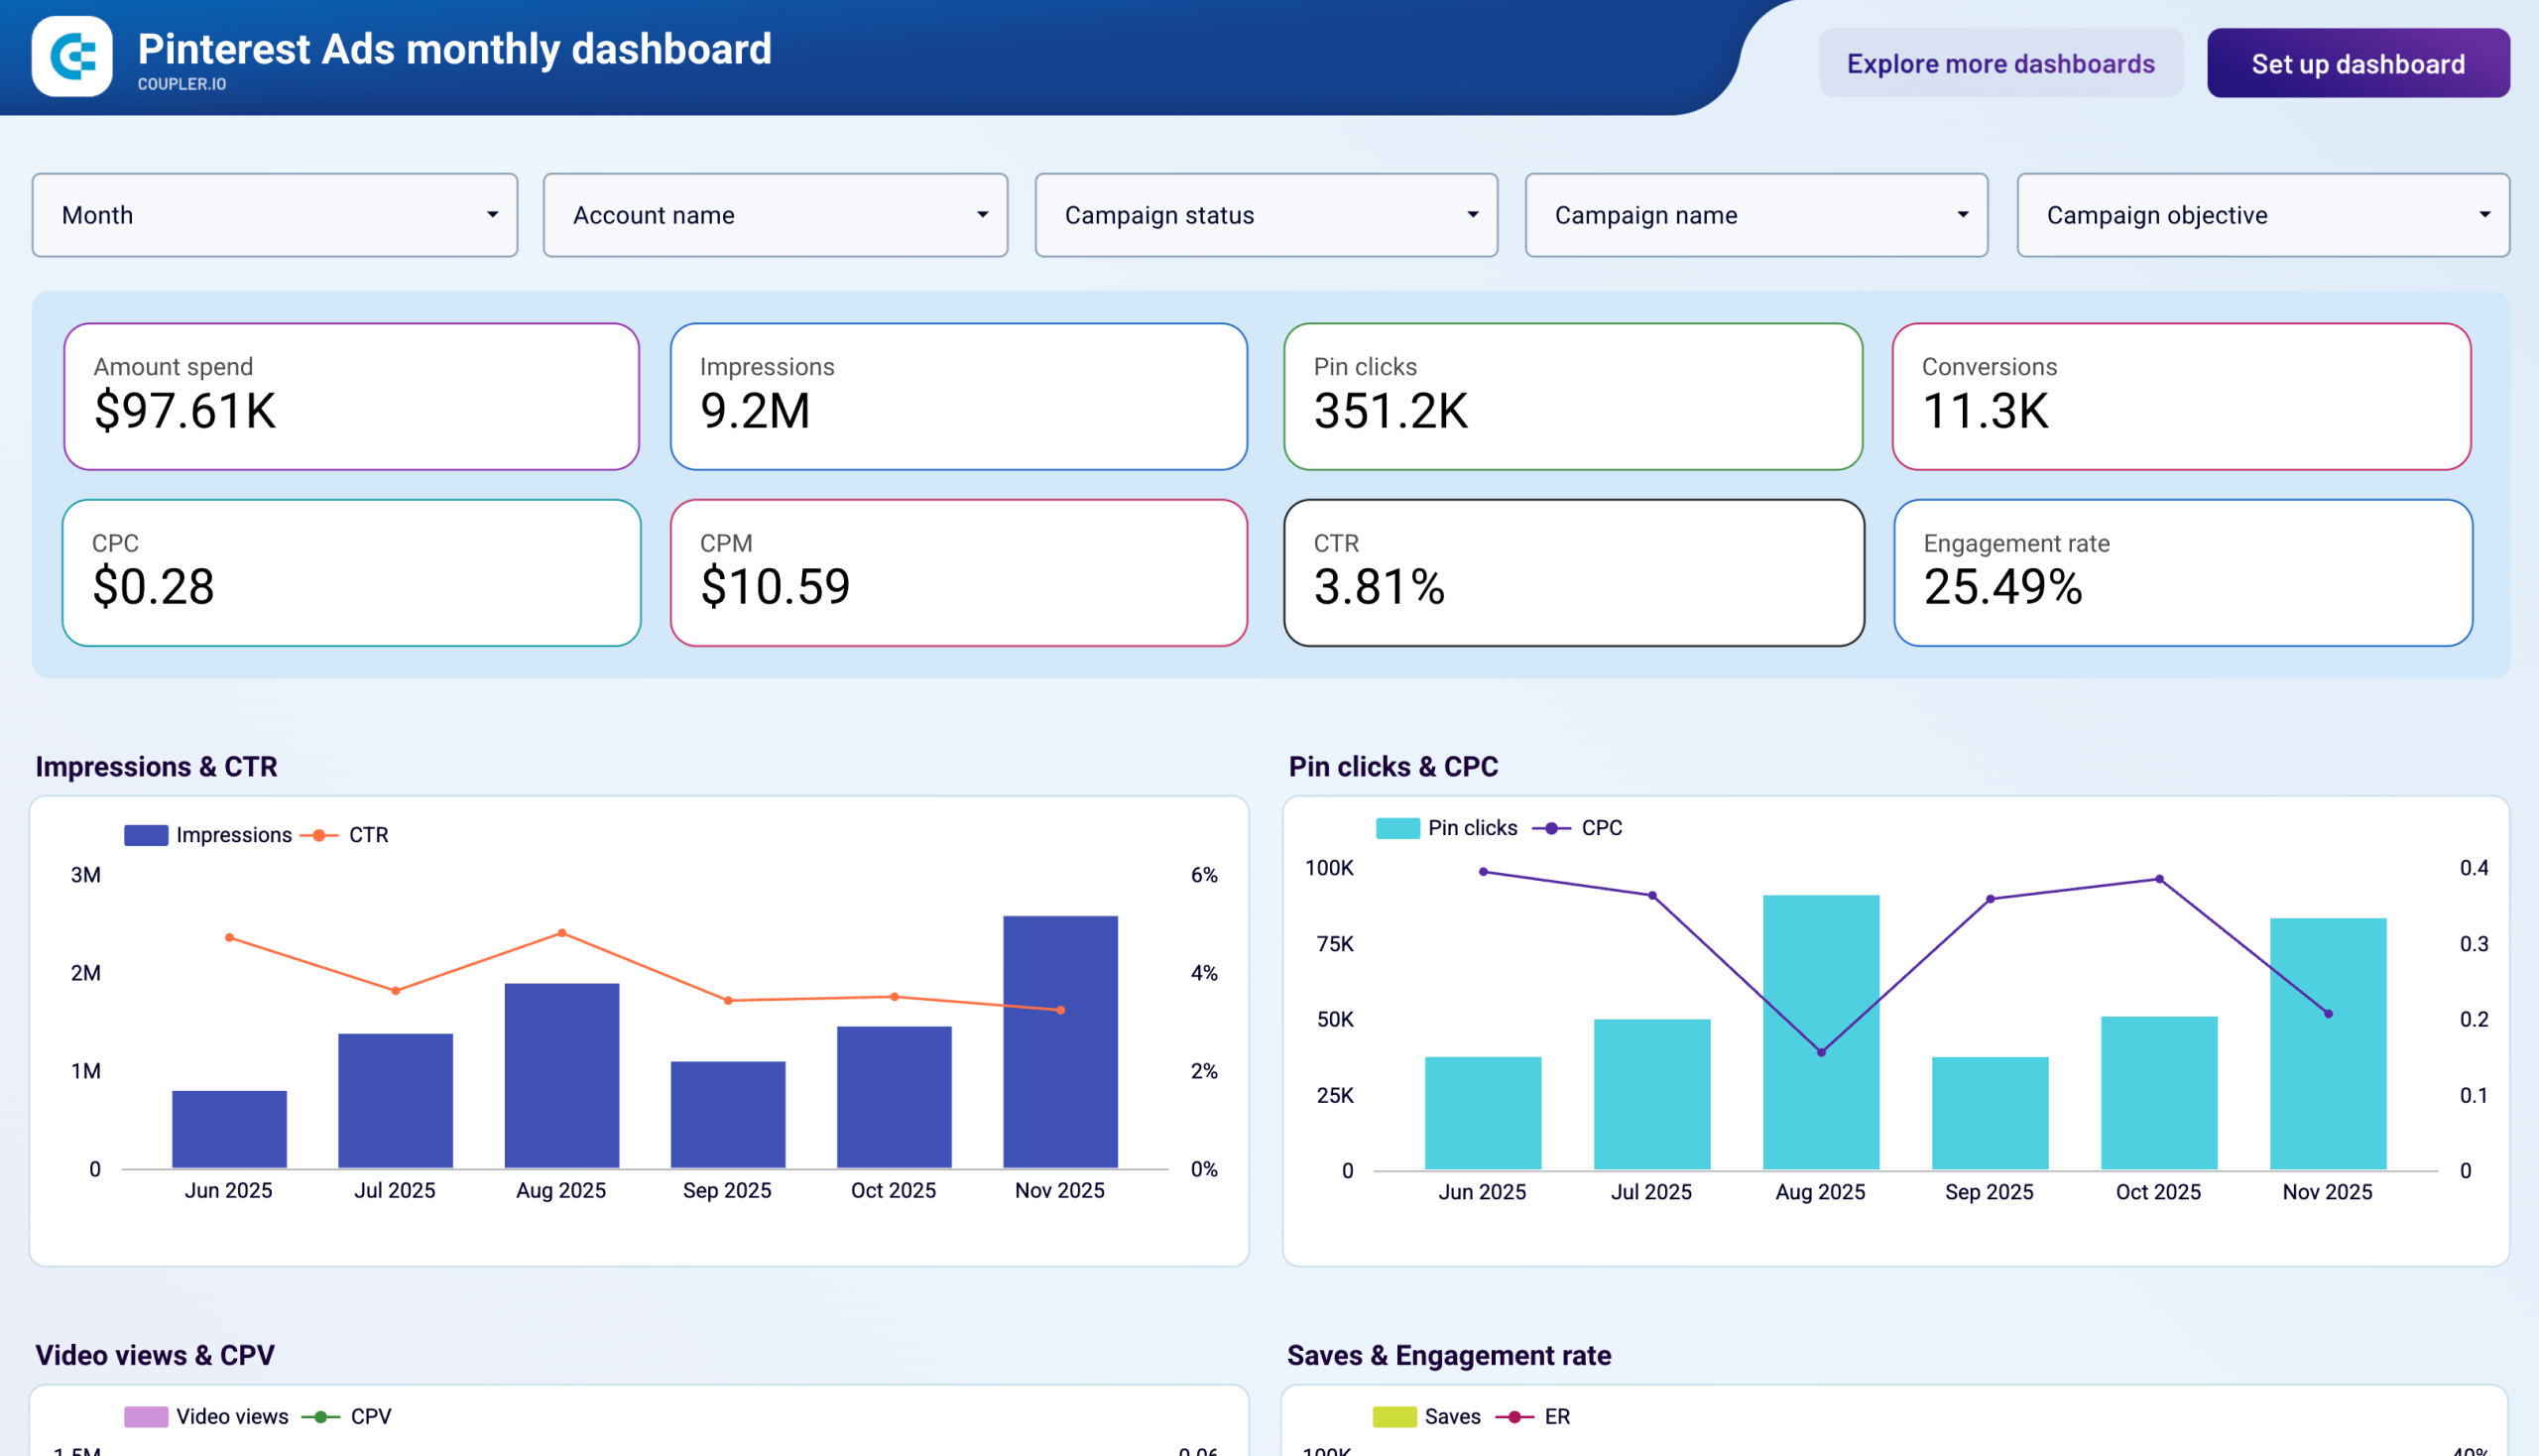
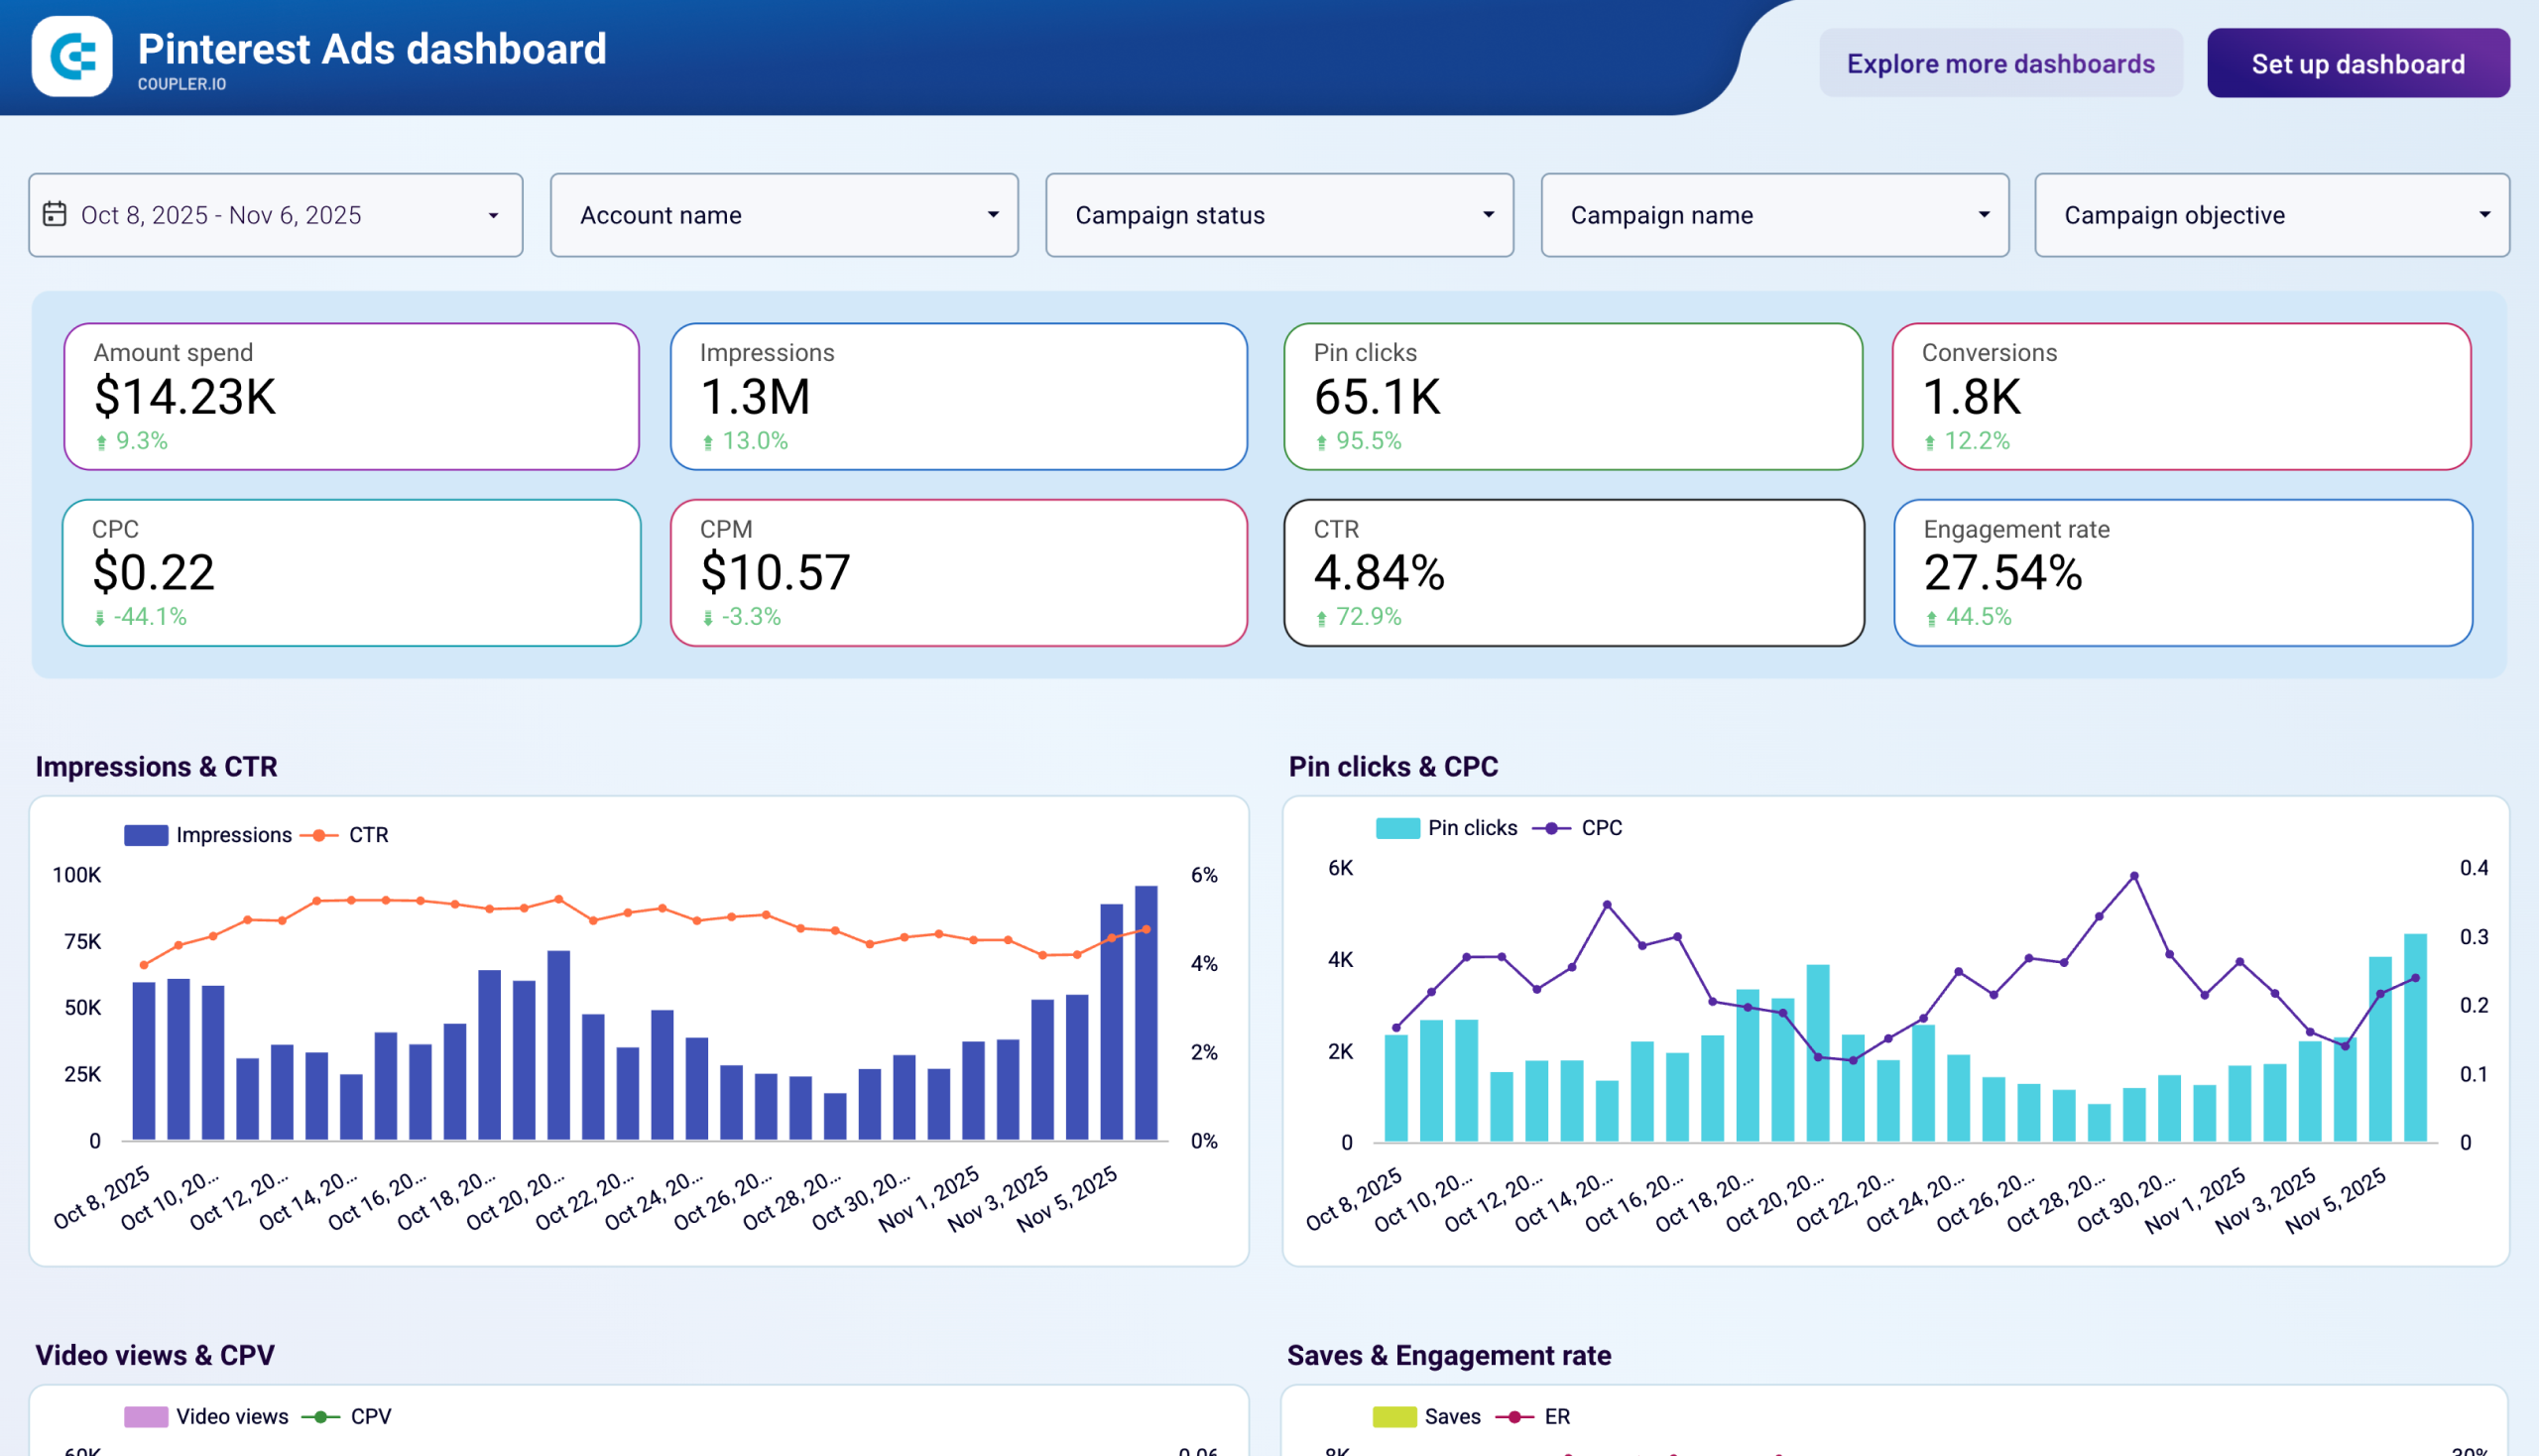
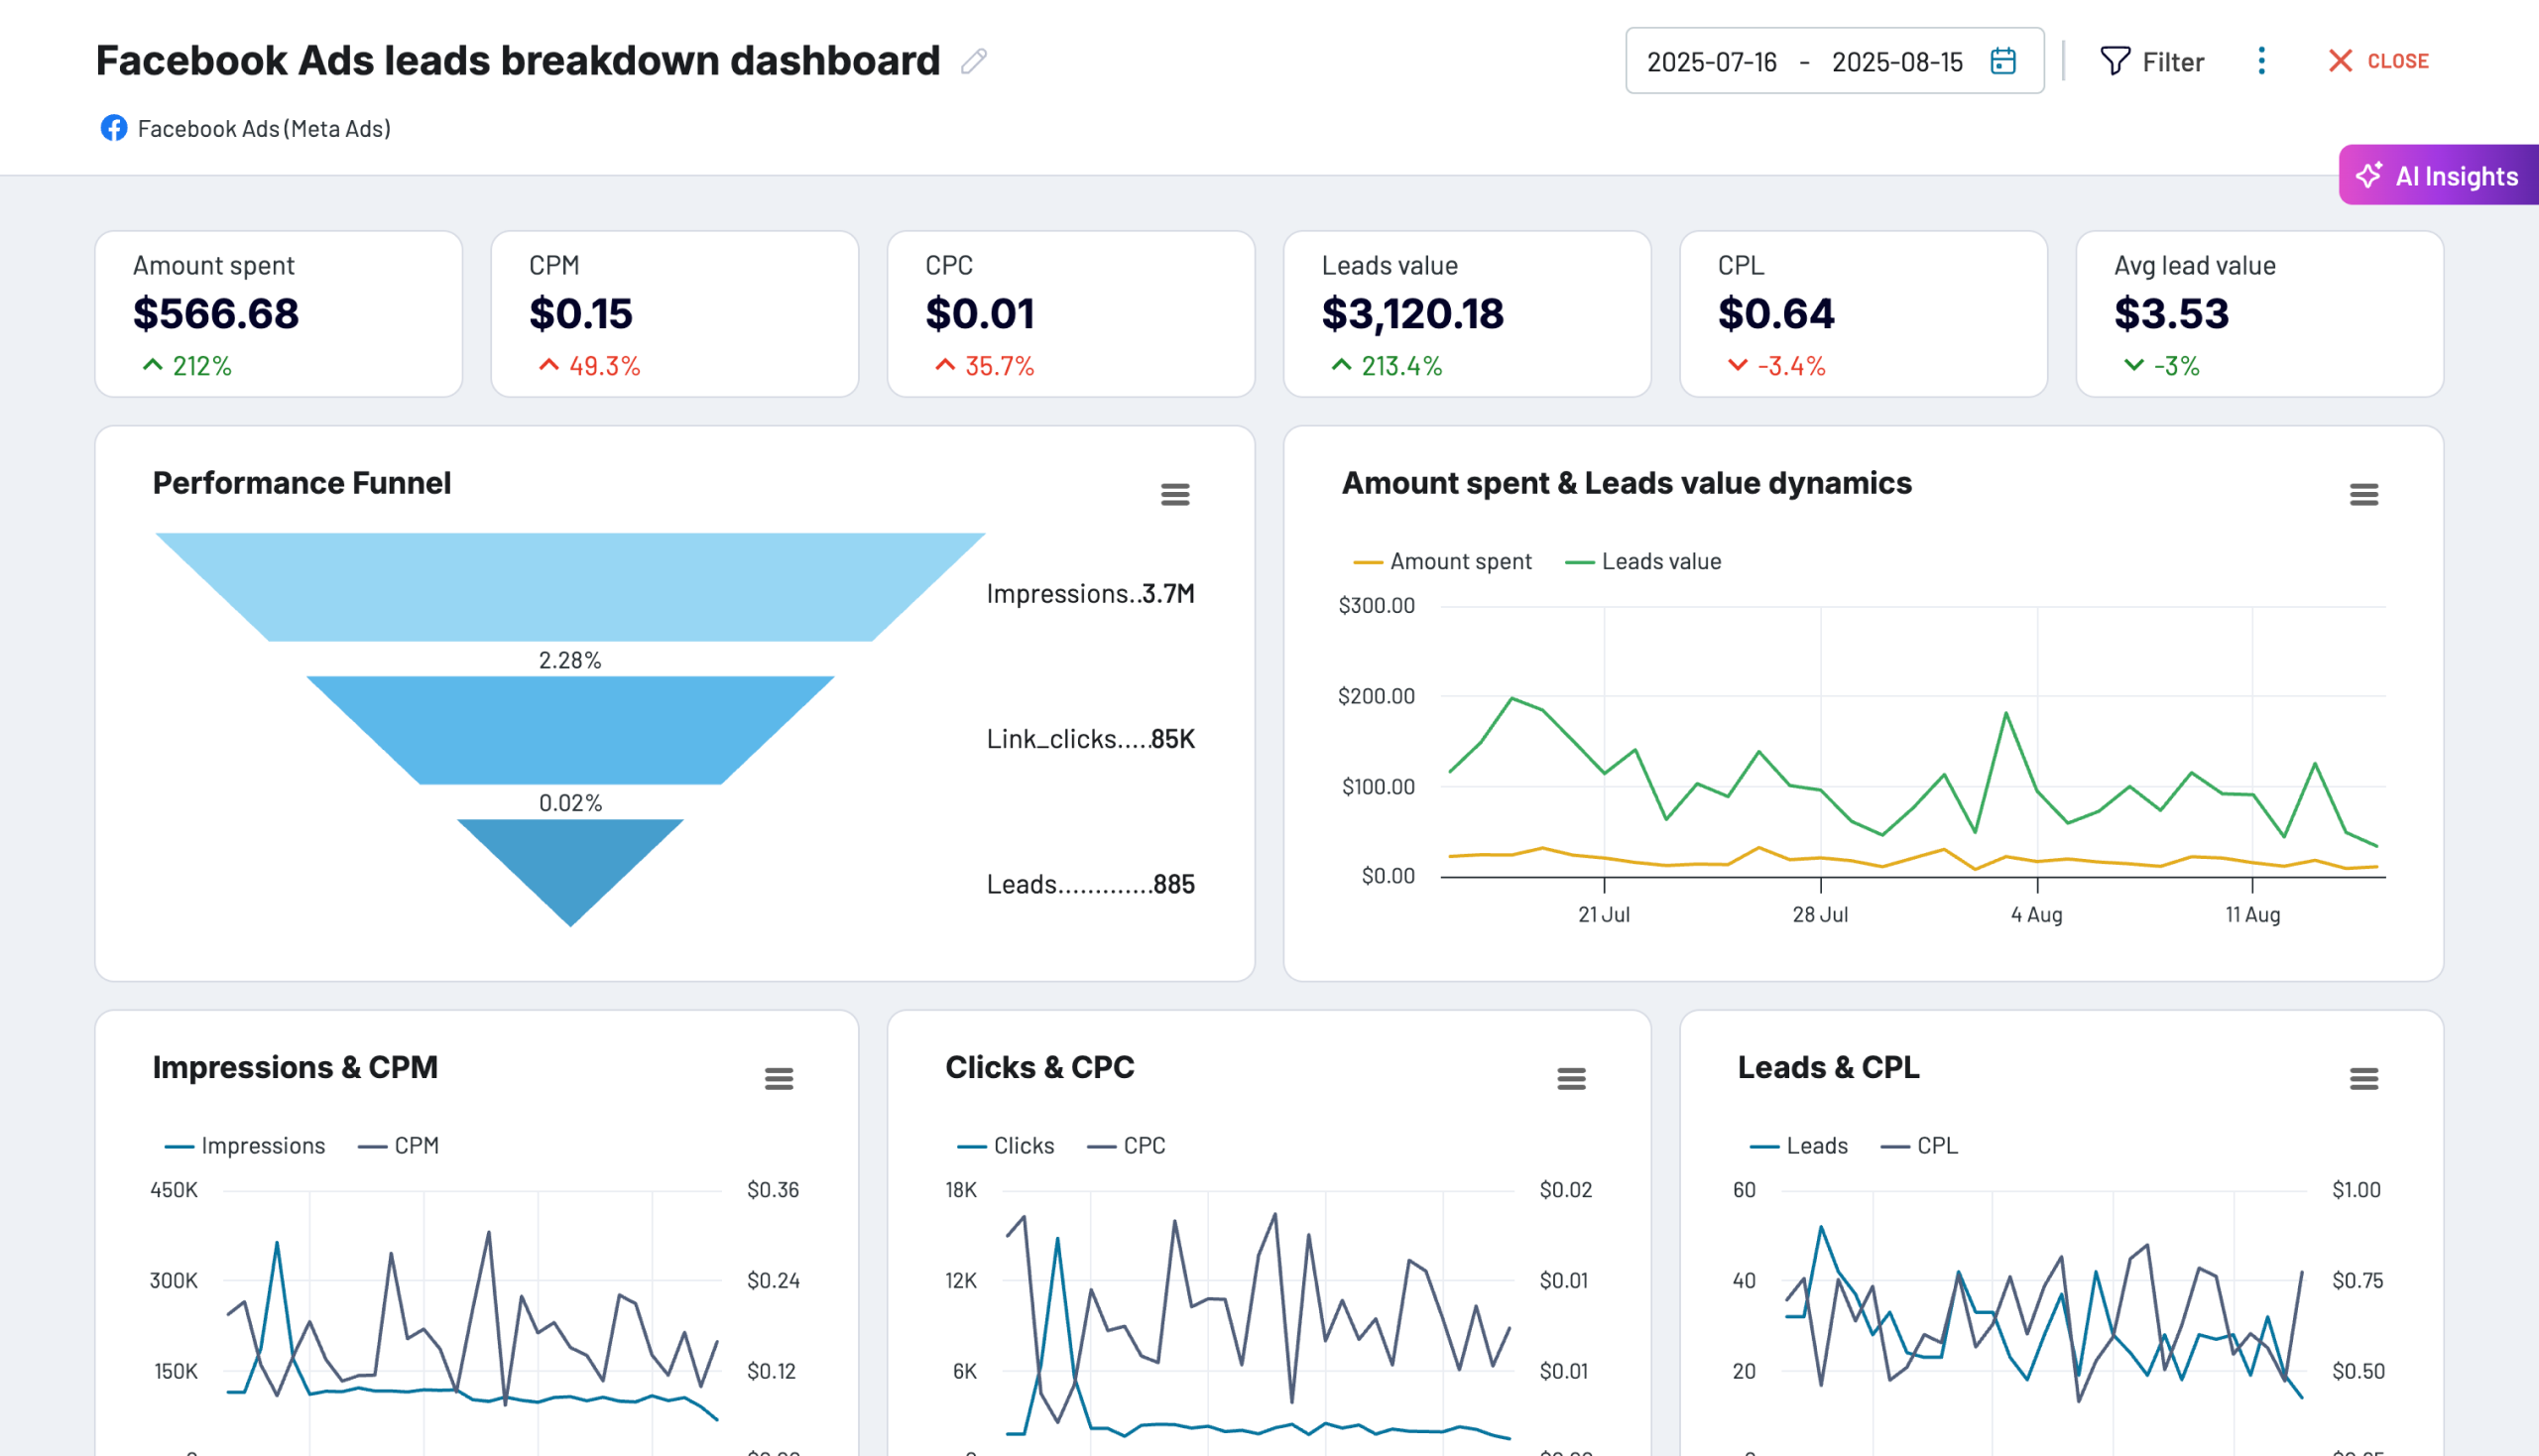
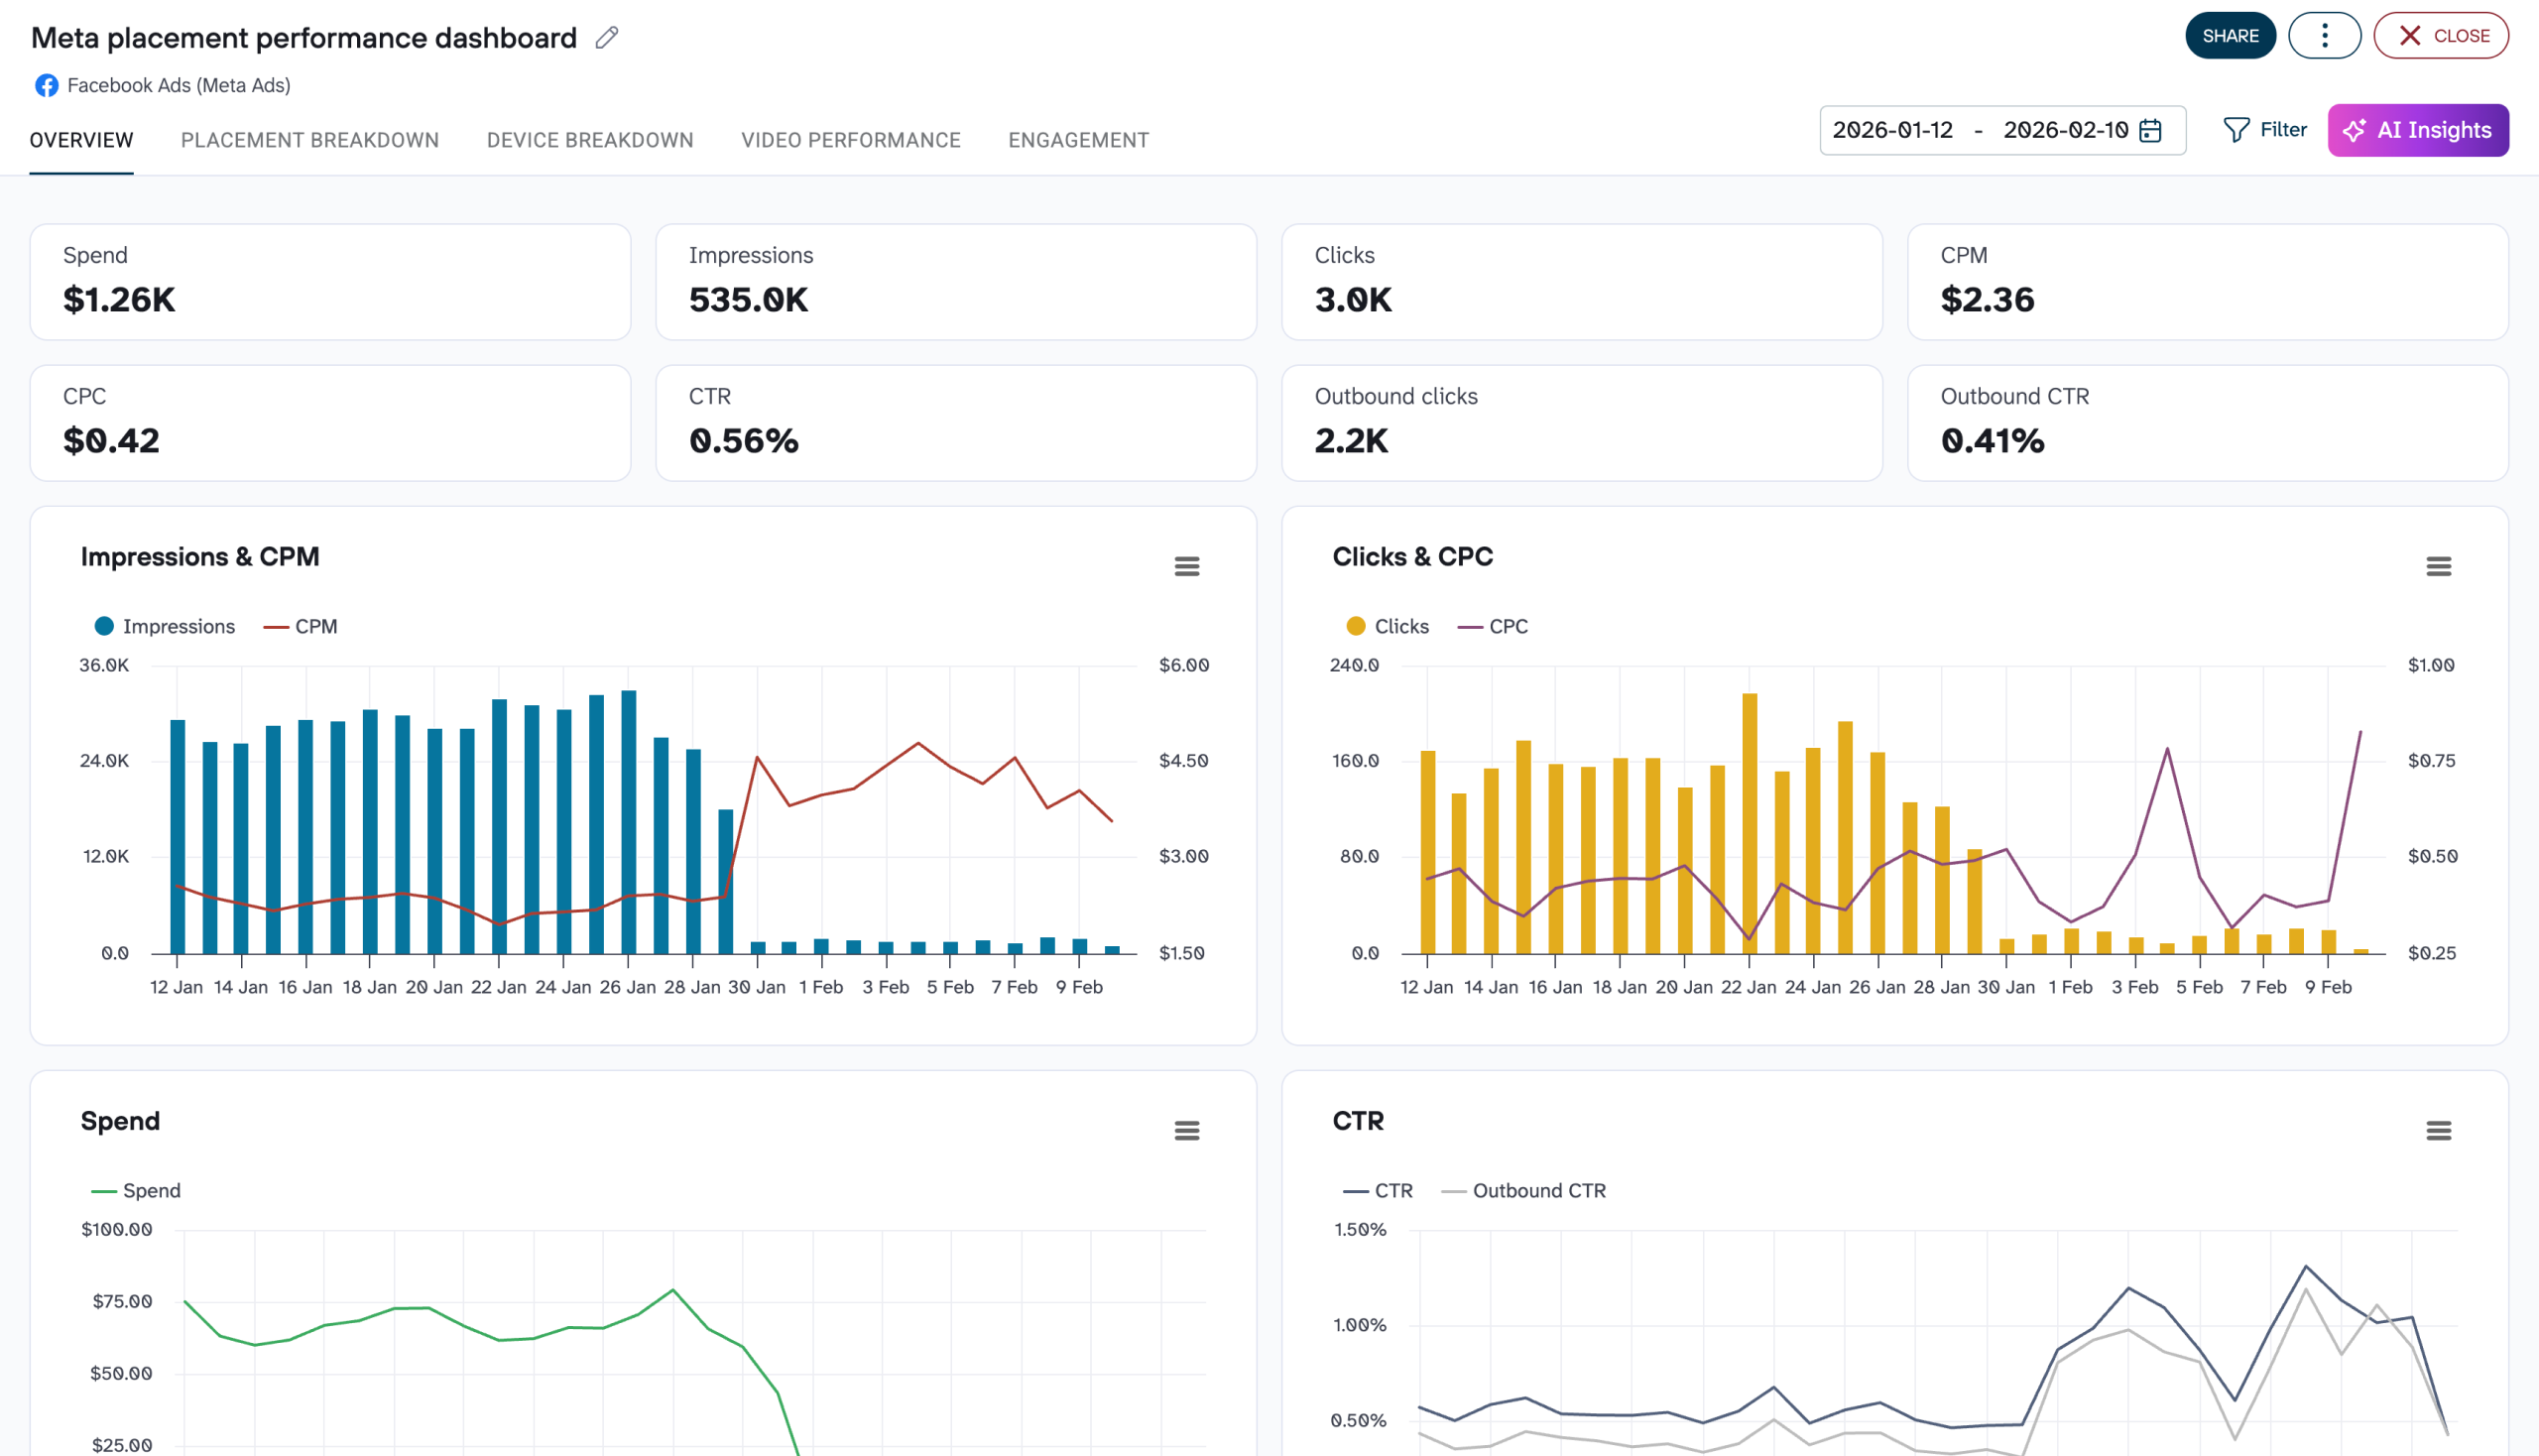
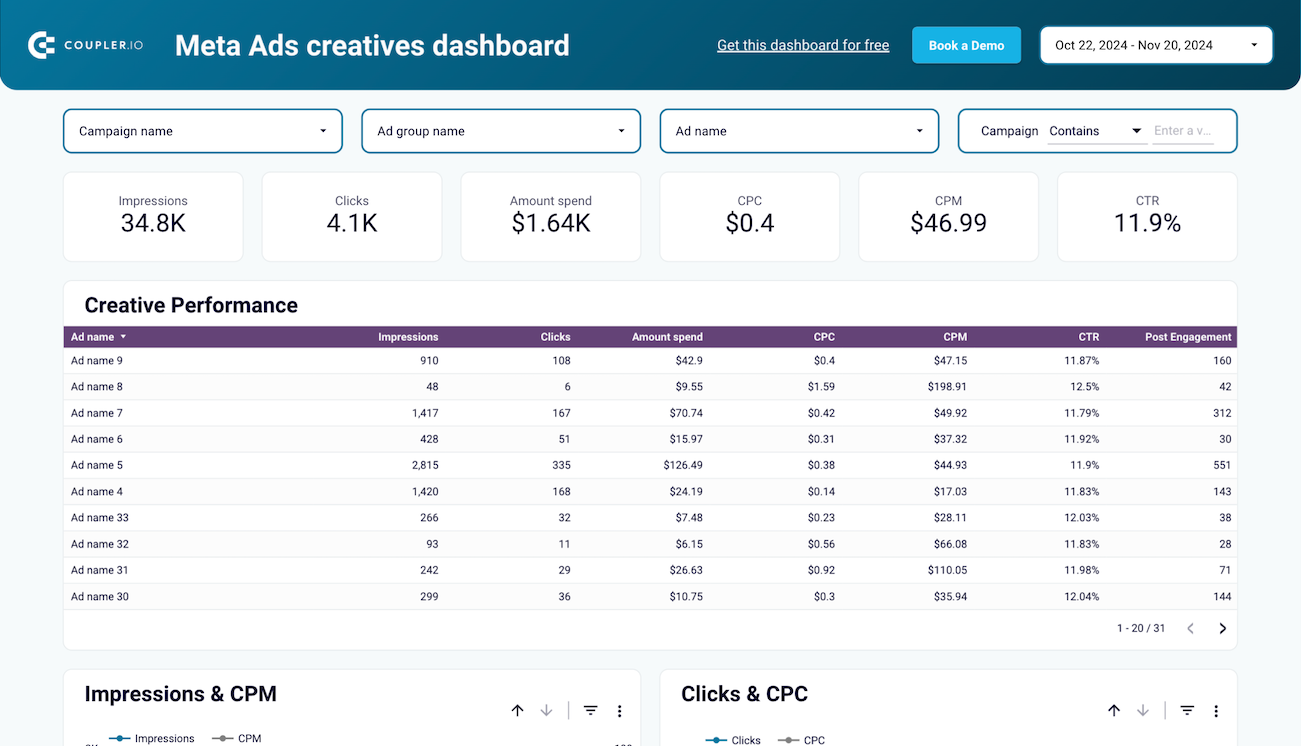
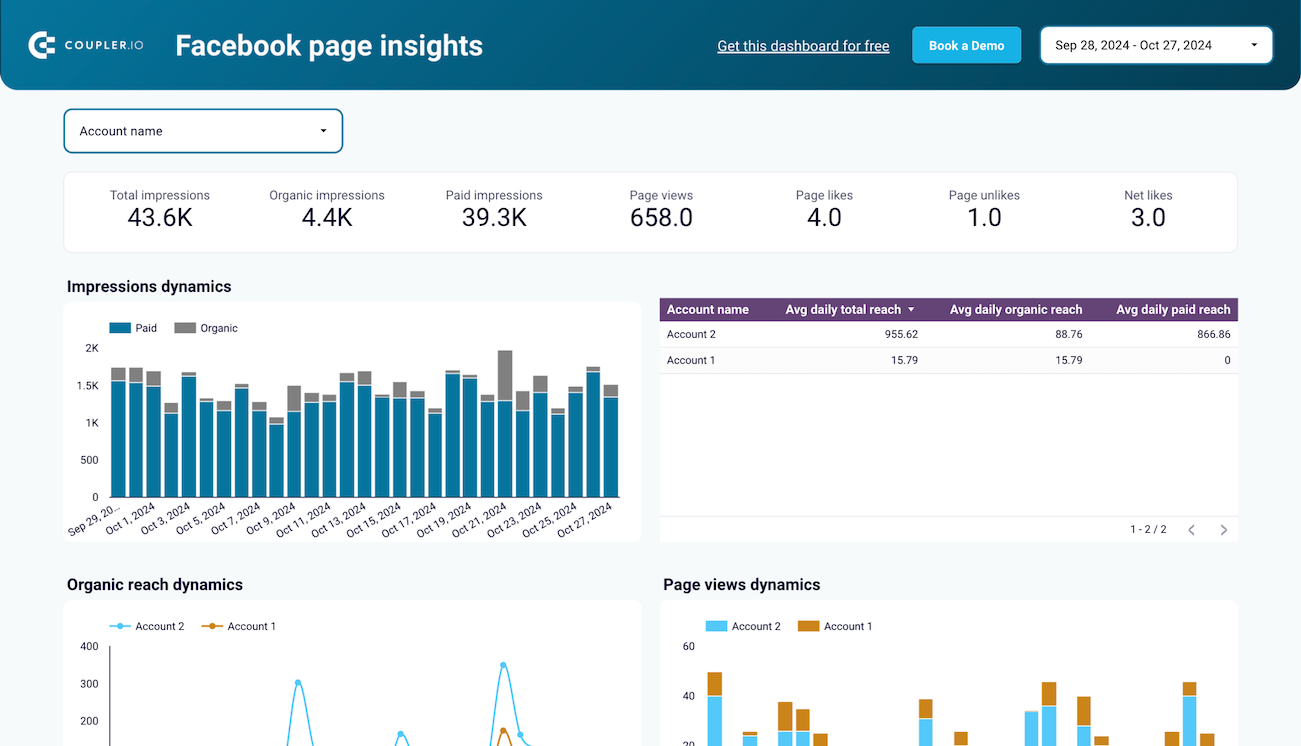
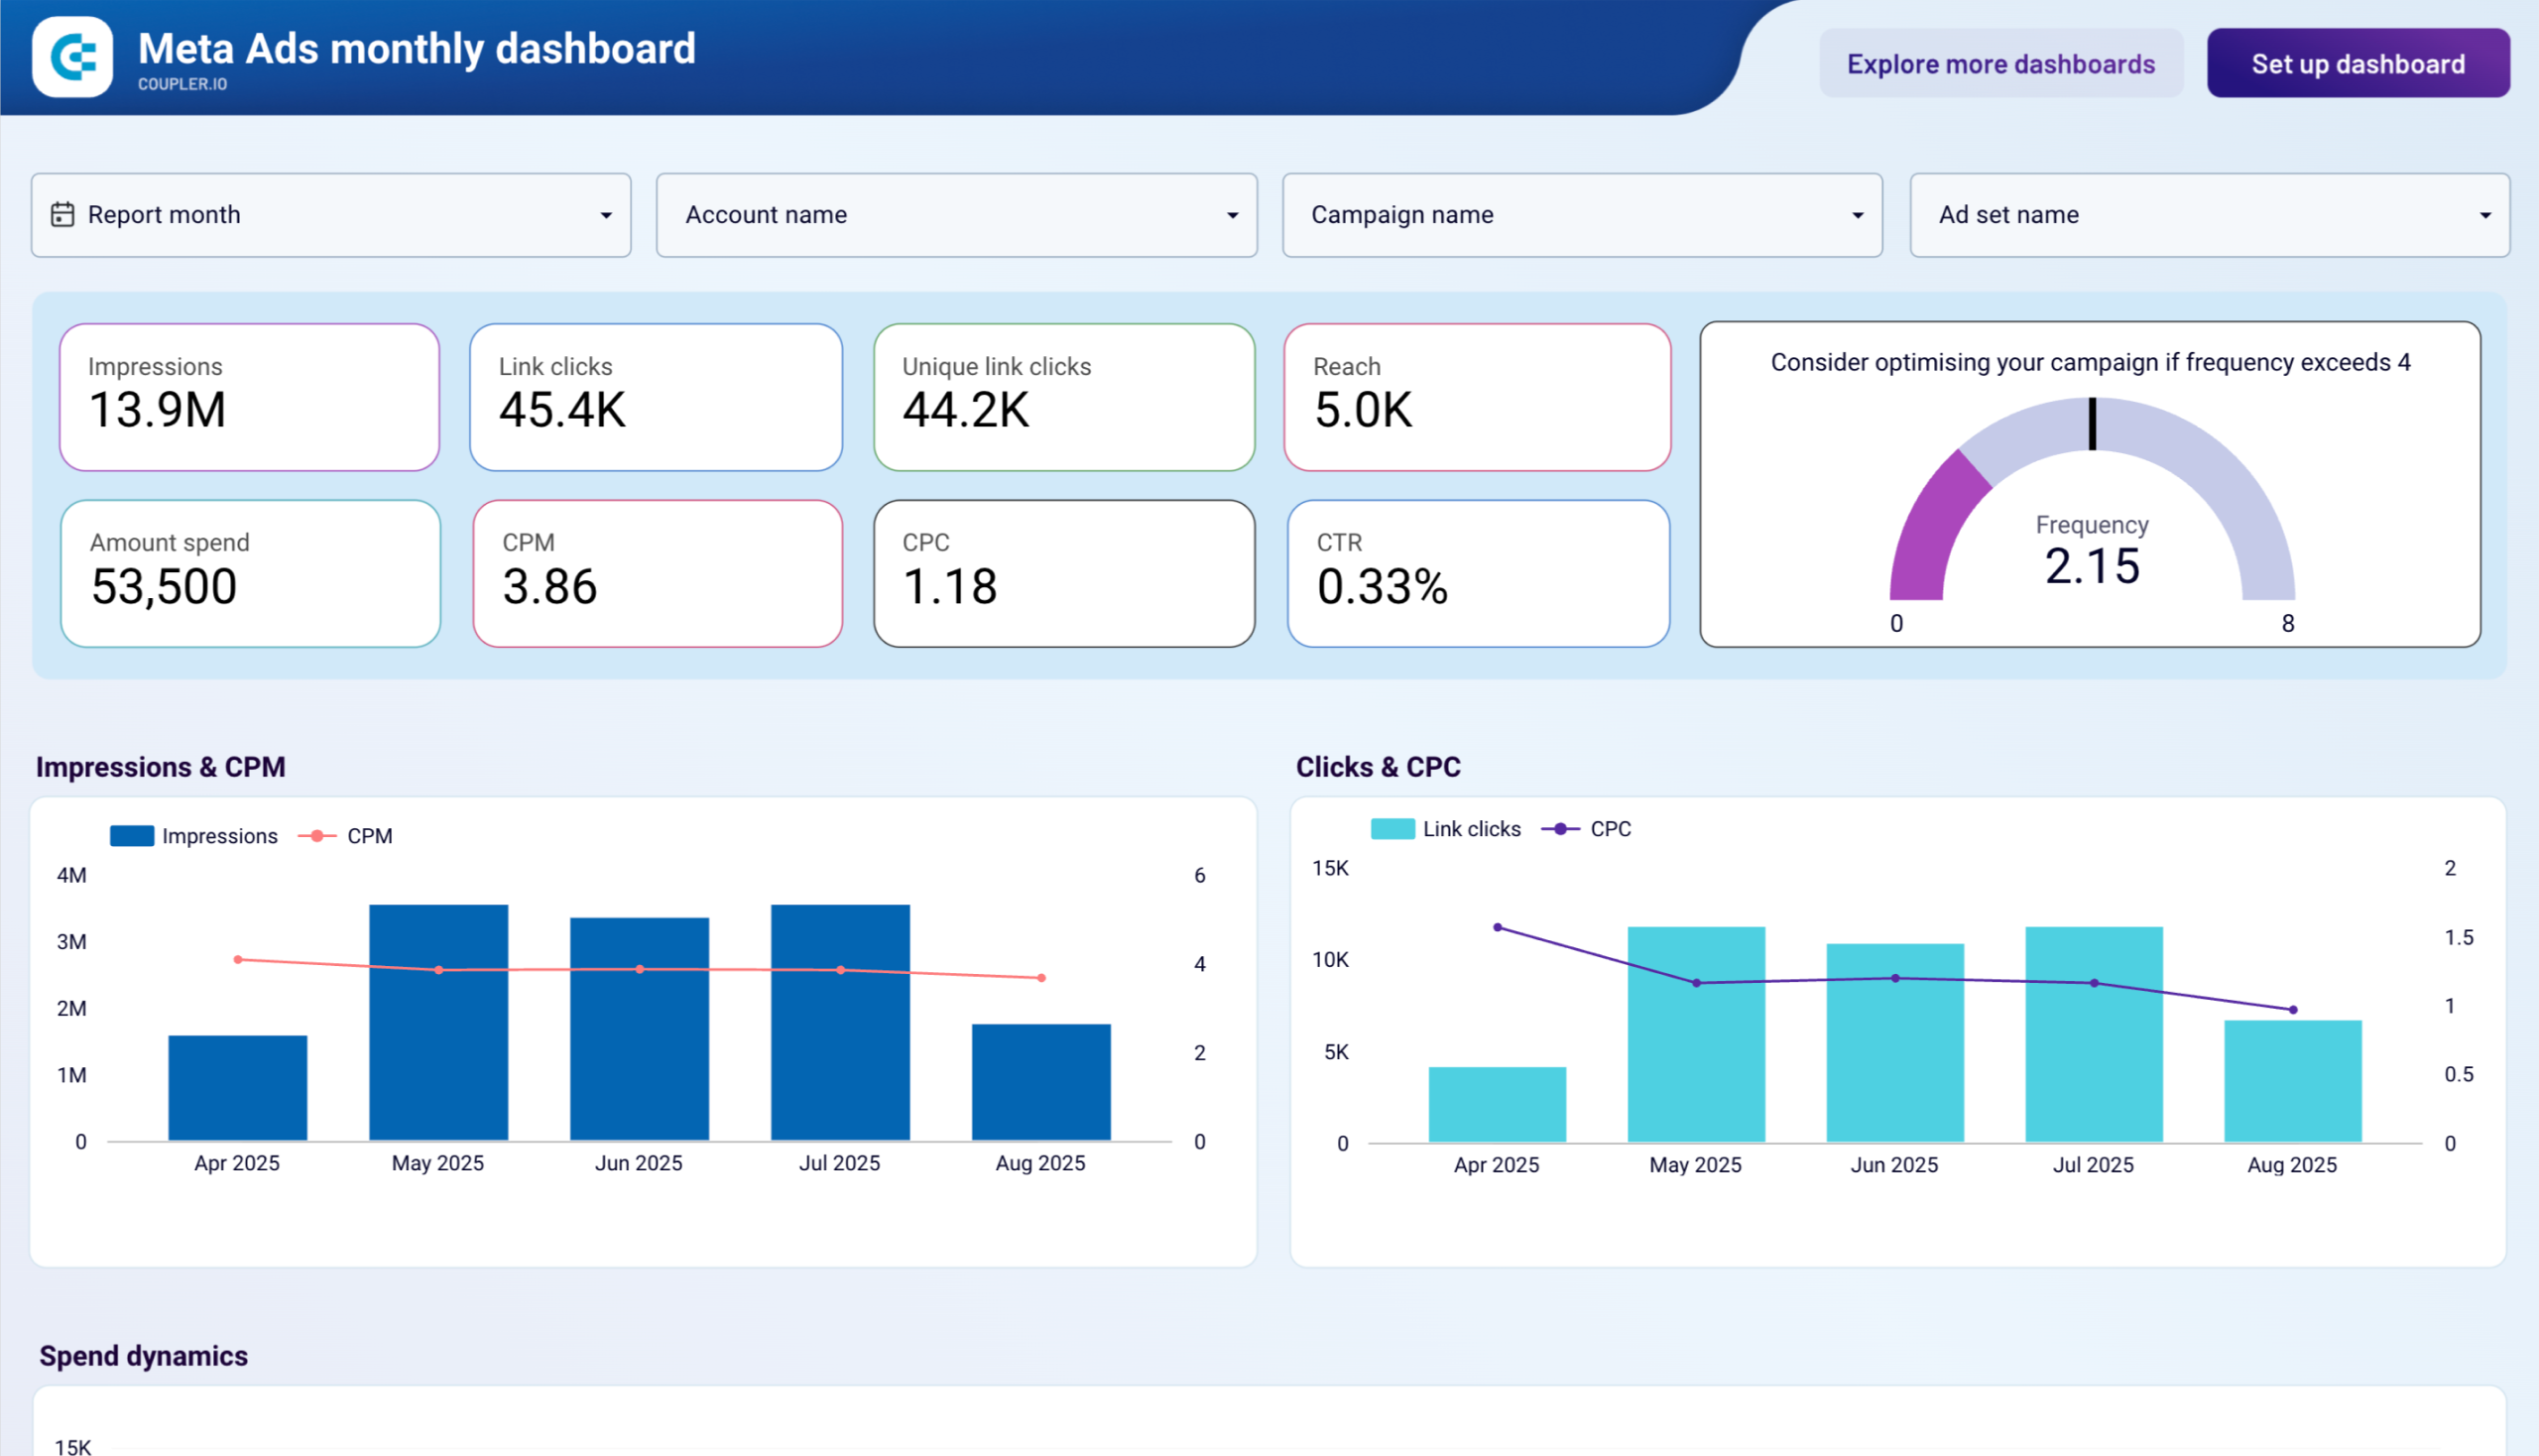
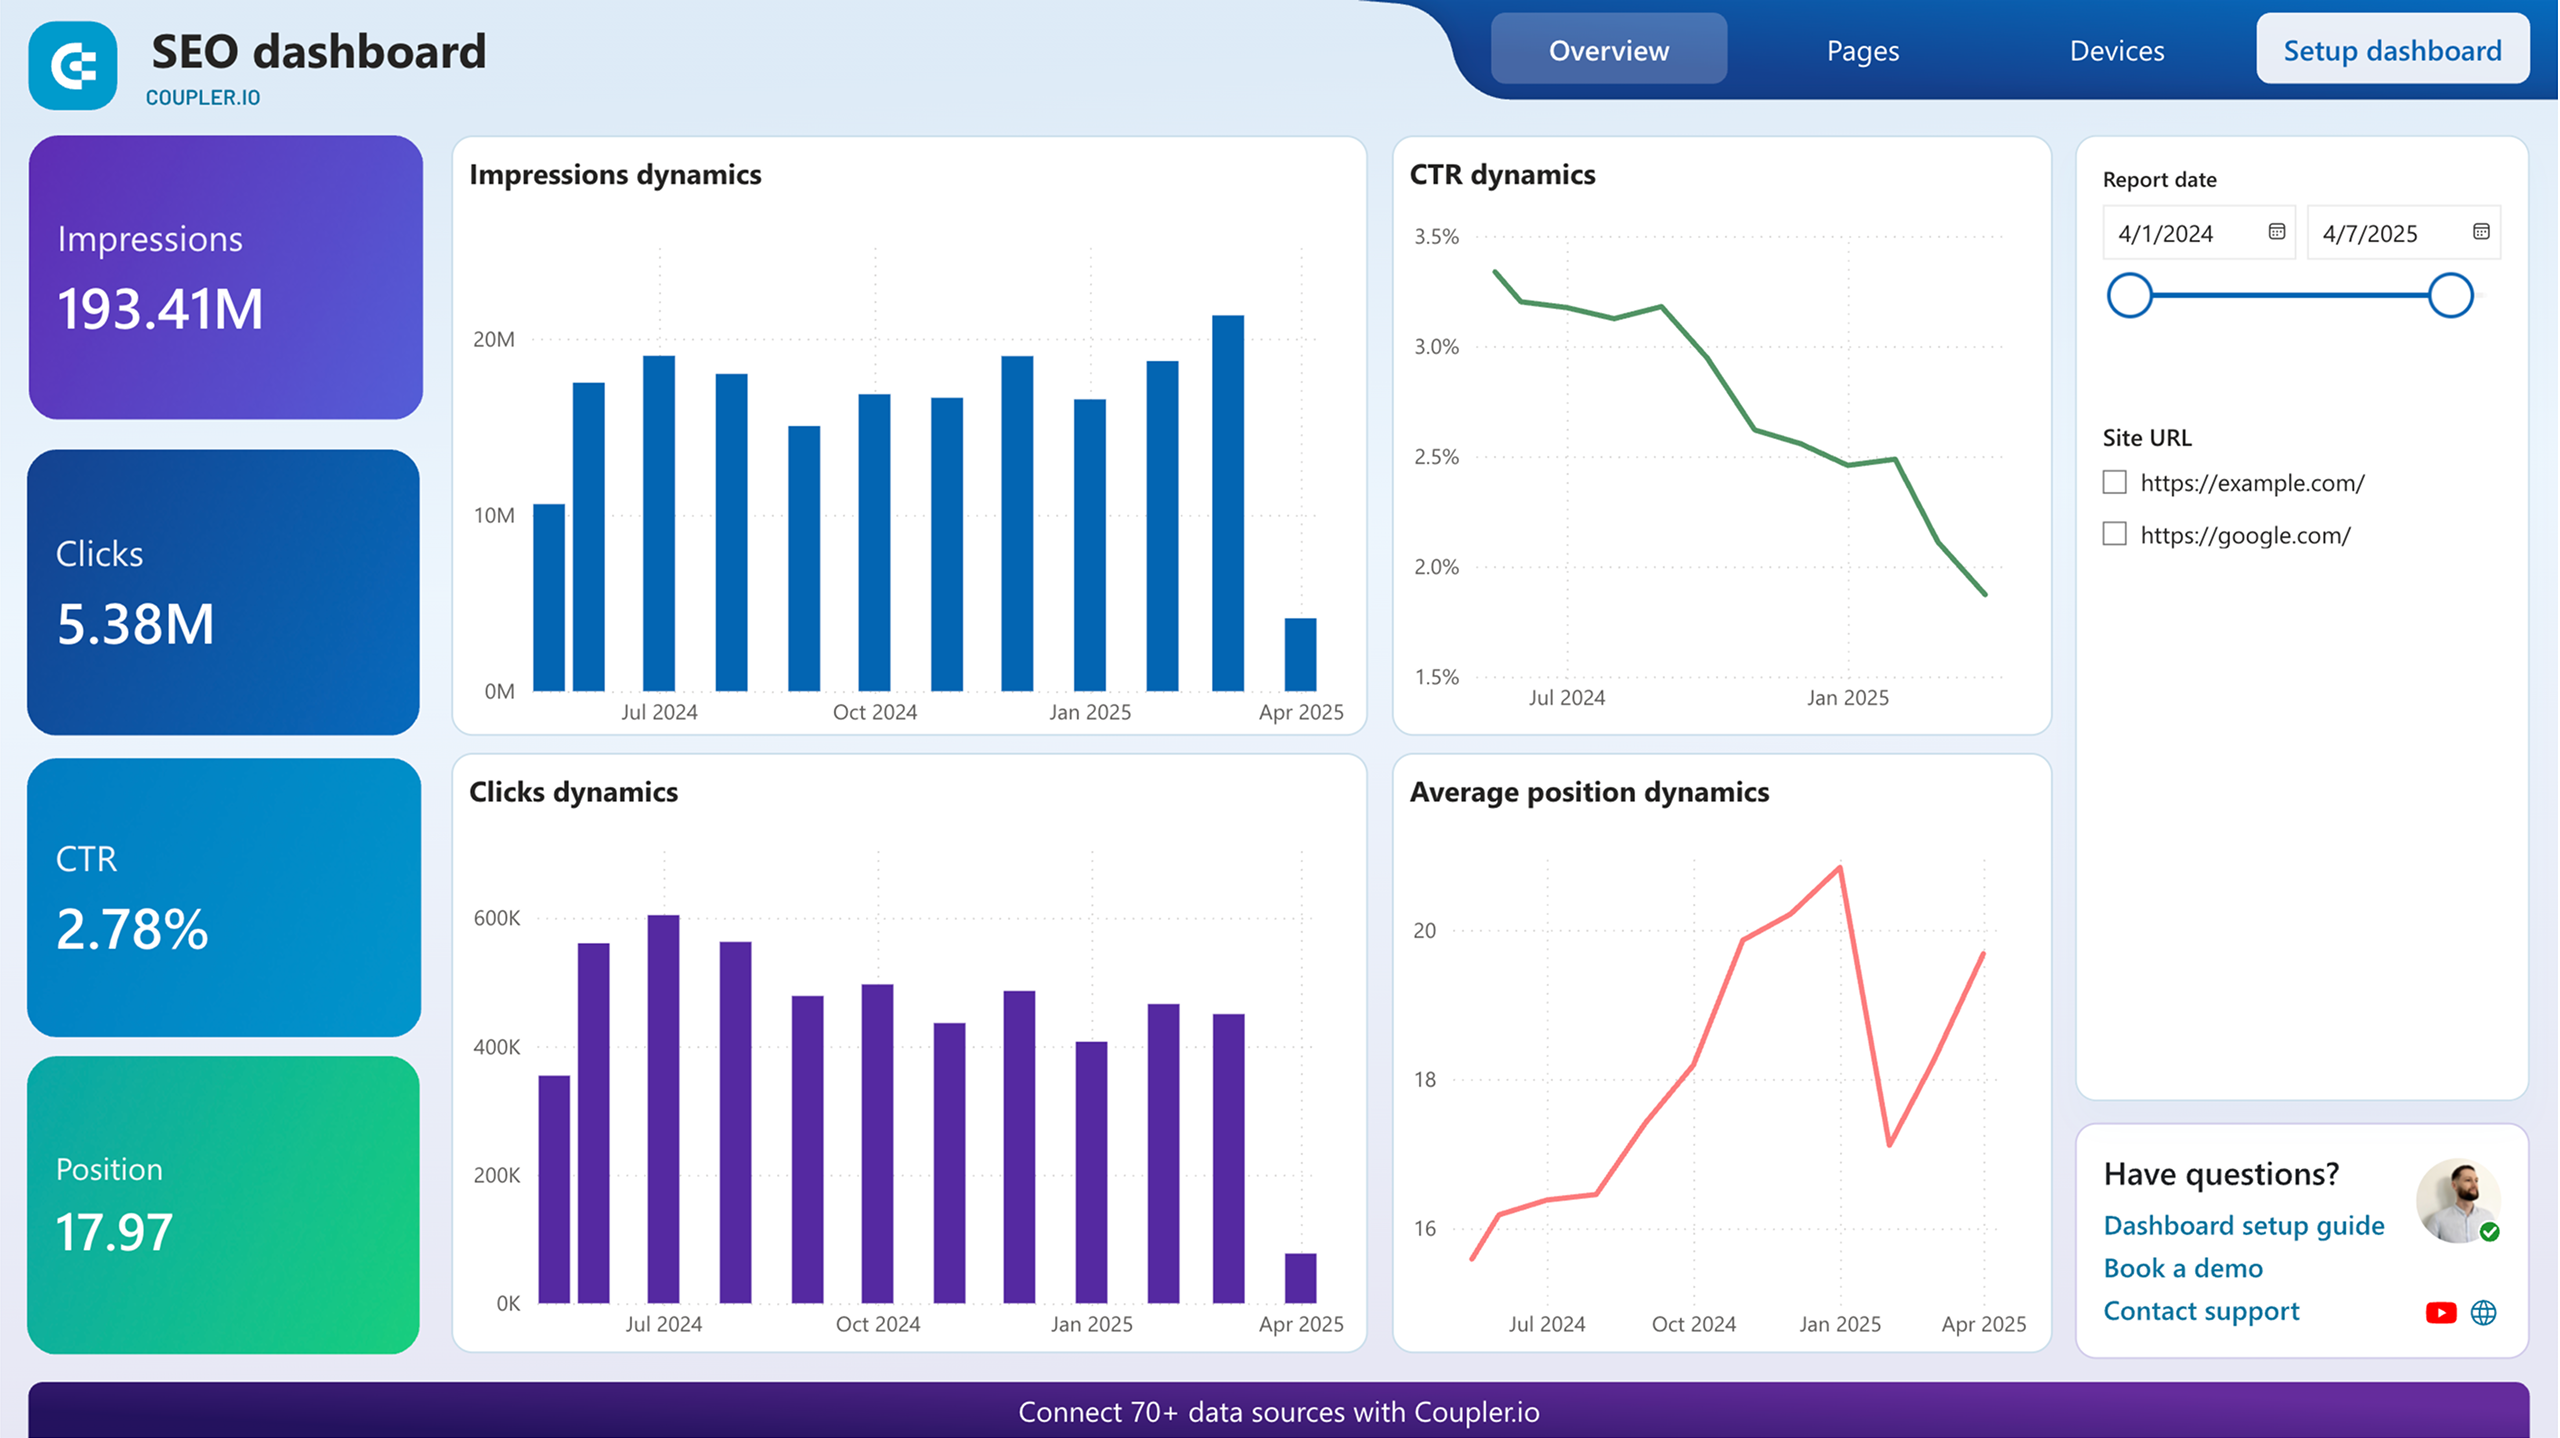
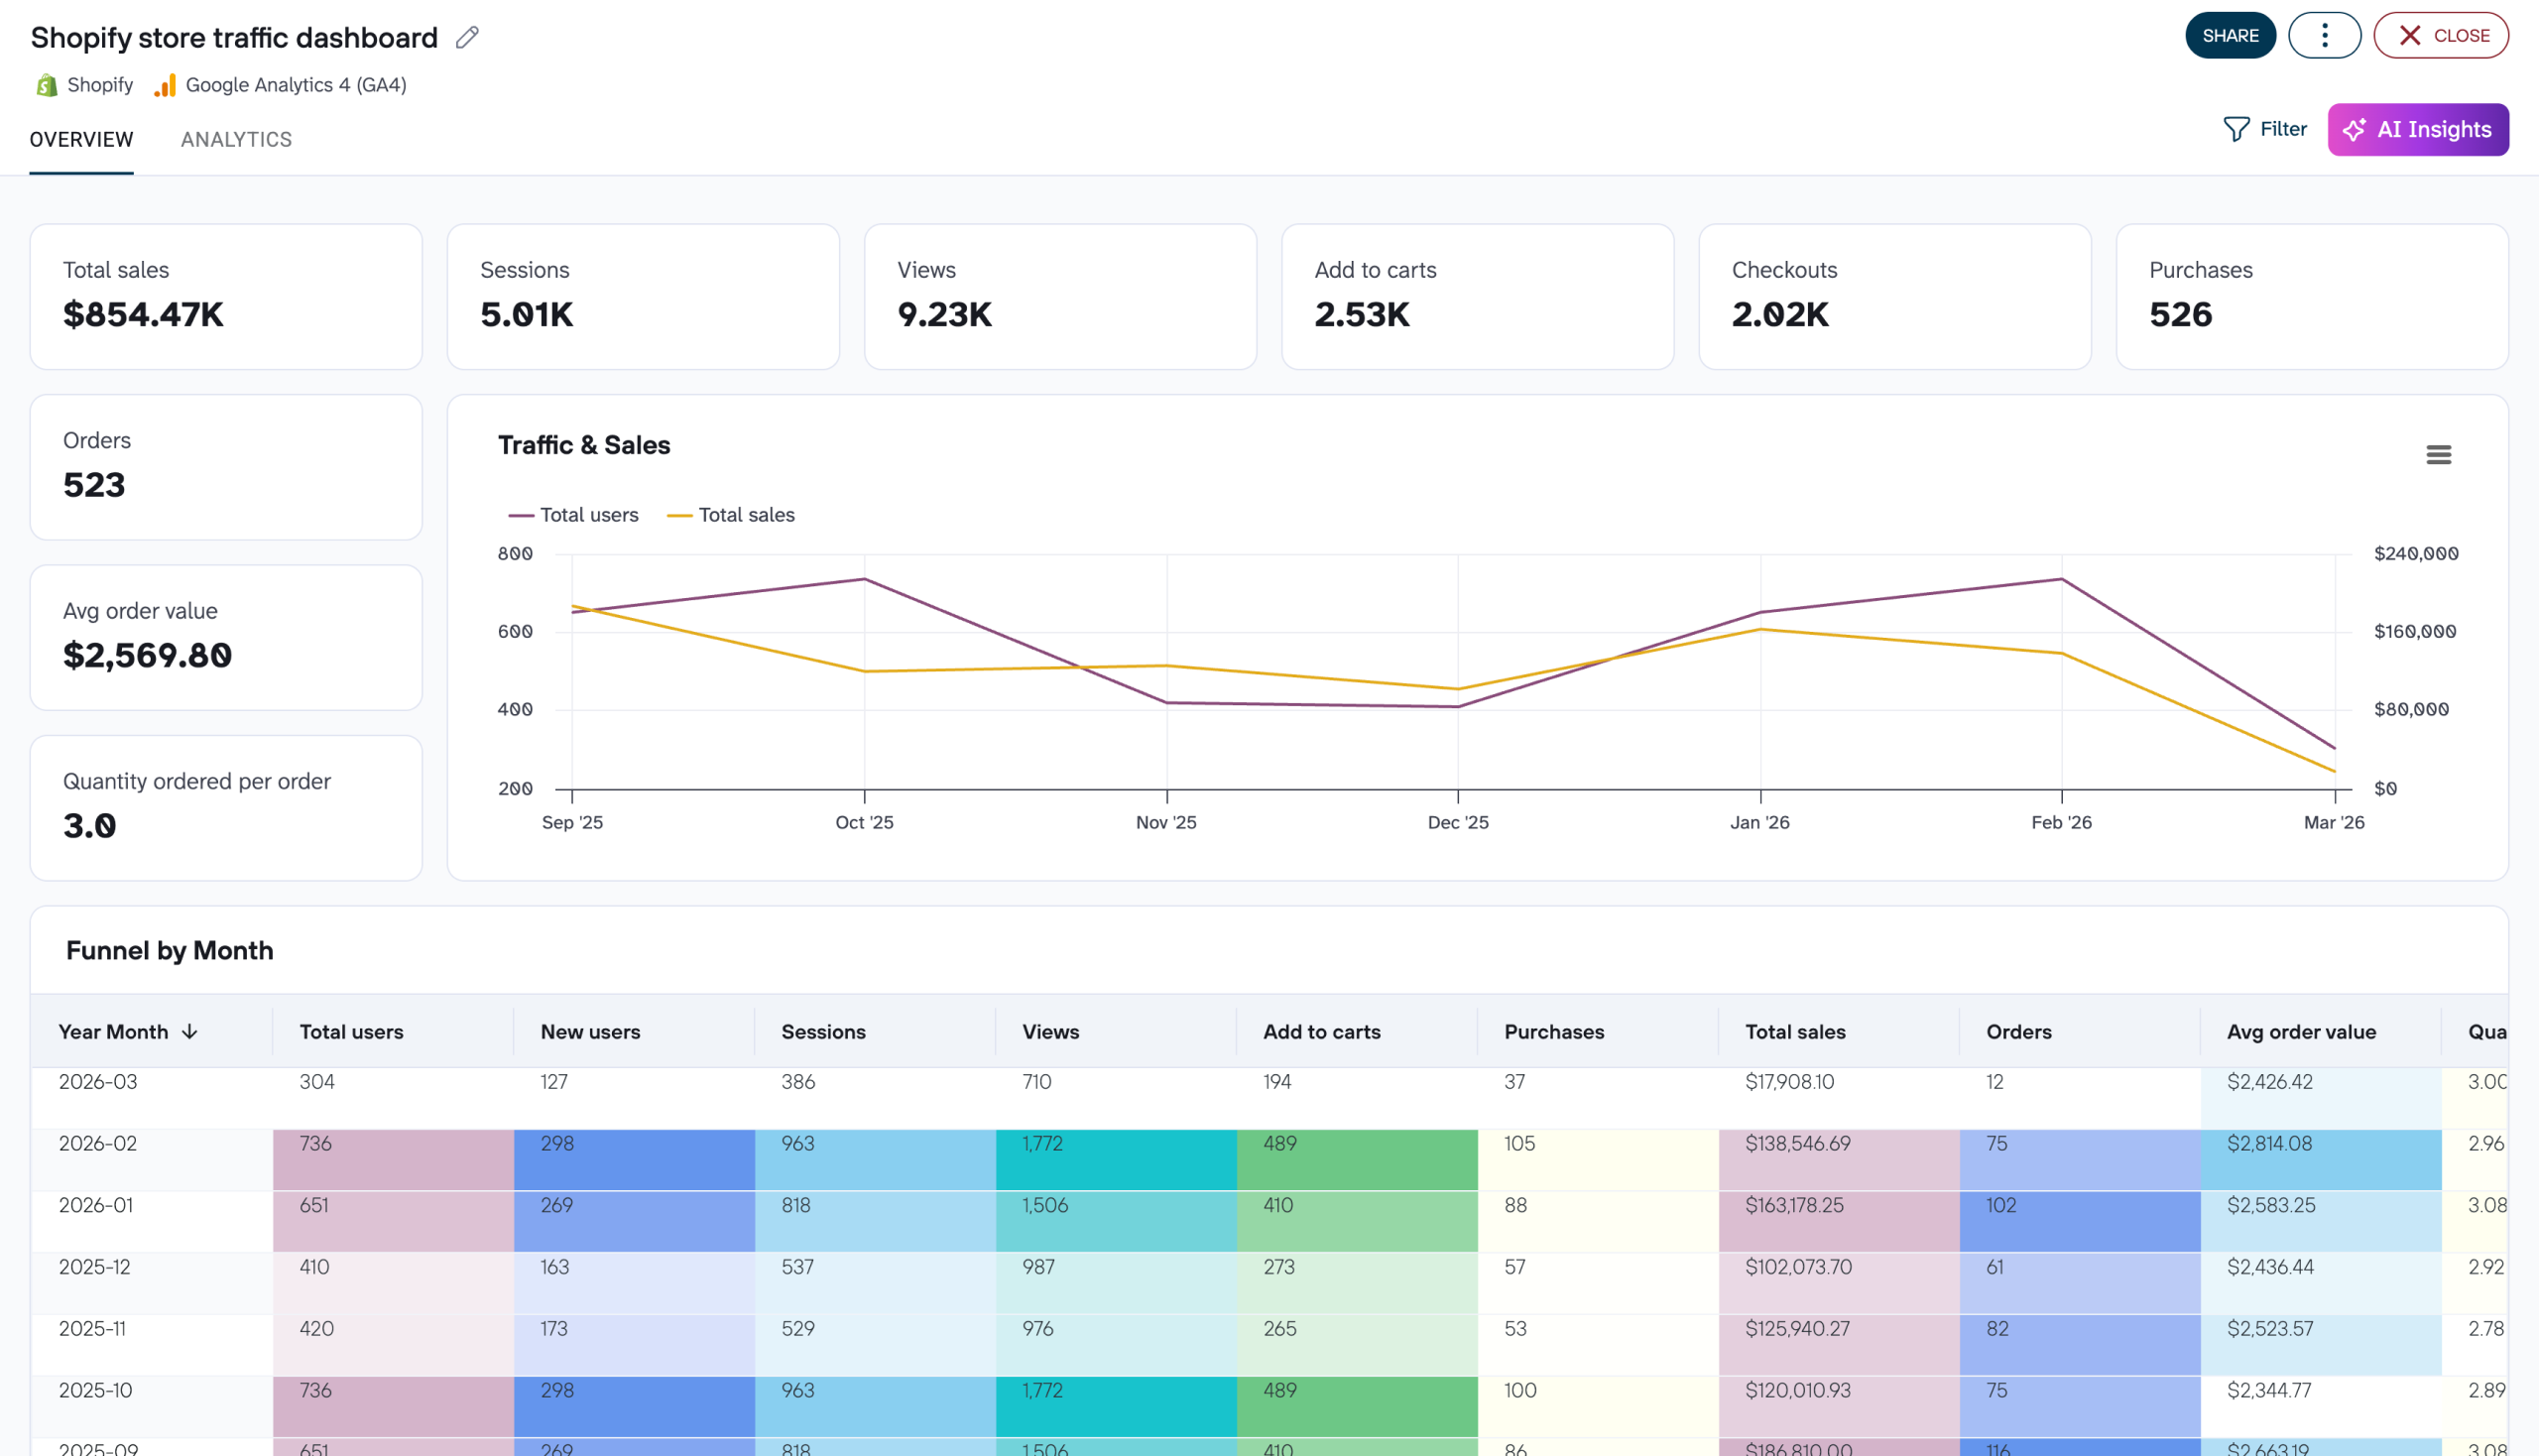
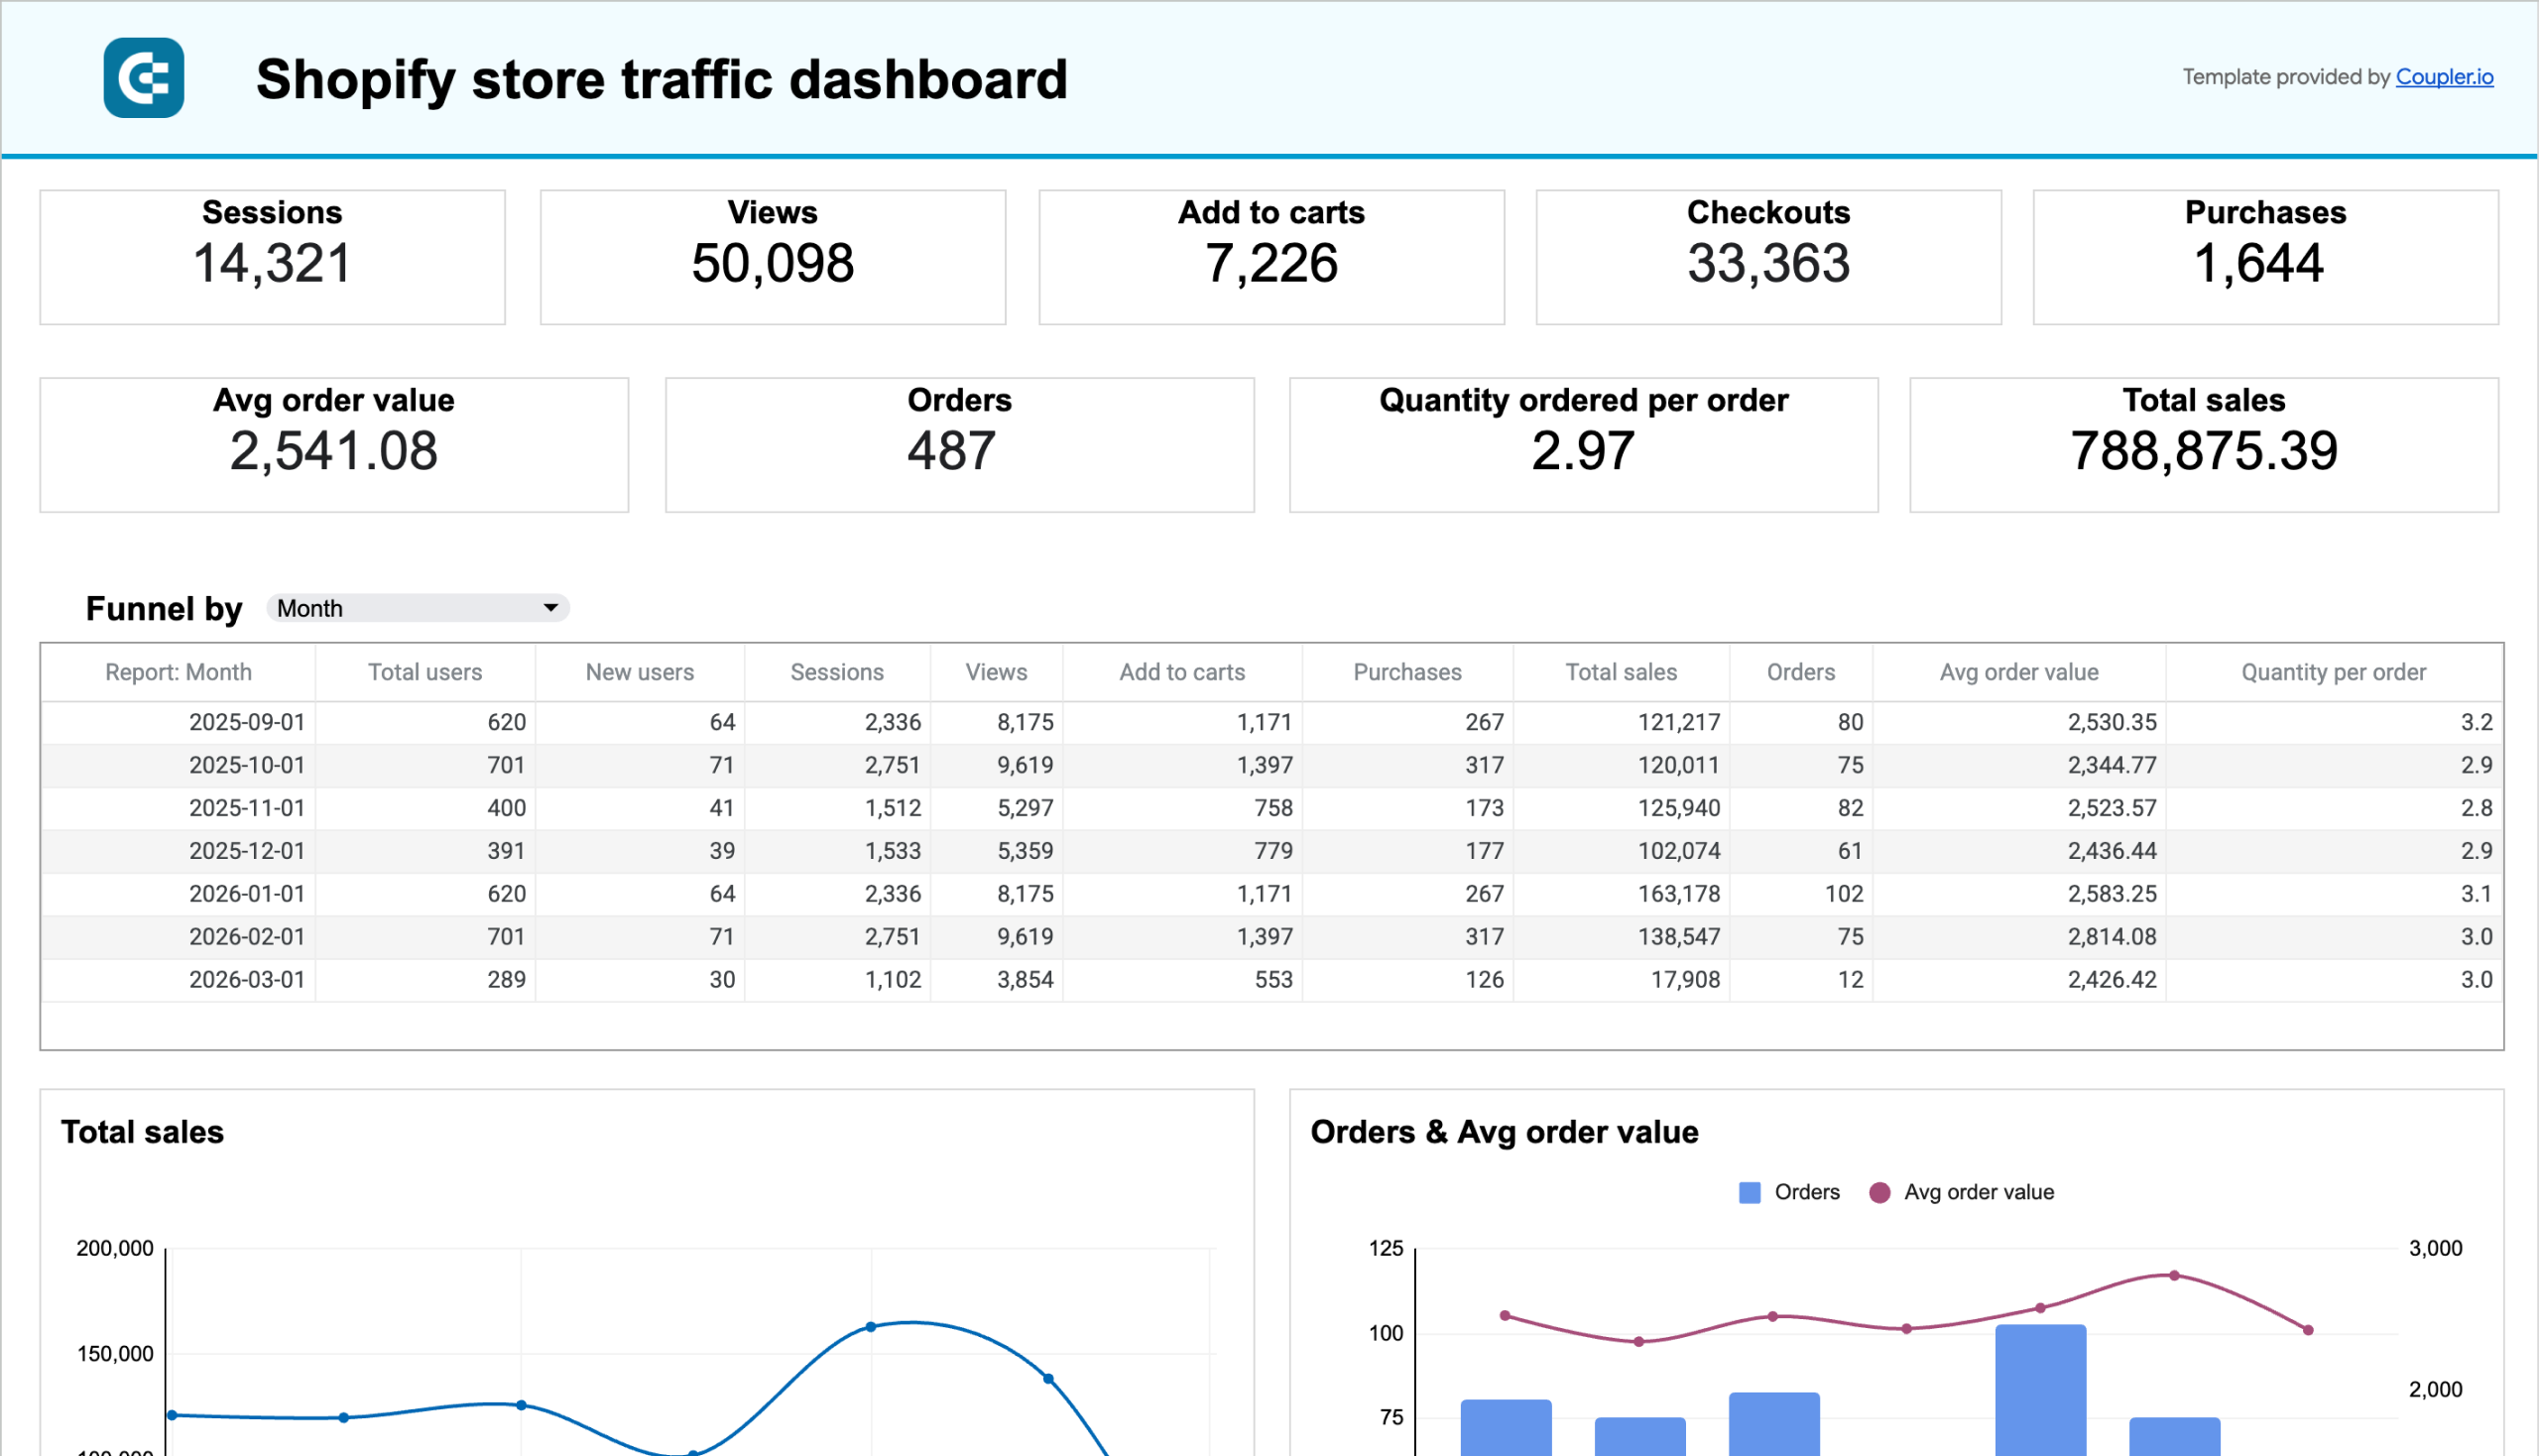
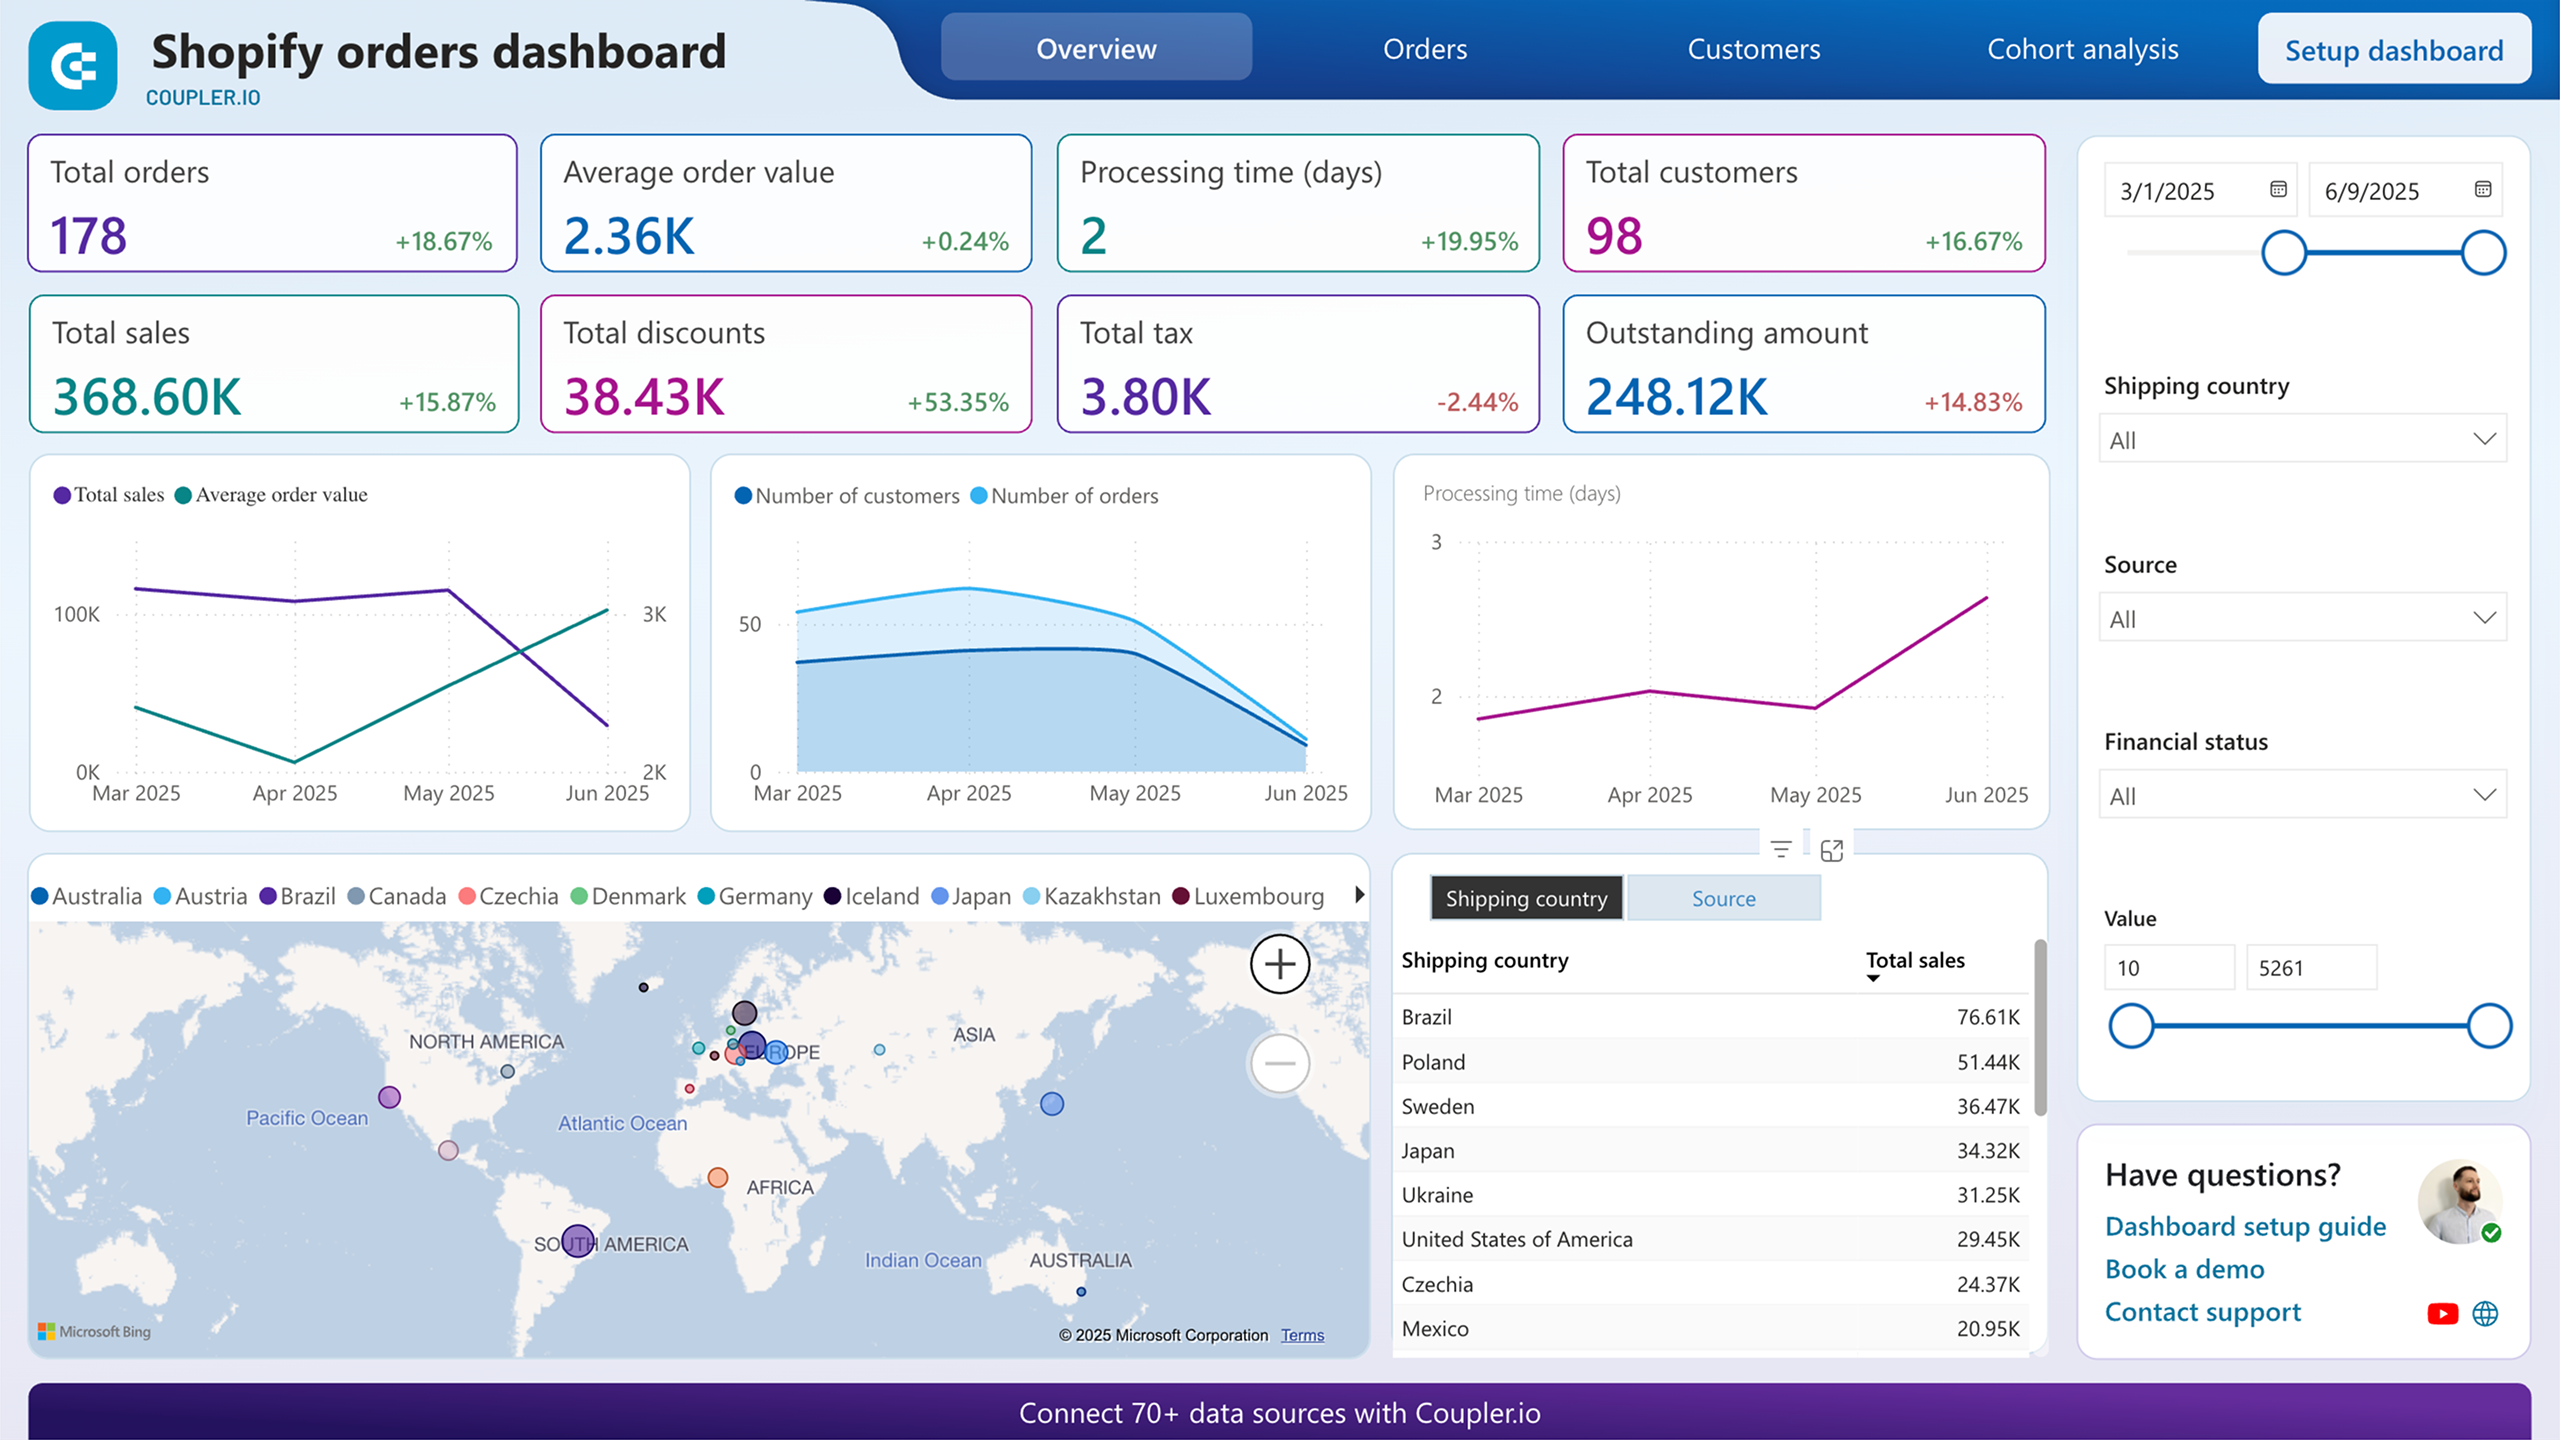
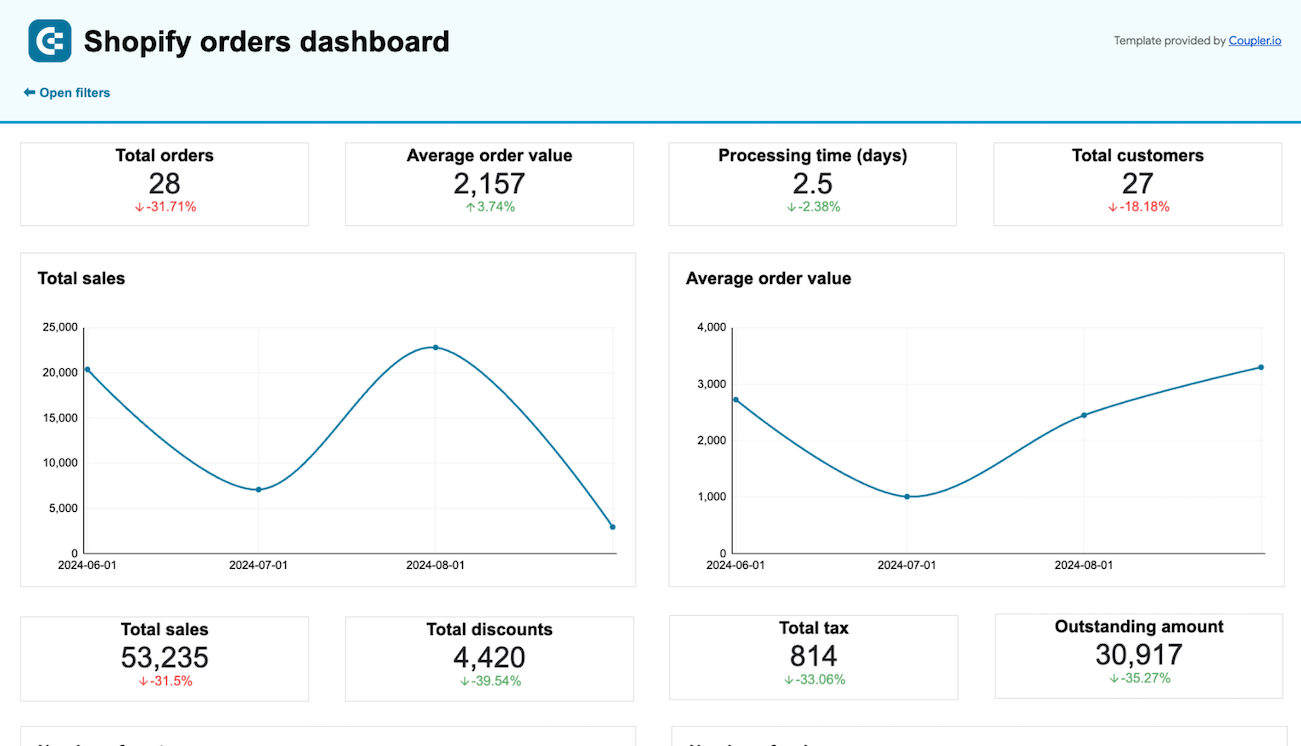
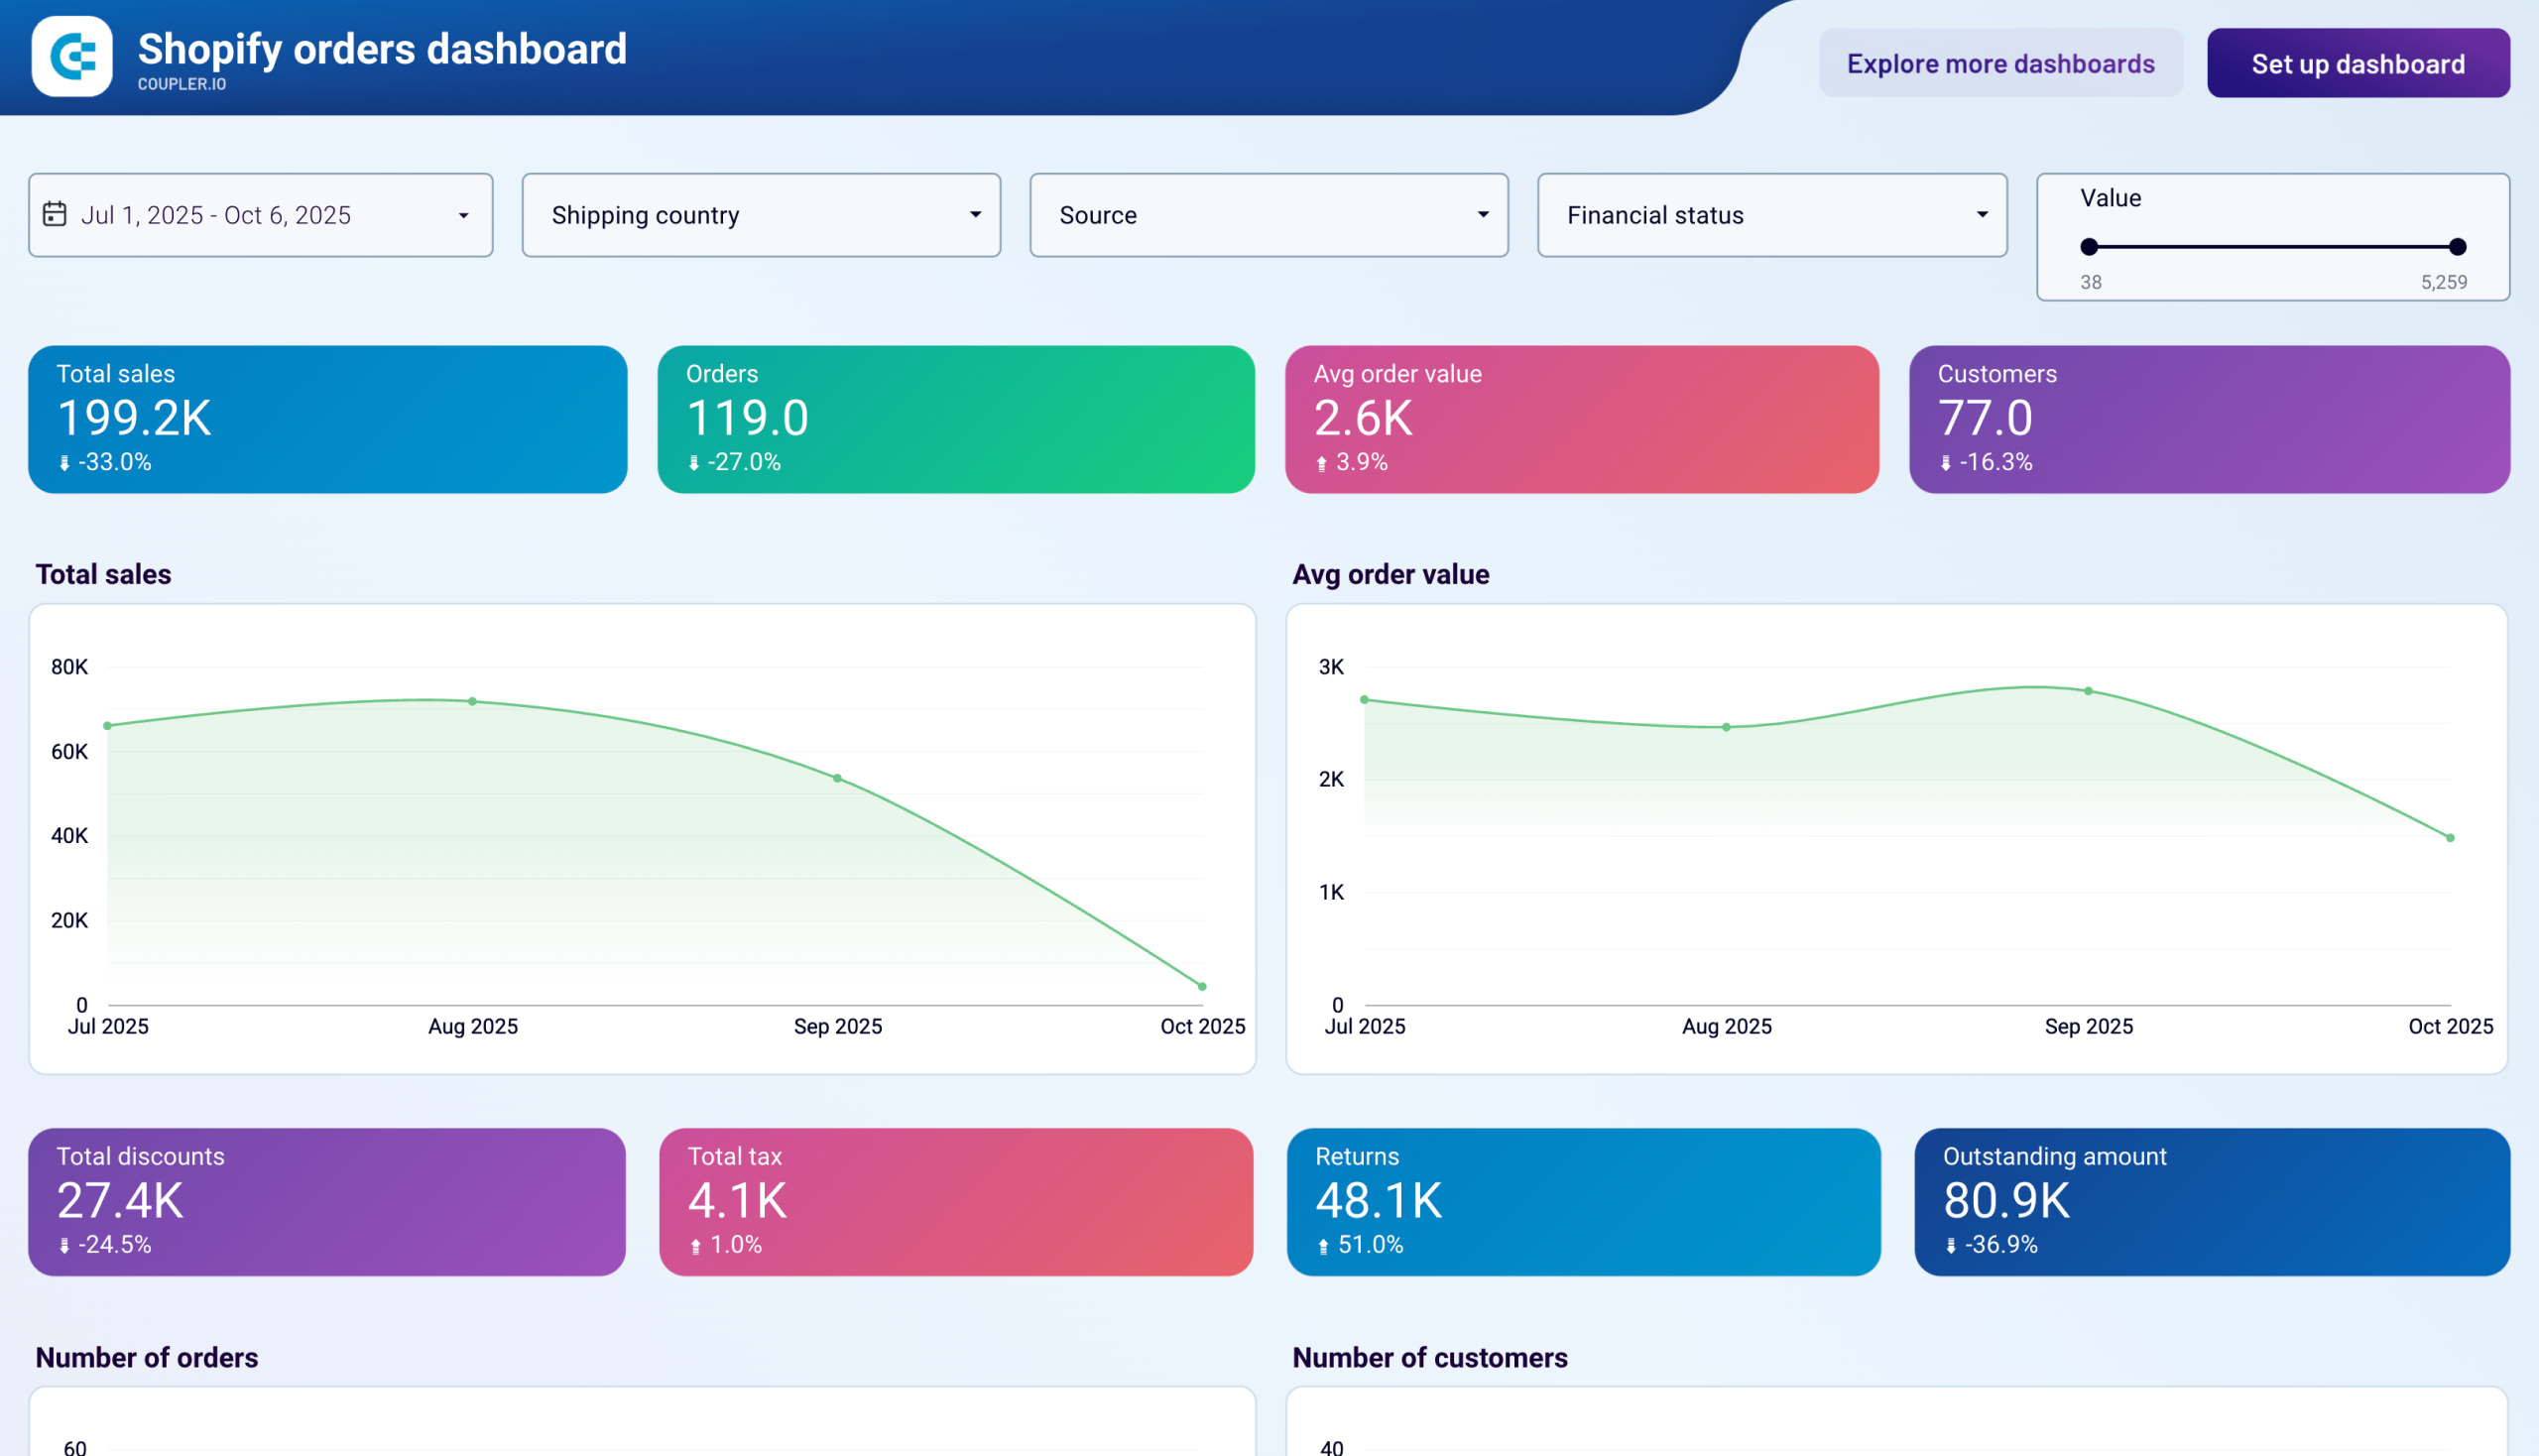
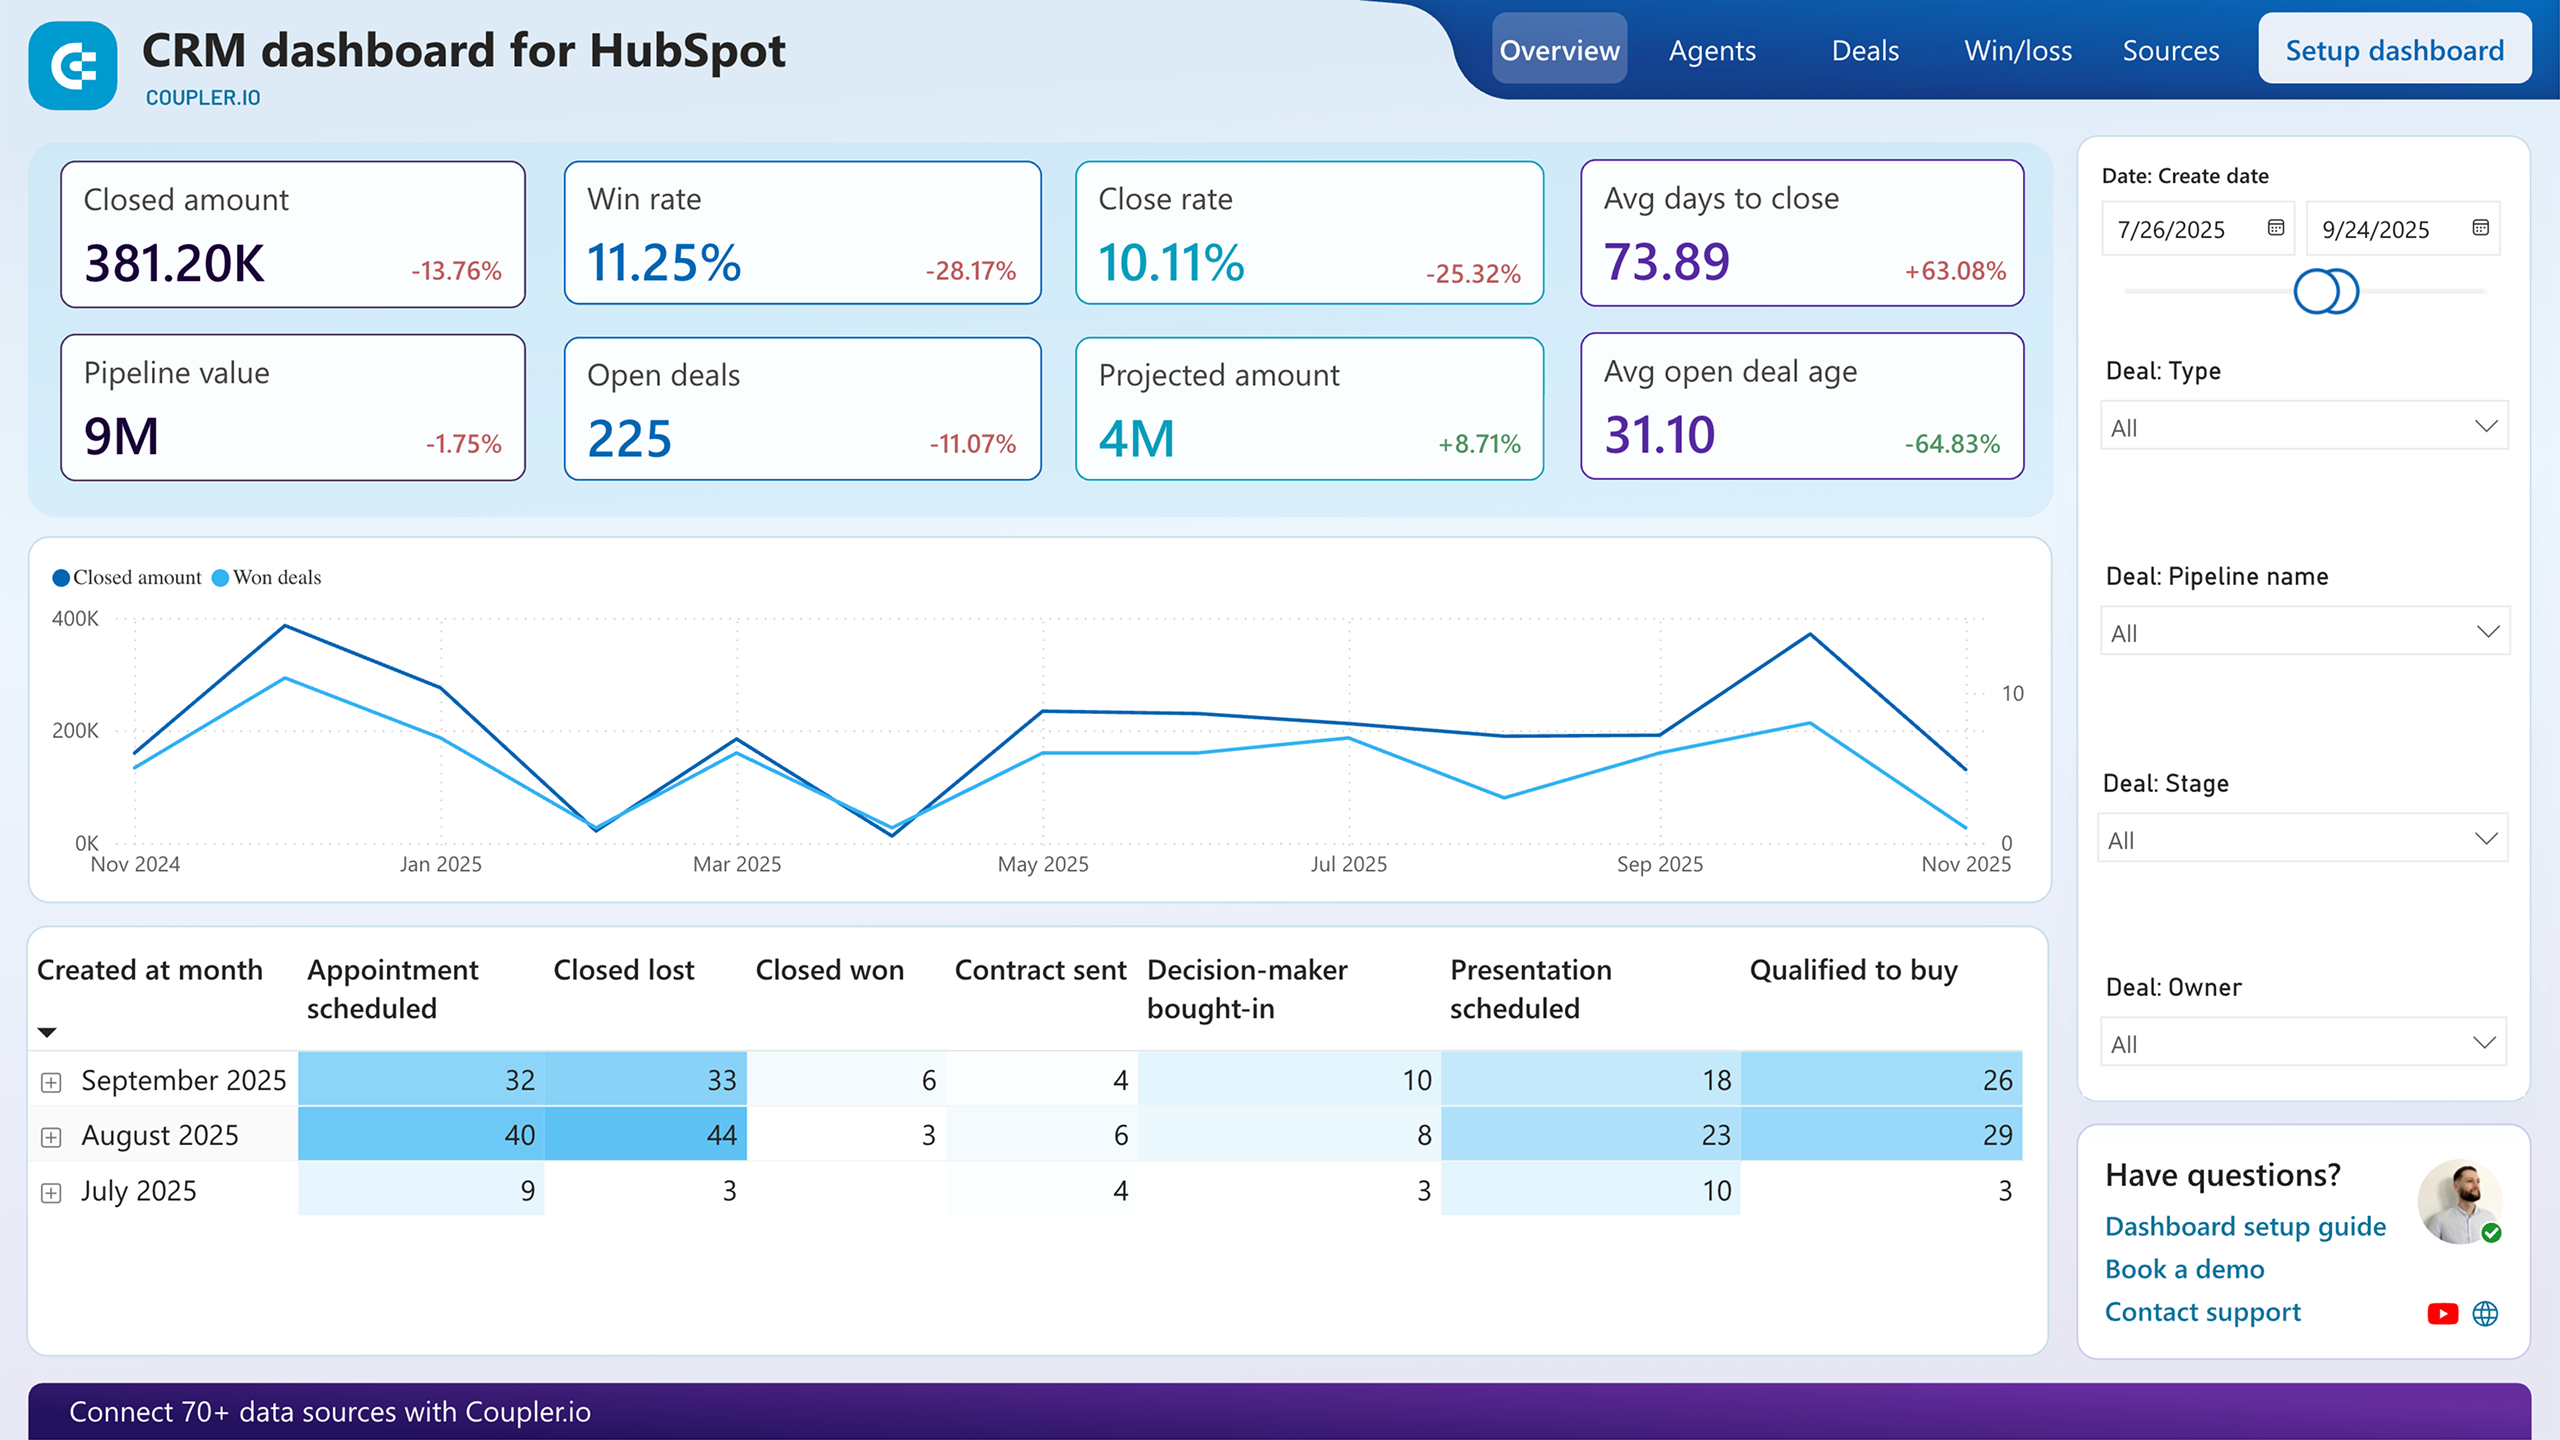
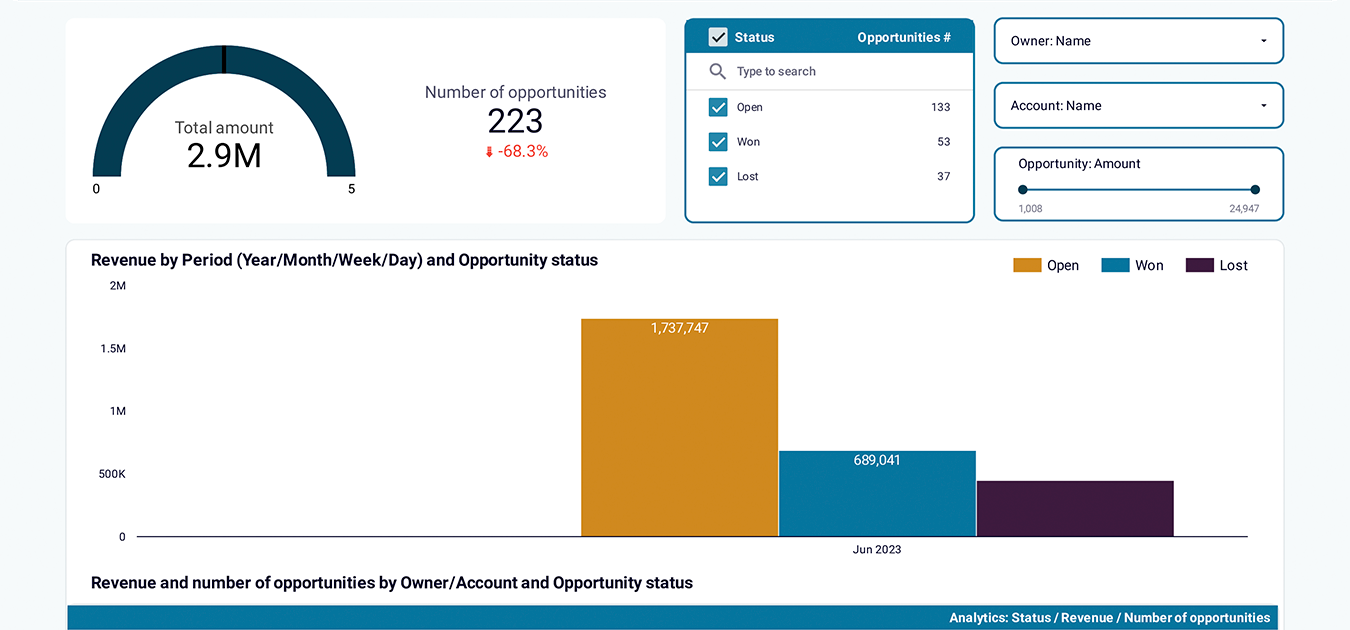
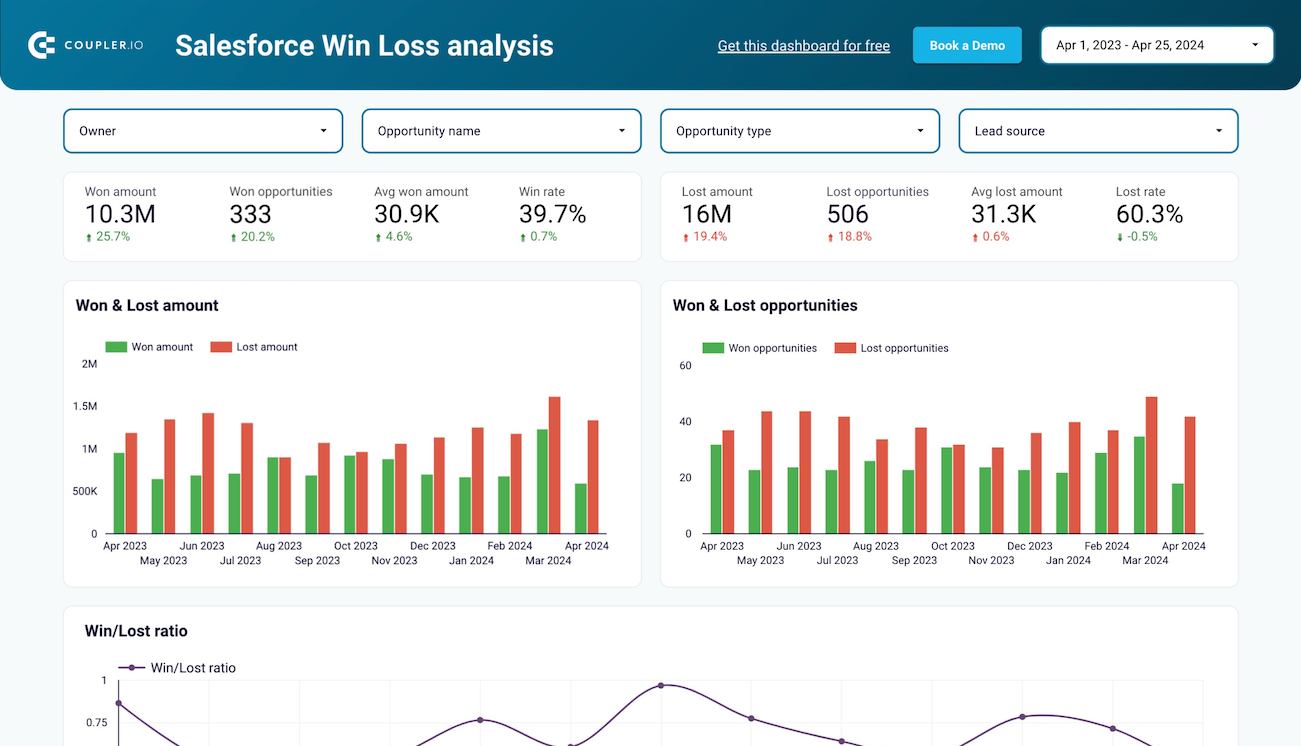
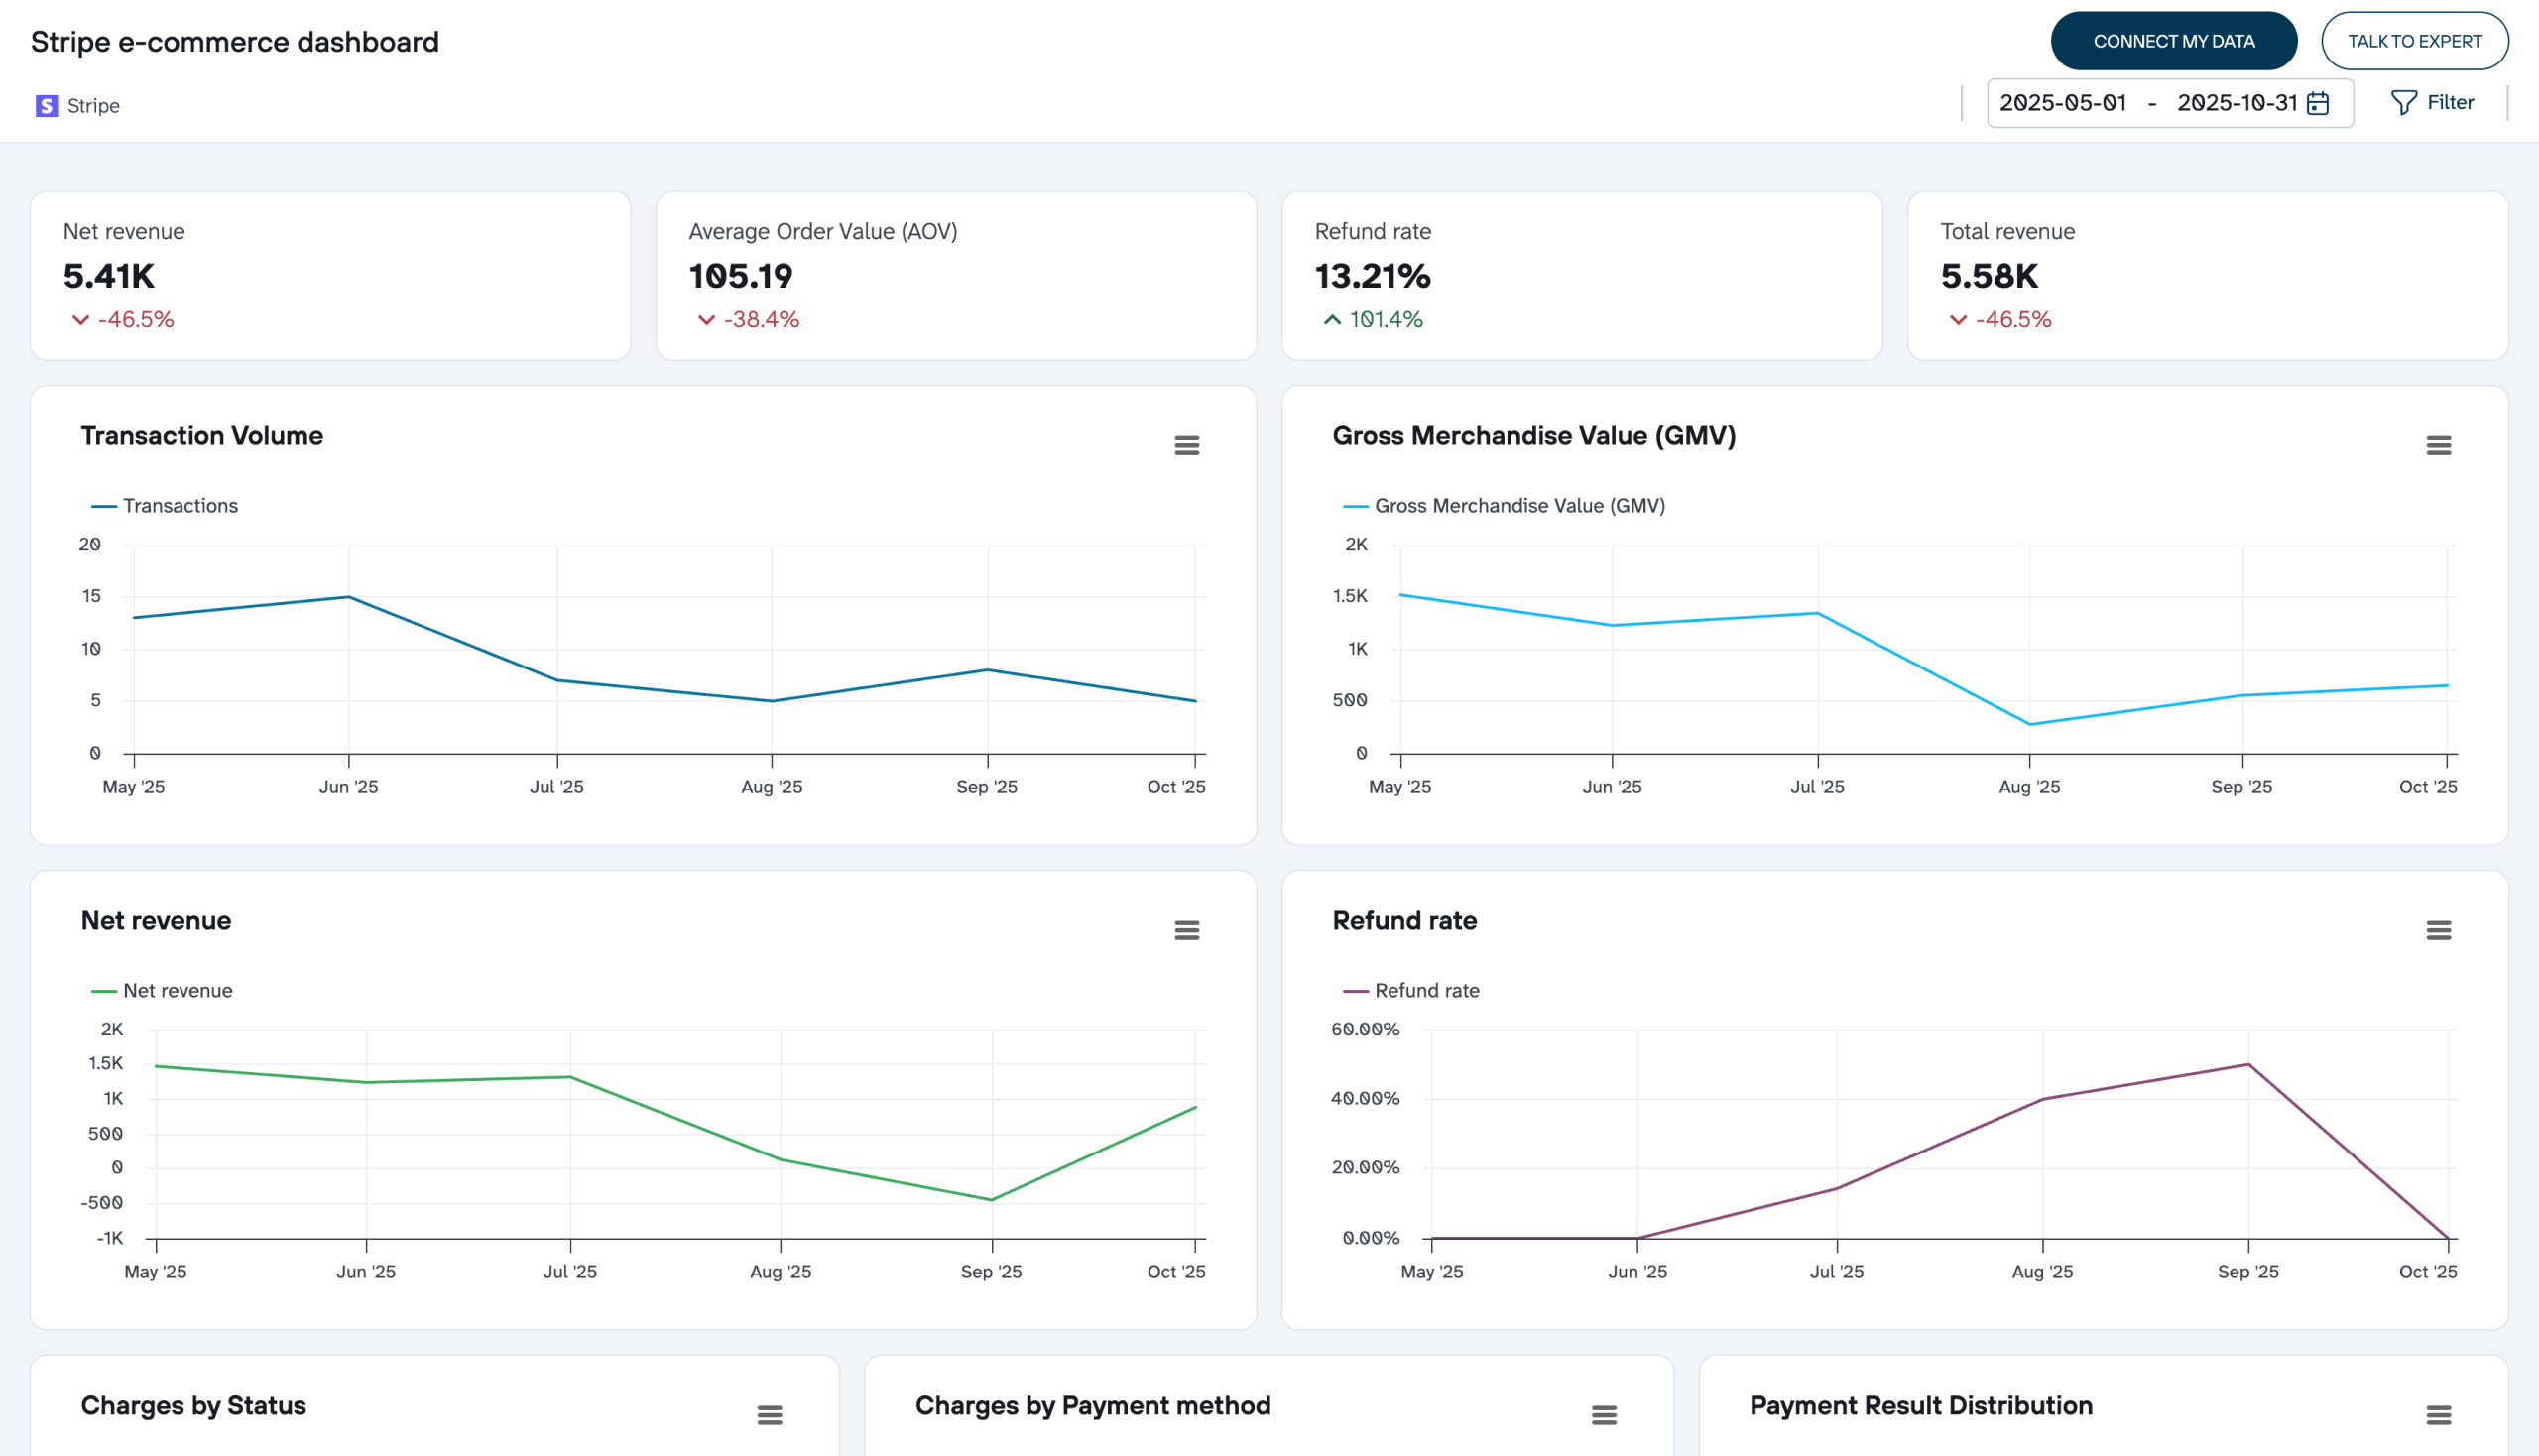
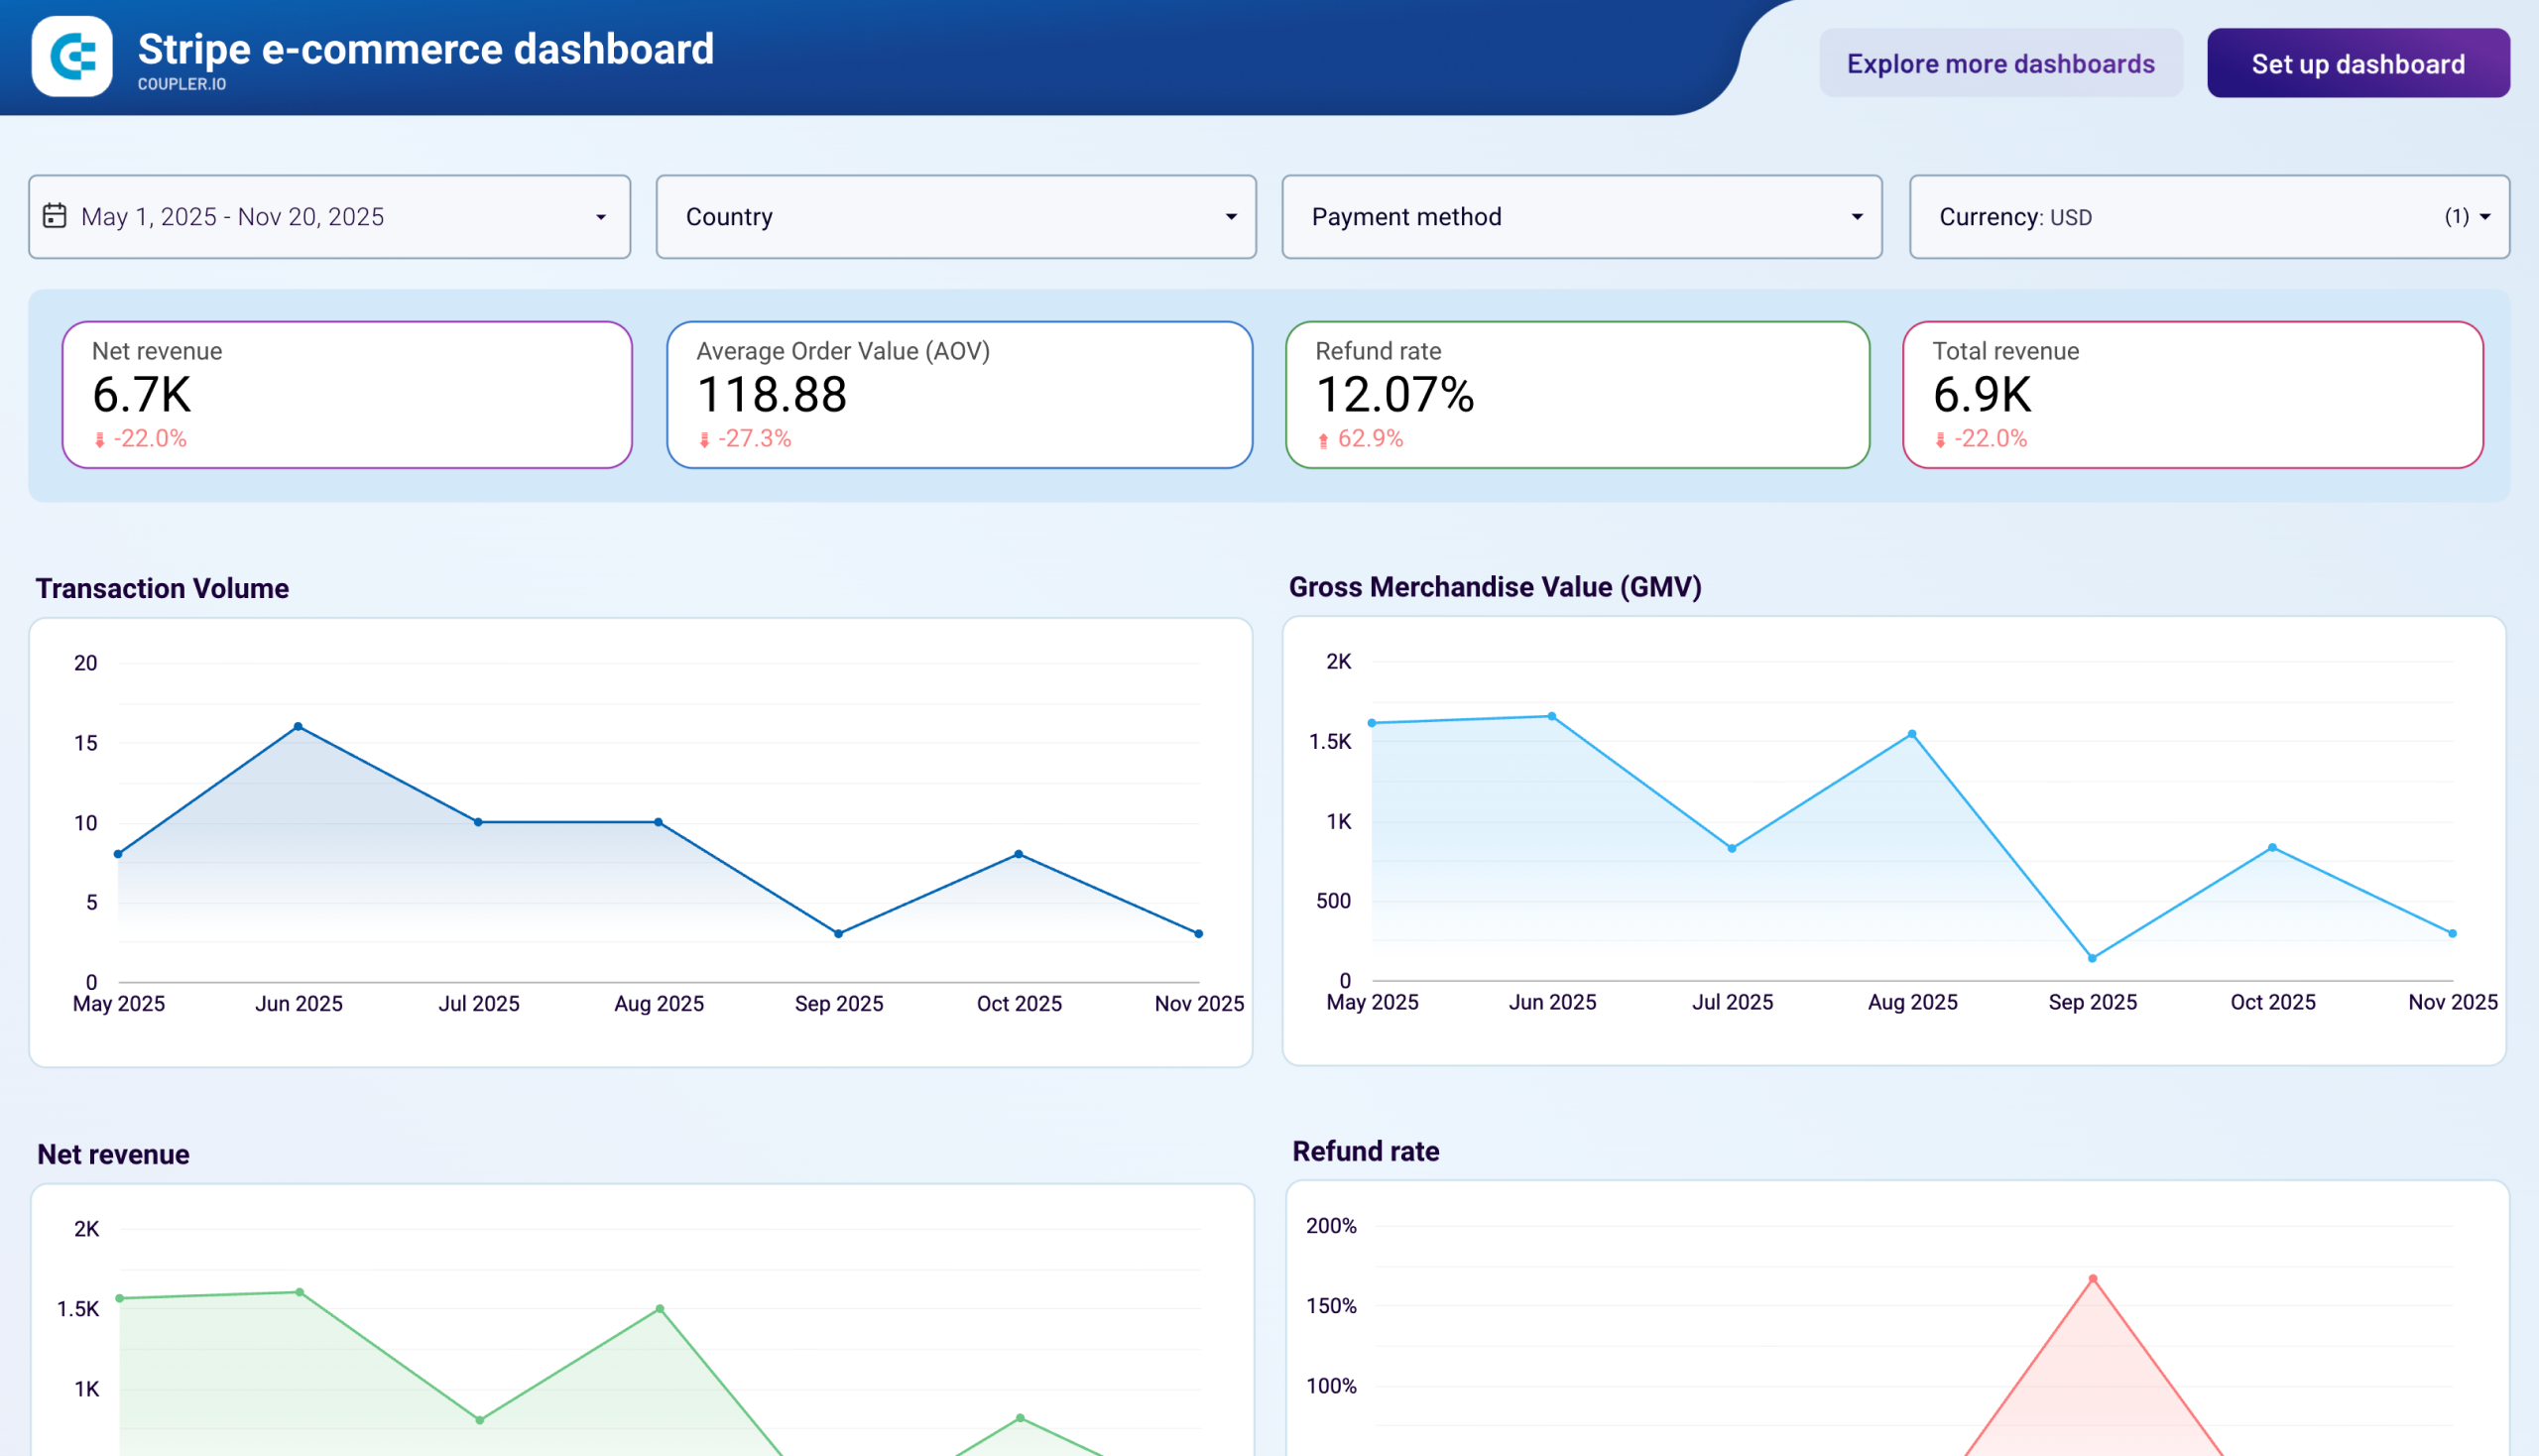
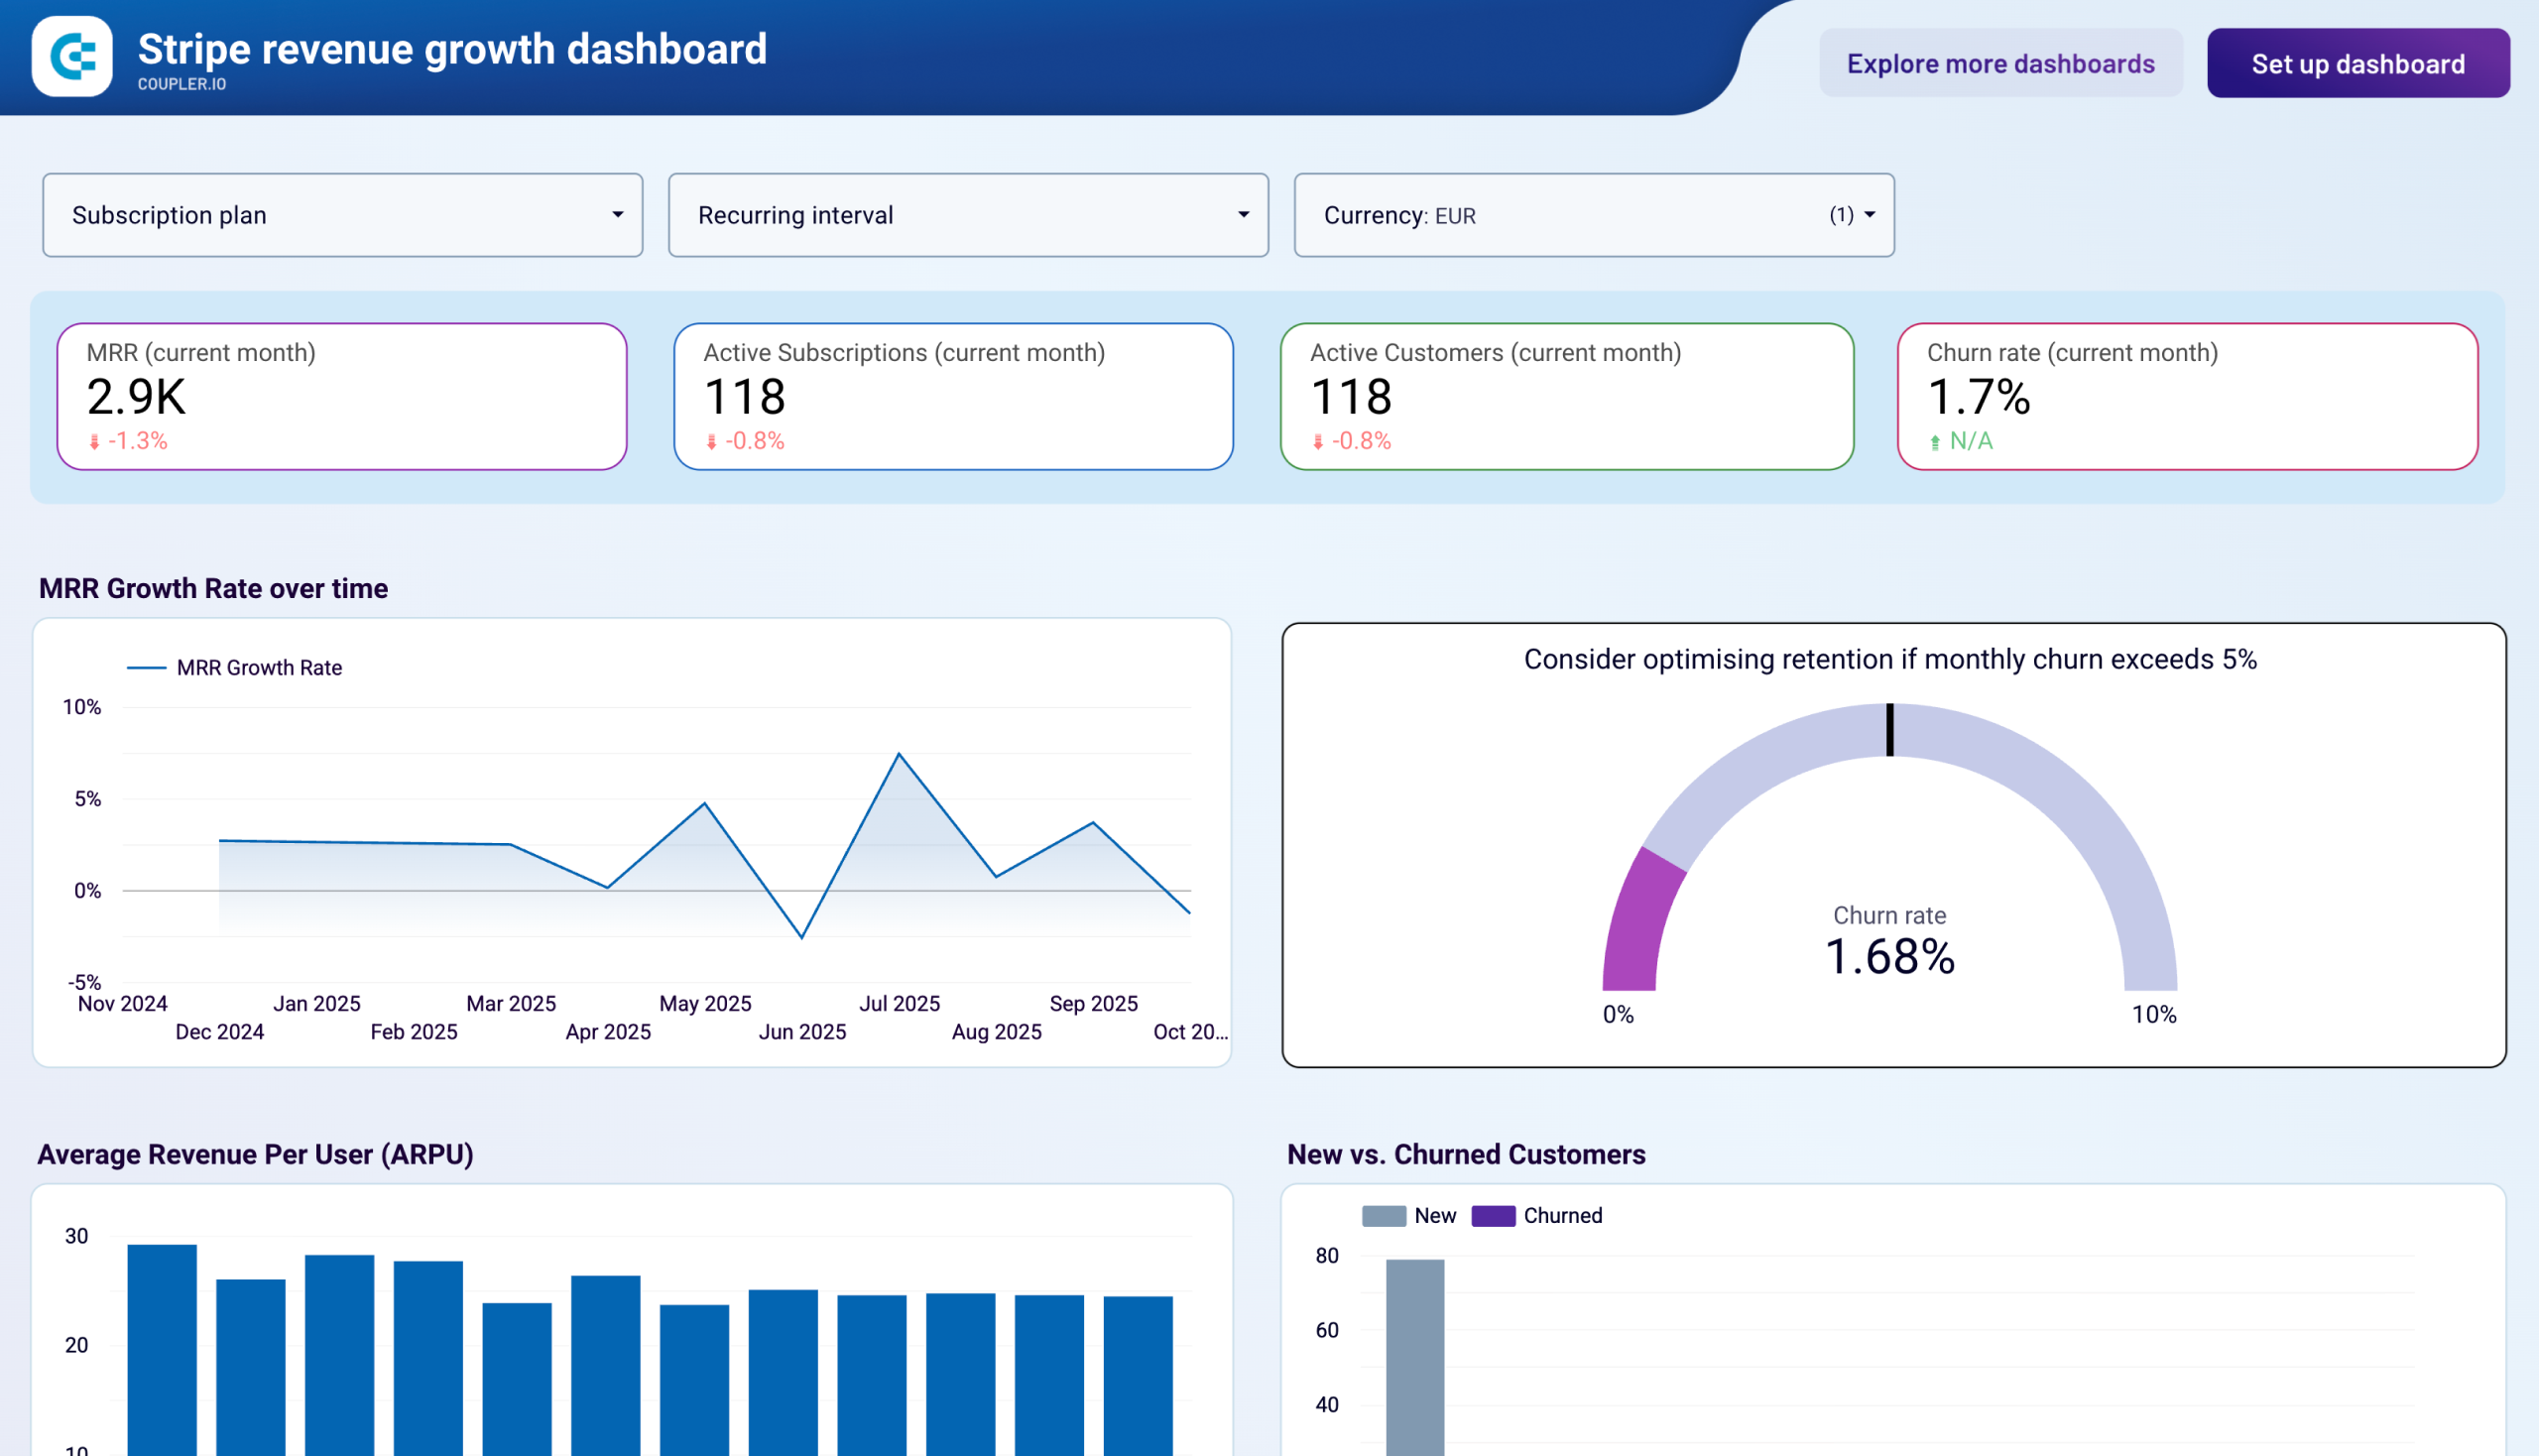
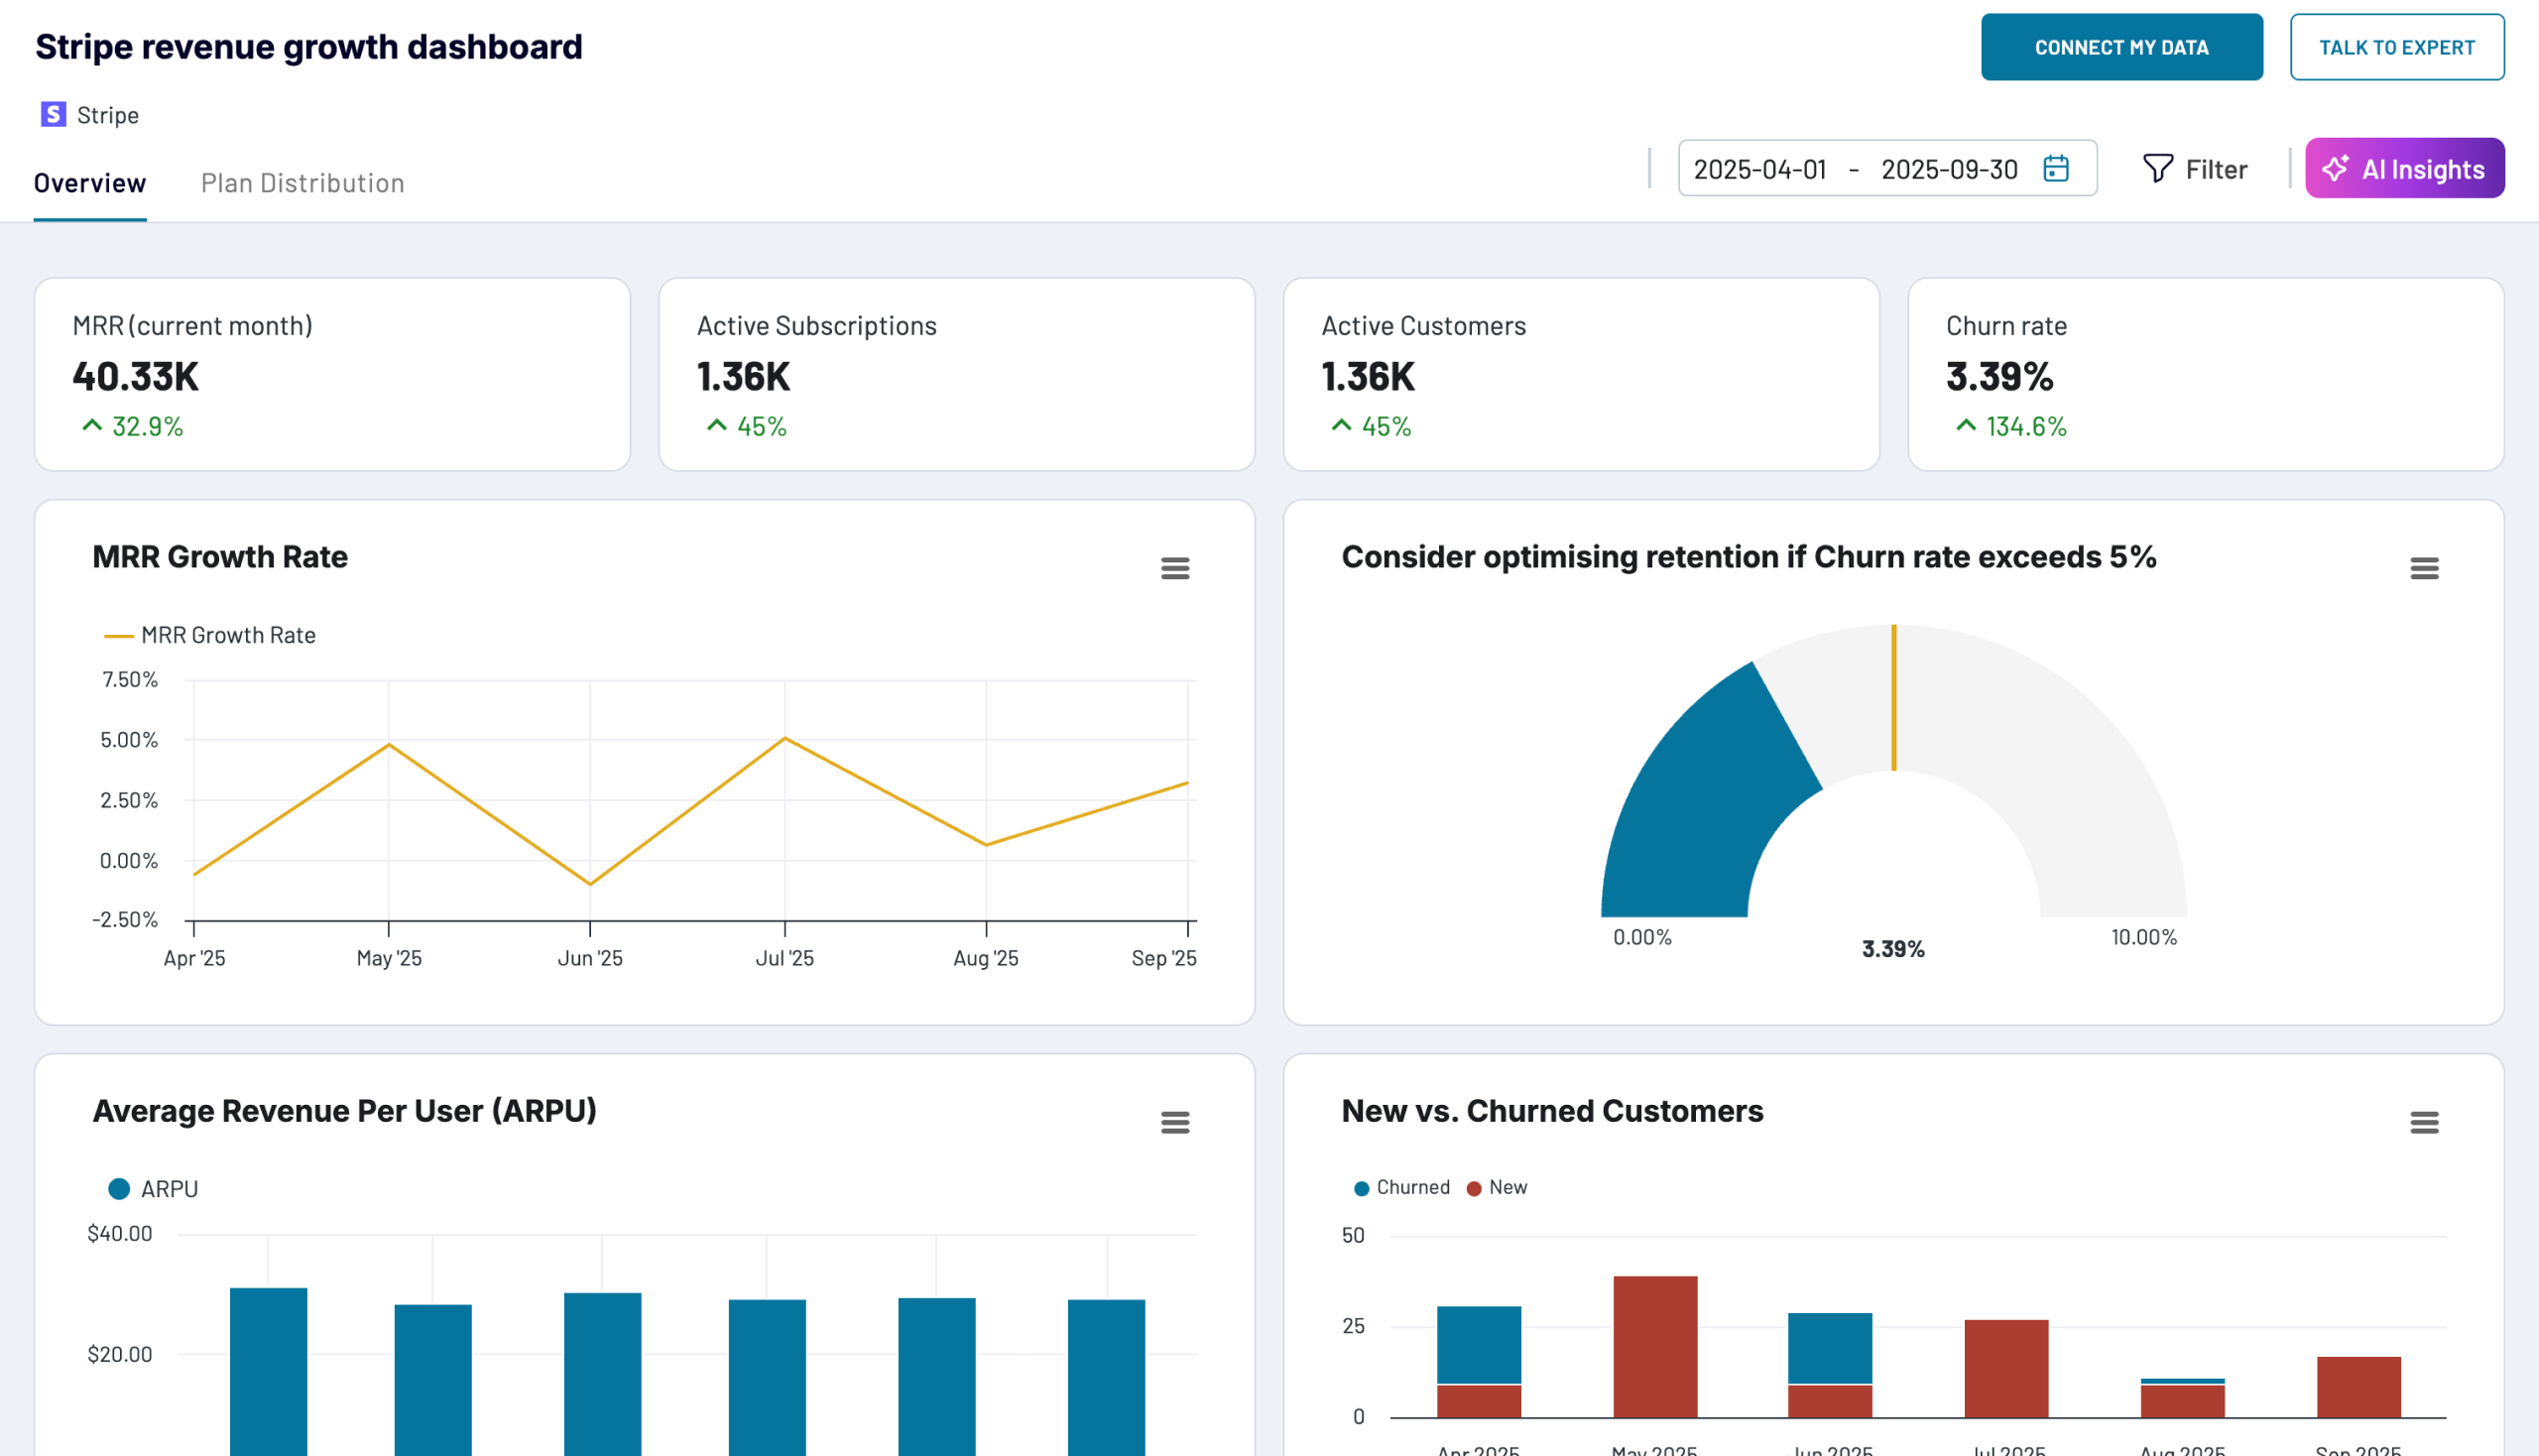
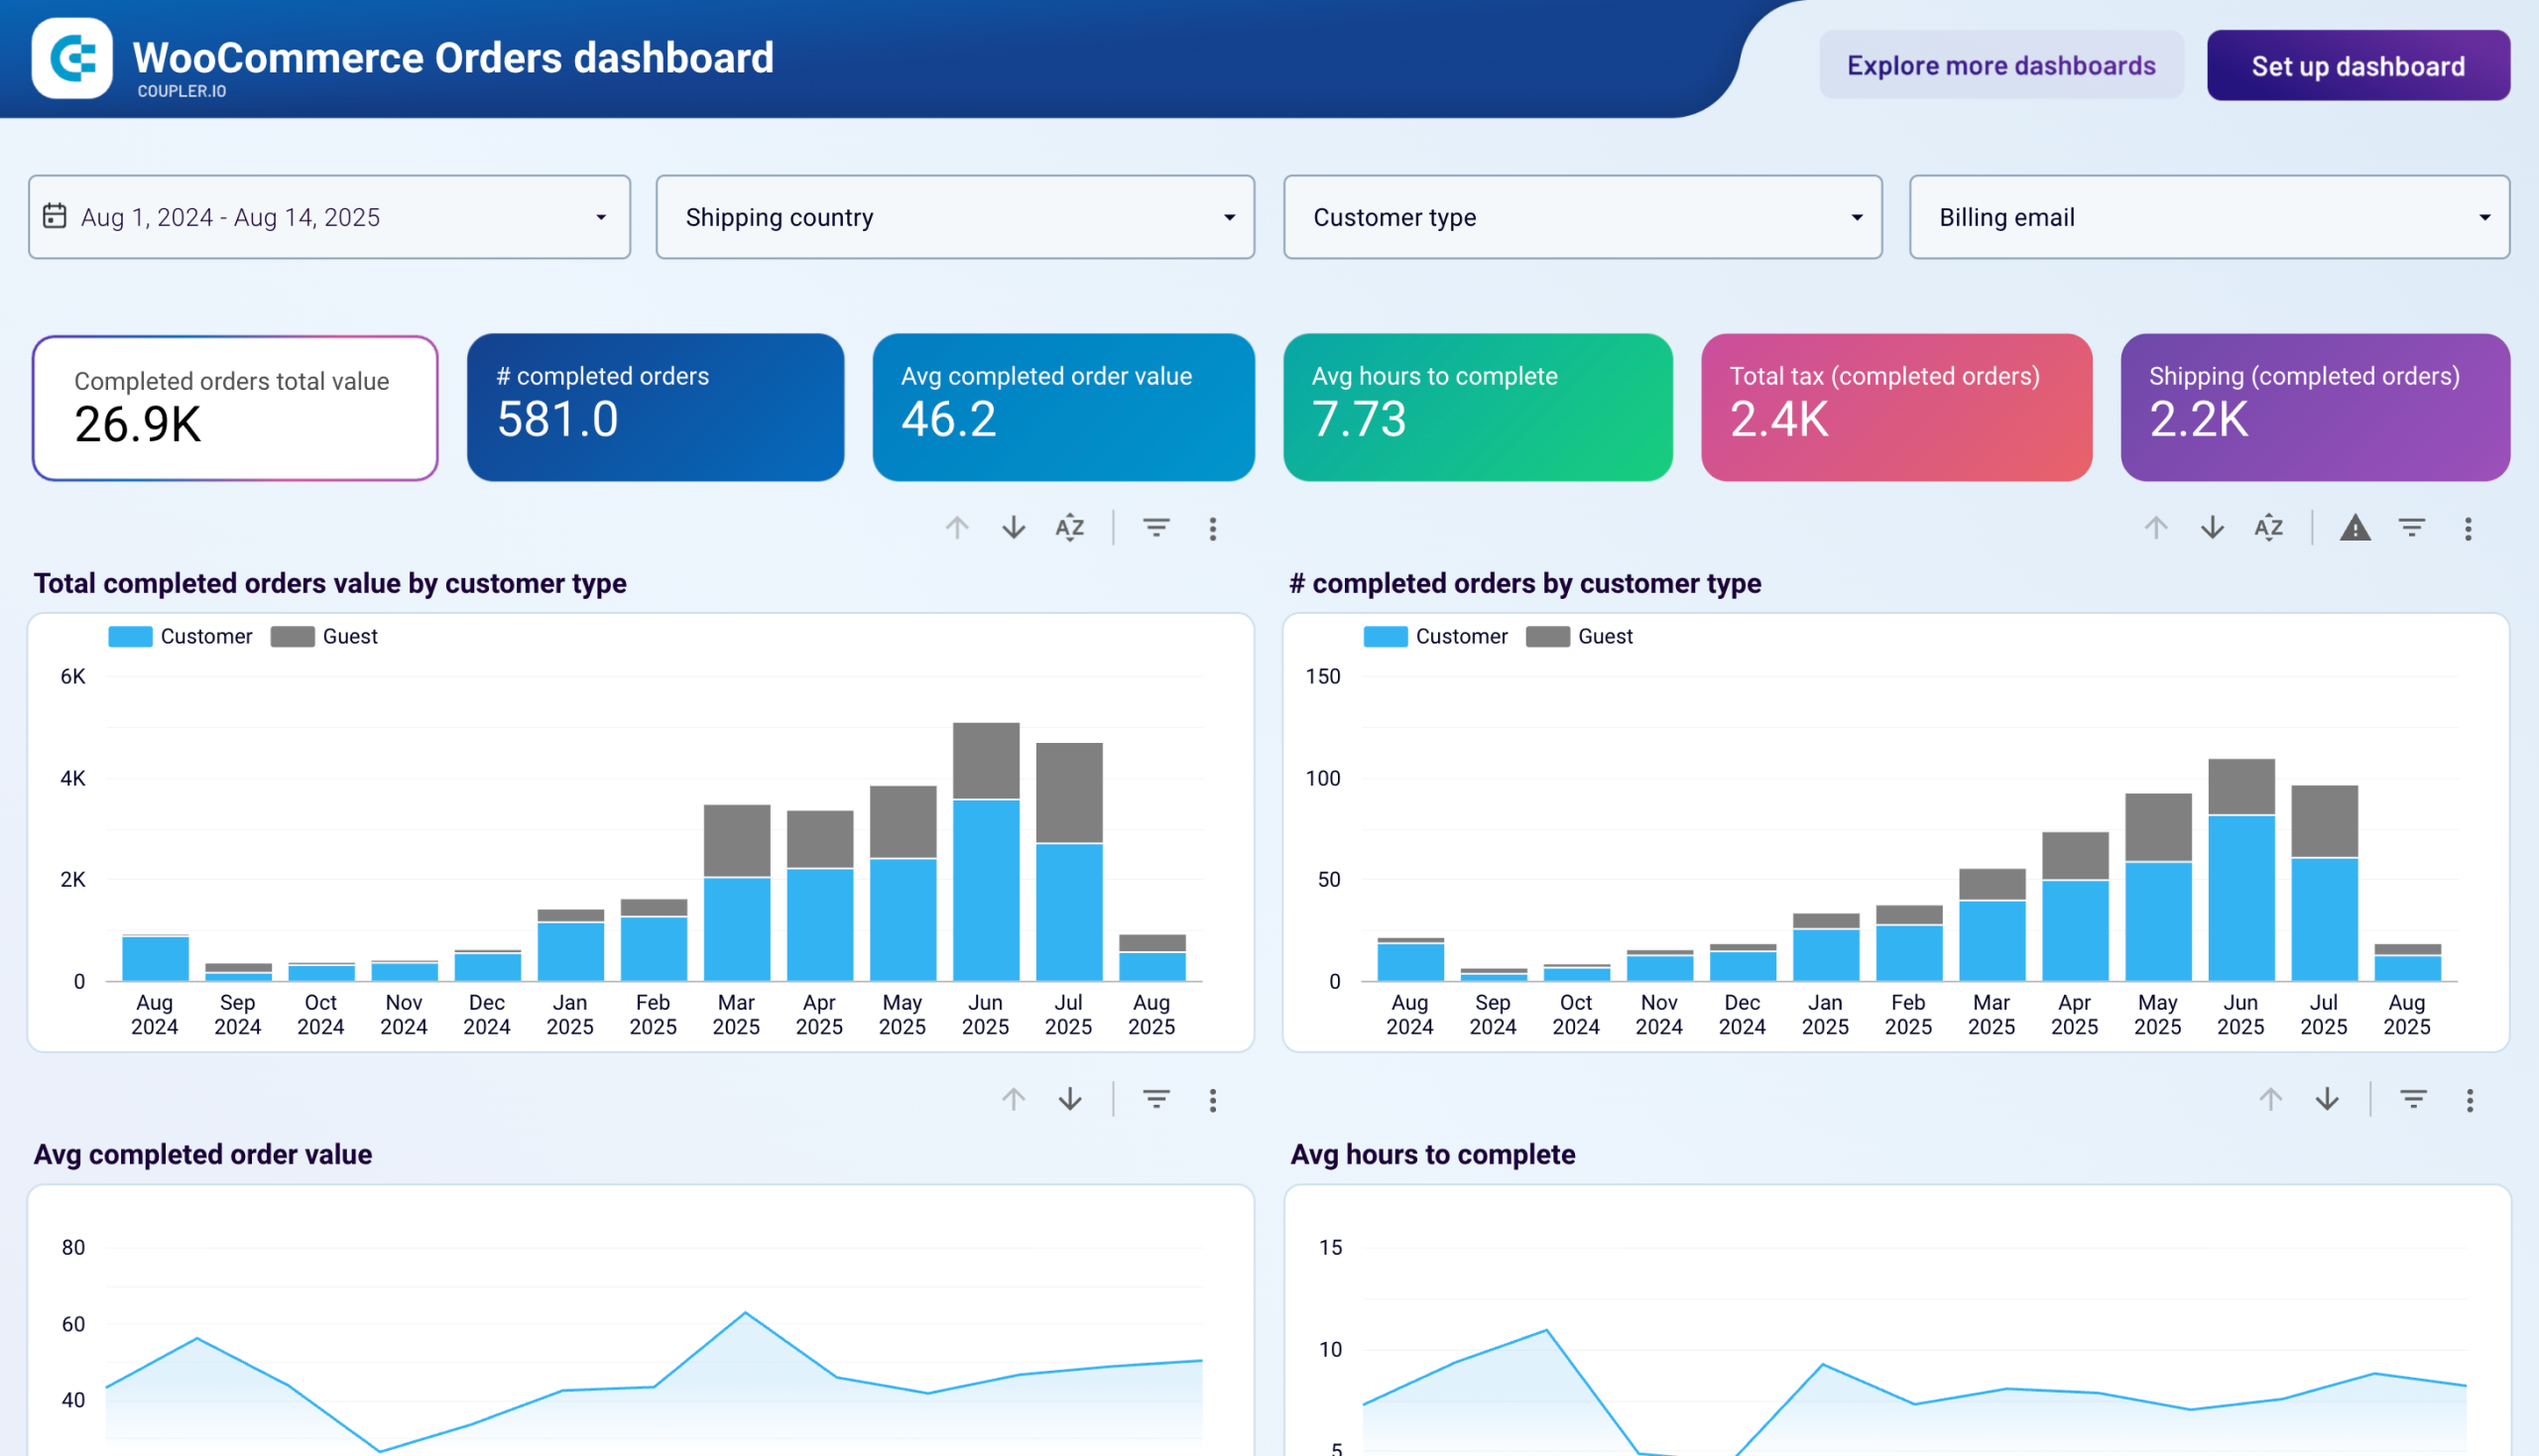
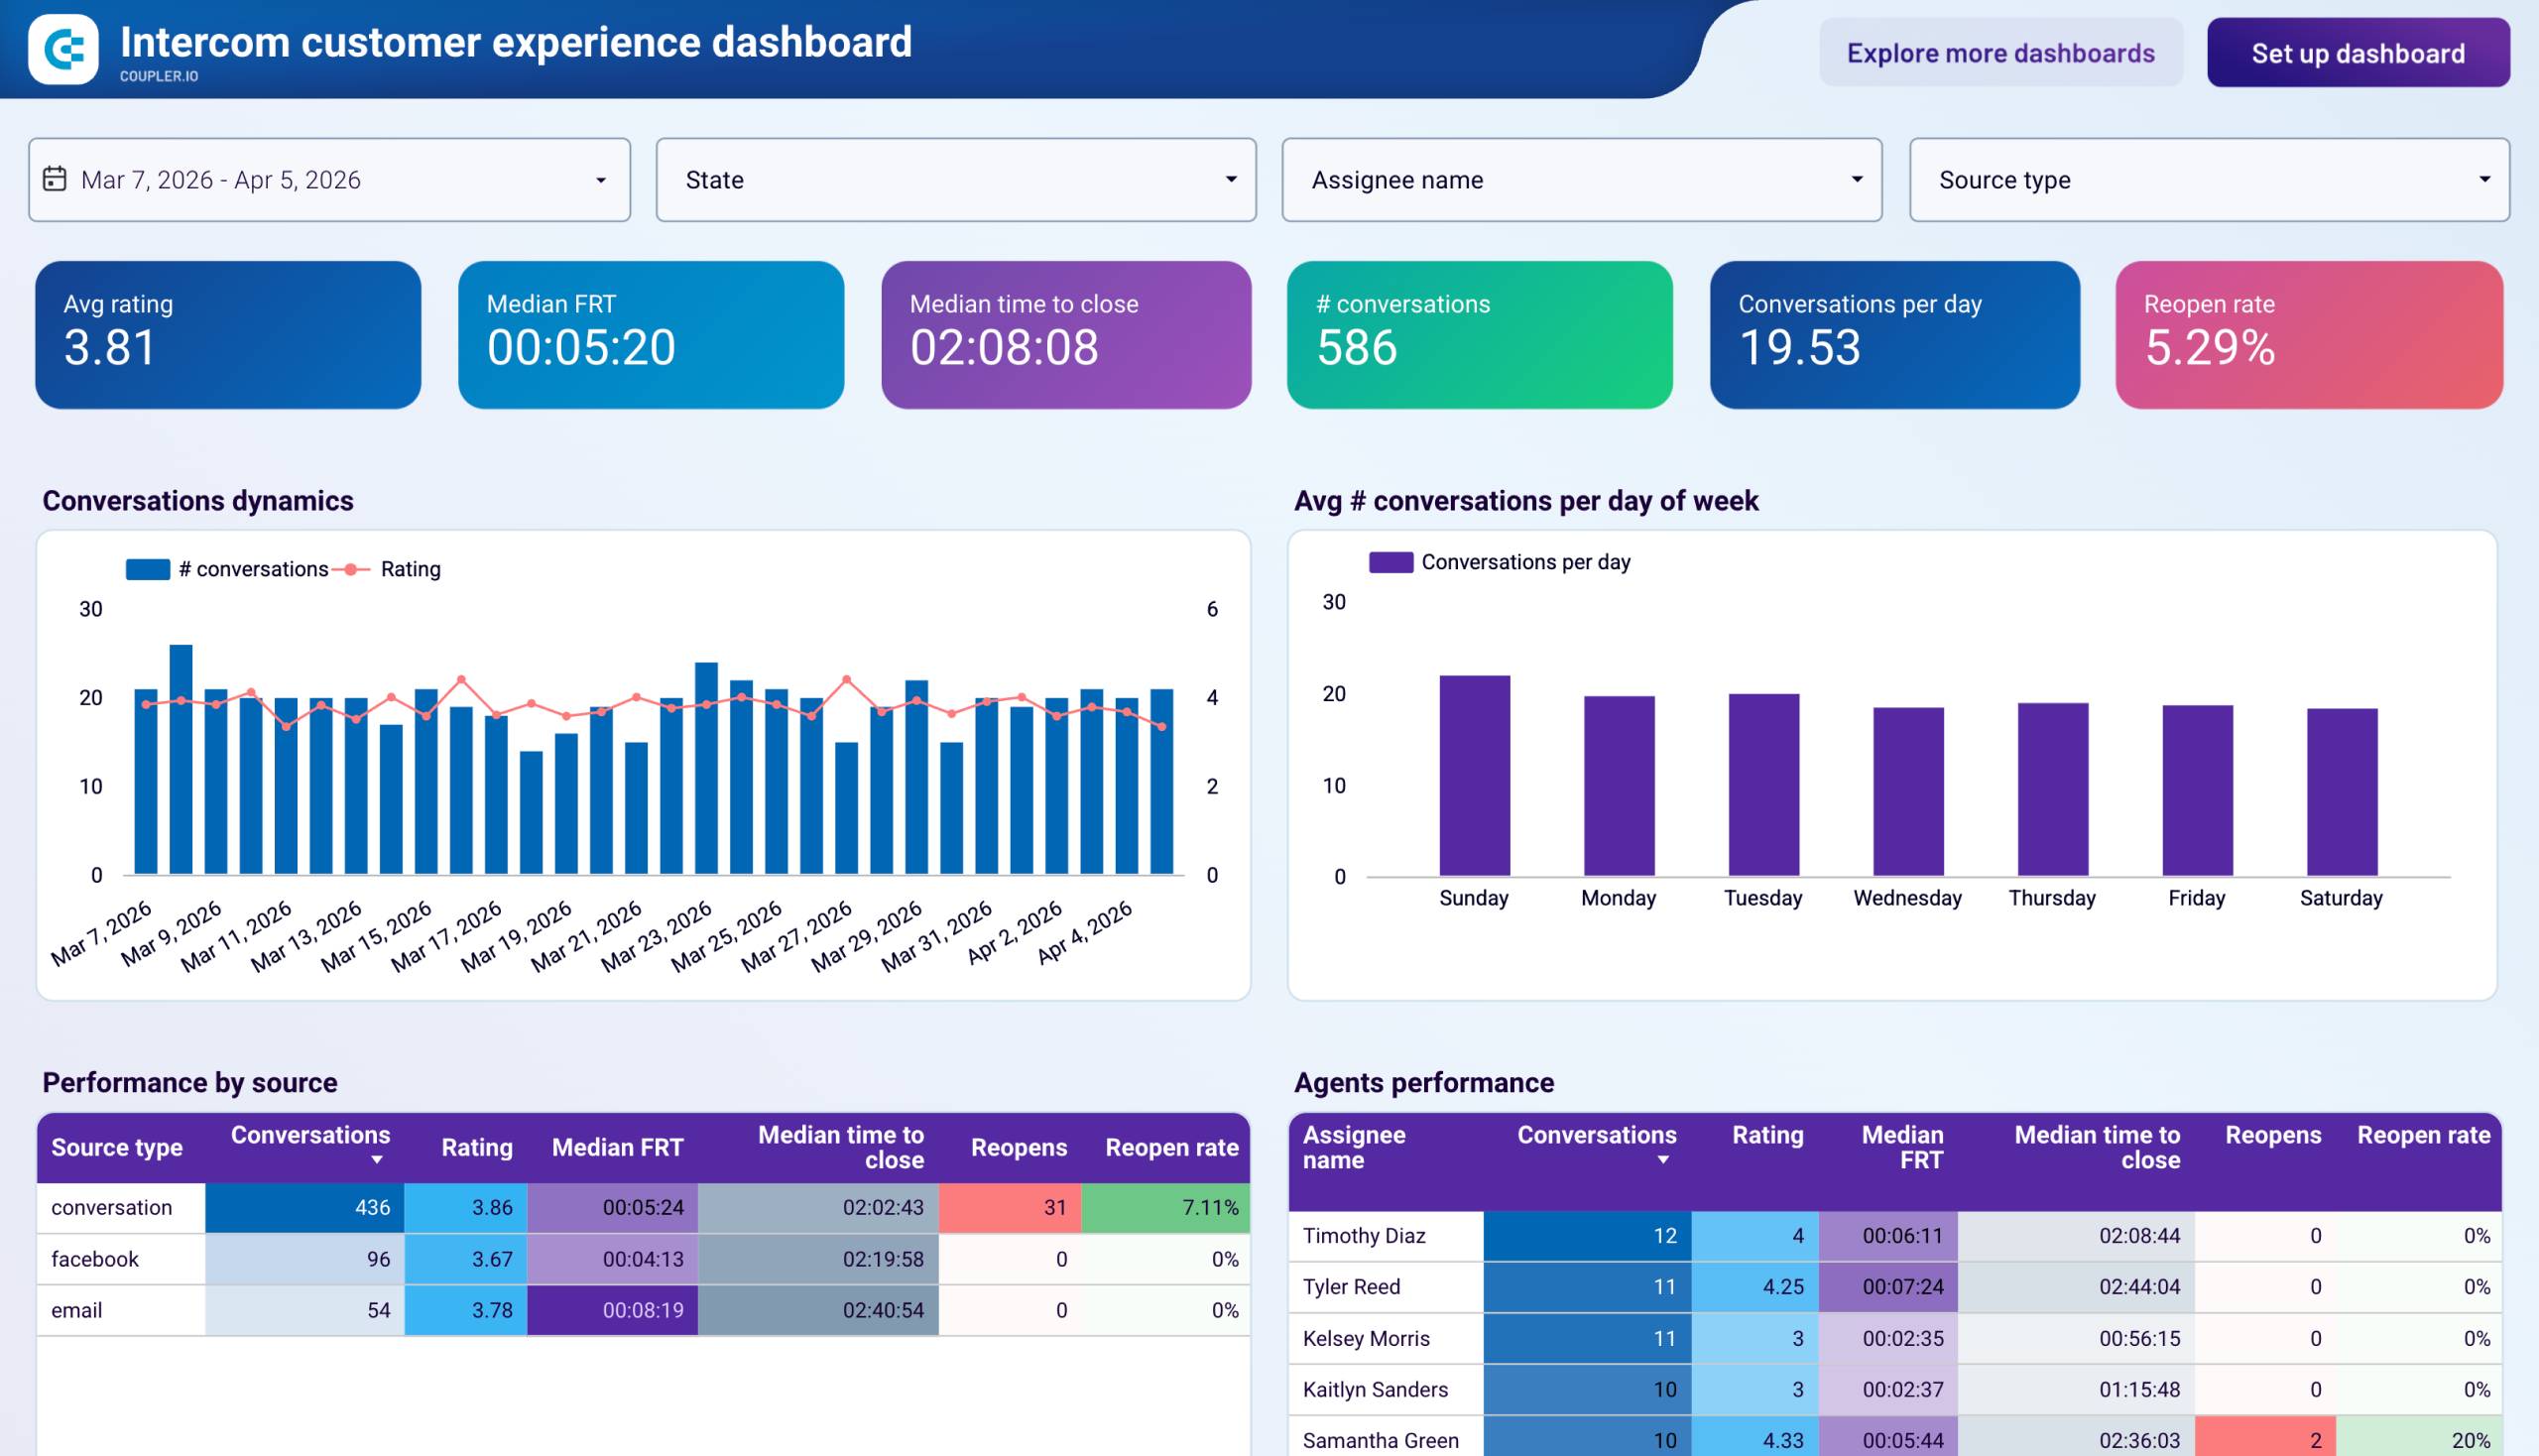
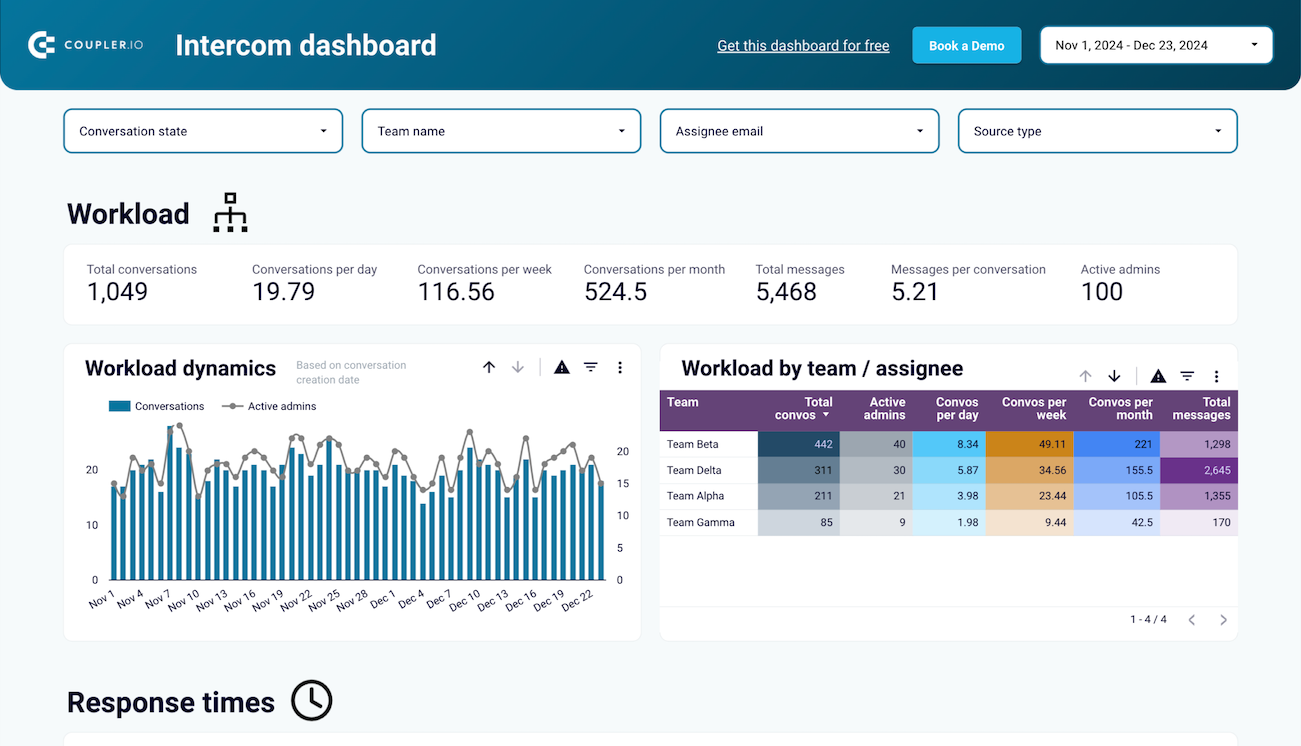
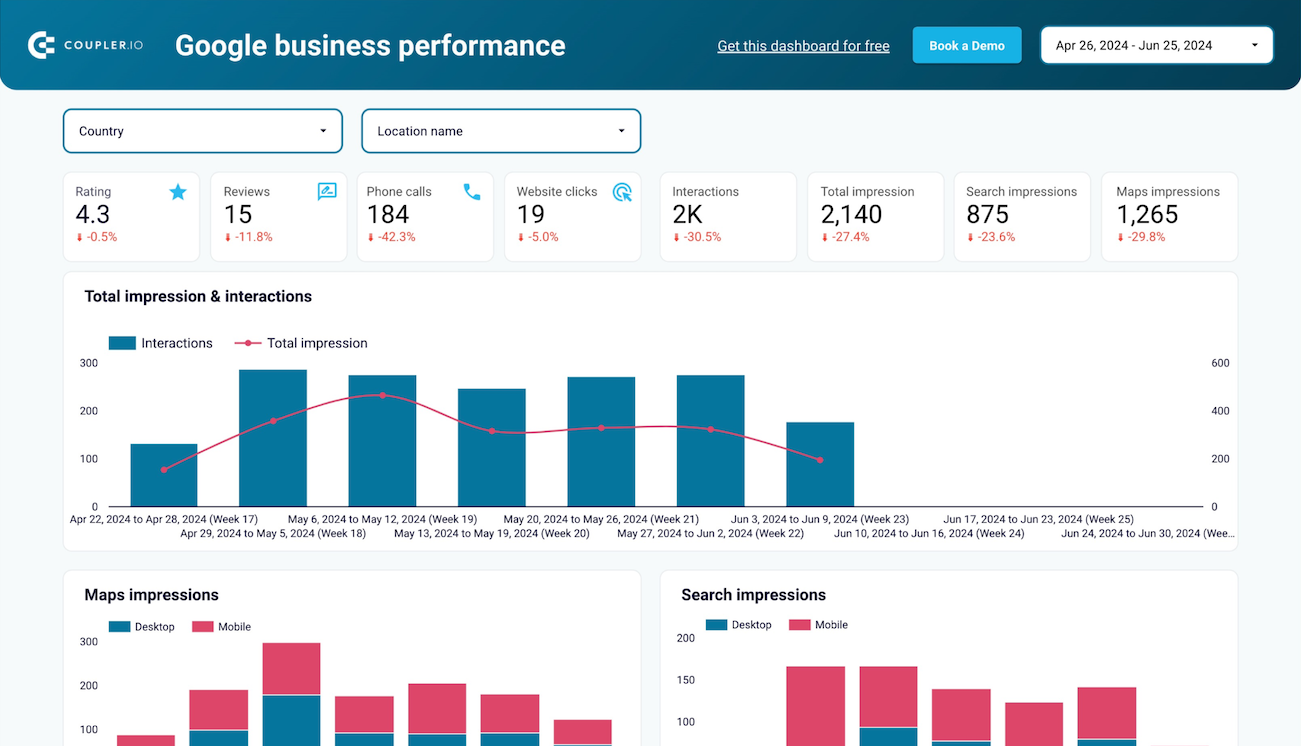
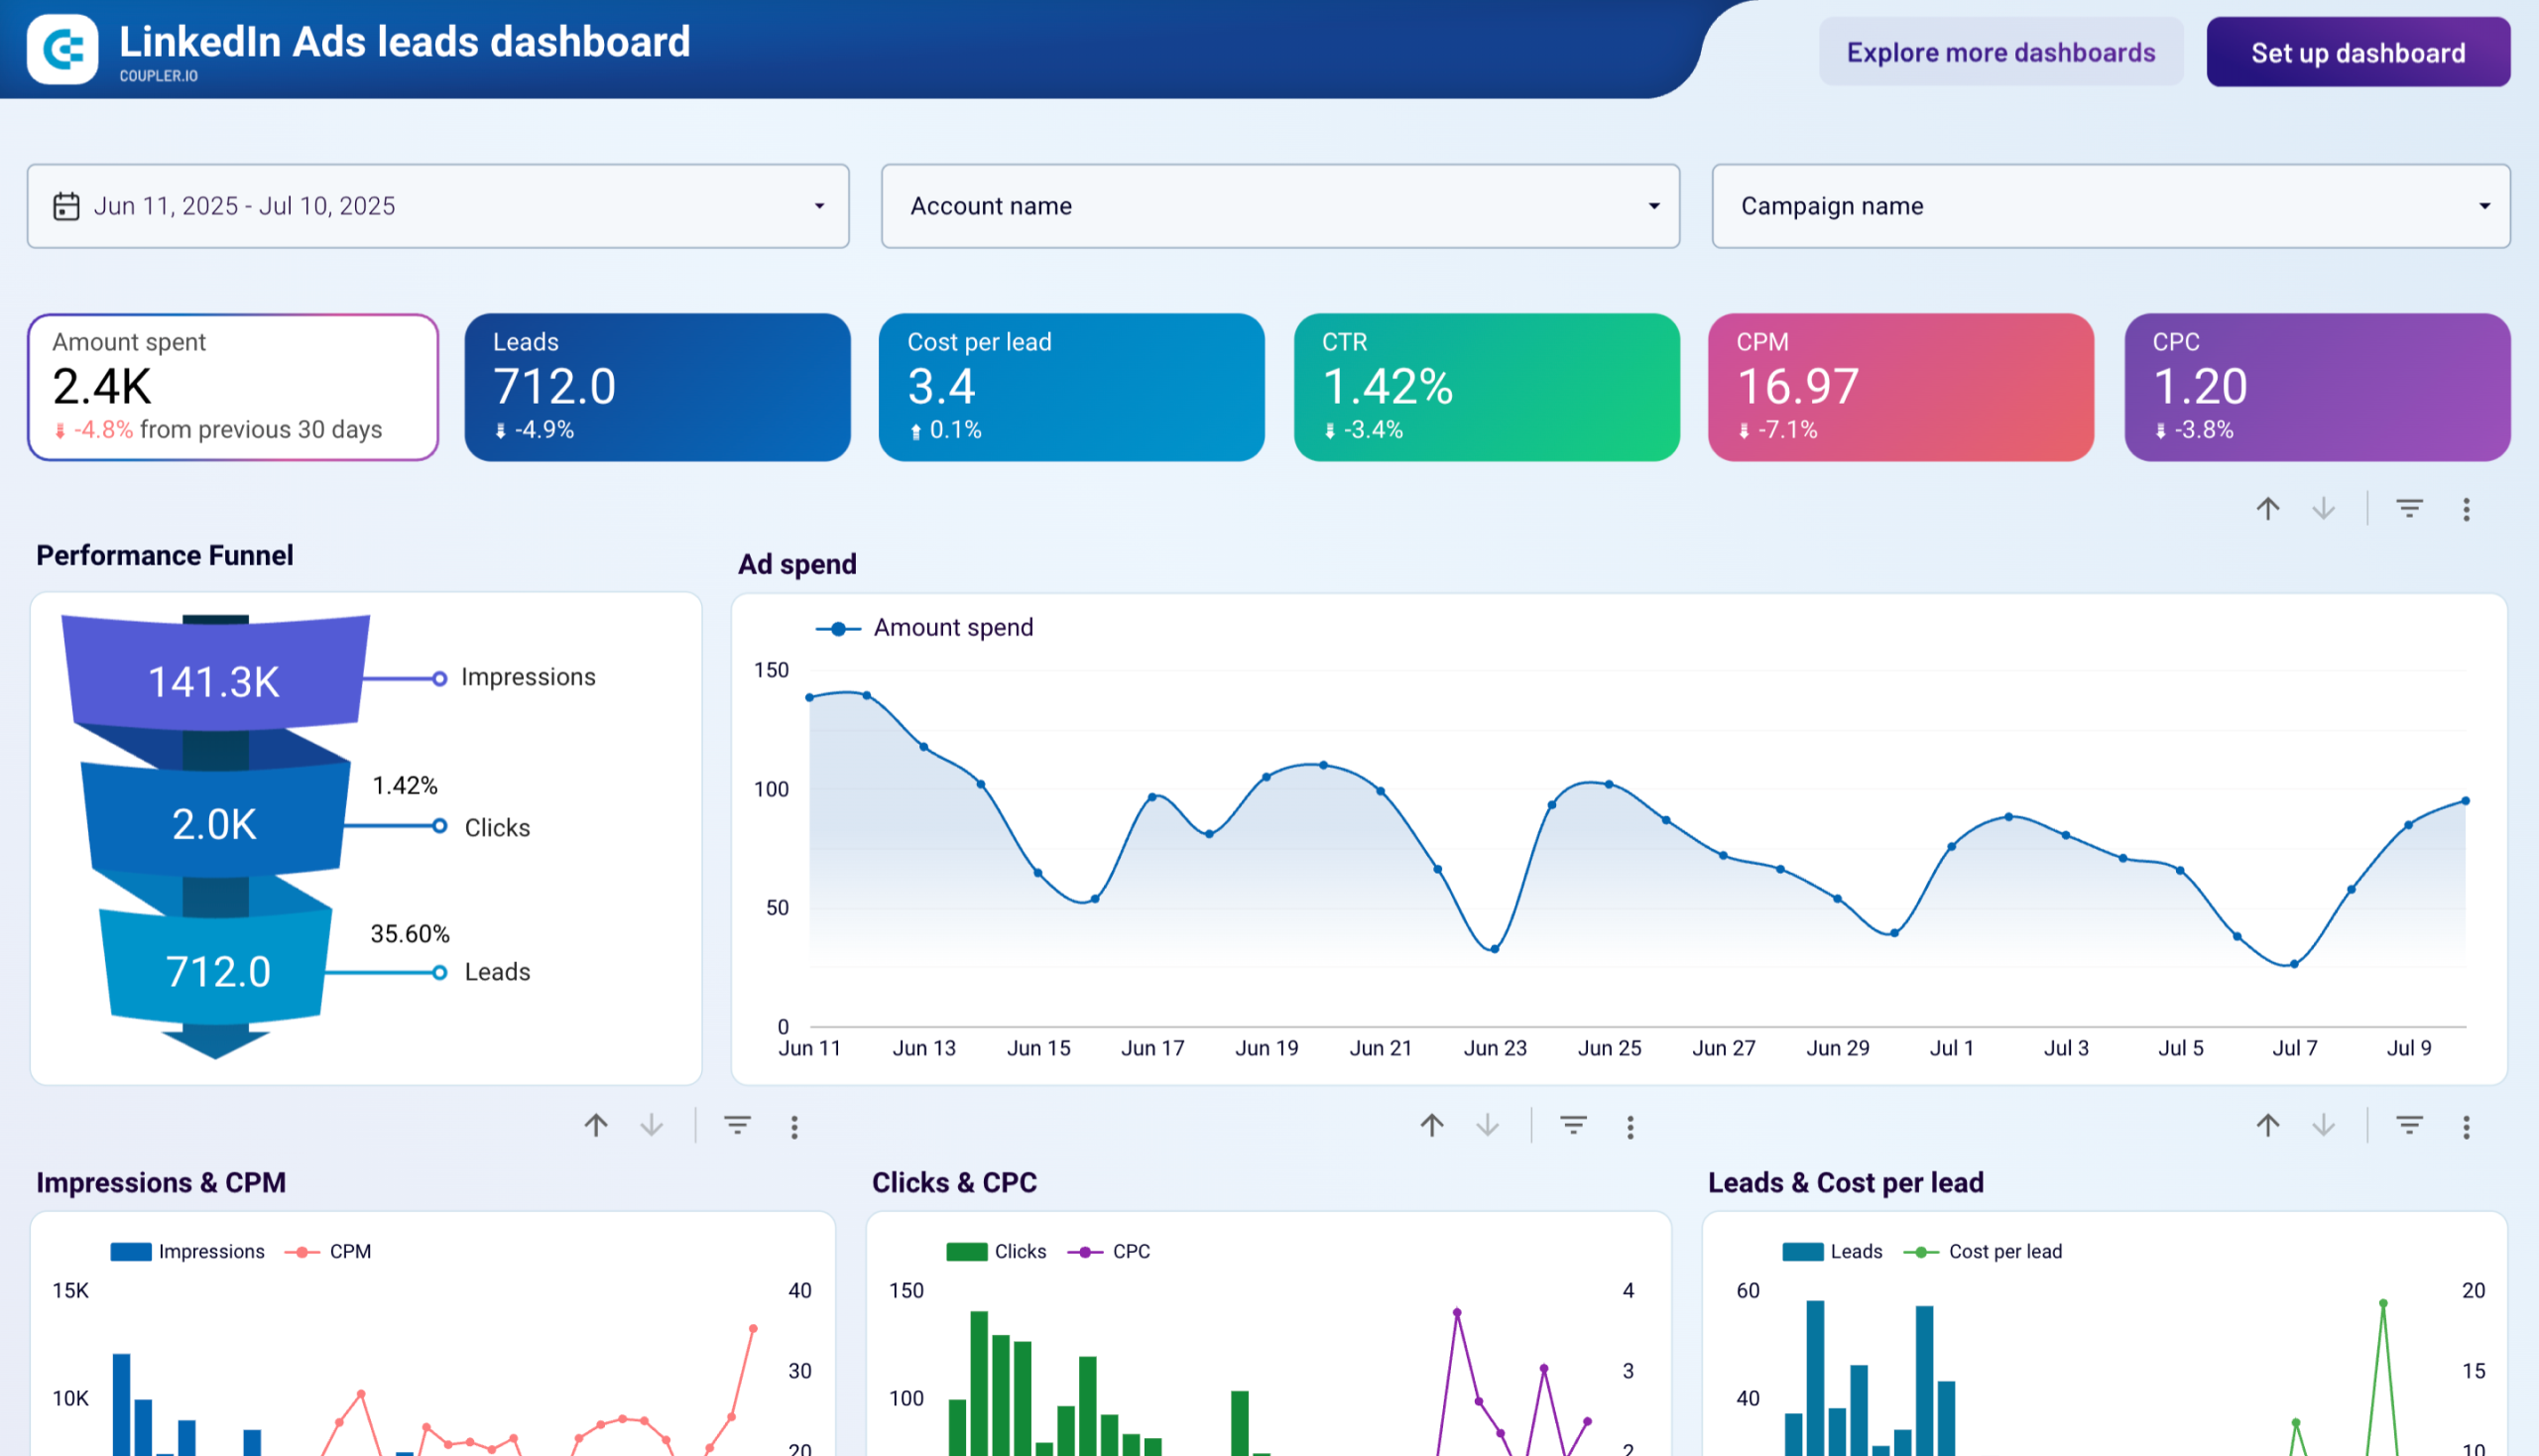
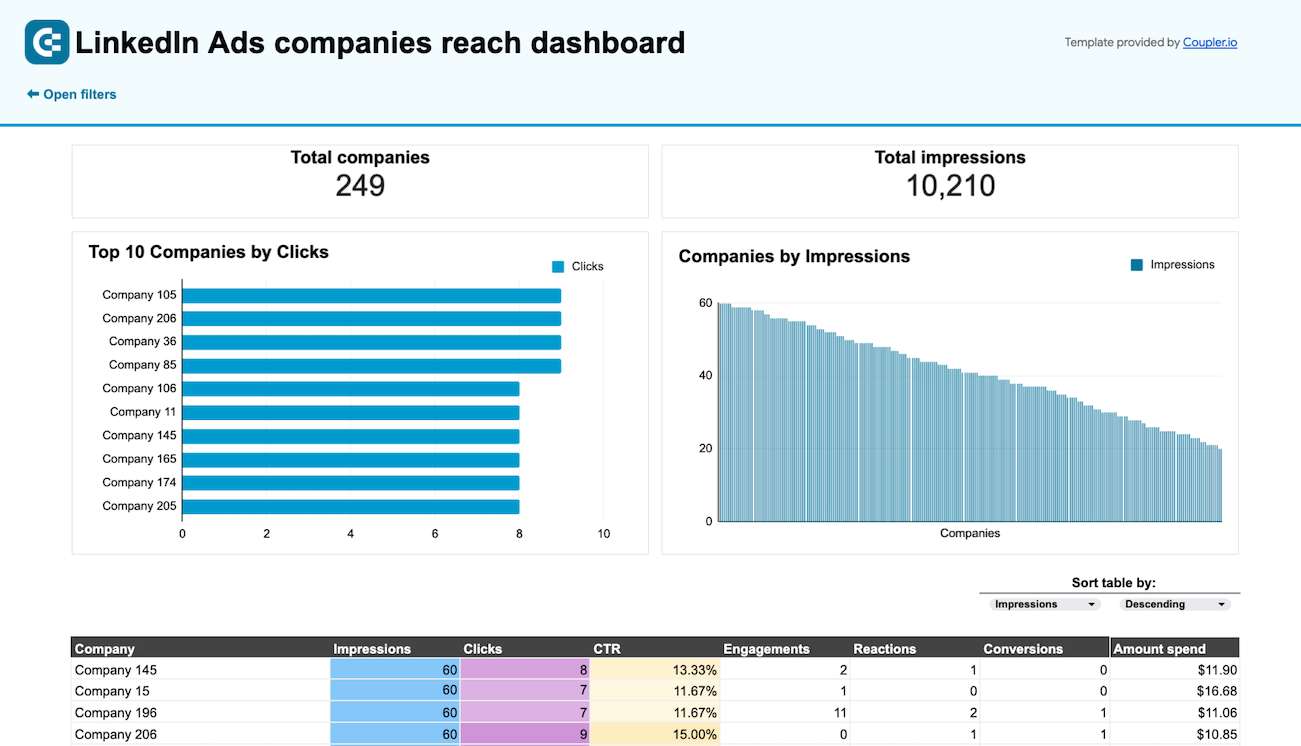
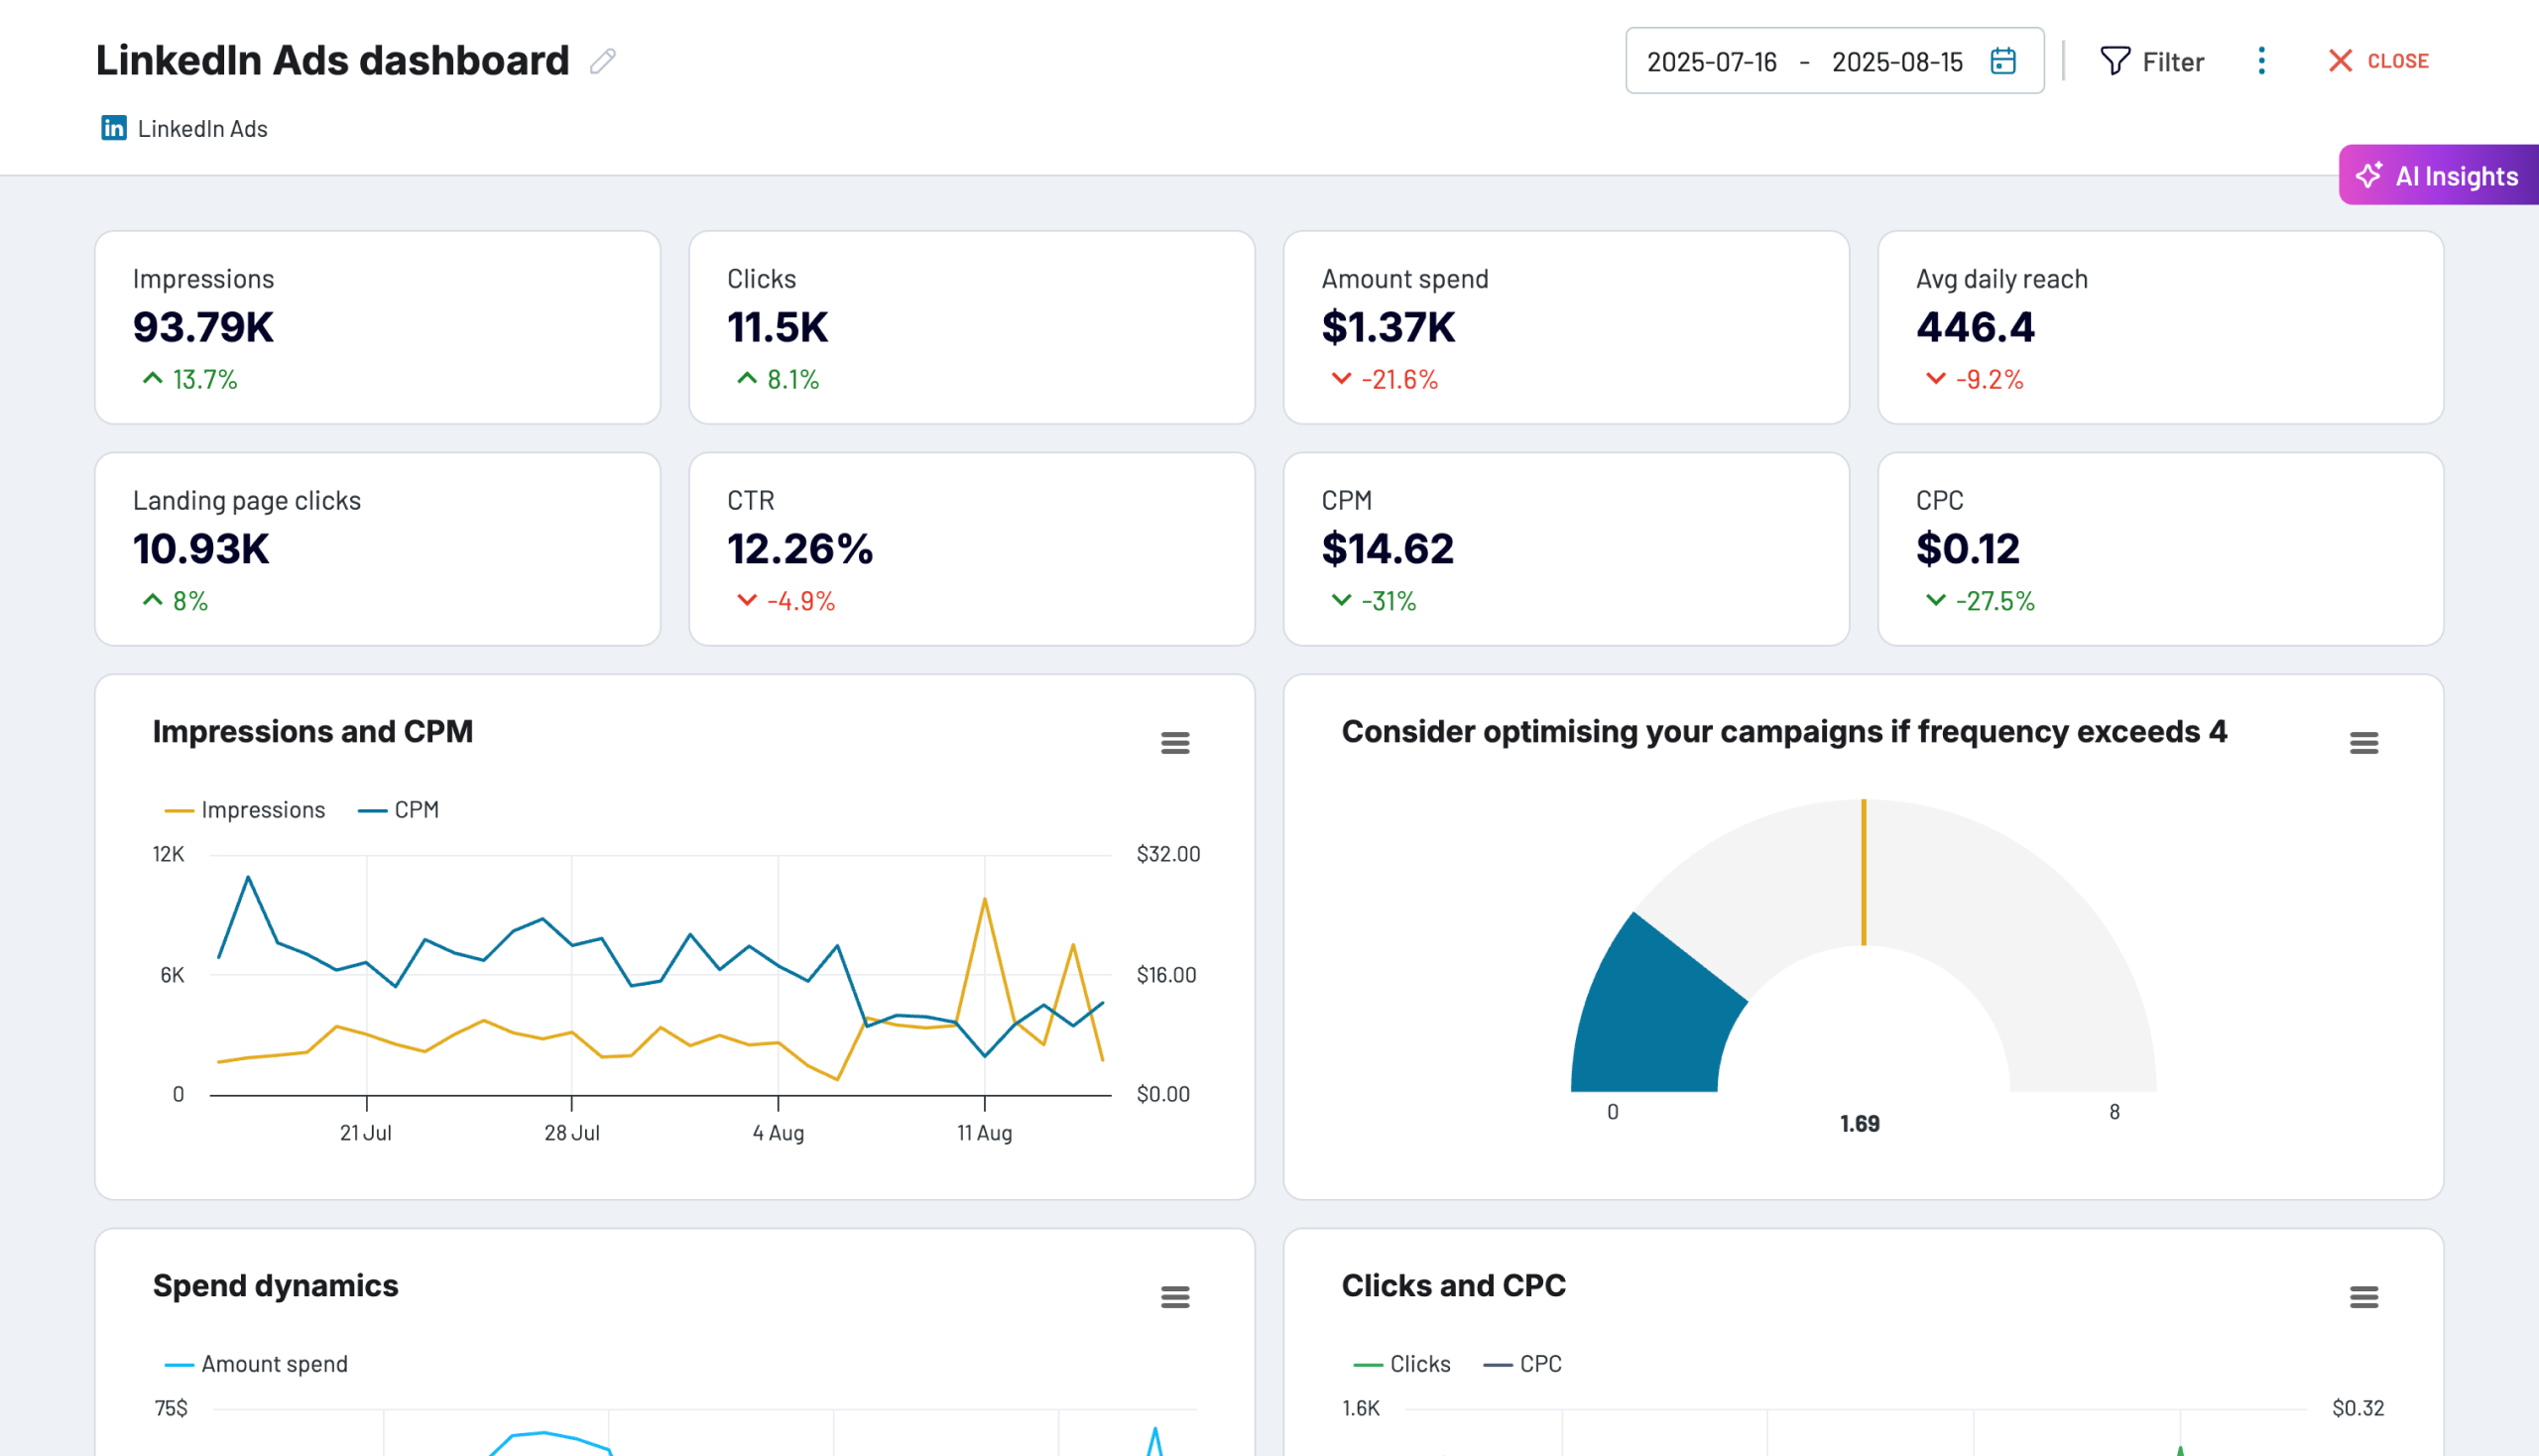
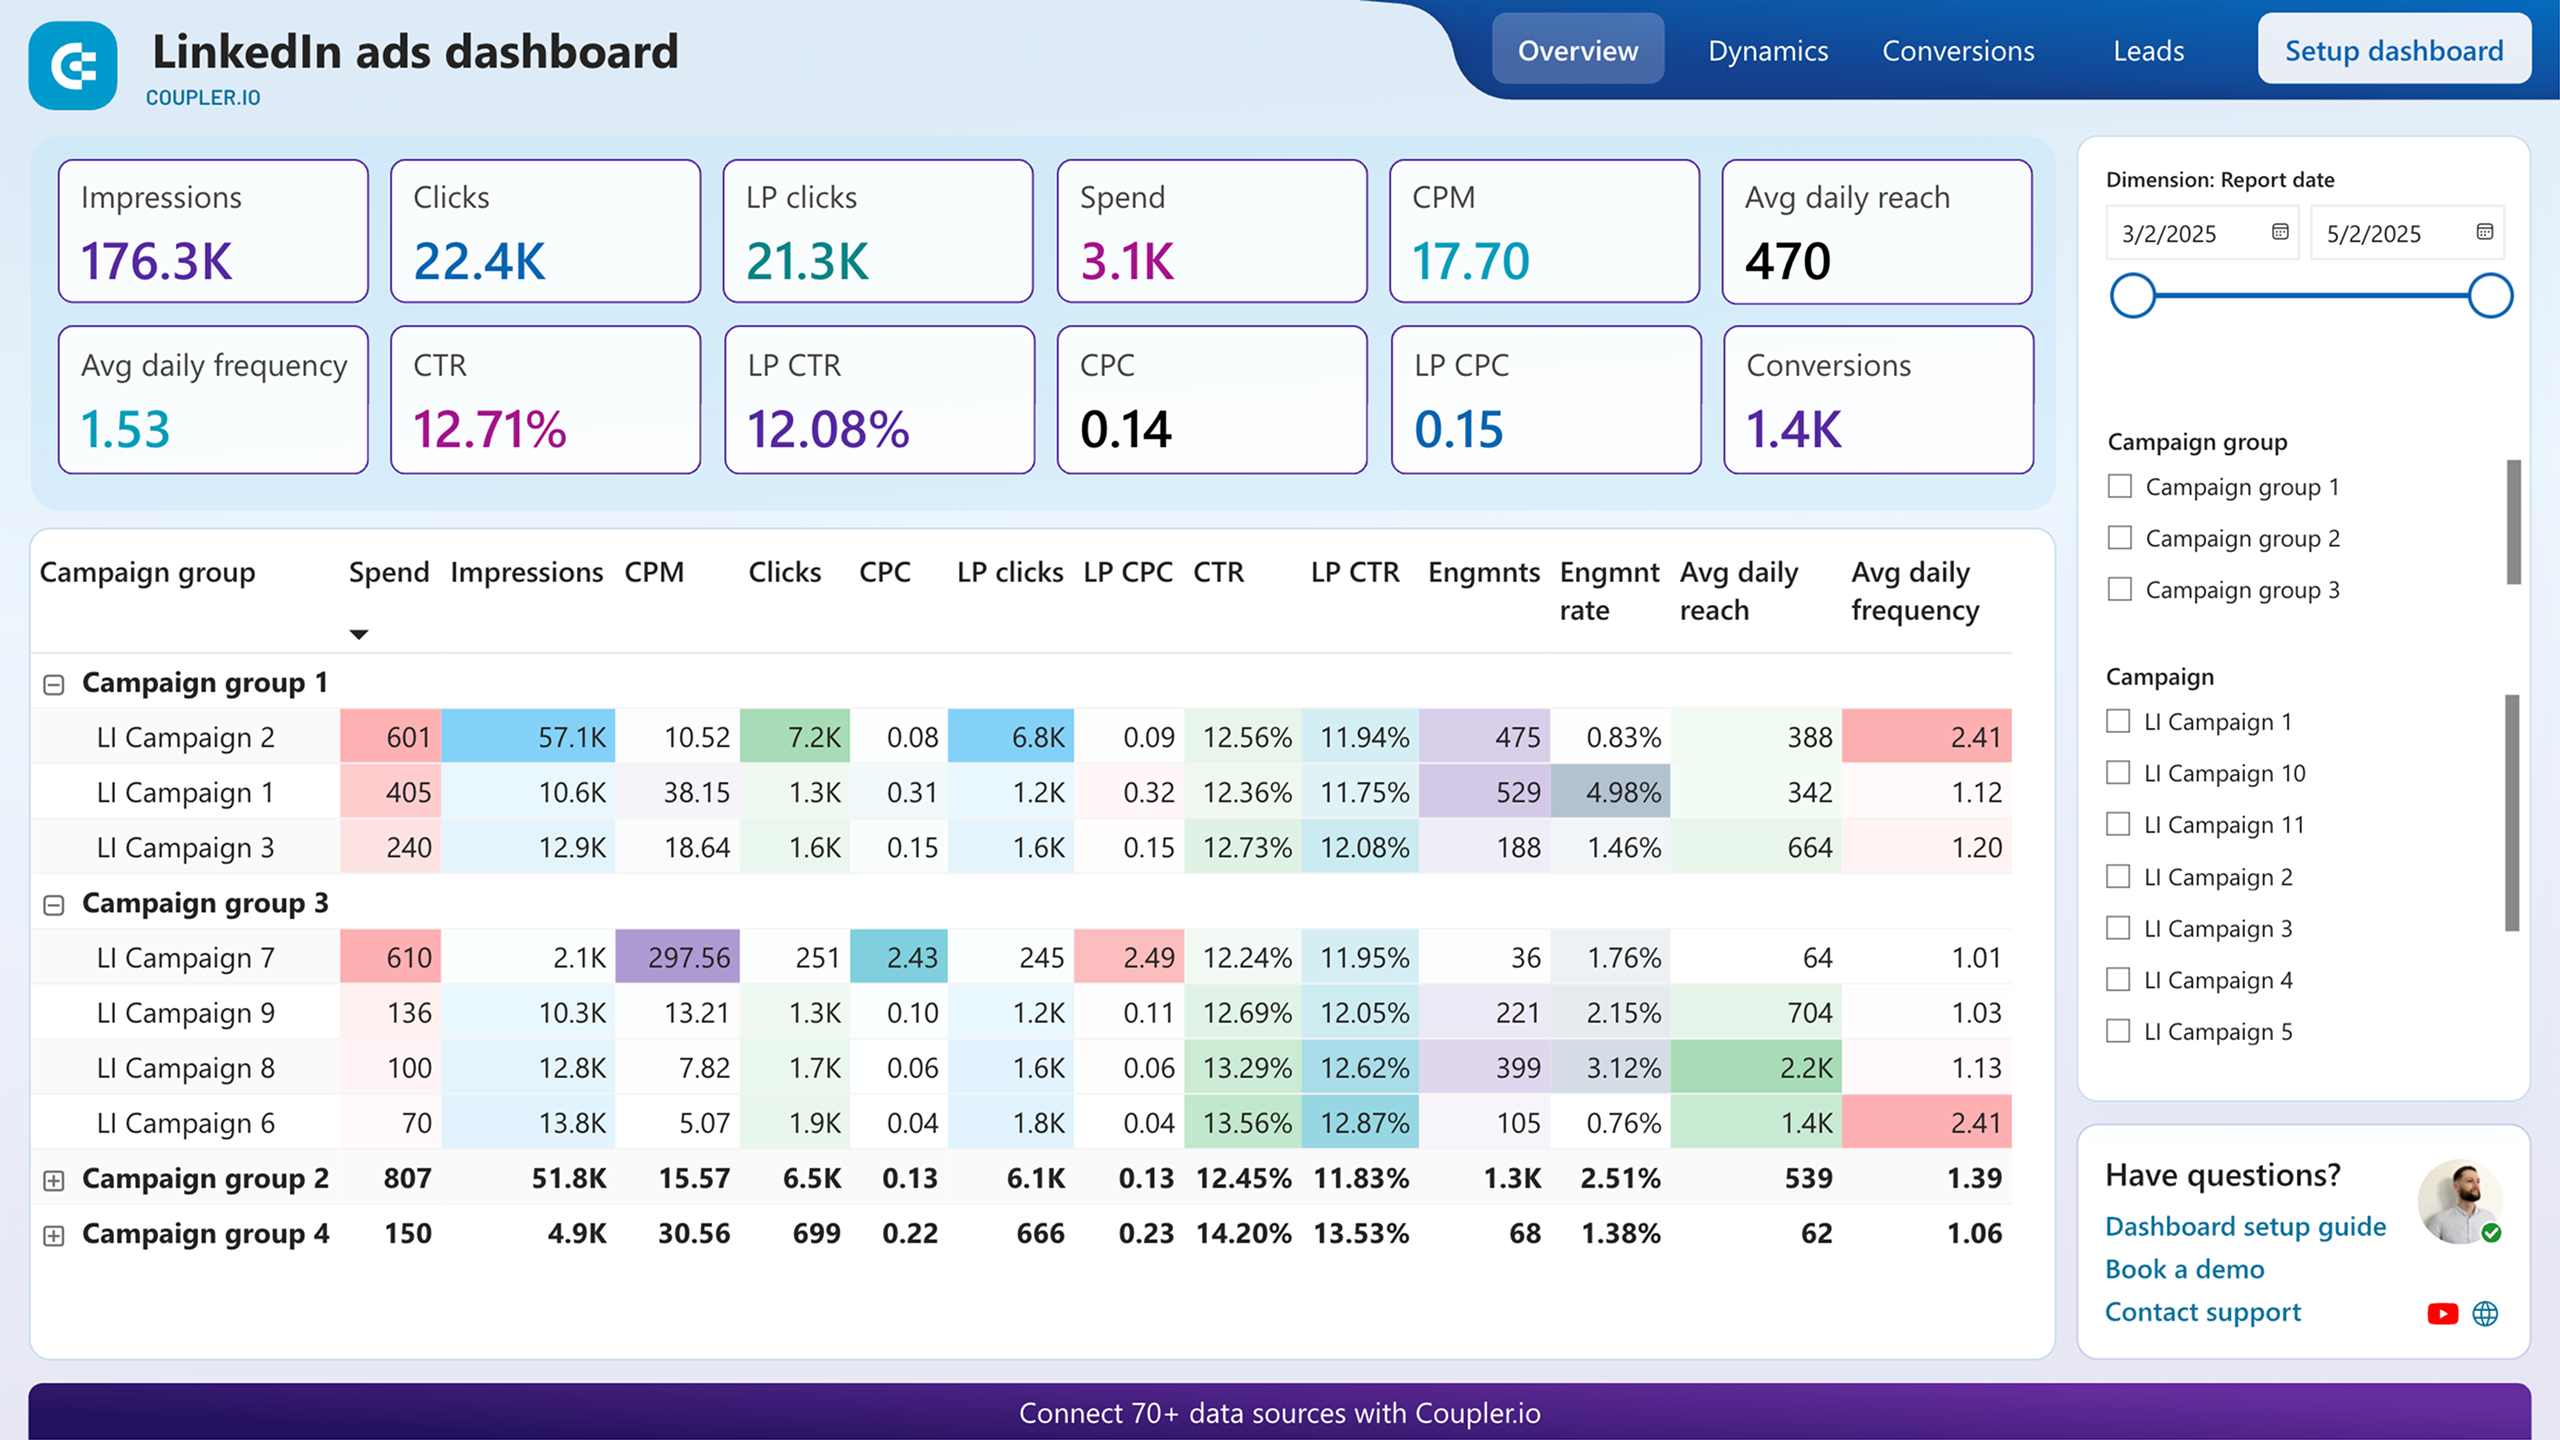
Use Coupler.io dashboards templates
Coupler.io offers a range of ready-to-use interactive dashboard templates designed to streamline your reporting and analytics. Explore our template gallery and connect your GitHub to start using the plug-and-play dashboard right away.


 +3
+3


 +6
+6


 +5
+5
 +6
+6

 +3
+3


 +1
+1


 +4
+4
 +4
+4
 +2
+2
 +2
+2


 +5
+5
 +4
+4
 +5
+5
 +5
+5


 +3
+3

 +1
+1
 +3
+3


 +1
+1
 +3
+3
 +3
+3


 +2
+2


 +1
+1


 +1
+1


 +2
+2
 +3
+3
 +4
+4


about your case. It doesn't cost you a penny 😉
Connect your favorite apps and get data in minutes


Recognized by industry leaders and community


