HubSpot to Google Sheets integration
Connect HubSpot to Google Sheets using the no-code integration by Coupler.io. Automate data exports to spreadsheets for reporting, analytics, or backup. Turn the raw HubSpot data into meaningful self-updating reports that provide insights for efficient decision-making.


Export data from HubSpot to Google Sheets with Coupler.io to automate reporting
Get and prepare data effortlessly
Automate workflow effortlessly using Coupler.io and its no-code HubSpot to Google Sheets integration. Use one intuitive interface to access the raw CRM data and transform it into dynamic reports before loading it to spreadsheets.
Automate reporting tasks
Get rid of the necessity of manually exporting HubSpot to Google Sheets for your reports. Automate reporting without any technical expertise required. Use report templates by Coupler.io, which are designed to save you time on data preparation.
Stand out as a data-driven expert
Power your decision-making with insights from your data exported from HubSpot to Google Sheets and share them with stakeholders. Delegate your manual routine to Coupler.io, which makes your reporting automated, sparing time for strategic activities.
Export data from HubSpot to alternative destinations


Quick start with CRM dashboard templates

Marketing and sales performance dashboard for HubSpot


HubSpot marketing performance dashboard

Sales KPI dashboard for HubSpot
No such template is available yet.
No worries. Our team will create a template that fits your needs, just tell us more
about your case. It doesn't cost you a penny 😉
Request a custom report
about your case. It doesn't cost you a penny 😉
Automate data exports from HubSpot to Google Sheets with just a few clicks.
Connect similar CRM apps and get data in minutes


HubSpot to Google Sheets integration: what to export

Deals
Track details of your sales deals using the HubSpot to Google Sheets integration. Get information about stages, values, associated contacts, estimated close dates, and others. Use this data to manage sales pipelines, forecast revenue, and make effective strategic decisions.
Contacts
Capture extensive information on contacts, including communication history, engagement levels, and personal details. With this data, you can enhance relationship management and marketing efforts. Enable personalized interactions and target campaign strategies.
Companies
Connect HubSpot to Google Sheets and extract essential information about business entities. This data includes industry type, size, relationship status, and more. Use this information for strategic business planning and optimizing B2B interactions. Tailor sales approaches to better meet the needs of each company.
Communications
Access all customer interactions across various channels. Analyze communication effectiveness and customer preferences using this detailed information. Optimize future communications and strategies, ensuring more personalized and impactful customer engagement.
Feedback Submissions
Collect and analyze customer feedback to measure satisfaction and identify areas for improvement. This data lets you evaluate product development and customer service strategies. Drive better business decisions and enhance customer experiences backed up with proper data.
Products
Track details about products, including pricing, specifications, and availability. Get access to this data to support inventory management. It can also help you optimize sales operations and evaluate product performance across customer segments.
Quotes
Manage and record details of pricing quotes offered to prospects or clients. Analyze quotes to understand market positioning, conversion rates, and sales effectiveness. Use this information to refine pricing strategies and sales tactics.
Goals
Track specific organizational goals related to sales, marketing, or customer service. Monitor performance against these goals to align team efforts efficiently. With this data, you can optimize staff motivation and drive overall business success through clear objectives.
Calls
Log details of phone calls, including participants, duration, and outcomes. This information is vital for evaluating communication strategies. Calls data lets you understand customer concerns and refine follow-up actions. As a result, you can improve overall business communication efficiency.
Meetings
Access specifics of business meetings, including attendees, outcomes, and follow-up actions. This information ensures alignment on project goals. You can use it to enhance collaborative efforts and track progress toward business objectives.
How to connect HubSpot to Google Sheets
Step 1. Connect your HubSpot account and choose a data entity to export
Step 2. Organize and transform data before loading it to Google Sheets
Step 3. Connect your Google Sheets account and specify where to load your data
Step 4. Enable data refresh to export HubSpot to Google Sheets on a schedule
Pricing plans
- Monthly
- Annual (save 25%)
Your data is secured by industry standards
 Google Cloud
Certified
 SOC 2 Type II
Certified
 GDPR
GDPRCompliant
 HIPAA
HIPAACompliant
Don’t just take our word for it


How to integrate HubSpot to Google Sheets (detailed guide)
All Coupler.io integrations are no-code and have intuitive set up flow. The in-app instructions will guide you from the very moment of selecting source and destination apps to the final click.
To set up a HubSpot to Google Sheets integration, create a new importer and complete the following steps:
Step 1: Collect data
Connect your HubSpot account. You’ll need to log in and grant read access to your data. After that, select the data type you'd like to export. Optionally, you can specify columns, date filters, and use the advanced data filtering.
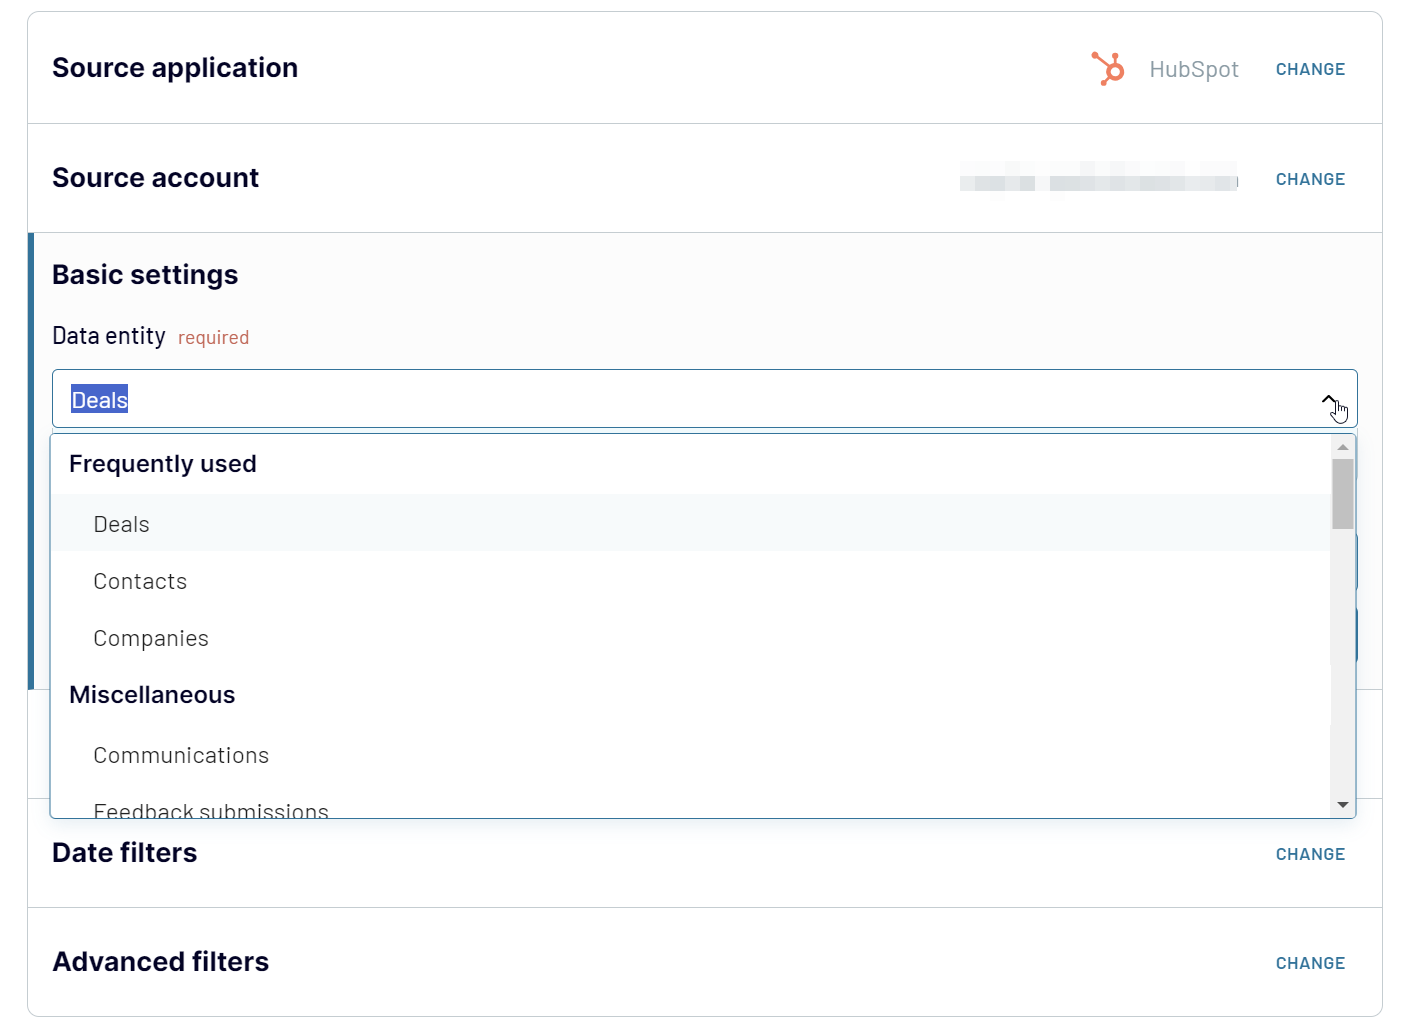
Once you’ve specified the HubSpot data for export, you can move to the Transformation step.
Step 2: Organize and transform
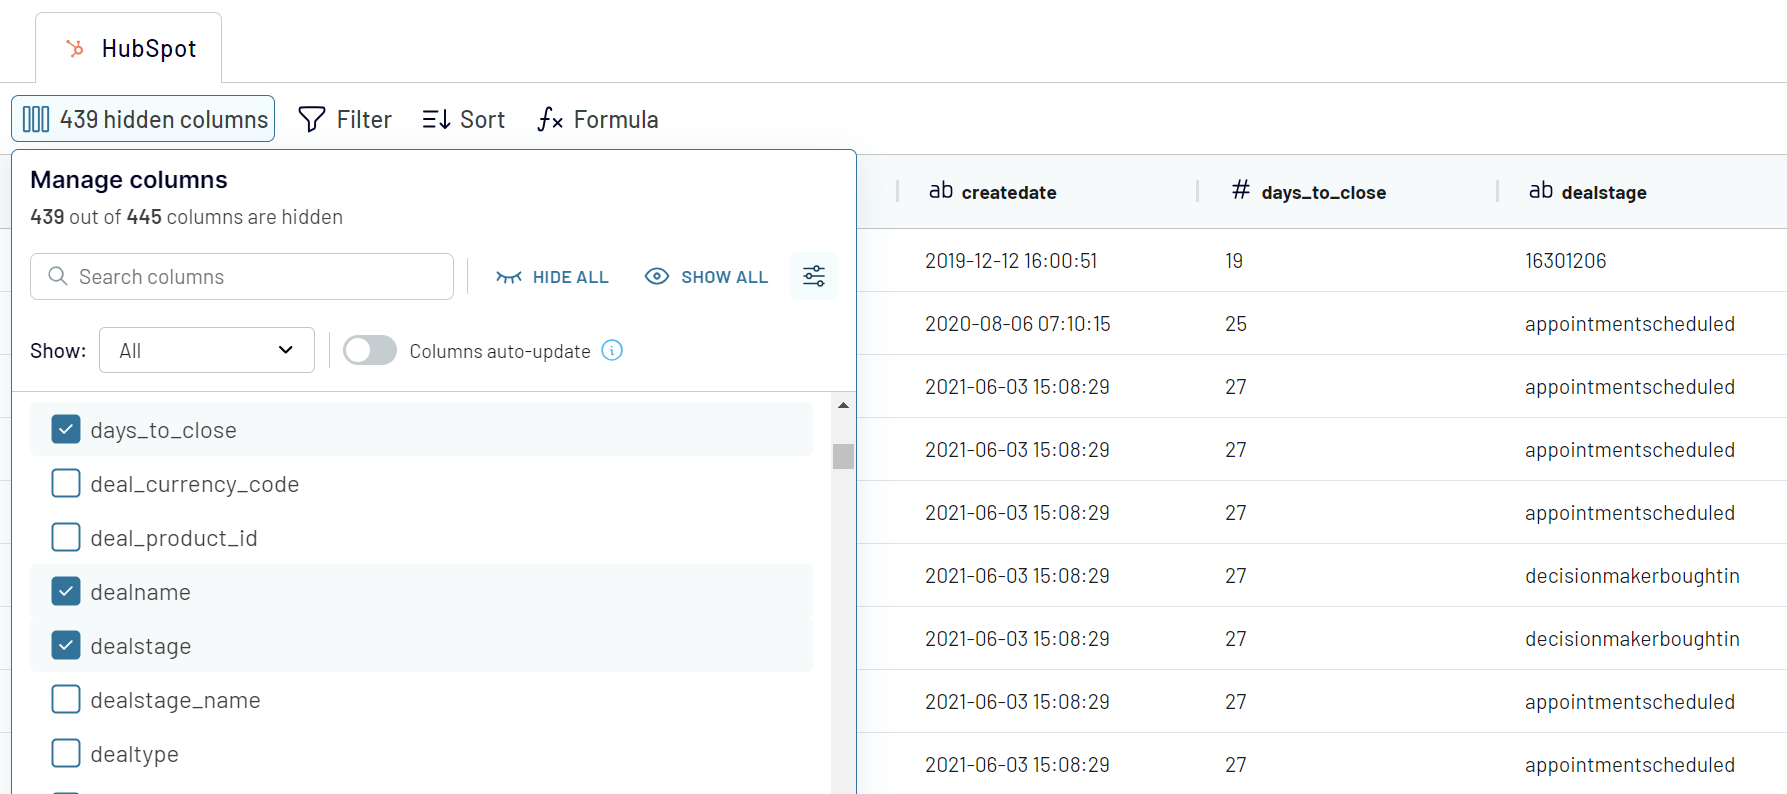
Coupler.io preloads up to 500 rows for you to preview the data and make it analysis-ready. So, you can actually make your report before exporting it from HubSpot to Google Sheets. Take advantage of the following transformation options:
With the data transformations complete, move to the destination settings.
Step 3: Load and automate
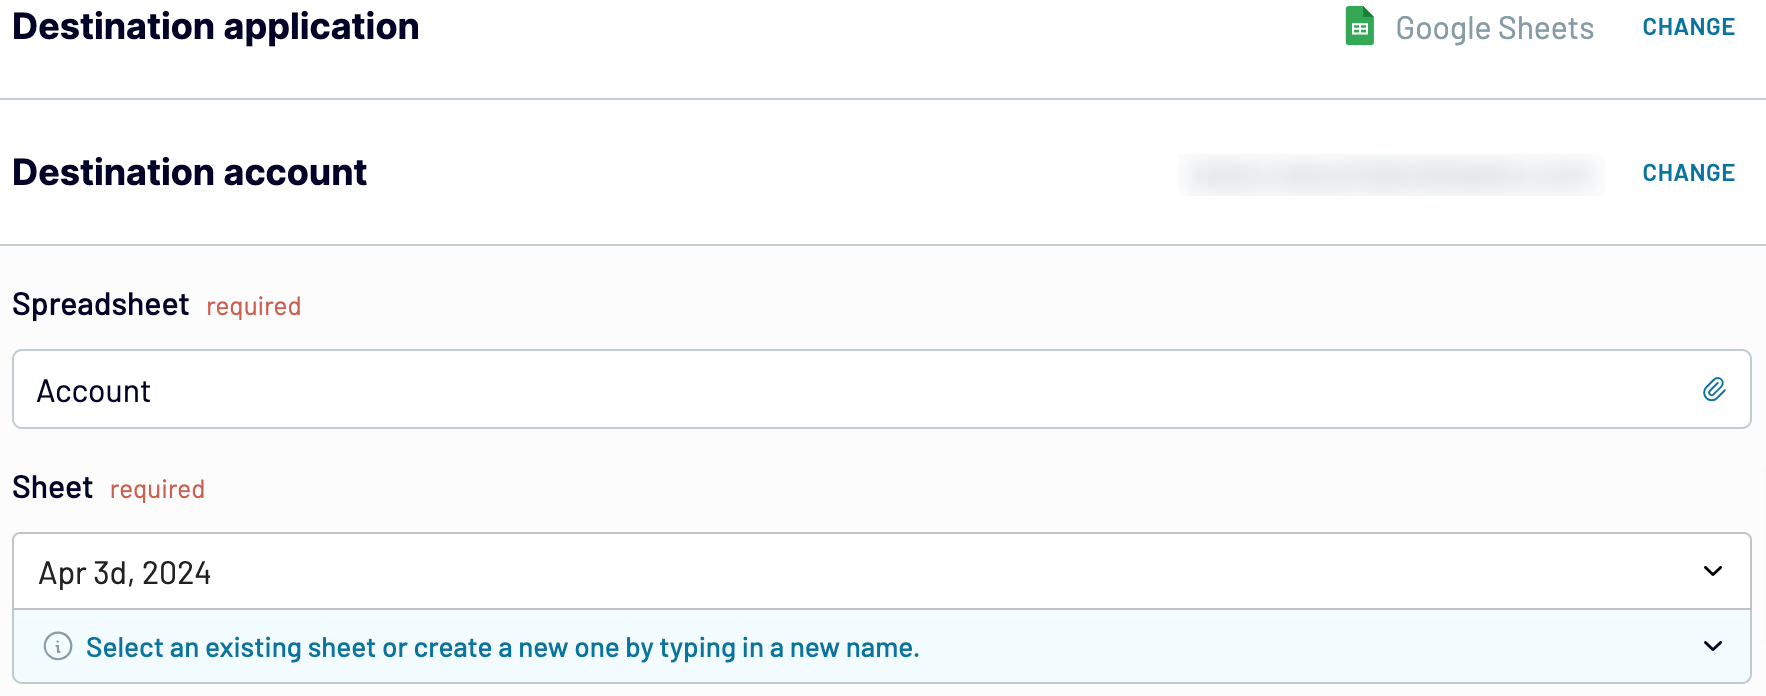
Connect Coupler.io to your Google Sheets account. Then, choose the file on your Google Drive and a sheet in this file where to load data from HubSpot. To create a new sheet, you can simply enter a new sheet name.
Optionally, Coupler.io lets you specify the first cell or a range for the exported data, and change the import mode.
Coupler.io will update data for each run by default,, but you can toggle this option off.
After that, you can automate data refresh and run your importer.
To set up a HubSpot to Google Sheets integration, create a new importer and complete the following steps:
Step 1: Collect data
Connect your HubSpot account. You’ll need to log in and grant read access to your data. After that, select the data type you'd like to export. Optionally, you can specify columns, date filters, and use the advanced data filtering.
Once you’ve specified the HubSpot data for export, you can move to the Transformation step.
Step 2: Organize and transform
Coupler.io preloads up to 500 rows for you to preview the data and make it analysis-ready. So, you can actually make your report before exporting it from HubSpot to Google Sheets. Take advantage of the following transformation options:
- Rename, reorder, hide, or edit columns
- Filter and sort data
- Add new columns using simple and advanced formulas
- Combine HubSpot data with other information, be it other data entities, records from other accounts, or apps
With the data transformations complete, move to the destination settings.
Step 3: Load and automate
Connect Coupler.io to your Google Sheets account. Then, choose the file on your Google Drive and a sheet in this file where to load data from HubSpot. To create a new sheet, you can simply enter a new sheet name.
Optionally, Coupler.io lets you specify the first cell or a range for the exported data, and change the import mode.
Coupler.io will update data for each run by default,, but you can toggle this option off.
After that, you can automate data refresh and run your importer.
Automate export of data from HubSpot to Google Sheets on a schedule
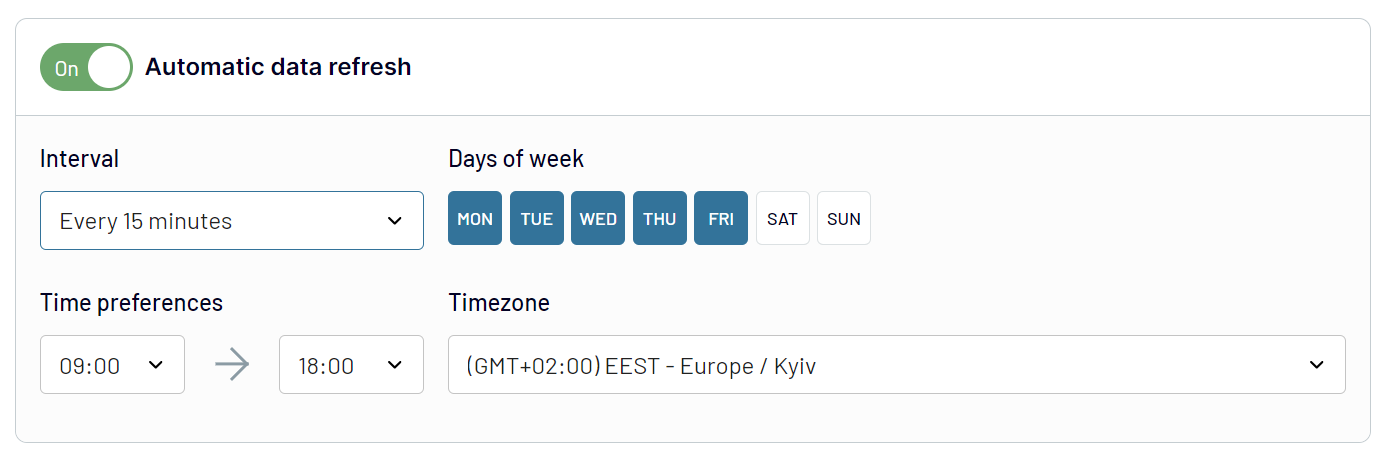
Automatic data refresh is the feature that schedules data exports from HubSpot to Google Sheets. To implement this automation, toggle on the feature and set up the desired schedule.
Coupler.io lets you configure:
With this level of scheduling, your reports will always be up-to-date with the recent changes to the HubSpot source data.
Coupler.io lets you configure:
- Interval - from every month to every 15 minutes
- Days of the week - you can skip weekends or other days when the refresh is not required
- Time preferences - specify the time range within which the refresh must be carried out
- Timezone - select the desired timezone
With this level of scheduling, your reports will always be up-to-date with the recent changes to the HubSpot source data.
What key metrics can you export from HubSpot to Google Sheets?
Total sales
This metric reflects the aggregate revenue accrued from all successfully closed deals. Get insights into the overall effectiveness of sales strategies and business growth trajectory. Use this data to evaluate the company's revenue-generating capability.
To calculate total sales, sum the values of all won deals within a chosen timeframe.
Win rate
The win rate is the ratio of won deals to the total number of deals closed (both won and lost). It is a key indicator of the sales team's efficiency in converting opportunities into successes.
To calculate the win rate, divide the number of won deals by the total number of closed deals. The rate is usually displayed as a percentage, so multiply the result by 100.
Close rate
The close rate is the percentage of deals closed (won or lost) relative to the total deals initiated. This metric lets you assess the sales process's productivity and the sales team's capability to finalize deals.
To calculate the close rate, divide the number of closed deals by the number of all deals. To get a percentage, multiply the result by 100.
Average days to close
This metric indicates the average duration of either winning or losing a deal. It provides insights into the length of the sales cycle and the team's efficiency in closing deals.
To calculate the average days to close, sum up the number of days for all closed deals and divide them by the number of closed deals.
Pipeline value
Pipeline value is the total value of all deals currently in the sales pipeline. It offers a glimpse into potential future earnings. This metric is vital for forecasting revenue and planning resources.
To calculate the pipeline value, total the values of all deals currently open.
Open deals
Open deals represent all ongoing opportunities that are neither won nor lost yet. This metric is essential for monitoring active sales initiatives and potential income. It highlights the vibrancy of the sales pipeline.
To calculate open deals, simply count all deals that are currently active.
Projected sales
The projected sales metric represents an estimate of future sales revenue based on the current sales pipeline. It is crucial for forecasting revenue and making informed business decisions.
To calculate projected sales, sum up the value of all open deals.
Average open deal age
This metric shows how long an average deal remains open in the pipeline. It helps identify deals that may need more focus or resources to progress. This information reflects the pace at which deals move through the sales cycle.
To calculate the average open deal age, sum up the number of days that all open deals have been active in the pipeline and divide it by the number of open deals.
Connect HubSpot to Google Sheets or another destination
Coupler.io supports over 10 destinations for your HubSpot data. So, you can not only connect HubSpot to Google Sheets but load your data to data warehouses and even data visualization tools.
Moreover, you won't have to create connections from scratch. You can simply copy your existing importer and change the destination to the one that fits your needs. Here are the alternative destination apps for your HubSpot data:
Moreover, you won't have to create connections from scratch. You can simply copy your existing importer and change the destination to the one that fits your needs. Here are the alternative destination apps for your HubSpot data:
- Data warehouses, including BigQuery, PostgreSQL, and Redshift
- Business intelligence (BI) tools, including Looker Studio, Power BI, Tableau, and Qlik
- Spreadsheet apps, including Microsoft Excel and Google Sheets
- Other destinations are JSON and Monday.com