Send your Pipedrive data to Google Sheets with Coupler.io to simplify reporting
Get and prepare data effortlessly
Send your Pipedrive data to Google Sheets automatically with Coupler.io's no-code connector. Transform data to prepare it for analysis, combine it with records from other sources, and schedule imports, all in a single interface.
Automate reporting tasks
With Coupler.io, it only takes several clicks to automate your data reporting from Pipedrive to Google Sheets. Minimize copying and pasting, create reports on data from multiple apps, and use our dashboard templates.
Stand out as a data-driven expert
Deliver transparent, near real-time, data-driven insights to clients and stakeholders without much effort. Use Coupler.io's advanced data analytics to spend your valuable time on more strategic tasks rather than reporting.
Export data from Pipedrive to alternative destinations
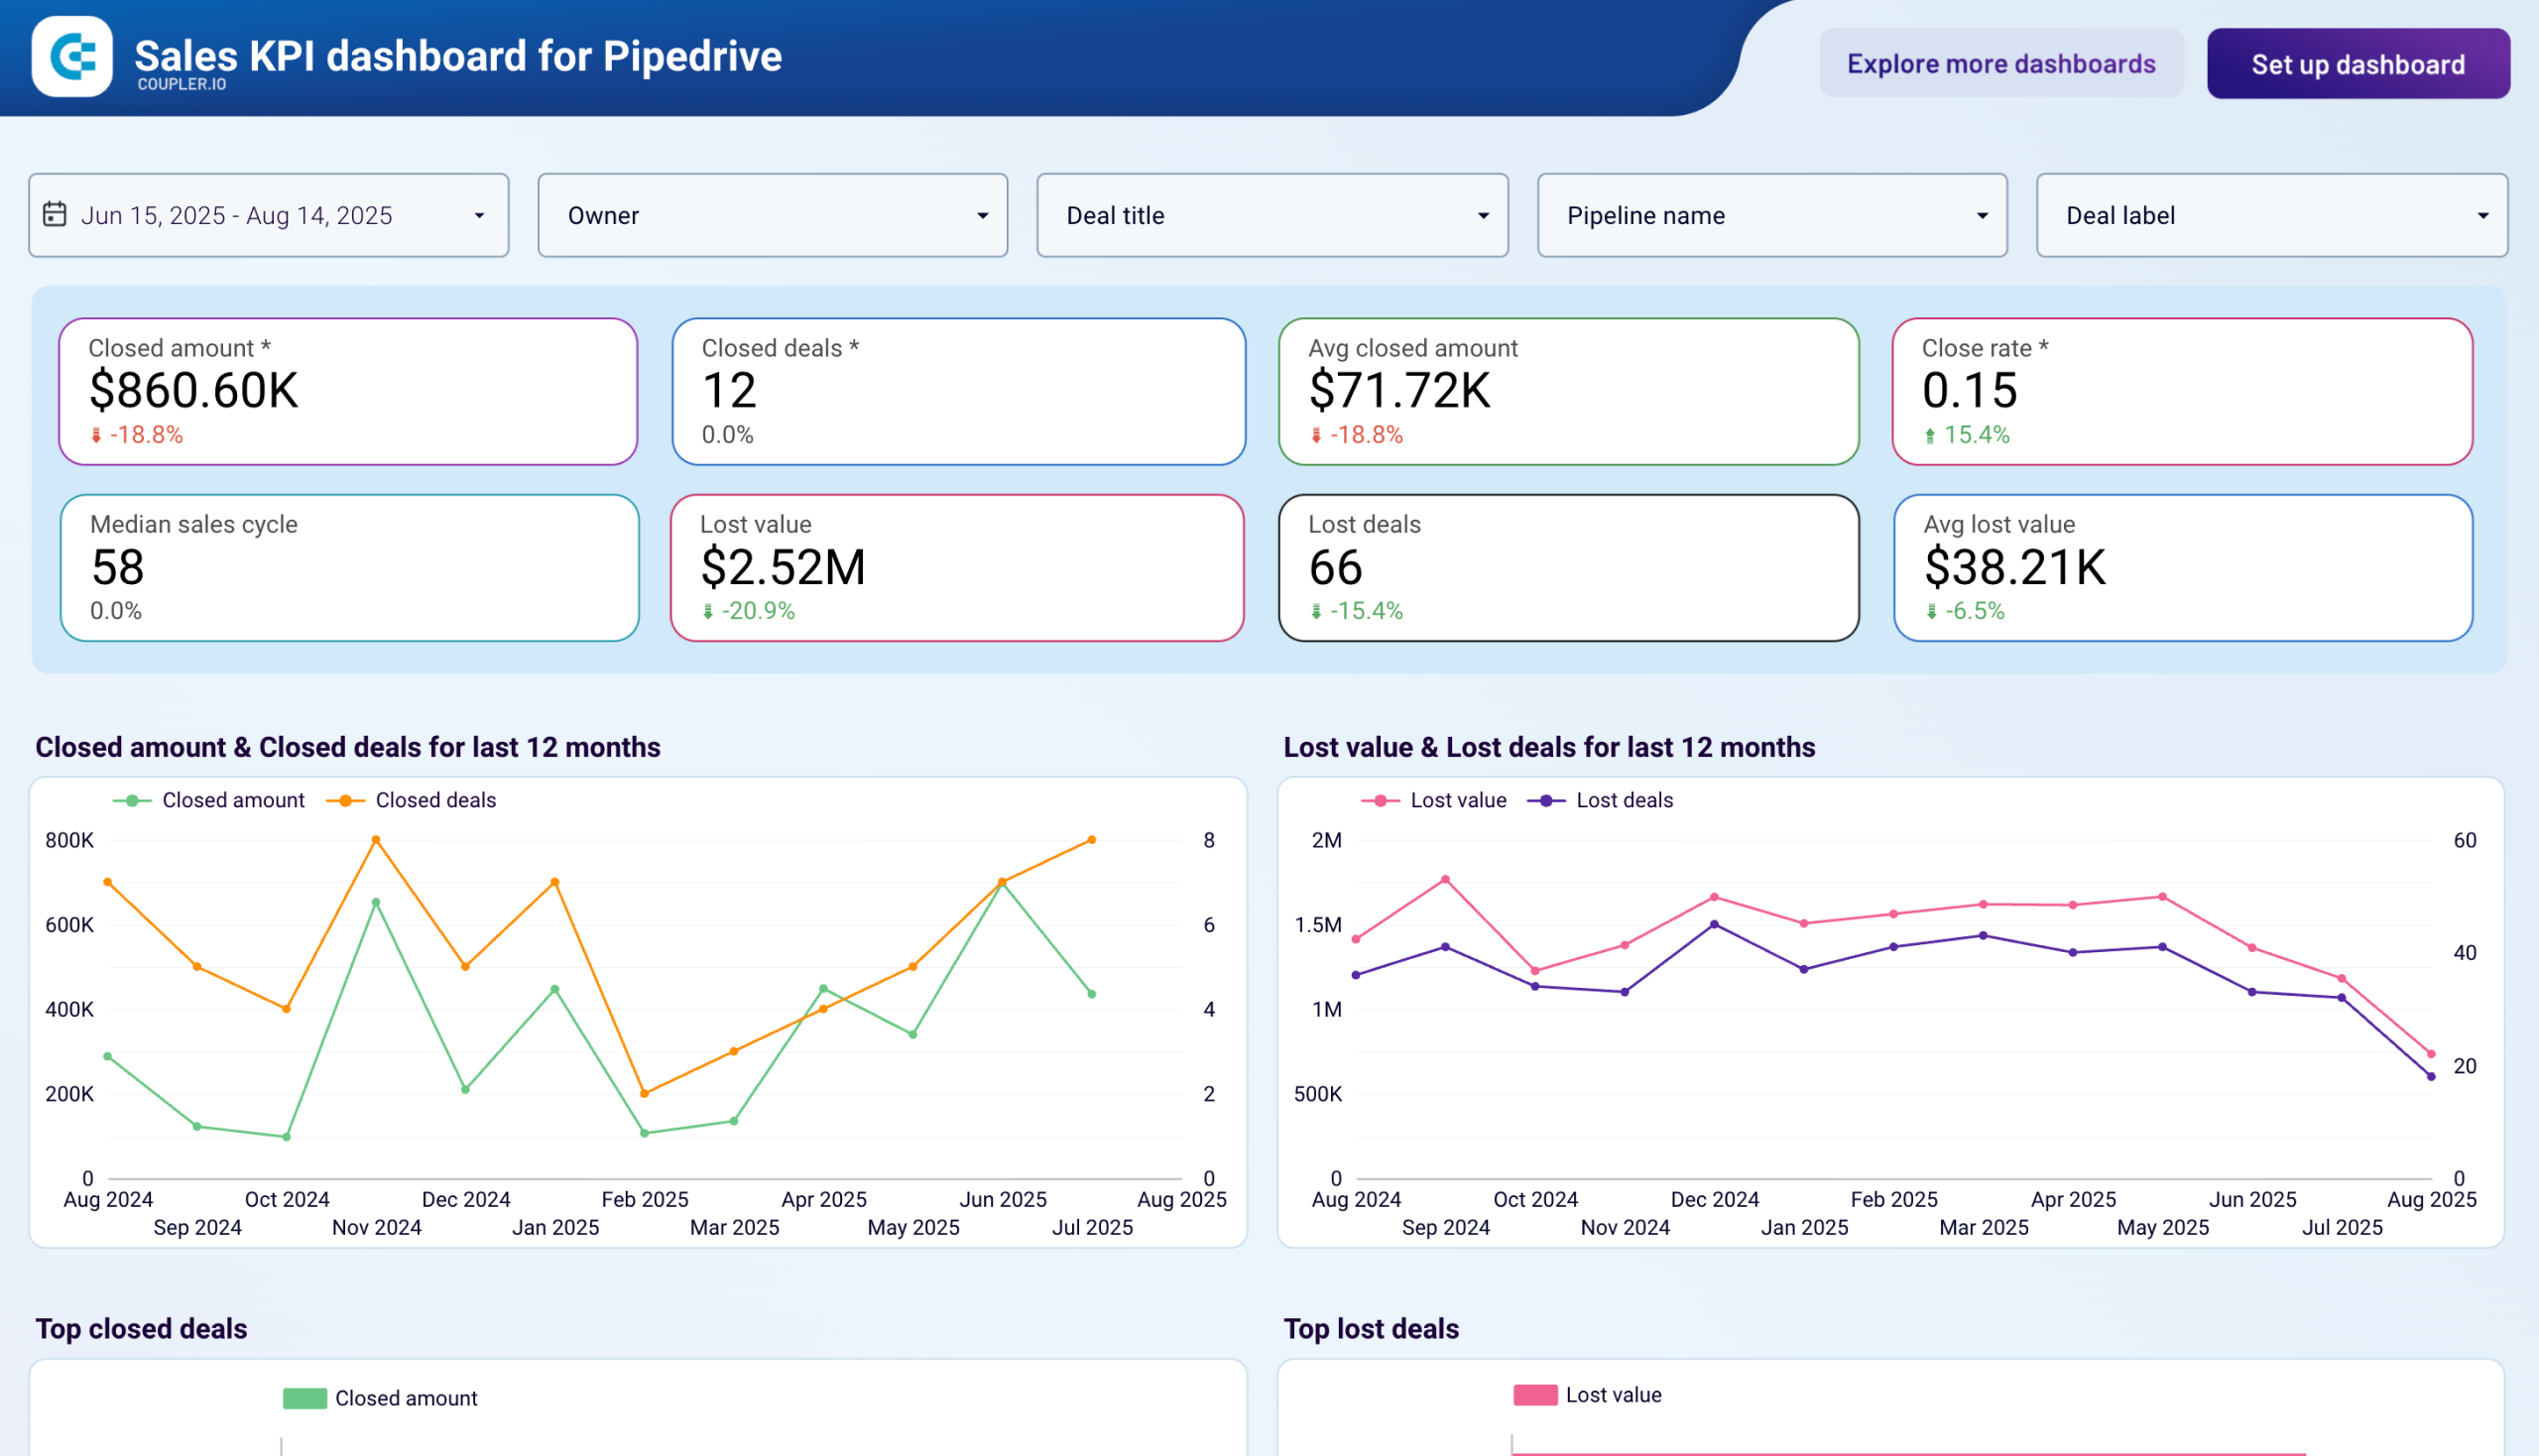
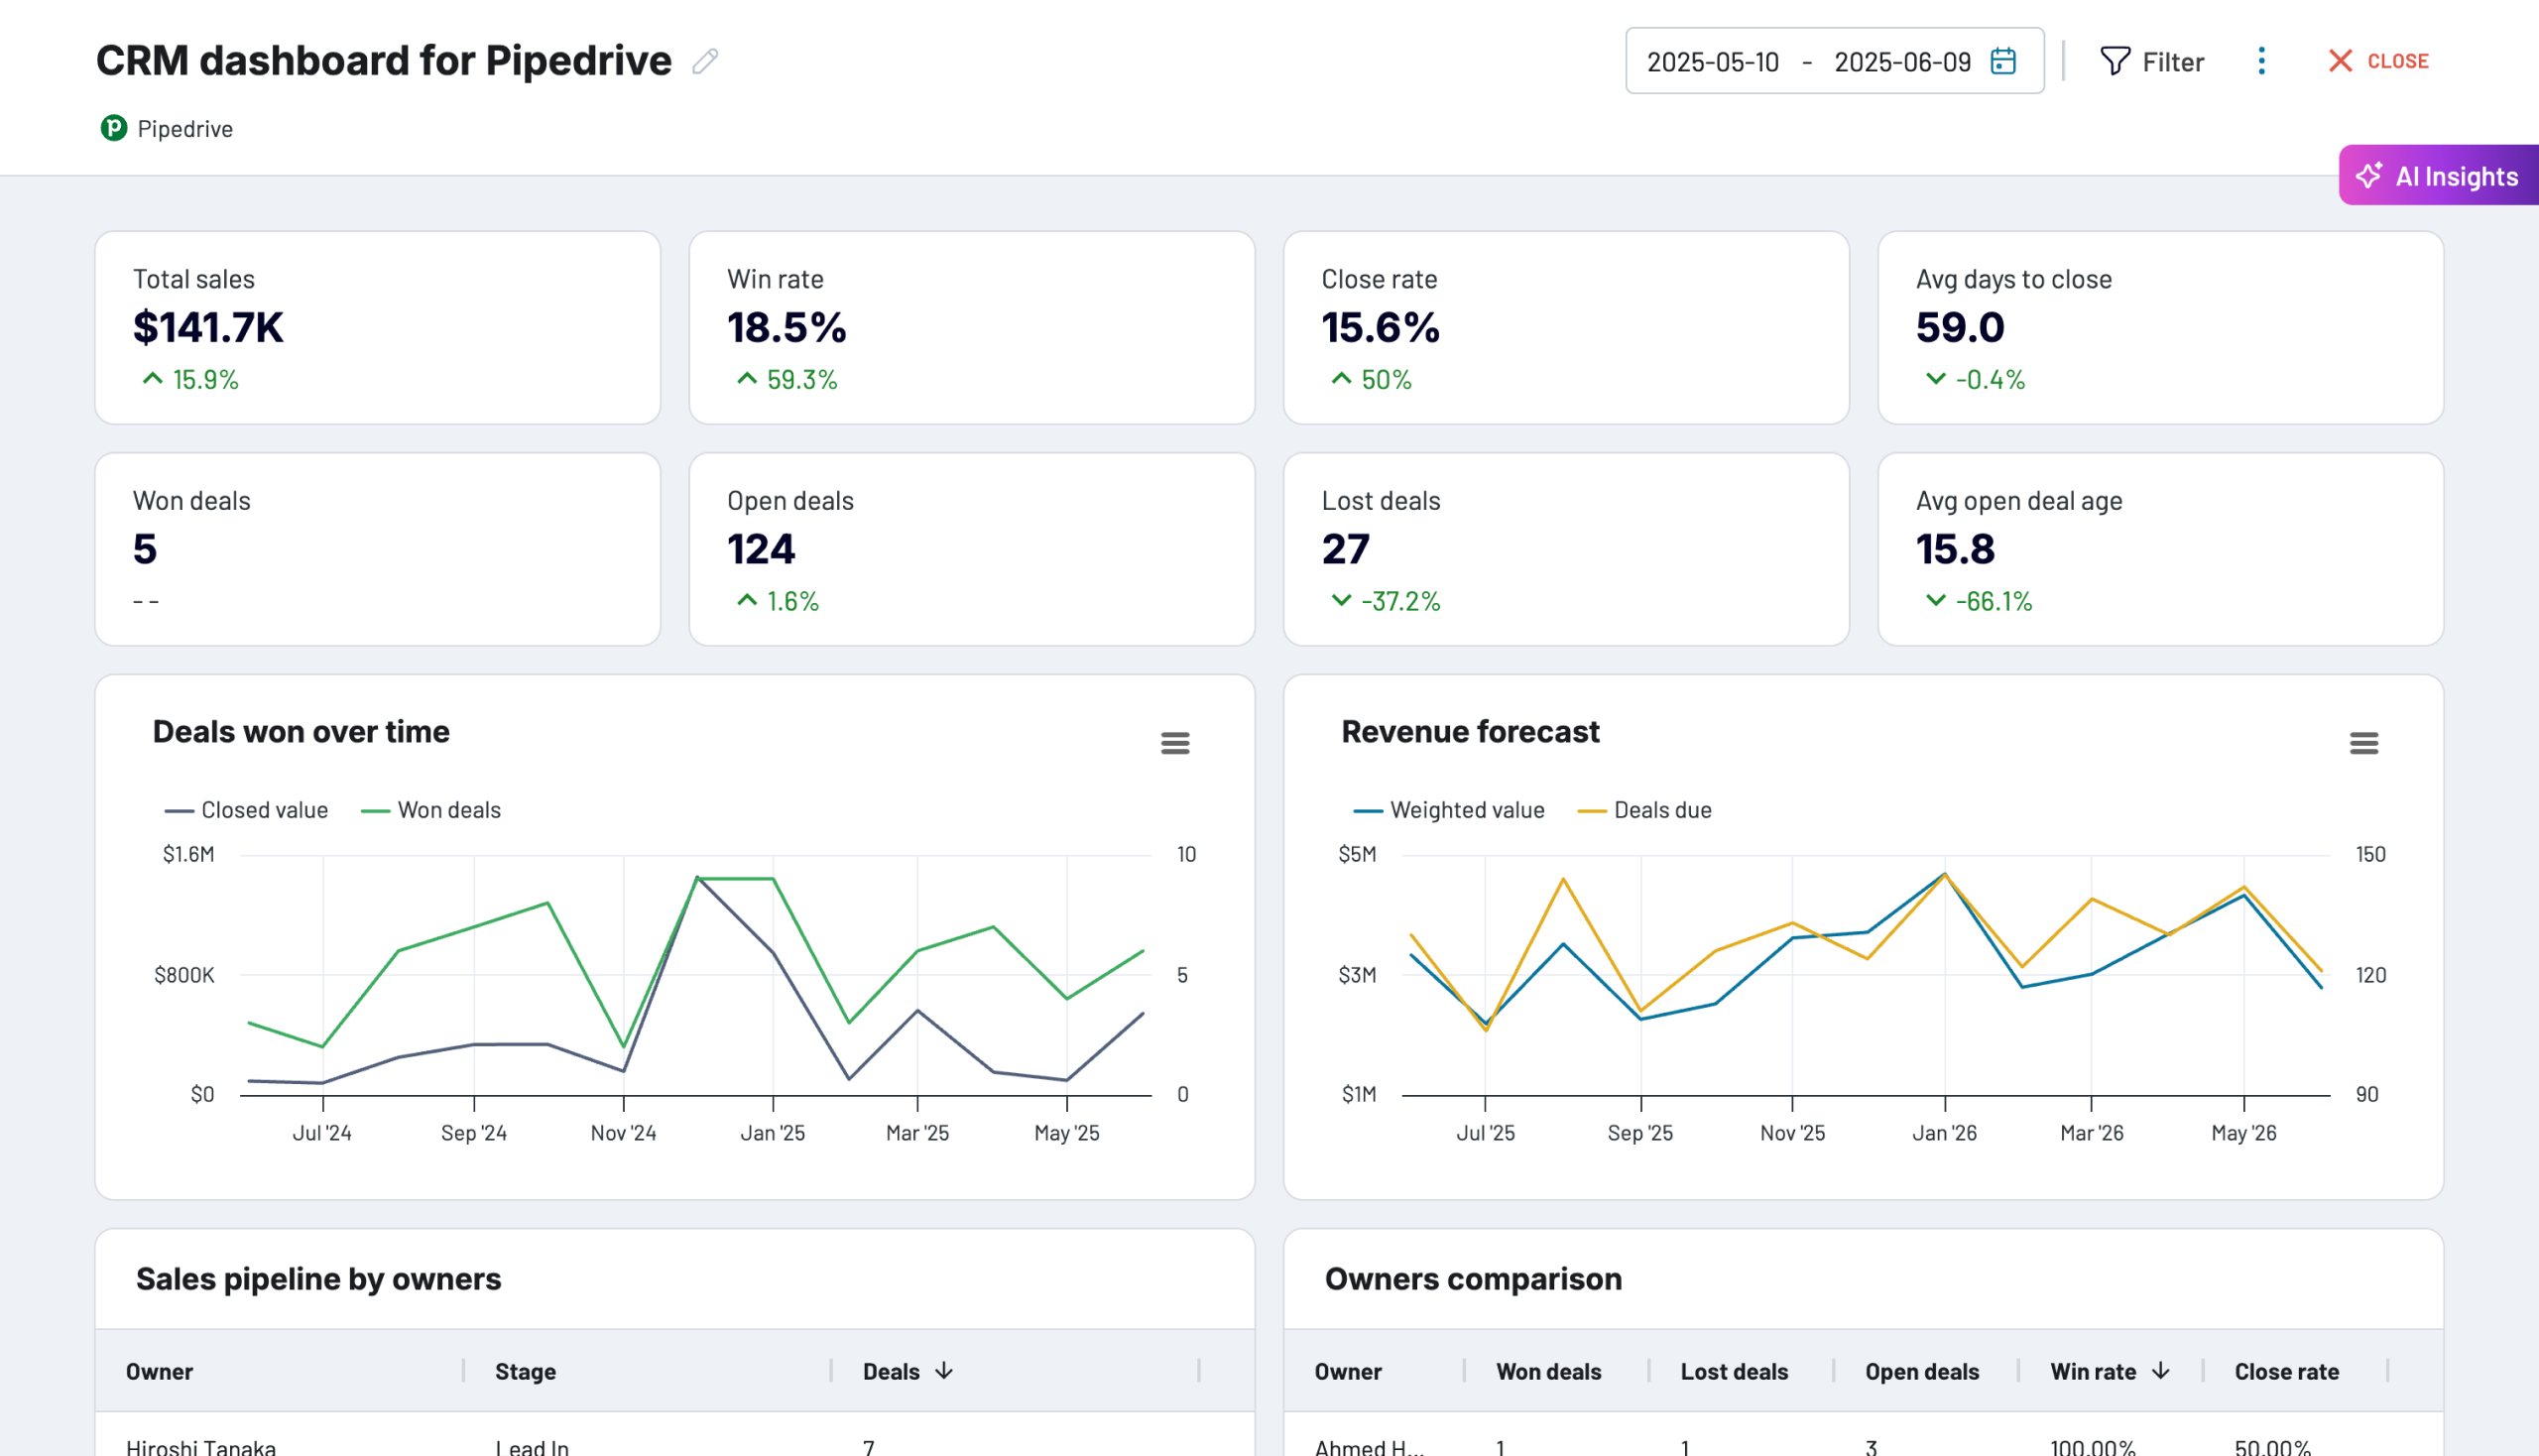
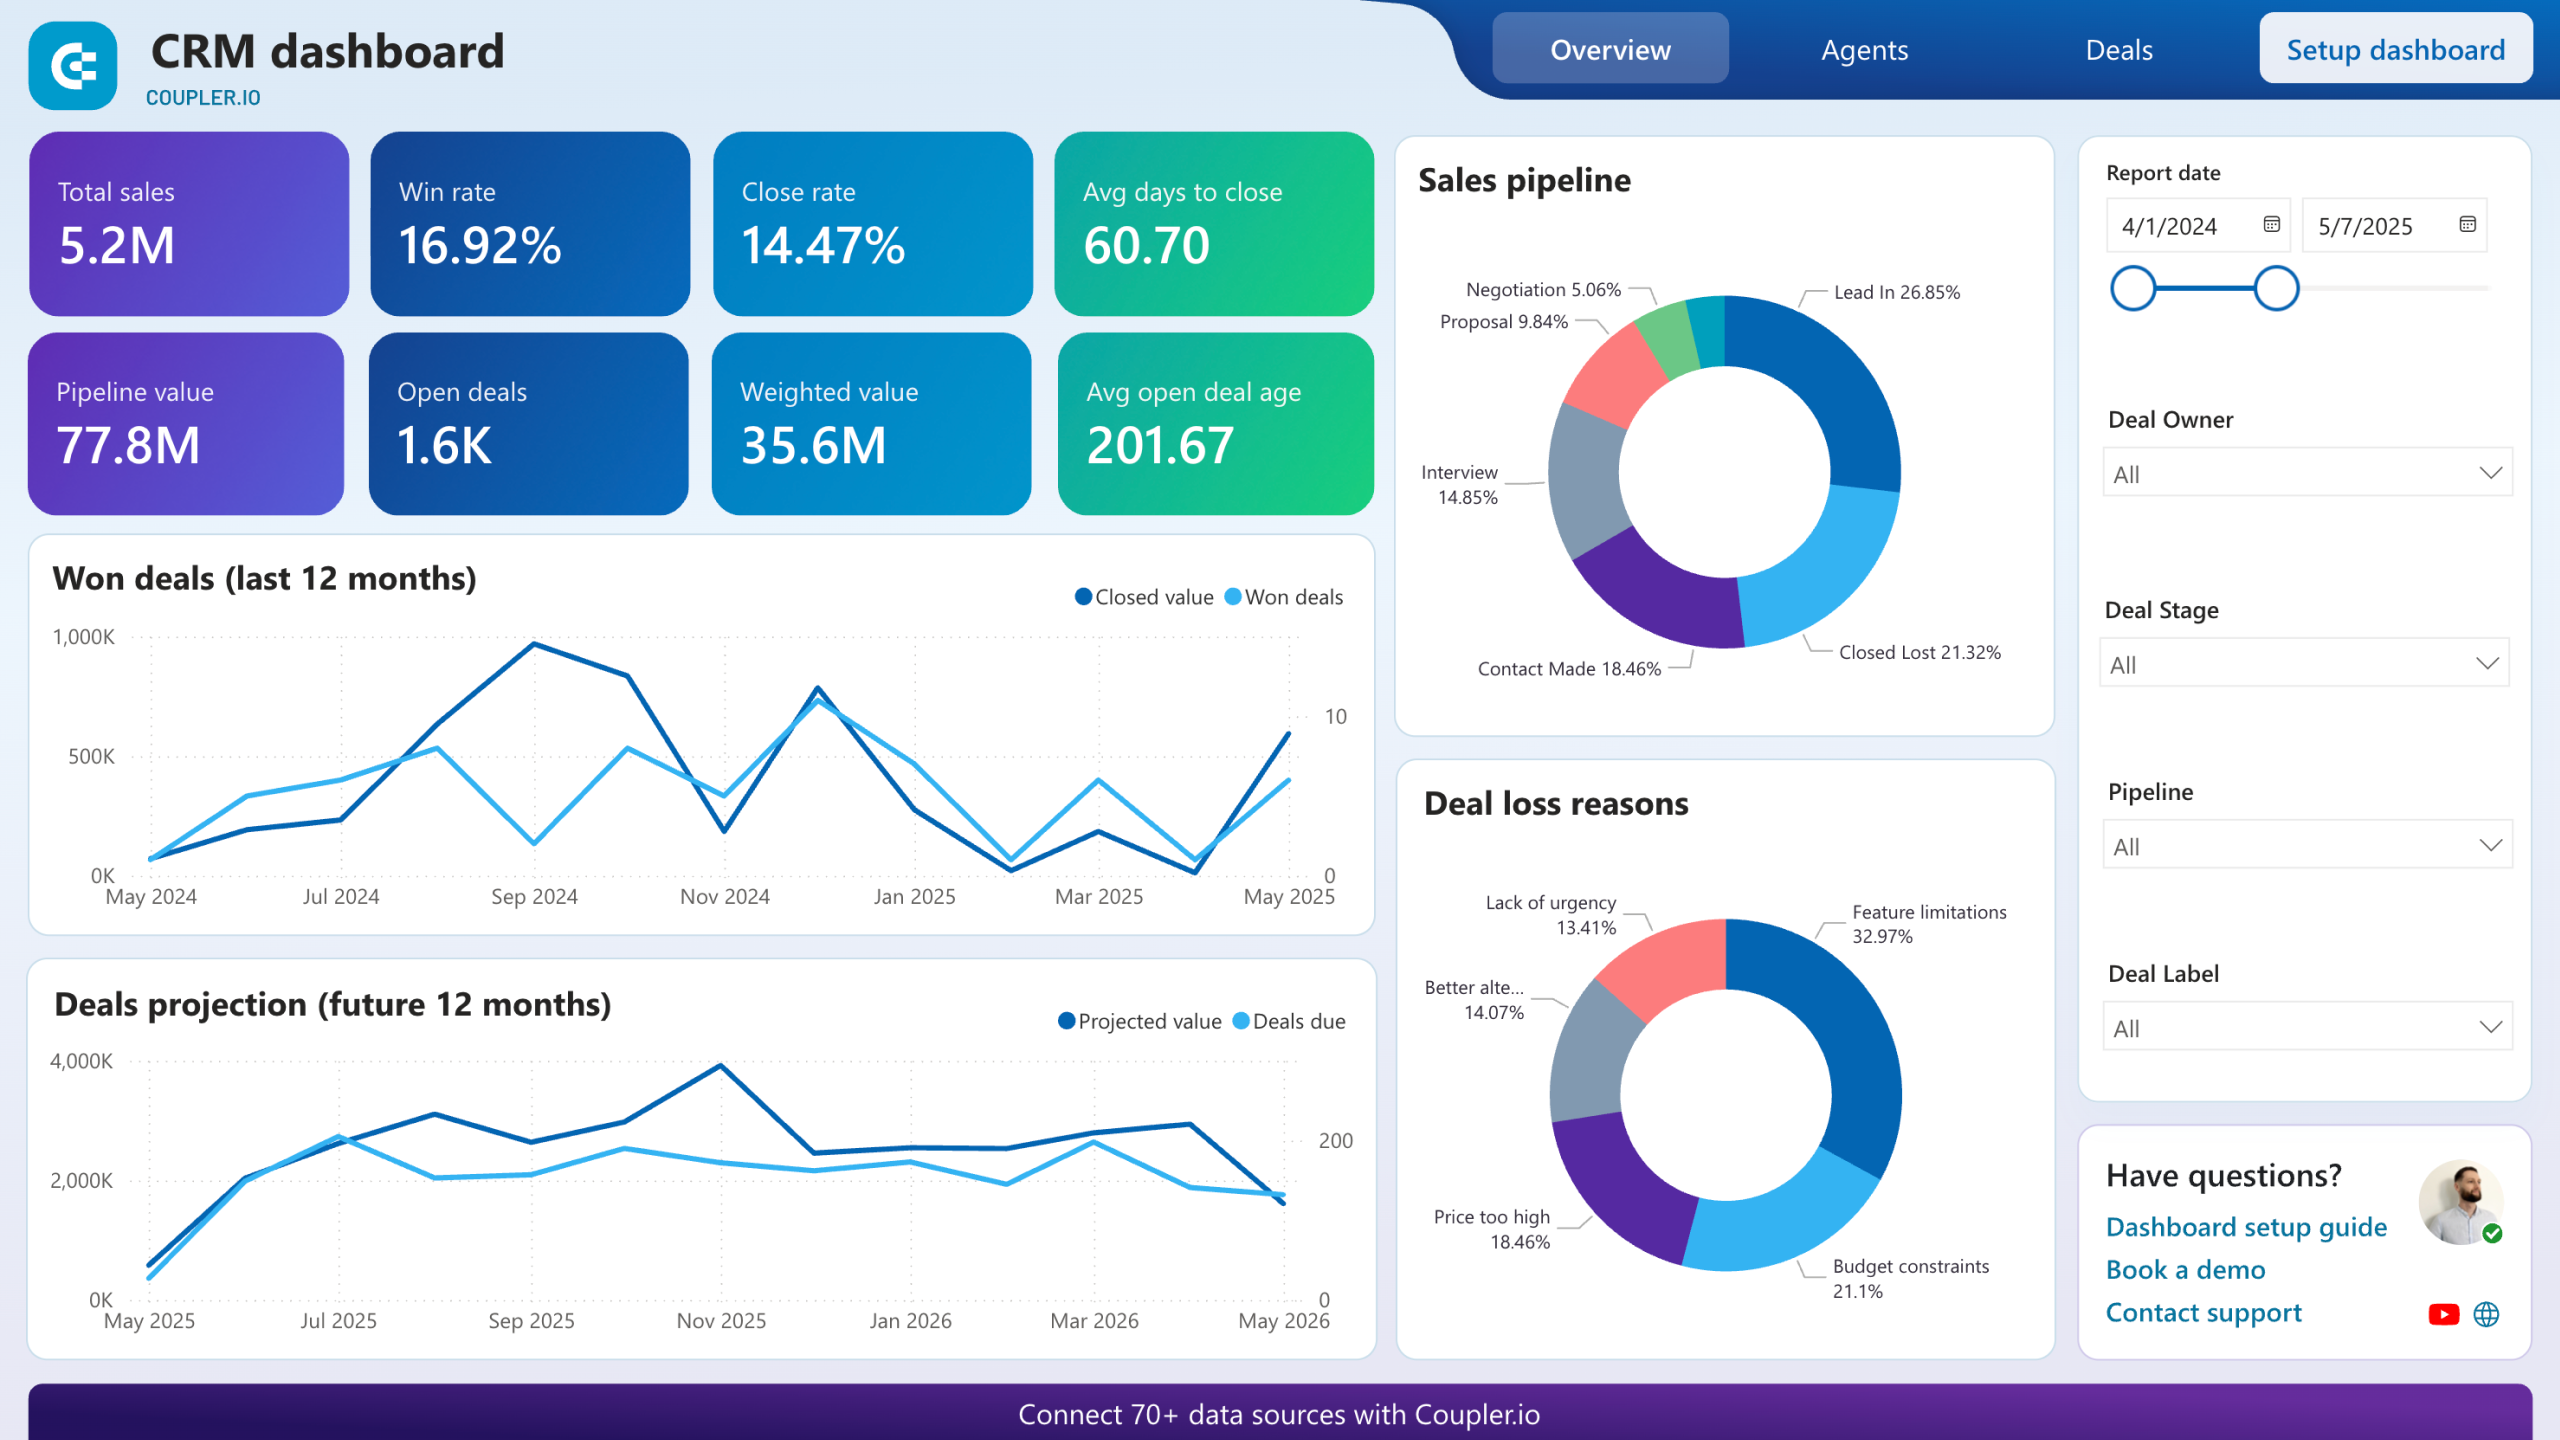
Quick start with CRM dashboard templates
No such template is available yet.
No worries. Our team will create a template that fits your needs, just tell us more
about your case. It doesn't cost you a penny 😉
Request a custom report
about your case. It doesn't cost you a penny 😉
Automate data exports from Pipedrive to Google Sheets with just a few clicks
Connect similar CRM apps and get data in minutes
Pipedrive to Google Sheets integration: what to export
Deals
Extract Deals data to view your sales transactions in detail. For example, it includes values, expected close dates, and associated contacts. Deals can help you track sales progress, forecast revenue, and analyze sales pipelines. This way, you improve your decision-making and strategy planning in real time.
Persons
Persons data is Pipedrive's contact information, such as names and associated deals. To manage your contact lists, connect Pipedrive to Google Sheets for data import. It enables you to segment customer data for targeted marketing campaigns. Additionally, you can maintain up-to-date records of customer interactions and preferences.
Organizations
Export Organizations for a structured overview of all companies in your Pipedrive CRM. You can see their industry, size, location, and relationship to deals and contacts. This data helps you analyze business relationships and track B2B sales efforts. As a result, you gain a better understanding of your market segments.
Activities
Activities include information linked to Pipedrive's sales processes. This data refers to all scheduled tasks, meetings, calls, and emails. You can export it to facilitate efficient tracking of sales activities. What's more, this helps assess team productivity. You can also ensure timely follow-ups and engagement with prospects and customers.
Files
Export Pipedrive to Google Sheets to enjoy data management benefits. By transferring Files data, you can keep a record of documents, presentations, and contracts related to your deals and contacts. It provides easy access to crucial sales materials. Besides, it enhances document management and supports compliance and auditing processes.
Leads
Leads comprise information on potential customers at the initial stage of the sales funnel. Export this data to track lead generation efforts and assess lead quality. It also helps you nurture leads through personalized marketing strategies. By doing so, you can improve conversion rates for your business.
Call logs
Call Logs provide a record of all calls made and received in Pipedrive. This data includes duration, outcome, and related notes. You can use these details to analyze call performance. This results in a better understanding of customer interactions. So you can refine sales and support strategies based on real insights.
Products
Products is another data type to select if you wish to export Pipedrive to Google Sheets. It enables you to view all items or services your company offers. This data includes information on pricing, categories, and association with deals. Using it, you can track inventory and analyze sales performance per product.
How to export Pipedrive to Google Sheets
Step 1. Connect your Pipedrive account and choose a data entity to export
Step 2. Organize and transform data before loading it to Google Sheets
Step 3. Connect your Google Sheets account and specify where to load your data
Step 4. Schedule data refresh to automate data flow from Pipedrive to Google Sheets
Pricing plans
- Monthly
- Annual (save 25%)
Keep your data safe
Coupler.io safeguards your shared information and data transfers from breaches, leaks, and unauthorized disclosures.

How to export Pipedrive to Google Sheets (detailed guide)
With Coupler.io, you can connect Pipedrive to Google Sheets in three simple steps:
Step 1: Collect data
Begin by authorizing your Pipedrive account. Then, you'll have to select the specific data type you'd like to export.
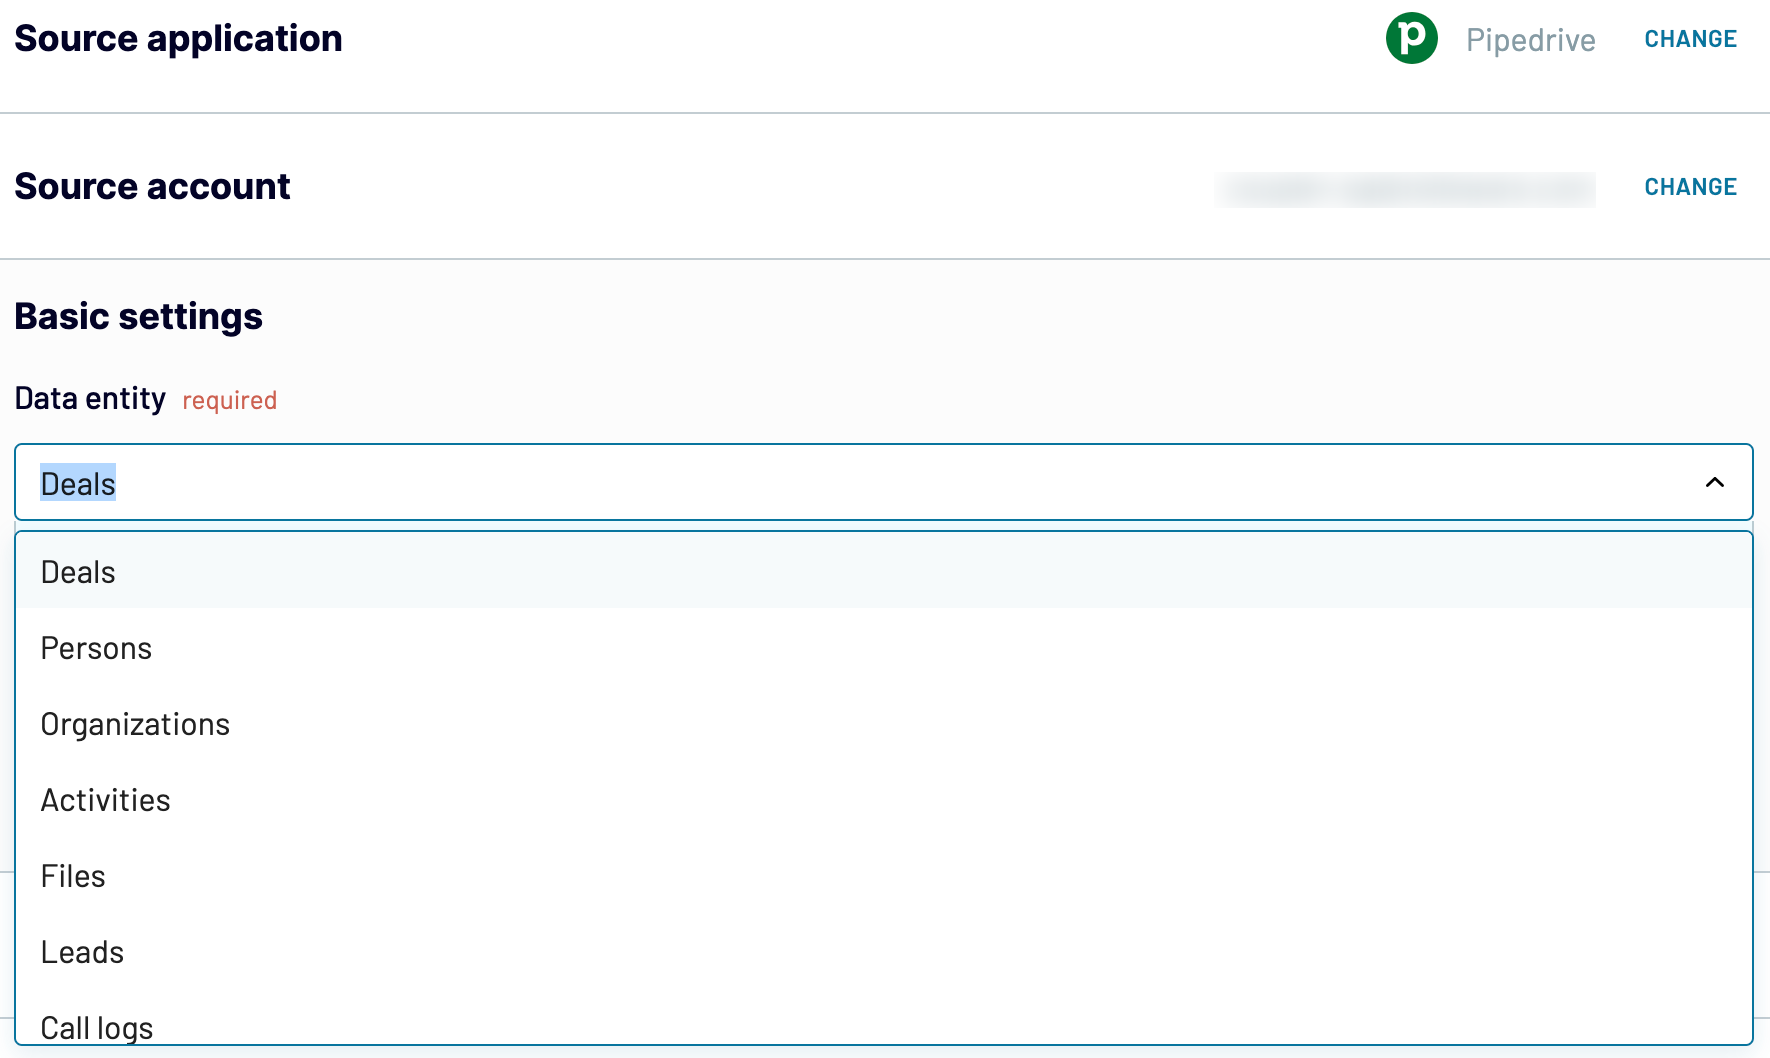
Once you have chosen the data entity, click Finish and proceed. Then, press Transform data to move on to the next step.
Step 2: Organize and transform
Before importing your Pipedrive data to Google Sheets, preview it to ensure everything is correct. At this step, Coupler.io enables you to make various transformations to your data:
This way, you can customize your data to fit reporting and analysis requirements.
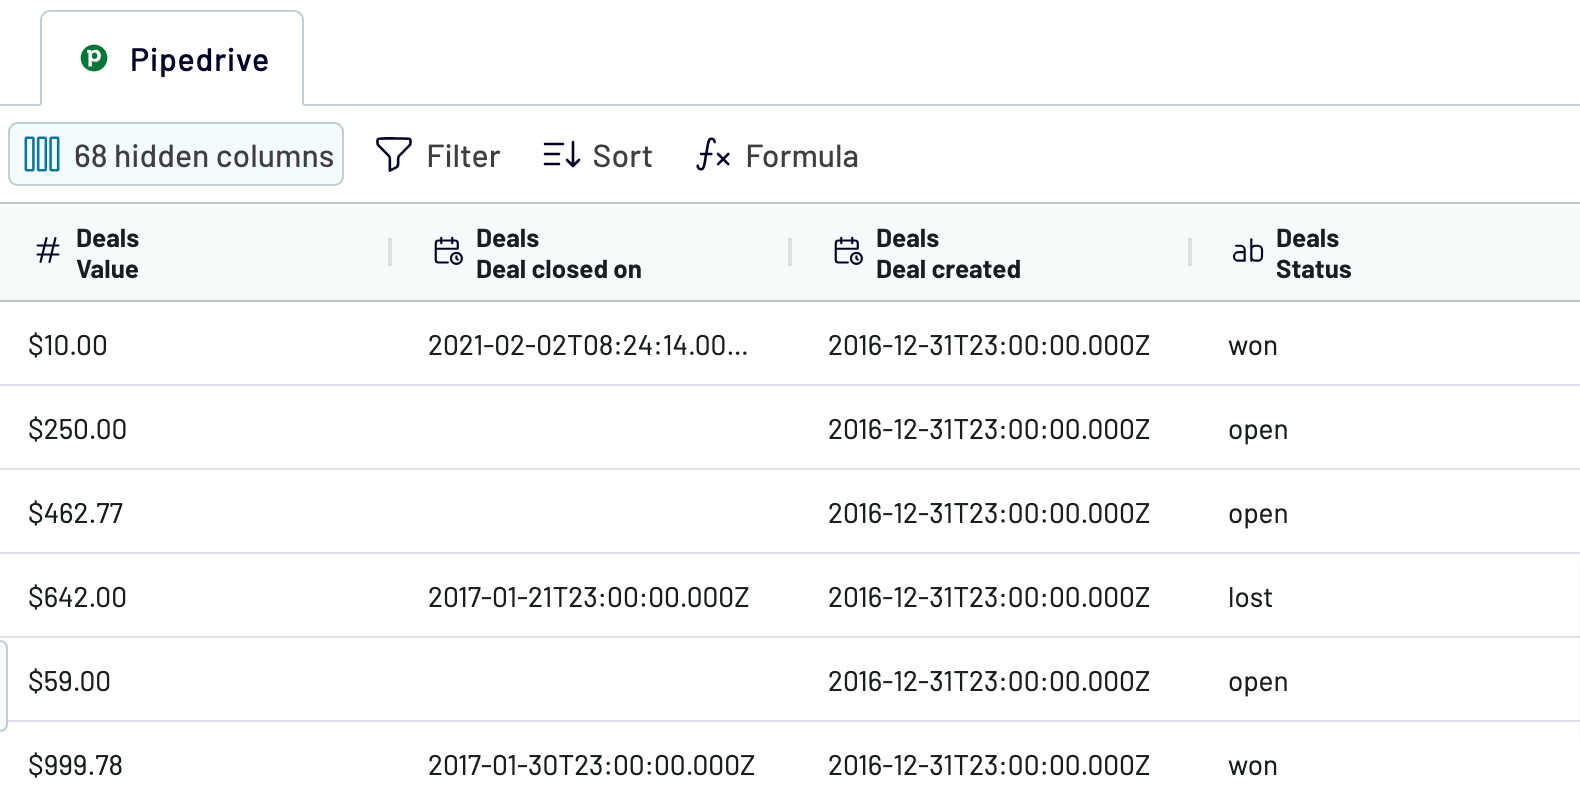
If your data is in order, click Proceed.
Step 3: Load and automate
Now, it's time to authorize your Google Sheets account. Next, to load your data from Pipedrive to Google Sheets, you must choose the destination spreadsheet and sheet. Alternatively, you can create a new sheet by specifying its name in the dedicated field.
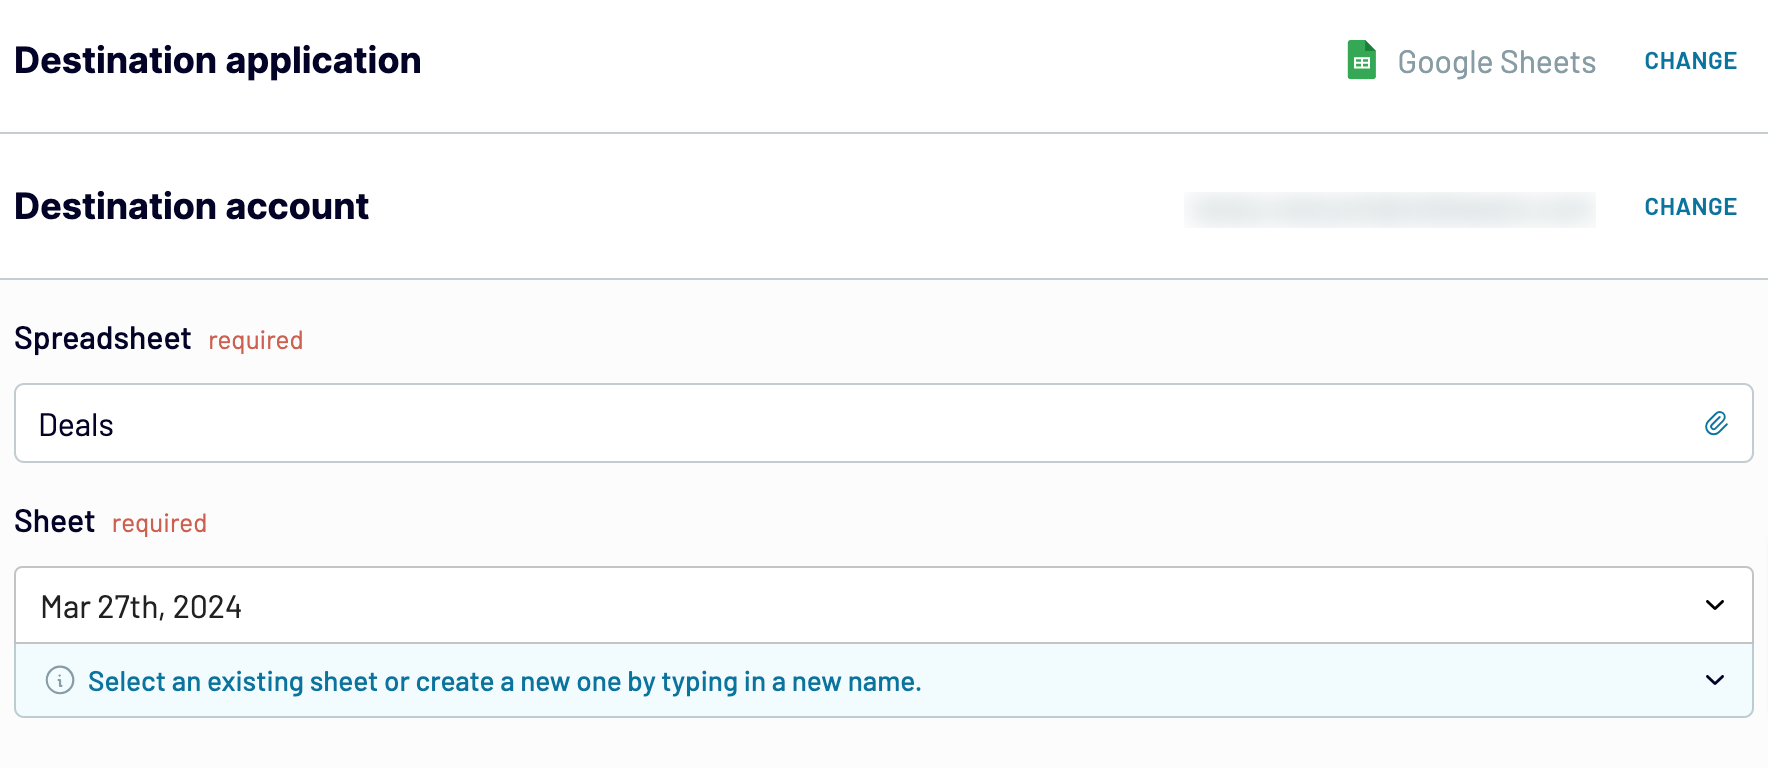
After that, click Setup a schedule to toggle on automatic data refreshes and choose the preferred interval. Finally, press Run importer to load your Pipedrive data to Google Sheets.
Step 1: Collect data
Begin by authorizing your Pipedrive account. Then, you'll have to select the specific data type you'd like to export.

Once you have chosen the data entity, click Finish and proceed. Then, press Transform data to move on to the next step.
Step 2: Organize and transform
Before importing your Pipedrive data to Google Sheets, preview it to ensure everything is correct. At this step, Coupler.io enables you to make various transformations to your data:
- Rename, rearrange, hide, or add columns
- Apply filters and sort data
- Create new columns with custom formulas
- Combine data from several accounts or apps
This way, you can customize your data to fit reporting and analysis requirements.

If your data is in order, click Proceed.
Step 3: Load and automate
Now, it's time to authorize your Google Sheets account. Next, to load your data from Pipedrive to Google Sheets, you must choose the destination spreadsheet and sheet. Alternatively, you can create a new sheet by specifying its name in the dedicated field.

After that, click Setup a schedule to toggle on automatic data refreshes and choose the preferred interval. Finally, press Run importer to load your Pipedrive data to Google Sheets.
Connect Pipedrive to Google Sheets and automate data exports on schedule
By turning on automated data refreshes, you ensure your report is ever-updating. You can customize the refresh schedule to meet your specific reporting needs.
Choose from monthly, daily, hourly, or even more frequent intervals: every 30 or 15 minutes. Further, specify particular days of the week. Then, set a precise time preference and select the appropriate timezone.

This level of customization enables you to keep your reports in tune with the latest changes to the source. So you can focus on analysis and strategy rather than manual updates.
Choose from monthly, daily, hourly, or even more frequent intervals: every 30 or 15 minutes. Further, specify particular days of the week. Then, set a precise time preference and select the appropriate timezone.

This level of customization enables you to keep your reports in tune with the latest changes to the source. So you can focus on analysis and strategy rather than manual updates.
What key metrics can you export from Pipedrive to Google Sheets?
Total sales
Description: Total sales represent the cumulative revenue generated from all won deals. This measurement provides insights into overall sales performance and growth trends. It can help you evaluate your success in generating revenue.
How to calculate: sum up the value of all deals marked as won within a specified period.
Win rate
Description: Win rate is the percentage of deals won compared to the total number of deals closed (won and lost). This metric assesses sales efficiency and effectiveness. It indicates how often opportunities convert into sales.
How to calculate: divide the number of won deals by the total closed deals, then multiply by 100.
Close rate
Description: Close rate measures the proportion of all closed deals against the total number of deals. It illustrates the sales cycle's productivity and the sales team's ability to bring deals to a conclusion.
How to calculate: divide closed deals by total deals and multiply by 100.
Average days to close
Description: Average days to close refers to the average number of days to win or lose a deal. By demonstrating the sales cycle length, this metric lets you understand time efficiency in closing deals.
How to calculate: average the total number of days all closed deals have been open.
Pipeline value
Description: Pipeline value represents the total monetary value of all open deals in the sales pipeline. It gives a snapshot of potential future revenue, assisting in forecasting and resource allocation. This figure is critical for sales planning and assessing the overall health of the sales funnel.
How to calculate: add together the value of each open deal.
Open deals
Description: Open deals quantify the number of opportunities in progress that have yet to be won or lost. This metric helps track sales activity and potential revenue. It clearly shows ongoing sales efforts and the pipeline's robustness.
How to calculate: count the total number of deals in progress.
Weighted value
Description: This is the estimate of potential revenue from open deals, adjusted for the probability of winning each deal. It offers a realistic forecast of future revenue, determining the likelihood of deal closure.
How to calculate: multiply the value of each deal by its win probability.
Average open deal age
Description: Average open deal age measures the average time open deals have been active. This metric helps identify deals that may require additional attention or resources to move forward. It indicates the pace at which deals progress through the pipeline.
How to calculate: average the number of days all open deals have been in the pipeline.
Connect Pipedrive data to Google Sheets or another destination
With Coupler.io, you are not limited to Google Sheets when exporting data from Pipedrive. Instead, you can easily replicate data importers and select new destinations from an extensive list. This way, you can meet various data management and analysis needs.
Alternative destination options include:
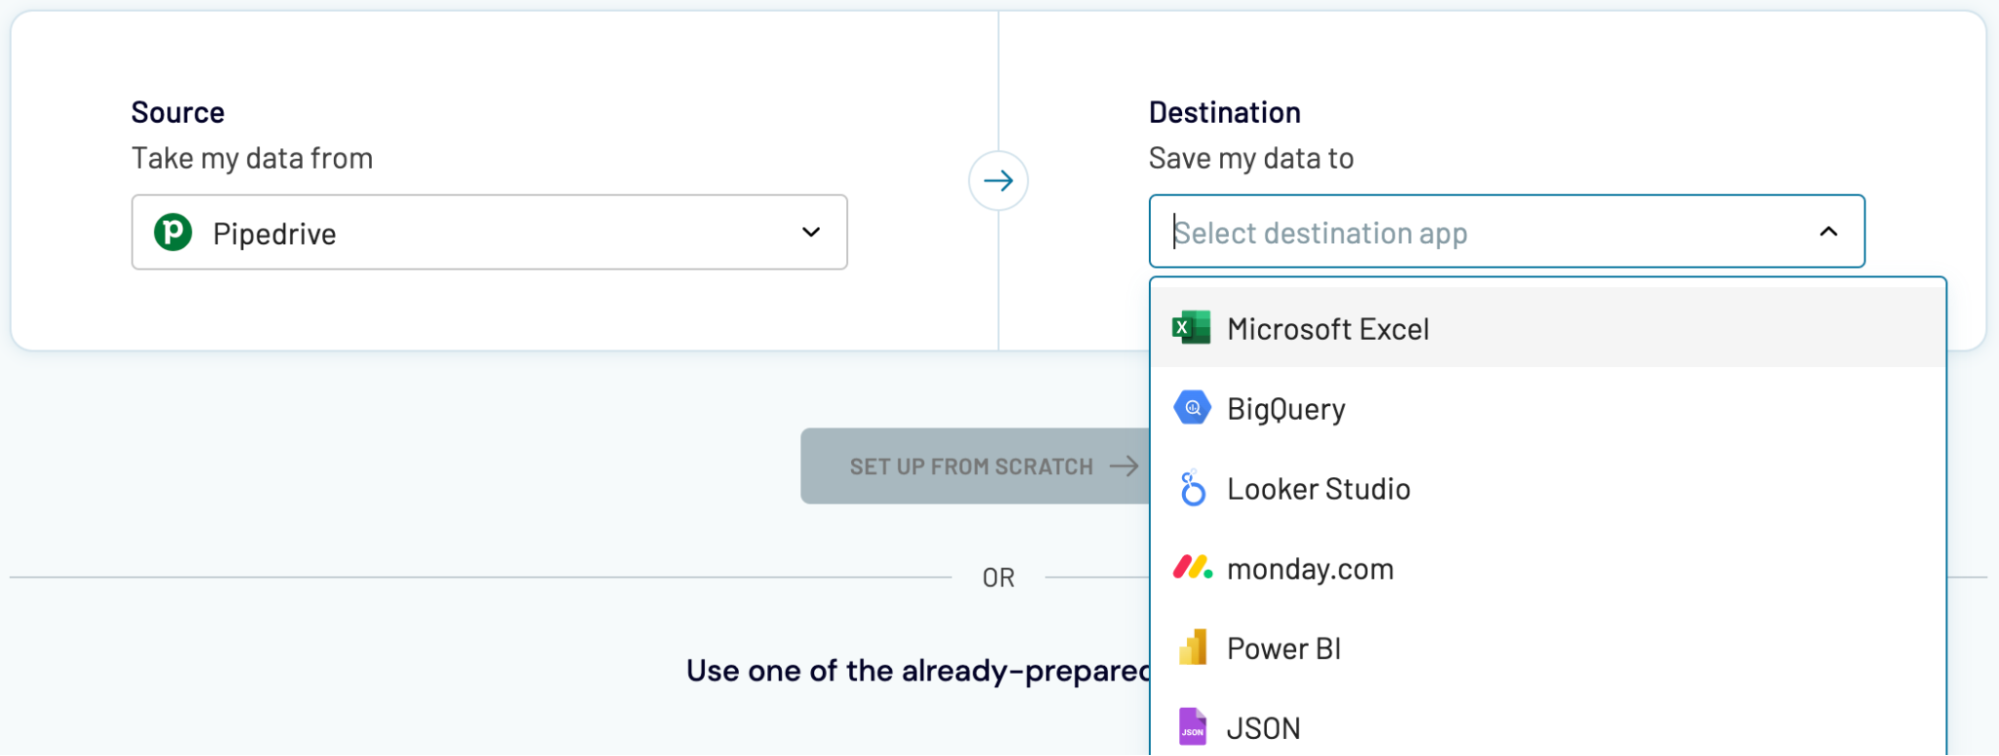
Just like with Google Sheets, Coupler.io ensures seamless integration of data into any other destination.
Alternative destination options include:
- Microsoft Excel, one more spreadsheet application
- Data warehouses (BigQuery, PostgreSQL, Redshift)
- Business intelligence (BI) tools (Looker Studio, Power BI, Tableau, Qlik)

Just like with Google Sheets, Coupler.io ensures seamless integration of data into any other destination.


