HubSpot to Tableau Integration
Use the HubSpot to Tableau integration to import data automatically in a matter of minutes. Extract your data without hassle, organize it as you prefer, and transform it into self-updating reports you'll be able to analyze right after importing.


Use Coupler.io's HubSpot to Tableau integration to simplify reporting

Get and prepare data effortlessly
Automate data imports from HubSpot to Tableau, even if you've never dealt with coding. You can export and adjust data on the go before sending it to the destination, set up a schedule for auto-updates, and load relevant records from multiple sources.

Automate reporting tasks
Сonnect HubSpot to Tableau in just a few simple steps. Spend little to no effort on manual activities, unite data from various source applications into a single report, and turn it into dynamic interactive visualizations using our free dashboard templates.

Stand out as a data-driven expert
Offer clear, nearly real-time updates to clients and stakeholders so you can demonstrate your professional skills through practical examples. Coupler.io's data analytics and automation free you up to focus on more important work and avoid tedious reporting.
Export data from HubSpot to alternative destinations


Quick start with CRM dashboard templates
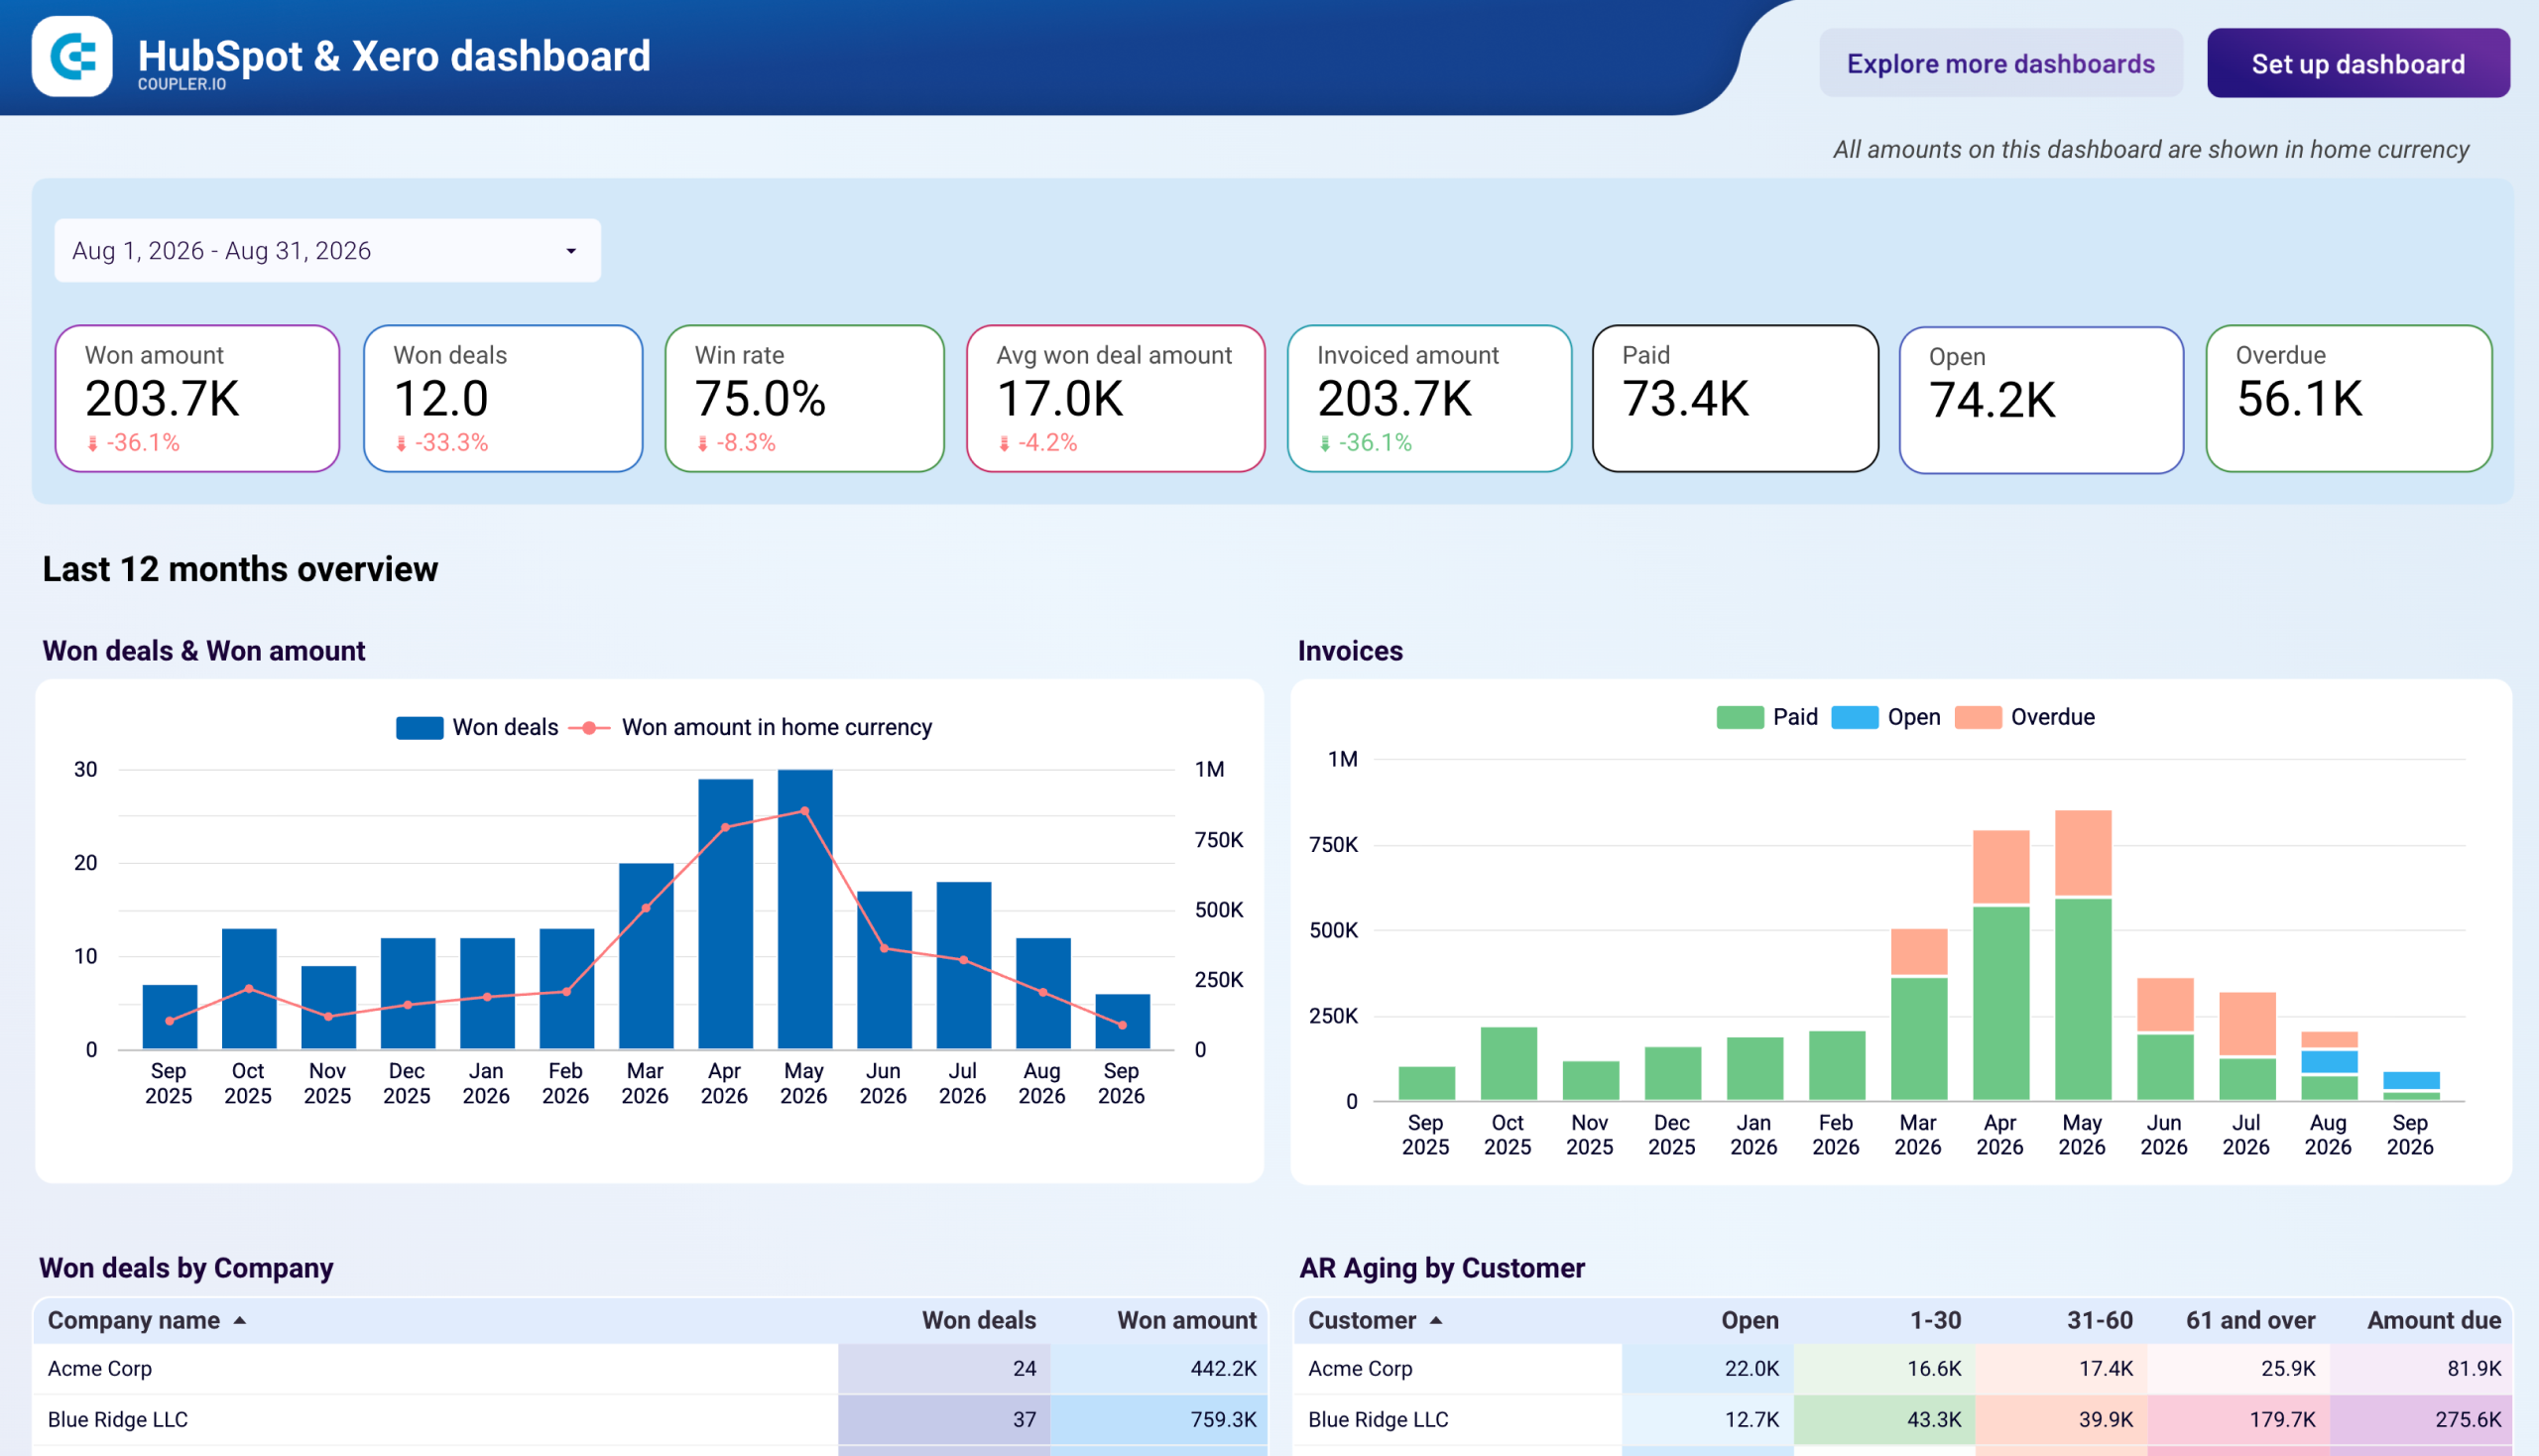
HubSpot & Xero dashboard
 +0
+0


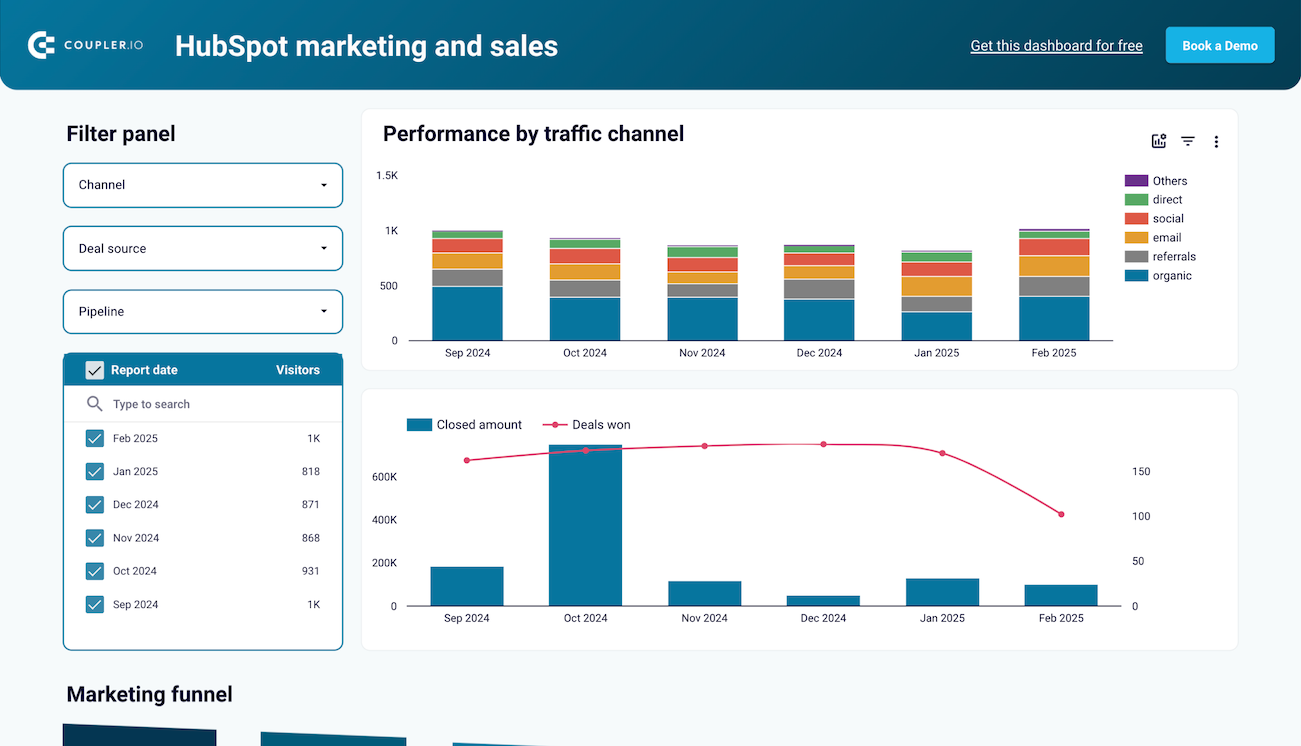
Marketing and sales performance dashboard for HubSpot
+0
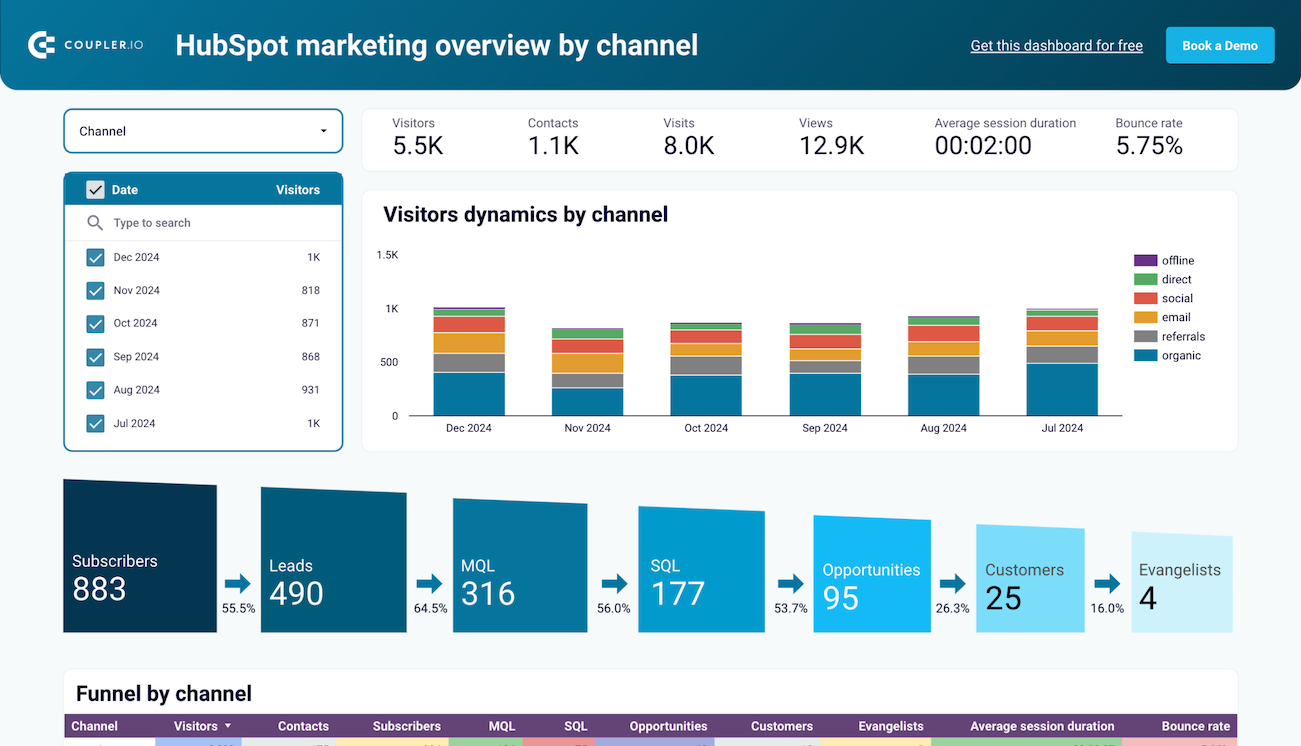
HubSpot marketing performance dashboard
+0
No such template is available yet.
No worries. Our team will create a template that fits your needs, just tell us more
about your case. It doesn't cost you a penny 😉
Request a custom report
about your case. It doesn't cost you a penny 😉
Connect HubSpot to Tableau automatically with just a few clicks.
Connect similar CRM apps and get data in minutes


What to export from HubSpot to Tableau

Deals
Transfer deal data from HubSpot to Tableau to track the progression of sales opportunities, analyze deal values, and forecast revenue. This information might help you understand sales pipelines, identify successful sales strategies, and recognize bottlenecks. By visualizing these details, you can better manage sales performance.
Contacts
You can also connect HubSpot to Tableau to import contact data. It includes detailed information about leads and customers as well as enables segmentation and targeted marketing efforts. Analyze customer demographics, track engagement, personalize communication, optimize customer interactions, and improve retention rates.
Companies
Based on this report, you can analyze your business-to-business interactions. It provides insights into the organizations you deal with, including industry, size, and engagement history. These details support account-based marketing strategies, assist in tracking company-specific sales performance, and help identify high-value clients.
Products
Product data from HubSpot enable a detailed analysis of your product portfolio. You can track product performance, sales trends, and profitability. By doing so, you can understand which products are driving revenue, identify opportunities for product development, optimize inventory management, and enhance your product offerings.
Taxes
This dataset allows you to perform a detailed financial analysis. It includes information on sales taxes collected, tax liabilities, and compliance status. You can use it to ensure accurate tax reporting, detect tax-related trends, manage obligations efficiently, avoid compliance issues, and take your financial planning to the next level.
Quotes
Leverage the HubSpot to Tableau integration to import data about sales processes, including information on quoted prices, quote acceptance rates, and customer feedback on quotes. Thanks to this info, you'll get a better idea of pricing strategies, identify successful quoting practices, and improve the accuracy of future quotes.
Meetings
Meeting data makes it easier to examine interaction frequency and quality with prospects and clients. It comprises information on meeting schedules, outcomes, and follow-up actions. This is crucial for assessing your sales and customer service teams, identifying engagement patterns, and managing client relationships.
Tasks
This kind of data lets you evaluate your team's productivity and task management. It includes details on task assignments, completion rates, and deadlines. By analyzing those, you can gain a firm understanding of workload distribution, identify bottlenecks, improve project supervision, and ensure timely completion of projects.
How do you use HubSpot to Tableau integration?
Step 1. Connect your HubSpot account and choose the data entity to export
30 seconds
Step 2. Organize and transform data before loading it into Tableau
30 seconds
Step 3. Connect the Tableau account and copy the integration URL to the desktop app
30 seconds
Step 4. Schedule refreshes to automate data flow from HubSpot to Tableau
10 seconds
Pricing plans
- Monthly
- Annual (save 25%)
Your data is secured by industry standards
 Google Cloud
Certified
 SOC 2 Type II
Certified
 GDPR
GDPRCompliant
 HIPAA
HIPAACompliant
Don’t just take our word for it





Dramatically improved our reporting speed by about 60%. The interface is user-friendly, even for team members with no technical background.
Helped solve data processing issues, and customer service is 10/10. It is extremely easy to use, and allows us to extract data from multiple sources.
How to integrate HubSpot to Tableau (detailed guide)
Сonnect HubSpot to Tableau by following the steps below:
Step 1: Collect data
To begin, connect your HubSpot account. Then, select the particular data type you'd like to extract.
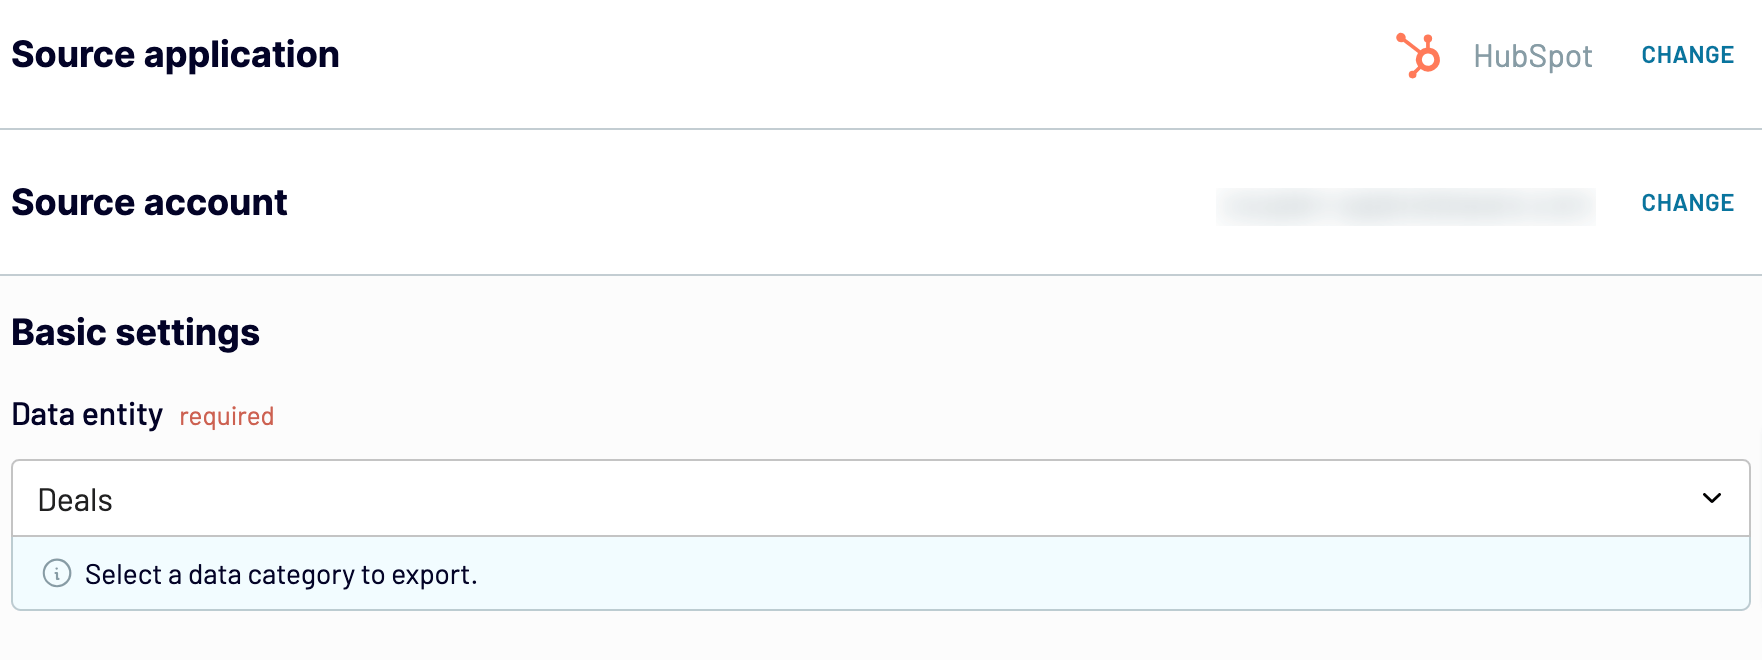
Once you've made your choice, move to the next step.
Step 2: Organize and transform
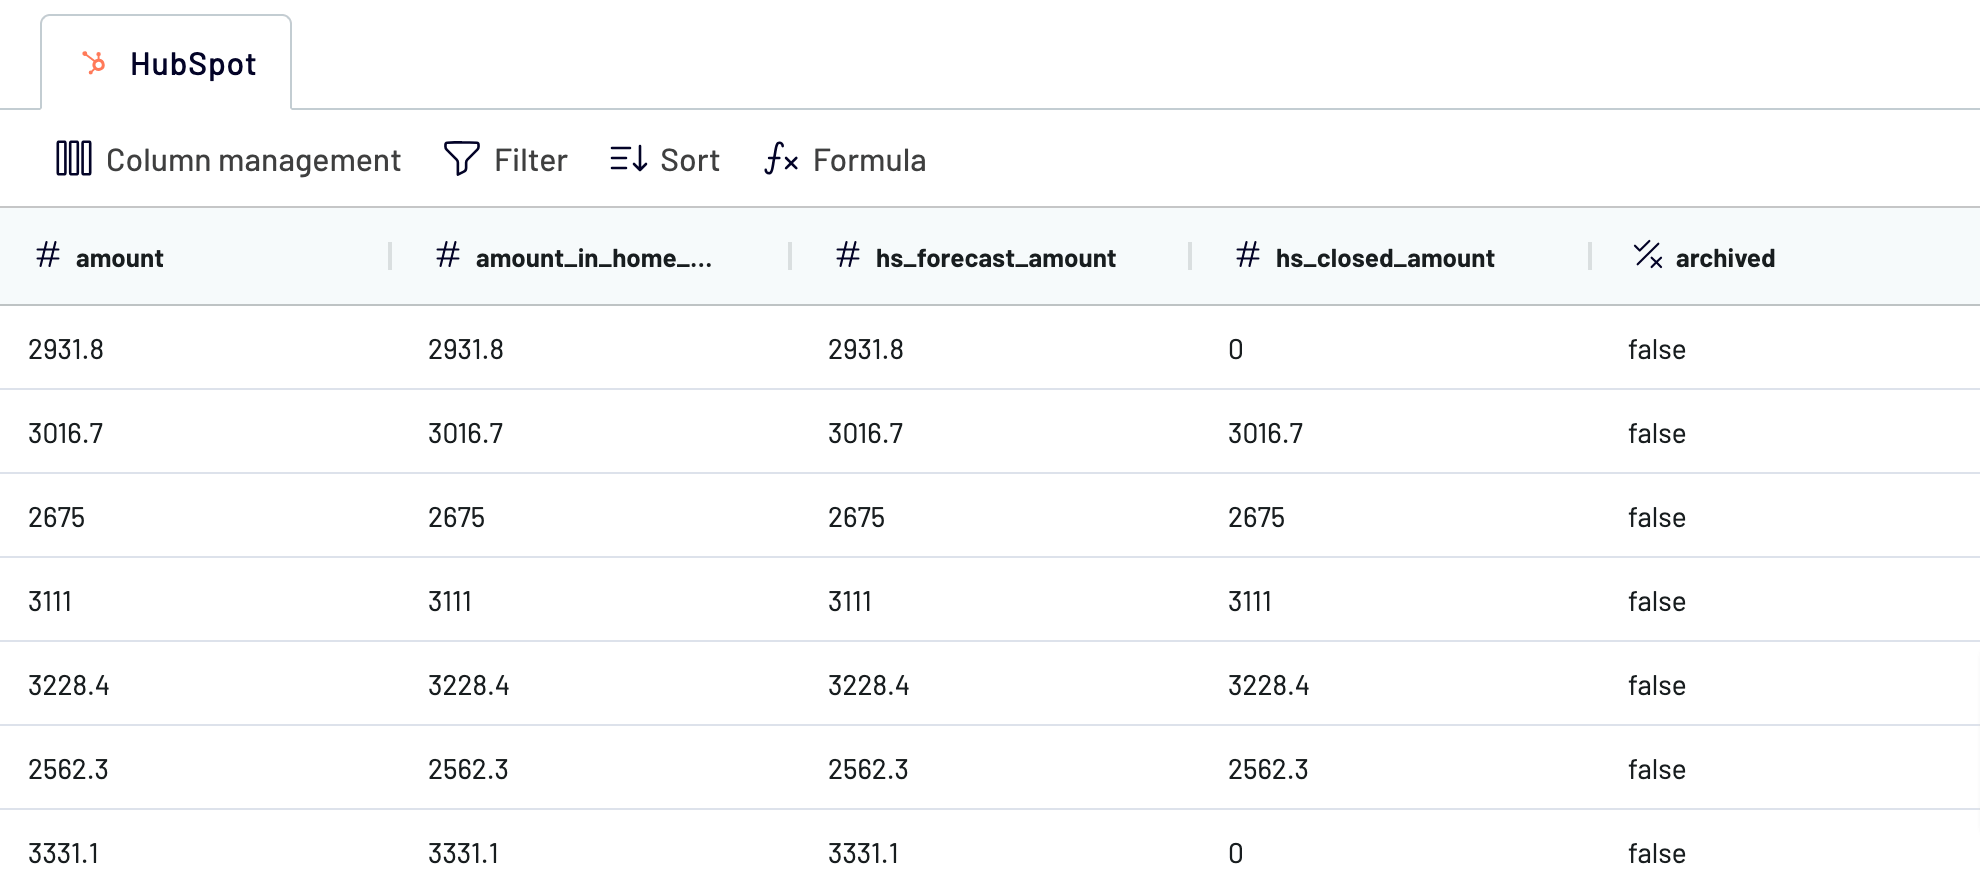
Before exporting data from HubSpot to Tableau, have a look at it to ensure it's organized as you prefer. If not, you can adjust it to your needs by making the following transformations:
After that, proceed to the destination settings.
Step 3: Load and automate
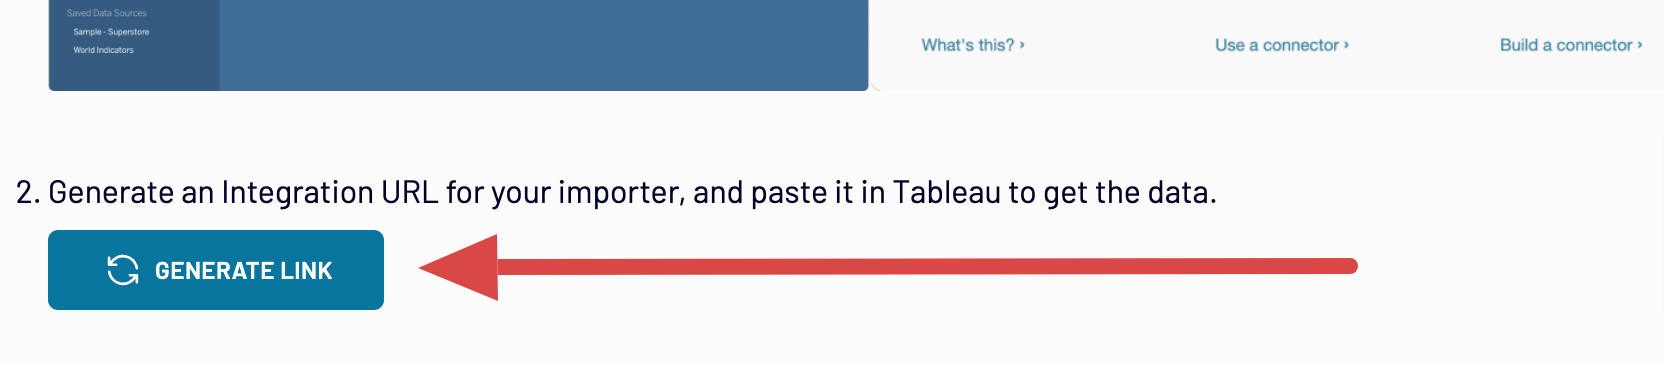
Generate a link to the integration URL. Then, schedule automated refreshes and run the importer. To get the things finally done, follow the connector setup instructions to complete the connection.
Step 1: Collect data
To begin, connect your HubSpot account. Then, select the particular data type you'd like to extract.
Once you've made your choice, move to the next step.
Step 2: Organize and transform
Before exporting data from HubSpot to Tableau, have a look at it to ensure it's organized as you prefer. If not, you can adjust it to your needs by making the following transformations:
- Edit, rearrange, hide, or add columns.
- Apply filters and sort data in the desired order.
- Create new columns with custom formulas.
- Combine data from different accounts or apps.
After that, proceed to the destination settings.
Step 3: Load and automate
Generate a link to the integration URL. Then, schedule automated refreshes and run the importer. To get the things finally done, follow the connector setup instructions to complete the connection.
Connect HubSpot to Tableau and automate data exports on schedule
Enable automatic data refresh to make your report self-updating. You've got a wide selection of intervals for updates: monthly, daily, hourly, or even every 30 or 15 minutes. In addition to that, you can also narrow your schedule to specific days of the week, pick the time slot, and choose the time zone.
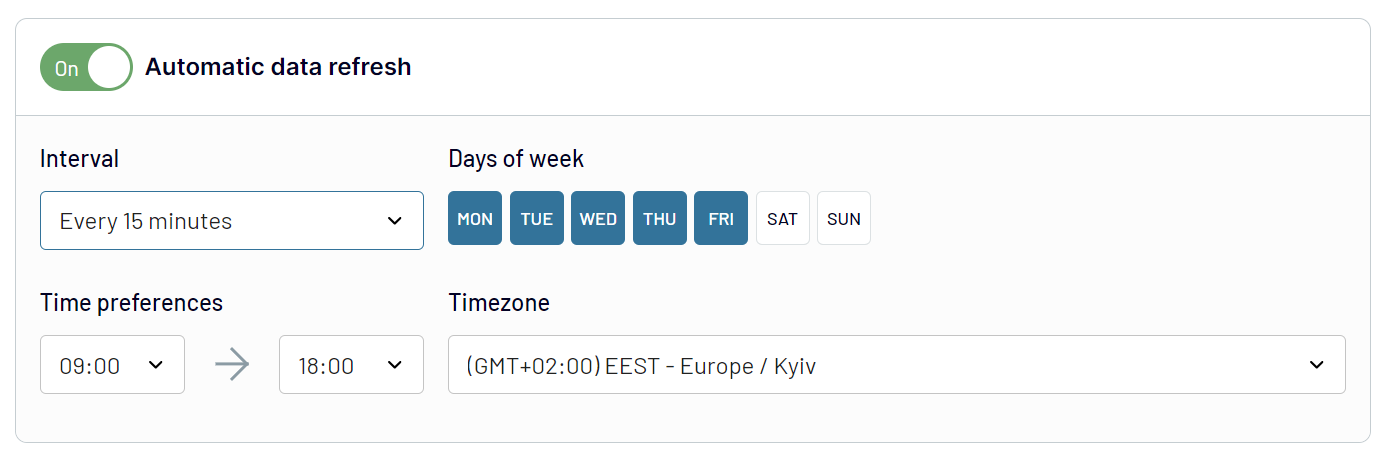
So, HubSpot to Tableau integration is not only a way to import but also receive the most recent data in accordance with rapidly changing records from the source.
So, HubSpot to Tableau integration is not only a way to import but also receive the most recent data in accordance with rapidly changing records from the source.
What key metrics can you export from HubSpot to Tableau?
Total revenue
Description: Total revenue refers to the sum of all income generated by a company over a specific period, typically measured monthly, quarterly, or annually.
How to calculate: To calculate total revenue, sum up the revenue generated from all sources, including sales of products or services, subscriptions, and any other income streams.
Revenue by product or service
Description: Revenue by product or service breaks down the total revenue into categories based on the different products or services offered by the company.
How to calculate: Divide the total revenue generated by each product or service by the total revenue.
Market penetration
Description: Market penetration measures the company's sales volume relative to the total market size.
How to calculate: Divide the company's total sales volume by the total potential market size and multiply by 100.
Percentage of revenue from new business
Description: Percentage of revenue from new business calculates the portion of total revenue that comes from acquiring new customers within a specific period.
How to calculate: Divide the revenue generated from new customers by the total revenue and multiply by 100.
Percentage of revenue from existing customers
Description: Percentage of revenue from existing customers measures the portion of total revenue generated from repeat business or sales to existing customers.
How to calculate: Divide the revenue generated from existing customers by the total revenue and multiply by 100.
Year-over-year growth
Description: Year-over-year growth compares the performance of a company in one period with the performance in the same period of the previous year.
How to calculate: Use the formula: (current year revenue - previous year revenue) / previous year revenue * 100
Average customer lifetime value
Description: Average customer lifetime value represents the average revenue generated from a customer over the entire duration of their relationship with the company.
How to calculate: Calculate the total revenue generated from a customer over their lifetime and divide it by the number of customers.
Net promoter score
Description: Net promoter score measures customer loyalty and satisfaction based on the likelihood of customers recommending the company's products or services to others.
How to calculate: Subtract the percentage of detractors (customers who are unlikely to recommend) from the percentage of promoters (customers who are highly likely to recommend).
Description: Total revenue refers to the sum of all income generated by a company over a specific period, typically measured monthly, quarterly, or annually.
How to calculate: To calculate total revenue, sum up the revenue generated from all sources, including sales of products or services, subscriptions, and any other income streams.
Revenue by product or service
Description: Revenue by product or service breaks down the total revenue into categories based on the different products or services offered by the company.
How to calculate: Divide the total revenue generated by each product or service by the total revenue.
Market penetration
Description: Market penetration measures the company's sales volume relative to the total market size.
How to calculate: Divide the company's total sales volume by the total potential market size and multiply by 100.
Percentage of revenue from new business
Description: Percentage of revenue from new business calculates the portion of total revenue that comes from acquiring new customers within a specific period.
How to calculate: Divide the revenue generated from new customers by the total revenue and multiply by 100.
Percentage of revenue from existing customers
Description: Percentage of revenue from existing customers measures the portion of total revenue generated from repeat business or sales to existing customers.
How to calculate: Divide the revenue generated from existing customers by the total revenue and multiply by 100.
Year-over-year growth
Description: Year-over-year growth compares the performance of a company in one period with the performance in the same period of the previous year.
How to calculate: Use the formula: (current year revenue - previous year revenue) / previous year revenue * 100
Average customer lifetime value
Description: Average customer lifetime value represents the average revenue generated from a customer over the entire duration of their relationship with the company.
How to calculate: Calculate the total revenue generated from a customer over their lifetime and divide it by the number of customers.
Net promoter score
Description: Net promoter score measures customer loyalty and satisfaction based on the likelihood of customers recommending the company's products or services to others.
How to calculate: Subtract the percentage of detractors (customers who are unlikely to recommend) from the percentage of promoters (customers who are highly likely to recommend).
Import data from HubSpot to Tableau or another destination
Besides HubSpot to Tableau integration, Coupler.io makes it possible for you to replicate importers to load data into other apps:
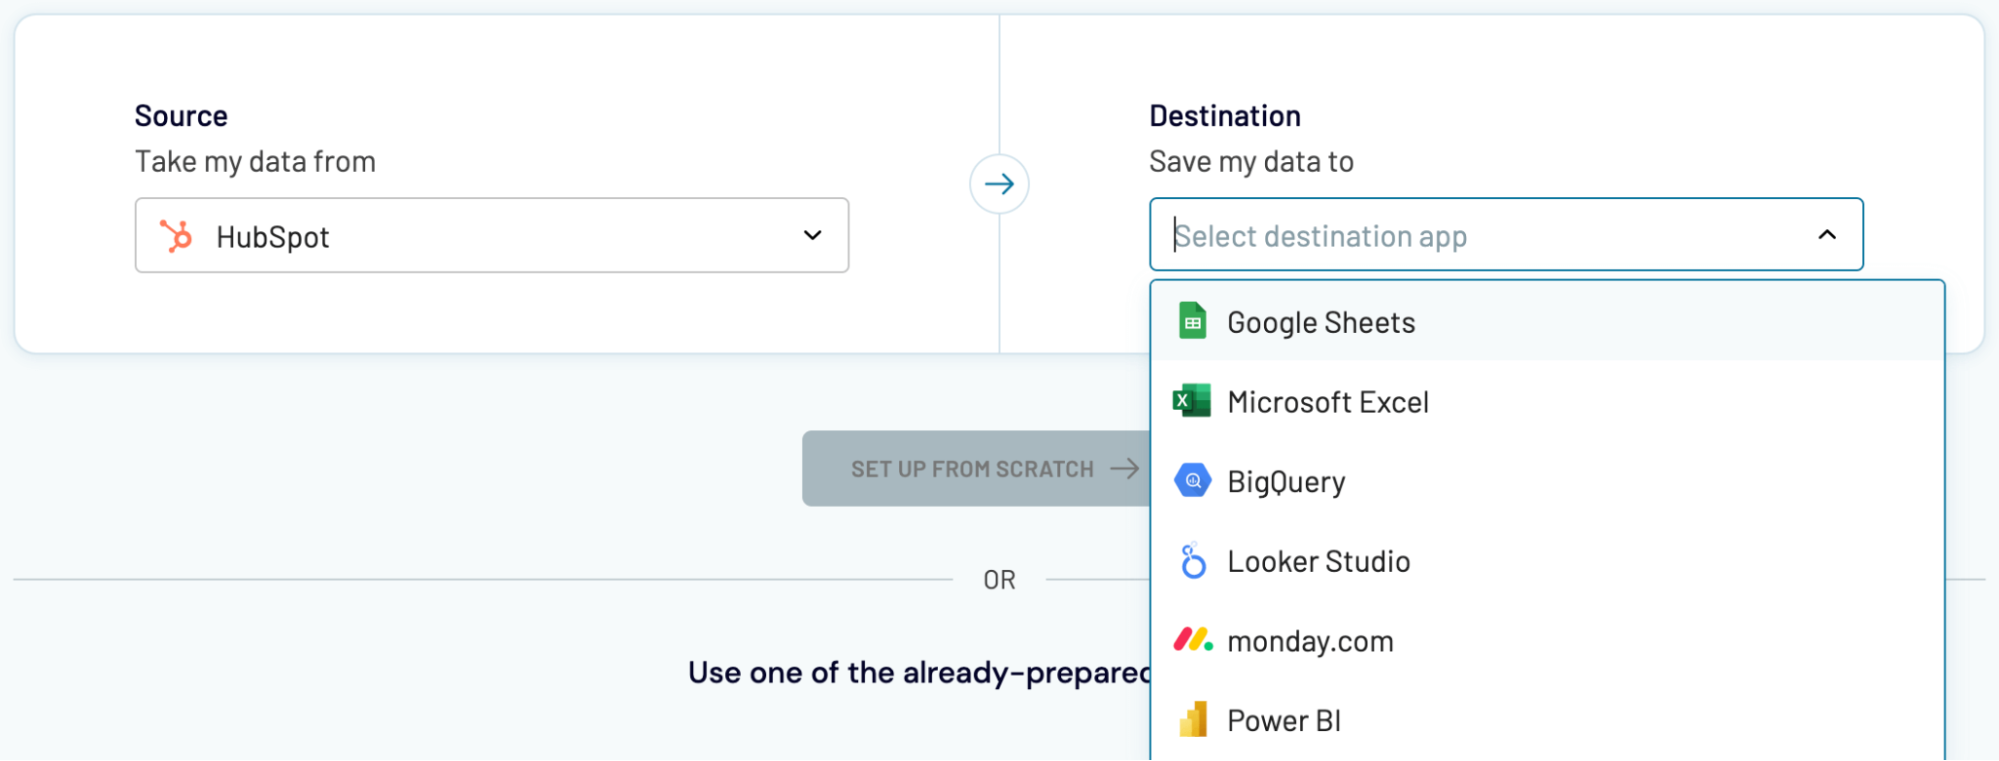
Remember how we said you can import data into Tableau? Same deal here with these destinations.
- Spreadsheet applications: Google Sheets and Microsoft Excel.
- Data warehouses: BigQuery, PostgreSQL, and Redshift.
- Other business intelligence (BI) tools: Data Studio, Power BI, and Qlik.
Remember how we said you can import data into Tableau? Same deal here with these destinations.