Import JSON to Google Sheets
Use Coupler.io to connect JSON to Google Sheets and automate your data import. Enjoy a no-code setup, organize and transform your data on the go, as well as create dynamic dashboards.


Connect JSON to Google Sheets with Coupler.io to simplify reporting
Get and prepare data effortlessly
Import JSON data to Google Sheets with Coupler.io. Experience effortless data organization, transformation, and preparation, all without any coding involved. Use reliable connectors and an intuitive interface to ensure easy and straightforward data handling.
Automate reporting tasks
Schedule automatic data imports from JSON to Google Sheets and simplify your reporting process. Coupler.io removes manual data entry, allowing you to build comprehensive multi-source reports or use pre-built dashboard templates.
Stand out as a data-driven expert
Import JSON to Google Sheets to achieve superior reporting and make informed decisions. Give clients and stakeholders clear, data-driven insights. Save time for strategy by using Coupler.io’s powerful data analysis.
How to import JSON to Google Sheets (detailed guide)
Coupler.io makes it easy to connect to APIs and get JSON data. You don't need to code. It improves your data analysis and reporting. Here’s how to import JSON to Google Sheets and set up automatic data refresh in three easy steps:
Step 1: Collect data
Step 2: Organize and transform
In this step, you need to organize and transform your data while using the available options.
This preparation is crucial to make your data ready for analysis.
Step 3: Load and automate
The next step is to connect Coupler.io to your Google Sheets account. Then specify where to load your JSON data:
Coupler.io also provides extra options:
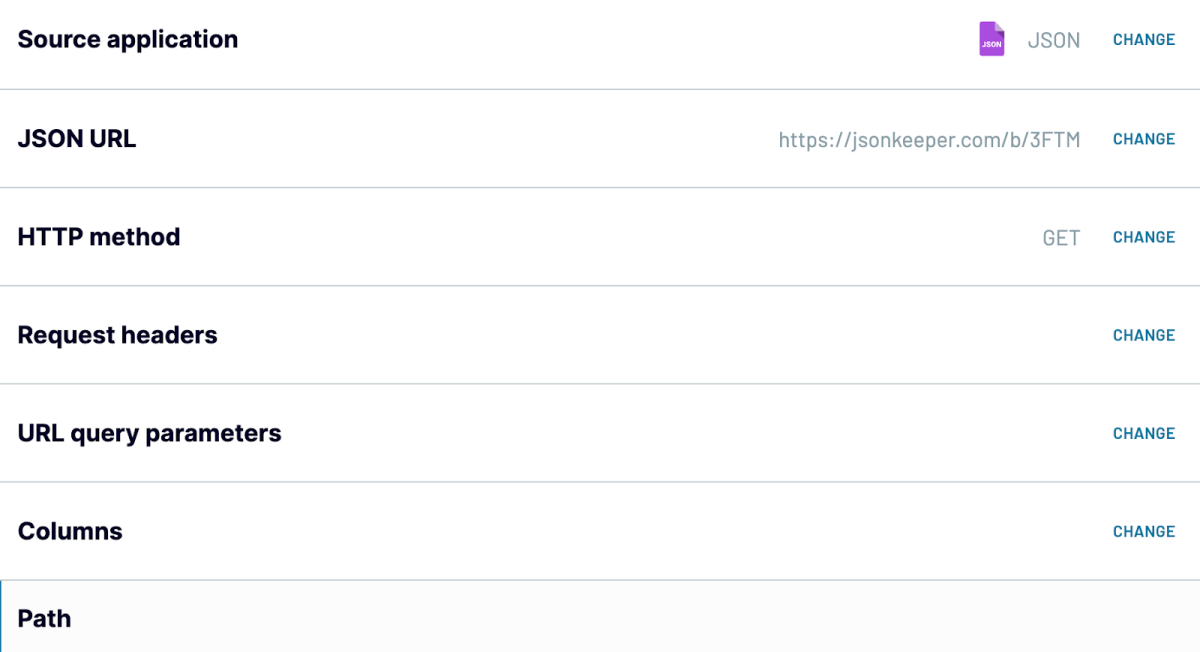
Step 1: Collect data
- Insert the JSON URL: It is the URL of the JSON file you want to import. You can find it in the RESTful API documentation of your data source.
- Choose HTTP Method: The default method is GET, but you might need to use POST for certain APIs.
- Set HTTP Headers: Include necessary headers in your request, such as for authorization.
- Use URL Parameters: To refine your data, apply query parameters related to the JSON URL.
- Select Fields (Optional): Choose the fields (columns) you wish to import. You can also do this later.
- Select Nested Objects (Optional): Use the path parameter to select nested objects in the JSON response.
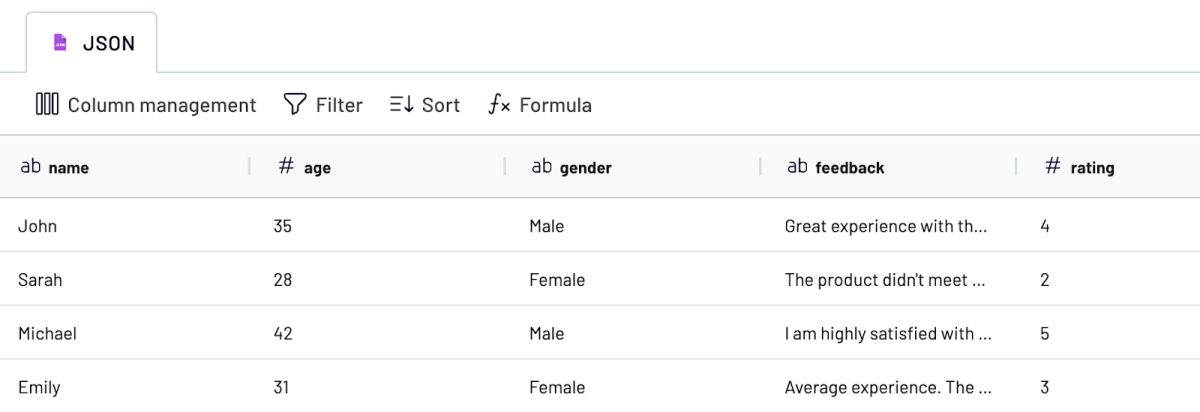
Step 2: Organize and transform
In this step, you need to organize and transform your data while using the available options.
- Preview Data: Check the data collected to confirm it meets your needs.
- Filter Data: Apply filters to isolate specific details and remove irrelevant data.
- Sort Data: Organize your data logically for easier analysis.
- Hide and rename Columns: Make column names more relevant. Hide unnecessary ones.
- Adjust Column Order: Rearrange columns to improve data structure and readability.
- Add Custom Columns: Incorporate formulas to create new columns for extra insights or calculations.
This preparation is crucial to make your data ready for analysis.
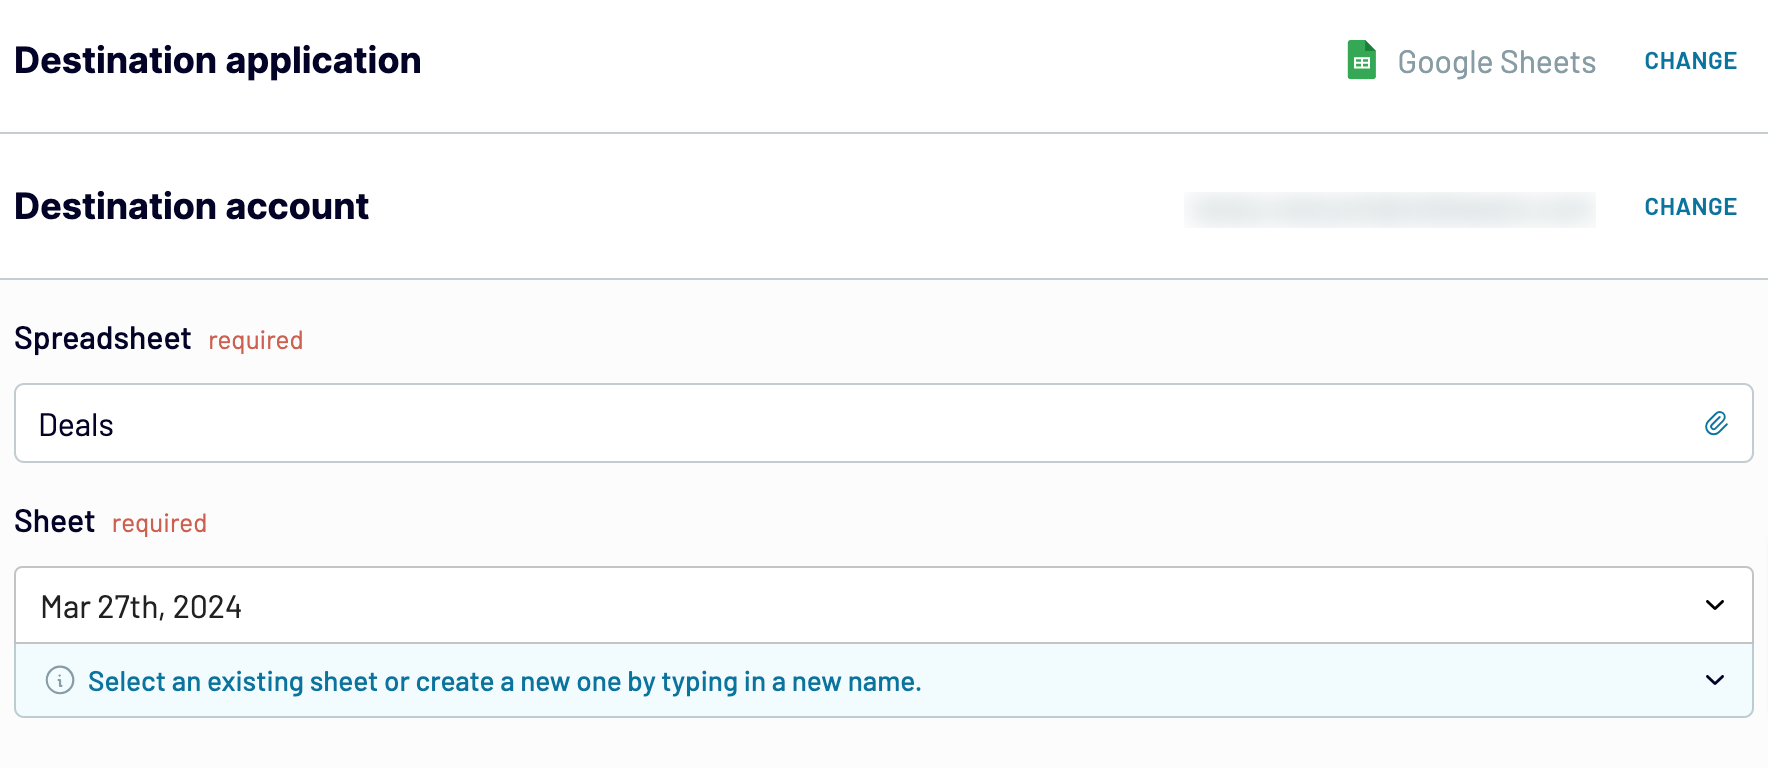
Step 3: Load and automate
The next step is to connect Coupler.io to your Google Sheets account. Then specify where to load your JSON data:
- Choose a spreadsheet: Select the Google Drive file where the data will be loaded.
- Select a sheet: Use an existing sheet or create a new one by specifying a new sheet name.
Coupler.io also provides extra options:
- Specify cell range: Set the initial cell or define a range for the exported data.
- Modify import mode: Change the import settings as required. Although Coupler.io typically updates data on each run, you can disable this setting.
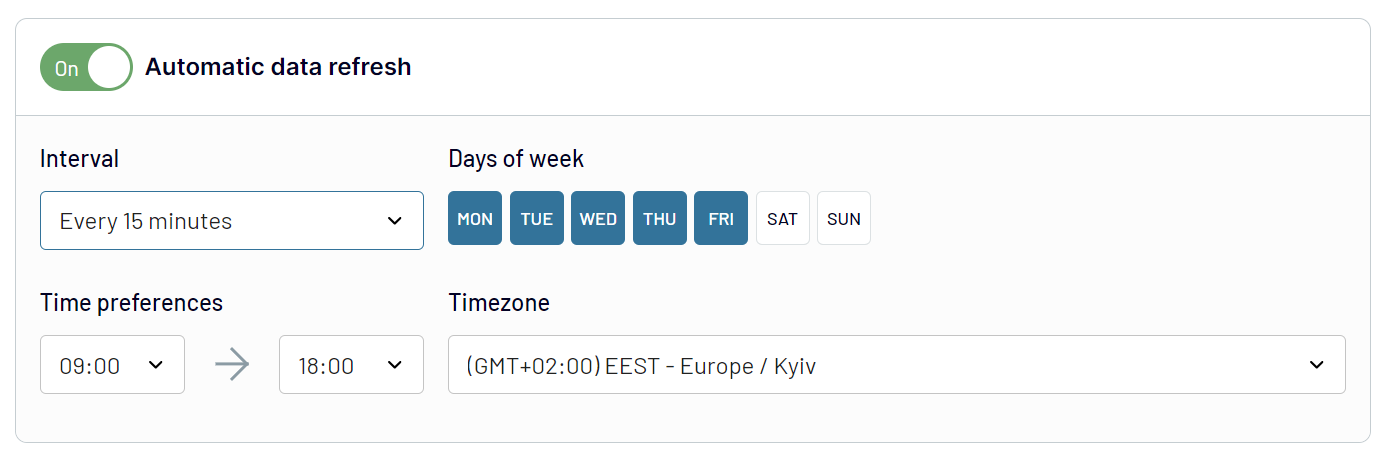
Export JSON to Google Sheets on a schedule
Automating the export of JSON data to Google Sheets takes your reporting process to the next level. With Coupler.io, you can keep your data up-to-date and remove the need for manual updates. The automatic data refresh feature lets you schedule data imports at intervals that suit your needs. Specifically, you can set the intervals monthly, daily, hourly, or even every 30 or 15 minutes.
In addition, you can customize the schedule. Specify days, time, and time zone for updates. Such a degree of flexibility ensures that your reports are based on the latest data. It makes them more accurate and timely. Coupler.io automates data export and helps you keep a smooth workflow, save time, and focus on data-driven decisions. Keep your reports fresh and relevant.
In addition, you can customize the schedule. Specify days, time, and time zone for updates. Such a degree of flexibility ensures that your reports are based on the latest data. It makes them more accurate and timely. Coupler.io automates data export and helps you keep a smooth workflow, save time, and focus on data-driven decisions. Keep your reports fresh and relevant.
Export data from JSON to alternative destinations


Quick start with dashboard templates

Multi-channel ad creatives performance dashboard


PPC multi-channel dashboard


 +3
+3

All-in-one marketing dashboard


 +6
+6
No such template is available yet.
No worries. Our team will create a template that fits your needs, just tell us more
about your case. It doesn't cost you a penny 😉
Request a custom report
about your case. It doesn't cost you a penny 😉
Export JSON to Google Sheets automatically with just a few clicks.
Connect similar Files & Tables apps and get data in minutes


What to export from JSON to Google Sheets

User Data
User data encompasses information about individual users, including demographics, behavior patterns, and preferences. This data is invaluable as it helps with personalized marketing. Insights into user data improve user experience and customize services to meet user needs. Study user data to find trends and use the data to make choices that improve engagement along with retention.
Financial Data
Financial data includes transactions, balances, revenues, and expenses. This data is crucial for accurate financial reporting, budgeting, and forecasting. Businesses can track performance, identify cost-saving opportunities, and comply with existing regulations by analyzing financial data. In the end, this leads to better financial management and planning.
Financial Market Data
Financial market data covers stock prices, indices, trading volumes, and economic indicators. Such data points are vital for investors, analysts, and financial professionals. Accurate financial market data is crucial for making informed investment choices, tracking market trends, and doing technical analysis. Staying updated with market data helps manage portfolios and predict market movements.
Business Data
Business data is all about sales figures, customer information, inventory levels, and employee records. This data is vital for operational efficiency, strategic planning, and performance analysis. Companies can improve processes, make better decisions, and drive growth by using business data.
Marketing Data
Marketing data includes campaign metrics, customer costs, conversion rates, and social media engagement. This data allows marketers to assess the effectiveness of their strategies. Marketing data also helps them improve campaigns and use resources well. Businesses can enhance ROI and target the right audience by analyzing marketing data.
E-commerce Data
E-commerce data contains product listings, order histories, customer reviews, and cart abandonment rates. In a nutshell, it helps understand customer behavior, improve products, and enhance the shopping experience. Businesses can use e-commerce data to increase sales, improve customer satisfaction, and streamline operations.
Weather Data
Weather data encompasses temperature, precipitation, humidity, and forecasts. This data is valuable for agriculture, logistics, and event planning industries. In these industries, weather affects operations. By studying weather data, companies can make smart choices, reduce risks, and improve scheduling as well as resource allocation.
Location Data
Location data includes geographical coordinates, movement patterns, and regional demographics. This data is essential for location-based marketing, logistics planning, and urban development.
Health Data
Health data covers patient records, treatment outcomes, and epidemiological statistics. Such data points are critical for healthcare providers, researchers, and policymakers. These can help improve patient care, track disease outbreaks, and develop effective health interventions. Analyzing health data leads to better medical practices and informed public health decisions.
IoT Data
IoT data includes sensor readings, device statuses, and operational metrics from connected devices. This data monitors and manages smart homes, industrial equipment, and urban infrastructure. Businesses can use IoT data to boost efficiency, predict maintenance needs, and create new solutions.
Logistics Data
Logistics data involves shipment tracking, delivery times, and inventory levels. This data type helps optimize supply chains, cut costs, and please customers. Companies can analyze logistics data to improve efficiency, shorten delivery times, and manage resources better.
Survey and Form Data
Survey and form data comprise responses to questionnaires and feedback forms. These offer insights into customer satisfaction, employee engagement, and market research. Analyzing survey data helps companies understand stakeholder opinions. It lets them identify areas for improvement and make data-driven decisions.
Operational Data
Operational data includes production metrics, equipment performance, and process efficiency. This data is essential for improving operational processes, reducing downtime, and increasing productivity. Businesses can use operational data to find bottlenecks, streamline workflows, and boost efficiency.
Educational Data
Educational data encompasses student performance, attendance records, and curriculum effectiveness. Such data is vital for educators, administrators, and policymakers. They need it to improve teaching, track student progress, and make better programs. Analyzing educational data leads to better learning outcomes and informed decisions.
Event Data
Event data includes attendee registrations, feedback, and engagement metrics. This data is important for planning, executing, and evaluating events. By analyzing event data, organizers can improve future events, enhance the attendee experience, and measure the success of their efforts.
Application Data
Application data covers user interactions, error logs, and feature usage within software applications. This data helps developers and product managers improve user experience. Also, it helps find bugs and decide on new features. Analyzing application data often translates into better software products that meet user needs.
How do you connect JSON to Google Sheets?
Step 1. Enter your JSON URL and specify other parameters to make a request to the API
Step 2. Organize and transform data before loading it into Google Sheets
Step 3. Connect your Google Sheets account and specify where to load your data
Step 4. Schedule auto-refreshes to export JSON to Google Sheets at desired intervals and run the importer
Pricing plans
- Monthly
- Annual (save 25%)
Your data is secured by industry standards
 Google Cloud
Certified
 SOC 2 Type II
Certified
 GDPR
GDPRCompliant
 HIPAA
HIPAACompliant
Don’t just take our word for it


