Salesforce to Tableau Integration
Use Coupler.io's Salesforce to Tableau integration to automate data imports without coding skills. Follow a few simple steps to extract sales data, organize it according to your needs, and transform it into revealing reports based on relevant insights.


Use Coupler.io's Salesforce to Tableau integration to simplify reporting
Get and prepare data effortlessly
Import data from Salesforce to Tableau automatically without any coding. Coupler.io allows you to organize and transform data as you like, set a schedule for auto-updates, and fetch records from numerous sources, all within a single web application.
Automate reporting tasks
With Coupler.io, you can connect Salesforce to Tableau in minutes. Spend minimal manual effort on reporting, bring together data from a multitude of source apps, and have it visualized as dynamic interactive dashboards with our free templates.
Stand out as a data-driven expert
Deliver understandable, almost live reports to clients and stakeholders – by doing so, you provide real-life examples of your expertise. With Coupler.io's data analytics and automation, you can save time for more significant tasks and avoid mundane reporting.
Export data from Salesforce to alternative destinations


Quick start with CRM dashboard templates


No such template is available yet.
No worries. Our team will create a template that fits your needs, just tell us more
about your case. It doesn't cost you a penny 😉
Request a custom report
about your case. It doesn't cost you a penny 😉
Connect Salesforce to Tableau automatically with just a few clicks.
Connect similar CRM apps and get data in minutes


What to export from Salesforce to Tableau

Contacts
Export contact data from Salesforce to Tableau for detailed analysis of your customer and stakeholder relationships. This data includes essential information such as names, email addresses, phone numbers, and roles. Monitor engagement levels, track communication history, and segment contacts for targeted marketing efforts.
New accounts report
You can also connect Salesforce to Tableau to capture all recently created accounts. This data provides insights into new business acquisition and growth trends. Here, you can analyze the influx of new clients, explore market penetration, and evaluate your sales strategies. This report is important for identifying emerging market opportunities.
New contacts & accounts report
Combining data from new contacts and accounts, this report offers a broad view of your recent customer base expansion. It lets you discover both individual and organizational relationships and highlights trends in customer acquisition and engagement. Assess your outreach efforts as well as refine your marketing and sales strategies.
New opportunities with products report
This report details newly created sales opportunities linked with specific products. Use it to analyze sales pipeline dynamics, product performance, and revenue potential. It can help you identify high-demand products, adjust sales strategies to emerging opportunities, forecast sales trends, and understand product-market fit.
New test account report
Export this report to track the creation and usage of test accounts, monitor testing activities, and ensure that test environments are managed effectively. This data is essential if you aim to support product development and quality assurance, as well as verify that test accounts are used without interfering with actual customer data.
PL new opportunities report
Use the Salesforce to Tableau integration to analyze sales opportunities segmented by product lines. This data will come in handy if you're looking to detect product-specific sales trends, evaluate different product lines, optimize product portfolios, identify lucrative market segments, and drive product-focused sales initiatives.
Orchestration runs
Data on orchestration runs include details about automated workflows and processes executed within Salesforce. It allows for the analysis of process efficiency, error rates, and automation effectiveness. Identify bottlenecks, improve workflow designs, ensure smooth operational processes, and enhance automation strategies.
Orchestration work items
It's useful if you need to track individual tasks within automated processes. It makes it easier for you to monitor task completion rates, identify inefficiencies, ensure that automated workflows are performing as intended, optimize task management, and improve the reliability and efficiency of your orchestration processes.
How do you use Salesforce to Tableau integration?
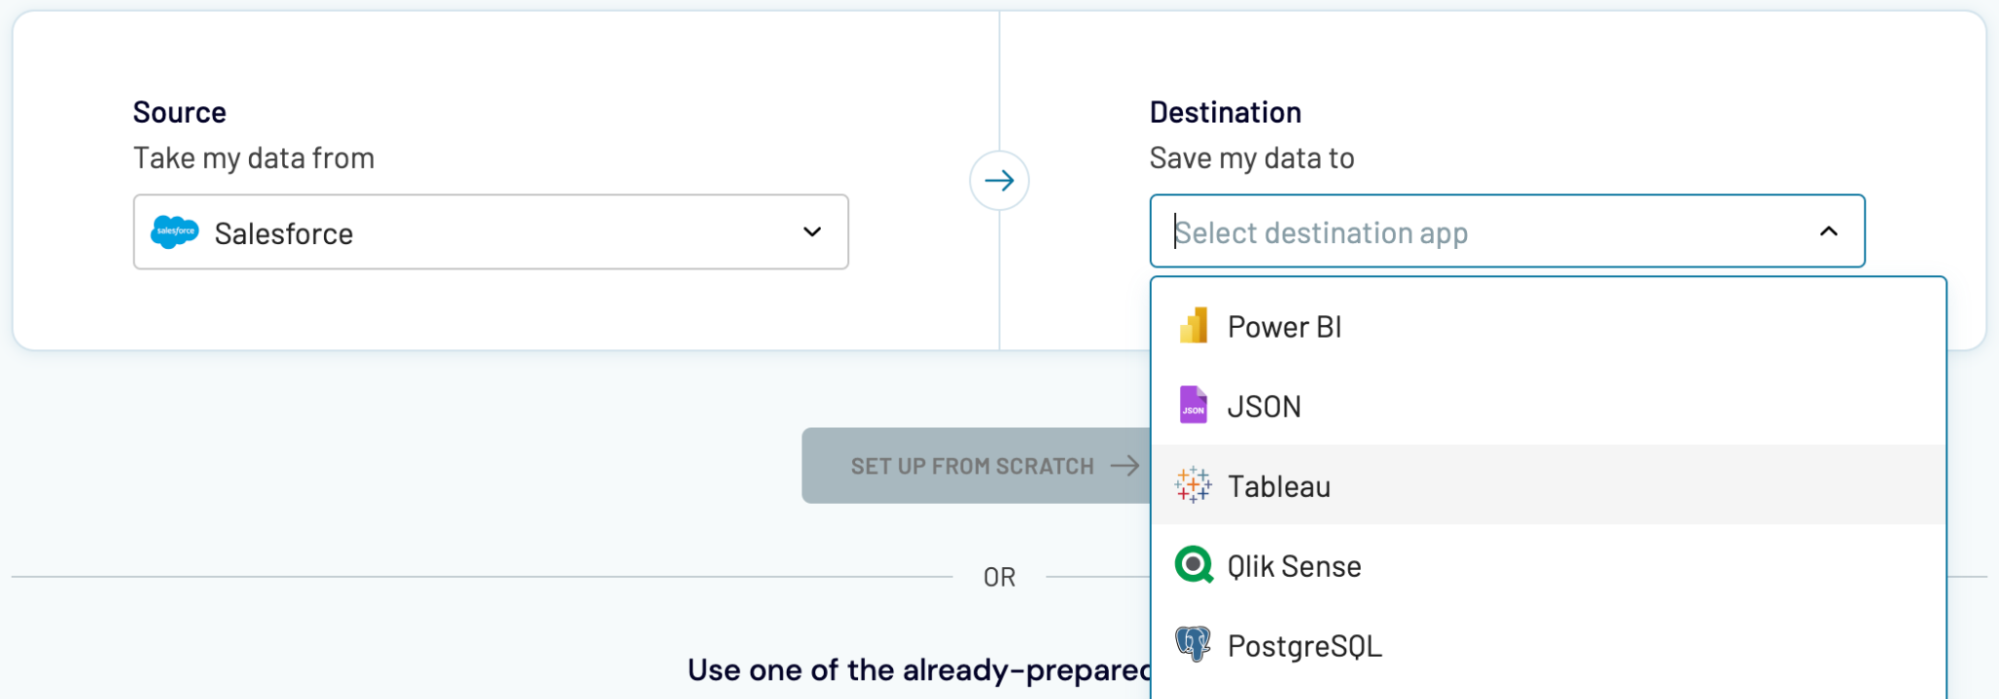
Step 1. Connect your Salesforce account and choose the data entity to export
Step 2. Organize and transform data before loading it into Tableau
Step 3. Connect the Tableau account and copy the integration URL to the desktop app
Step 4. Schedule refreshes to automate data flow from Salesforce to Tableau
Pricing plans
- Monthly
- Annual (save 25%)
Your data is secured by industry standards
 Google Cloud
Certified
 SOC 2 Type II
Certified
 GDPR
GDPRCompliant
 HIPAA
HIPAACompliant
Don’t just take our word for it


How to integrate Salesforce to Tableau (detailed guide)
Connect Salesforce to Tableau by following the steps below:
Step 1: Collect data
To get started, connect your Salesforce account. Then, select the particular data type you'd like to extract. Depending on the specified data type, adjust the other mandatory settings if there are any.
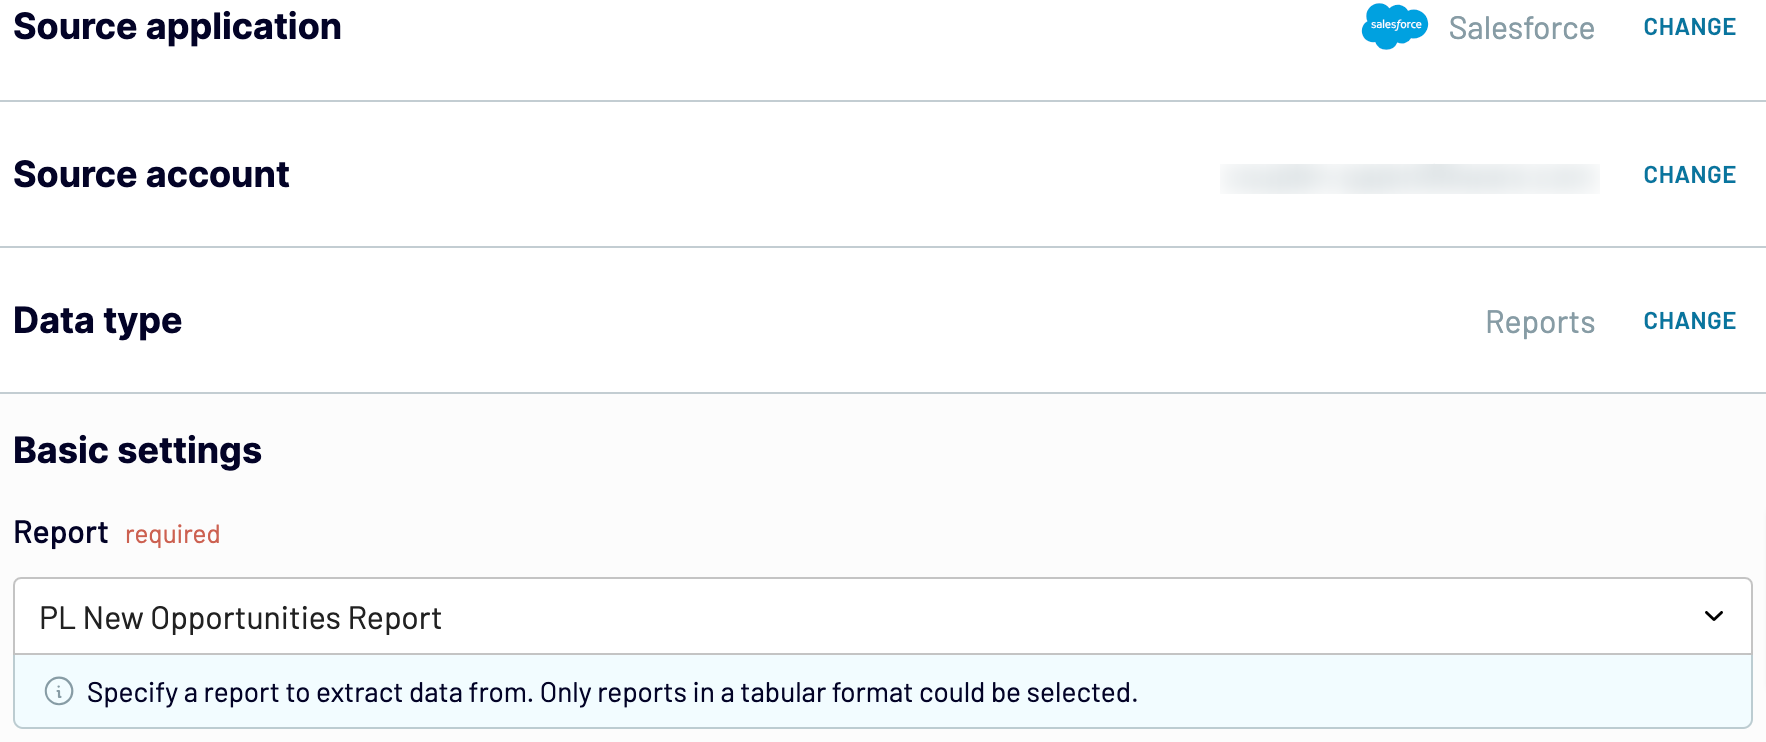
After that, proceed to the next step.
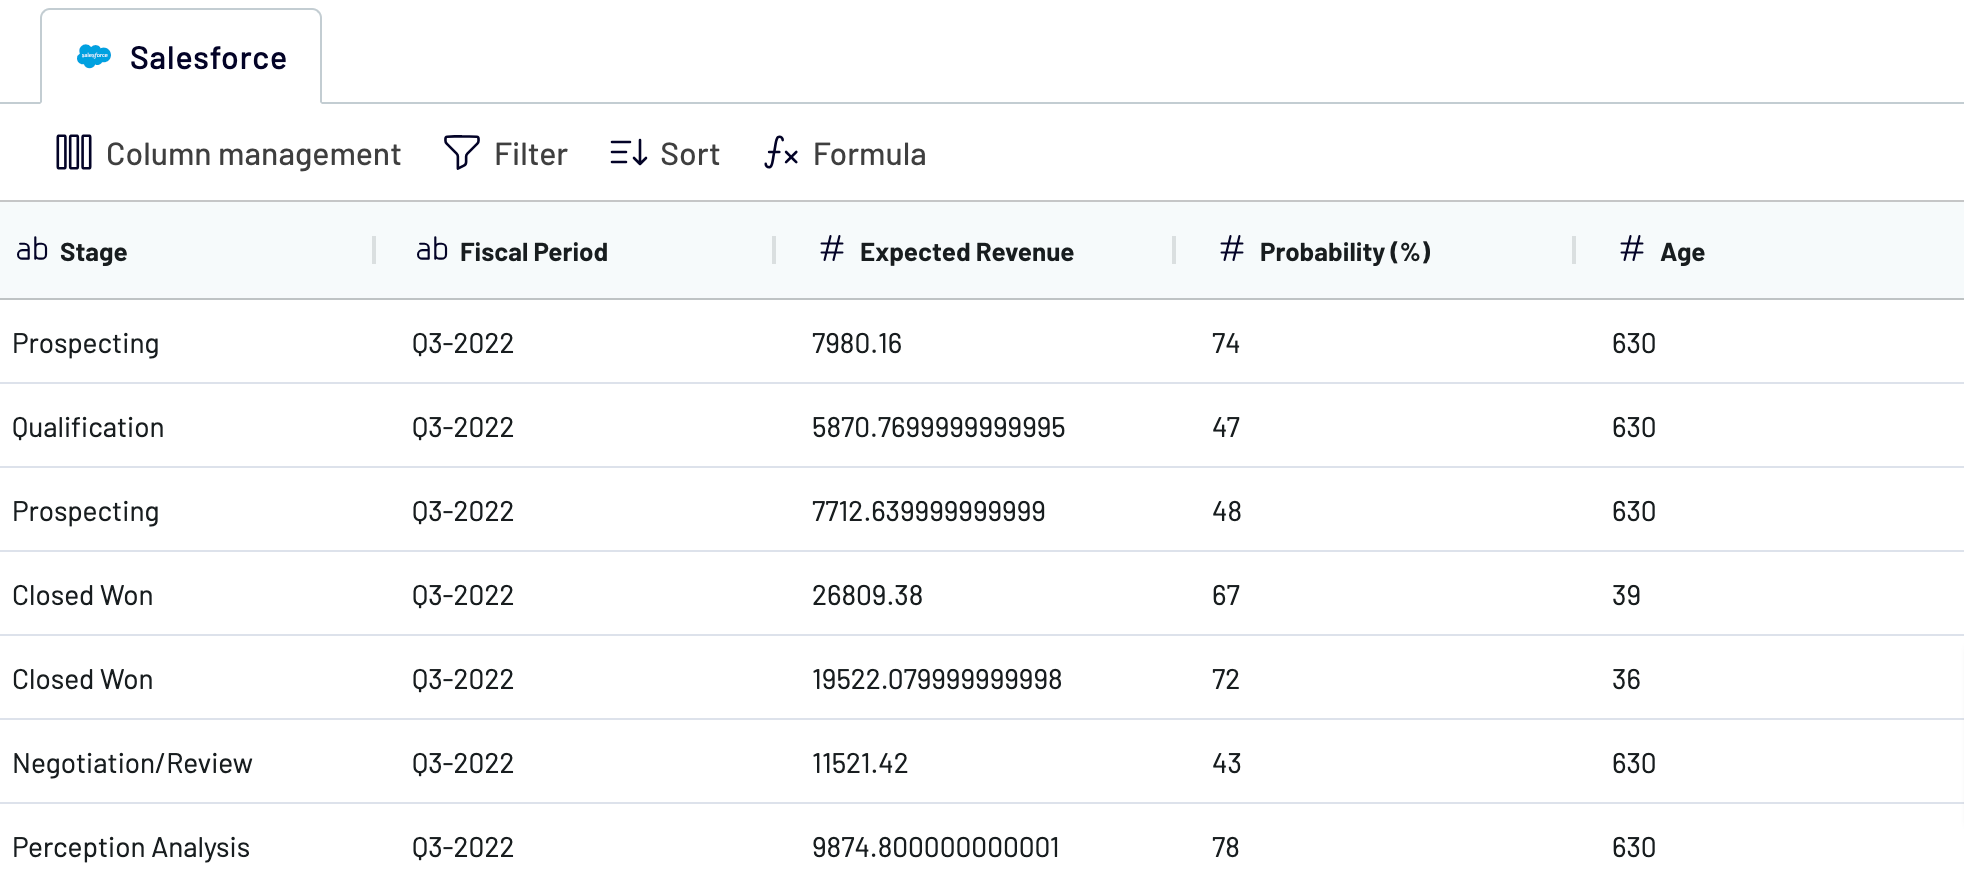
Step 2: Organize and transform
Before importing data from Salesforce to Tableau, preview it and verify whether it's accurate. If not, you can transform it in the following ways:
When you get the things done at this step, go next to set up your destination.
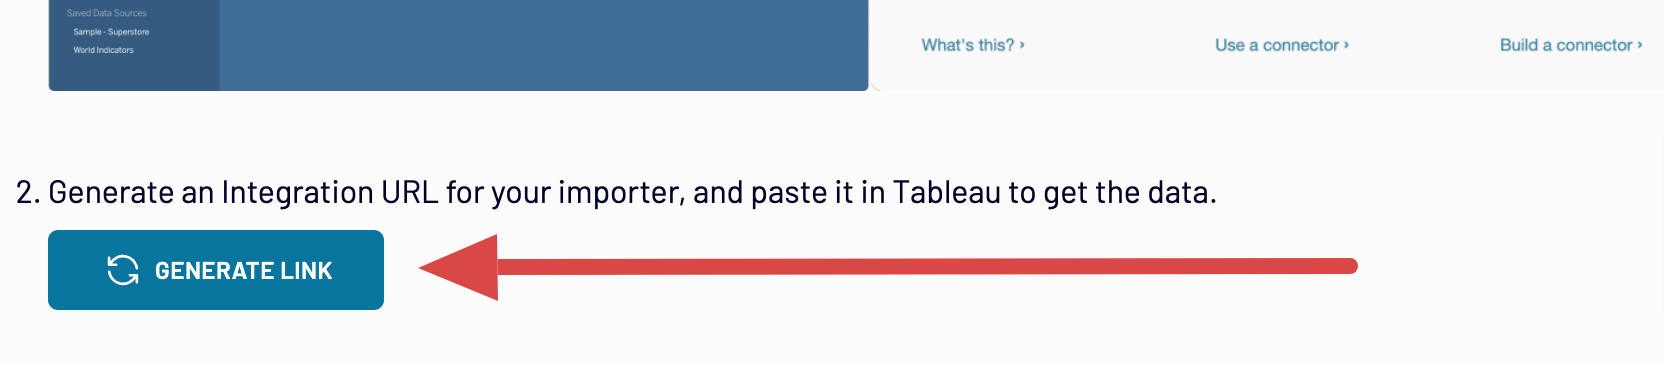
Step 3: Load and automate
Generate a link to the integration URL. Then, schedule automated refreshes and run the importer. To finish this process, follow the connector setup instructions to complete the connection.
Step 1: Collect data
To get started, connect your Salesforce account. Then, select the particular data type you'd like to extract. Depending on the specified data type, adjust the other mandatory settings if there are any.
After that, proceed to the next step.
Step 2: Organize and transform
Before importing data from Salesforce to Tableau, preview it and verify whether it's accurate. If not, you can transform it in the following ways:
- Edit, rearrange, hide, or add columns.
- Apply filters and sort data in the desired order.
- Create new columns with custom formulas.
- Combine data from different accounts or apps.
When you get the things done at this step, go next to set up your destination.
Step 3: Load and automate
Generate a link to the integration URL. Then, schedule automated refreshes and run the importer. To finish this process, follow the connector setup instructions to complete the connection.
Connect Salesforce to Tableau and automate data exports on schedule
Thanks to automatic data refresh, you'll get your Tableau report automatically updated at a preferred frequency. Select the interval from monthly, daily, or hourly to even every 30 or 15 minutes. To maximize the customization, you can also specify the days of the week, the time slot, and the time zone appropriate for your needs.
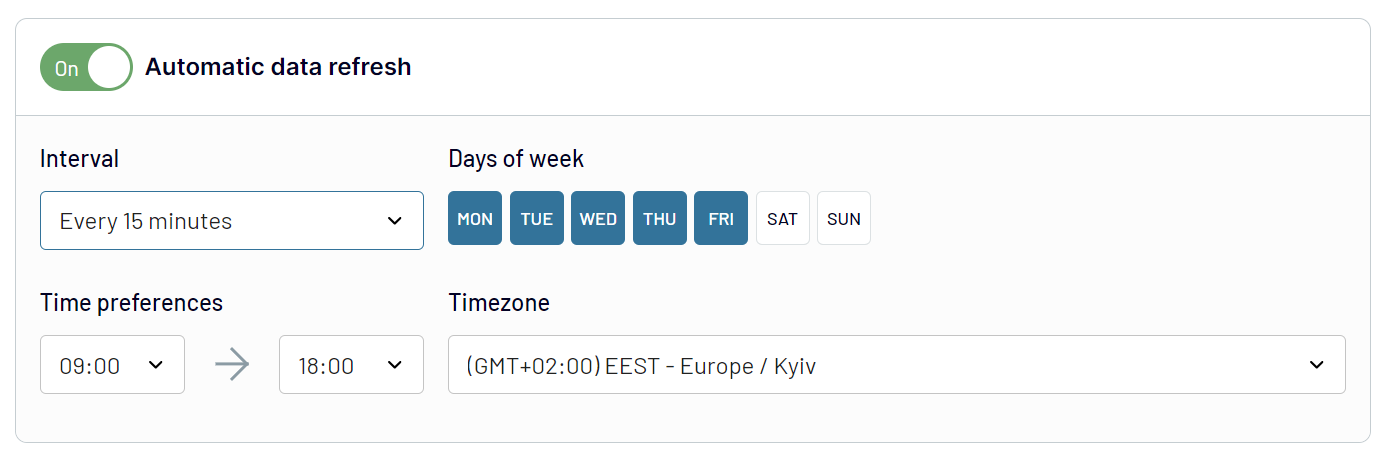
This way, Coupler.io's Salesforce to Tableau integration enables you to access the most recent data as the report is regularly refreshed according to changes in the source.
This way, Coupler.io's Salesforce to Tableau integration enables you to access the most recent data as the report is regularly refreshed according to changes in the source.
What key metrics can you export from Salesforce to Tableau?
Total sales
Description: Total sales represent the cumulative value of all closed deals within a specific period.
How to calculate: Sum the revenue of all deals marked as "Closed-Won" during the selected timeframe.
Win rate
Description: Win rate is the percentage of deals won out of the total number of deals closed within a specific period.
How to calculate: Divide the number of closed-won deals by the total number of closed deals (both won and lost), then multiply by 100.
Close rate
Description: Close rate refers to the percentage of all deals that have been closed out of the total number of deals in the pipeline during a specific period.
How to calculate: Divide the number of closed deals (both won and lost) by the total number of deals in the pipeline, then multiply by 100.
Average days to close
Description: Average days to close measures the average number of days it takes to close a deal from its creation date.
How to calculate: Calculate the number of days between the creation date and the closing date for each closed deal, then find the average of these durations.
Pipeline value
Description: Pipeline value is the total potential revenue of all active deals currently in the sales pipeline.
How to calculate: Sum the potential revenue of all deals that are still open and active in the pipeline.
Open deals
Description: Open deals refer to the total number of deals that are currently active and have not yet been closed.
How to calculate: Count all deals in the pipeline that do not have a closed status.
Expected revenue
Description: Expected revenue is the forecasted revenue based on the probability of closing each deal currently in the pipeline.
How to calculate: Multiply the value of each open deal by its probability of closure, then sum these values.
Average open deal age
Description: Average open deal age is the average duration that open deals have been in the pipeline.
How to calculate: Calculate the time elapsed since the creation of each open deal, then find the average duration.
Import data from Salesforce to Tableau or another destination
It's not only the Salesforce to Tableau integration that Coupler.io offers. Apart from that, you can replicate importers to load data into alternative destinations:
You'll import data from Salesforce into these applications just like you did with Tableau, as we mentioned earlier in the article.
- Spreadsheet applications: Google Sheets and Microsoft Excel.
- Data warehouses: BigQuery, PostgreSQL, and Redshift.
- Other business intelligence (BI) tools: Looker Studio, Power BI, and Qlik.
You'll import data from Salesforce into these applications just like you did with Tableau, as we mentioned earlier in the article.