Salesforce to Excel Integration
Use Coupler.io's Salesforce to Excel integration to import data automatically and schedule report updates. Export your data, transform it on the go, and get reports quickly created to track sales performance and make informed business decisions.
Use Coupler.io's Salesforce to Excel integration to simplify reporting
Get and prepare data effortlessly
Load data from Salesforce to Excel without coding, thanks to Coupler.io's automation capabilities. Organize data to your liking, make desired transformations, schedule report auto-updates, and collect data from multiple sources within a single interface.
Automate reporting tasks
Connect Salesforce to Excel by performing a few simple actions. You'll be able to minimize manual intervention, combine records from various apps in a single report, and enjoy data visualizations available in our free dynamic dashboard templates.
Stand out as a data-driven expert
Illustrate your value as an expert to clients and stakeholders – with the help of easily understandable, nearly real-time reports. Coupler.io's data analytics and automation empower you to allocate more time to impactful tasks rather than reporting duties.
Export data from Salesforce to alternative destinations
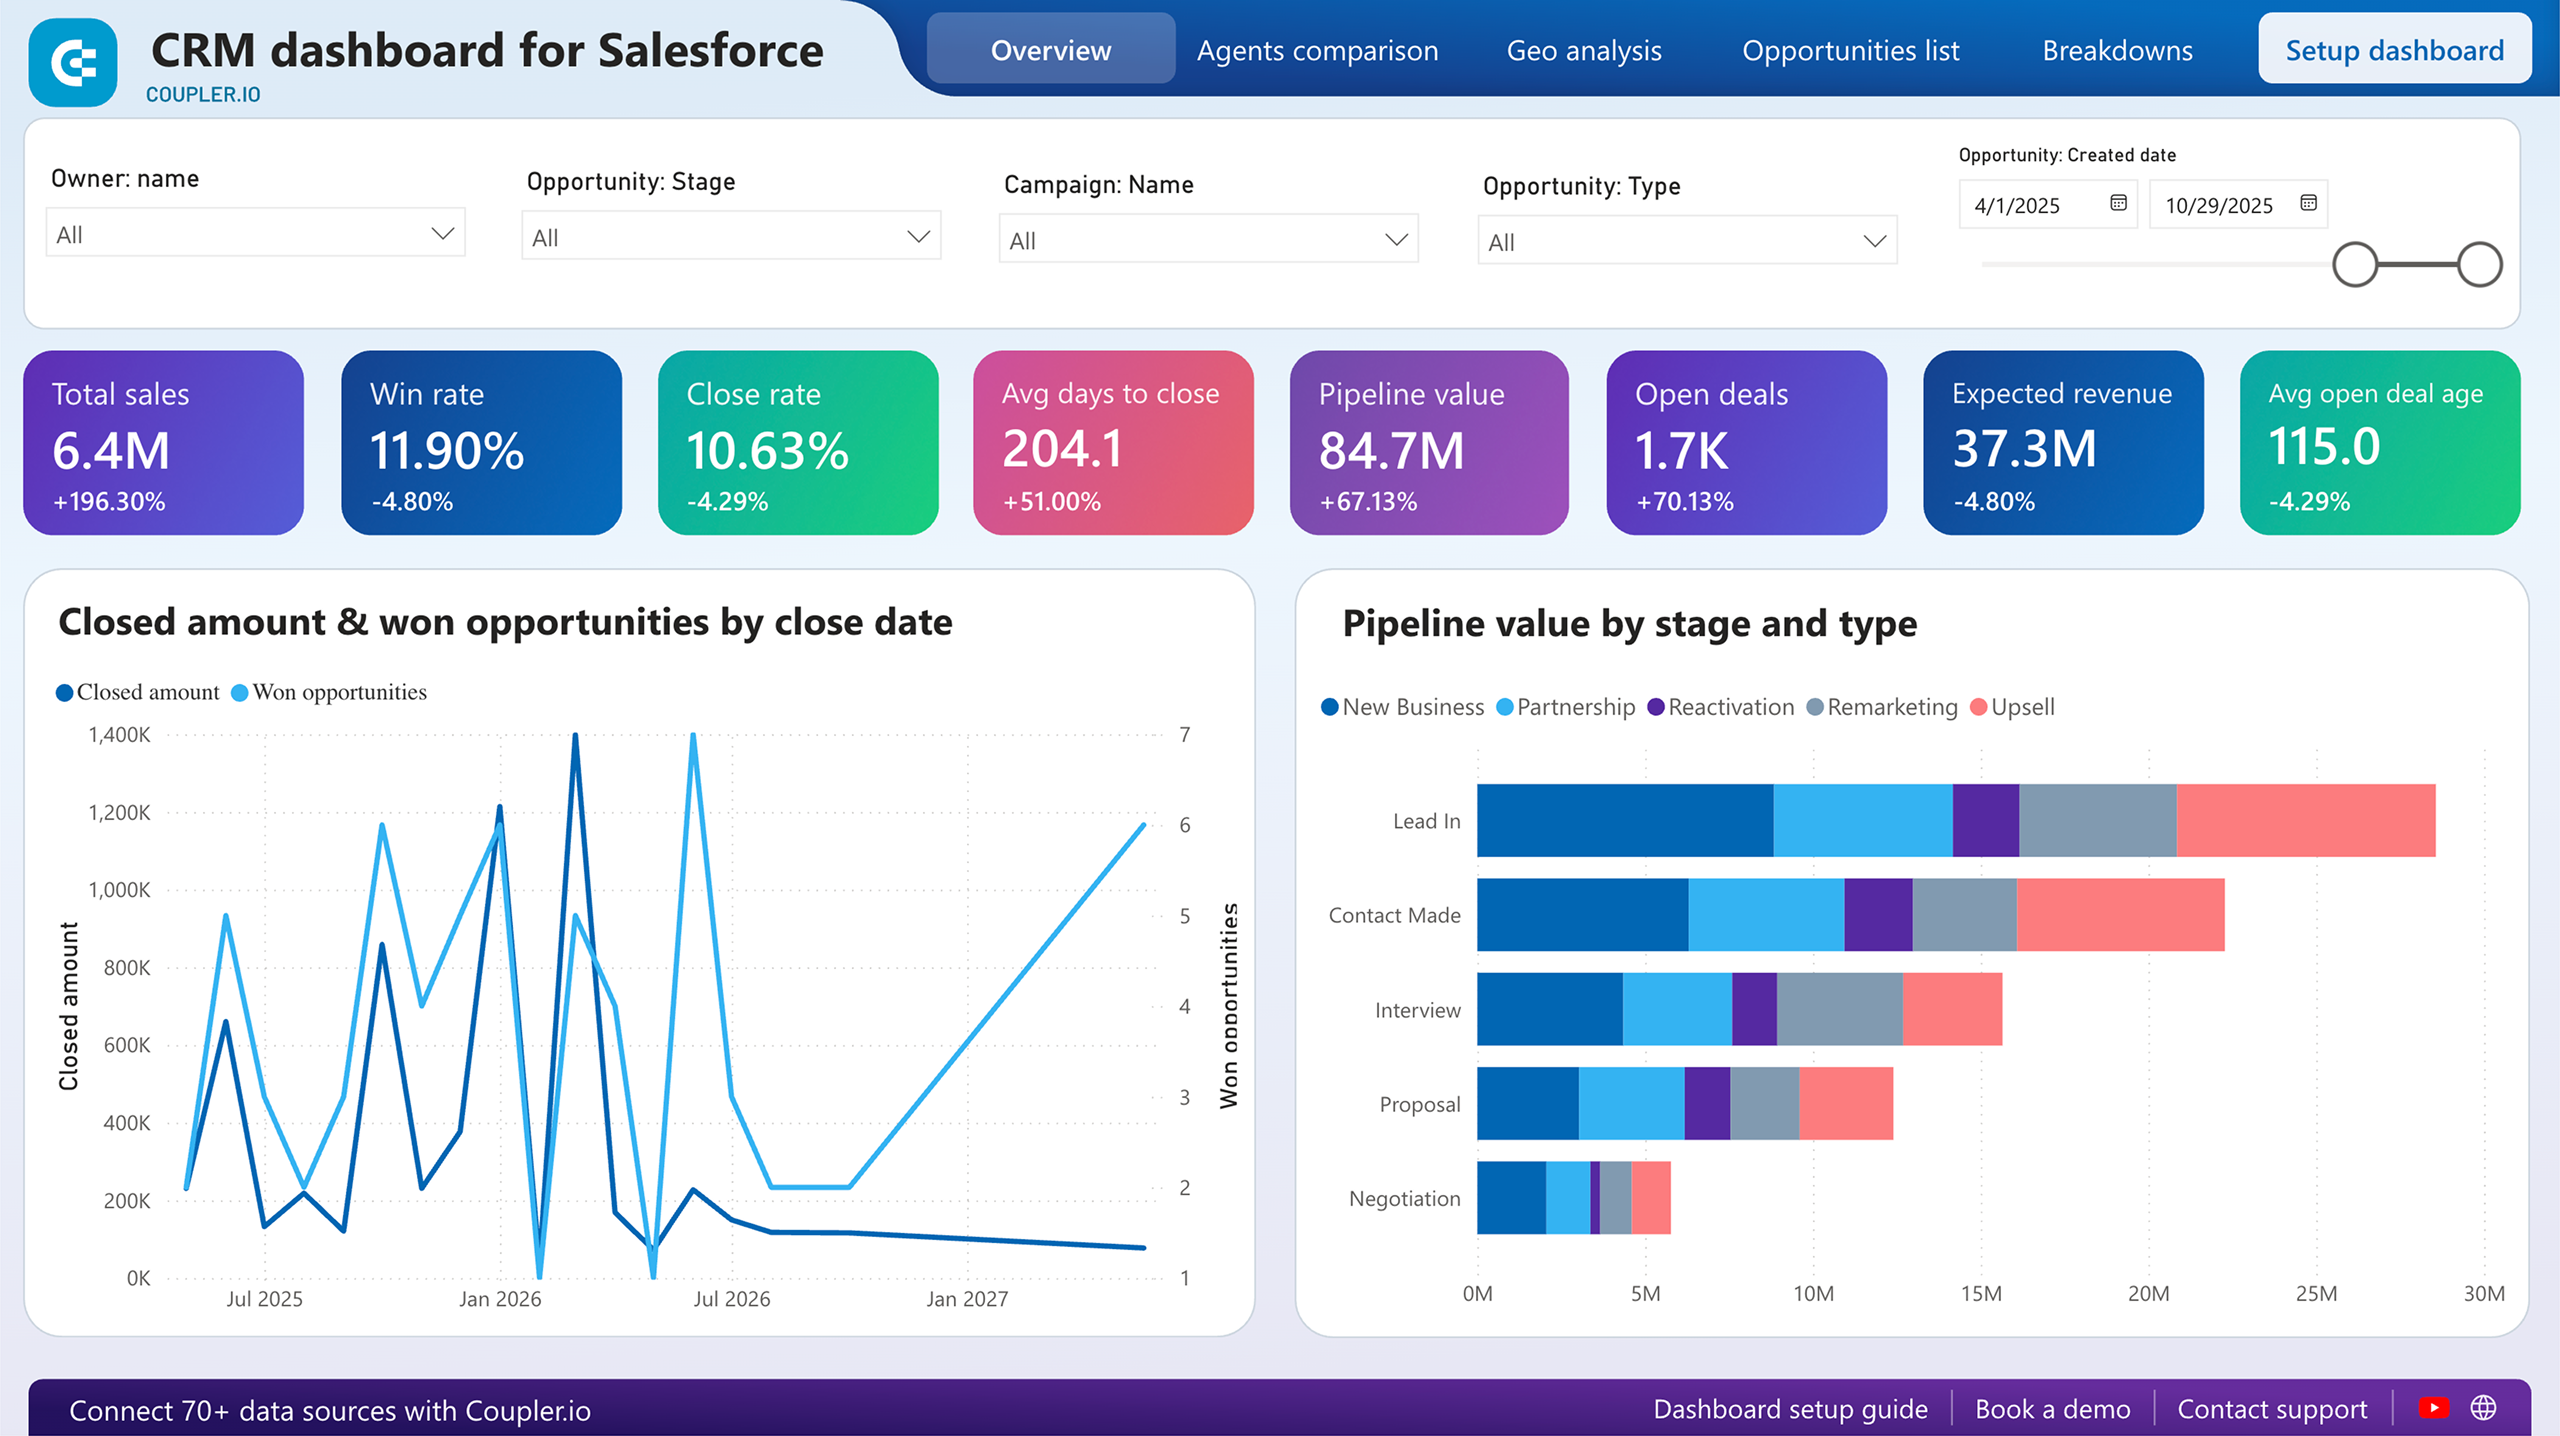
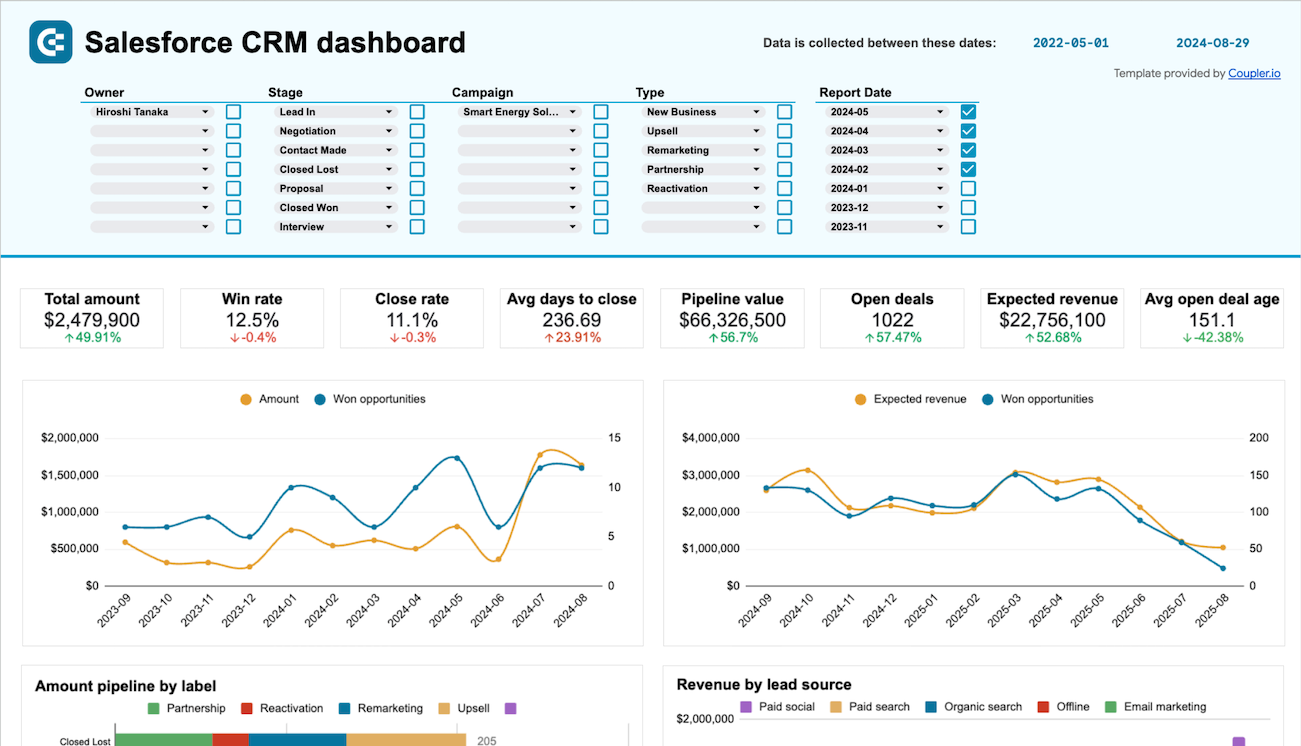
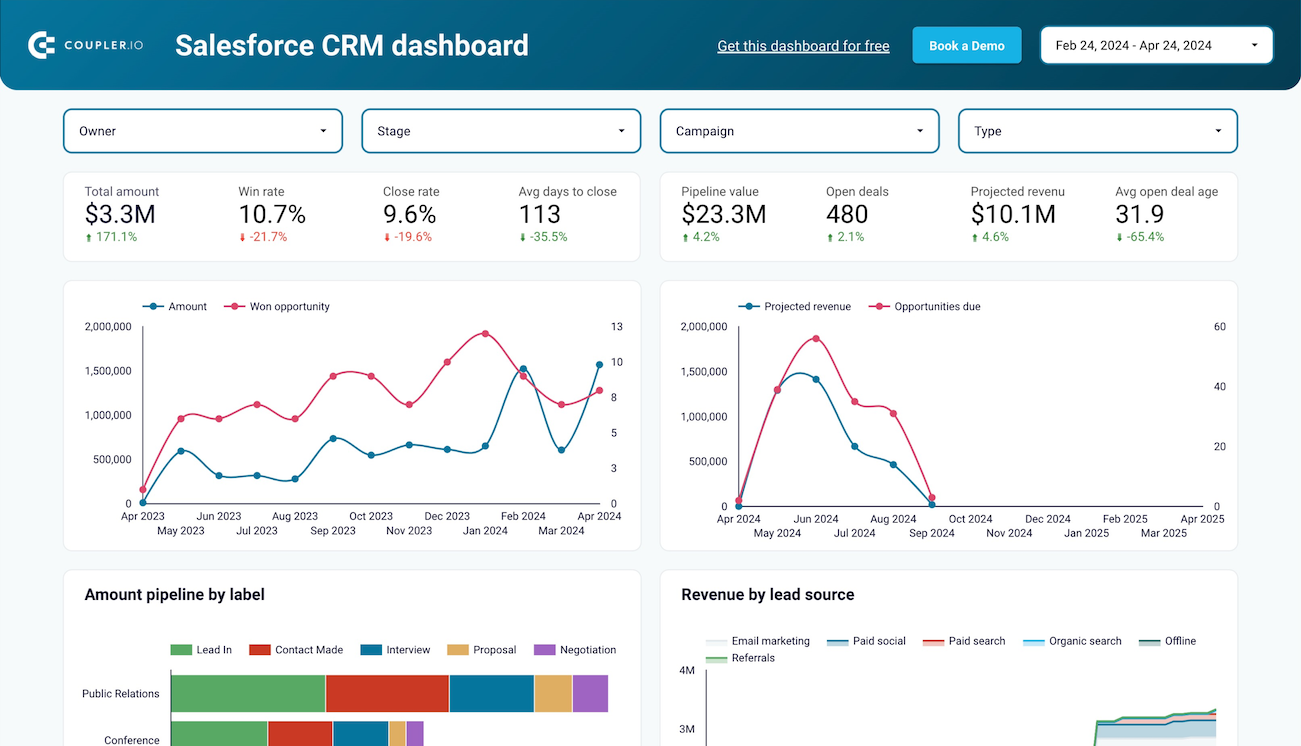
Quick start with CRM dashboard templates
No such template is available yet.
No worries. Our team will create a template that fits your needs, just tell us more
about your case. It doesn't cost you a penny 😉
Request a custom report
about your case. It doesn't cost you a penny 😉
Connect Salesforce to Excel automatically with just a few clicks.
Connect similar CRM apps and get data in minutes
What to export from Salesforce to Excel
Contacts
Load Contacts from Salesforce to Excel to analyze details related to individuals or entities associated with an account. It covers vital information like names, emails, phone numbers, and more. By exploring this data, you'll be able to better analyze customer interactions, identify key stakeholders, and get a grasp of relationships within accounts.
New accounts report
You can also connect Salesforce to Excel to extract a new accounts report detailing freshly established accounts within a defined timeframe. It offers insights into customer base expansion, including particulars such as name, industry, and location. This data will empower you to monitor growth efforts and target emerging markets efficiently.
New contacts & accounts report
Merge recently created contacts and accounts into one report. By transferring this data to Excel, you will get a deep overview of individual and organizational connections. It's helpful in the analysis of customer acquisition trends, identification of potential leads, and customization of engagement strategies for enhanced retention and satisfaction.
New opportunities with products report
Use this report to discover fresh sales opportunities along with associated products. This data is just what you need to analyze revenue-generating activities and product performance. By tracking deal size, close dates, and product details, you'll make it easier to refine sales strategies, predict revenue, and prioritize product offerings.
New test account report
A new test account report comprises accounts earmarked for testing purposes. Export this data to monitor test account creation and its impact on system performance. Details like name, testing status, and associated scenarios make a valuable asset for quality assurance, troubleshooting, and seamless system functionality.
PL new opportunities report
Take advantage of Salesforce to Excel integration to import data on new sales opportunities originating from partner leads. This enables the assessment of partner-driven sales initiatives, optimization of partner engagement, efficient resource allocation, and revenue maximization through strategic partnerships.
Orchestration runs
Orchestration runs represent instances of automated processes executed within Salesforce's orchestration framework. Information such as run ID, start time, duration, and outcome is critical to bottleneck identification and workflow design optimization performed for higher operational efficiency across the processes.
Orchestration work items
Collect data on orchestration work items to examine individual tasks or actions within orchestrated processes. It's crucial for understanding task execution, dependencies, and resource allocation. With these details in mind, it will be simpler to monitor task progress, identify workflow inefficiencies, and optimize task allocation.
How do you use Salesforce to Excel Integration?
Step 1. Connect your Salesforce account and choose a data entity to export
Step 2. Organize and transform data before loading it to Microsoft Excel
Step 3. Connect your Microsoft Excel account and specify where to load your data
Step 4. Schedule refreshes to automate data flow from Salesforce to Excel
Pricing plans
- Monthly
- Annual (save 25%)
Keep your data safe
Coupler.io safeguards your shared information and data transfers from breaches, leaks, and unauthorized disclosures.

How to integrate Salesforce to Excel (detailed guide)
Here's how you connect Salesforce to Excel step by step:
Step 1: Collect data
First, authorize your Salesforce account. After that, select the particular Data type you're going to export. Depending on the specified Data type, adjust the other mandatory settings if there are any.
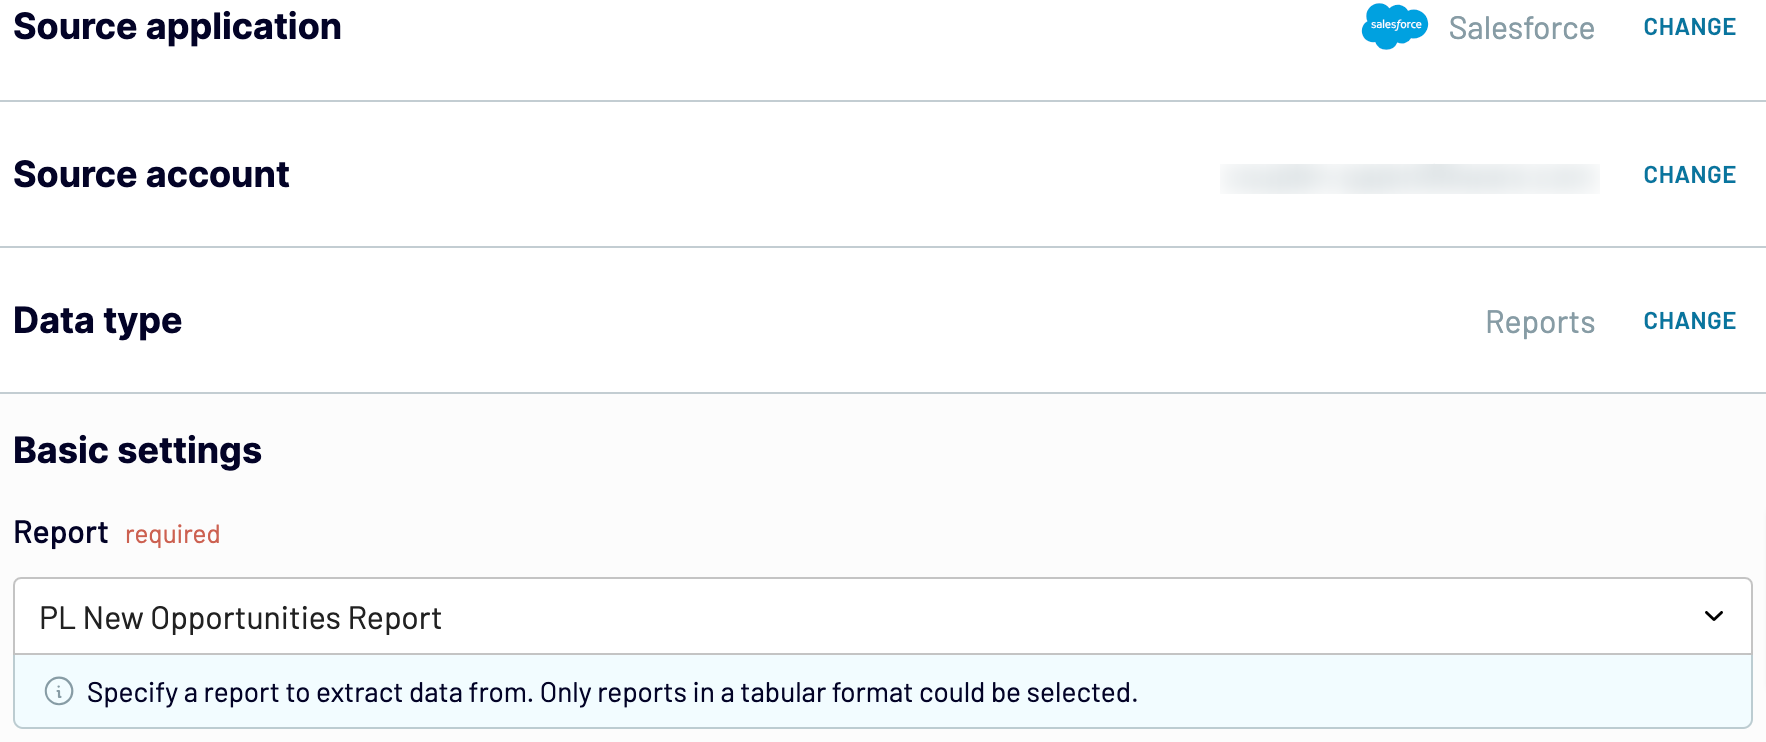
Then, move on to the next step.
Step 2: Organize and transform
Before loading data from Salesforce to Excel, check whether it's correct and ready for import. If not, you can transform it in multiple ways:
Through these adjustments, you modify the data to suit your reporting and analytics preferences.
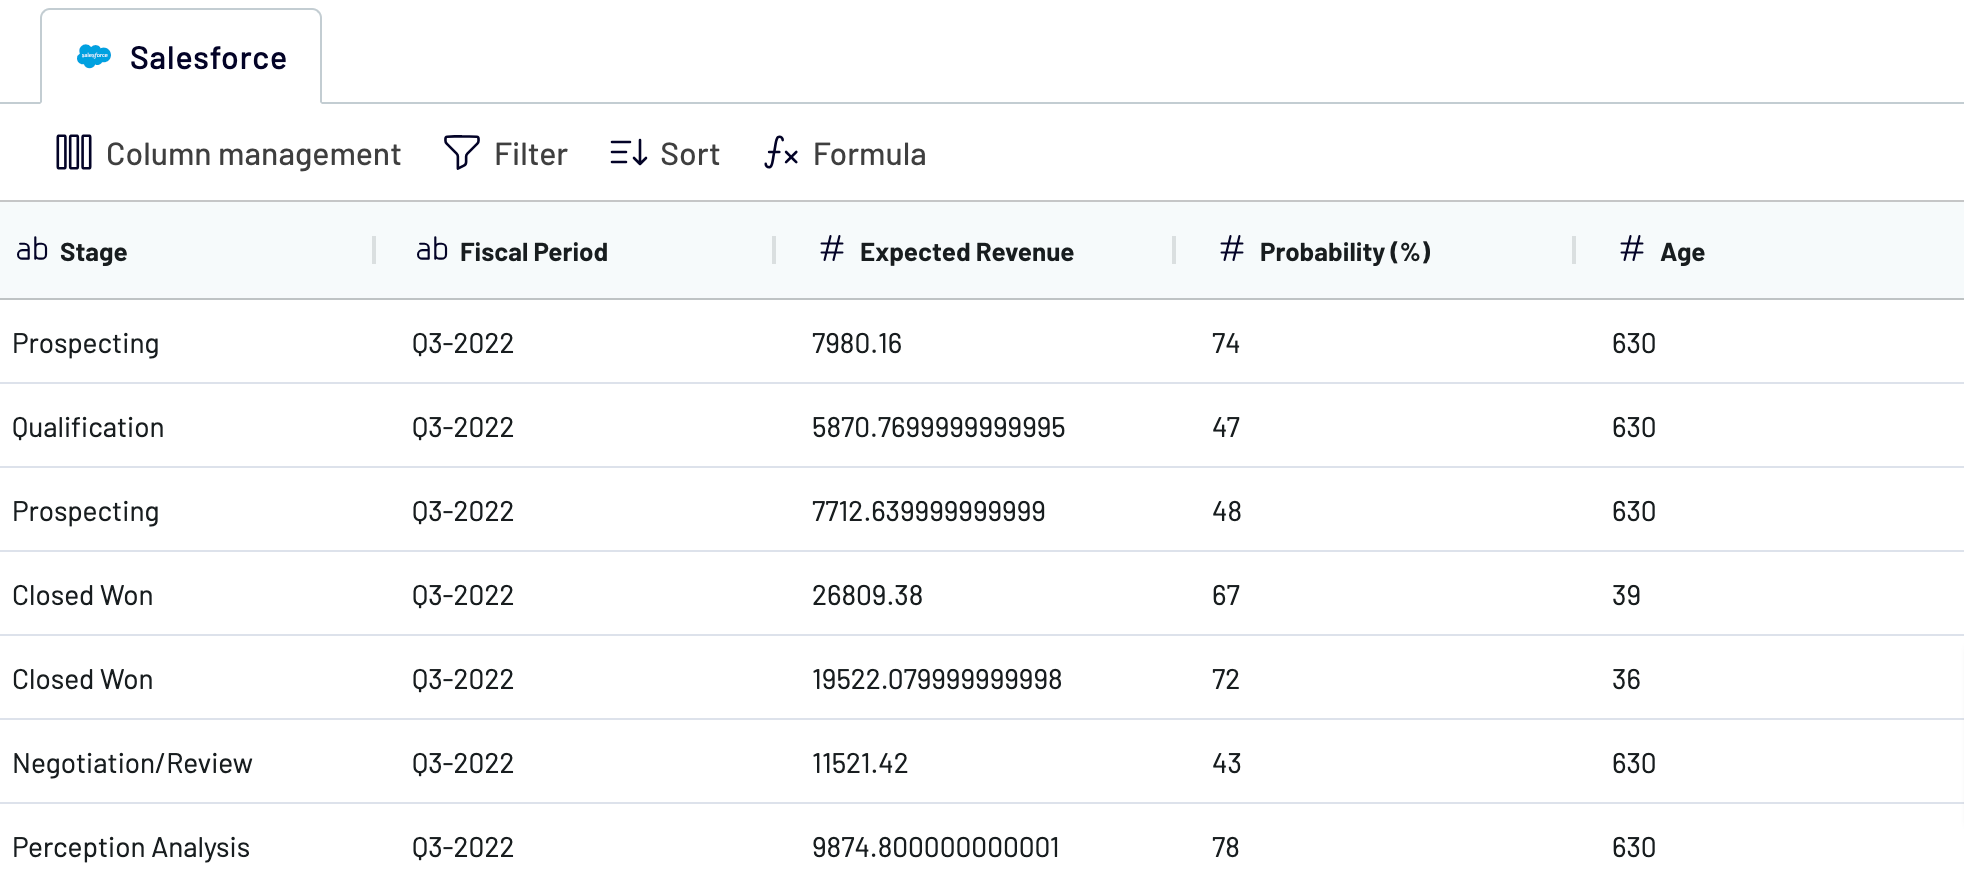
When you're finished, proceed to the destination settings.
Step 3: Load and automate
First, connect your Excel account. Next, you must select the exact destination to import data. Do this by specifying an existing workbook and worksheet. As an option, you can create a new worksheet by typing in its name in the dedicated field.
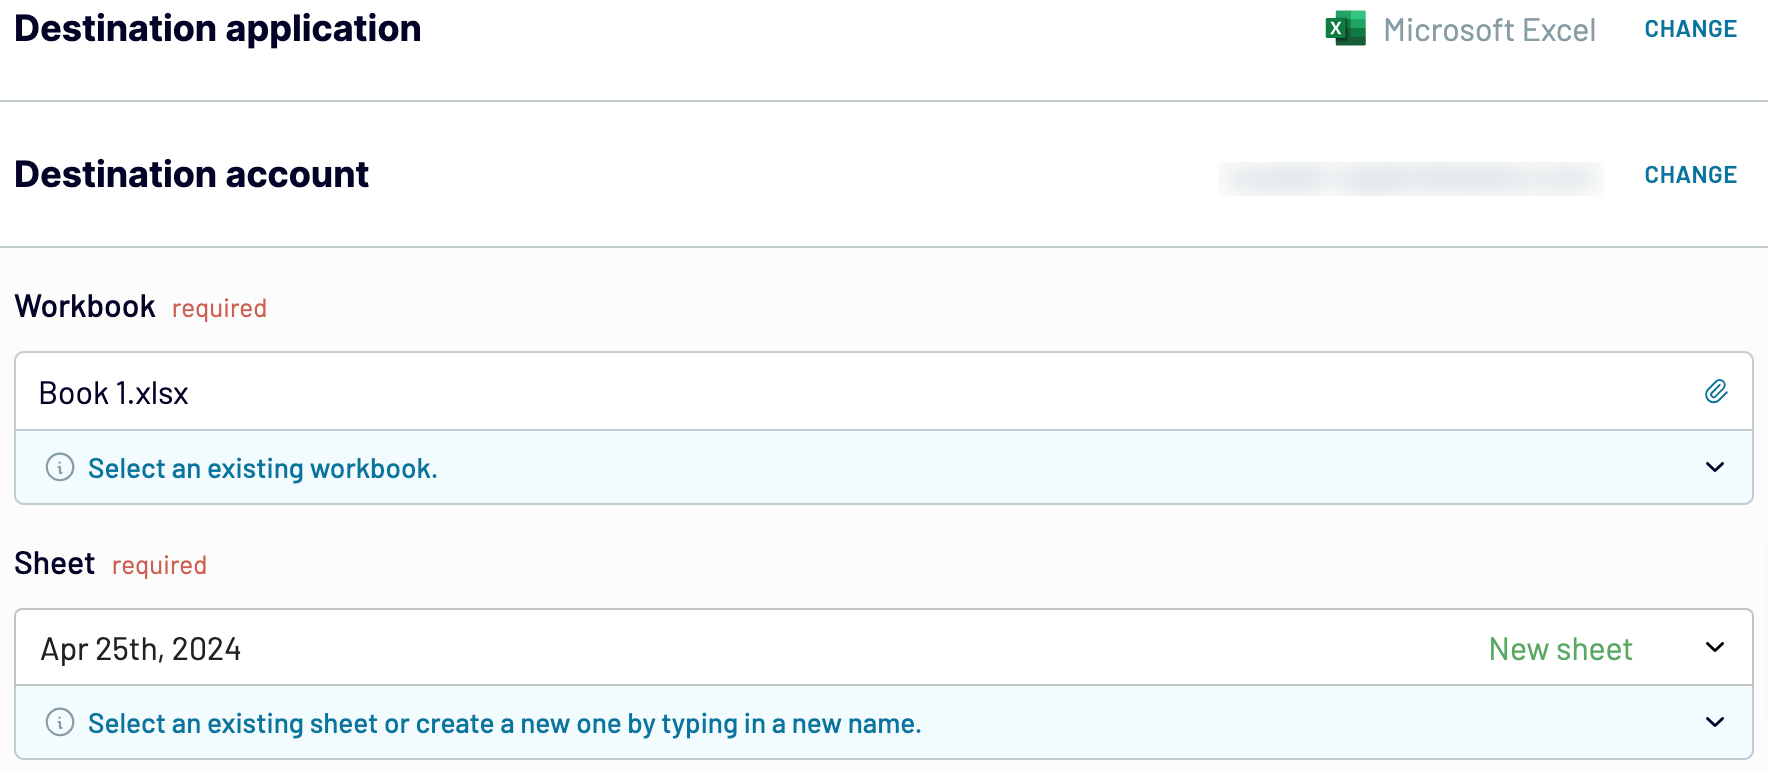
Afterward, enable Automatic data refresh and select the preferred interval in the corresponding dropdown field. To get your data to the destination, save and run importer.
Step 1: Collect data
First, authorize your Salesforce account. After that, select the particular Data type you're going to export. Depending on the specified Data type, adjust the other mandatory settings if there are any.

Then, move on to the next step.
Step 2: Organize and transform
Before loading data from Salesforce to Excel, check whether it's correct and ready for import. If not, you can transform it in multiple ways:
- Edit, rearrange, hide, or add columns.
- Apply filters and sort data in the desired order.
- Create new columns with custom formulas.
- Combine data from different accounts or apps.
Through these adjustments, you modify the data to suit your reporting and analytics preferences.

When you're finished, proceed to the destination settings.
Step 3: Load and automate
First, connect your Excel account. Next, you must select the exact destination to import data. Do this by specifying an existing workbook and worksheet. As an option, you can create a new worksheet by typing in its name in the dedicated field.

Afterward, enable Automatic data refresh and select the preferred interval in the corresponding dropdown field. To get your data to the destination, save and run importer.
Connect Salesforce to Excel and automate data exports on schedule
Activate automated data refreshes to get a dynamically updated Excel report. Customize the update frequency according to your preference: monthly, daily, hourly, or even every 30 or 15 minutes. Furthermore, you may wish to select suitable days of the week, specific times, and your time zone.

With Coupler.io's Salesforce to Excel integration, you'll have the latest data available for analytics – thanks to the report constantly refreshed according to ever-changing source records.

With Coupler.io's Salesforce to Excel integration, you'll have the latest data available for analytics – thanks to the report constantly refreshed according to ever-changing source records.
What key metrics can you export from Salesforce to Excel?
Total sales
Description: Total sales represent the overall revenue generated from successful transactions over a given period.
How to calculate: Sum up the total value of all successful orders, excluding taxes, shipping fees, and discounts.
Win rate
Description: Win rate indicates the percentage of opportunities that result in successful deals.
How to calculate: Divide the number of won opportunities by the total number of opportunities and multiply by 100 to get the win rate percentage.
Close rate
Description: Close rate represents the percentage of deals successfully closed out of the total number of opportunities.
How to calculate: Divide the number of closed deals by the total number of opportunities and multiply by 100 to get the close rate percentage.
Average days to close
Description: Average days to close is the average duration it takes to close deals from the time they are opened.
How to calculate: Calculate the time elapsed between opening and closing deals, then find the average duration.
Pipeline value
Description: Pipeline value indicates the total potential value of all open opportunities.
How to calculate: Sum up the values of all open opportunities in the sales pipeline.
Open deals
Description: Open deals refer to the number of ongoing opportunities that have not been closed yet.
How to calculate: Count the number of opportunities that are still open and in progress.
Expected revenue
Description: Expected revenue is the anticipated total revenue from all open opportunities.
How to calculate: Sum up the expected revenue values of all open opportunities in the sales pipeline.
Average open deal age
Description: Average open deal age is the average duration that open deals have been in the pipeline.
How to calculate: Calculate the time elapsed since the creation of each open deal, then find the average duration.
Import data from Salesforce to Excel or another destination
It's not only Salesforce to Excel integration that you can use with Coupler.io. Additionally, you can replicate importers to load your data into other destinations:
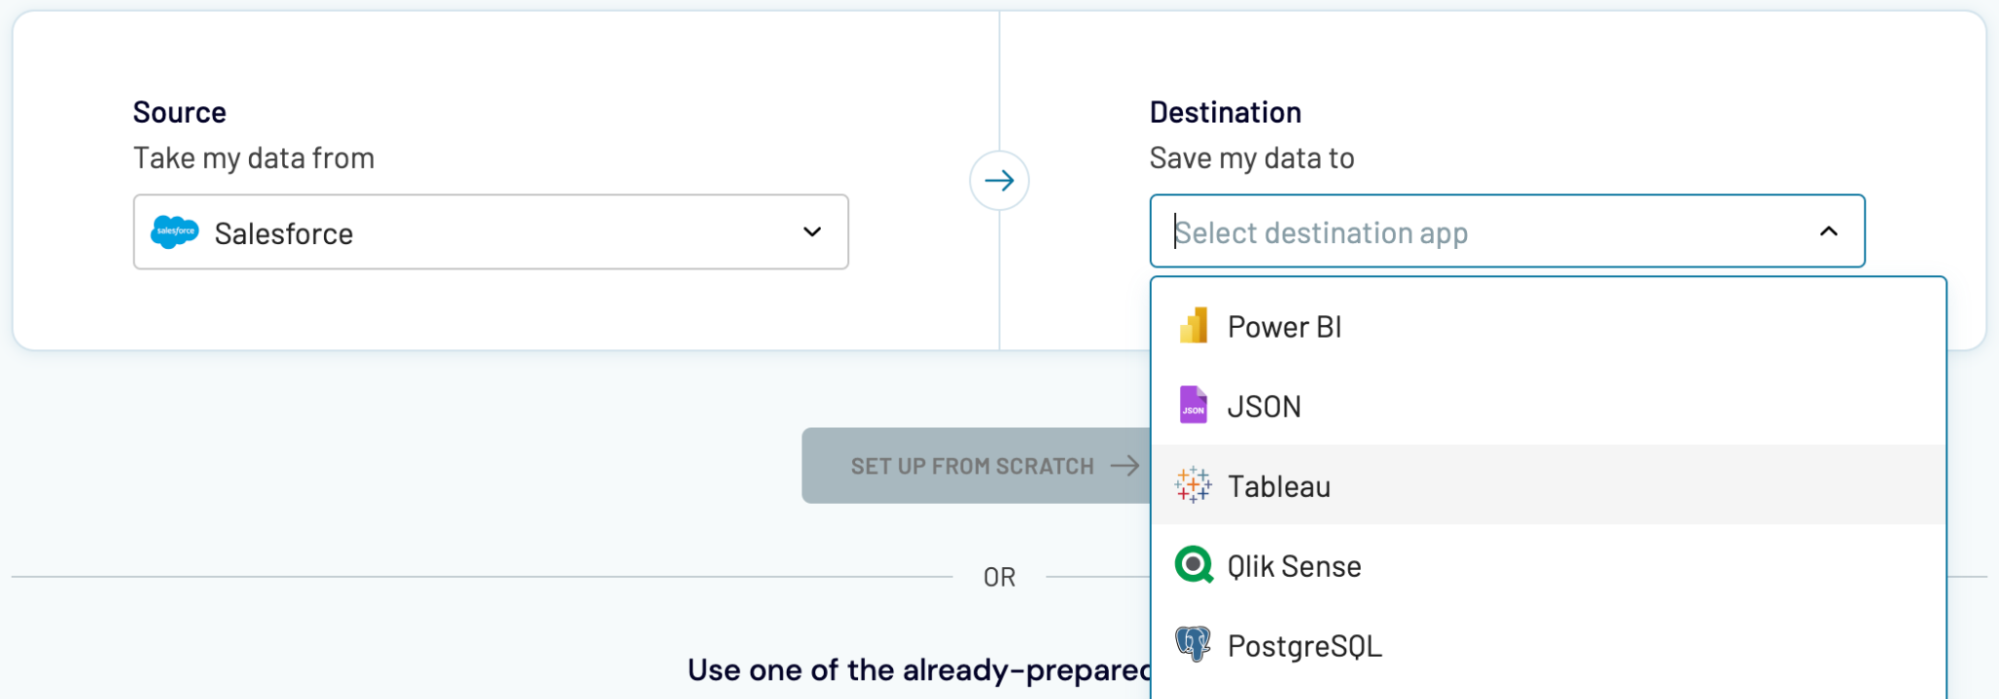
You can import Salesforce data into these apps in a similar way to Excel, as explained earlier.
- Google Sheets – another spreadsheet application.
- Data warehouses: BigQuery, PostgreSQL, and Redshift.
- Other business intelligence (BI) tools: Looker Studio, Tableau, Power BI, and Qlik Sense.

You can import Salesforce data into these apps in a similar way to Excel, as explained earlier.


