Salesforce to Power BI Integration
With Coupler.io's Salesforce to Power BI integration, you can automate data imports and create self-updating reports. Retrieve data in a matter of minutes, apply multiple transformations, and benefit from analysis-ready reports tailored to your needs.


Use Coupler.io's Salesforce to Power BI integration to simplify reporting
Get and prepare data effortlessly
You no longer need coding skills to automate data imports from Salesforce to Power BI. Use Coupler.io to organize data as you like, transform it if needed, schedule automated refreshes, and extract records from numerous sources within a single application.
Automate reporting tasks
Connect Salesforce to Power BI by following several steps. Reduce the manual effort required, integrate data from diverse source applications into a single report, and get it visualized automatically with the help of our free dynamic dashboard templates.
Stand out as a data-driven expert
Communicate your expertise to clients and stakeholders through comprehensible, nearly real-time reports. Take advantage of Coupler.io's data analytics and automation to free up your time for more meaningful work rather than mundane reporting tasks.
Export data from Salesforce to alternative destinations


Quick start with CRM dashboard templates


No such template is available yet.
No worries. Our team will create a template that fits your needs, just tell us more
about your case. It doesn't cost you a penny 😉
Request a custom report
about your case. It doesn't cost you a penny 😉
Connect Salesforce to Power BI automatically with just a few clicks.
Connect similar CRM apps and get data in minutes


What to export from Salesforce to Power BI

Contacts
Export contact data from Salesforce to Power BI to analyze and monitor customer interactions, track communication history, and manage relationship management strategies. It lets you know customer demographics, engagement levels, communication preferences, and key customer segments so you can tailor your sales approaches.
New accounts report
You can also connect Salesforce to Power BI to track the addition of new business accounts and analyze customer acquisition within a given period. It can help you explore trends in business growth, understand the effectiveness of marketing and sales efforts, and spot potential market opportunities to enhance your customer base.
New contacts & accounts report
This report combines data regarding newly added contacts and accounts, which provides you with a broad perspective on new business relationships. Export this information to analyze the correlation between new contacts and accounts, evaluate outreach efforts, identify growth patterns, and improve resource allocation.
New opportunities with products report
By loading this report from Salesforce, you can assess sales pipeline efficiency and examine new sales opportunities alongside associated products. This kind of data enables you to assess product performance, track potential revenue from new opportunities, understand customer product preferences, and refine product strategies.
New test account report
The new test account report includes data on newly created test accounts used for various purposes, such as trials, demos, or testing new features. Leverage it to monitor the usage and performance of these test accounts. It illuminates user engagement, potential market interest, and the outcome of your trial or demo programs.
PL new opportunities report
Use Salesforce to Power BI integration to load data on new sales opportunities categorized by product lines. This way, you can analyze the performance of different product lines, highlight which product lines are driving new business opportunities, reveal customer preferences, and take your marketing strategies to the next level.
Orchestration runs
Orchestration runs data captures the execution of automated processes in Salesforce. It will come in handy if you decide to monitor the effectiveness of these workflows. You can analyze process performance, measure the success of automation initiatives, and ensure that automated workflows resonate with your business objectives.
Orchestration work items
These details refer to individual tasks within automated workflows, which is useful in the analysis of task completion rates, performance metrics, and operational efficiency. Retrieve this dataset to evaluate your workflow efficiency, identify areas for improvement, and verify that tasks are completed in a timely and efficient manner.
How do you use Salesforce to Power BI integration?
Step 1. Connect your Salesforce account and choose a data entity to export
Step 2. Organize and transform data before loading it to Power BI
Step 3. Connect the Power BI account and copy the integration URL to the desktop app
Step 4. Schedule refreshes to automate data flow from Salesforce to Power BI
Pricing plans
- Monthly
- Annual (save 25%)
Your data is secured by industry standards
 Google Cloud
Certified
 SOC 2 Type II
Certified
 GDPR
GDPRCompliant
 HIPAA
HIPAACompliant
Don’t just take our word for it


How to integrate Salesforce to Power BI (detailed guide)
Connect Salesforce to Power BI by following the steps below:
Step 1: Collect data
To begin, authorize your Salesforce account. Then, select the particular data type you'd like to extract. Depending on the specified data type, adjust the other mandatory settings if there are any.
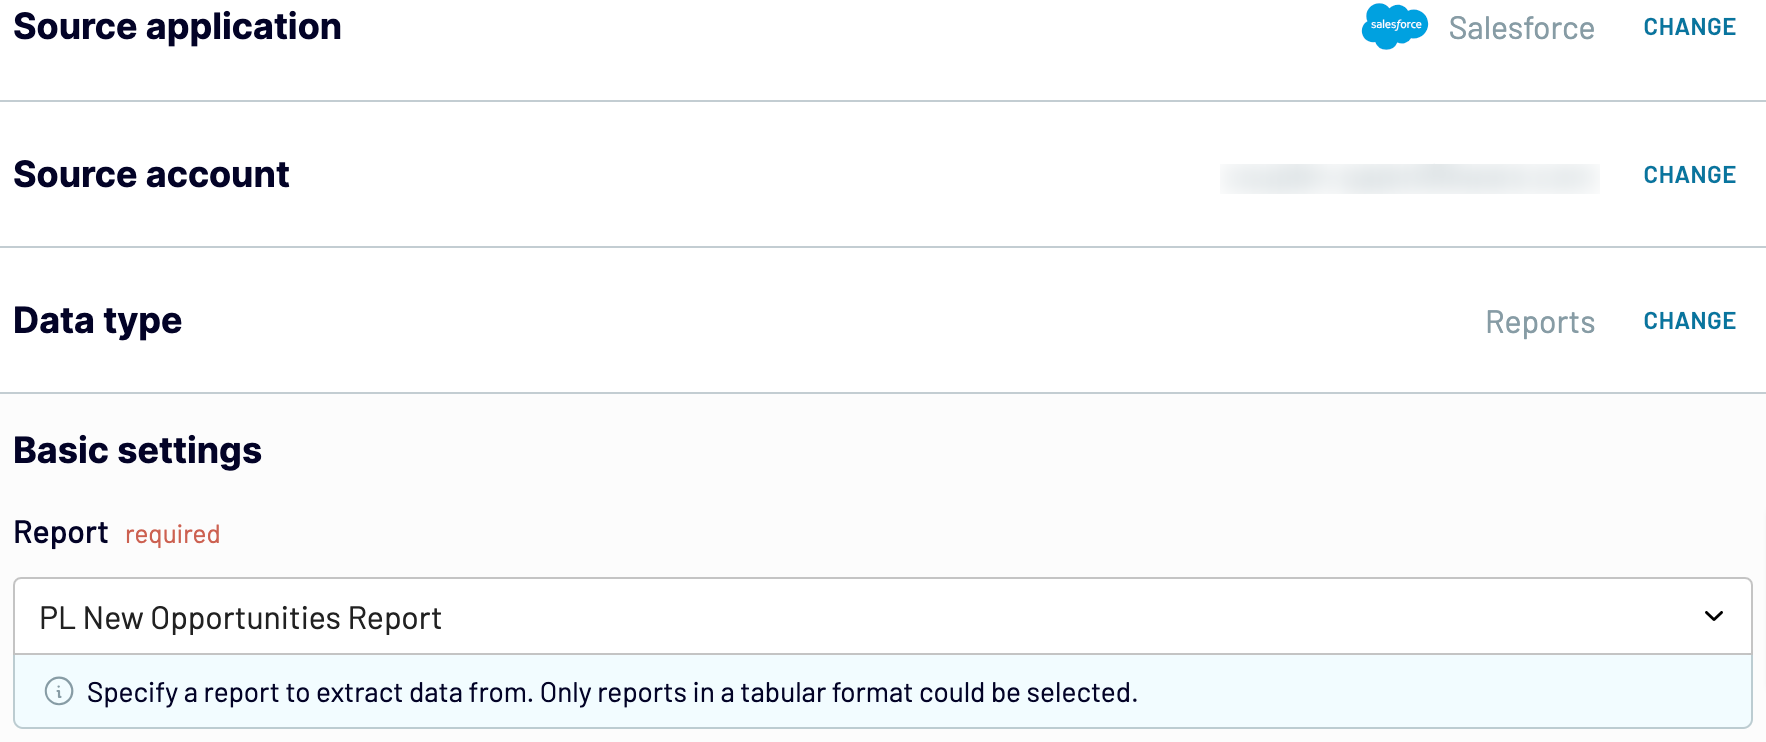
After that, proceed to the next step.
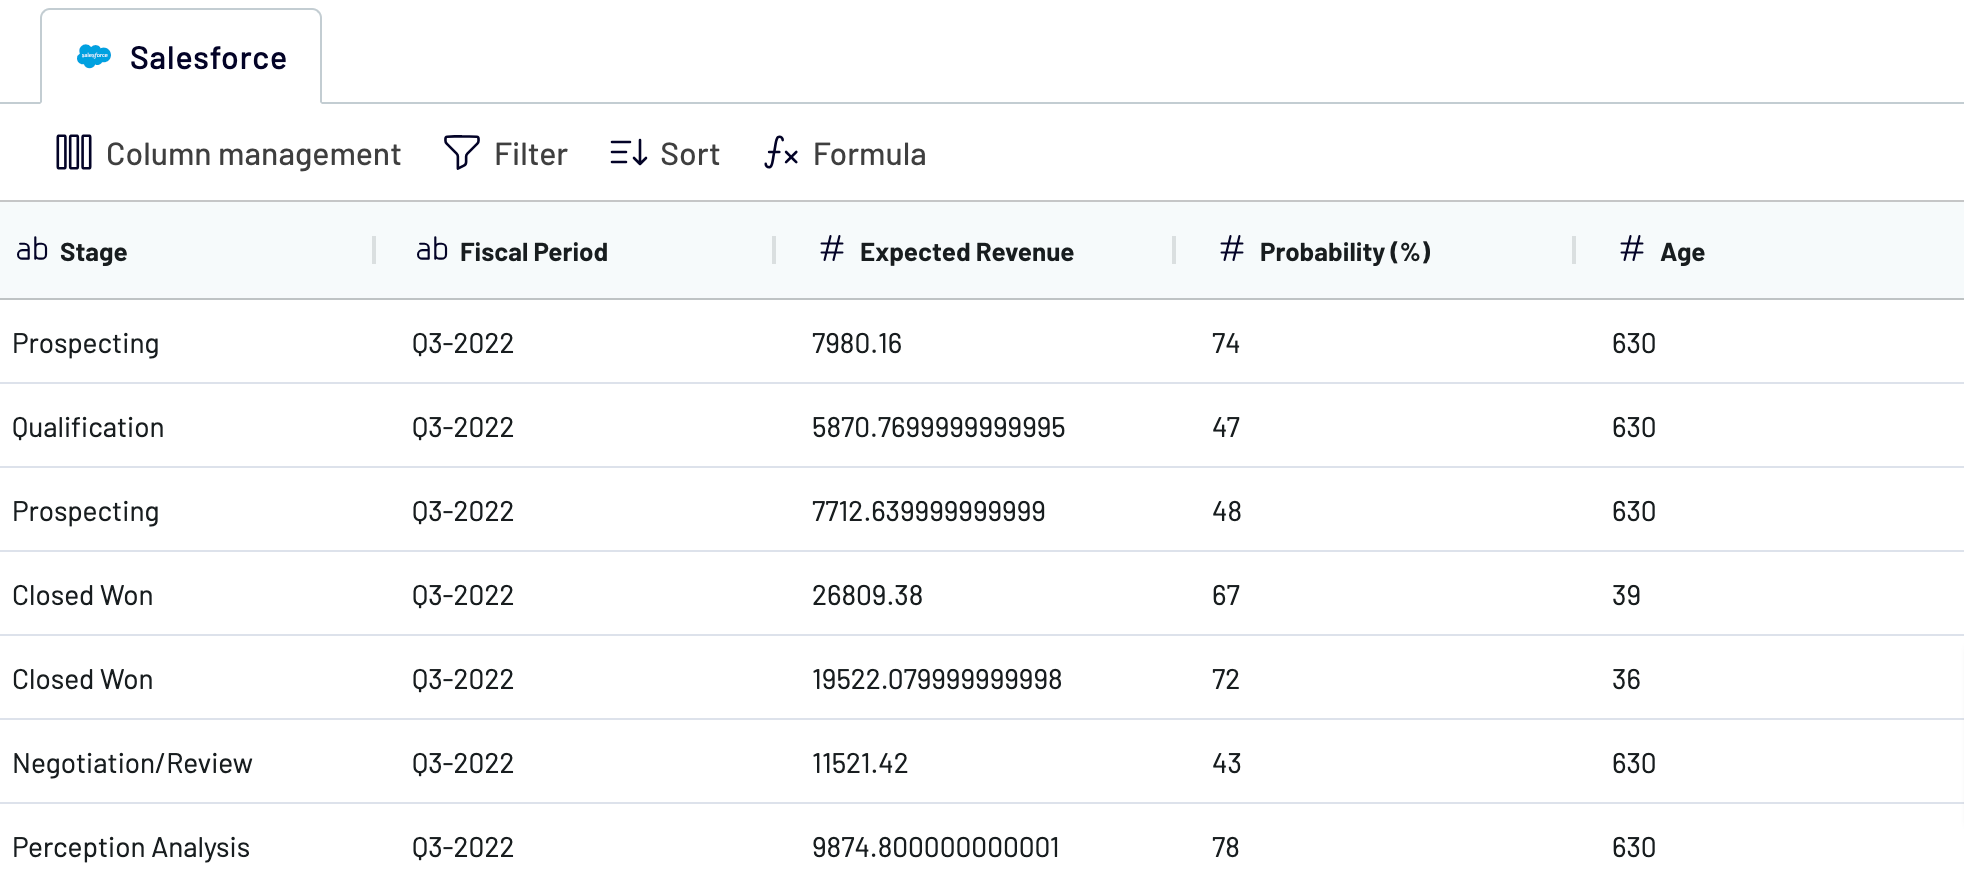
Step 2: Organize and transform
Before exporting data from Salesforce to Power BI, verify whether it's accurate. If not, you can make a broad array of transformations:
These alterations make it easier to align data with your reporting and analytics needs.
Once you're done with this step, move on to set up the destination.
Step 3: Load and automate
To make data import happen, follow the in-app instructions to generate the integration URL and insert it into the Power BI desktop application.
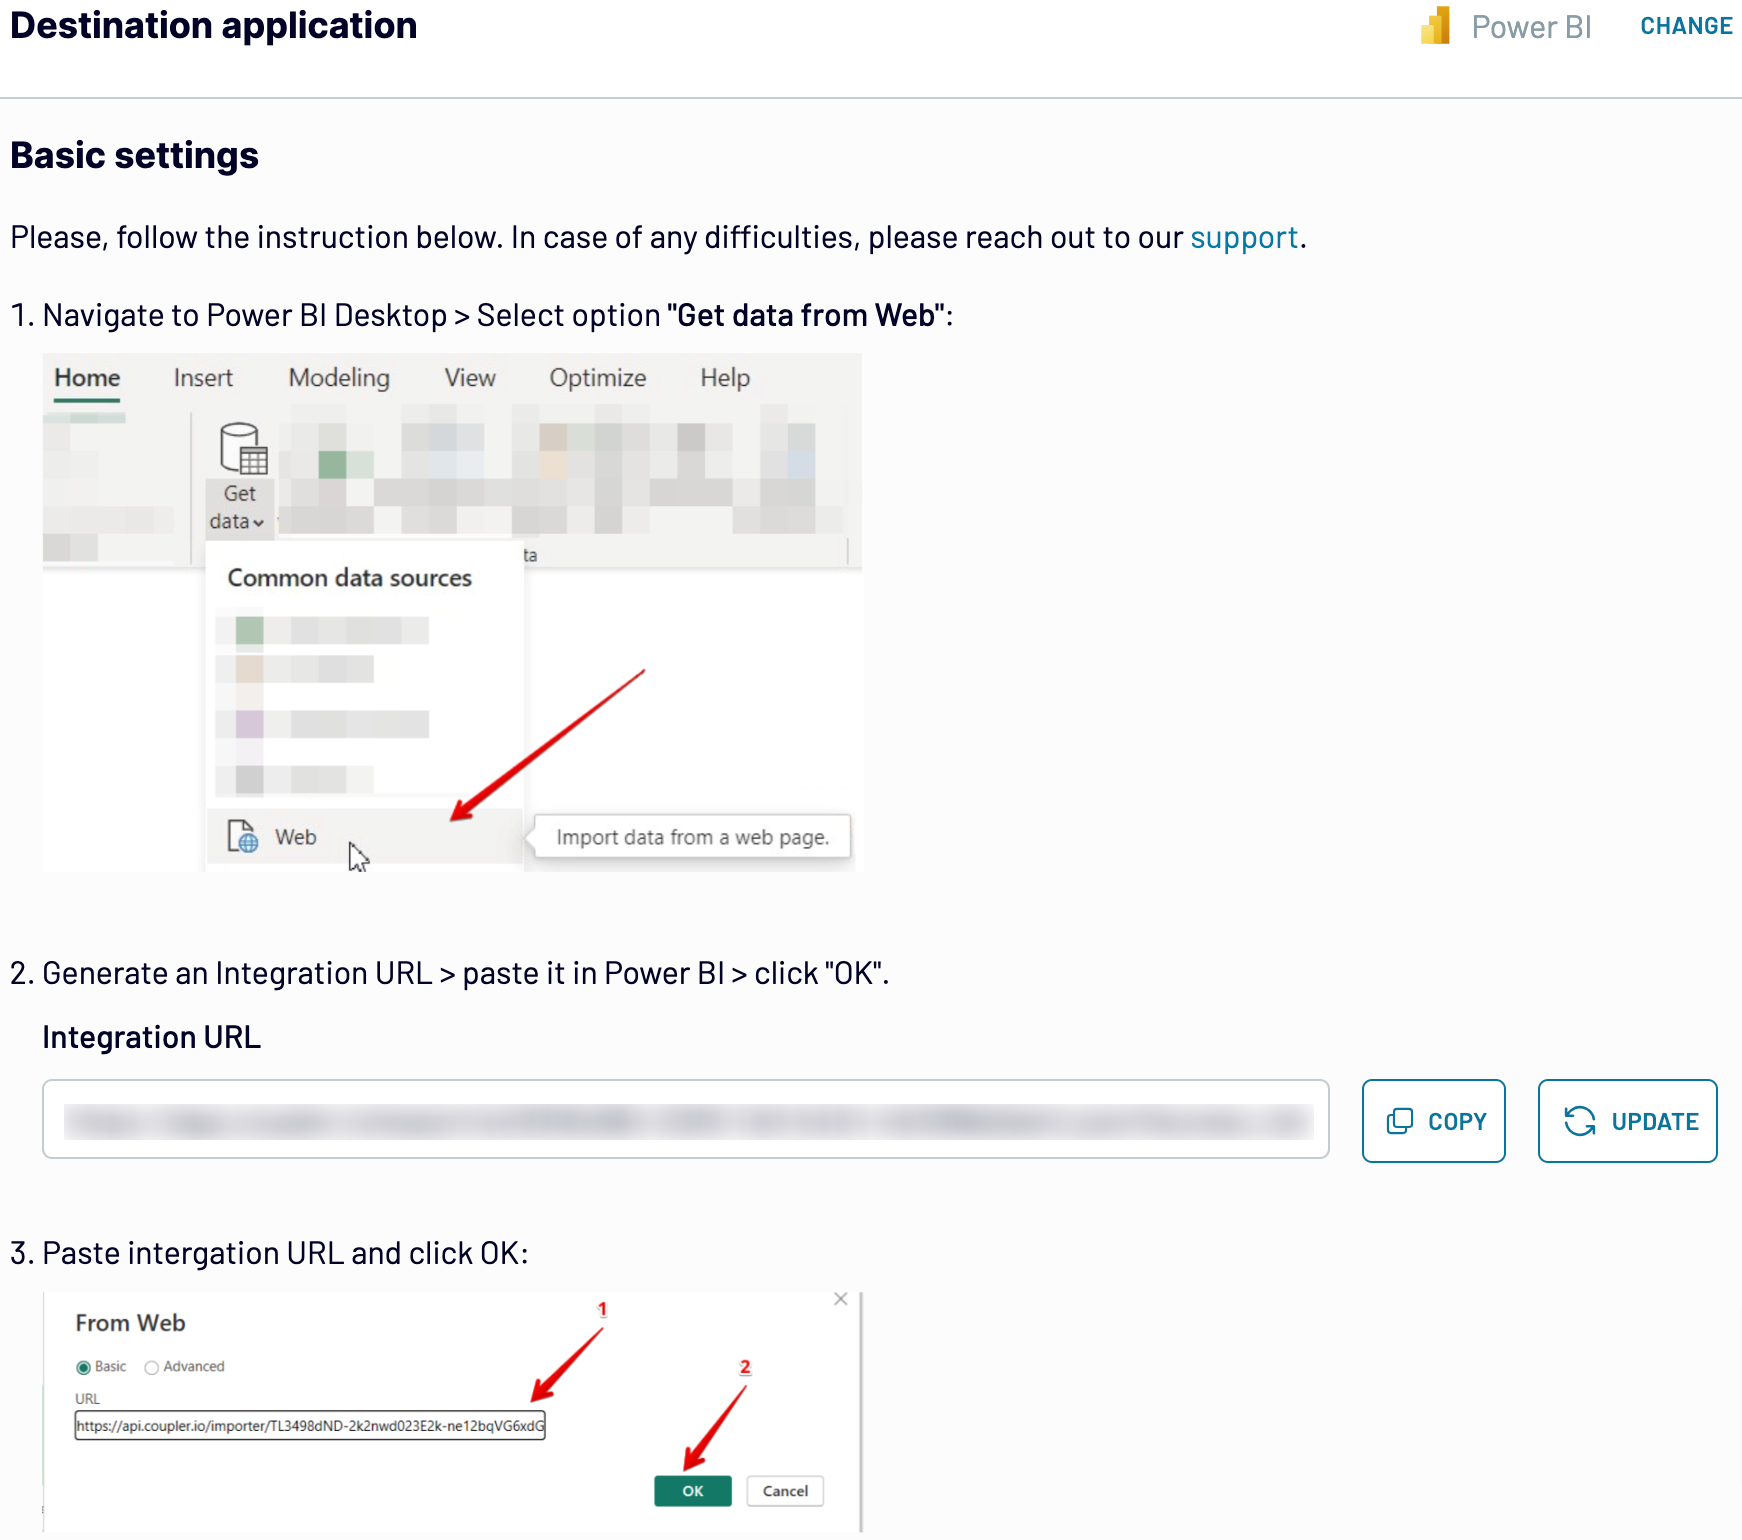
Next, turn on automated data refreshes and choose the preferred frequency in the respective dropdown field. Lastly, save and run the importer.
Step 1: Collect data
To begin, authorize your Salesforce account. Then, select the particular data type you'd like to extract. Depending on the specified data type, adjust the other mandatory settings if there are any.
After that, proceed to the next step.
Step 2: Organize and transform
Before exporting data from Salesforce to Power BI, verify whether it's accurate. If not, you can make a broad array of transformations:
- Edit, rearrange, hide, or add columns.
- Apply filters and sort data in the desired order.
- Create new columns with custom formulas.
- Combine data from different accounts or apps.
These alterations make it easier to align data with your reporting and analytics needs.
Once you're done with this step, move on to set up the destination.
Step 3: Load and automate
To make data import happen, follow the in-app instructions to generate the integration URL and insert it into the Power BI desktop application.
Next, turn on automated data refreshes and choose the preferred frequency in the respective dropdown field. Lastly, save and run the importer.
Connect Salesforce to Power BI and automate data exports on schedule
Enable the data refresh feature to have your Power BI report updated automatically. You're free to choose the desired interval: monthly, daily, hourly, or even every 30 or 15 minutes. On top of that, you can additionally specify the days of the week, the time slot, and the time zone you're comfortable with.
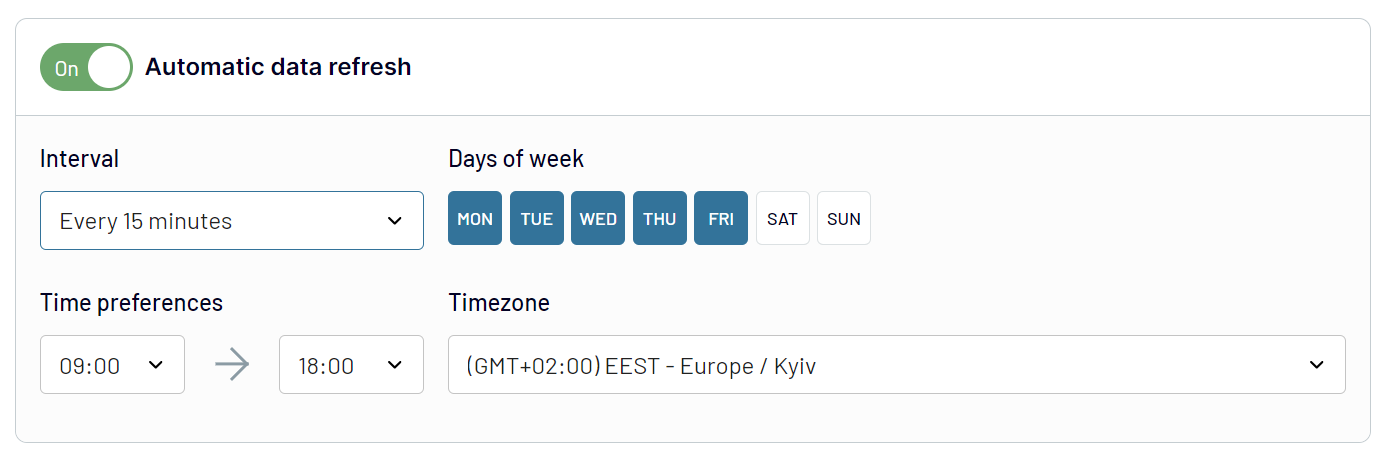
Thanks to Coupler.io's Salesforce to Power BI integration, you'll have the most recent data at hand. Your report will be regularly refreshed to correspond with the ever-changing source data.
Thanks to Coupler.io's Salesforce to Power BI integration, you'll have the most recent data at hand. Your report will be regularly refreshed to correspond with the ever-changing source data.
What key metrics can you export from Salesforce to Power BI?
Total sales
Description: Total sales represent the sum of all closed-won deals within a specified period.
How to calculate: Aggregate the total value of all closed-won opportunities.
Win rate
Description: Win rate is the percentage of opportunities that result in a closed-won deal.
How to calculate: Divide the number of closed-won opportunities by the total number of opportunities, then multiply by 100.
Close rate
Description: Close rate measures the percentage of deals successfully closed compared to the total number of opportunities.
How to calculate: Divide the number of closed deals by the total number of opportunities, then multiply by 100.
Average days to close
Description: Average days to close is the mean duration from opportunity creation to closure.
How to calculate: Sum the number of days taken to close each opportunity and divide by the total number of closed opportunities.
Pipeline value
Description: Pipeline value is the total worth of all open opportunities in the sales pipeline.
How to calculate: Sum the value of all open opportunities.
Open deals
Description: Open deals refer to the number of active opportunities in the sales pipeline.
How to calculate: Count the total number of opportunities that have not yet been closed or lost.
Expected revenue
Description: Expected revenue is the anticipated monetary value of open opportunities.
How to calculate: Sum the value of all open opportunities weighted by their probability of closure.
Average open deal age
Description: Average open deal age is the average duration that open deals have been in the pipeline.
How to calculate: Calculate the time elapsed since the creation of each open deal, then find the average duration.
Import data from Salesforce to Power BI or another destination
In addition to Salesforce to Power BI integration, Coupler.io enables you to replicate importers to load data into other apps:
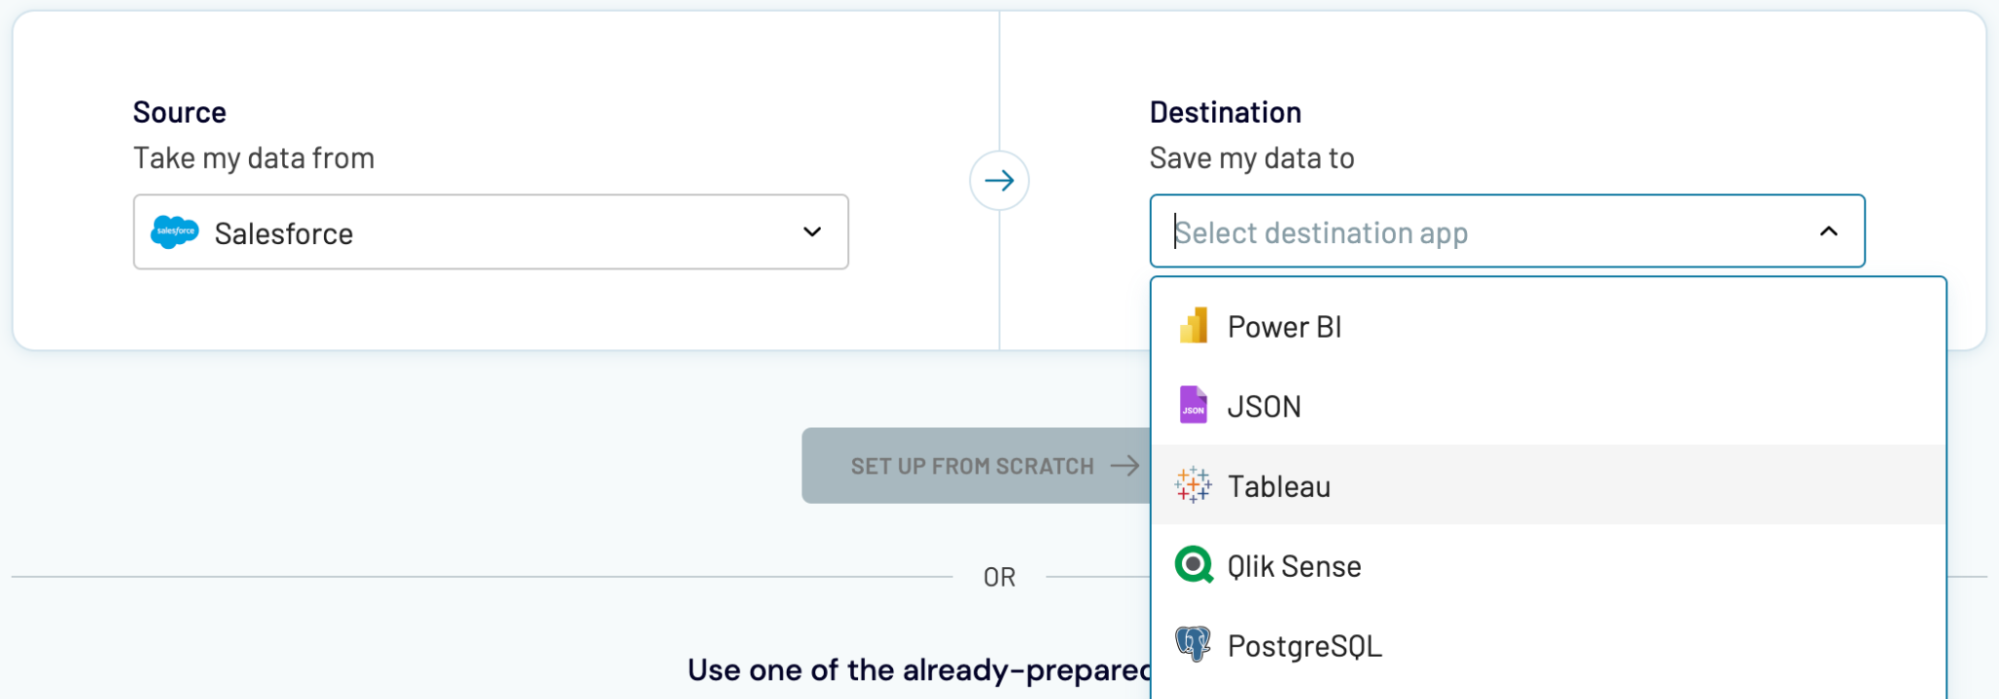
You can import data from Salesforce into these destinations much like you would with Power BI, as previously described.
- Spreadsheet applications: Google Sheets and Microsoft Excel.
- Data warehouses: BigQuery, PostgreSQL, and Redshift.
- Other business intelligence (BI) tools: Looker Studio, Tableau, and Qlik Sense.
You can import data from Salesforce into these destinations much like you would with Power BI, as previously described.