Export Facebook Ads to Power BI
Connect Facebook Ads to Power BI with Coupler.io and automate data imports without being a programmer. Collect, organize, and transform data in a few simple steps to create analysis-ready reports on your advertising performance.
Step 1
Set source basics

Step 2
Set destination

Setup data integration within seconds
Source application
 Facebook Ads
View all available apps on Data sources page
Metrics & dimensions
Period
Destination application
 Power BI
View all available apps on Data destinations page
Connect Facebook Ads to Power BI with Coupler.io to simplify reporting
Get and prepare data effortlessly
Use Coupler.io to export Facebook Ads to Power BI, even if you're unfamiliar with coding. Make various alterations to your advertising data, schedule automated refreshes at preferred frequency, and integrate records from multiple source apps.
Automate reporting tasks
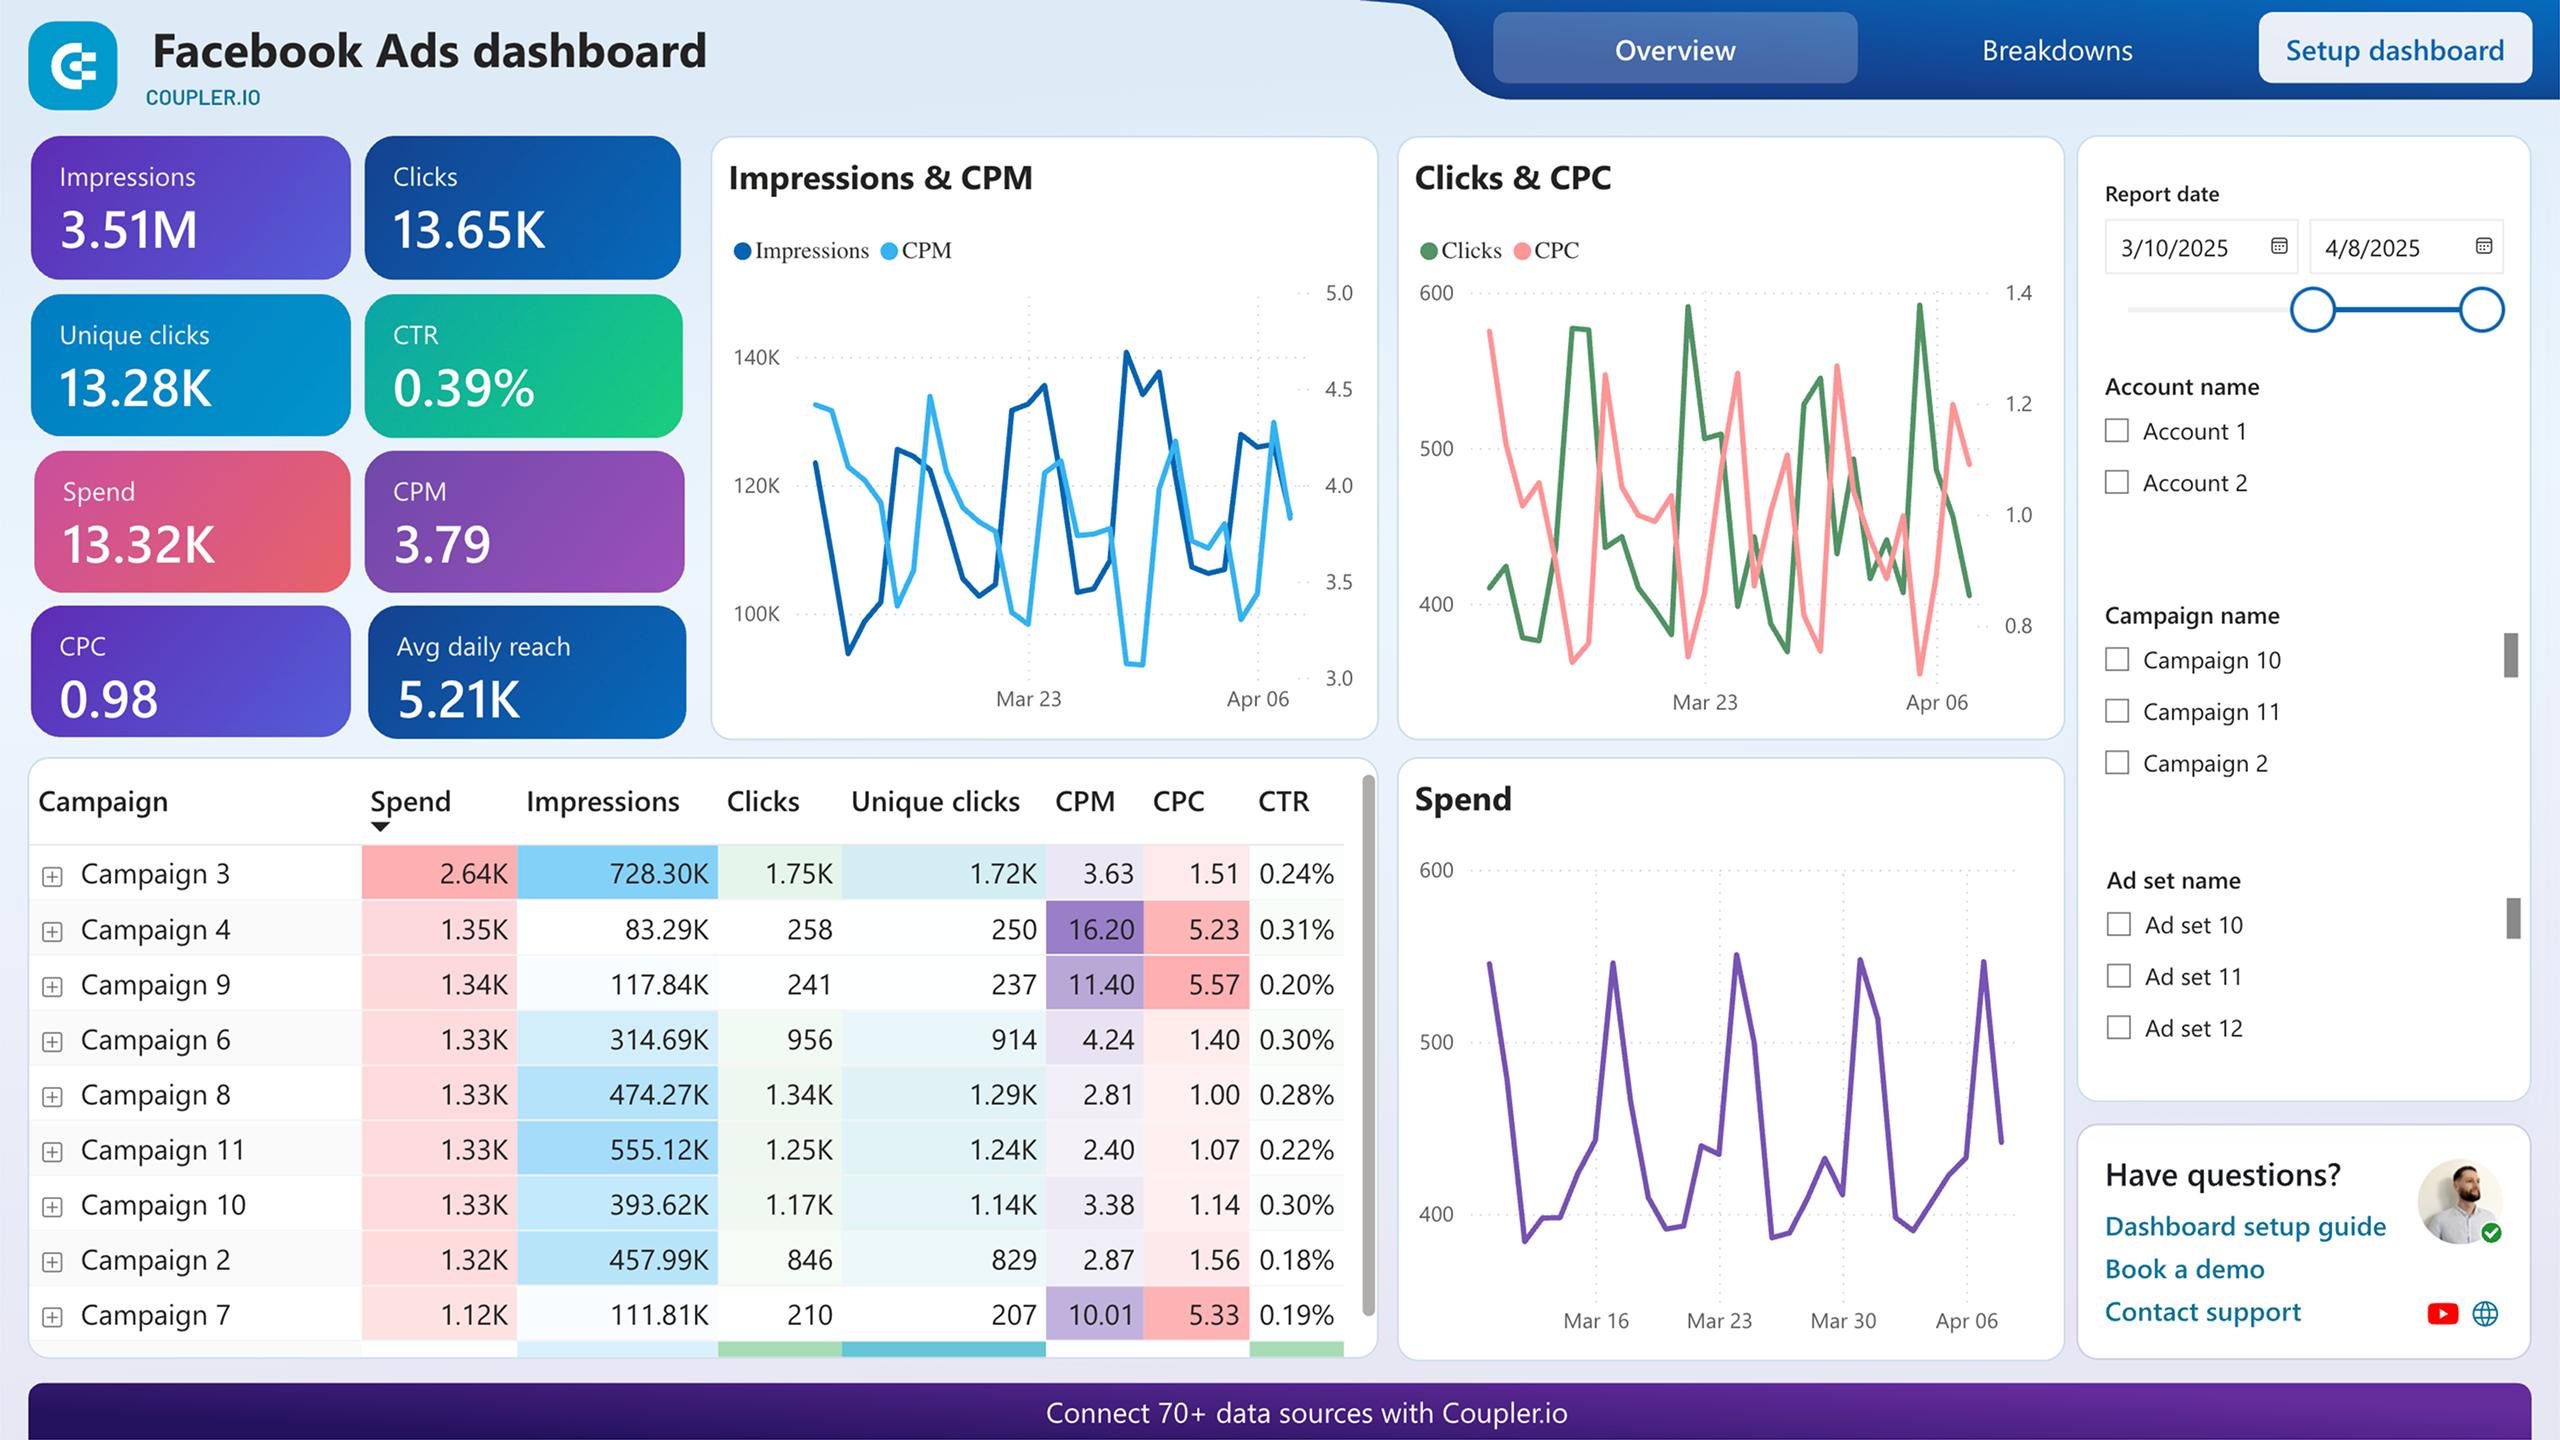
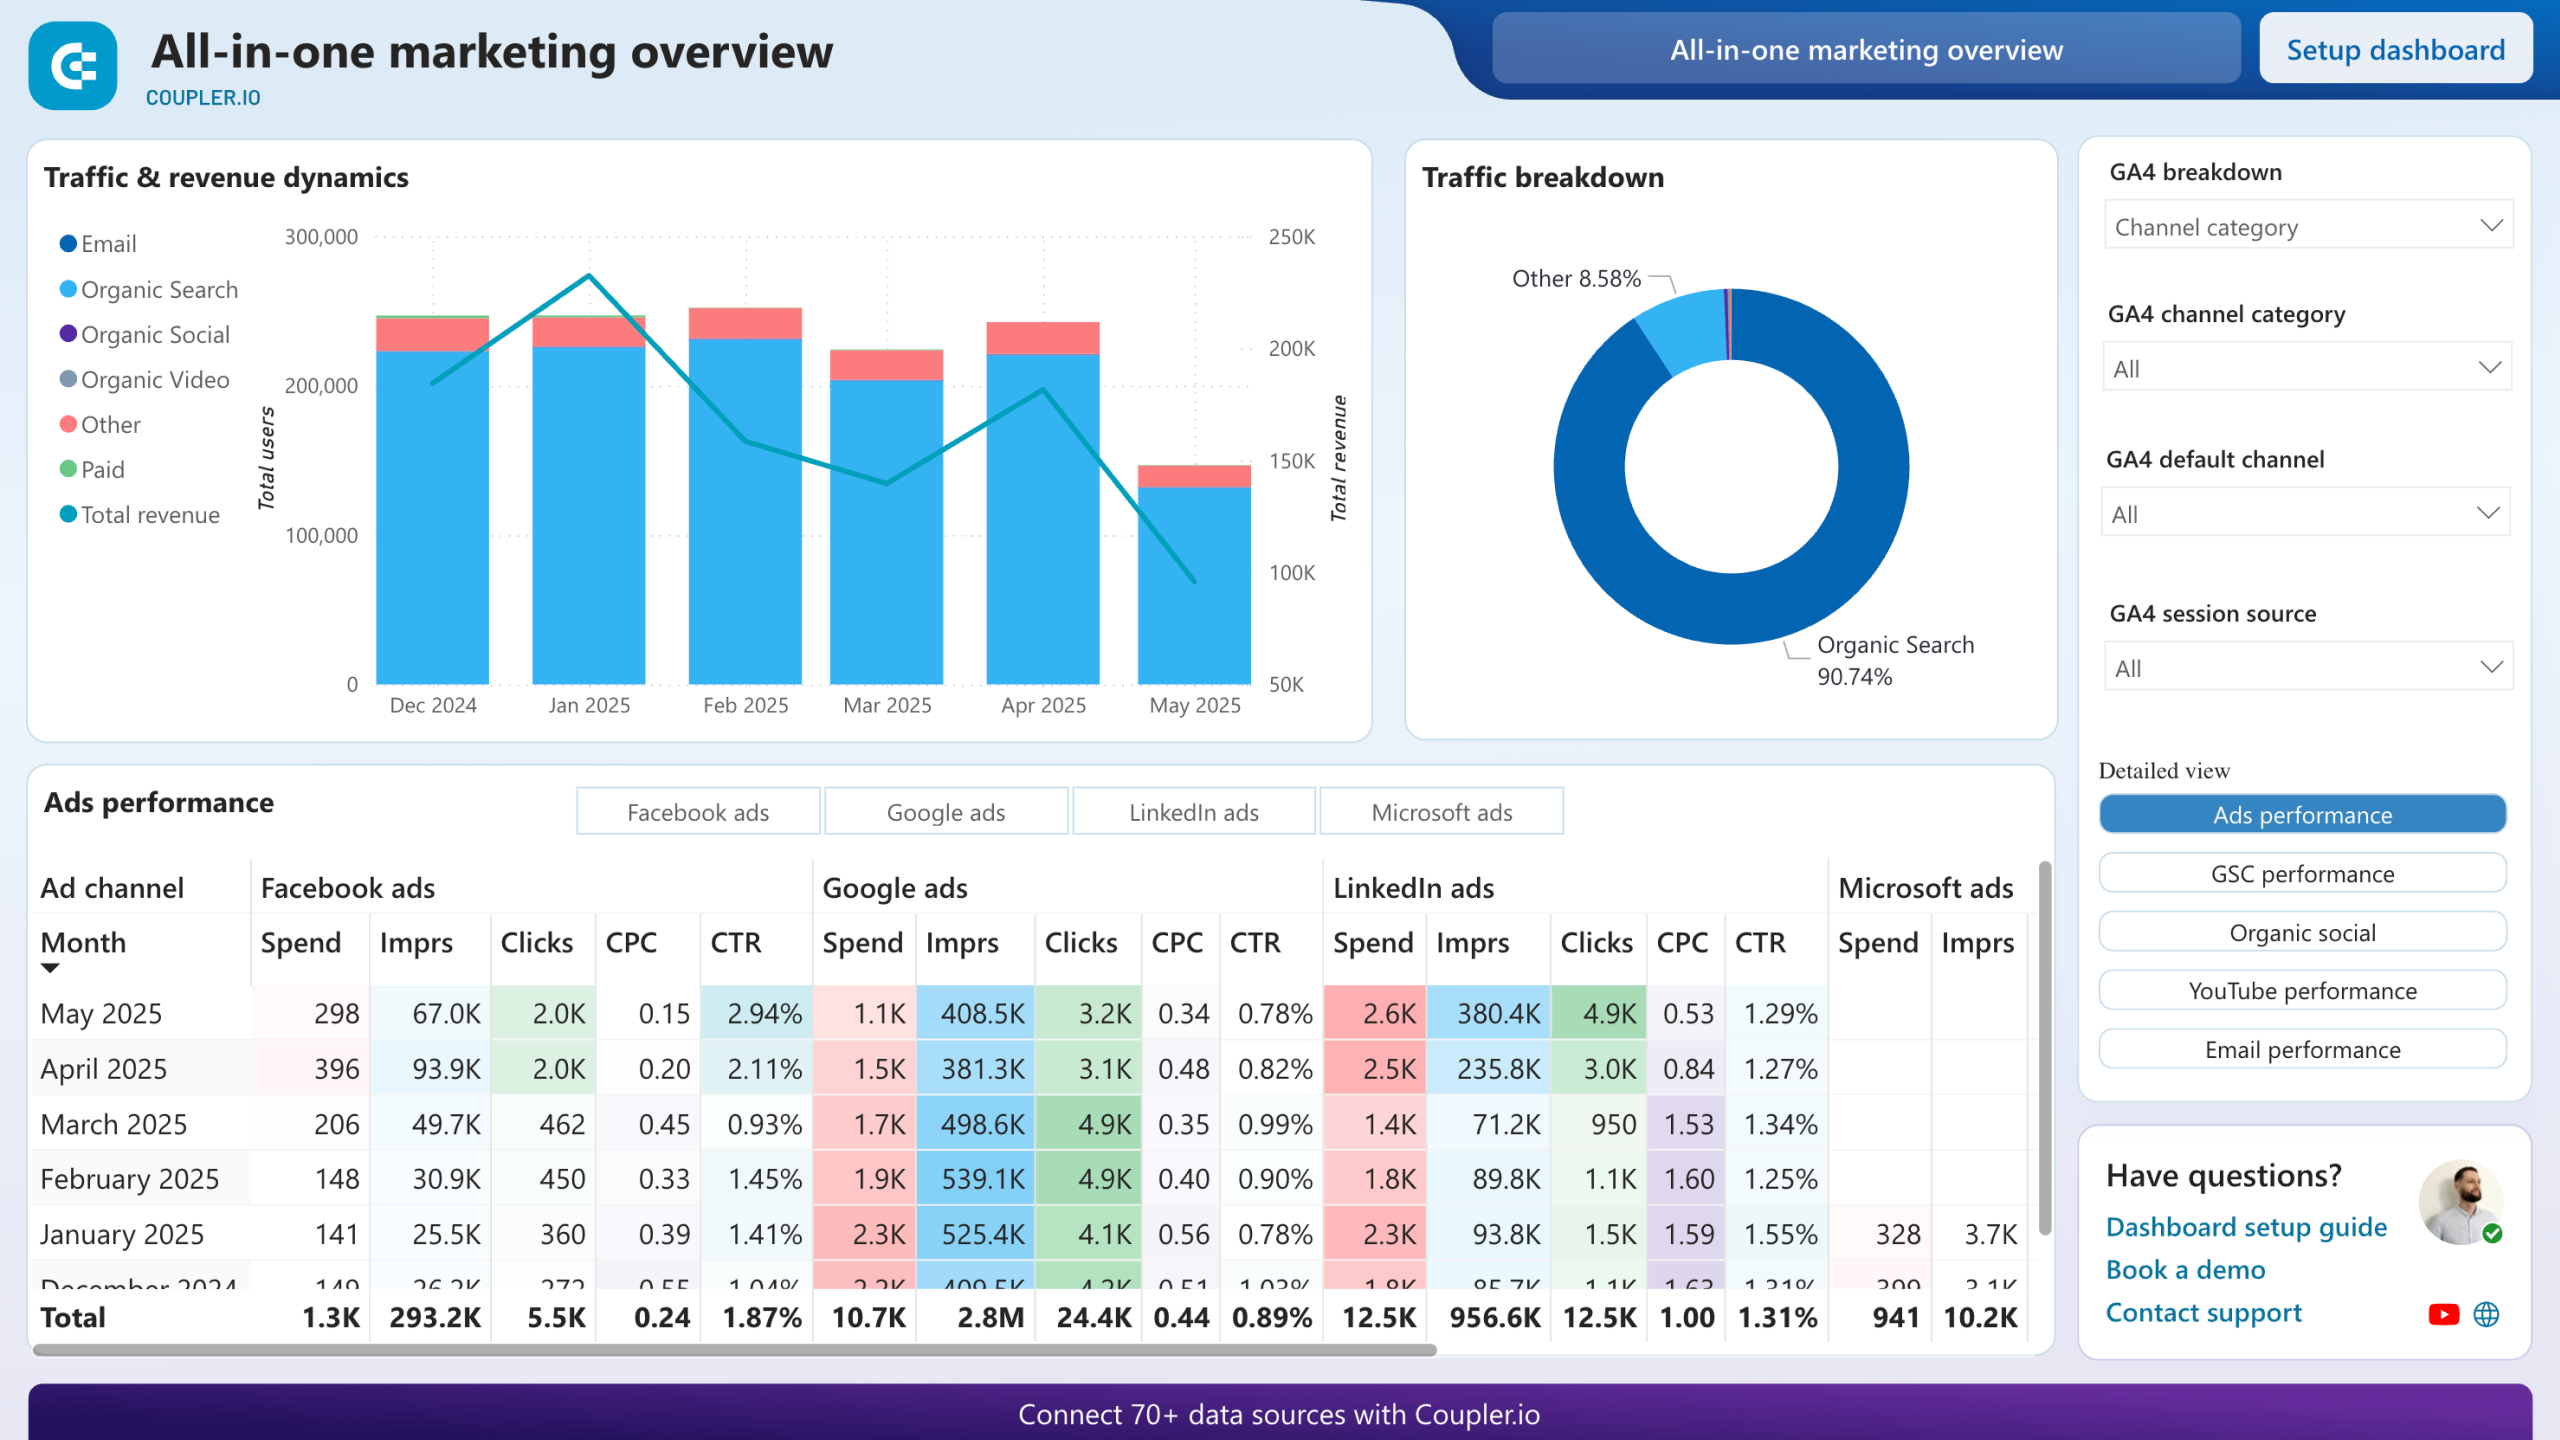
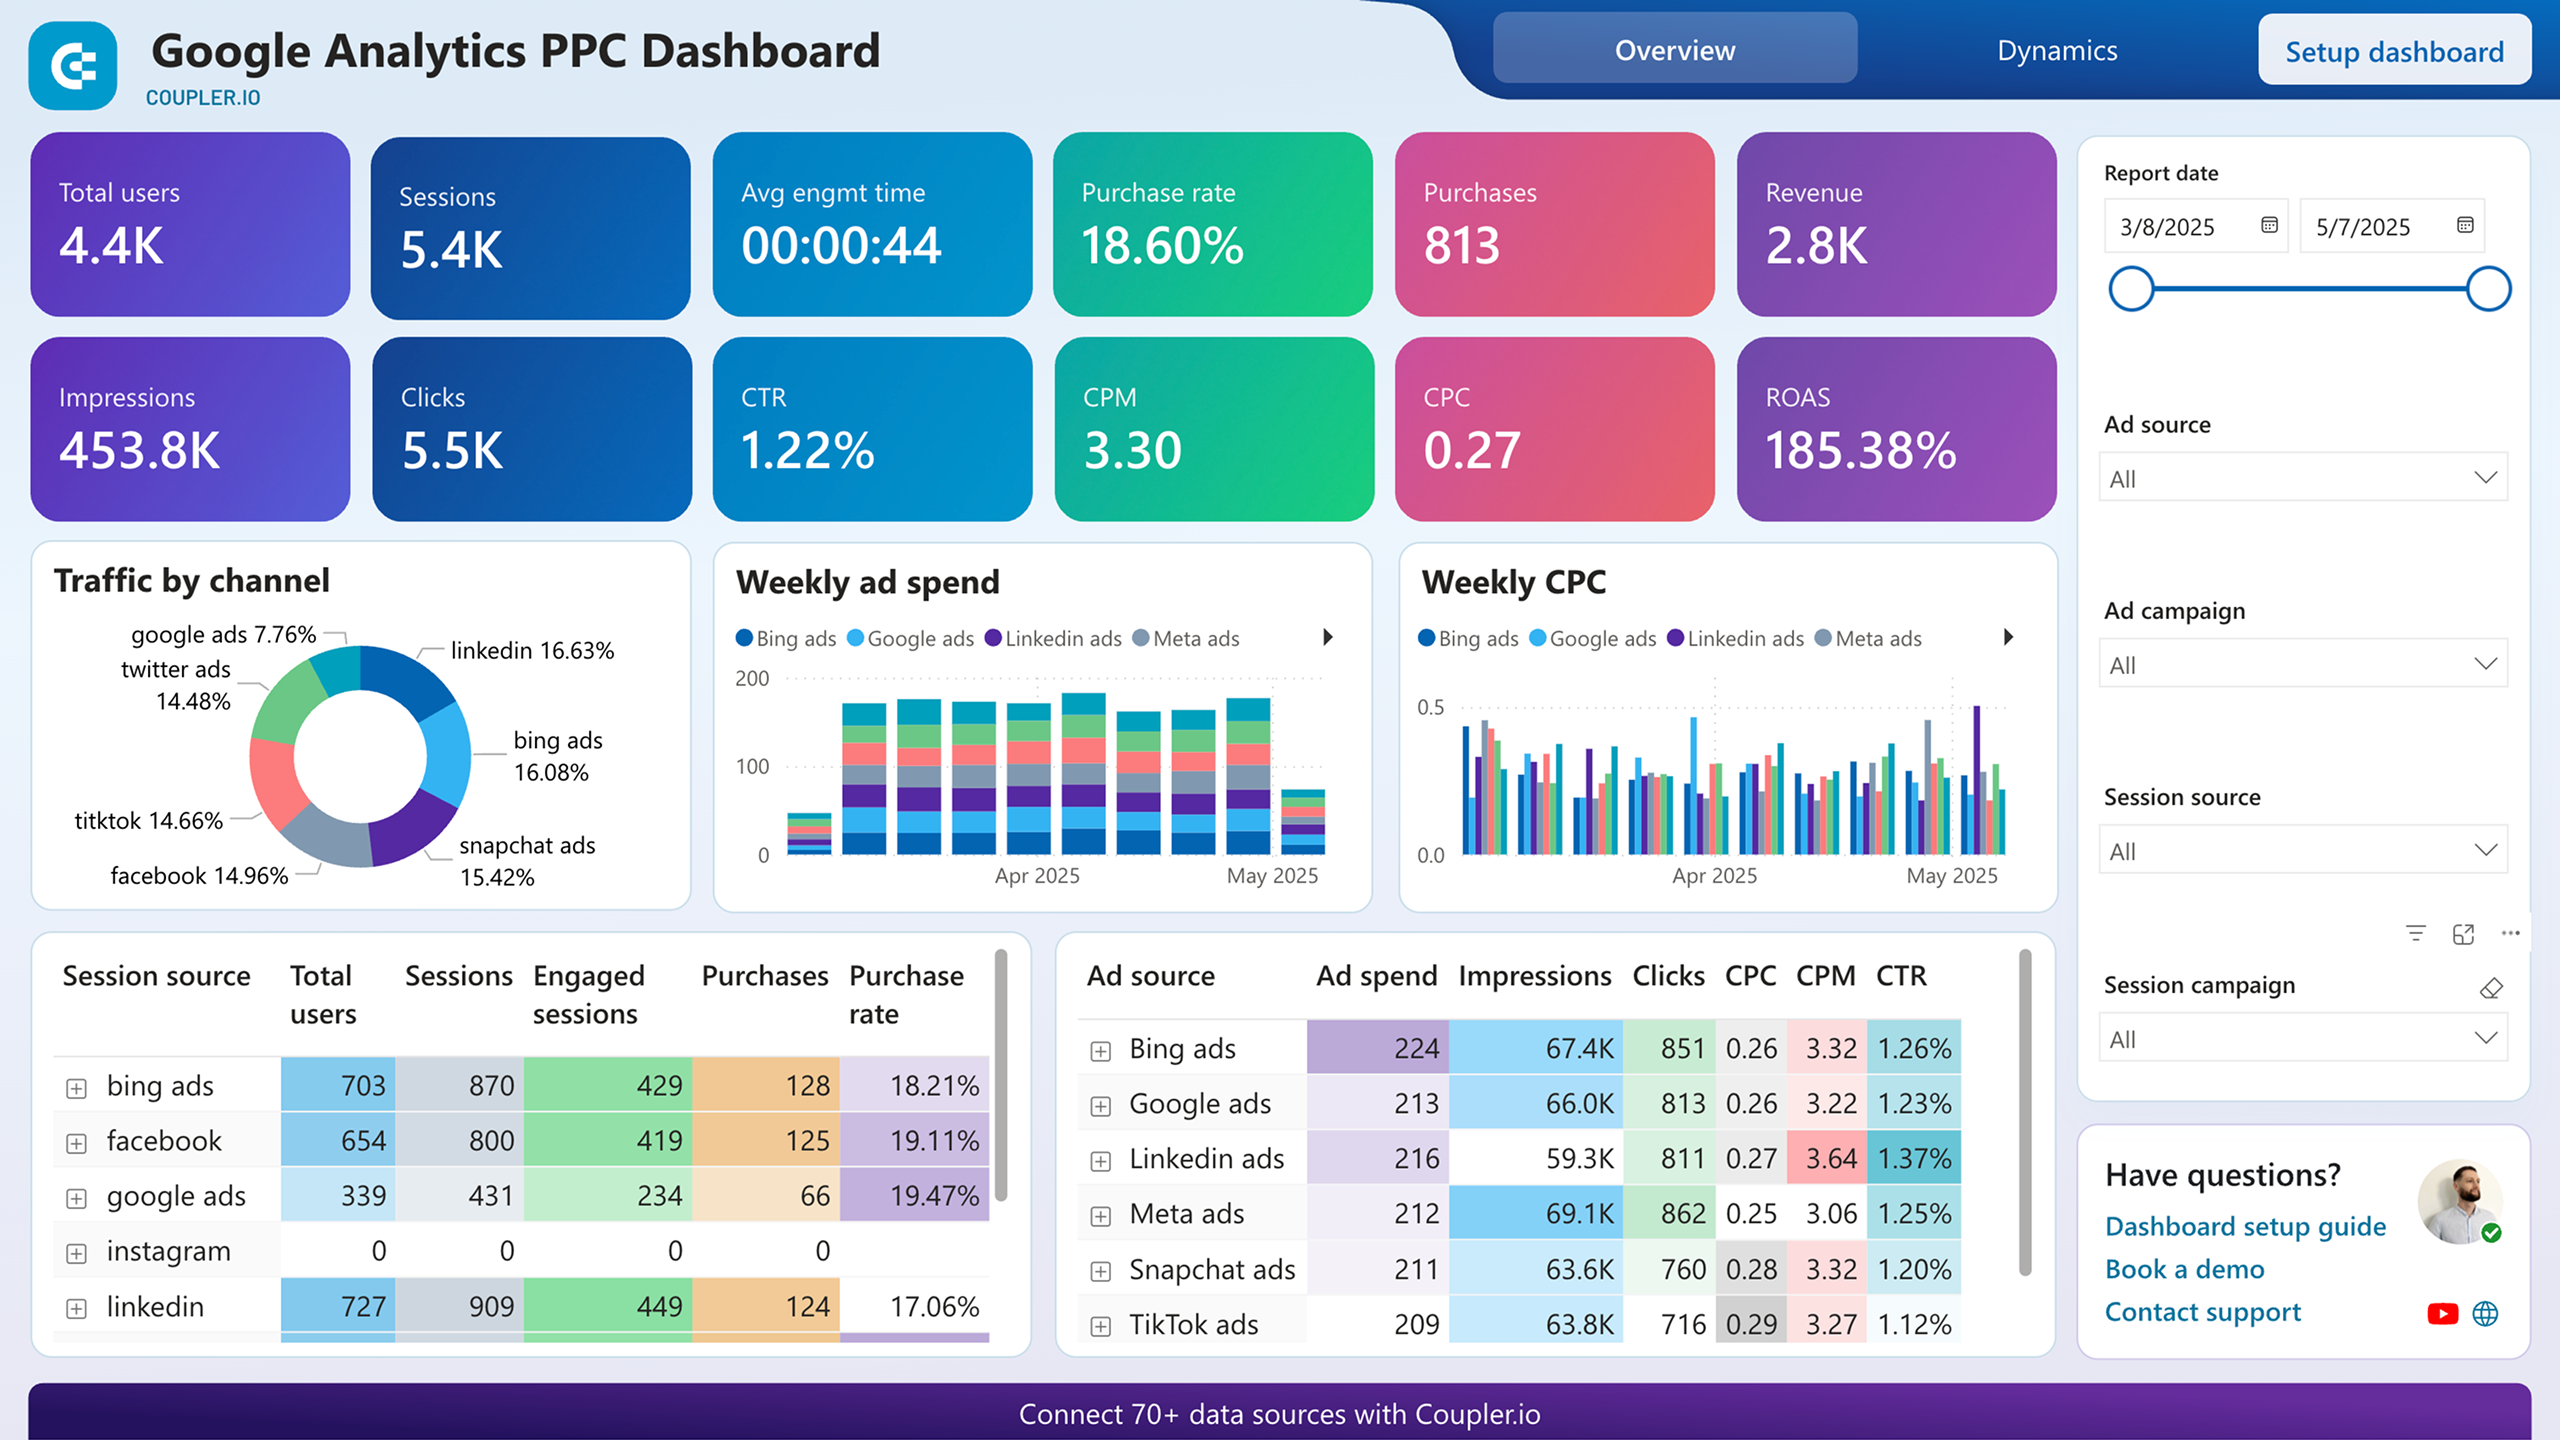
You can connect Facebook Ads to Power BI automatically in a matter of minutes. Give up manual uploads, build reports across diverse advertising channels, and simplify your understanding of PPC performance by visualizing it with our free dashboard templates.
Stand out as a data-driven expert
With Coupler.io's data analytics and automation, you can prioritize strategic tasks rather than mundane matters like reporting. Come across as an insightful expert to your clients and stakeholders by providing Power BI reports that truly impact business outcomes.
Export data from Facebook Ads to alternative destinations
Quick start with PPC dashboard templates
No such template is available yet.
No worries. Our team will create a template that fits your needs, just tell us more
about your case. It doesn't cost you a penny 😉
Request a custom report
about your case. It doesn't cost you a penny 😉
Export Facebook Ads to Power BI automatically with just a few clicks
Connect similar PPC apps and get data in minutes
What to export from Facebook Ads to Power BI
Reports and insights
You can load this dataset from Facebook Ads to Power BI to take a deep dive into advertising results. This information covers vital performance metrics such as the amount spent, impressions, clicks, CTR, CPM, and CPC. Such a broad overview offers valuable insights into ad campaign effectiveness and audience engagement.
List of ads
Export Facebook Ads to Power BI for a detailed analysis of individual ad creatives. It comprises diverse information like the time of the last update, status, and improvement recommendations, among others. This data can help you identify top-performing ad creatives and use these findings to optimize future campaigns for better PPC results.
List of ad sets
By extracting this kind of data, you get information on different ad sets within campaigns, including bid strategy, daily budget, budget remaining, etc. Analyzing ad sets makes it easier to understand the effectiveness of various audience segments and optimize targeting strategies to take campaign performance to the next level.
List of campaigns
A list of campaigns lets you delve into details of all advertising campaigns run on Facebook. Using data like buying type, objectives, start time, and so on, you can assess the overall effectiveness of their advertising efforts. Importing this information from Facebook Ads to Power BI contributes valuable input into strategic decision-making.
How do you export Facebook Ads to Power BI?
Step 1. Connect your Facebook Ads account and specify from where you'd like to export data
Step 2. Organize and transform data before loading it to Power BI
Step 3. Connect the Power BI account and copy the integration URL to the desktop app
Step 4. Schedule refreshes to automate data flow from Facebook Ads to Power BI
Pricing plans
- Monthly
- Annual (save 25%)
Keep your data safe
Coupler.io safeguards your shared information and data transfers from breaches, leaks, and unauthorized disclosures.

How to export Facebook Ads to Power BI (detailed guide)
Here's how you can connect Facebook Ads to Power BI:
Step 1: Collect data
First, authorize your Facebook Ads account. After that, specify the Ad accounts from where you'd like to load data and the Report type, which is the exact data you'll export.
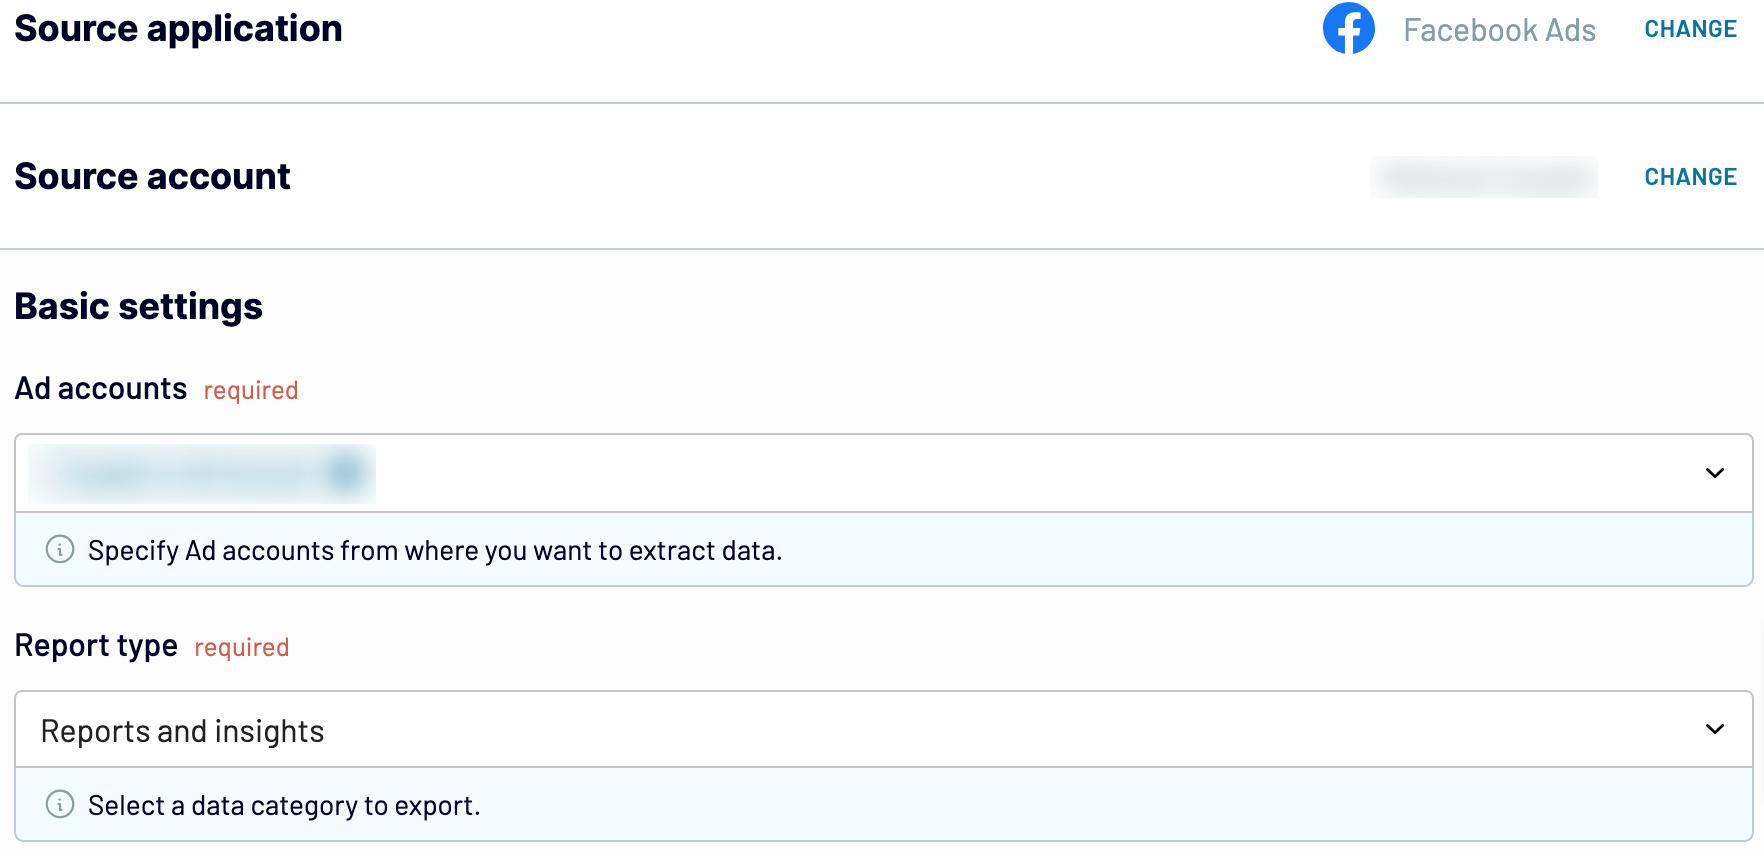
Select the Report period and the Metrics and dimensions you'll include in your report (required for Reports and insights only).

Click Finish and proceed. Next, press Transformations to move forward.
Step 2: Organize and transform
Preview your data before importing it from Facebook Ads to Power BI. If you'd like to make some modifications, you can do the following:
By doing so, you ensure the report will be ready for analysis without any further edits to your data.
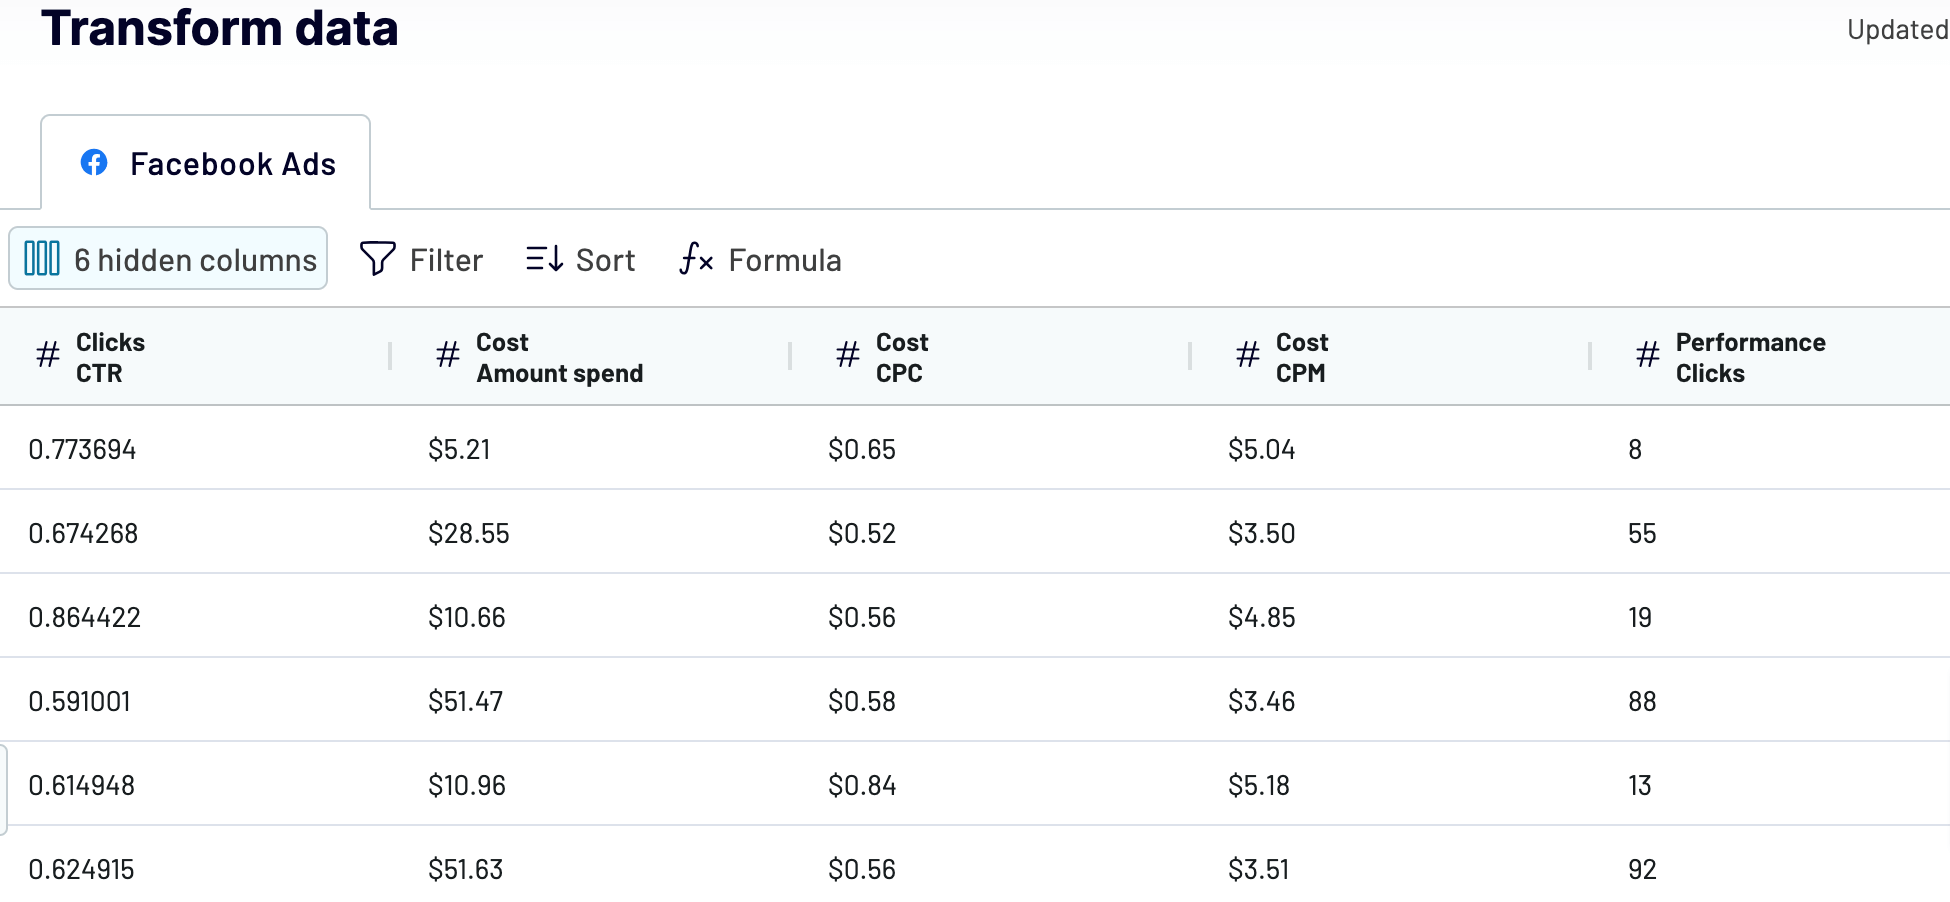
Once you know the data is accurate, click on Destinations.
Step 3: Load and automate
To actually export Facebook Ads to Power BI, generate the integration URL and paste it into the Power BI desktop app – all according to the in-app instructions.
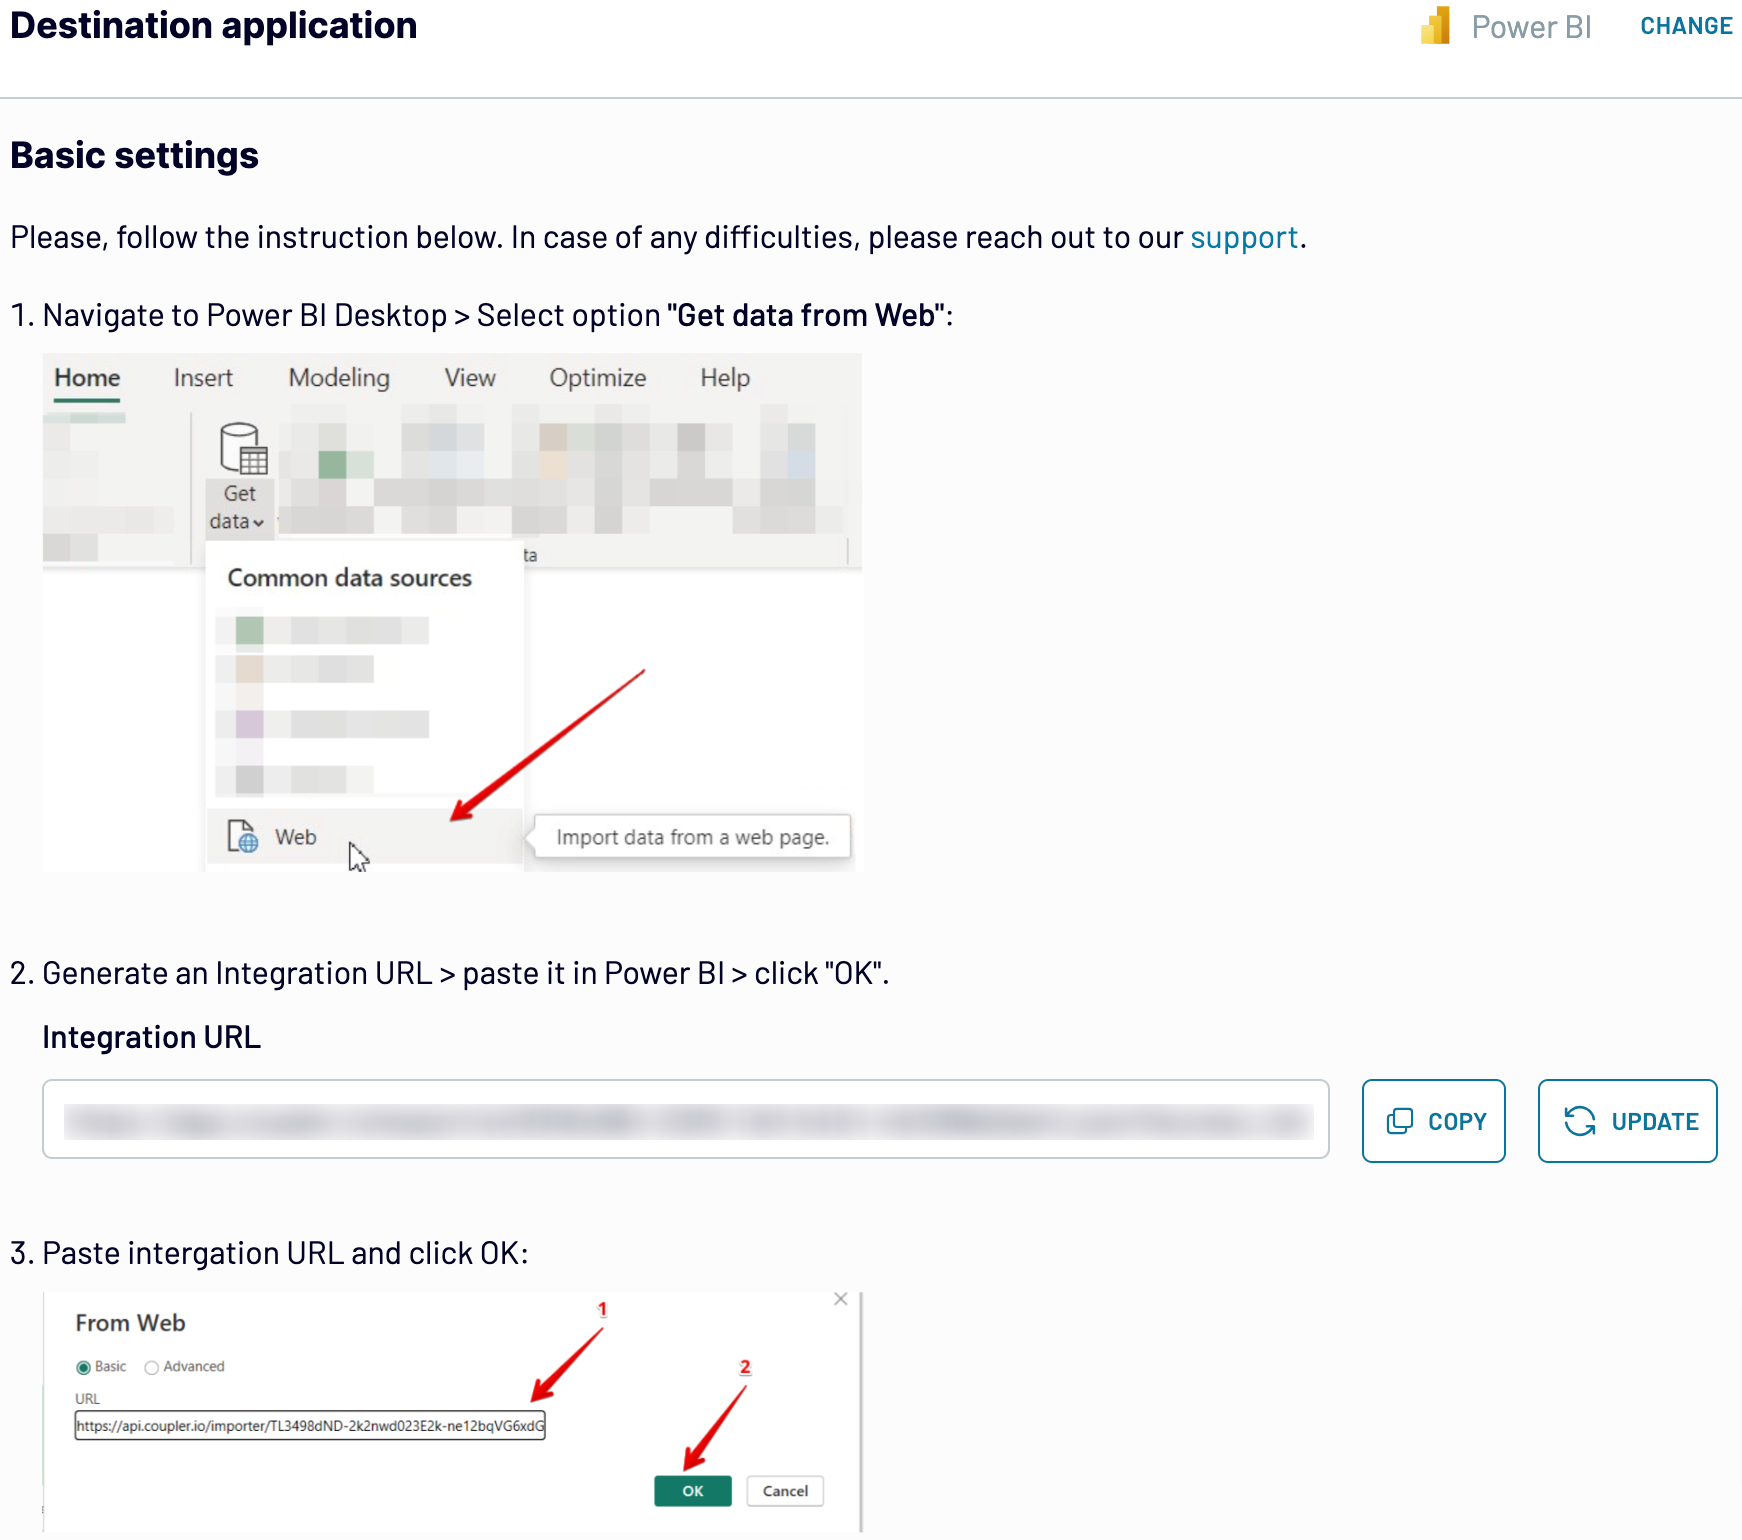
Return to Coupler.io and click Set a schedule to toggle on Automatic data refresh. Select the desired interval for auto-updates in the corresponding drop-down field. Lastly, press the Save and run importer button.
Step 1: Collect data
First, authorize your Facebook Ads account. After that, specify the Ad accounts from where you'd like to load data and the Report type, which is the exact data you'll export.

Select the Report period and the Metrics and dimensions you'll include in your report (required for Reports and insights only).

Click Finish and proceed. Next, press Transformations to move forward.
Step 2: Organize and transform
Preview your data before importing it from Facebook Ads to Power BI. If you'd like to make some modifications, you can do the following:
- Edit, rearrange, hide, or add columns.
- Filter and sort data in the preferred order.
- Create new columns with custom formulas.
- Combine data from different accounts or apps.
By doing so, you ensure the report will be ready for analysis without any further edits to your data.

Once you know the data is accurate, click on Destinations.
Step 3: Load and automate
To actually export Facebook Ads to Power BI, generate the integration URL and paste it into the Power BI desktop app – all according to the in-app instructions.

Return to Coupler.io and click Set a schedule to toggle on Automatic data refresh. Select the desired interval for auto-updates in the corresponding drop-down field. Lastly, press the Save and run importer button.
Connect Facebook Ads to Power BI and automate data exports on schedule
To make your Power BI report self-update, you must enable automated data refreshes. First, choose the update frequency for your data from monthly, daily, hourly, or even every 30 or 15 minutes. Then, you can adjust the days of the week, time preferences, and the time zone.

By activating this feature, you secure access to the most recent data that constantly corresponds with the ever-changing Facebook Ads records.

By activating this feature, you secure access to the most recent data that constantly corresponds with the ever-changing Facebook Ads records.
Replace or append the data you export from Facebook Ads to Power BI
Coupler.io offers several import modes for loading data from multiple sources. To benefit from them, click Connect one more source in the Data sources step. Next, complete a process that is pretty much the same as the configuration of the initial source. You can integrate different applications or numerous accounts of the same one within a single importer.
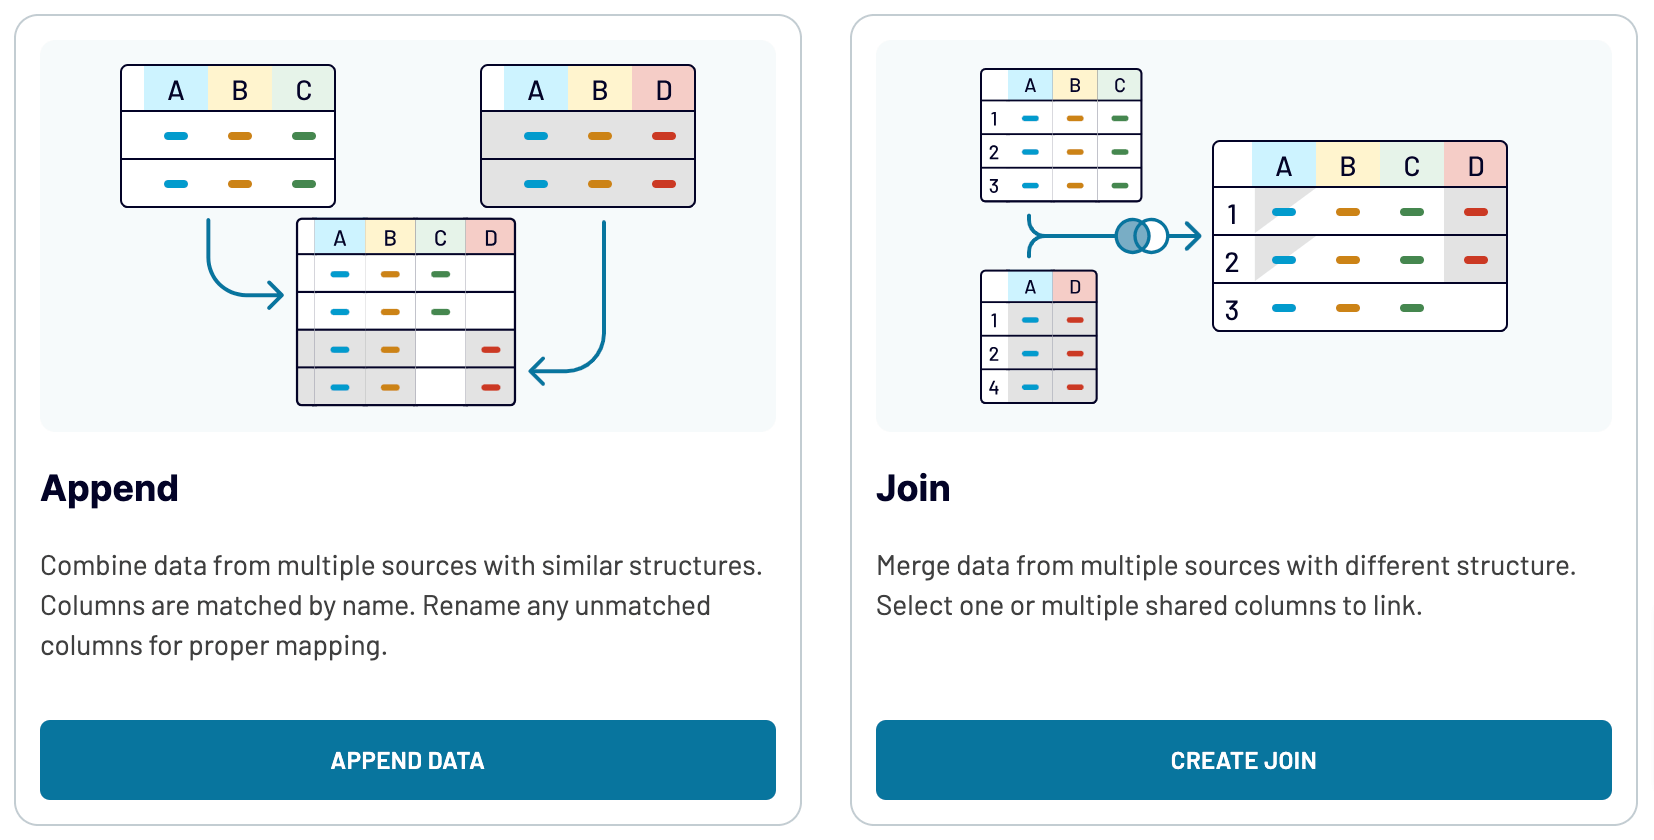
Furthermore, it's possible to blend data from different source apps. So, you can combine Facebook Ads records with data from other channels. After setting up the required sources and moving on to the Transformations step, choose from the following data blending options:
By exporting data from multiple applications, you expand your analytics and get a more comprehensive view of your advertising performance.
Furthermore, it's possible to blend data from different source apps. So, you can combine Facebook Ads records with data from other channels. After setting up the required sources and moving on to the Transformations step, choose from the following data blending options:
- Append: Merge data elements from one source into another. This feature requires identical column names between datasets.
- Join: Combine datasets side-by-side. At least one identical column in each dataset is required.

By exporting data from multiple applications, you expand your analytics and get a more comprehensive view of your advertising performance.
What key metrics can you export from Facebook Ads to Power BI?
Impressions
Description: Impressions represent the number of times your ad is displayed to a user. It indicates ad visibility.
How to calculate: Count the total times your ad is shown to users.
Link clicks
Description: Link clicks are the number of times users click on your ad, directing them to various destinations.
How to calculate: Count the total clicks on your ad.
CTR (click-through rate)
Description: CTR measures the frequency of users clicking on your ad after seeing it. This metric demonstrates the relevance and effectiveness of ads.
How to calculate: Divide the total number of clicks by the total number of impressions, then multiply by 100.
Amount spent
Description: Amount spent refers to the expenditure on the ad campaign during a specified period. It shows the campaign's reach and budget distribution.
How to calculate: Determine the total expenditure on the ad campaign.
CPM (cost per mille)
Description: CPM denotes the expense incurred when your ad is displayed a thousand times to users, which is helpful in evaluating cost efficiency.
How to calculate: Divide the total cost of the ad campaign by the total number of impressions, then multiply by 1,000.
Import data from Facebook Ads to Power BI or another destination
Besides the capability to export Facebook Ads to Power BI, Coupler.io enables you to replicate importers to send data to alternative destinations:
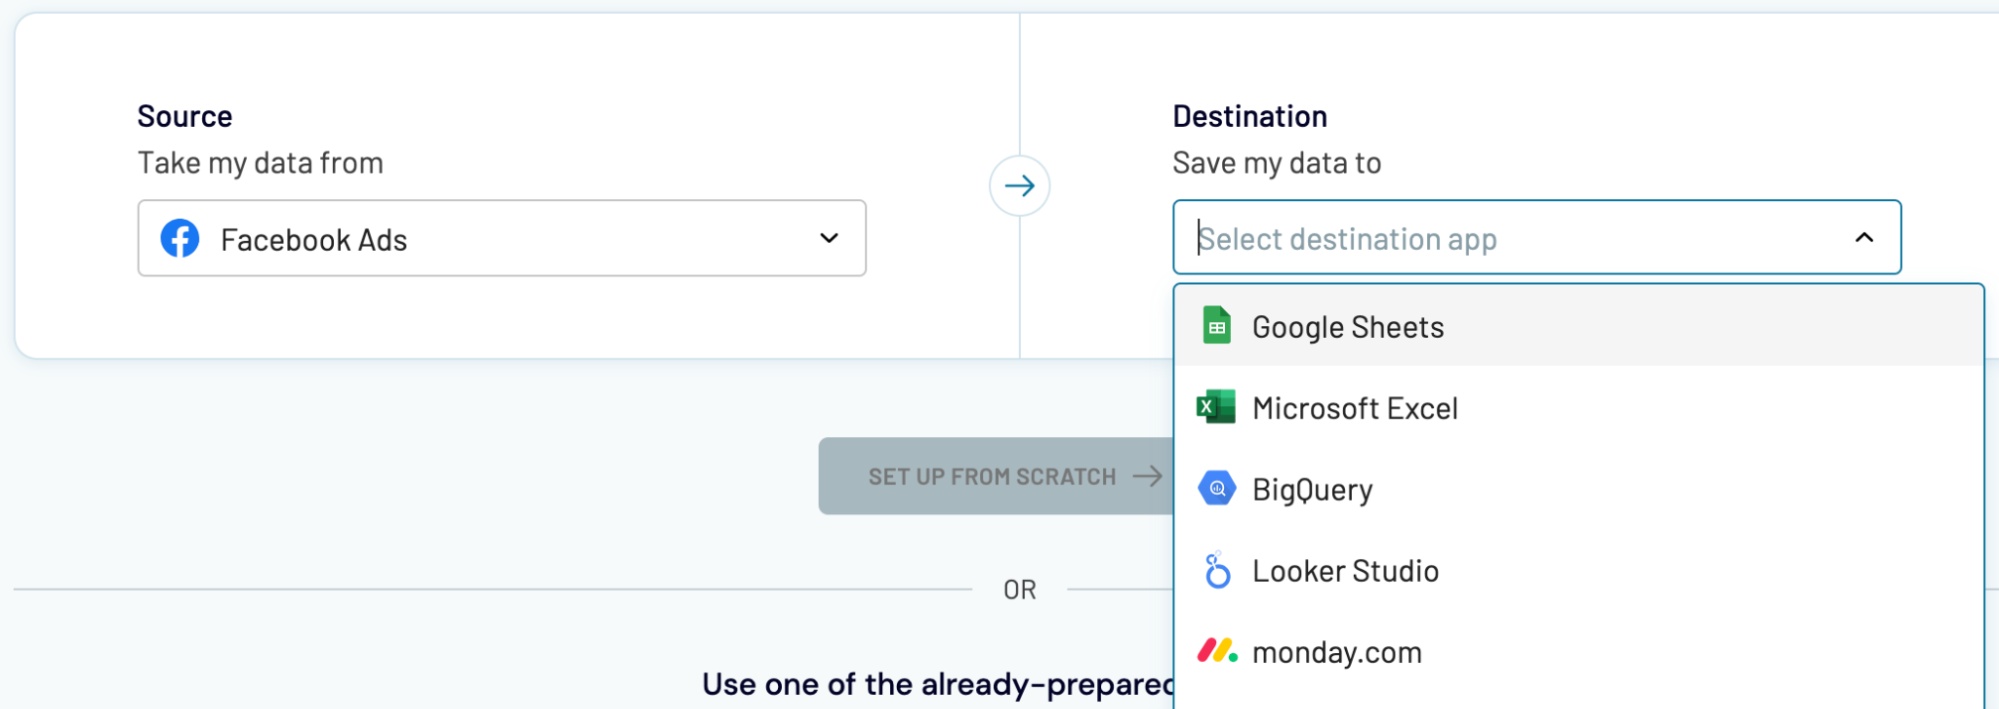
The import of Facebook Ads data to these applications is quick and straightforward, much like what we previously outlined for Power BI.
- Spreadsheet apps: Google Sheets and Microsoft Excel.
- Data warehousing software: BigQuery, PostgreSQL, and Redshift.
- Other business intelligence (BI) tools: Tableau, Looker Studio, and Qlik Sense.

The import of Facebook Ads data to these applications is quick and straightforward, much like what we previously outlined for Power BI.


