Connect Twitter Ads to Power BI
No coding is required to automate data exports from Twitter Ads to Power BI. Coupler.io simplifies organizing and preparing your advertising data for analysis. Gain valuable insights through dynamic reports or dashboards and easily make data-driven decisions.


Connect Twitter Ads to Power BI with Coupler.io to simplify marketing reporting
Get and prepare data effortlessly
Coupler.io's no-code integration allows you to gather data from Twitter Ads to Power BI effortlessly. Its user-friendly interface makes it easy to prepare self-updating reports. Filters, custom functions, and data transformation are available out of the box. Optimize your workflow by scheduling exports and combining data from various sources.
Automate reporting tasks
Focus on what matters with Coupler.io's automated reporting. Say goodbye to manual data entry by seamlessly connecting Twitter Ads to Power BI. Craft clear and insightful reports, drawing data from a single source or combining it across applications. Maximize your reporting efficiency with the help of pre-built dashboard templates.
Stand out as a data-driven expert
Upgrade your advertising reporting with complete automation for both data collection and transformation. Craft clear and insightful reports, drawing data from a single source or combining it across applications. Let Coupler.io handle your reporting routine so you can allocate more time to strategic tasks and empower data-driven decisions.
How to connect Twitter Ads to Power BI (detailed guide)
Improve your reporting processes with the help of Coupler.io connectors. In just a few simple steps, you can have your advertising campaign data presented as a report. Here is how to connect Twitter Ads to Power BI:
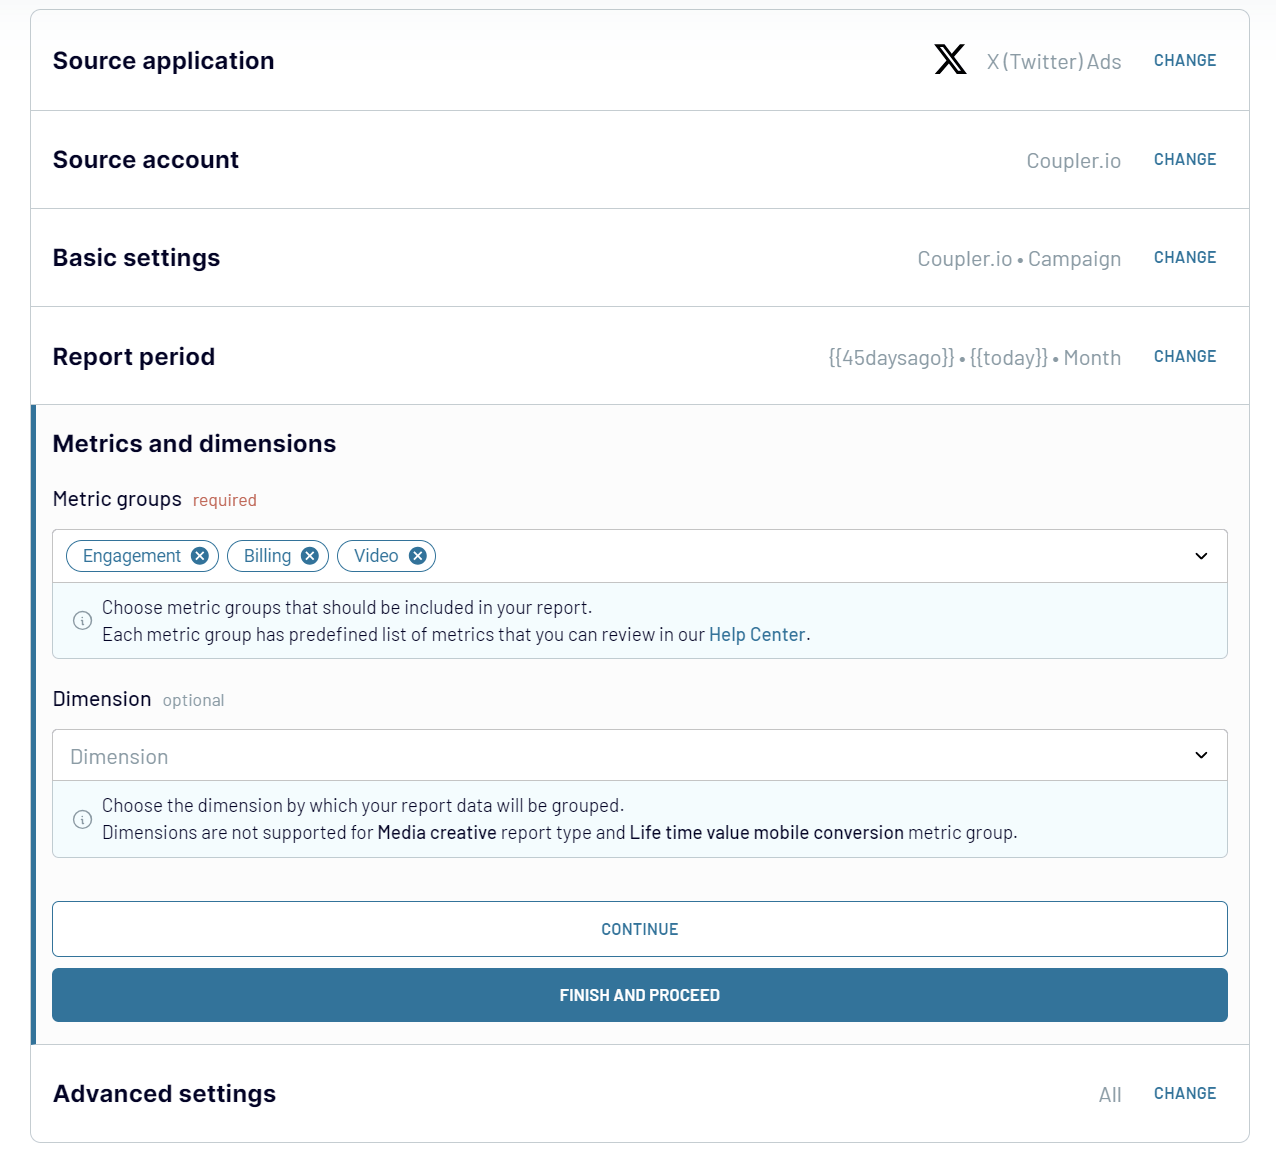
Step 1: Collect data
Connect your Twitter Ads account, then select the report type you wish to export. Specify your report's start and end dates and choose the interval to split the data: month, day, or hour. You also need to select the metric groups to include in your report, such as engagement, billing, video, and others. Optionally add a dimension to group your data.
Step 2: Organize & Transform Data
Once the source account connection is ready, Coupler.io will load data for preview. Now you can organize and refine your data before loading it into Power BI:
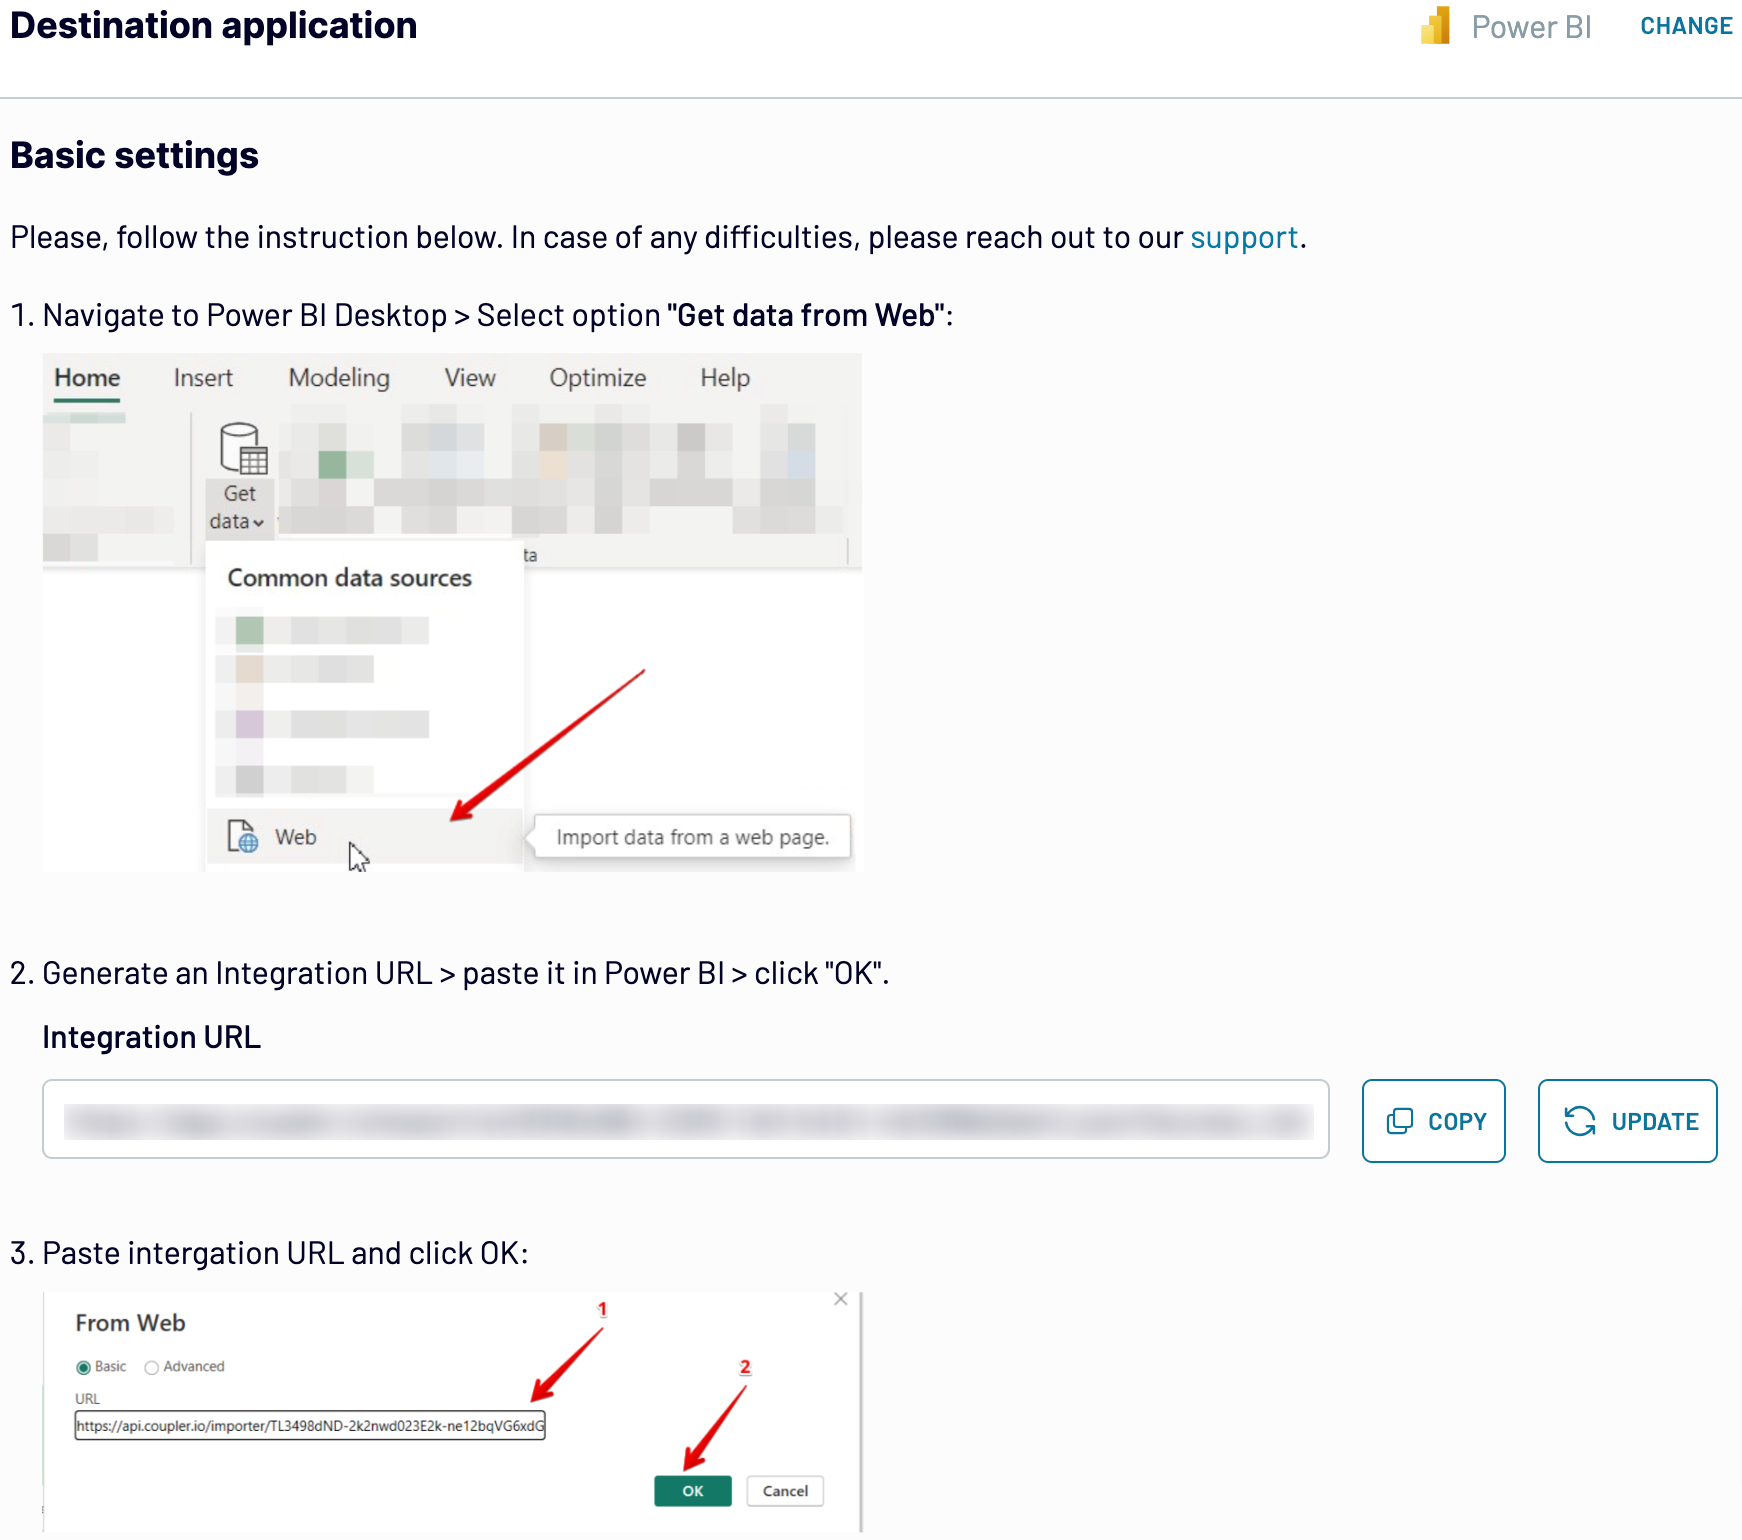
Step 3: Load data and automate refresh
Follow the in-app instructions to load your data from Twitter Ads to Power BI:
Once your data is loaded to Power BI dataset, you can schedule refresh. Toggle on the automatic data refresh feature and configure the desired schedule.
You can choose the refresh interval, days of the week, time preference, and time zone. The refresh interval or frequency can be set from every month to every 15 minutes. The latter lets you make your dynamic reports almost real-time.
With the automatic data refresh enables, Coupler.io will update your report without your involvement required.
Step 1: Collect data
Connect your Twitter Ads account, then select the report type you wish to export. Specify your report's start and end dates and choose the interval to split the data: month, day, or hour. You also need to select the metric groups to include in your report, such as engagement, billing, video, and others. Optionally add a dimension to group your data.
Step 2: Organize & Transform Data
Once the source account connection is ready, Coupler.io will load data for preview. Now you can organize and refine your data before loading it into Power BI:
- Apply filters for more relevant data sets
- Sort and organize information efficiently
- Customize and rearrange column names
- Create custom columns using formulas
Step 3: Load data and automate refresh
Follow the in-app instructions to load your data from Twitter Ads to Power BI:
- Generate the integration URL and copy it.
- Paste the URL into the Power BI desktop app.
- Load Twitter Ads data to Power BI and start creating a report or visualization.
Once your data is loaded to Power BI dataset, you can schedule refresh. Toggle on the automatic data refresh feature and configure the desired schedule.
You can choose the refresh interval, days of the week, time preference, and time zone. The refresh interval or frequency can be set from every month to every 15 minutes. The latter lets you make your dynamic reports almost real-time.
With the automatic data refresh enables, Coupler.io will update your report without your involvement required.
Export data from X (Twitter) Ads to alternative destinations


Quick start with PPC dashboard templates

Google Analytics PPC dashboard


 +4
+4

Shopify marketing funnel dashboard


 +5
+5

Customer acquisition dashboard for Pipedrive
+3
No such template is available yet.
No worries. Our team will create a template that fits your needs, just tell us more
about your case. It doesn't cost you a penny 😉
Request a custom report
about your case. It doesn't cost you a penny 😉
Set up a Twitter Ads to Power BI integration with just a few clicks.
Connect similar PPC apps and get data in minutes


Load data from Twitter Ads to Power BI: what to export

Campaign
A campaign refers to a set of marketing activities designed to achieve a specific goal. This data category includes details about the campaign's objectives, budget, start and end dates, performance metrics, and target audience. Analyzing campaign data lets you understand your marketing efforts' effectiveness and reach.
Funding Instrument
Funding instrument data provides information on the financial resources allocated for your campaigns. It includes budget details, payment methods, and spending limits. This metric is crucial for tracking and managing the financial aspects of your marketing activities. With this insight, you can ensure your campaigns stay within budget and optimize return on investment.
Line Items
Line items represent individual components within a campaign, such as specific ads or promotional content. This data covers the allocation of resources, performance metrics, and scheduling details for each line item. With this insight, you can assess the effectiveness of different elements within a campaign.
Media Creative
Media creative data includes information on your ads' visual and textual content, such as images, videos, and copy. This category provides insights into your media assets' design, messaging, and engagement levels. With this data, you can refine your creative strategy to enhance audience engagement.
Promoted Account
Promoted account data tracks the performance of Twitter accounts that are advertised to gain more followers and engagement. This includes metrics such as follower growth, engagement rates, and audience demographics. Understanding promoted account data lets you evaluate the success of your promotional efforts. You can identify opportunities to increase account visibility.
Account
Account data encompasses comprehensive details about your Twitter Ads account. This includes account settings, billing information, and overall performance metrics. You get an overview of your account's health and activity. As a result, you can achieve better management and optimization of your advertising strategies.
Promoted Tweet
Promoted tweet data provides insights into the performance of tweets that are boosted to reach a larger audience. This includes metrics such as impressions, clicks, retweets, likes, and engagement rates. Analyzing promoted tweet data lets you determine the effectiveness of your content. With this insight, you can optimize future tweets for better reach and interaction.
How to connect Twitter Ads to Power BI
Step 1. Connect your Twitter Ads account and choose a data entity to export
Step 2. Organize and transform data before loading it to Power BI
Step 3. Generate and and copy the integration URL to the Power BI desktop app
Step 4. Schedule data refresh to automate data flow from Twitter Ads to Power BI
Pricing plans
- Monthly
- Annual (save 25%)
Your data is secured by industry standards
 Google Cloud
Certified
 SOC 2 Type II
Certified
 GDPR
GDPRCompliant
 HIPAA
HIPAACompliant
Don’t just take our word for it


