Export Google Analytics to Looker Studio
Visualize your GA4 website data through interactive dashboards by connecting Google Analytics to Looker Studio with Coupler.io. Experience dynamic reporting with drill-down filters, blended multi-source datasets, and scheduled data refreshes that keep your visualizations accurate without manual exports or native connector limitations.


What data you can export from Google Analytics
-
SessionsVisit records capturing arrival source, page depth, and time on site for each user interaction, forming the backbone of traffic volume trend charts and session-based comparison visualizations in your Looker Studio dashboards.
-
Active usersUnique visitor measurements across configurable time windows that power audience size gauges and growth trend lines, making it straightforward to visualize whether your reach is expanding or plateauing period over period.
-
ConversionsGoal completion records for purchases, sign-ups, form submissions, and other tracked actions that feed conversion funnel charts and goal achievement scorecards, allowing visual drill-downs by source, device, or landing page.
-
Engagement rateThe share of sessions involving meaningful interaction rather than immediate exits, providing a quality indicator for traffic segments that works well in comparative bar charts and channel performance heatmaps.
-
Average engagement timeDuration metrics reflecting how long users actively spend on your content per session, enabling time-on-site trend visualizations and content quality comparisons across different sections of your website.
-
Event countAggregated interaction tallies for clicks, downloads, video plays, scroll milestones, and custom actions that support detailed behavioral charts showing which site features drive the most user activity.
-
Traffic source, medium, and campaignMulti-level acquisition dimensions categorizing how visitors discovered your site, powering channel breakdown pie charts, source comparison tables, and campaign performance trend lines in Looker Studio.
-
Landing pageEntry point data showing which pages users see first when arriving at your site, supporting landing page performance tables with sortable metrics and visual comparisons of bounce rates, engagement, and conversion contribution.
-
Country and regionGeographic audience data for mapping visitor distribution across locations, enabling Looker Studio's geo-chart visualizations that highlight your strongest markets and reveal underserved regions worth targeting.
-
User age bracket and genderDemographic dimension data segmenting your audience by age group and gender for building audience profile visualizations, persona-based reporting, and demographic comparison dashboards within Looker Studio.
All-in-one tool for Google Analytics data exports and analytics
Feed GA4 traffic metrics into Looker Studio alongside data from advertising platforms, Search Console, CRM systems, and over 400 other sources through Coupler.io. Build cross-channel marketing dashboards that tell the full story of how visitors find and interact with your site.

Structure GA4 dimensions and metrics for optimal dashboard performance before they reach Looker Studio. Filter noise, aggregate granular records, and format columns so your charts and tables render quickly and display meaningful labels from the start.

Schedule GA4 data updates to Looker Studio at 15-minute, 30-minute, hourly, daily, or monthly intervals through Coupler.io. Your dashboards reflect recent site activity without anyone needing to trigger a manual refresh or worry about stale numbers during stakeholder reviews.

Pair your visual dashboards with Coupler.io AI integrations for conversational data exploration. When a chart raises a question that requires deeper analysis, ask AI tools directly instead of building additional report pages or custom calculations.

Why export Google Analytics to Looker Studio - real life cases
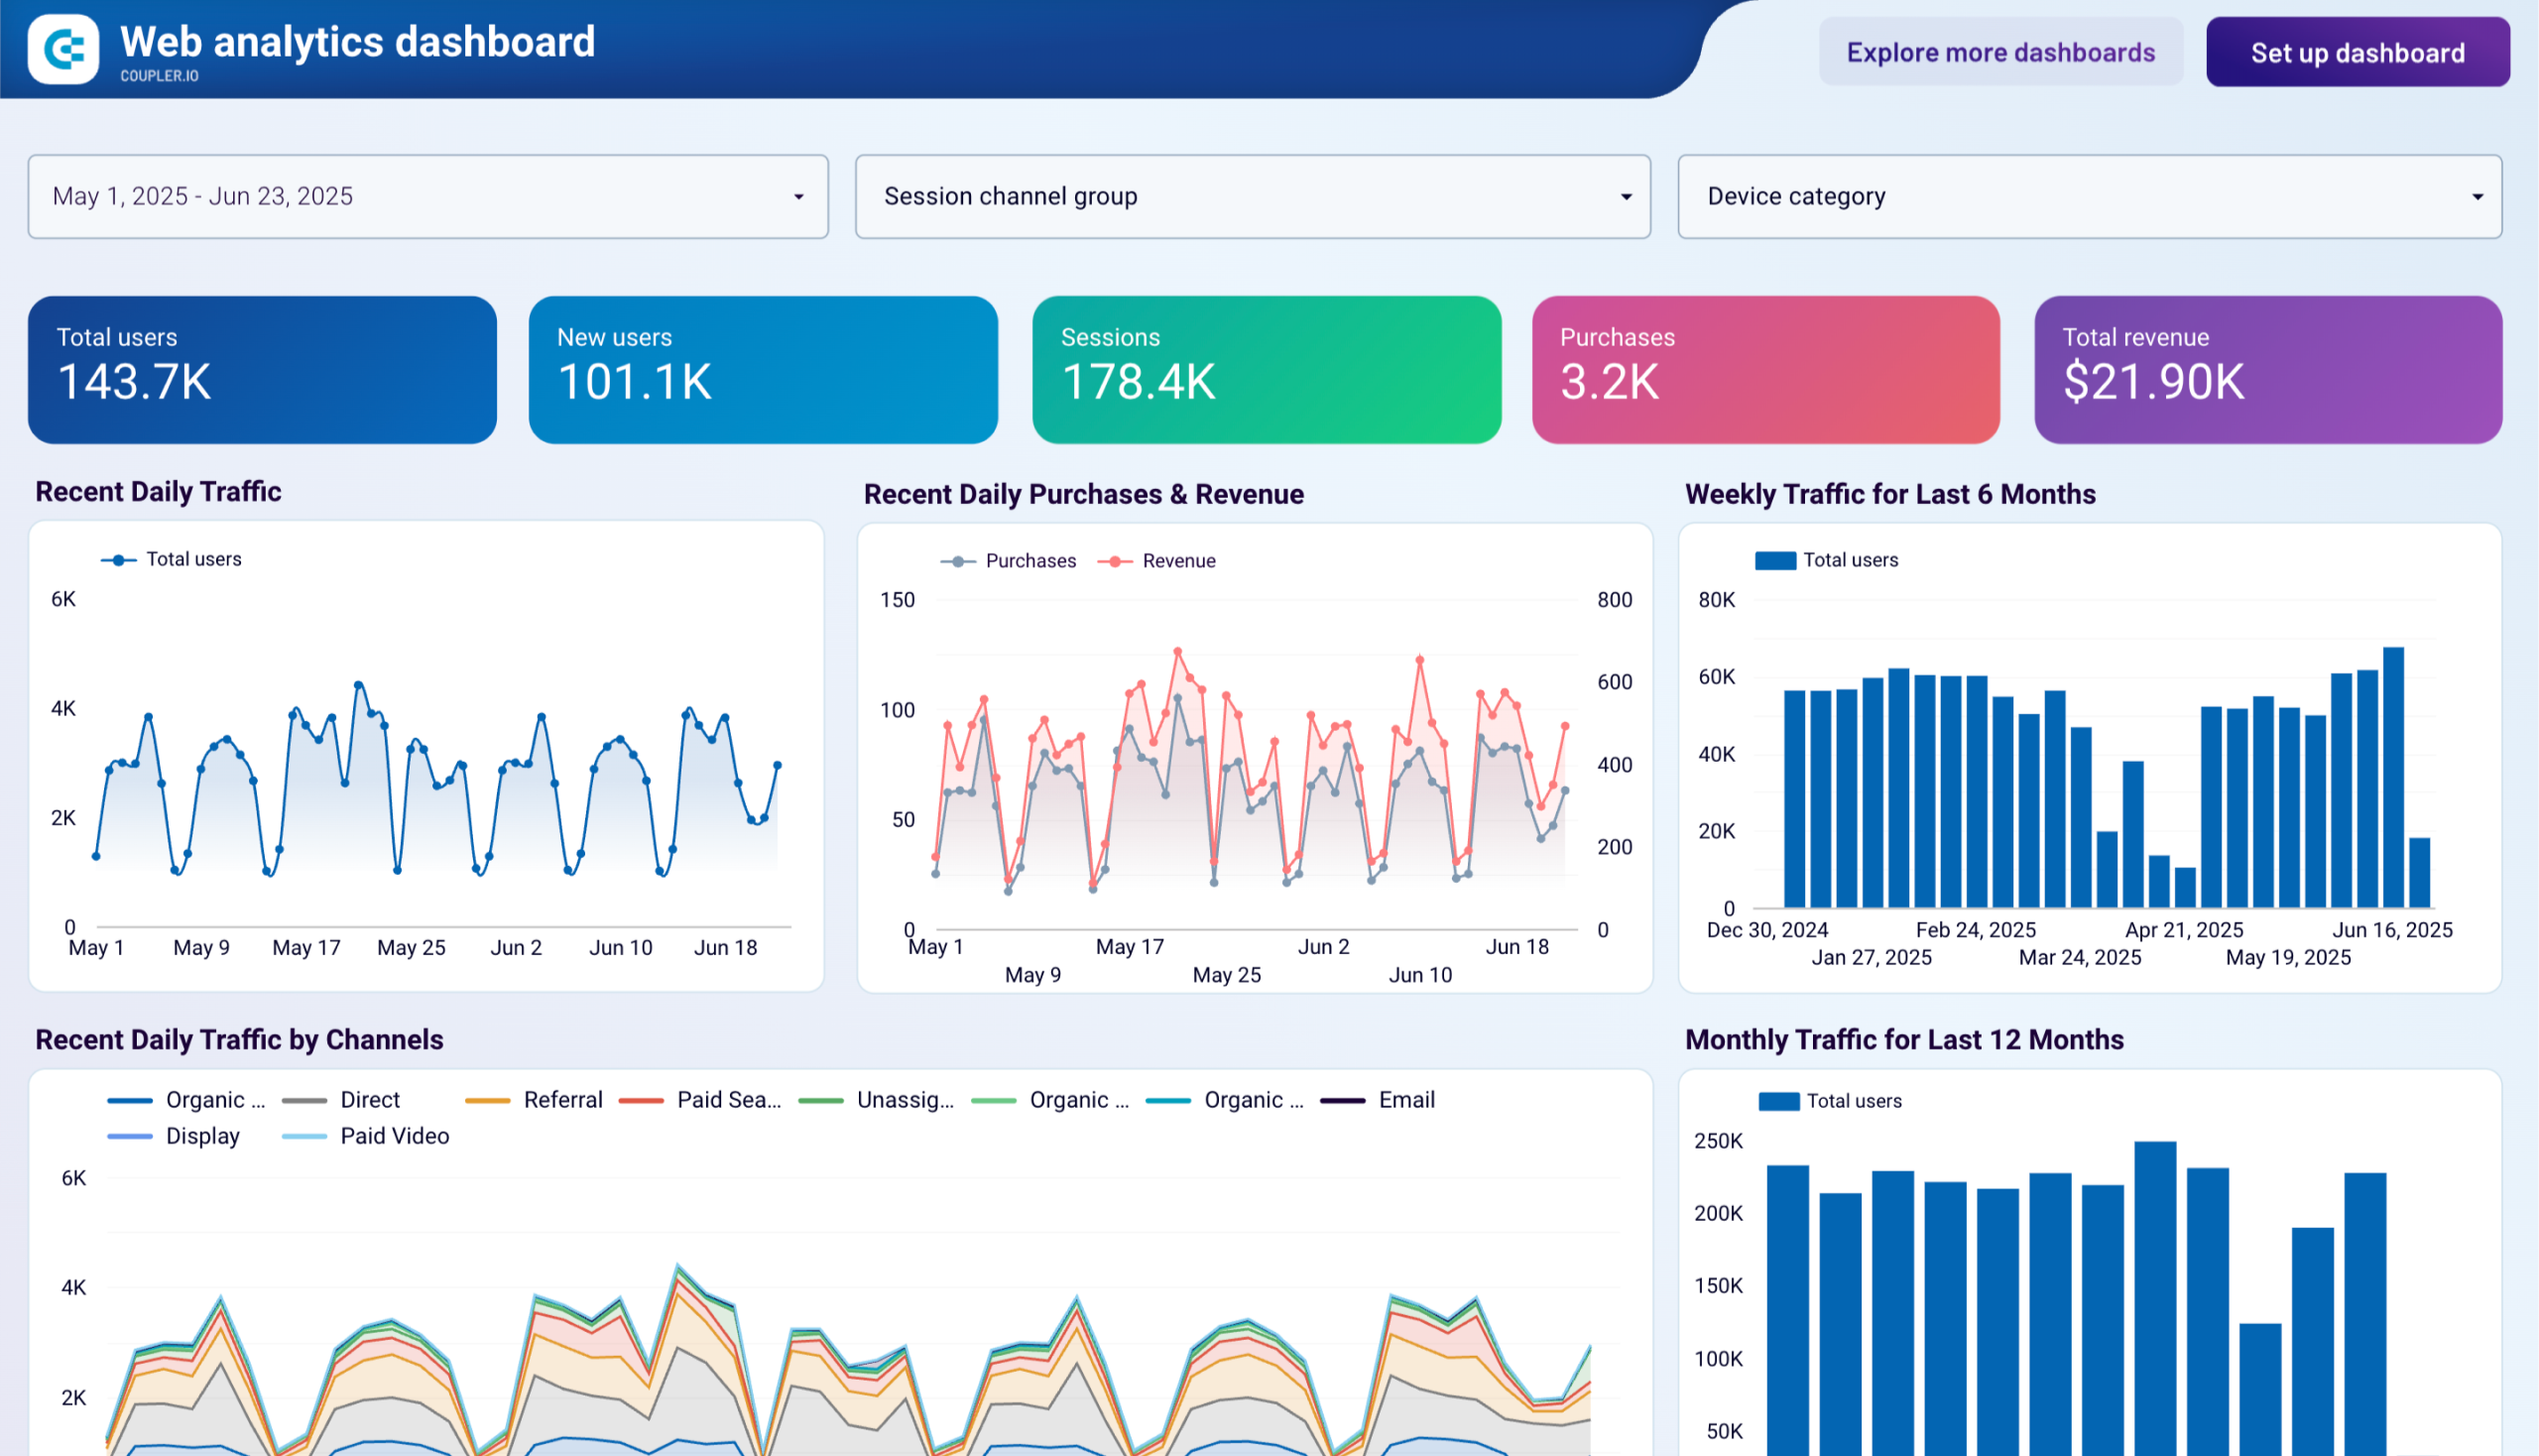
Multi-property web analytics dashboards
Acquisition channel visualization and comparison
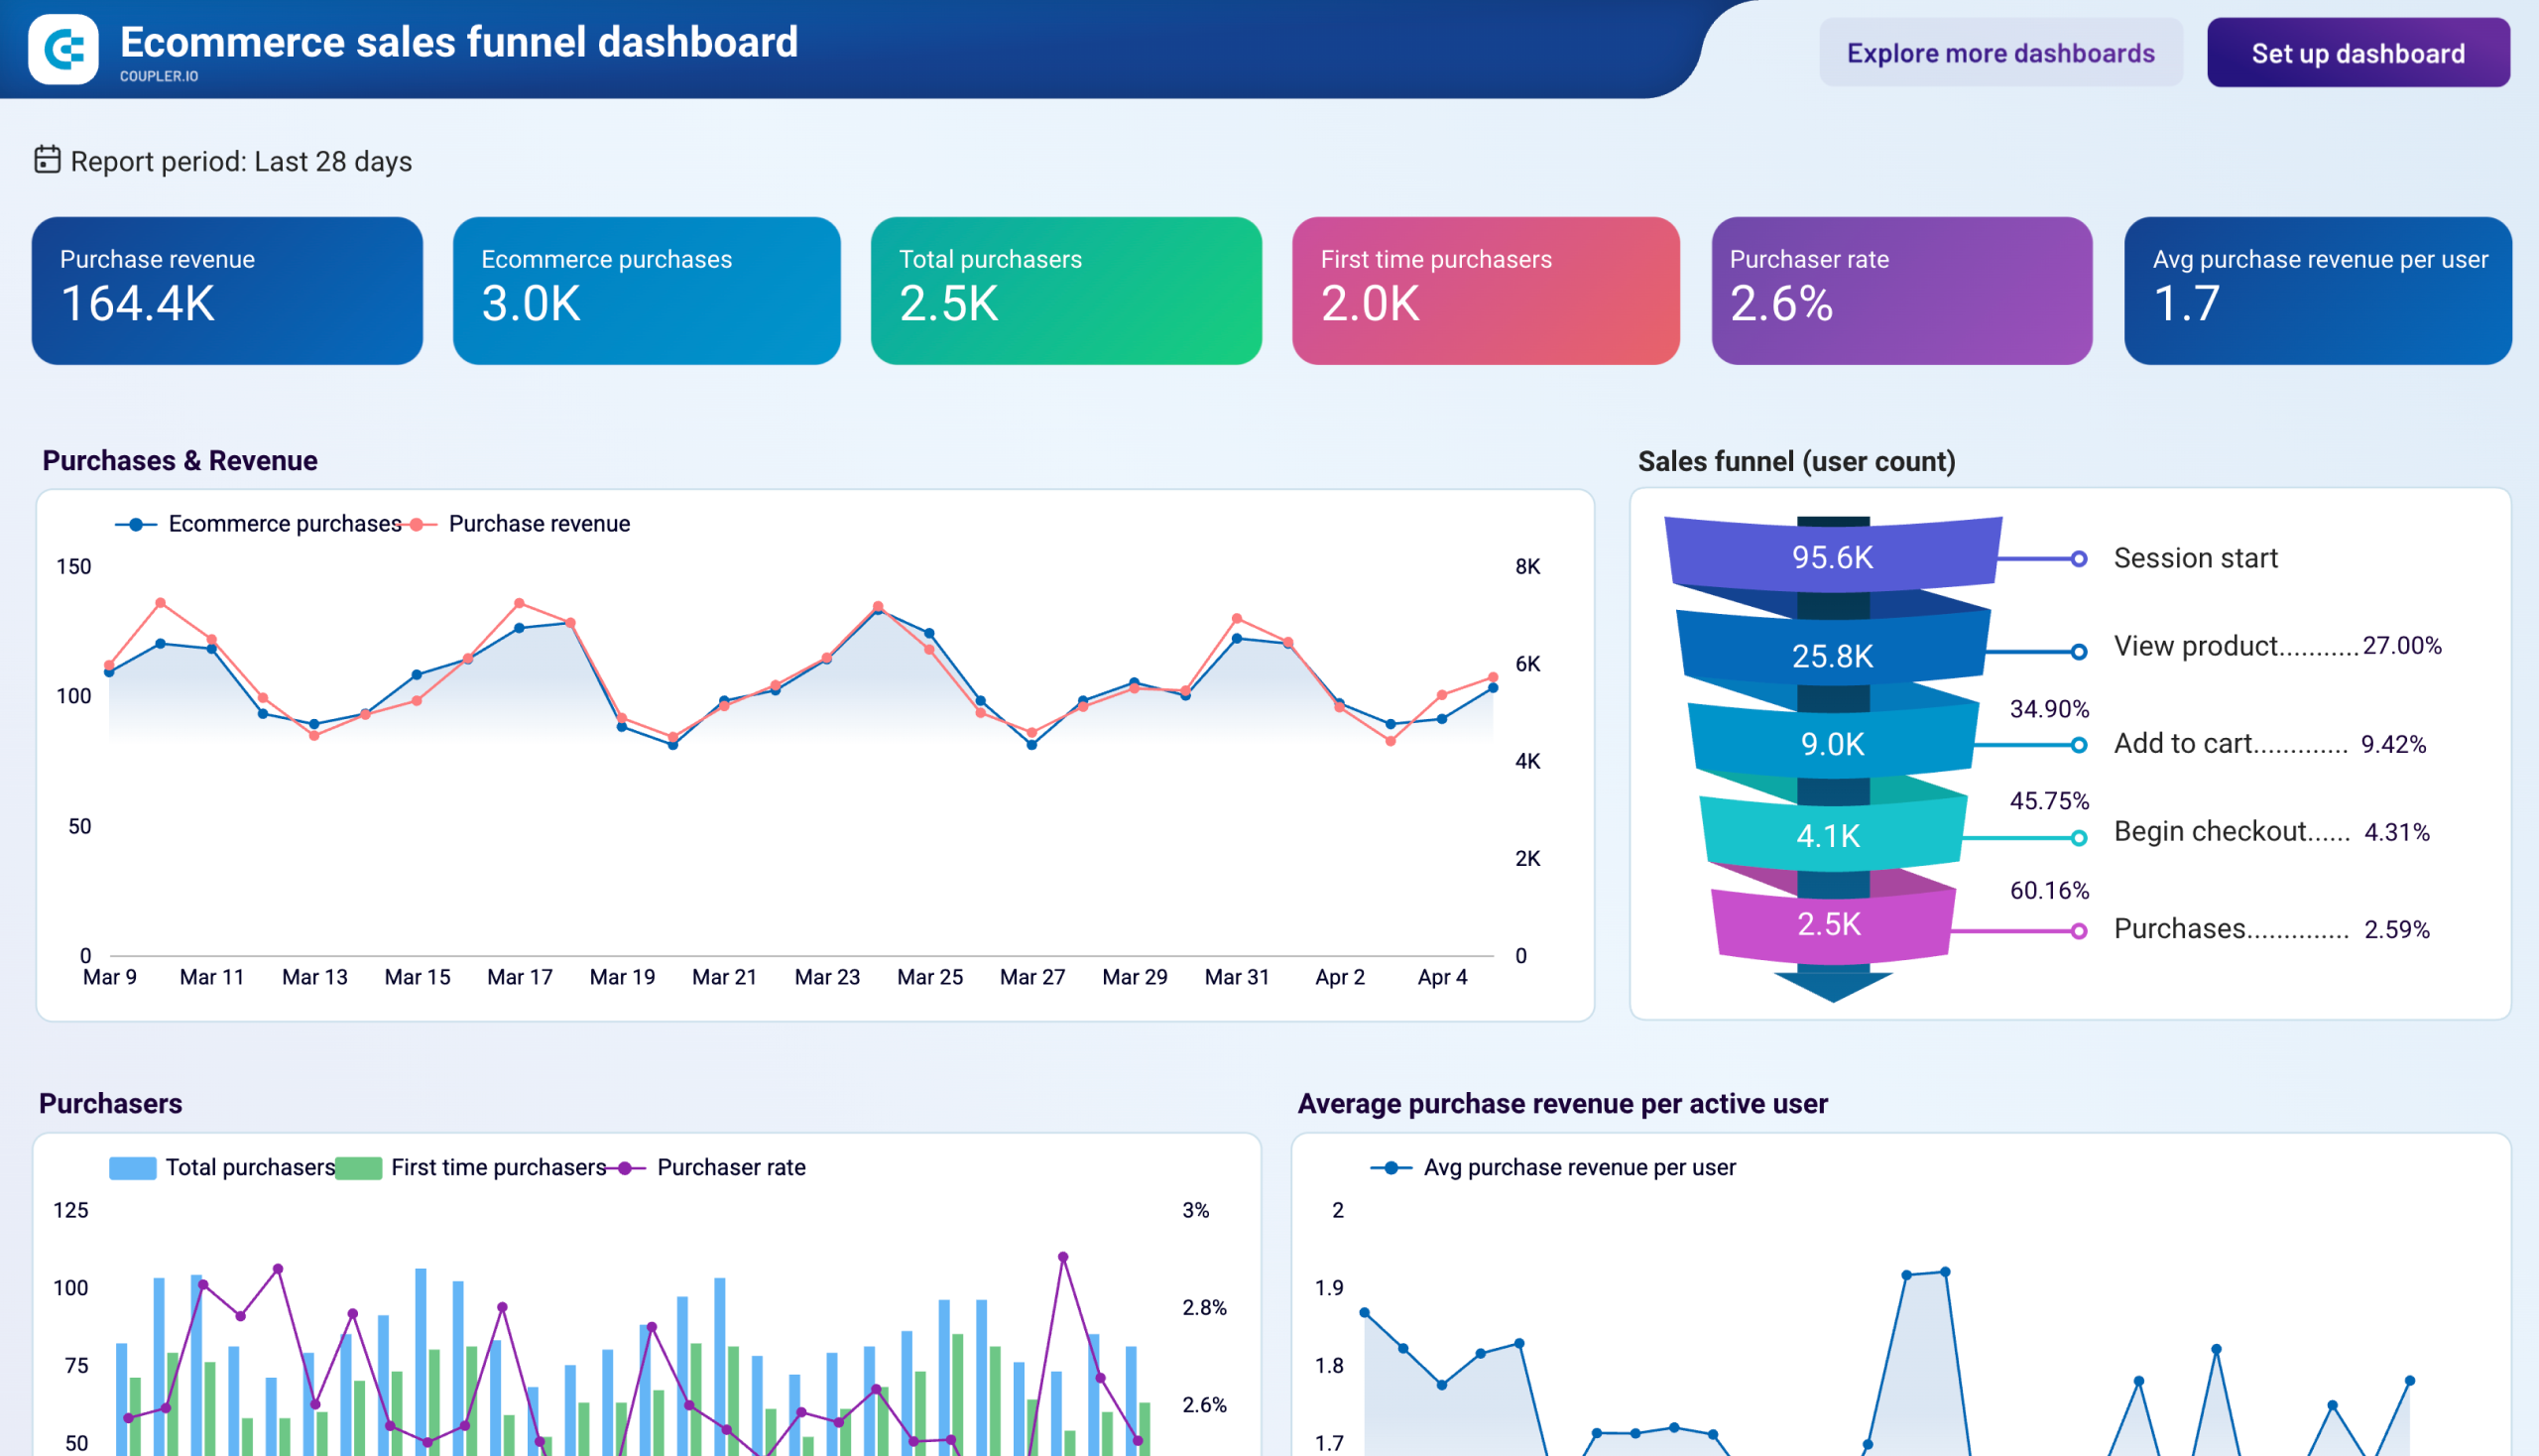
User journey and funnel visualization
Branded client reporting for marketing agencies
How to export Google Analytics to Looker Studio
Automate data exports with the no-code Google Analytics Looker Studio integration
Connect similar PPC apps and get data in minutes


Quick start with PPC dashboard templates


about your case. It doesn't cost you a penny 😉
Talk to AI about your Google Analytics 4 data
Examples of questions you can ask about Google Analytics data:
"What traffic sources are growing fastest this quarter and which ones are losing momentum?"
"Break down our conversion funnel by device type and highlight where mobile users drop off compared to desktop"
"Which landing pages should I prioritize for redesign based on high traffic but poor engagement?"
"Explain the relationship between our organic traffic trends and seasonal patterns over the past year"


Your data is secured by industry standards
 Google Cloud
Certified
 SOC 2 Type II
Certified
 GDPR
GDPRCompliant
 HIPAA
HIPAACompliant


