Export Taboola to Data Studio (formerly Looker Studio)
Build compelling visual narratives from native advertising data with the Taboola to Data Studio integration by Coupler.io. Transform campaign metrics into interactive dashboards that communicate content promotion performance through engaging, stakeholder-ready visualizations.


What data you can export from Taboola
-
AccountsAccount structure data optimized for Data Studio hierarchical visualization, enabling interactive drill-down from organizational overview to individual advertiser performance across native advertising initiatives.
-
CampaignsCampaign configuration metrics formatted for visual trend analysis, supporting interactive charts showing budget utilization, bidding strategy effectiveness, and performance comparison across content promotion efforts.
-
Campaign itemsCreative asset data structured for visual performance comparison, enabling interactive dashboards showing headline effectiveness, image engagement, and content resonance across audience demographics.
-
Audience rulesTargeting criteria information optimized for visualization, supporting interactive charts comparing demographic targeting effectiveness and behavioral segmentation performance across native advertising campaigns.
-
Conversion rulesAction tracking data formatted for ROI visualization, enabling interactive dashboards showing conversion funnel performance, attribution patterns, and value generation across different campaign types.
-
Motion adsVideo creative metrics structured for engagement visualization, supporting interactive reports showing completion rates, viewer behavior patterns, and motion content effectiveness across audience segments.
-
AudiencesSegment performance data optimized for comparative visualization, enabling interactive dashboards showing audience effectiveness, overlap analysis, and engagement patterns across predefined targeting groups.
All-in-one tool for Taboola data exports and analytics
Import Taboola campaign data and combine with web traffic analytics, conversion tracking, and cross-platform advertising metrics to create holistic datasets that power visual storytelling in Data Studio dashboards.

Prepare Taboola metrics with properly structured dimensions and measures optimized for Data Studio visualization, enabling interactive filtering, dynamic charts, and drill-down functionality for native advertising exploration.

Keep Data Studio dashboards reflecting latest campaign performance through automated data updates from monthly to 15-minute frequencies. Ensure stakeholders view the most recent native advertising metrics through visual reports.

Enhance visual insights with Coupler.io AI integrations. Connect your Taboola datasets to AI tools for conversational exploration that complements your Data Studio dashboards.

Why export Taboola to Data Studio - real life cases

Executive native advertising dashboards

Content promotion ROI visualization

Creative performance comparison

Multi-campaign performance monitoring
How to export Taboola to Data Studio
 30 seconds
30 seconds
10 seconds
30 seconds
30 seconds
30 seconds
10 seconds
Automate data exports with the no-code Taboola to Data Studio integration
Connect similar PPC apps and get data in minutes


Quick start with dashboard templates
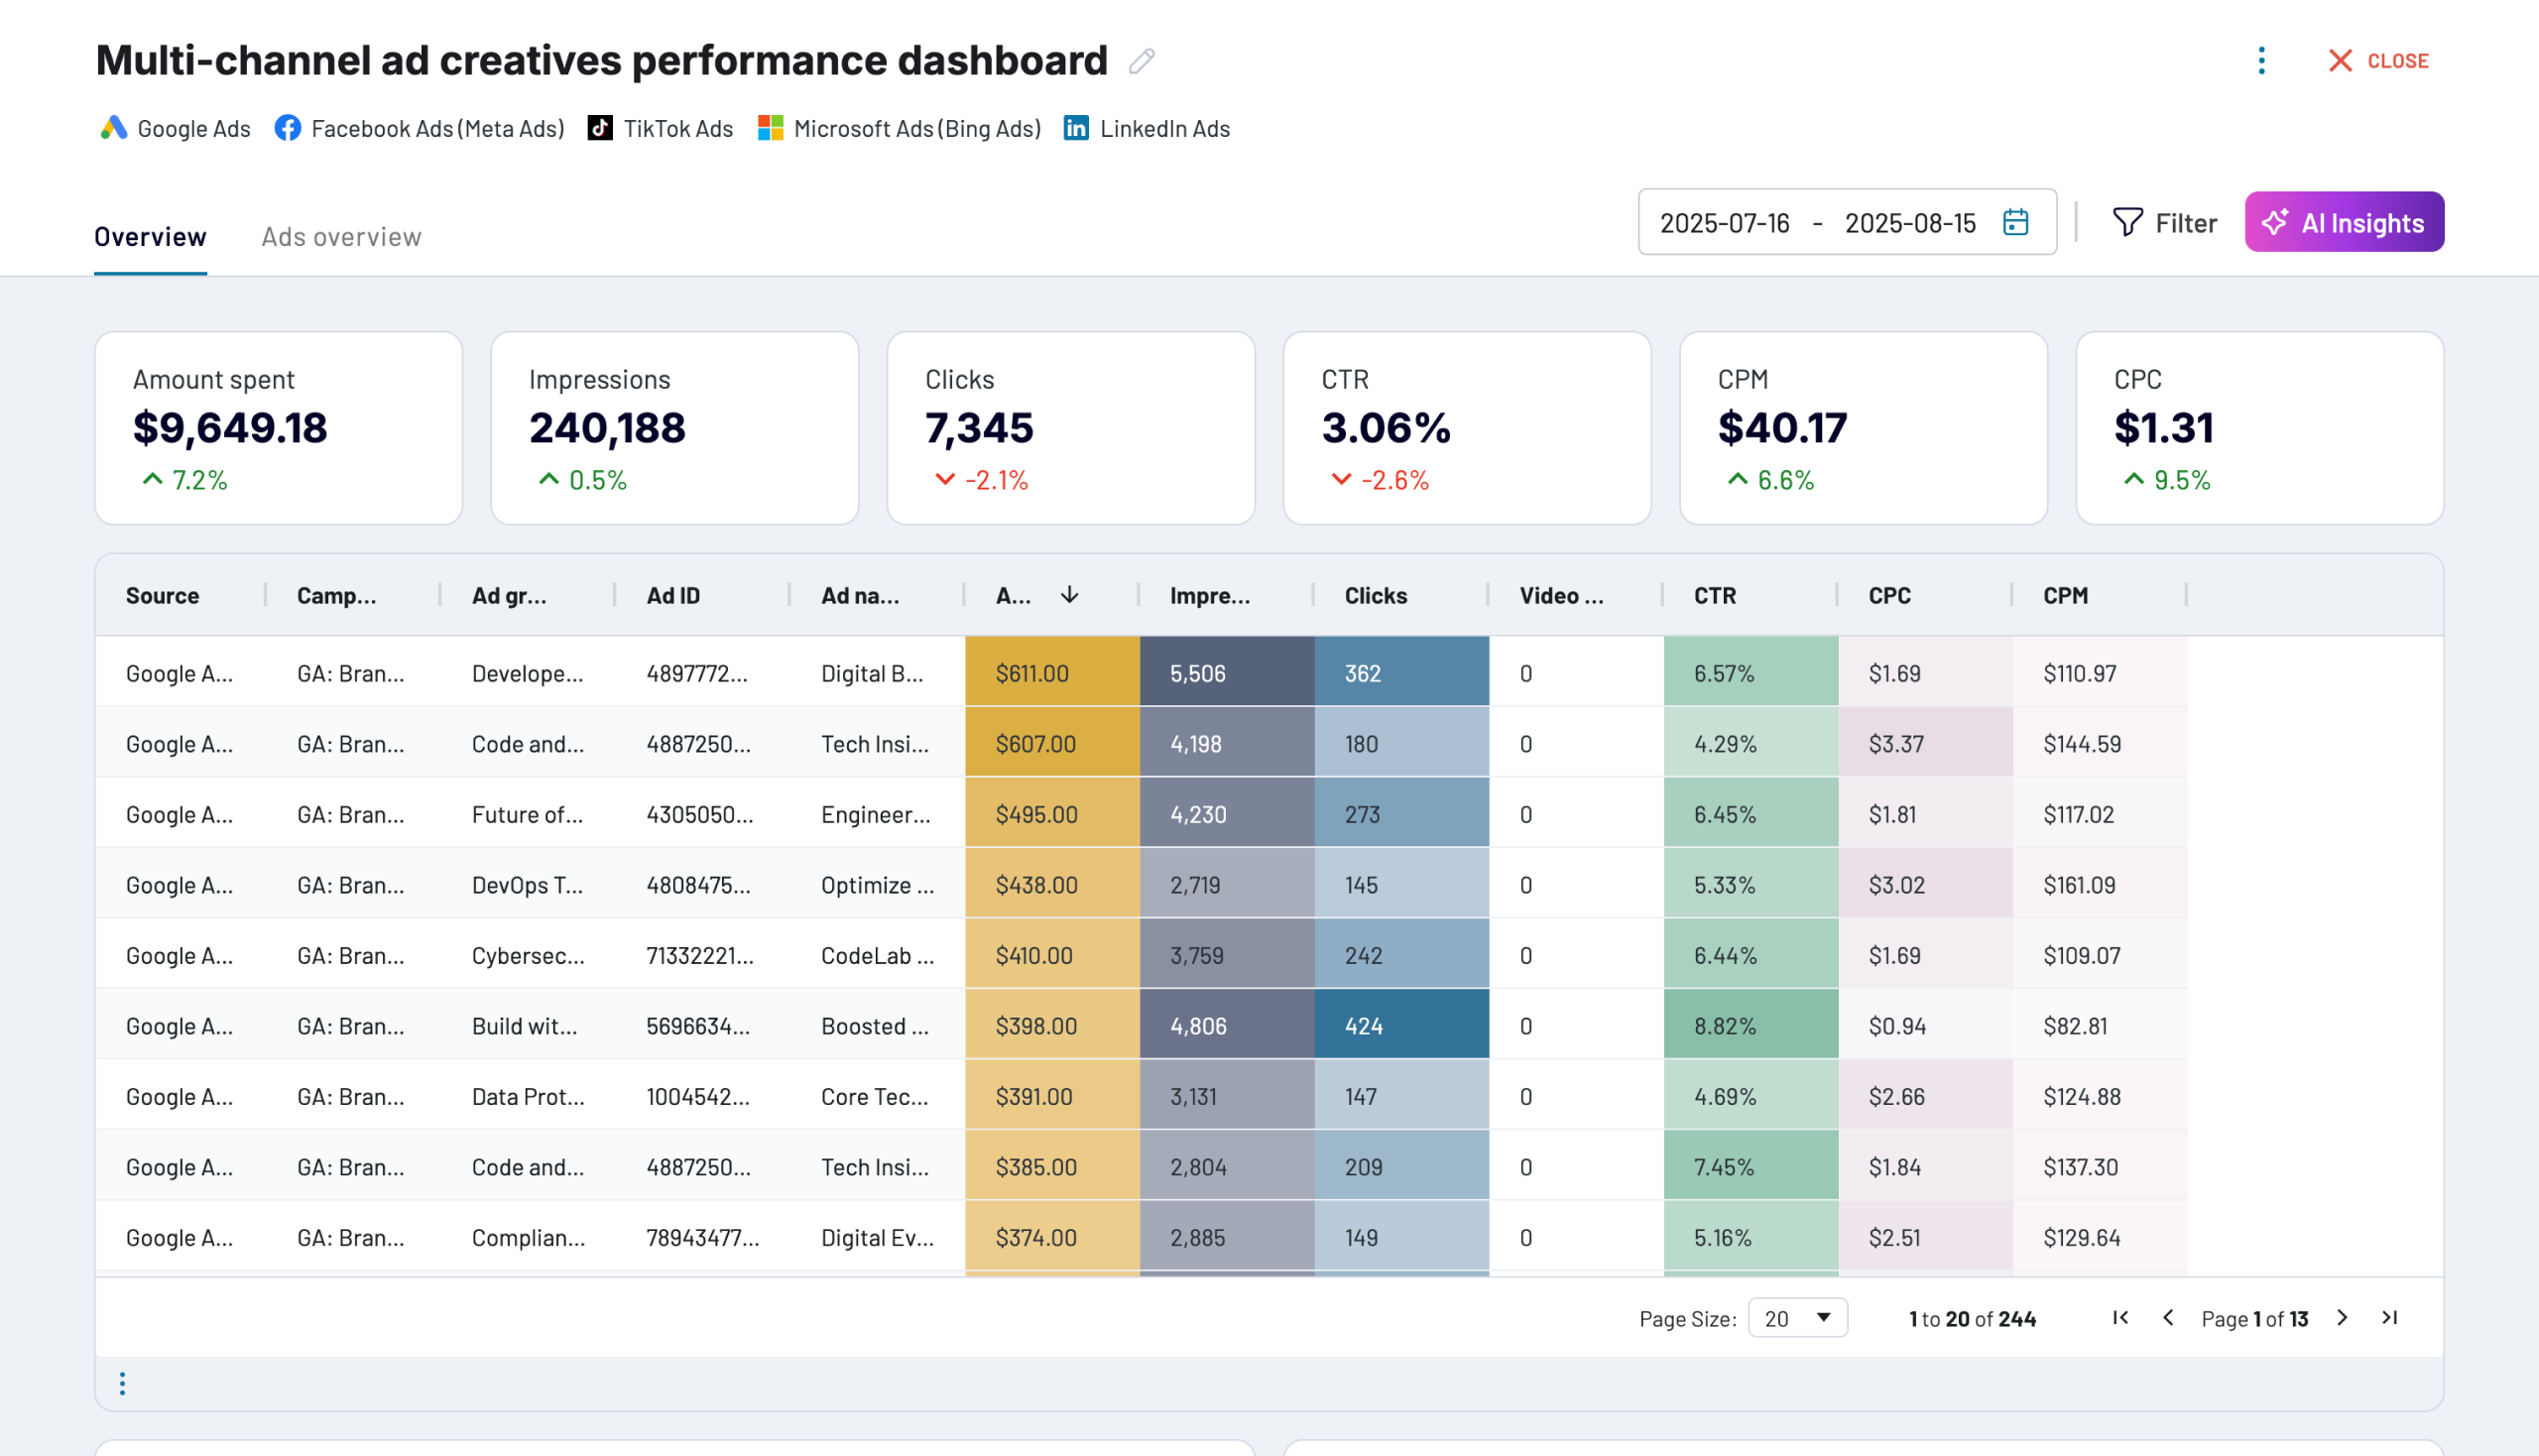


 +0
+0


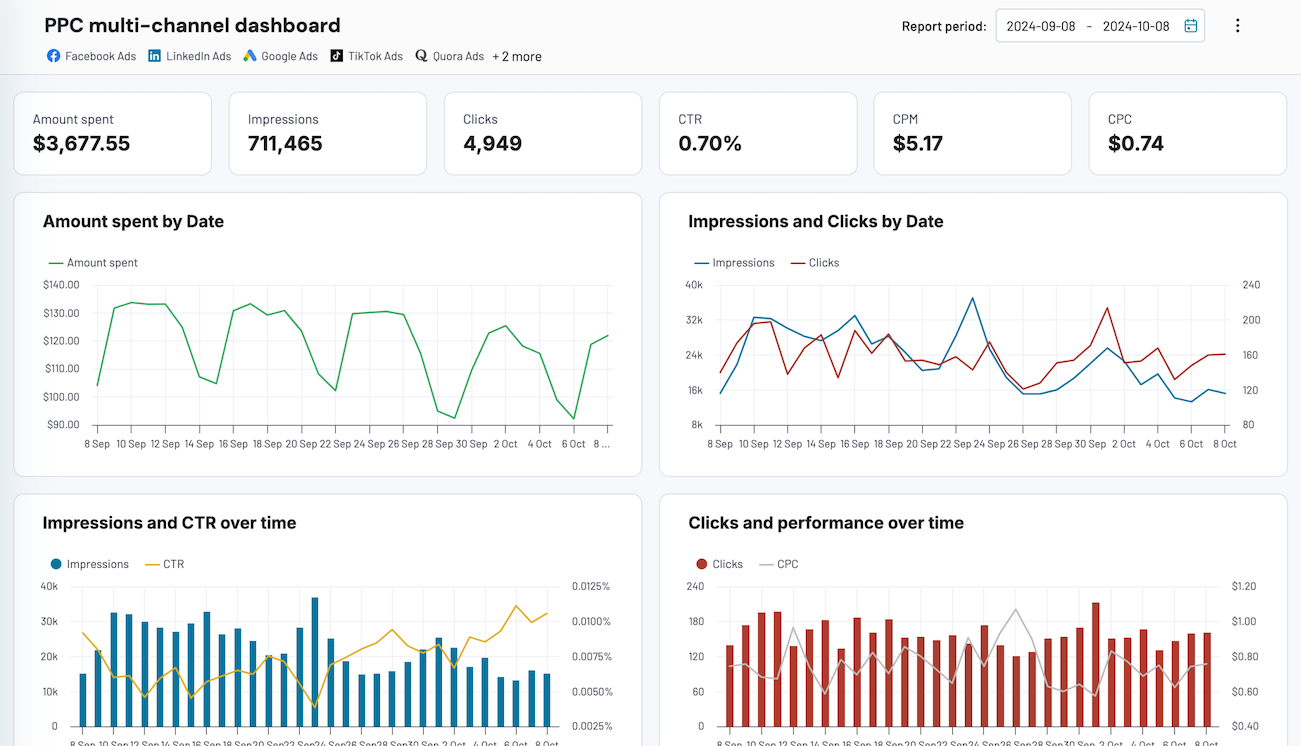


 +4
+4
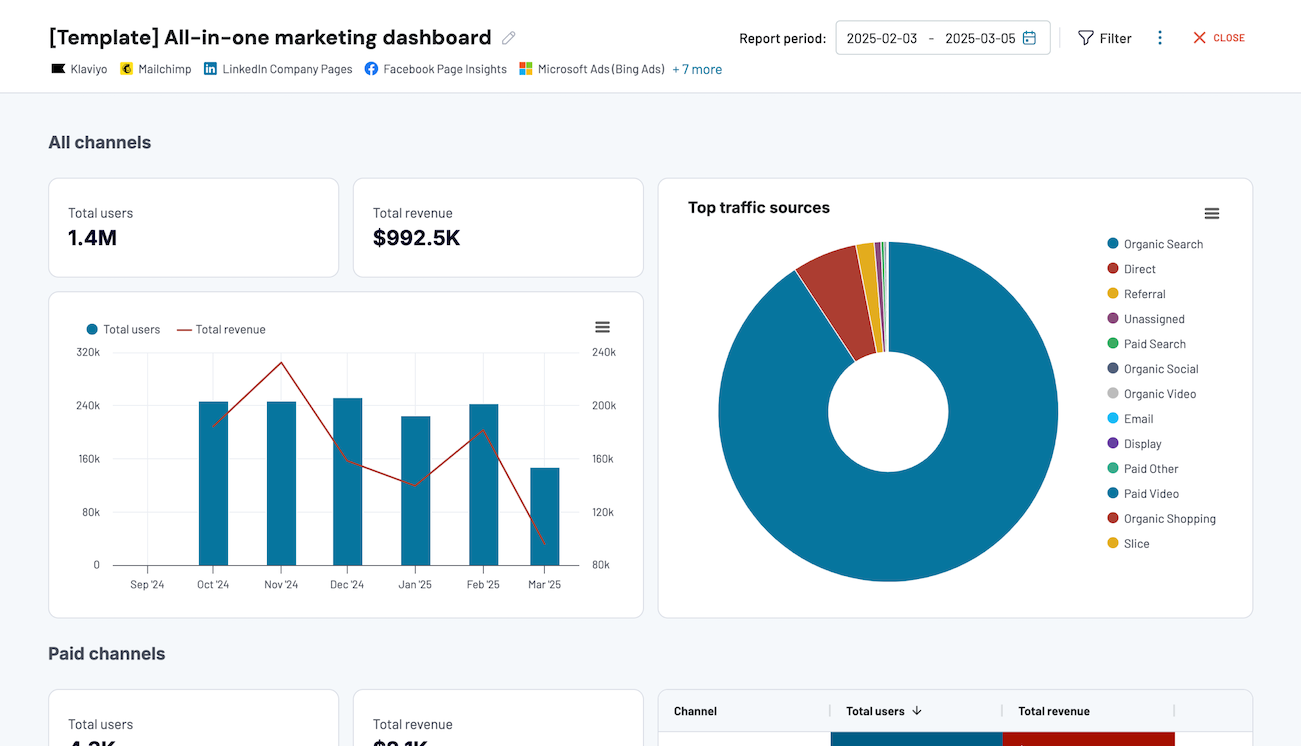


 +7
+7
about your case. It doesn't cost you a penny 😉
Talk to AI about your Taboola data
Examples of questions you can ask about Taboola data:
"Explain the factors behind the engagement rate trends shown in my dashboard"
"What visualization approach would best communicate our audience targeting effectiveness?"
"Identify campaigns where spending patterns deviate from historical norms"
"Recommend dashboard metrics that would help stakeholders understand content promotion ROI"





Your data is secured by industry standards
 SOC 2 Type II
Certified
 Google Cloud
Certified
 GDPR
GDPRCompliant
 HIPAA
HIPAACompliant
Export data from Taboola to alternative destinations