Connect StackAdapt to Data Studio (formerly Looker Studio)
Import StackAdapt to Data Studio with Coupler.io for client dashboards where the programmatic channel sits beside Meta, Google, LinkedIn, and TikTok. See campaign, campaign group, and GEO performance on tiles that refresh overnight, with eCPA and CPM charted beside every other channel.


All-in-one tool for StackAdapt data exports and analytics
Compile StackAdapt advertiser, campaign group, campaign, ad, and GEO reports as Data Studio data sources alongside Meta, Google Ads, LinkedIn, and TikTok. One dashboard reads from one blended set, not five disconnected feeds.

Prepare StackAdapt rows at ad level or campaign group level, apply filters, and align columns before they reach Data Studio. Blended charts work on the first build, with no field remapping between StackAdapt and the other paid media sources.

Schedule Coupler.io to refresh StackAdapt data on monthly, daily, hourly, 30-minute, or 15-minute intervals. Data Studio tiles pull from the refreshed data source, so clients open the dashboard and see today's numbers rather than last week's snapshot.

Hand a Data Studio data source to Claude, ChatGPT, Copilot, Cursor, Gemini CLI, or Perplexity through Coupler AI. Marketing leads ask about dashboard tiles in plain language and get the Analytical Engine's number, not an interpretation of the chart.

Why connect StackAdapt to Data Studio - real life cases

Build the client dashboard page where programmatic sits beside Meta, Google, and LinkedIn

Visualize eCPA, CPM, and conversions by campaign group over time

Map GEO performance by DMA, ZIP code, and congressional district

Give clients view-only dashboard access with blended StackAdapt and social tiles
How to connect StackAdapt to Data Studio
 30 seconds
30 seconds
10 seconds
Automate your no-code StackAdapt Data Studio integration
Connect similar PPC apps and get data in minutes


Quick start with dashboard templates
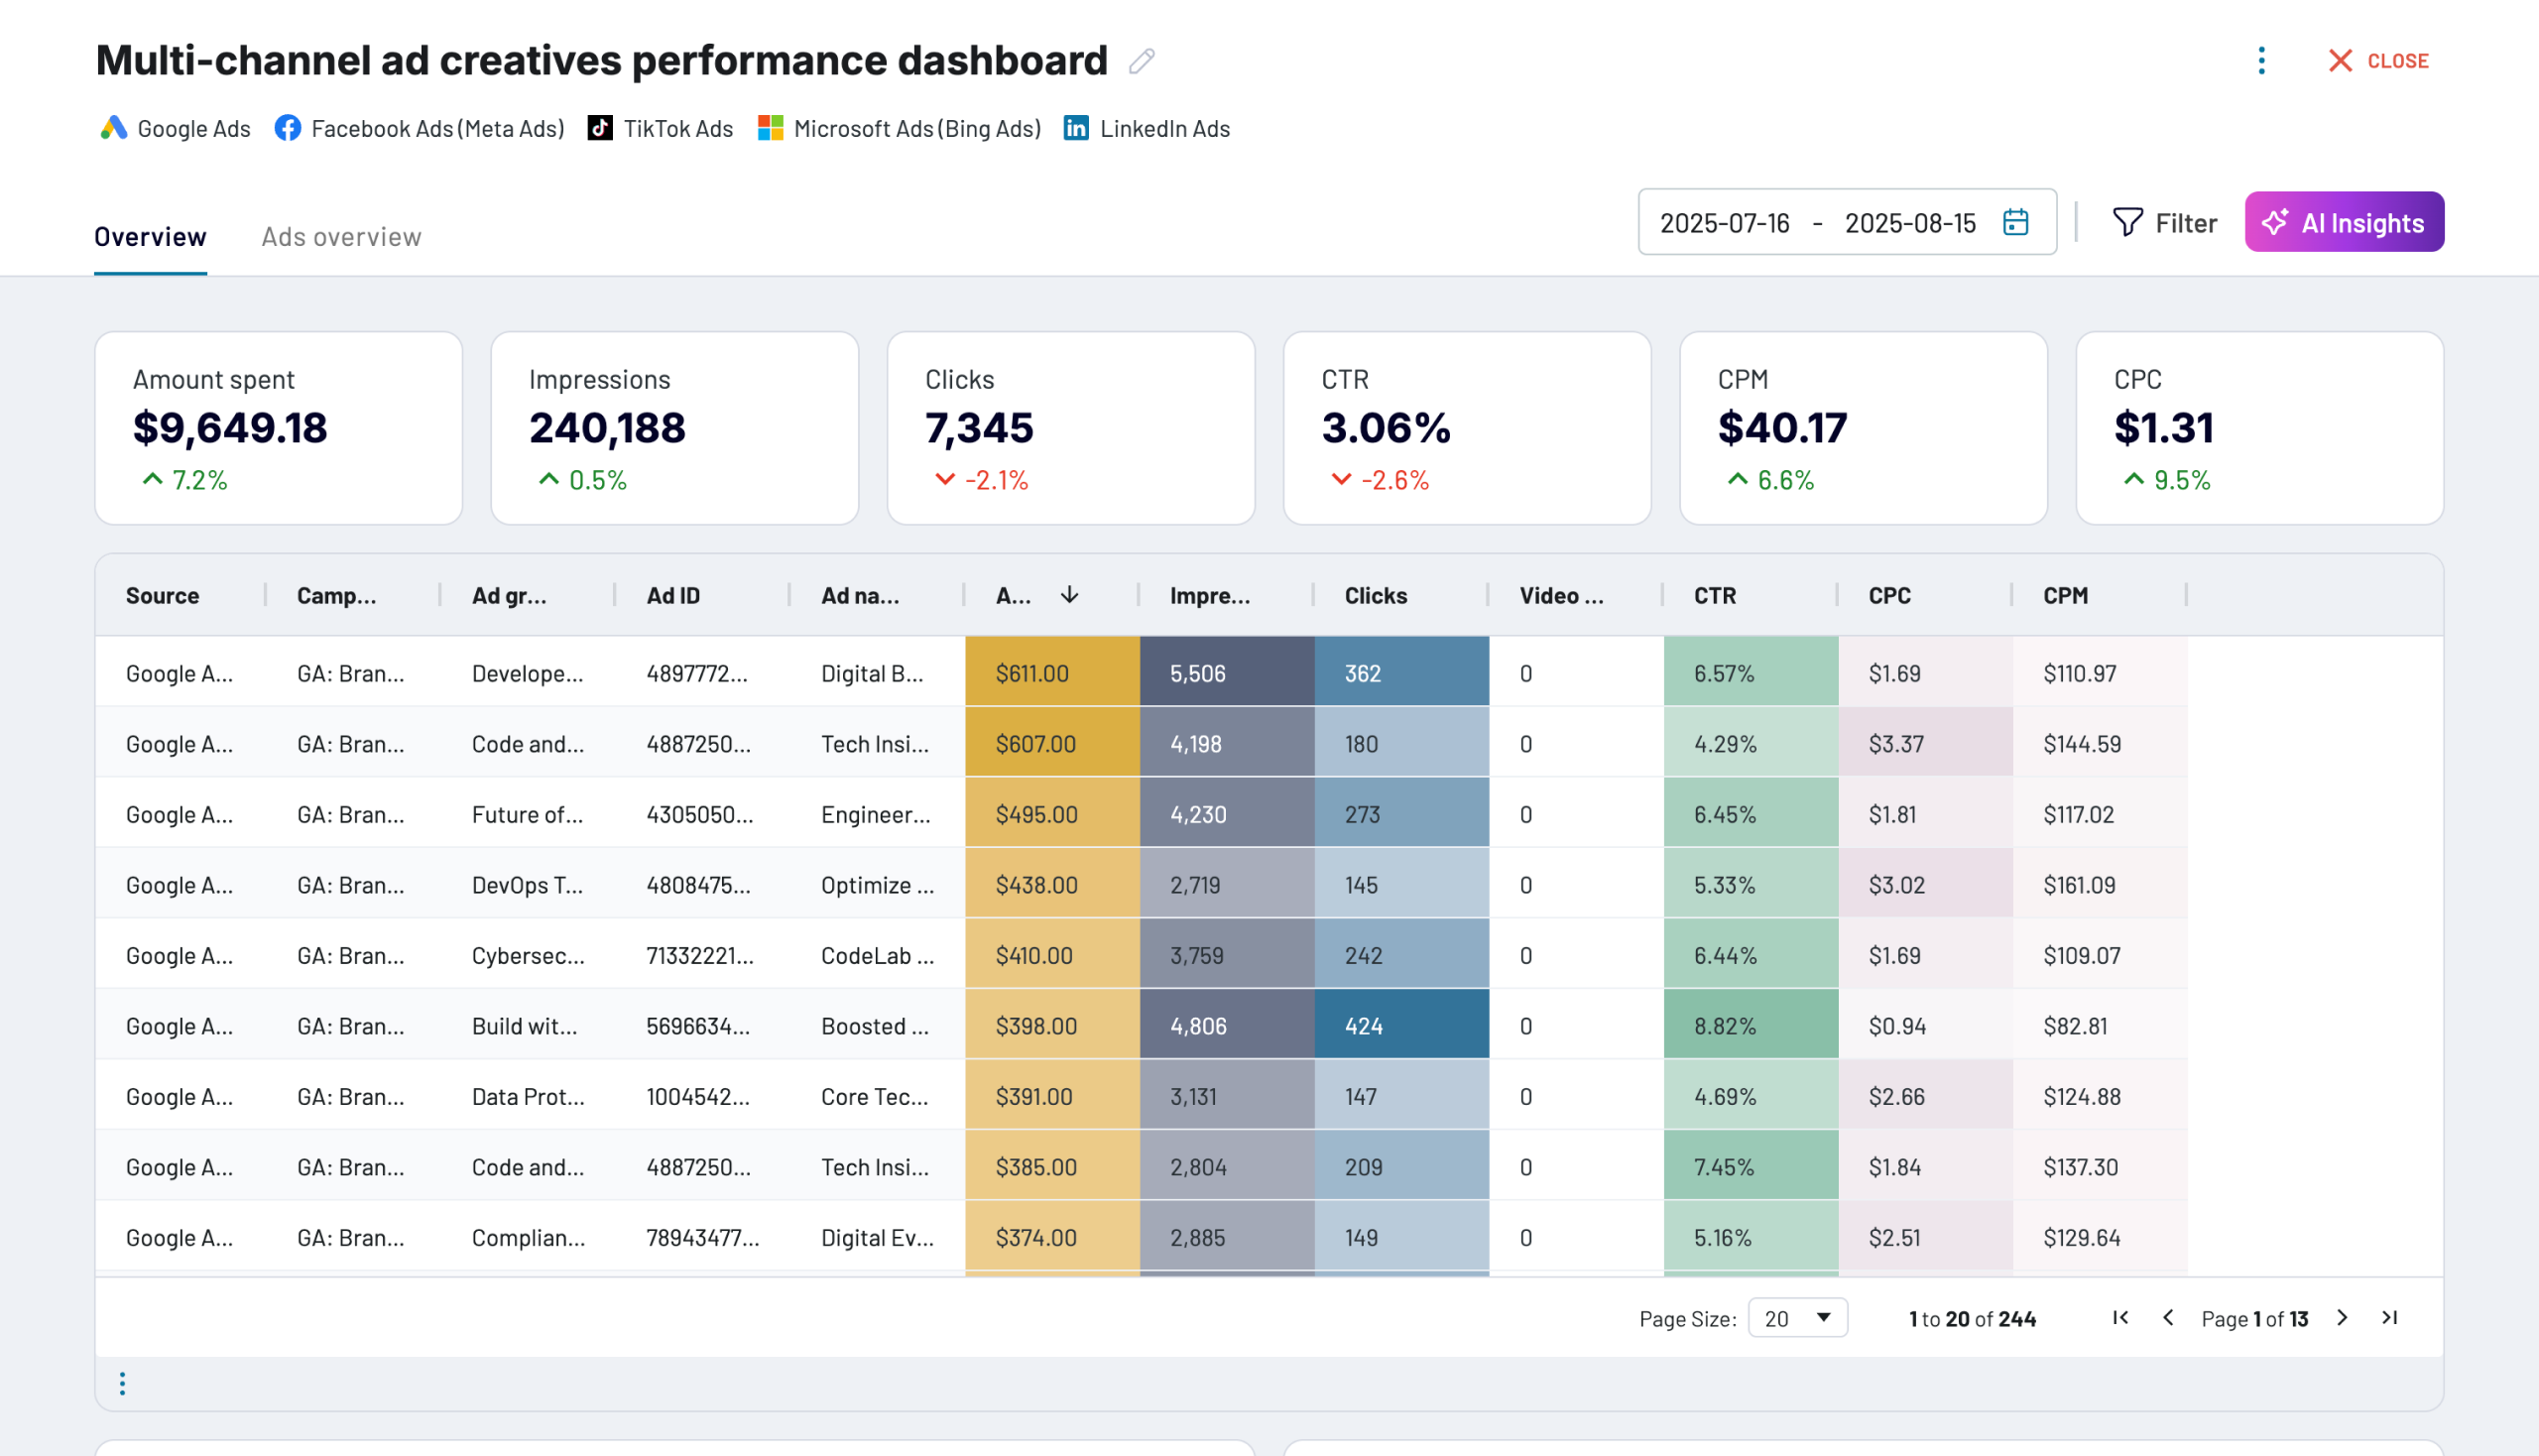


 +0


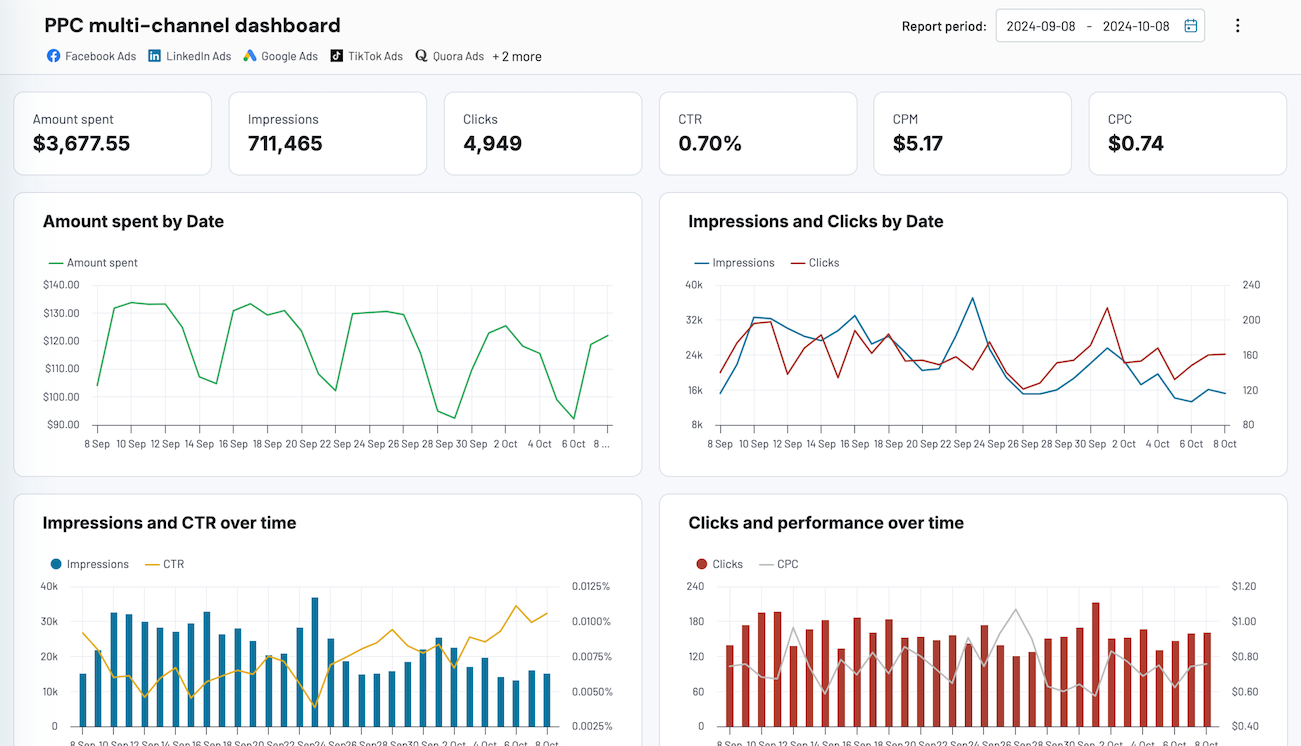


 +4
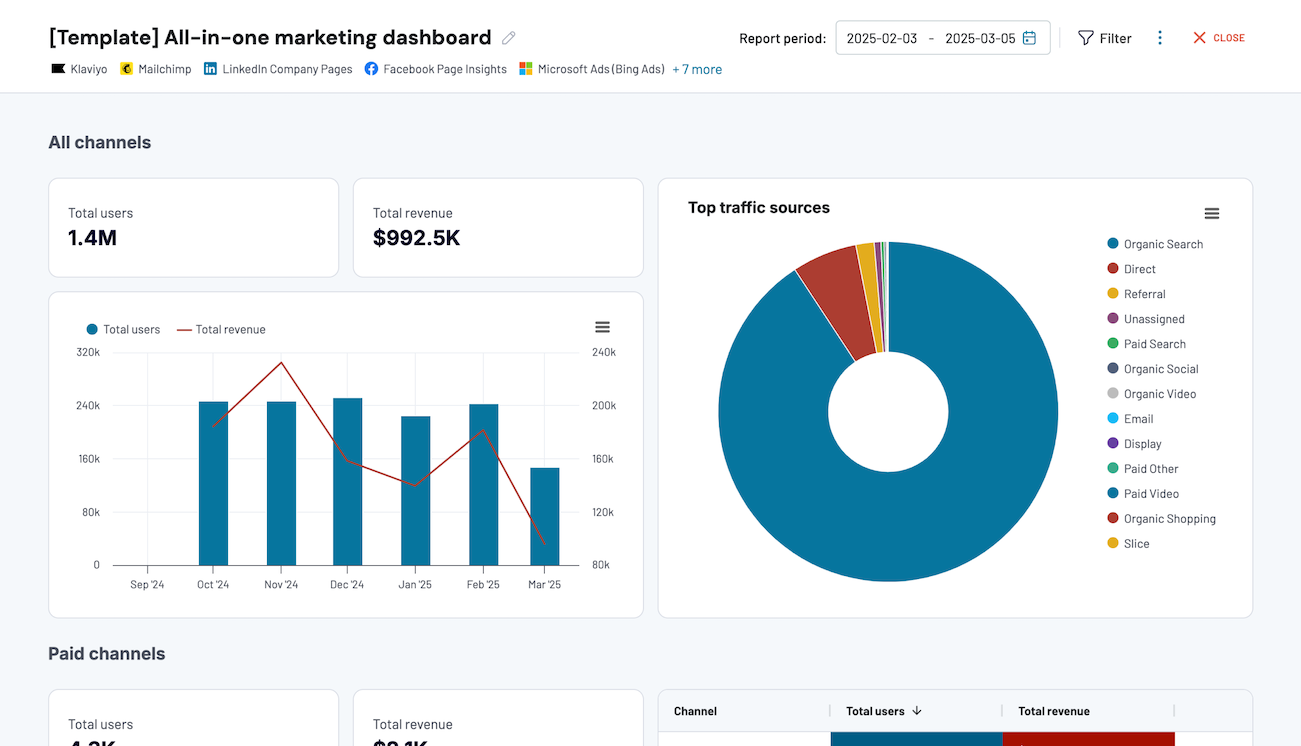


 +7
about your case. It doesn't cost you a penny 😉
Talk to AI about your StackAdapt data
Prompts to try alongside your StackAdapt dashboard in Data Studio:
- "Explain the CTV conversion dip on client X's dashboard for last week."
- "Which campaign group drove most of the Q3 CPM increase visible on the top-right chart?"
- "Rank advertisers by month-over-month eCPA change, ignoring campaigns with less than $500 spend."
- "Which DMAs on the map have the lowest cost per conversion this month?"
- "Compare blended paid media eCPA for the client's two agency contacts."





Your data is secured by industry standards
 SOC 2 Type II
Certified
 Google Cloud
Certified
 GDPR
Compliant
 HIPAA
Compliant
Connect StackAdapt to alternative destinations