Connect QuickBooks to Looker Studio
Transform accounting data into compelling visualizations and self-service analytics with the QuickBooks to Looker Studio integration by Coupler.io. Enable automated financial data exports for interactive dashboard creation.


What data you can export from QuickBooks
-
Customer recordsComplete customer information optimized for customer analysis visualizations, including geographic distribution, payment behavior patterns, and relationship duration metrics.
-
Item catalogProduct and service data formatted for inventory and profitability visualizations, enabling interactive charts showing top-performing products, margin analysis, and inventory turnover metrics.
-
Invoice dataDetailed invoice information structured for revenue trend analysis, including time-based visualizations of sales performance, payment cycles, and outstanding receivables tracking.
-
Class tracking dataBusiness segment classifications for multi-dimensional reporting enabling visual analysis of performance across different business lines, projects, or profit centers.
-
Tax code informationTax rate and jurisdiction data for compliance reporting and tax liability visualization across different regions and product categories.
-
Customer Income ReportRevenue analysis by customer showing payment patterns, purchase frequency, and profitability metrics for customer relationship visualization and retention analysis.
-
Sales by Product/ServiceProduct performance analysis with quantity sold, revenue generated, and margin calculations for inventory optimization and sales strategy visualization.
-
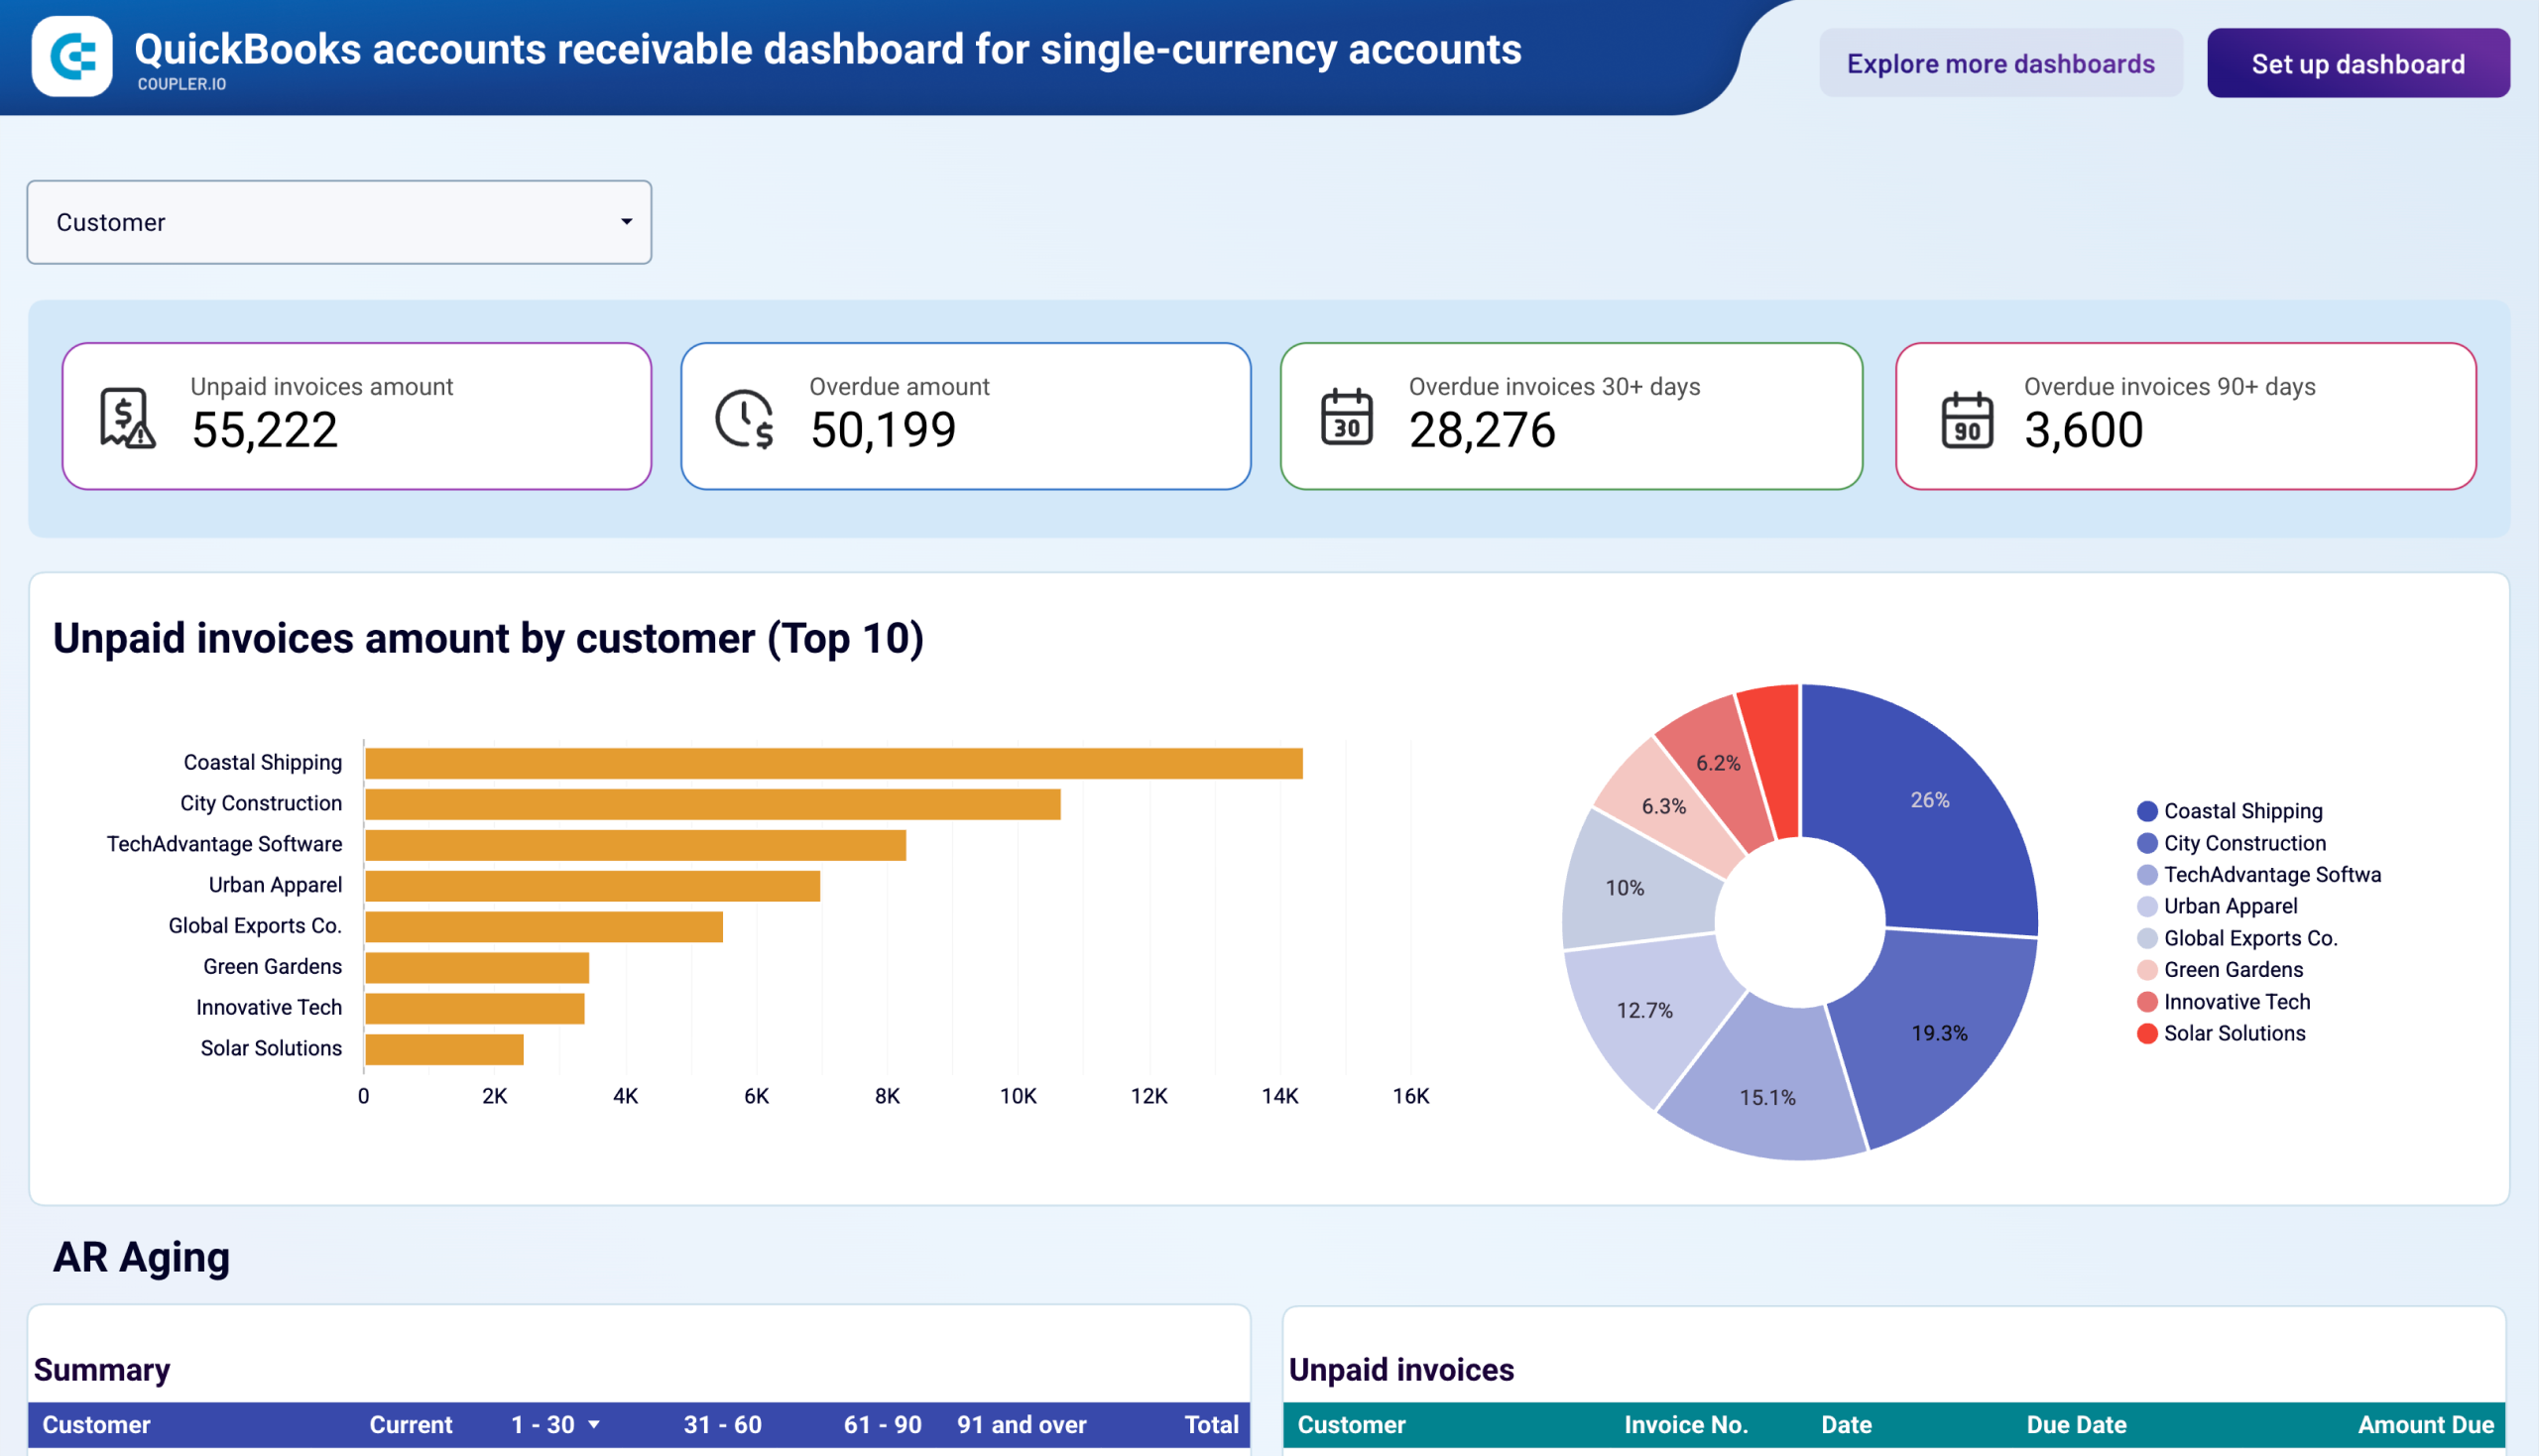
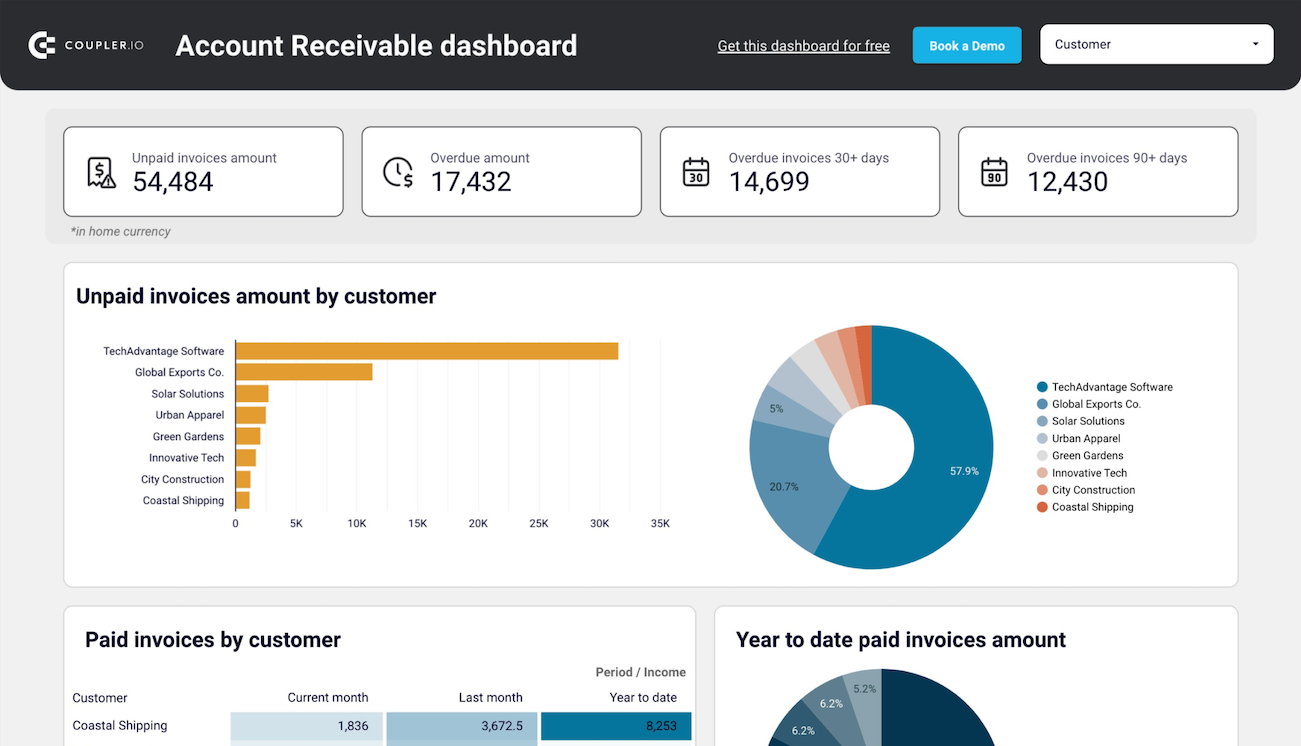
Accounts Receivable Aging DetailCustomer payment status with detailed aging analysis and collection tracking for cash flow visualization and credit management dashboards.
-
Expenses by Vendor ReportVendor spending analysis with category breakdowns and payment timing for supplier relationship management and cost control visualization.
-
Profit and Loss by ClassFinancial performance segmented by business classifications for multi-dimensional profitability analysis and strategic decision-making visualizations.
All-in-one tool for QuickBooks data exports and analytics
Import QuickBooks financial data and blend with marketing, sales, and operational data sources to create comprehensive datasets that power interactive Looker Studio dashboards and compelling visual storytelling.

Format QuickBooks data for optimal visualization performance in Looker Studio, with properly structured dimensions and metrics that enable interactive filtering, drilling, and dynamic dashboard functionality.

Keep Looker Studio dashboards up-to-date with automated data updates from monthly to 15-minute frequencies. Ensure stakeholders always view the latest financial performance through real-time visualizations.

Enhance your QuickBooks data insights with Coupler.io AI integrations. It allows you to connect your datasets to AI tools and have natural language exploration of your financial data.

Why export QuickBooks to Looker Studio - real life cases
Interactive executive dashboards
Client reporting automation for service providers
Sales and financial performance correlation
Multi-location performance monitoring
How to export QuickBooks to Looker Studio
Automate data exports with the no-code QuickBooks Looker Studio integration
Connect similar Finance & Accounting apps and get data in minutes


Quick start with Finance dashboard templates


about your case. It doesn't cost you a penny 😉
Talk to AI about your QuickBooks data
Examples of questions you can ask about QuickBooks data:
- "Create visualizations showing seasonal patterns in our revenue and expenses"
- "What are the key metrics I should include in this month's executive dashboard?"
- "Identify the most effective visual formats for presenting cash flow trends to stakeholders"
- "Which customers contribute most to revenue growth and how should I visualize this?"

Your data is secured by industry standards
 Google Cloud
Certified
 SOC 2 Type II
Certified
 GDPR
GDPRCompliant
 HIPAA
HIPAACompliant


