What data you can export from ChartMogul
-
CustomersVisualize customer data through Looker Studio's interactive charts and graphs. Create customer segmentation dashboards, revenue contribution analysis, and subscription health monitoring with dynamic filtering capabilities.
-
ActivitiesTransform customer activity streams into visual narratives using Looker Studio's timeline and flow visualizations. Perfect for understanding customer engagement patterns and subscription interaction analysis.
-
Customer daily countsDisplay daily customer metrics through Looker Studio's time-series visualizations. Ideal for creating trend dashboards, performance monitoring displays, and immediate subscription health indicators.
-
Customer weekly countsBuild weekly performance dashboards using Looker Studio's comparative visualization tools. Excellent for identifying weekly patterns, campaign impact analysis, and medium-term trend monitoring.
-
Customer monthly countsCreate strategic planning dashboards using monthly customer data and Looker Studio's analytical visualizations. Perfect for board presentations, quarterly reviews, and long-term subscription analysis.
All-in-one tool for ChartMogul data exports and analytics
Blend ChartMogul subscription data with marketing platforms, sales systems, and financial databases within Looker Studio for visual analytics and reporting. Create unified dashboards that combine subscription metrics with business context, enabling stakeholders to understand performance drivers and customer behavior patterns.
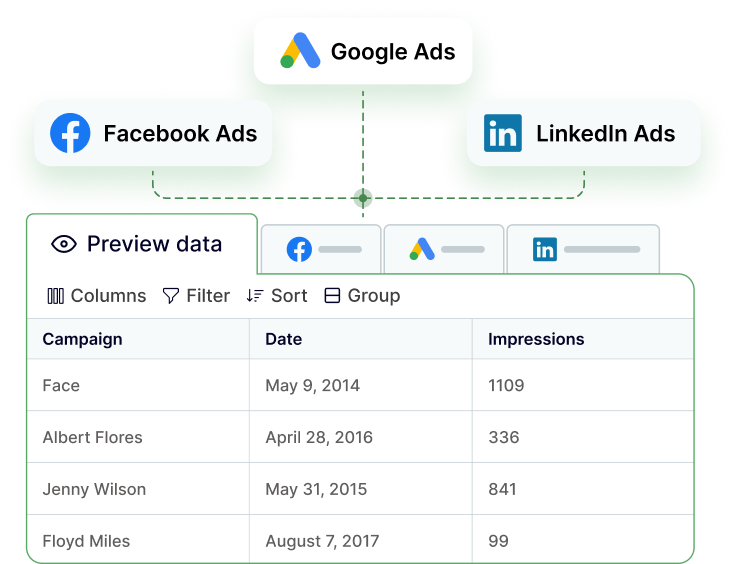
Structure subscription analytics for optimal Looker Studio visualization with pre-configured dimensions, metrics, and data relationships for immediate dashboard creation and insights. Standardized data models ensure consistent visualization while maintaining flexibility for custom chart creation and interactive exploration.
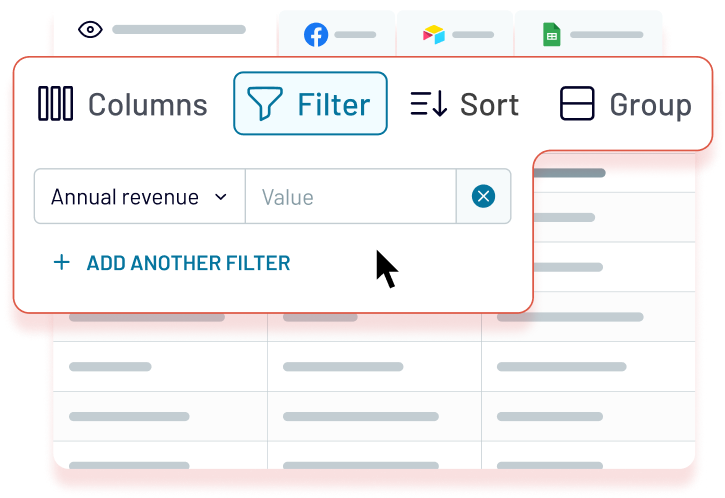
Keep Looker Studio dashboards up-to-date with automated ChartMogul data updates from monthly to 15-minute intervals. Ensure stakeholders have access to the latest subscription performance metrics.
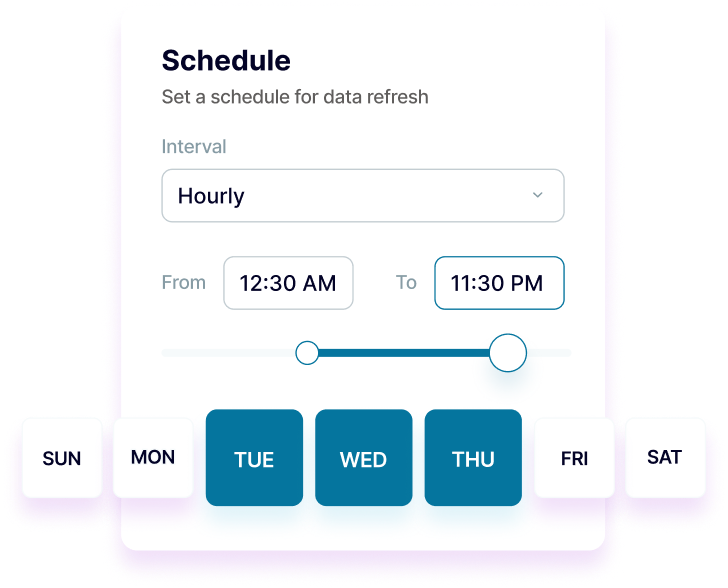
Enhance visual analytics with AI-powered insights by connecting ChartMogul data to AI tools. Enable natural language exploration of subscription patterns, generate intelligent commentary and recommendations that complement your visualizations with contextual analysis.



Why export ChartMogul to Looker Studio - real life cases
Executive dashboard creation
Customer journey visualization
Subscription performance monitoring
Stakeholder reporting automation
How to export ChartMogul to Looker Studio
Automate data exports with the no-code ChartMogul Looker Studio integration
Connect similar Finance & Accounting apps and get data in minutes
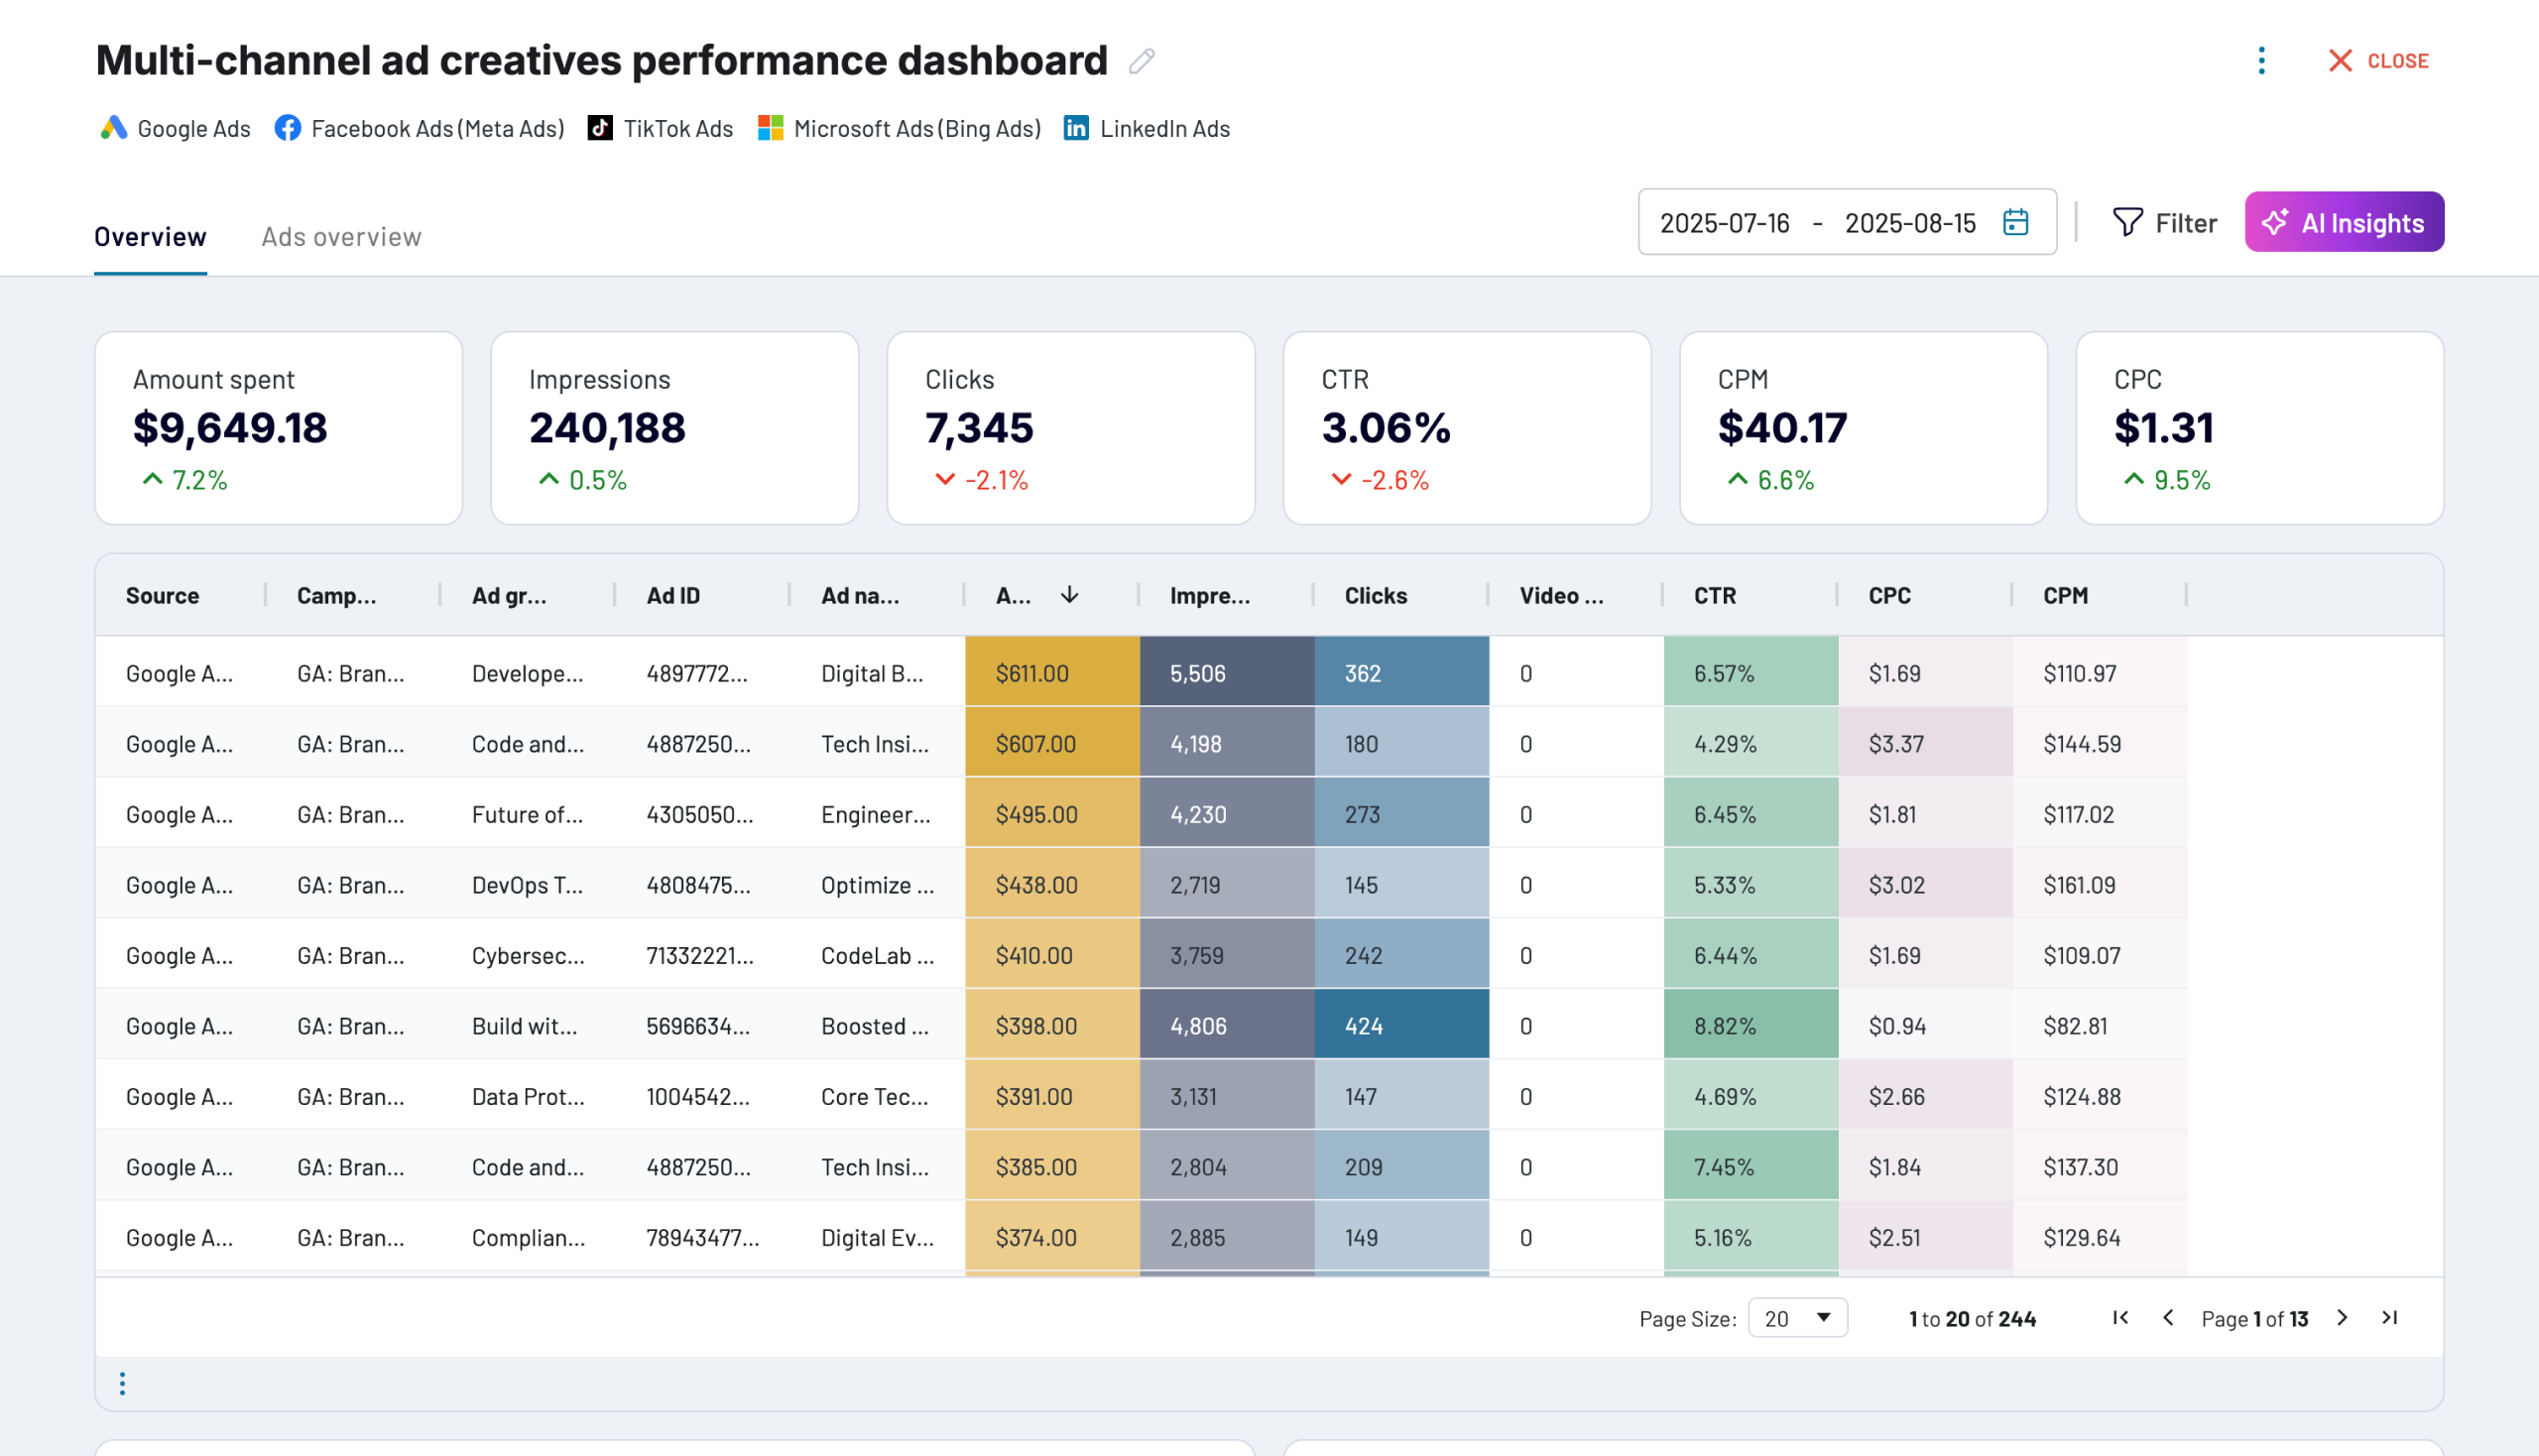
Quick start with dashboard templates




about your case. It doesn't cost you a penny 😉
Talk to AI about your Chartmogul data
Examples of questions you can ask about ChartMogul data:
- "What story does our customer activity data tell about subscription engagement?"
- "How can we visualize the relationship between customer counts and revenue growth?"
- "What weekly subscription patterns should we highlight in our dashboard?"
- "Which customer segments deserve dedicated visualization in our reports?"


Keep your data safe
Coupler.io safeguards your shared information and data transfers from breaches, leaks, and unauthorized disclosures.


