Connect your data to Claude in 1 minute. No code needed Try it now

Connect ChartMogul to BigQuery

Connect ChartMogul to BigQuery with Coupler.io for scalable subscription intelligence. Experience large-scale data processing and machine learning capabilities, converting customer analytics into warehouse-grade insights through distributed computing power and advanced analytical infrastructure.

πŸ† Voted 4.9/5 on Capterra πŸ”’ SOC2 & GDPR compliant 🌍 Trusted by 1M+ users worldwide

What data you can export from Chartmogul?

  • Customers
  • Activities
  • Customer daily counts
  • Customer weekly counts
  • Customer monthly counts
  • Customer quarterly counts

All-in-one tool for ChartMogul data exports and analytics

Integrate ChartMogul subscription metrics with business systems, marketing data, and operational databases within BigQuery's data warehouse environment for cross-source analysis. Combine multiple data sources to build unified customer intelligence and revenue analytics at scale.

Collect data from ChartMogul and enrich it with information from other sources image

Transform subscription analytics into BigQuery-optimized schemas with proper indexing, partitioning, and structure for high-performance queries and large-scale data processing. Standardized table designs ensure optimal query performance while maintaining data integrity and accessibility for analytical workloads.

Organize raw ChartMogul data in the form of a ready-to-use data set image

Maintain up-to-date information about subscriptions with automated ChartMogul exports from monthly to 15-minute frequencies. Configure refresh schedules to balance data freshness requirements with system performance and resource utilization across your data infrastructure.

Automate data refresh on a custom schedule image

Connect ChartMogul data to AI tools for conversational analysis. The Coupler AI integration lets you ask natural language questions about your subscription data while maintaining BigQuery as your primary data warehouse infrastructure.

Connect ChartMogul data to AI to query and analyze data using natural language conversations image
Collect data from ChartMogul and enrich it with information from other sources image
Organize raw ChartMogul data in the form of a ready-to-use data set image
Automate data refresh on a custom schedule image
Connect ChartMogul data to AI to query and analyze data using natural language conversations image

Why connect ChartMogul to BigQuery - real life cases

Scalable data warehousing icon

Scalable data warehousing

Centralize subscription analytics within your data architecture, enabling data teams to build business intelligence solutions combining ChartMogul metrics with organizational data for unified customer insights and reporting.
Advanced machine learning applications icon

Advanced machine learning applications

Enable data scientists to apply machine learning algorithms to subscription data stored in BigQuery, building predictive models for churn prevention, revenue optimization, and customer lifetime value analysis.
High-performance analytics processing icon

High-performance analytics processing

Process large subscription datasets using BigQuery's distributed computing power, enabling complex analytical queries across millions of customer records and activity events for deep business intelligence and insights.
Scalable business intelligence infrastructure icon

Scalable business intelligence infrastructure

Build dashboards and reporting systems using BigQuery as the foundation. Provide teams with fast access to subscription analytics, customer insights, and performance monitoring capabilities.

How to connect ChartMogul to BigQuery

Step 1. Connect to your ChartMogul account and select the data to export
time icon 30 seconds
Step 2. Organize data using transformation options such as filters, column management, aggregation, etc.
time icon 30 seconds
Step 3. Connect your BigQuery project and specify where to load your data
time icon 30 seconds
Step 4. Schedule data refresh to automate data flow from ChartMogul to BigQuery
time icon 10 seconds

Automate data exports with the no-code ChartMogul BigQuery integration

Quick start with dashboard templates
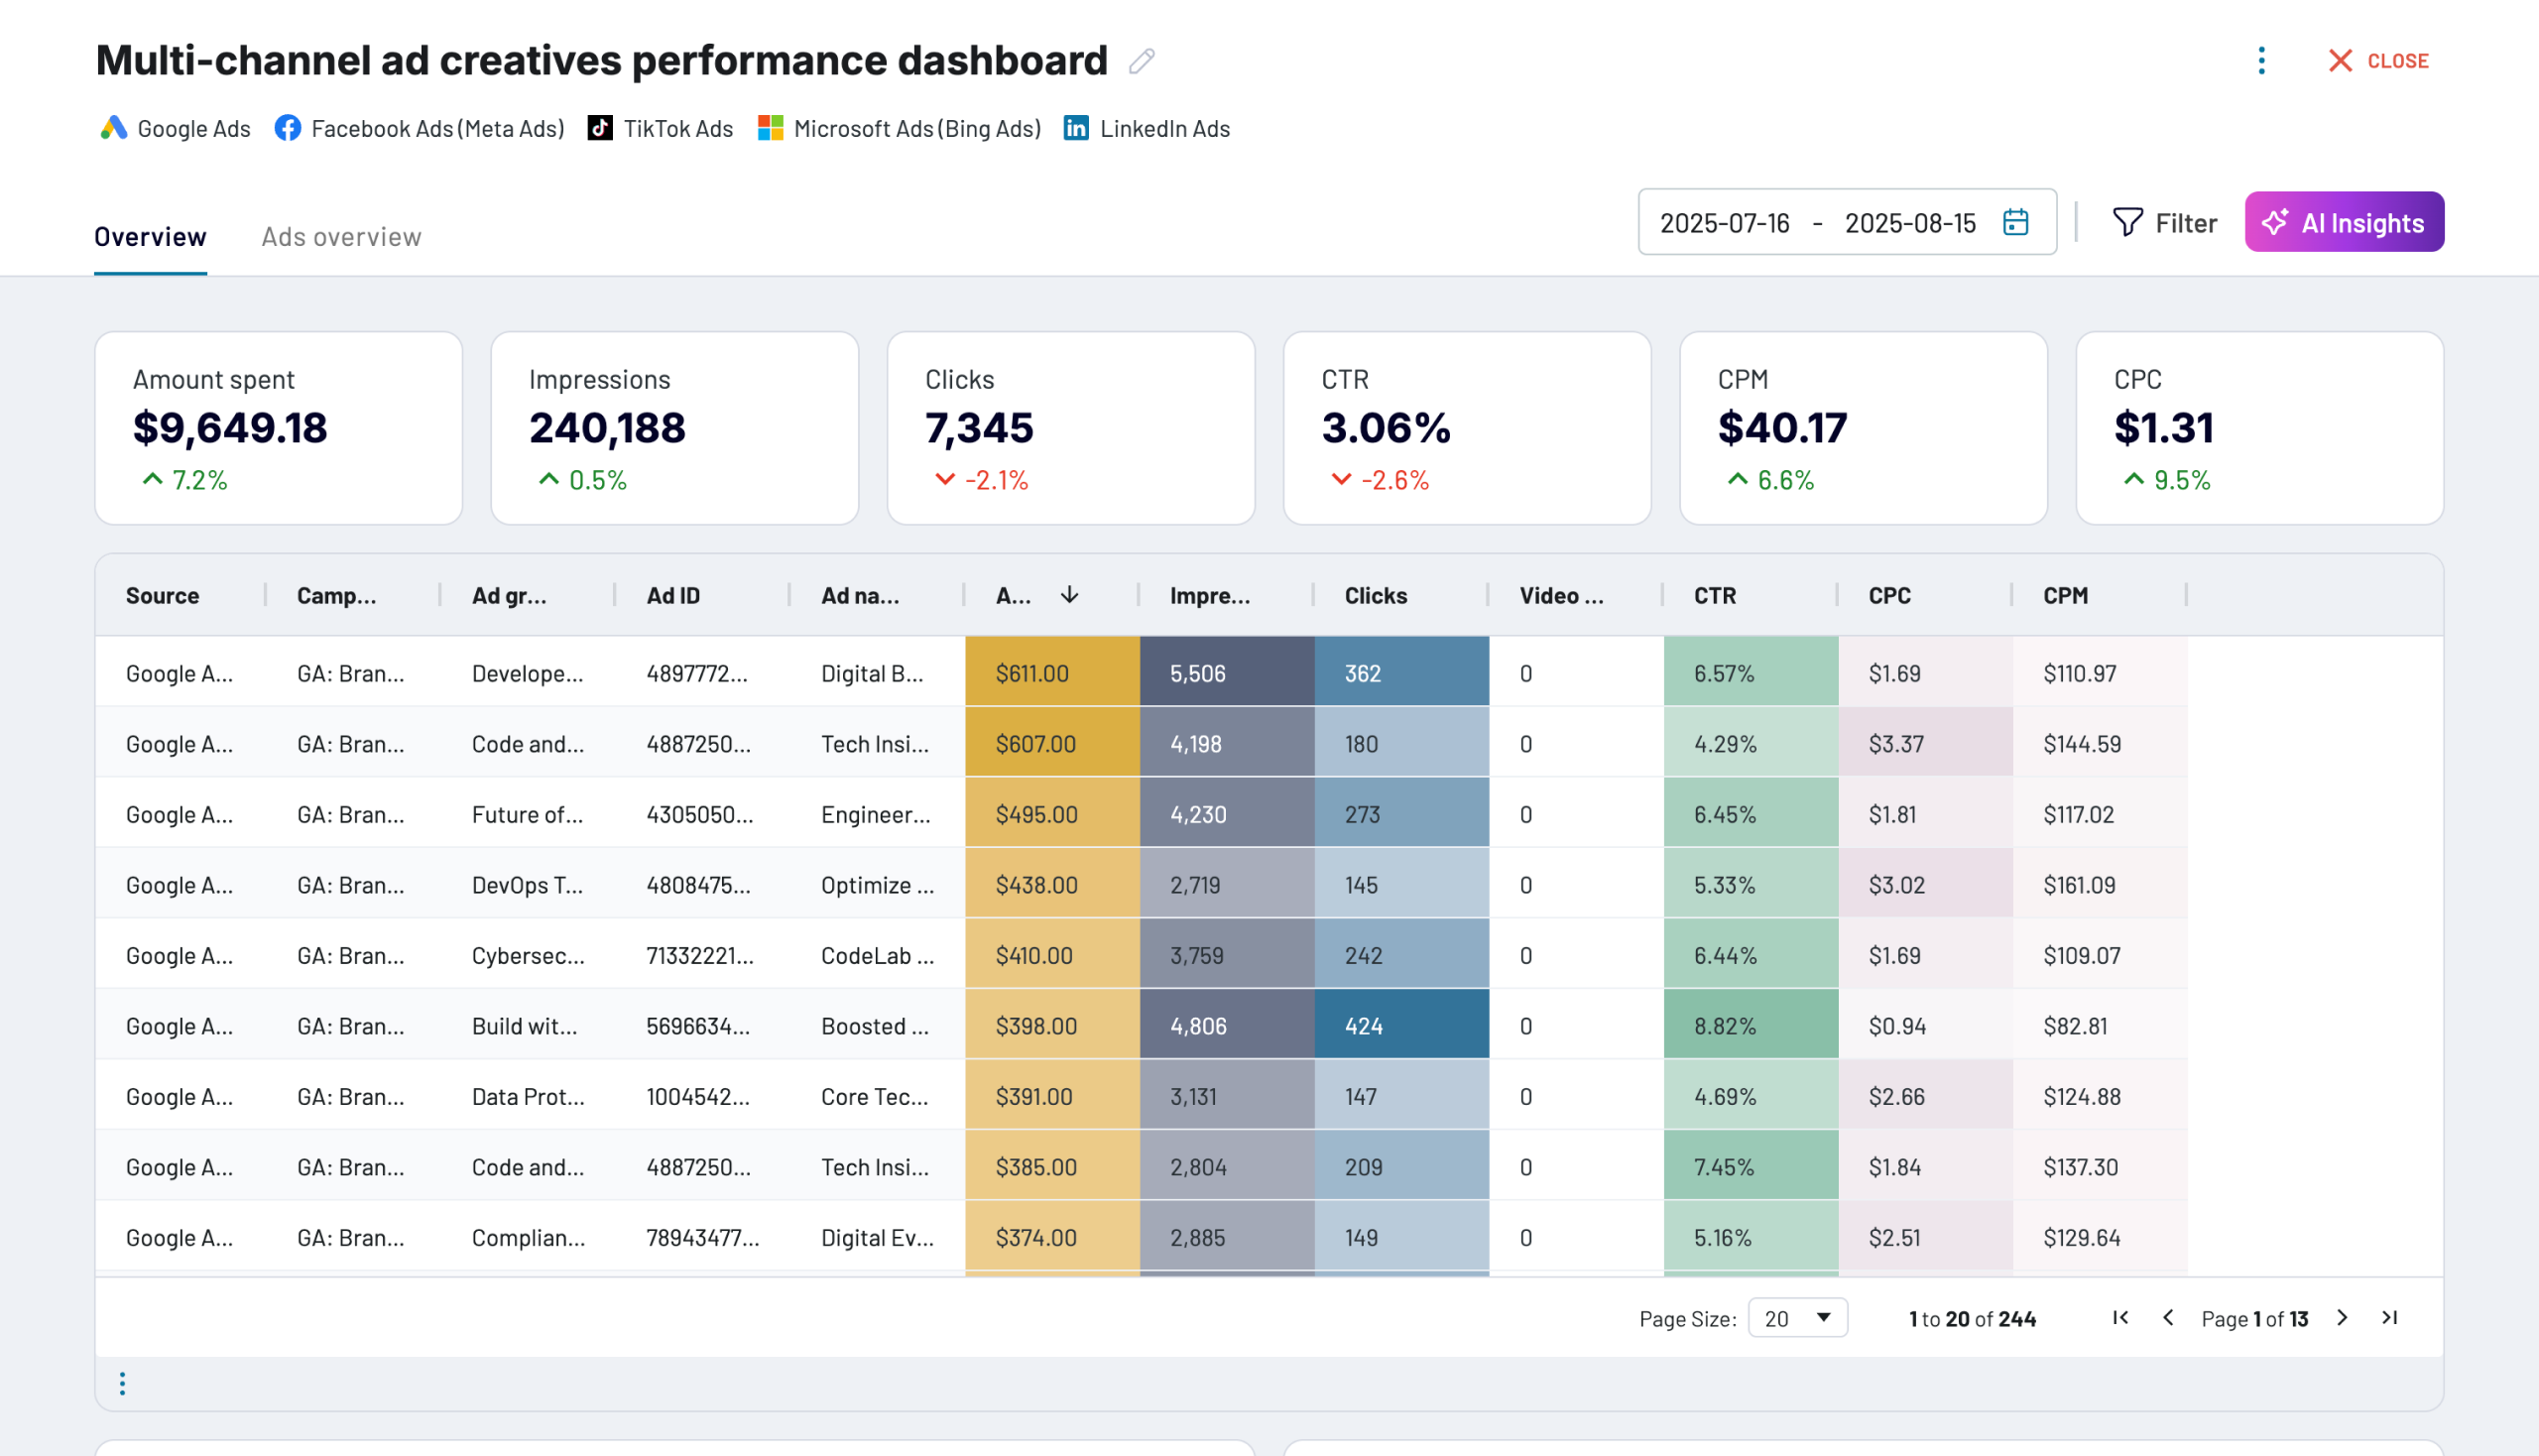
No such template is available yet.
No worries. Our team will create a template that fits your needs, just tell us more
about your case. It doesn't cost you a penny πŸ˜‰
Request a custom report

Talk to AI about your Chartmogul data

Subscription data can travel further than a single dashboard. Complementing BigQuery storage, Coupler AI integrations let you connect ChartMogul data to AI tools for natural language conversations, surfacing insights through conversational chats.

Examples of questions you can ask about ChartMogul data:
  • "Identify patterns in customer activity data that predict subscription cancellations"
  • "What are the key characteristics of our highest-value customer segments?"
  • "How do monthly customer acquisition trends correlate with our marketing spend?"
  • "Which weekly patterns indicate healthy subscription growth momentum?"
connect-ai-integrations image chartmogul.svg

Customer success stories

At Coupler.io, our mission is simple: to help our customers succeed by unlocking the full potential of their data. Check out how using Coupler.io has helped businesses like yours scale and achieve better ROI.

Frequently asked questions
You connect ChartMogul to BigQuery in Coupler.io in three steps: authorize ChartMogul, choose the data you need, and set a schedule. Coupler.io creates the tables on the first run and keeps them updated automatically, with no code.
No, Coupler.io is the BigQuery integration built for business teams, not data teams, so you connect ChartMogul to BigQuery without SQL, Python, or a data engineer.
Yes, the first sync pulls your entire ChartMogul subscription and activity history into BigQuery, and every run after that keeps it up to date. You start with the complete record, not just data from today forward.
You choose the schedule. Coupler.io refreshes ChartMogul data in BigQuery automatically, as often as your plan allows.
Yes, Coupler.io can blend ChartMogul with your other platforms before the data lands. Join subscription metrics with marketing or product data for a complete revenue picture.
BigQuery is a destination on every Coupler.io plan, not a paid add-on and not locked behind a higher tier.
The simplest way to get ChartMogul into BigQuery is a no-code connector: connect the account, pick your fields, set a schedule, and BigQuery fills itself. Coupler.io does this for ChartMogul plus 400+ other sources.
Yes, Coupler.io is SOC 2 Type II certified and writes directly into your own BigQuery project, so your data stays in your warehouse.
After ChartMogul data reaches BigQuery, you can decide which segments need retention attention by tracking activity patterns, build churn prediction models from your full subscription history, and correlate acquisition trends with marketing spend.

Ready to connect ChartMogul to BigQuery and automate your reporting?